We are so excited to share another story from the community! Our series of community stories takes you across the world to hear from young people and educators who are engaging with creating digital technologies in their own personal ways.
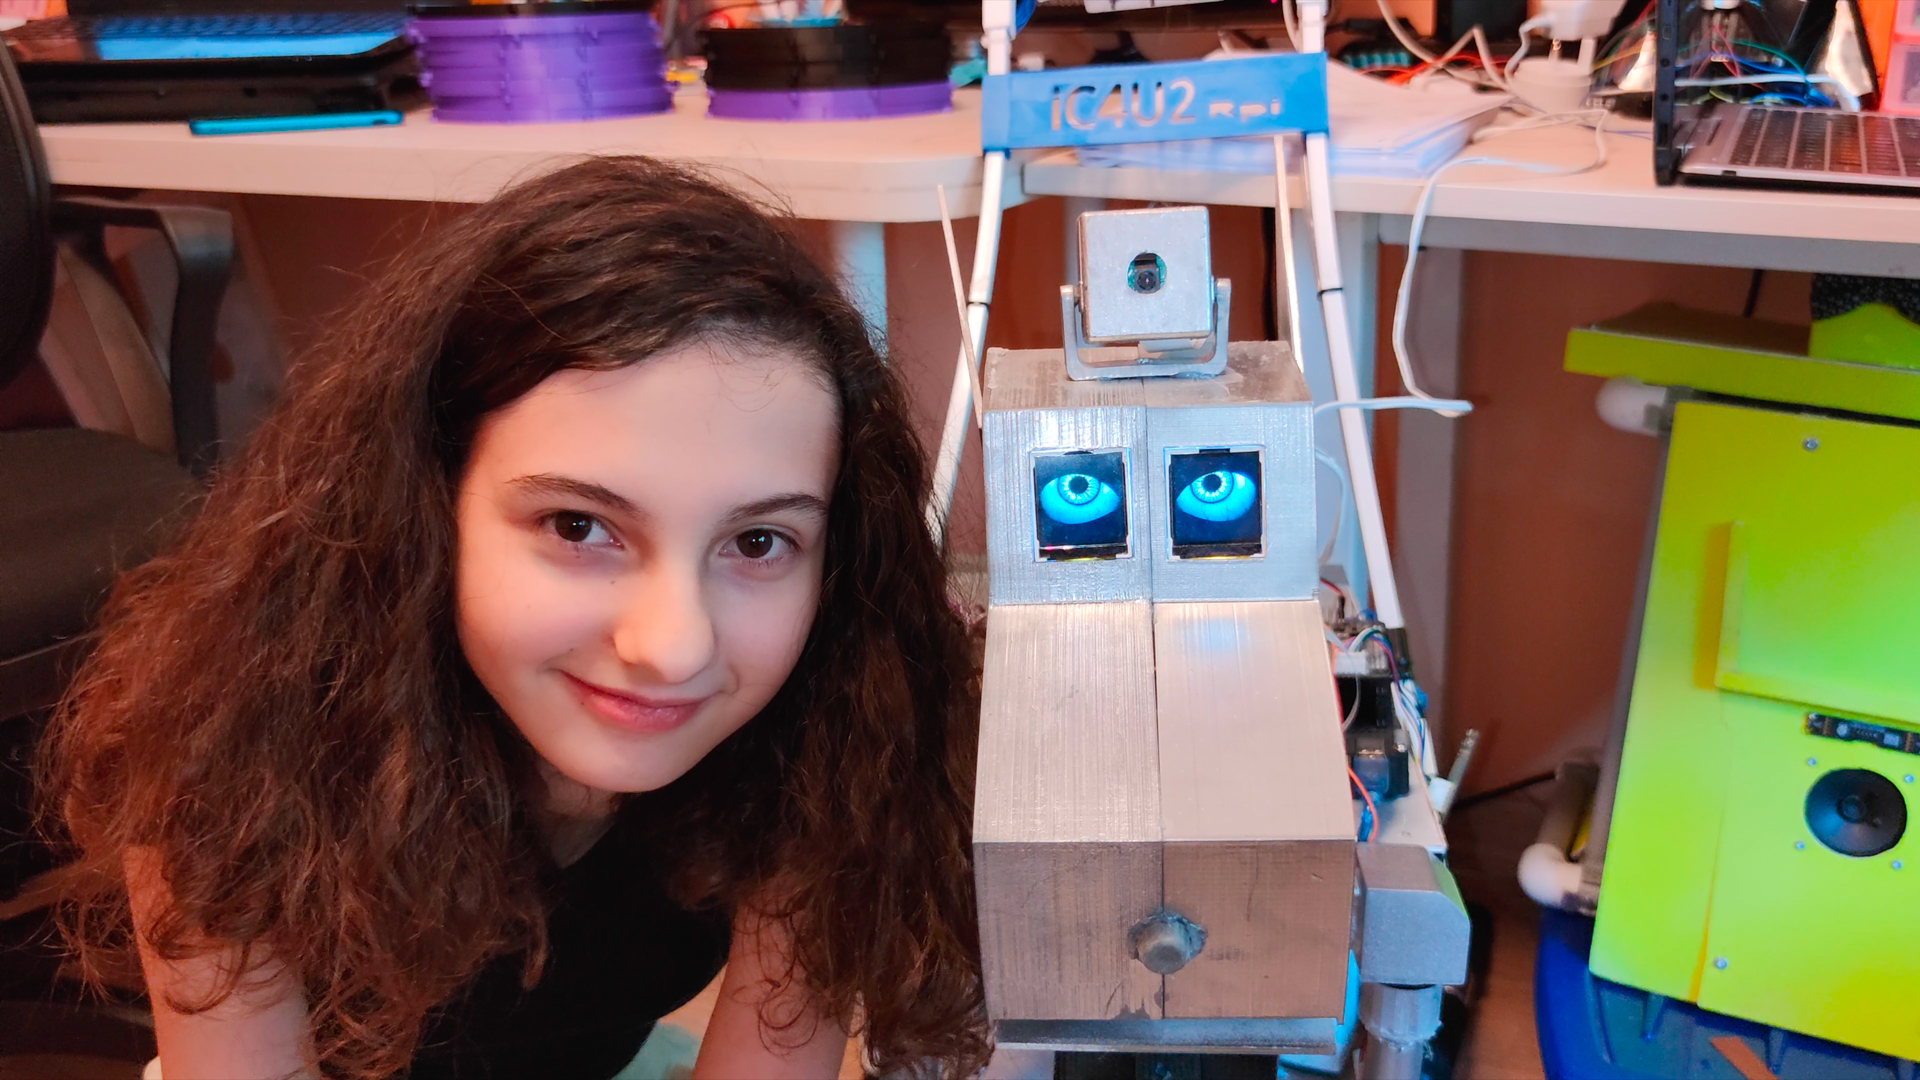
Selin and her robot guide dog IC4U.
In this story we introduce you to Selin, a digital maker from Istanbul, Turkey, who is passionate about robotics and AI. Watch the video to hear how Selin’s childhood pet inspired her to build tech projects that aim to help others live well.
Meet Selin
Selin (16) started her digital making journey because she wanted to solve a problem: after her family’s beloved dog Korsan passed away, she wanted to bring him back to life. Selin thought a robotic dog could be the answer, and so she started to design her project on paper. When she found out that learning to code would mean she could actually make a robotic dog, Selin began to teach herself about coding and digital making. Selin has since built seven robots, and her enthusiasm for creating digital technologies shows no sign of stopping.
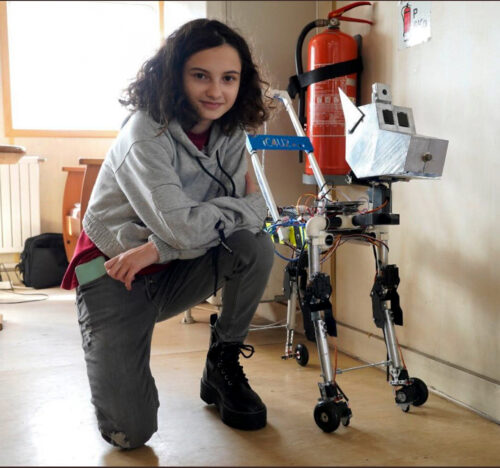
Selin and her robot guide dog IC4U.
One of Selin’s big motivations to explore digital making was having an event to work towards. When she discovered Coolest Projects, our global technology showcase for young people, Selin set herself the task of making a robot that she could present at the Coolest Projects event in 2018.
When thinking about ideas for what to make for Coolest Projects, Selin remembered how it felt to lose her dog. She wondered what it must be like when a blind person’s guide dog passes away, as that person loses their friend as well as their support. So Selin decided to make a robotic guide dog called IC4U. She contacted several guide dog organisations to find out how guide dogs are trained and what they need to be able to do so she could replicate their behaviour in her robot. The robot is voice-controlled so that people with impaired sight can interact with it easily.
Selin at Coolest Projects International in 2018.
Selin and her parents travelled to Coolest Projects International in Dublin with Selin’s robotic guide dog, and Selin and IC4U became a judges’ favourite in the Hardware category. Selin enjoyed participating in Coolest Projects so much that she started designing her project for next year’s event straight away:
“When I returned back I immediately started working for next year’s Coolest Projects.”
Selin
Many of Selin’s tech projects share a theme: to help make the world a better place. For example, another robot made by Selin is the BB4All — a school assistant robot to tackle bullying. And last year, while she attended the Stanford AI4ALL summer camp, Selin worked with a group of young people to design a tech project to increase the speed and accuracy of lung cancer diagnoses.
Through her digital making projects, Selin wants to show how people can use robotics and AI technology to support people and their well-being. In 2021, Selin’s commitment to making these projects was recognised when she was awarded the Aspiring Teen Award by Women in Tech.
Listening to Selin, it is inspiring to hear how a person can use technology to express themselves as well as create projects that have the potential to do so much good. Selin acknowledges that sometimes the first steps can be the hardest, especially for girls interested in tech: “I know it’s hard to start at first, but interests are gender-free.”
“Be curious and courageous, and never let setbacks stop you so you can actually accomplish your dream.”
Selin
We have loved seeing all the wonderful projects that Selin has made in the years since she first designed a robot dog on paper. And it’s especially cool to see that Selin has also continued to work on her robot IC4U, the original project that led her to coding, Coolest Projects, and more. Selin’s robot has developed with its maker, and we can’t wait to see what they both go on to do next.
Help us celebrate Selin and inspire other young people to discover coding and digital making as a passion, by sharing her story on Twitter, LinkedIn, and Facebook.
Can you monitor your backups with Zabbix? Of course, you can — and you should! By day, I am a monitoring tech lead in a global cyber security company. By night, I monitor my home with Zabbix & Grafana and do some weird experiments with them. Welcome to my blog about this project.
Some time ago, Zabbix blog had an excellent read about how to back up Zabbix. While I’m next time coming up with something Completely Else in this blog, this week I wanted to remind you about backups.
The topic came into my mind as my old trustworthy Apple Time Capsule from 2013 probably just said “No, I don’t want to do this job anymore”. It’s a good thing that I also regularly back up my Mac to an external USB drive which I only keep connected to the Mac during backups and then put it in a safe place, and that I also do backup to iCloud and one other cloud service. Update one hour after publishing this blog post: Apple Time Capsule came back to life! But, I shall not trust it anymore.
But, for backing up my Raspberry Pi 4 and its Zabbix, I do something different. Let’s move on to that, shall we?
My old and trustworthy friend
A long time ago (20 years ago long time), I used BackupPC at work. Back then I liked it a lot, as it uses proven, field-tested components (Apache, Perl, rsync), it’s fast, light and does its job with no questions asked.
Until lately I took my home Zabbix backups to an external USB drive connected to our home router by letting a cron job to dump the database with mysqldump and copying some custom script directories around. As this What’s up, home? thing is now world-famous and my home Zabbix has turned into an invisible family member, it was time to take backups a bit more seriously — I don’t want to lose my precious home Zabbix configuration.
So, I went to BackupPC’s site and was surprised that it’s still developed! Kind of the latest release is from 2020, and oh boy, it’s much more polished than it was 20 years ago.
Faster than I can say “BA-NA-NA”, I typed sudo apt install backuppc on my spare laptop, which nowadays runs Ubuntu 22.04 LTS.
Meet BackupPC
Here it is! Thanks to rsync and symbolic links, this thing did deduplication long before it became trendy.
And it lets me go back in time via a nice web interface from which I can easily restore individual files, directories or just everything. On October 24th, I did some testing, so don’t scratch your head about that day in the screenshot.
Zabbix, meet BackupPC
At first, I tried to use a Zabbix community template for BackupPC. It worked — for the most part. Unfortunately, at least with a combination of Zabbix 6.2 running on Raspberry Pi 4 and BackupPC 4.4.0 running on Ubuntu 22.04 LTS, the template was unable to fetch metrics, as Zabbix agent’s web.page.get was inserting some garbage between HTTP headers and the expected JSON content — I guess I did hit this issue.
To work around the problem, I just changed the templates master item type to be HTTP Agent instead of Zabbix agent web.page.get. The difference is that with the Zabbix agent-based solution, the agent can fetch the content locally from the BackupPC server so its web interface does not need to listen on anything else than localhost, and now I opened my BackupPC to listen on the network and did let my Zabbix server to fetch the JSON.
If you want to try out my (very) slightly modified template, it’s available on my GitHub.
After the initial hurdles, the rest was a snap. Not every metric is working for me, as I understood that for them to work, I would need to use the bleeding edge version of BackupPC, but for now, this is good enough. I can get all kinds of metrics about BackupPC, below is a custom dashboard I created for it.
… and even if my BackupPC is backing up my Zabbix perfectly now, it is not backing up itself as I did not yet configure it to do so, so here’s how BackupPC would complain about my Zabbix backups too, should they be failing for any reason.
Do not trust your backups
What’s worse than having no backups at all? Doing backups, but ONLY doing backups. Especially if you are just setting up the backup routine for something completely new, it’s very likely that you miss something during the first try.
Backups are not a fire-and-forget thing, you better monitor them and regularly test them, or otherwise, it’s guaranteed that Mr. Murphy will hit you with a clue stick sooner or later.
So, here’s my €0.02:
Take regular backups
Monitor them
Test your backups
Make sure you have more than one backup (my MacBook copies the Zabbix backup files from my Ubuntu daily, too, and from there my Zabbix backups are spread to everywhere my Mac backups are)
My future development in this area includes a script that would attempt to automatically restore the database and my scripts to a VM/container, install Zabbix and see if it works. If it would not, then my Zabbix would get alerted.
I have been working at Forcepoint since 2014 and during my long IT career have learned that you always have to have a guaranteed way to restore something. — Janne Pikkarainen
This post was originally published on the author’s LinkedIn account.
Can you monitor Finland’s total real-time power consumption with Zabbix? Of course, you can! By day, I am a monitoring tech lead in a global cyber security company. By night, I monitor my home with Zabbix & Grafana and do some weird experiments with them. Welcome to my blog about this project.
After my speech at the Zabbix Summit 2022, someone asked how deeply my wife is involved with this home monitoring project, and I responded back that she usually gives me ideas by accident. You know, she’s a funny and talkative person up to the point that I call her the comment track or the voice-over of my life, so even as a non-techie, she will for sure give me new ideas.
Well, this time she gave the idea for this post on purpose — now that winter and the dark days & nights are approaching fast, she asked if Zabbix could turn our decorative seasonal lights on and off based on the current electricity price.
Of course, it can! I am anyway already monitoring the current electricity price. But let’s take it further — using Zabbix, we can also check Finland’s current real-time power consumption. It would be kind NOT to turn on the lights even during the cheap hours if our power grid would be near its maximum limit.
Hello, Fingrid
Our electricity network Fingrid offers open data for all kinds of details about our power grid, one of them being the current electricity consumption. Using their services is free, all you need is to create an account to get an API key, so I tried if I can use the API with Zabbix. Well, Zabbix integration was easy, though, due to the time constraints set by our now-10-weeks-old-baby, this current version is a bit of a kludge and not yet finished. But hey, I have this blog to write!
So, after getting my API key, I created a new HTTP agent item to my Zabbix and did parse it with Zabbix JSONPath for the value.
Why the regular expression? The value was not returned in pure numeric format, and I know it must be just my JSONPath expression that has something wrong, but to get this working today, I just brute-forced the extra characters away. I’ll fix that one day. Maybe. The most important for now is that this works; the values shown are in megawatts.
What’s next?
Now that the groundwork has been done, albeit in an ugly way, in the near future (when we actually install the seasonal lights), I can start controlling them via smart power sockets and smart lights. Thanks to the total flexibility of Zabbix, I can then create triggers such as turn on seasonal lights if electricity cost is maximum of X EUR/kWh AND Finland’s power grid total consumption is not more than Y MWh AND time of day is something when we would be awake (we would turn the lights off during the graveyard hours in any case).
I have some additional research to do; I’m sure I can find out Finland’s total power grid capacity from somewhere, maybe even via Fingrid API (I first tried it about one hour ago). But, as this winter is going to be totally different than our usual winters, Zabbix can help you in this area, too.
I have been working at Forcepoint since 2014 and just like a small part of Forcepoint’s logo, I’m trying to be green as well. — Janne Pikkarainen
This post was originally published on the author’s LinkedIn account.
Can you use Zabbix as a countdown timer? Of course, you can! By day, I am a technical monitoring lead in a global cyber security company. By night, I monitor my home with Zabbix & Grafana and do some weird experiments with them. Welcome to my blog about this project.
Note: This post was written a week before the Zabbix Summit 2022 kick-off on October 7-8 in Riga, Latvia. However, the content of this blog post does not lose its value and can be used for many other purposes.
Zabbix Summit 2022 is almost here. Finally, we meet again in person after two years of virtual summits. And this year, I got to be a speaker. YAY!
But can you make Zabbix show you if it’s time for the Summit yet? Yes, easily! Just create a calculated item that calculates the epoch time difference between your desired time and current time, and that’s about it.
Get your epoch time easily
In my case, I consider my Zabbix Summit to be starting when I board the plane at Helsinki Airport.
To get the epoch time, or Unix timestamp, or time in seconds since January 1st, 1970 00:00:00, for my flight departure, I went to the Epoch Converter website and entered the details.
Create a calculated item
With that info, I then created a new calculated item on Zabbix.
In other words, get the time remaining in seconds before my flight takes off.
For my calculated item, I declared the units to be in seconds, after which Zabbix already shows the results in a more convenient days — hours — minutes format.
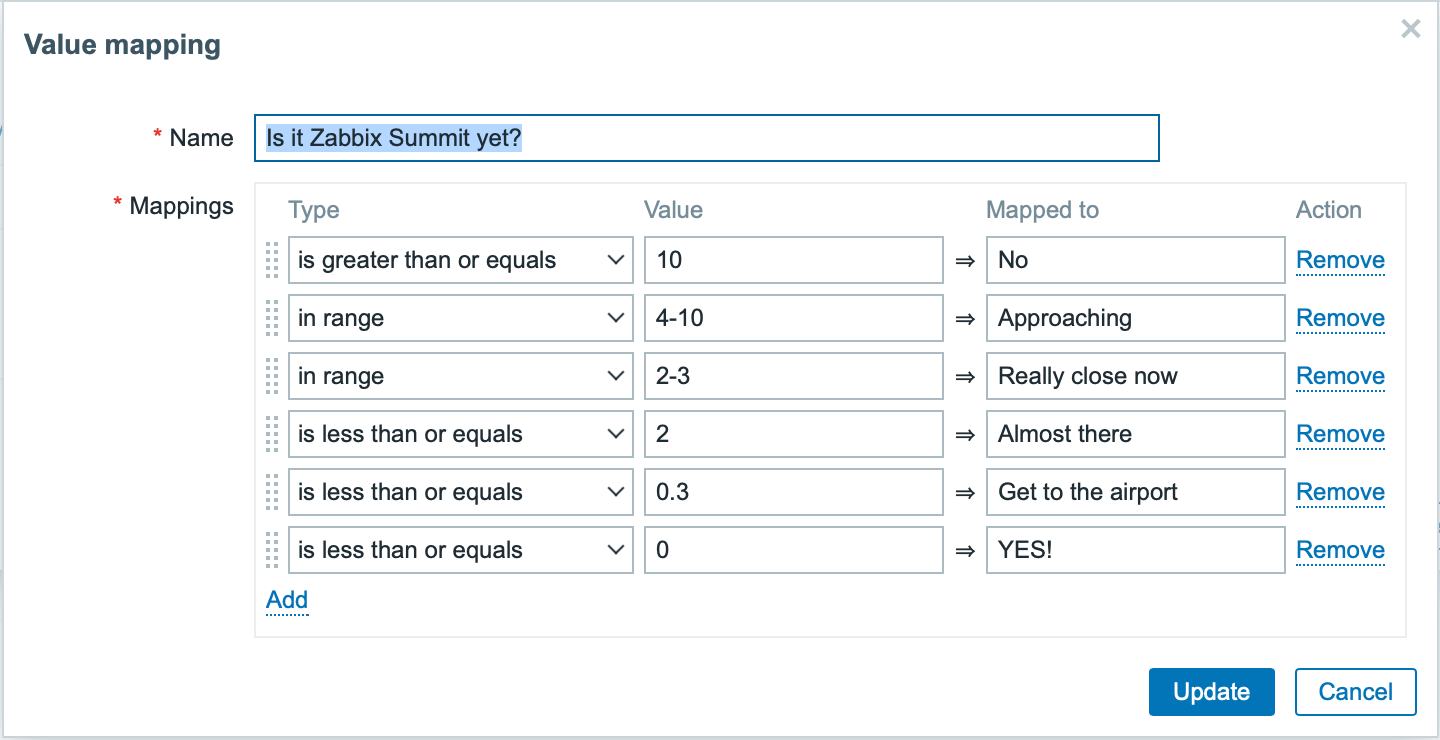
Apply some value mapping
To make this more interesting, let’s apply some value mapping!
Next, when I apply this value mapping on my previously created item, I can then move on and create a separate dashboard for my Zabbix Summit countdown needs.
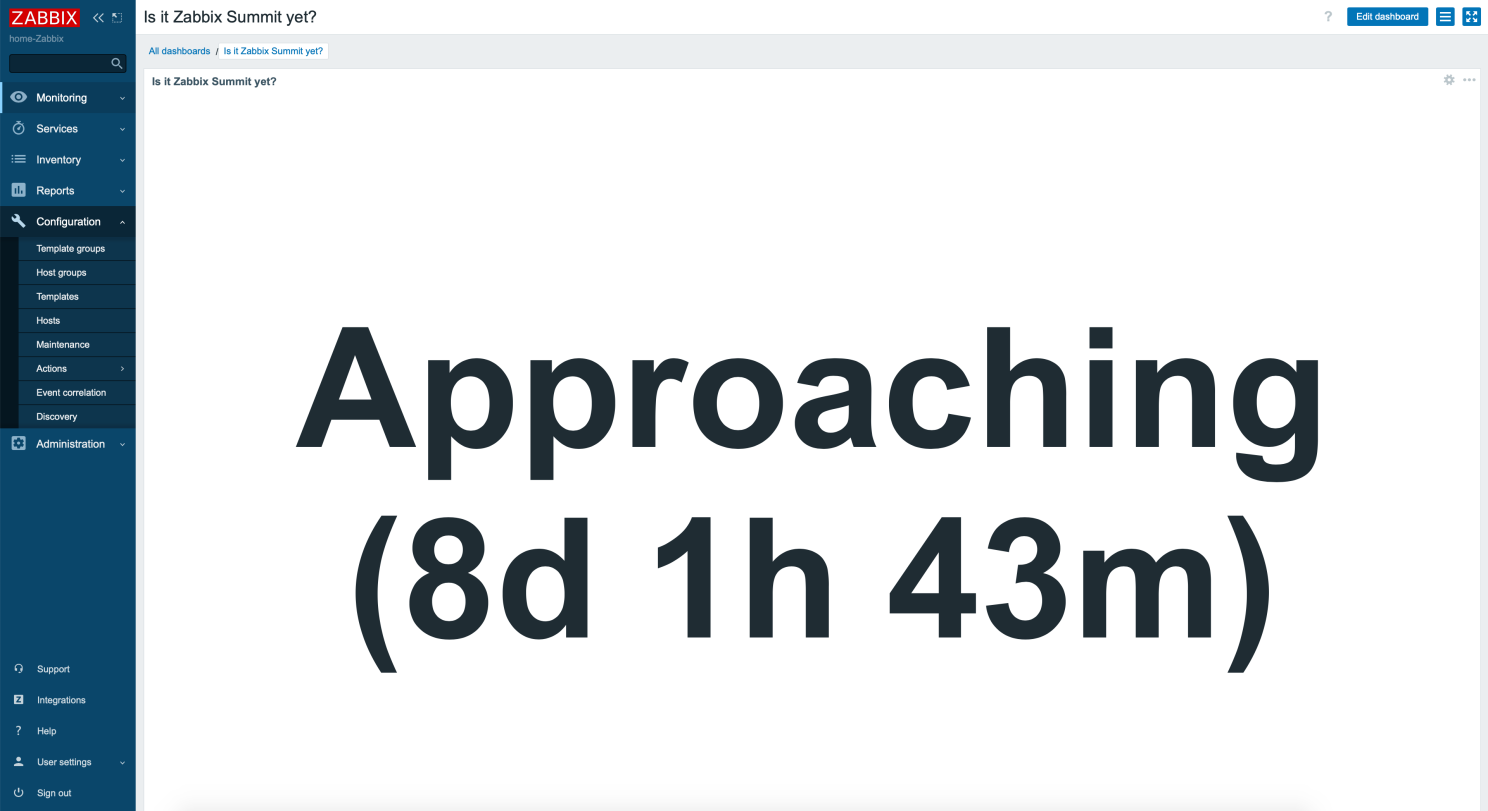
Create a dashboard
I simply added a new Item value widget to my new dashboard, chose my time until the Zabbix Summit item, adjusted font size, and item positioning, and here it is in all its glory.
I could of course create alert triggers for this to get a notification when I need to go to the airport, but I guess that’s totally unnecessary. Can’t wait to meet y’all!
I have been working at Forcepoint since 2014 and monitoring keeps my internal clock ticking. Hmm, that was a weird sentence. — Janne Pikkarainen
This post was originally published on the author’s LinkedIn account.
Can you monitor a banana with Zabbix? Of course, you can! By day, I am a monitoring tech lead in a global cyber security company. By night, I monitor my home with Zabbix & Grafana and do some weird experiments with them. Welcome to my blog about this project.
From that moment, the rest of the summit went all bananas. So, what’s a better way for me to contribute to this ba-na-na meme than to attempt to monitor a banana, as anyway I am now known for monitoring weird things? Here we go!
Apart from a monkey wrench and a gorilla leg for your camera to get perfectly steady photos or videos of your precious snacks, what do we need to monitor bananas with Zabbix? Not much:
Some Python (I guess snakes might like bananas, too)
OpenCV image recognition libraries (no, that’s not a tool to help you create resumes on LinkedIn, the CV stands for Computer Vision)
This banana monitoring is just a simulation, so I downloaded a random picture of a vector graphics banana from our dear Internet. See, it’s beautiful!
Feed the snake
OK, I now have a nice picture of a banana, but how on earth would I monitor that with Zabbix? With OpenCV, that’s not too hard. No, I do not know anything about OpenCV, but with some lucky search engine hits and some copy-pasting, I managed to get my super intelligent image recognition script to work.
It’s tailored to check a pixel I know belongs to our banana and then check the hue value of that pixel. With hue, it’s easier and more reliable to check the actual color, no matter its brightness, or so I was told by the articles I found.
Anyway, here’s the script!
Really, most of this was just copy-paste, so I do not take any credit for this code. But, it seems to do its job, as this is what happens when I run the script from the command line.
Fantastic! Or maybe, to honor Steve, I should say This was I-ZI.
Configuring Zabbix
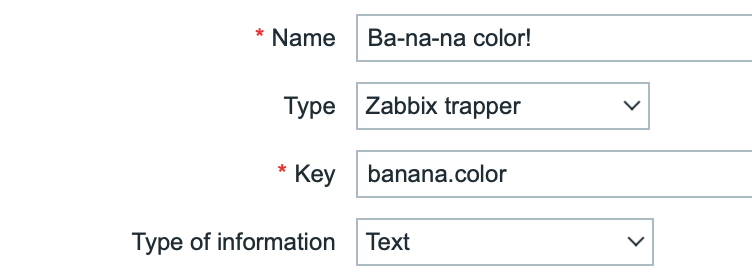
To send this data to Zabbix, I’m going to use the good old zabbix_sender command. For that to work, I needed to set up a new trapper-type item for Zabbix.
And, well… that’s it. Now if I run the following from the command line, it works:
Let’s check from Latest data, too:
But it needs a dashboard!
Now that it’s working, it definitely needs a dashboard. This is what I created for it with just an Item value and URL widgets.
Ain’t technology fantastic? Now if only Zabbix would have dynamic colors for the item value widget, but I guess they told us at the Summit that it’s coming.
Of course, like with most of my blog posts, this kind of monitoring could have some real-world use cases, too: make OpenCV check pictures, video streams, photos, whatever and if the color of something that should be the same all the time is not the same anymore, make Zabbix go bananas about it.
I have been working at Forcepoint since 2014 and writing these posts has never been tastier. — Janne Pikkarainen
This post was originally published on the author’s LinkedIn account.
Can you monitor a banana with Zabbix? Of course, you can! By day, I am a monitoring tech lead in a global cyber security company. By night, I monitor my home with Zabbix & Grafana and do some weird experiments with them. Welcome to my blog about this project.
From that moment, the rest of the summit went all bananas. So, what’s a better way for me to contribute to this ba-na-na meme than to attempt to monitor a banana, as anyway I am now known for monitoring weird things? Here we go!
Apart from a monkey wrench and a gorilla leg for your camera to get perfectly steady photos or videos of your precious snacks, what do we need to monitor bananas with Zabbix? Not much:
Some Python (I guess snakes might like bananas, too)
OpenCV image recognition libraries (no, that’s not a tool to help you create resumes on LinkedIn, the CV stands for Computer Vision)
This banana monitoring is just a simulation, so I downloaded a random picture of a vector graphics banana from our dear Internet. See, it’s beautiful!
Feed the snake
OK, I now have a nice picture of a banana, but how on earth would I monitor that with Zabbix? With OpenCV, that’s not too hard. No, I do not know anything about OpenCV, but with some lucky search engine hits and some copy-pasting, I managed to get my super intelligent image recognition script to work.
It’s tailored to check a pixel I know belongs to our banana and then check the hue value of that pixel. With hue, it’s easier and more reliable to check the actual color, no matter its brightness, or so I was told by the articles I found.
Anyway, here’s the script!
Really, most of this was just copy-paste, so I do not take any credit for this code. But, it seems to do its job, as this is what happens when I run the script from the command line.
Fantastic! Or maybe, to honor Steve, I should say This was I-ZI.
Configuring Zabbix
To send this data to Zabbix, I’m going to use the good old zabbix_sender command. For that to work, I needed to set up a new trapper-type item for Zabbix.
And, well… that’s it. Now if I run the following from the command line, it works:
Let’s check from Latest data, too:
But it needs a dashboard!
Now that it’s working, it definitely needs a dashboard. This is what I created for it with just an Item value and URL widgets.
Ain’t technology fantastic? Now if only Zabbix would have dynamic colors for the item value widget, but I guess they told us at the Summit that it’s coming.
Of course, like with most of my blog posts, this kind of monitoring could have some real-world use cases, too: make OpenCV check pictures, video streams, photos, whatever and if the color of something that should be the same all the time is not the same anymore, make Zabbix go bananas about it.
I have been working at Forcepoint since 2014 and writing these posts has never been tastier. — Janne Pikkarainen
This post was originally published on the author’s LinkedIn account.
Can you make sure your video streams are up with Zabbix? Of course, you can! By day, I am a monitoring technical lead in a global cyber security company. By night, I monitor my home with Zabbix & Grafana Labs and do some weird experiments with them. Welcome to my weekly blog about the project.
You might have a surveillance camera at home to record suspicious activities in your yard while you are away or so. Most of the time the cameras do work just fine but might require a hard reboot from time to time, for example, due to harsh weather, or not coming back after a network outage. A networked camera responding to ping does not 100% mean the camera is actually functional. I have seen our camera going black and refusing to connect to its stream even though it thinks it’s working just fine.
My post for this week is mostly to maybe give you a new approach for monitoring your cameras, not so much a functional solution as I’m still figuring out how to do this properly.
For example, I can connect to our camera via RTSP protocol and pass some credentials with it, so rtsp://myusername:[email protected]:443/myAddress
To figure out a connection address for your camera model, iSpyConnect has a nice camera database.
Playing the stream
To test if the video stream works, VLC and mplayer are good options; for visually verifying the stream works, try something like
or for those who like to use a GUI, in VLC, File –> Open Network –> enter your camera address.
For obvious reasons, I am not posting here an image from our camera. Anyway, trust me, this method should work if you have a compatible camera.
Let’s go next for the neat tricks part, which I’m still figuring out myself, too.
Making sure the stream works
To make sure the video stream is up and running, make your Zabbix server, Zabbix proxy, or a dedicated media server to continuously stream your video feed. For example:
The combination above would make mplayer play the stream with a null video driver; thus, the stream will be continuously played, but just with no visual video output generated. In other words, under perfect conditions, the mplayer process should be running on the server all the time. If anything goes wrong with the stream, mplayer quits itself, and the process goes away from the process list, too.
Using Zabbix to check the player status
Now that you have some server continuously playing the stream, it’s time to check the status with Zabbix.
From here, checking the stream status with Zabbix is simple, just
create a new item to check if for example mplayer process is around with Zabbix Agent item type and proc.num[,mplayer] key and
make your Zabbix alert about it if the number of mplayer processes is <1
Camera screenshots to your Zabbix user interface
Both mplayer and VLC can be controlled remotely, so here’s an idea I have not yet implemented but testing out.
If a motion sensor, either an external unit or a built-in, detects movement, make Zabbix send a command to the camera to record a screenshot of the camera stream, or possibly a short video. Then just make the script to save the photo or video in a directory that Zabbix can access and then show with its URL widget type.
mplayer has a slave mode for receiving commands from external programs, which might work together with a FIFO pipe.
Real-time video stream in your Zabbix user interface
At least VLC can transcode RTSP to HTTP stream in real-time, so in theory, then embedding the resulting stream to your Zabbix user interface should very much be doable with a short HTML file and Zabbix URL widget type. This one I did not yet even start to try out, though.
So, that’s all for this week’s blog post. I’m still building this thing out, but if you have successfully done something similar, please let me know!
I have been working at Forcepoint since 2014 and am a true fan of functional testing. — Janne Pikkarainen
This post was originally published on the author’s LinkedIn account.
Can you monitor your upcoming electricity bills with Zabbix? Of course, you can! By day, I am a monitoring technical lead in a global cyber security company. By night, I monitor my home with Zabbix & Grafana Labs and make some weird experiments with them. Welcome to my weekly blog about the project.
With the current world events, energy prices are soaring. But how much do I need to really pay next month for my electricity? Zabbix to the rescue!
(Yes, in Finland I can check that from my electricity company’s page, but where’s the fun in that?)
Fixed vs spot price
There are two kinds of electricity contracts you can subscribe to in Finland. With a fixed price, you can be sure your bill does not fluctuate that much from month to month, as you pay the same price per kilowatt for every hour of the day. In this kind of deal, the electricity company adds some extra to each kilowatt, so you will automatically pay some extra compared to the electricity market price, but at least you don’t get so severely surprised by market price peaks.
Then there’s the spot price, where you pay only the electricity market price. This can and will vary a lot depending on the hour of the day, but at least in theory, this is the cheapest option in the long run. But, if the market price goes WAY up, like it tends to do in the winter, and has now been peaking due to world events, this can add to your bill.
Nordpool, please respond
There’s Nord Pool (“Nord Pool runs the leading power market in Europe, offering day-ahead and intraday markets to our customers”), and there’s a Python library for accessing Nord Pool electricity prices. With it, I could get hour-by-hour prices, but for this experiment, let’s stick with the average kWh price. The example script on the GitHub page shows all kinds of data, and for fun let’s use Zabbix item preprocessing to parse the average price from its output.
I now have the below script on running as a cron task every night, so my results will be updated once per 24 hours.
So, Zabbix then reads the file contents, like in so many of my previous blog posts.
Next, let’s add some preprocessing. The regular expression part gets the Average value from the script output, and the custom multiplier changes the value from “Euros per Megawatt” to “Euros per Kilowatt”, for it to be a familiar value for me from the electricity bills.
And… it’s working! As I know our average consumption, let’s add a new Grafana dashboard.
Four seasons
During summer, we don’t actually use very much electricity compared to our harsh winter; for example, keeping our garage “warm” (about +10C) during winter contributes to our electricity bill quite a lot.
Here’s a dashboard showing some guesstimations of how expensive the different seasons will be for us. Or, hopefully cheap, if the long overdue new Olkiluoto 3 nuclear plant finally could operate at its full capacity here in Finland.
The guesstimate above is missing some taxes and electricity transfer prices, so the reality will be a bit more expensive than this. Maybe I should also add some triggers to Zabbix to make me alert about any really crazy price changes.
Anyway, now I can start gathering nuts for the cold winter as it seems that it will be an expensive one.
I have been working at Forcepoint since 2014 and I’m happy that my laptop does not consume too much electricity. — Janne Pikkarainen
This post was originally published on the author’s LinkedIn account.
Can you automatically control the temperature of your home in a time- and room-based manner using Zabbix? Of course, you can!
By day, I am a monitoring technical lead in a global cyber security company. By night, I monitor my home with Zabbix & Grafana and make some weird experiments with them. Welcome to my weekly blog about this project.
Usually in Finland during the summer, the nights are not so hot that an AC would be needed. However, that can happen during any rare heat wave we get. It’s annoying to wake up in the middle of the night all sweaty and turn on the AC when it’s already too late.
Of course, I could just leave the AC on when I go to bed, but let’s make Zabbix do some good for our electricity bill and for the environment by not using the AC when it’s not needed.
Detecting if I am at home
Like so many times before in this blog series, Cozify smart home hub is the true star of this story. It detects if anyone is at home based on if a specific phone or, for example, a smart key fob is present and reachable in Cozify’s range. For this case, I will be using my smart key fob in Zabbix, too. This is how it looks in Cozify.
… and here’s the key fob reachability status in Zabbix.
Surprisingly enough, it shows 1 (or “True”) as my status now that I type this blog entry at home and my keys are at home.
A deeper dive into my key fob Zabbix item
To make this all work, I have a set of Python scripts gathering data from Cozify via an unofficial Cozify API Python library. One of the scripts gets the reachability status for all the items, and here’s the configuration for my key fob Zabbix item.
… and some preprocessing …
Let’s add some triggers
Now that we have the key fob data, let’s create some triggers to combine the data about my presence with the temperature information.
I created the triggers by using Zabbix expression constructor:
.. and when I was done, this is how it looked.
I made a similar trigger for our living room, too.
Next, some scripts
Next I added some scripts under Zabbix Administration → Scripts and made them as Action operations.
This one turns on the AC:
… and this one turns it off.
Lights, camera, action!
We have our triggers and scripts, great! Next, it’s time to add some actions.
During the daytime, Zabbix will be interested in the living room temperature and will turn on AC if the temperature goes over 23C for ten consecutive times
During the nighttime, Zabbix will be reading the temperature of our bedroom and turn on AC if the temperature goes over 23C for ten consecutive times
We will see how well my attempt at this will work. Here’s what the operations look like — if it’s too hot, turn on the AC, and when the temperature comes down enough, turn off the AC.
As I built this thing while I was writing this blog entry, it’s possible I would need to fine-tune the thresholds somewhat to not make my automatic AC control too aggressive. Anyway, this now works in theory.
Oh, BTW, Cozify could also make similar rules, but as it does not directly support our air conditioner (but would require a separate Air Patrol device for that), this is again a great example of how I can utilize Cozify, but with Zabbix extend my home’s IoT functionality even more for free.
I have been working at Forcepoint since 2014 and always try to find out new ways to automate things. — Janne Pikkarainen
This post was originally published on the author’s LinkedIn account.
Can you control your air conditioner using Zabbix? Of course, you can!
By day, I am a monitoring technical lead in a global cyber security company. By night, I monitor my home with Zabbix and Grafana and do some weird experiments with them. Welcome to my weekly blog about this project.
A few months ago I added our recently bought air conditioner to Zabbix monitoring by utilizing MQTT. Reading values is nice and mandatory for monitoring; but can we also send commands to the air conditioner using Zabbix? Yes.
Testing, testing
MQTT is a little unknown area for me, so please don’t hit me too hard if I’m doing this completely wrong. Anyway, this seems to work! I know that Zabbix supports MQTT for reading data, but I’m not sure if it can do writing, so that’s why I am using a command line and external scripts for my example.
At first, I tested if my whole idea would work just by using the command line:
The mosquitto_pub command might sound like a bar where some summer-time insects spend their free time, but no, this one instead publishes an MQTT message with value 22 to that aircon topic. In other words, I tried to change the temperature to 22 degrees Celsius.
And it worked!
From here, the rest was easy. I created three shell one-liners:
One for setting AC mode (off, cooling, etc.)
One for setting AC fan speed
One for setting AC temperature
These then receive some value from Zabbix by taking the command line argument. Yeah, I know, I didn’t add any input validation here.
Adding it to Zabbix
Now that I have my scripts, I then went to Zabbix Administration –> Scripts and added some scripts there.
I gave these scripts a menu tree structure, so from now on I can control my AC from Zabbix and it looks like this.
Setting fan speed:
Setting AC mode:
Setting temperature:
… and whenever I execute any of these, I get mosquitto_pub command output back, here setting the temperature to 22 C.
Of course, the scripts could be hooked with triggers, so if for example, our living room would be too hot, Zabbix could power on the AC automatically. For now, I’m not taking the automatic route as we might not be at home all the time.
A Grafana dashboard
And, like for so many other monitored items, I also have a separate Grafana dashboard for our air conditioning, with values being read from Zabbix. From the dashboard, I can easily see whenever our AC has been on or off, what’s the fan speed and so on.
And btw, those of you using Zabbix 6.2 and Grafana — please make sure you upgrade your Grafana Zabbix plugin to at least version 4.2.9 (released on July 12th, 2022), as the previous versions did not work with Zabbix 6.2 at all. I found this out the hard way at home, but I patiently waited for the update.
I have been working at Forcepoint since 2014 and it never has been cooler to work from home. — Janne Pikkarainen
This post was originally published on the author’s LinkedIn account.
Can you find out what your laptop is doing during its boot with Zabbix? Of course, you can!
By day, I am a monitoring technical lead in a global cyber security company. By night, I monitor my home with Zabbix & Grafana and do some weird experiments with them. Welcome to my weekly blog about this project.
This time I was originally planning to write about how to monitor yet another device with Zabbix, but as in today’s world deliveries seem to take a long time, I’ll blog about something else — Zabbix and syslog collection.
Zabbix as syslog platform?
You might not think of Zabbix as of a syslog platform, as there are specialized tools for that, providing much more functionality for log management than Zabbix ever could. However, sending syslog information to Zabbix can be very useful. In bigger environments, sending everything to it might be overkill and too taxing, so please, filter with care and consider the log retention period, but at home with a very low logging rate, this can be handy.
Logs? How and why?
At my home network, a Raspberry Pi 4 is running a Zabbix server, among other software. One of the roles of my cool little Raspberry is that it acts as a centralized syslog server. I have configured my home router, MacBook, and one more laptop to send their syslog to rsyslogd running on my Raspberry.
Then, on Zabbix, I have an item configured to keep an eye on the centralized log file the events are flowing into.
This way, I can see all kinds of events happening on those devices via Zabbix, and create appropriate triggers if something worth mentioning gets logged. Inspecting the syslog with the Zabbix Plain text widget, it’s shown absolutely everything, and well, that view probably contains just noise.
Adding details
However, if you start searching for whatever you would need to know about, then you of course can search for content. Let’s see what my MacBook has automatically updated lately:
I can then add a trigger that would log the time when something got installed or updated. It’s in no way a replacement for a proper log management solution, but for Super Important Targets something like this could be very useful, as you could catch any looming issues via Zabbix immediately, too.
Likewise, I can see what my Linux laptop has been doing:
In my configuration, absolutely everything gets sent to Zabbix, so the syslog entries from the devices are coming in starting from the moment the devices have their network & syslog services up, and they will stop coming when the syslog service stops during a shutdown.
Here’s the Linux laptop starting up:
MacBook also sends its events to syslog during OS updates/startup/shutdown, but it’s been so long since I last restarted my Mac that my Zabbix does not have the logs for that period of time anymore, and I don’t want to restart my MacBook (which I’m using to type this blog entry) just to get a screenshot from its boot sequence.
Hopefully, my new gadget will arrive soon, so I can then finally blog about that.
I have been working at Forcepoint since 2014 and in addition to monitoring addict, I am a log addict, too. — Janne Pikkarainen
This post was originally published on the author’s LinkedIn account.
Can you monitor your several-year-old dumb Roomba iRobot vacuum cleaner with Zabbix? Of course, you can!
By day, I am a monitoring technical lead in a global cyber security company. By night, I monitor my home with Zabbix & Grafana and make weird experiments with them. Welcome to my weekly blog about this project.
This post is a tad bit shorter than usual, as my summer vacation was looming and I had much other fish to fry before that. However, my motivation for this post came from guests visiting us at our home that weekend, so doing the hoovering and stuff was a reasonable thing to do.
Monitor your robot vacuum cleaner with Zabbix
So, I just did put our Roomba to do some initial cleaning. While doing so, I attached the RuuviTag I used in my last post to our Roomba, and of course, did so by using the gorgeously ugly brown tape to secure Ruuvi’s trip.
As RuuviTag has acceleration sensors, it may be possible to record Roomba’s movements by using Ruuvi. Does it work? Of course, it does.
See, it works!
This is so far my most rushed blog entry, as I literally started this experiment in about 30 minutes. The RuuviTag was already configured to my Zabbix, as it’s the same one that is/was measuring if our dog Lily is in her bed.
However, Lily’s presence was detected by utilizing Ruuvi’s temperature sensor. This Roomba experiment is done by checking the readings from RuuviTag acceleration sensors. See, it works!
From the graph we can clearly see 1) the moment I did transfer RuuviTag from Lily’s bed to Roomba and 2) Roomba’s movement.
So, from these graphs, I can then see for how long Roomba was doing its stuff.
But why?
OK, this is a stupid example, but in the real world, there would be more practical applications for this kind of monitoring. For example, monitor something that should NOT be moving (maybe a grill in your backyard or a safe at work), and if it starts moving, immediately suspect that something is wrong. Or, monitor something that should be in the constant move (conveyor belt?) but is not, and alert accordingly.
I have been working at Forcepoint since 2014 and adding more data points to monitoring is still fascinating. — Janne Pikkarainen
This post was originally published on the author’s LinkedIn account.
Can you monitor your dogs’ sleeping habits with Zabbix? Of course, you can! By day, I am a monitoring technical lead in a global cyber security company. By night, I monitor my home with Zabbix & Grafana and do some weird experiments with them. Welcome to my weekly blog about this project.
Meet Lily, our soon-eleven-years old French bulldog. As she’s getting old, a year or two ago we got her a very nice bed from a Finnish company PAIKKA. The bed is more advanced than the one we humans in this house have; it has a memory foam mattress and some kind of thermal system to keep our furry buddy warm.
Anyway, even though Lily has three or four additional beds all around our house so she can be with us, no matter in what room we are spending our time, Lily really loves this bed and seemingly spends very long periods of time in it without coming out of it meanwhile.
Or, that’s our impression. But what’s the actual usage pattern? Zabbix to the rescue!
Oh hi, RuuviTag, would you like to do some temperature monitoring?
How to monitor Lily’s bed usage? A surveillance camera and something like ZoneMinder would be weird; a motion sensor would not give any meaningful results … but wait, there’s RuuviTag, a nice little environmental monitoring gadget from another Finnish company Ruuvi. It’s just a Bluetooth Low Energy device… a Bluetooth Beacon… I don’t know how to officially call it, but it has reprogrammable firmware, and by default RuuviTag acts as an environmental monitoring device, measuring temperature, humidity, and movement.
Here’s what Ruuvi’s mobile app looks like. For most people, that would be enough. For me, I skip that altogether after I have tried out with it that a RuuviTag works.
“Installing” RuuviTag to Lily’s bed
So, this part is not too hard. Here, let’s put the RuuviTag under Lily’s mattress.
Now that it’s there, it’s time to harvest data from RuuviTag and insert it into Zabbix.
Bridging RuuviTag and Zabbix
For easy reading of data from RuuviTag, there’s Bluewalker with built-in support for parsing Ruuvi’s data. It can format the output in various formats. I used just the traditional text format, made Zabbix read the log file, and made it parse the log file using item preprocessing.
Here’s the log:
Here’s Zabbix master item for the data:
.. and then I just have a bunch of dependent items parsing individual items from the master item.
… with some preprocessing applied.
Does it work?
Yes, it does. It seems that quite soon after Lily enters her bed the mattress temperature will raise a couple of degrees, so from that data we can guess that Lily is in her bed. And, as we can see, she really stays in her bed for several hours without leaving it, especially during the nighttime.
As you can see from the graph, I already did set up some alert thresholds to guess when Lily is in her bed and when she is not. The threshold is very careful on purpose not to get false alerts.
Anyway, I now also see data like this on my ZBX Viewer app and of course on my Zabbix/Grafana dashboard.
Of course, all this is just me being silly with our dog. But imagine the benefits of deploying this kind of “smart mattress” for the elderly or whoever we might need to monitor for their safety. “Hey, grandma Martha usually wakes up early, she’s still in bed even though it’s 11am, is she OK?”, or vice versa, “Hey, grandma Martha did not ever go to her bed last night, what’s up?”.
I recently just heard that a close relative of one of our friends had found their mother from her home after she had been there for one week in bad shape — luckily just ended up in hospital in the end, but imagine what kind of terror that week must have been. A 30 EUR gadget like RuuviTag or a smartwatch might have helped to detect the situation and alert people to help much, much earlier.
Hey watchdog, I am monitoring you too.
I have been working at Forcepoint since 2014 and even our dog must now think I am a monitoring addict. — Janne Pikkarainen
This post was originally published on the author’s LinkedIn account.
Can you monitor your webcam activity with Zabbix? Of course you can! By day, I work as a monitoring technical lead in a global cyber security company. By night, I monitor my home with Zabbix & Grafana and do some weird experiments with them. Welcome to my weekly blog about this project.
In a world where we work remote and have our web cameras on much of the time, you totally can forget to turn it off (or forget to toggle that physical webcam blindfold). Or, a Bad Hombre can lure something nasty to your computer and silently record your activities with it for any later evil consumption.
Scary, huh? Zabbix to the rescue!
Ssssshhhhh! Be very quiet, I am setting up a trap for uninvited visitors
Underneath, this thing works with a combination of zabbix_sender (spawned on my MacBook) and a Zabbix trapper item …
… with some preprocessing applied to it:
See, it works!
Easy bits first: See, this works!
Here’s latest data:
And here’s a graph:
In other words, my Zabbix can now tell if the web camera is on or not. I did not do any triggers for this yet, and for the most part this is just an inspirational post for y’all. Use Zabbix trigger conditions and create alerts such as:
Webcam is on but no usual webcam needing software (Teams, Zoom…) is found
Webcam is on even if the screen is locked
Webcam is on even if user is not logged in
Webcam is on in the middle of the night
Webcam is on even if nobody is home (according to your IoT monitoring setup)
This easily could add another layer to your security and privacy, as any suspicious usage of web camera (or, with similar technique, a microphone) can be detected in real time.
Headbang time
So, since I mostly use Mac for any webcam needs, I needed to get this working with a Mac. Unfortunately, as a Mac admin, I wear a yellow belt. For what it’s worth, I have an ancient MacBook Pro Retina mid-2012, running macOS Catalina.
First I thought this would be somehow easy, as I am already forwarding all the macOS syslog entries to my home syslog server (which is just the Raspberry Pi that also runs Zabbix & Grafana). Naive me thought that I could just look for kCameraStreamStart/Stop events via that log.
Little did I know, and this is where I request your help to make this sensible. I can see the log entries on my macOS in real-time with
log stream | grep “kCameraStream”
… but that does not want to save the thing in a log file if I try standard redirection with > or piping to tee or any other command, at least not without specifying a timeout value and then restarting the command.
Then there seems to be /etc/asl.conf and /etc/asl/ directory with many files, but my asl-fu is weak and I have no idea how to make it forward logs to remote syslog. I found out that in theory there’s a file parameter and I could store messages to file, which the standard syslog could then forward to my syslog server…. but I did not try out that route yet.
I know I could get the webcam status by using lsof but the trouble is that if the camera was on just for a very short time, it is possible to miss that with lsof.
For now, I have this terrible, terrible thing running background to see if the concept works, and I would like to get rid of this.
So, how to make this as smooth as possible with Mac? Basically I just would need to forward more logs to my central log server, but did not yet figure out, how to do that.
I think that with Linux I could detect the use of /dev/video0 via audit log or setup an incron hook to trigger if /dev/video0 get accessed, but not totally sure as these are some murky waters for me, I am not usually spying my webcam.
I have been working at Forcepoint since 2014 and my co-workers have to stand the pain that is my stupid t-shirts.
This post was originally published on the author’s LinkedIn account
Can you monitor your Bluetooth headset usage hours with Zabbix? Of course, you can!
By day, I earn living by being a monitoring tech lead in a global cyber security company. By night, I monitor my home with Zabbix and Grafana and do some weird experiments with them. Welcome to my weekly blog about how I monitor my home.
I adjust and tweak myself with the power of music. Finding out the root cause for a severe outage or just fixing some less severe error becomes much more epic if I listen to Hans Zimmer’s music. Trance, drum ‘n bass, demoscene music, and retro gaming music keep me afloat if I have something simple, repetitive things to do. For some reason I write each and every of these home monitoring entries with the soundtrack from the latest Batman movie playing background, and so forth.
My music listening habits, the online meetings at work, and the fact that I mostly work from home, just like my wife, means that I use my Valco headphones several hours a day. Valco claims that their headset can provide about 40 hours runtime with a single charge, and that kind of must be true as I only charge the headset on Sundays for them to be ready for a new week on Monday morning.
But how much do I really use my Valcos? Zabbix to the rescue!
Mac to Valco, Mac to Valco, please respond
As I use my headset mostly with a MacBook, I needed to find out how to get the connection status info from macOS command line. I am sure there are more sophisticated ways of doing this, but the sledgehammer method I used is good enough for my home use.
On macOS, system_profiler command gives you back tons of data, one of the elements being the Bluetooth devices. Sure enough, my Valco headset is visible there, and so is the connection status.
Now that I have the data available, I could send all this text output to Zabbix and use Zabbix item pre-processing. This morning (yes, I created this whole thing only two-three hours ago) I did something else though.
You know, while I was testing if my attempt works in real-time, I created a terrible shell one-liner, which I now also use with Zabbix.
Beautiful? No. Does it work? Yes. If I remove the zabbix_sender part, this is what happens: it returns “Yes” or “No”, indicating if my headphones are connected or not.
In other words, theoretically, this tells if my headset is powered on and if I am using them. In practice, I could of course have forgotten to turn the headset off, but that really does not happen.
My MacBook now runs the one-liner every minute via a cron job, so my Zabbix receives the data in near-enough real-time.
Zabbix time!
All my efforts and the zabbix_sender command are no good if I don’t do something on the Zabbix side, too.
With zabbix_sender, you need to set up a Zabbix trapper item on Zabbix. It’s really not rocket science, check this out:
But wait! My shell responded back “Yes” or “No”, but the Type of information is set to numeric. Am I stupid? Careless? No. There’s also some preprocessing involved.
I changed the values to be numeric so I can get fancier with Grafana later on; with numeric data, I can get better statistics about how much I actually do use my headphones and get really creative.
Does it work?
Of course, it does. Here are some latest data:
… and here’s a graph:
I will tell you next week how many hours I have spent inside my active noise-cancelling bubble. Probably too many, any ear doctor would tell me.
I have been working at Forcepoint since 2014 and without music, would be way less productive. — Janne Pikkarainen
This post was originally published on the author’s LinkedIn account.
Can you integrate Zabbix with Siri? Of course, you can! By day, I am a monitoring tech lead in a global cyber security company. By night, I monitor my home with Zabbix & Grafana and do some weird experiments with them. Welcome to my weekly blog about the home project.
I have lost count of exactly when, but a couple of major iOS/macOS versions ago Apple’s Siri gained the Shortcuts application. It allows you to automate all kinds of stuff and do some drag-and-drop ‘programming’.
What do I use it for? You guessed it right — I integrate Shortcuts with Zabbix API.
Setting up the Zabbix side
For my home Zabbix environment, I do not have any complex access rights set. So, setting up the API token for Shortcuts to consume was almost a one-click operation. In Zabbix, I went to User settings → API tokens → Create API token and let it do its stuff.
Creating a new shortcut
Now that I have the API token in place, next we need to create the shortcut. That’s not too much work though — run the Shortcuts application and create a new shortcut. What the shortcut below does is:
calls Zabbix API and requests our fridge temperature
parses the value and appends “degrees Celsius” to it
returns the value
Yes, that’s all of it. Drag ‘n drop a couple of elements and assign some values. Done.
Time to get Sirious
Ok, so we have our shortcut in place. What happens if I now ask Siri to check beer temperature? This happens.
The result is actually our refrigerator temperature, the beer thing was just to make this more interesting. But, as you can see, integrating Zabbix with Siri or vice versa is not too hard.
Any real-world use cases for this, other than the geek factor? I don’t know. It might be handy to request the latest alerts or similar from Siri if I’m driving my car and I get to hear that something’s wrong at work.
I have been working at Forcepoint since 2014 and I confess I actually use Siri for some basic work stuff, too. — Janne Pikkarainen
This post was originally published on the author’s LinkedIn account.
From experience, being connected to a community of fellow computing educators is really important, especially given that some members of the community may be the only computing educator in their school, district, or country. These professional connections enable educators to share and learn from each other, develop their practice, and importantly reduce any feelings of isolation.
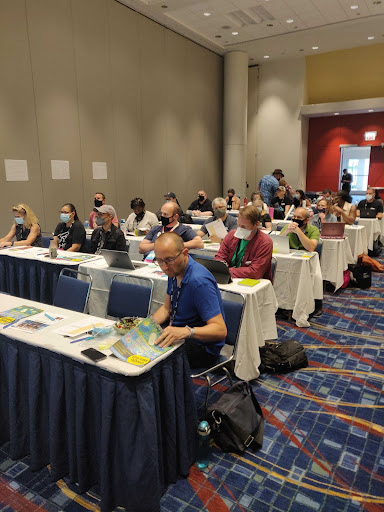
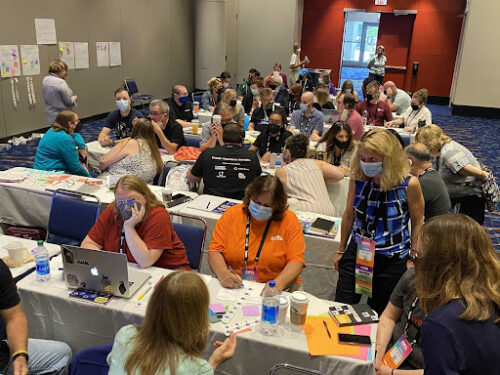
It was great to see the return of the Computer Science Teachers Association (CSTA) Annual Conference to an in-person event this year, and I was really excited to be able to attend.
Our small Raspberry Pi Foundation team headed to Chicago for four and a half days of meetups, professional development, and conversations with educators from all across the US and around the world. Over the week our team ran workshops, delivered a keynote talk, gave away copies of Hello World magazine, and signed up many new subscribers. You too can subscribe to Hello World magazine for free at helloworld.cc/subscribe.
We spoke to so many educators about all parts of the Raspberry Pi Foundation’s work, with a particular focus on the Hello World magazine and podcast, and of course The Big Book of Computing Pedagogy. In collaboration with CSTA, we were really proud to be able to provide all attendees with their own physical copy of this very special edition.
It was genuinely exciting to see how pleased attendees were to receive their copy of TheBig Book of Computing Pedagogy. So many came to talk to us about how they’d used the digital copy already and their plans for using the book for training and development initiatives in their schools and districts. We gave away every last spare copy we had to teachers who wanted to share the book with their colleagues who couldn’t attend.
Don’t worry if you couldn’t make it to the conference, The Big Book of Computing Pedagogy is available as a free PDF, which due to its Creative Commons licence you are welcome to print for yourself.
Another goal for us at CSTA was to support and encourage new authors to the magazine in order to ensure that Hello World continues to be the magazine for computing educators, by computing educators. Anyone can propose an article idea for Hello World by completing this form. We’re confident that every computing educator out there has at least one story to tell, lessons or learnings to share, or perhaps a cautionary tale of something that failed.
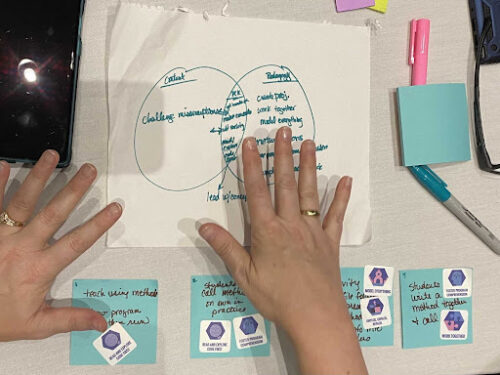
We’ll review any and all ideas and will support you to craft your idea into a finished article. This is exactly what we began to do at the conference with our workshop for writers led by Gemma Coleman, our fantastic Hello World Editor. We’re really excited to see these ideas flourish into full-blown articles over the coming weeks and months.
Our week culminated in a keynote talk delivered by Sue, Jane, and James, exploring how we developed our 12 pedagogy principles that underpin The Big Book of Computing Pedagogy, as well as much of the content we create at the Raspberry Pi Foundation. These principles are designed to describe a set of approaches that educators can add to their toolkit, giving them a shared language and the agency to select when and how they employ each approach. This was something we explored with teachers in our final breakout session where teachers applied these principles to describe a lesson or activity of their own.
We found the experience extremely valuable and relished the opportunity to talk about teaching and learning with educators and share our work. We are incredibly grateful to the entire CSTA team for organising a fantastic conference and inviting us to participate.
Discover more with Hello World — for free
Subscribe now to get each new Hello World straight to your digital inbox, for free! And if you’re based in the UK and do paid or unpaid work in education, you can subscribe for free print issues.
This post has been adapted from issue 19 of Hello World magazine, which explored the interaction between technology and sustainability.
We may have had the Coolest Projects livestream, but we are still in awe of the 2092 projects that young people sent in for this year’s online technology showcase! To continue the Coolest Projects Global 2022 celebrations, we’re shining a light on some of the participants and the topics that inspired their projects.
In this year’s showcase, the themes of sustainability and the environment were extremely popular. We received over 300 projects related to the environment from young people all over the world. Games, apps, websites, hardware — we’ve seen so many creative projects that demonstrate how important the environment is to young people.
Here are some of these projects and a glimpse into how kids and teens across the world are using technology to look after their environment.
Using tech to make one simple change
Has anyone ever told you that a small change can lead to a big impact? Check out these two Coolest Projects entries that put this idea into practice with clever inventions to make positive changes to the environment.
Arik (15) from the UK wanted to make something to reduce the waste he noticed at home. Whenever lots of people visited Arik’s house, getting the right drink for everyone was a challenge and often resulted in wasted, spilled drinks. This problem was the inspiration behind Arik’s ‘Liquid Dispenser’ project, which can hold two litres of any desired liquid and has an outer body made from reused cardboard. As Arik says, “You don’t need a plastic bottle, you just need a cup!”
Arik’s project helps you easily select a drink with the press of a button
Amrit (13), Kingston (12), and Henry (12) from Canada were also inspired to make a project to reduce waste. ‘Eco Light’ is a light that automatically turns off when someone leaves their house to avoid wasted electricity. For the project, the team used a micro:bit to detect the signal strength and decide whether the LED should be on (if someone is in the house) or off (if the house is empty).
“We wanted to create something that hopefully would create a meaningful impact on the world.”
Amrit, Kingston, and Henry
Projects for local and global positive change
We love to see young people invent things to have positive changes in the community, on a local and global level.
This year, Sashrika (11) from the US shared her ‘Gas Leak Detector’ project, which she designed to help people who heat their homes with diesel. On the east coast of America, many people store their gas tanks in the basement. This means they may not realise if the gas is leaking. To solve this problem, Sashrika has combined programming with physical computing to make a device that can detect if there is a gas leak and send a notification to your phone.
Sashrika and her gas leak detector
Sashrika’s project has the power to help lots of people and she has even thought about how she would make more changes to her project in the name of sustainability:
“I would probably add a solar panel because there are lots of houses that have outdoor oil tanks. Solar panel[s] will reduce electricity consumption and reduce CO2 emission[s].”
Sashrika
Amr in Syria was also thinking about renewable energy sources when he created his own ‘Smart Wind Turbine’.
The ‘Smart Wind Turbine’ is connected to a micro:bit to measure the electricity generated by a fan. Amr conducted tests that recorded that more electricity was generated when the turbine faced in the direction of the wind. So Amr made a wind vane to determine the wind’s direction and added another micro:bit to communicate the results to the turbine.
Creating projects for the future
We’ve also seen projects created by young people to make the world a better place for future generations.
Naira and Rhythm from India have designed houses that are suited for people and the planet. They carried out a survey and from their results they created the ‘Net Zero Home’. Naira and Rhythm’s project offers an idea for homes that are comfortable for people of all abilities and ages, while also being sustainable.
“Our future cities will require a lot of homes, this means we will require a lot of materials, energy, water and we will also produce a lot of waste. So we have designed this net zero home as a solution.”
Naira and Rhythm
Andrea (9) and Yuliana (10) from the US have also made something to benefit future generations. The ‘Bee Counter’ project uses sensors and a micro:bit to record bees’ activity around a hive. Through monitoring the bees, the team hope they can see (and then fix) any problems with the hive. Andrea and Yuliana want to maintain the bees’ home to help them continue to have a positive influence on our environment.
Knowledge is power: projects to educate and inspire
Some young creators use Coolest Projects as an opportunity to educate and inspire people to make environmental changes in their own lives.
Sabrina (13) from the UK created her own website, ‘A Guide to Climate Change’. It includes images, text, graphics of the Earth’s temperature change, and suggestions for people to minimise their waste. Sabrina also received the Broadcom Coding with Commitment award for using her skills to provide vital information about the effects of climate change.
Sabrina’s project
Kushal (12) from India wanted to use tech to encourage people to help save the environment. Kushal had no experience of app development before making his ‘Green Steps’ app. He says, “I have created a mobile app to connect like-minded people who want to do something about [the] environment.”
Kushal’s app helps people to upload and save pictures, like content from other users, and access helpful resources
These projects are just some of the incredible ideas we’ve seen young people enter for Coolest Projects this year. It’s clear from the projects submitted that the context of the environment and protecting our planet resonates with so many students, summarised by Sabrina, “Some of us don’t understand how important the earth is to us. And I hope we don’t have to wait until it is gone to realise.”
Check out the Coolest Projects showcase for even more projects about the environment, alongside other topics that have inspired young creators.
Can you take screenshots of the websites you monitor with Zabbix? Of course, you can! By day, I earn my living by being a monitoring tech lead in a global cyber security company. By night, I monitor my home. Welcome to my weekly blog about how I monitor my home with Zabbix & Grafana and do some weird experiments with them.
Proper full-stack monitoring does cover everything from the device’s physical status to what the end-user sees. However, often even with website monitoring, web admins only rely on all kinds of run-time data; operating system load, hardware health, service response times, and logs. If your site has some rarely occurring technical issue, you might not have any idea what the site looks like when the error happens. Is your site looking really wrong or is maybe just a panel or two misbehaving during some issue?
No, even if this post is meant to provide some food for thought, I am not speaking about the selenium your metabolism needs. Instead, I am speaking about a web-test framework that allows you to automate web browsers by using Java, Python, or several other languages it supports. It’s probably most useful for web browser & website developers so they can be sure that their sites look OK on all major browsers and so forth, but why not utilize that with your monitoring, too?
With a really short Python script (or whatever language) you can spawn a headless instance of whatever browser you want and ask it to do stuff for you. In the horribly simple example above, the script can be called like
selenium_screenshot.py blog.zabbix.com
and it then saves the screenshot under /usr/share/zabbix/assets/webtest-screenshots/ directory which is accessible by my home Zabbix & Grafana.
Now, where did I put that script?
What I actually use this for at home is that whenever some lunch restaurants publish their new menus, my Zabbix grabs a screenshot of the lunch menus and I can then spy the menus without a need to go to sites by myself.
As I do not want to show the more exact locations of the places I visit, in this example I’ll show you how to screenshot the blog.zabbix.com site instead.
Hooking the script to Zabbix is easy; just add the script to Zabbix via its Administration –> Scripts, and add it as a script you can call via Actions, and if you so want, also put it as a manual action so you can call the script manually any time you want through Zabbix contextual menus.
Then just add a trigger that snaps a screenshot whenever your web test is failing.
Say cheese!
Now that we have our screenshot mechanism in place, this is how it looks through Zabbix URL widget:
… and this is how it looks when embedded to Grafana with its Text panel, HTML content type and a simple <img> tag:
What’s this useful for?
Lots of stuff. From now on, you too can easily embed a screenshot of your monitored website within your monitoring environment. Put some more panels to that dashboard showing the active alerts, graphs, run-time data, and logs, and you can have a very comprehensive full stack monitoring in place.
Or make your screenshot script more intelligent (I recommend that anyway), and make it save the files with date stamp info in filenames, so you can have a nice little time machine inside Grafana and its time picker.
Selenium can also give you many more other details, such as performance data or the URLs which were called during the page load. I’m sure that’s useful, too.
I have been working at Forcepoint since 2014 and never get tired of getting a more clear view of the status of the stuff I monitor. — Janne Pikkarainen
Many of us have visited a number of different conferences over the years. The setting and the goal of the conferences can vary by a large degree – from product presentations to technology stack overviews and community get-togethers. Zabbix Summit is somewhat special in that, as it aims to combine all of the aforementioned goals and present them in a friendly, inclusive, and approachable manner.
As an open-source product with a team consisting of open-source enthusiasts, it is essential for us to ensure that the core tenets of what we stand for are also represented in the events that we host, especially so for Zabbix Summit. Our goal is for our attendees to feel right at home and welcome during the Summit – no matter if you’re a hardened IT and monitoring professional or just a beginner looking to chat and learn from the leading industry experts.
Connecting with the Zabbix community
Networking plays a large part in achieving the goals that we have set up for the event. From friendly banter during coffee breaks and speeches (you never know when a question will turn into a full-fledged discussion) to the evening fun-part events – all of this helps us build our community and encourages people to help each other and mutually contribute to each other’s projects.
Of course, the past two years have challenged our preconceptions of how such an event can be hosted in a way where we achieve our usual goals. While hosting a conference online can make things a bit more simple (everyone is already in the comfort of their home or office and organizers don’t have to spend time and other resources renting a venue, for example) the novelty of “online events” can wear of quite quickly. The conversations don’t flow as naturally as they do in person. Perusing through a list of attendees in Zoom isn’t quite the same as noticing a friend or recognizing an acquaintance while standing in line at the snack bar. As for the event speakers – steering your presentation in the correct direction can be quite complex without observing the emotional feedback of your audience. Are they bored? Are they excited? Is everyone half asleep 5 minutes in? Who knows.
With travel and on-premise events slowly becoming a part of our lives again, we’re excited to get back to our usual way of hosting Zabbix Summit. In 2022, it will be held on-premises in Riga, Latvia on October 7-8, and we can’t wait to interact with our community members, clients, and partners face-to-face again!
Making the best Zabbix Summit yet
As with every Zabbix Summit, this year’s event will build on the knowledge and feedback we have gained in previous years to make this year’s Summit the best it has ever been. This year will be special for us – we will be celebrating the 10th anniversary of the Zabbix Summit hosted on-premises! In addition to conducting the event on-site, we will also be live-streaming the event online, so if you can’t meet us in person – tune in and say hello to the Zabbix team virtually!
Zabbix Summit 2019 conference venue
Over the years we have managed to define a set of criteria for the Zabbix Summit speeches with the goal to provide content that can deliver unique value to our attendees. As a Zabbix certified trainer, a Zabbix fan, and a long-time Zabbix user, I know that there are certain types of speeches that immediately attract my attention:
In-depth Zabbix functionality overviews from Zabbix experts or Zabbix team members
Unique business monitoring use cases
Custom Zabbix integrations, applications, and extensions
How Zabbix is used in the context of the latest IT trends (e.g.: Kubernetes, cloud environments, configuration management tools such as Ansible and Chef)
Designing and scaling Zabbix deployments for different types of large and distributed environments
This is something that we try to put extra focus on for the Zabbix Summit. Speeches like these are bound to encourage questions from the audience and serve as a great demonstration of using Zabbix outside the proverbial box that is simple infrastructure monitoring.
Looking back at Zabbix Summit 2021, we had an abundance of truly unique speeches that can serve as guidelines for complex monitoring use cases. Some of the speeches that come to mind are Wolfgang Alper’s Zabbix meets television – Clever use of Zabbix features, where Wolfgang talked about how Zabbix is used in the broadcasting industry to collect Graylog entries and even monitor TV production trucks!
As Zabbix has greatly expanded its set of features since the previous year’s summit, this year we expect the speeches to cover an even larger scope of topics related to many different industries and technology stacks.
Workshops – what to expect
Workshops are a whole other type of ordeal. In an environment where we can have participants coming from different IT backgrounds with very different skill sets, it’s important to make the workshop interesting, while at the same time making it accessible to everyone.
Zabbix workshop session at the Zabbix Summit 2019
There are a few ways we go about this to ensure the best possible workshop experience for our Zabbix Summit attendees:
Use native Zabbix features to configure and deploy unique use cases
Focus on a thorough analysis of a particular feature, uncovering functionality that many users may not be aware of
Demonstrate the latest or even upcoming Zabbix features
Interact with the audience and be open to questions and discussions
In the vast majority of cases, this allows keeping a smooth pace during the workshop while also having fun and discussing the potential use cases and the functionality of the features on display.
Becoming Zabbix certified during Zabbix Summit 2022
But why stop at workshops? During the Zabbix Summit conferences, we always give our attendees a chance to test their knowledge by attempting to pass the Zabbix certified user, specialist, or professional certification exams. The exams not only test your proficiency in Zabbix but can also reveal some missing pieces in your Zabbix knowledge that you can discuss with the Zabbix community right on the spot. Receiving a brand new Zabbix certificate is also a great way to start your day, won’t you agree?
A moment of jubilation for our freshly certified Zabbix specialists and professionals
This year the Summit attendees will also get the chance to participate in Zabbix one-day courses focused on problem detection, Zabbix security, Zabbix API, and data pre-processing. Our trainers will walk you through each of these topics from A-Z and they’re worth checking out both for Zabbix beginners as well as seasoned Zabbix veterans. I can attest that by the end of the course you will have a list of features that you will want to try out in your own infrastructure – and I’m saying that as a Zabbix-certified expert.
As for those who already have Zabbix 5.0 certifications – we’ve got a nice surprise in store for you too. We will be holding Zabbix certified specialist and professional upgrade courses, which will get you up to speed with the latest Zabbix 6.0 features and upgrade your certification level to Zabbix 6.0 certified specialist and professional.
Scaling up the Zabbix Summit
But we haven’t slumbered for the last two years of working and hosting events remotely. We have continued growing as a team and expanding our partner and customer network. Who knows what surprises October will bring, but currently our plan is for Zabbix Summit 2022 to reflect our growth.
Zabbix team at the Zabbix Summit 2019
Currently, we stand to host approximately 500 attendees on-site and expect the online viewership to reach approximately 7000 unique viewers from over 80 countries all across the globe.
With over 20 speakers from industries such as banking and finance, healthcare and medical, IT & Telecommunications, and an audience consisting of system administrators, engineers, developers, technical leads, and system architects, Zabbix Summit is the monitoring event for knowledge sharing and networking across different industries and roles.
The fun part
Spending the major part of the day networking and partaking in knowledge sharing can be an amazing experience, but when all is said and done, most of us will want to unwind after an eventful day at the conference. The Zabbix Summit conference fun part events are where you will get to strengthen your bonds with other fellow Zabbix community members and simply relax in an informal atmosphere.
Zabbix Summit 2019 Sunset afterparty
The Zabbix Summit fun part consists of three parties.
Kick off Zabbix Summit 2022 by joining the Zabbix team and your fellow conference attendees for an evening of social networking and fun over cocktails and games at the Meet & Greet party.
Join the main networking event to mark the 10th anniversary of the Zabbix Summit. Apart from good vibes, cool music, and like-minded people, expect the award ceremony honoring the most loyal Zabbix Summit attendees, fun games to play, and other entertaining activities.
Celebrate the end of the Zabbix Summit 2022 by attending the closing party where you can network with conference peers and discuss the latest IT trends with like-minded people in a relaxed atmosphere.
Zabbix Summit 2019 Main party
Invite a travel companion
Zabbix Summit is also a great chance to take a friend or a loved one to the conference. The conference premises are located in the very heart of Riga – perfect for taking strolls across and exploring Riga Old Town.
If you’re interested in a more guided experience for your companion, we invite you to register for the Travel companion upgrade. Your travel companion will get to enjoy the Riga city tour followed by a lunch with the rest of the guests accompanying the Zabbix conference participants. Last time, we nurtured our travel companions with a delightful tour across the Riga Central market, accompanied by the Latvian-famous chef Martins Sirmais, and full of local food tasting. Our team is preparing something special also for this year. The tour will take place on October 7 during the conference time.
Visit the Zabbix offices
Are you a fan of the product and what we stand for? Why not pay us a visit and attend the Zabbix open doors day on October 6 from 13:00 till 15:00. Take a tour of the office and sit down with us for an informal chat and a cup of coffee or tea. There won’t be any speeches, workshops, or presentations, just friendly conversations with Zabbix team, our partners, and the community to warm up before the Summit. Although, there might be friendly foosball and office badminton tournaments if any volunteers will appear.
Welcoming our community members at the Zabbix Summit 2019 Open Doors day
All things said and done – Zabbix Summit is not only about deep technical knowledge and opinion sharing on monitoring. It is and has always been primarily a celebration of the Zabbix community. It is the community feedback that largely shapes the Zabbix summit and helps us build upcoming events on the foundations laid in the previous year. Throughout the years Zabbix summit has grown into much more than a simple conference – it’s an opportunity to travel, visit us, connect with like-minded people and spend a couple of days in a relaxed atmosphere in the heart of a beautiful Northern European city.
To provide the best experiences, we use technologies like cookies to store and/or access device information. Consenting to these technologies will allow us to process data such as browsing behavior or unique IDs on this site. Not consenting or withdrawing consent, may adversely affect certain features and functions.
Functional
Always active
The technical storage or access is strictly necessary for the legitimate purpose of enabling the use of a specific service explicitly requested by the subscriber or user, or for the sole purpose of carrying out the transmission of a communication over an electronic communications network.
Preferences
The technical storage or access is necessary for the legitimate purpose of storing preferences that are not requested by the subscriber or user.
Statistics
The technical storage or access that is used exclusively for statistical purposes.The technical storage or access that is used exclusively for anonymous statistical purposes. Without a subpoena, voluntary compliance on the part of your Internet Service Provider, or additional records from a third party, information stored or retrieved for this purpose alone cannot usually be used to identify you.
Marketing
The technical storage or access is required to create user profiles to send advertising, or to track the user on a website or across several websites for similar marketing purposes.