We are witnessing in real time as AI fundamentally changes how people work across every industry. Customer support agents can respond to ten times the tickets. Software engineers are reviewers of AI generated code instead of spending hours pounding out boiler plate code. Salespeople can get back to focusing on building relationships instead of tedious follow up and administration.
This technology feels magical, and Cloudflare is committed to helping companies build world class AI-driven experiences for their employees and customers.
There is a but, however. Any time a brand new technology with such widespread appeal emerges, the technology often outpaces the tools in place to govern, secure and control the technology. We’re already starting to see stories of vibe coded apps leaking all their users’ details. LLM chats that were intended to only be shared between colleagues, are actually out on the web, being indexed by search engines for all the world to see. AI Agents are being given the keys to the application kingdom, enabling them to work autonomously across an organization — but without proper tracking and control. And then there’s the risk of a well-meaning employee uploading confidential company or customer data into an LLM, which then uses it to train future models.
Beyond internal data used for LLM training, content creators and media companies are also faced with a decision about how they want LLM scrapers and information retrieval bots to interact with their content. Cloudflare has found that it can be hundreds, or even thousands, of times harder to generate site traffic (and therefore ad revenue) from an AI response versus a search engine result.
We’re hearing more and more of these stories from CISOs, CIOs, Creators, and even CEOs. These leaders are faced with a difficult choice: clamping down on all AI usage and bots — or letting them run wild. There needs to be something in between. And for that to be a real option, the tools to manage and secure AI need to catch up to AI itself.
This week, that’s what Cloudflare is focused on. Welcome to AI Week! Over the coming week, we will focus on four core areas to help companies secure and deliver AI experiences safely and securely:
Securing AI environments and workflows: AI is incredibly powerful. The problem is, innovation is outpacing control — we want to change that. And as one of the few zero trust providers also building out AI infrastructure for the web, we’re uniquely positioned to be able to do so.
Protecting original content from misuse by AI: AI Companies are devouring organic content as quickly as it’s created… and creators aren’t seeing any benefit. We want to give content creators control over the content that they have worked so hard to develop.
Helping developers build world-class, secure, AI experiences: the possibilities for developers to create new applications on top of (or even building with) AI are endless. We want to allow developers to create AI driven applications that are as close to users as possible, with security controls built-in from day one.
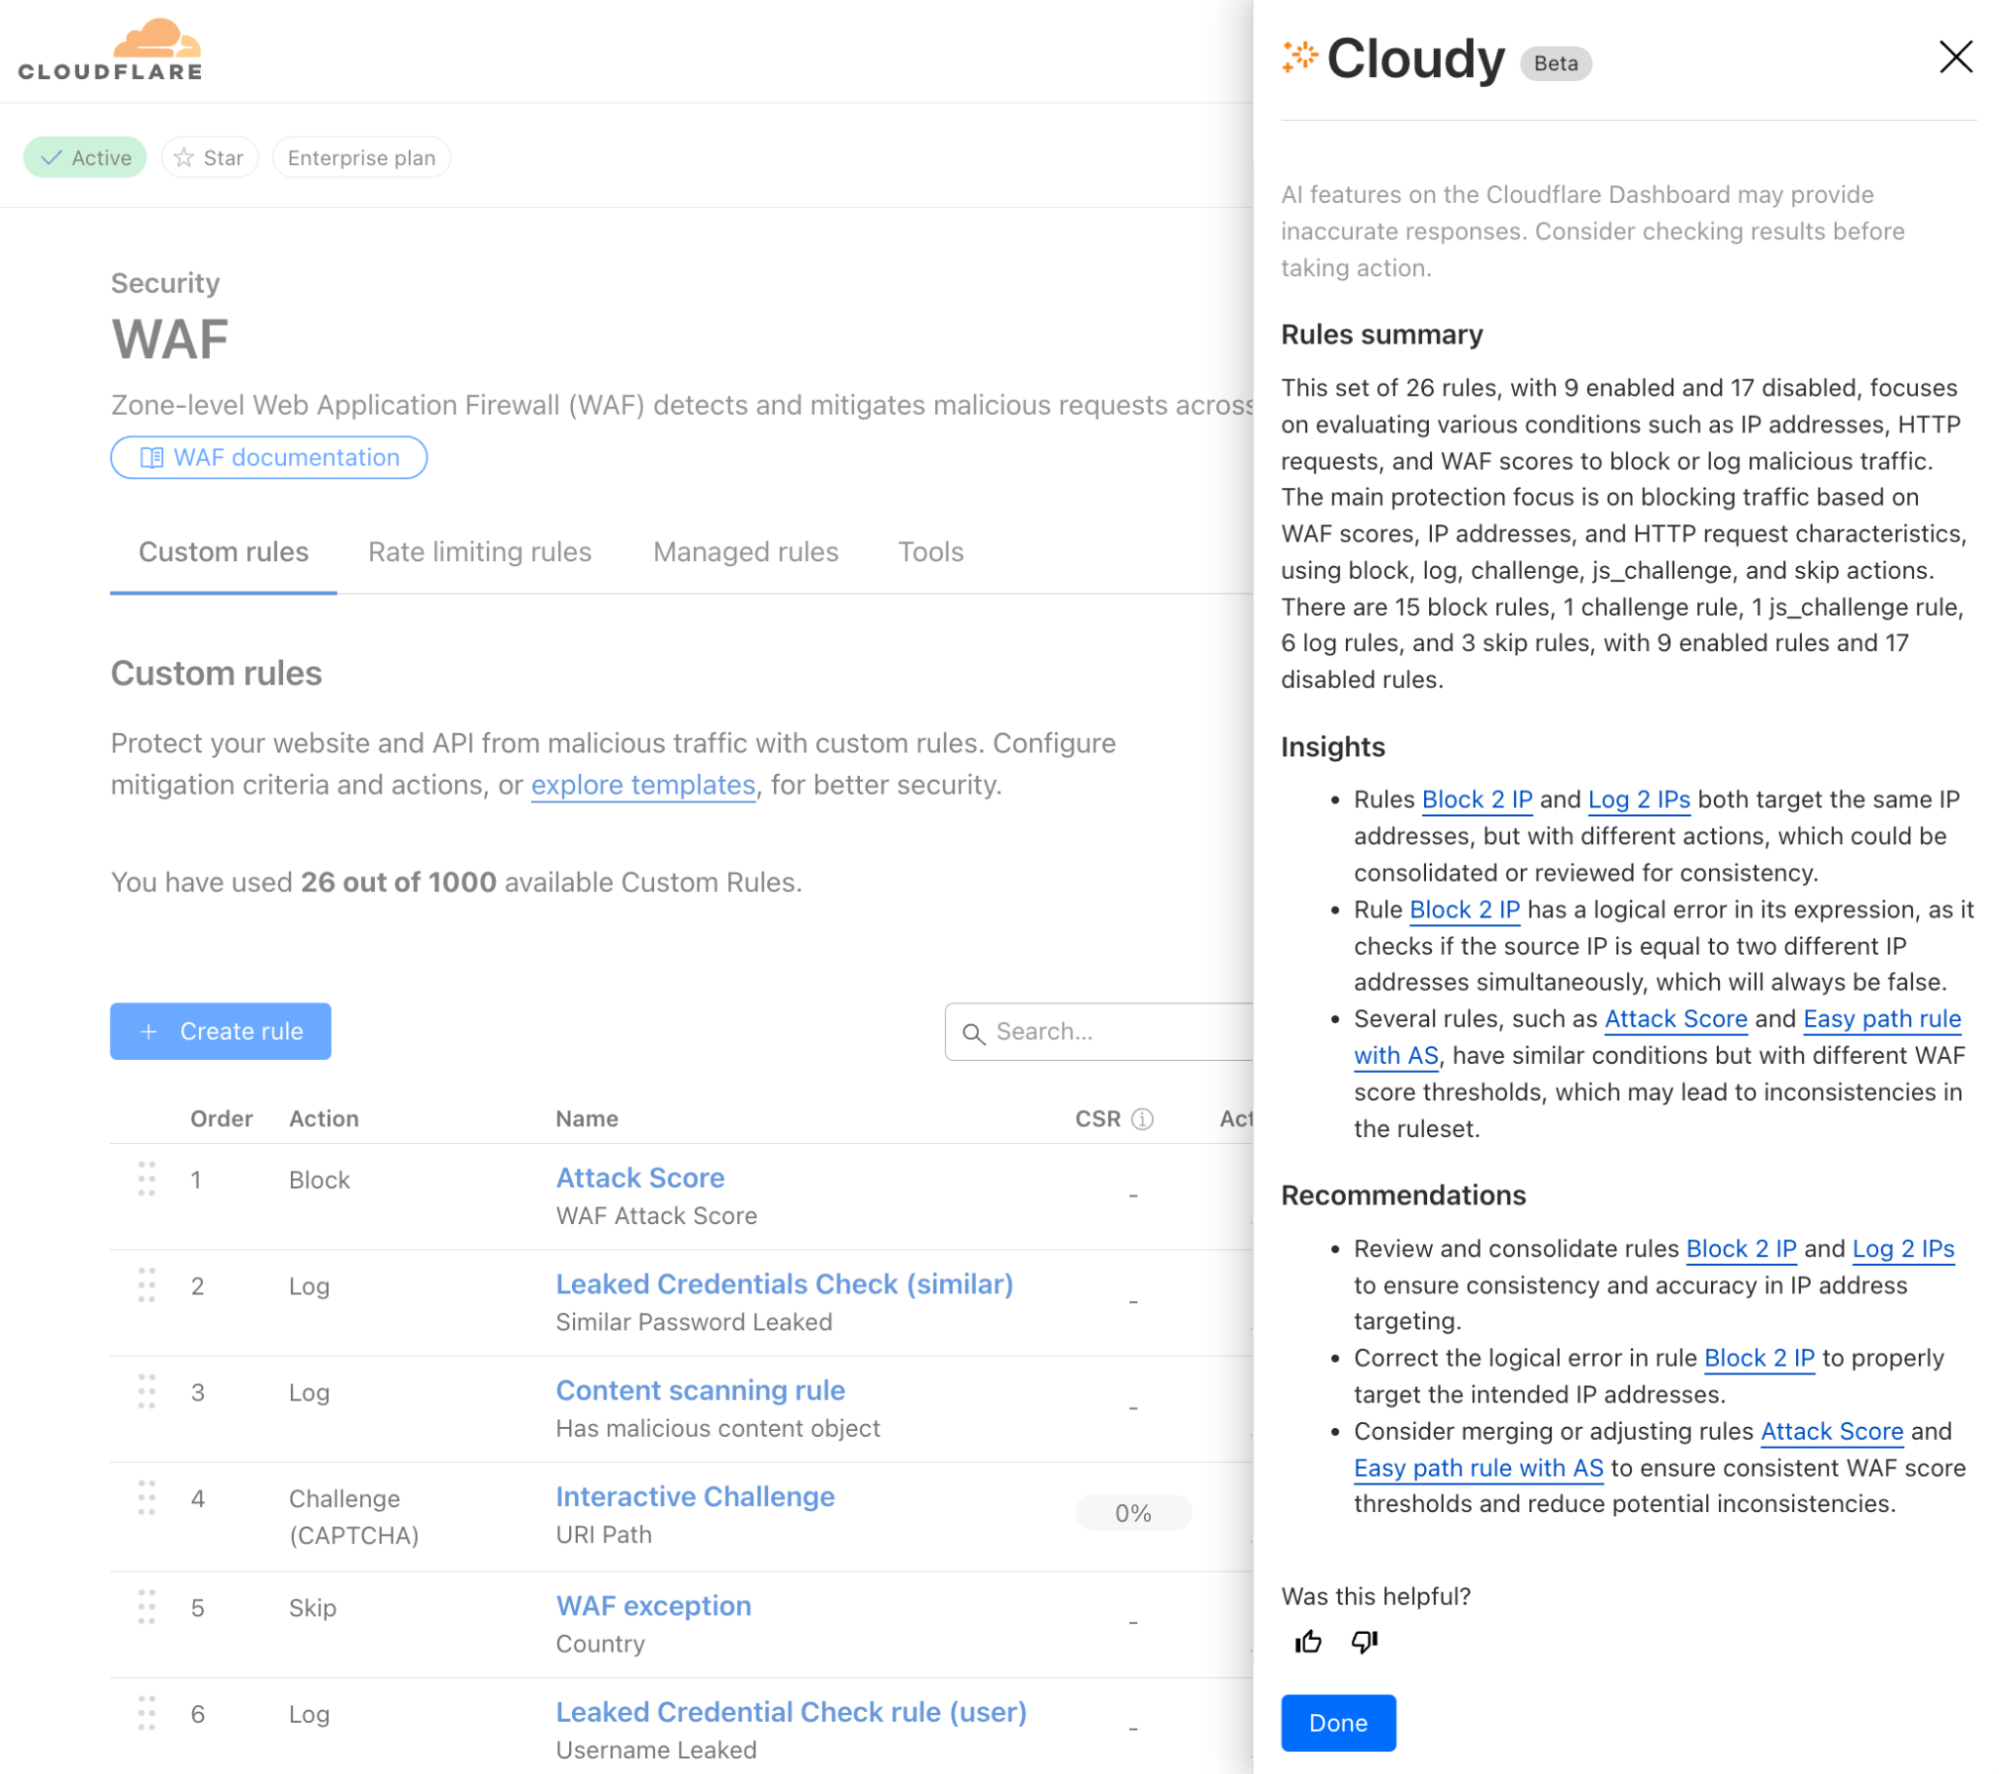
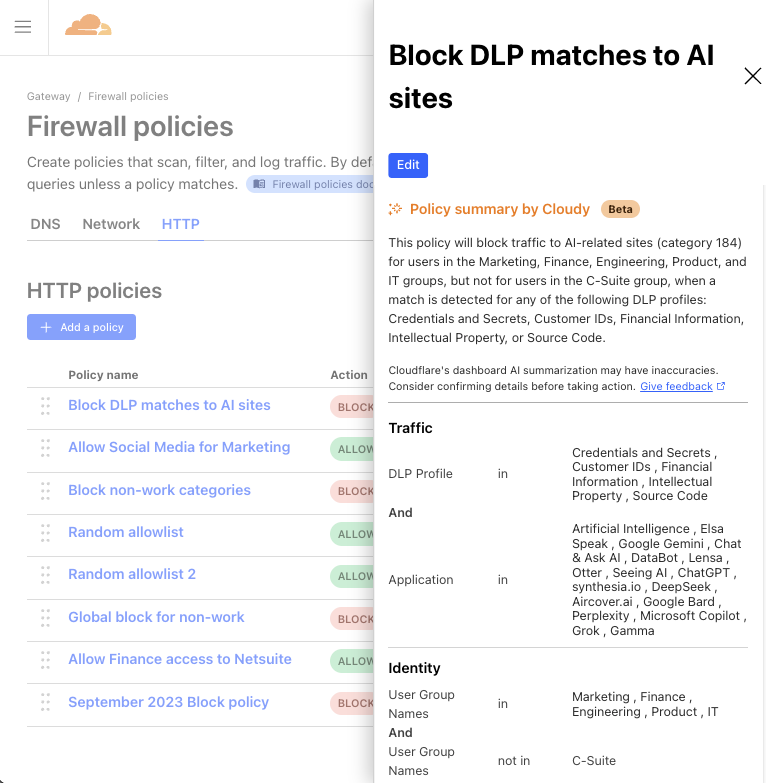
Making Cloudflare better for you with AI: AI is changing the nature of interfaces. For example, finding and mitigating issues buried in thousands and millions of logs and events across website, employee, and email usage is something that used to be tedious — but now with AI, it can be made easy. We’re working day and night to integrate AI into Cloudflare itself to make things more efficient for ourselves and our customers.
Securing AI environments and workflows
As Artificial Intelligence innovation continues to accelerate at an unprecedented pace, the speed of its development is increasingly outpacing the implementation of robust security controls. This rapid advancement, while promising immense benefits, simultaneously introduces novel and complex security challenges that traditional measures are often ill-equipped to address. Organizations are finding themselves grappling with the inherent risks of adopting powerful AI tools without adequate safeguards, leading to vulnerabilities such as Shadow AI and the uncontrolled proliferation of AI models, making the development of specialized AI security paramount.
As we look around the zero trust space, none of the other providers are moving fast enough to keep up with AI’s pace of innovation. This is something we know a thing or two about — and after this week, if you’re worried about governing AI usage inside your organization, we will have you covered.
We will be announcing new and powerful controls to detect Shadow AI and control unauthorized AI usage. Additionally, we’ve built options for teams to establish the “paved path” of AI tooling in an organization to supercharge employee productivity without sacrificing security. Finally, we’ll be announcing new ways of protecting your own models from poisoning or attacks.
Protecting original content from AI
The explosion of Large Language Models (LLMs) has also created a new challenge for content creators: the unauthorized scraping and training of their valuable content. Cloudflare recognizes the critical need for creators to maintain control over their intellectual property. That’s why we’ve introduced Crawl Control, a groundbreaking initiative designed to empower content owners to manage how their content is accessed and used by AI models.
In the past two months, we’ve seen incredible progress with Crawl Control. We’ve significantly expanded the number of participating content providers, allowing more creators to leverage this innovative protection. We’ve also refined our detection mechanisms to more accurately identify AI crawlers and ensure that only authorized access occurs. Furthermore, we’ve streamlined the integration process, making it easier for new publishers to onboard and begin protecting their content within minutes. Our goal remains to provide content creators with the tools they need to thrive in the age of AI, ensuring they are compensated and acknowledged for the content they produce.
Helping you build world-class, secure, AI experiences
We believe that AI experiences should have security controls by default. This is why we are heavily investing in both our developer platform’s AI Gateway and the associated security controls for those products. This two pronged approach allows developers to iterate and test new ideas without the fear of painful or embarrassing security issues.
The Cloudflare AI Gateway allows developers to deploy AI-driven applications with unparalleled speed and efficiency, ensuring that these applications are as close to end-users as possible. This proximity minimizes latency and maximizes performance, delivering a seamless and responsive user experience that is critical in today’s fast-paced digital landscape.
This week, we’re announcing significant enhancements to the AI Gateway, further solidifying its position as the premier platform for AI application deployment. These improvements include advanced caching mechanisms that reduce redundant model calls, leading to faster response times and lower operational costs. We are also introducing expanded observability features, providing developers with deeper insights into their AI model’s performance and usage patterns, which will enable more effective debugging and optimization. Furthermore, new integrations with popular AI frameworks and services will simplify the development workflow, allowing developers to leverage the AI Gateway’s benefits with even greater ease. Our commitment is to provide developers with the tools to innovate and deliver cutting-edge AI experiences to their users.
Making Cloudflare better with AI
We’re integrating AI across our entire product suite to enhance the Cloudflare experience itself. From intelligent threat detection that adapts to emerging attack patterns, to AI-powered optimizations that fine-tune network performance, our goal is to leverage AI to make our platform more intuitive, efficient, and secure. We envision a future where Cloudflare’s products proactively anticipate user needs, automate complex tasks, and deliver unparalleled insights, all powered by seamlessly embedded AI. This commitment to internal AI integration ensures that as the digital landscape evolves, Cloudflare remains at the forefront of innovation, continuously delivering superior value to our users.
We cannot wait to share these updates and announcements with you. Follow our AI Week hub page for all the latest releases from our blog and CloudflareTV.
Today, we are announcing Cloudflare’s Browser Developer Program, a collaborative initiative to strengthen partnership between Cloudflare and browser development teams.
At Cloudflare, we aim to help build a better Internet. One way we achieve this is by providing website owners with the tools to detect and block unwanted traffic from bots through Cloudflare Challenges or Turnstile. As both bots and our detection systems become more sophisticated, the security checks required to validate human traffic become more complicated. While we aim to strike the right balance, we recognize these security measures can sometimes cause issues for legitimate browsers and their users.
Building a better web together
A core objective of the program is to provide a space for intentional collaboration where we can work directly with browser developers to ensure that both accessibility and security can co-exist. We aim to support the evolving browser landscape, while upholding our responsibility to our customers to deliver the best security products. This program provides a dedicated channel for browser teams to share feedback, report issues, and help ensure that Cloudflare’s Challenges and Turnstile work seamlessly with all browsers.
What the program includes
Browser developers in the program will benefit from:
A two-way communication channel to Cloudflare’s team dedicated to addressing browser-specific concerns, feedback, and issues.
Best practices for building and testing against Cloudflare Challenges and Turnstile.
A private community forum for updates, questions, and discussion between browser developers and Cloudflare engineers.
Early visibility into updates or changes to that may impact how your browser handles Cloudflare Challenges.
(If applicable) Testing integration where we will incorporate your browser into our testing pipeline and monitor its performance with our releases.
This program is designed as a partnership where Cloudflare will, with our best effort, ensure our security products work properly with all browsers, while giving browser developers a voice in how these systems evolve. As an output of this program, we expect to publish clear browser requirements to run Cloudflare Challenges while striking the balance between openness and security.
For end users browsing the web, we continue to support a wide range of browsers. We will continue to update this list based on the insights and collaborations from the Browser Developer Program. We are also committed to ensuring our Challenge interstitial pages and Turnstile provide clear, actionable UI/UX for any error or failed states, making it easier for you to understand and resolve issues you may encounter.
How to apply
If you are working on a browser and want to ensure your users have a seamless experience with Cloudflare-protected websites, we encourage you to apply here.
We’ll ask for basic information about your project and ask you to sign our Browser Developer Program Agreement. In addition, we expect participants to adhere to our Community Code of Conduct and commit to constructive engagement.
Once you’re accepted, you’ll be invited to a private space in the Cloudflare Community where you can engage directly with our team.
Why is this important?
Cloudflare Challenges, a security mechanism to verify whether a visitor is a human or a bot, serve a wide variety of browsers in the world today. Chrome leads with 68.0%, Safari at 8.7%, Firefox at 6.3%, Edge at 4.8%, and Opera at 6.2%. However, the very long tail of browsers that collectively make up the remaining traffic, each representing less than 1% individually but together painting a picture of an incredibly diverse web ecosystem.
Browser traffic distribution, with 100+ browsers comprising the ‘Other’ category
This diversity spans a wide range of environments, each with unique constraints and capabilities:
Emerging and experimental browsers pushing the boundaries of web technology
Privacy-focused browsers such as DuckDuckGo that prioritize user data protection
Embedded browsers inside social media apps like Facebook, Instagram, and TikTok
WebViews used by mobile applications
Gaming and VR browsers such as Oculus for headsets and gaming consoles
Smart device browsers built into classroom displays and home appliances
Supporting this level of diversity poses real engineering challenges. Many of these browsers deviate from standard assumptions. Some lack full support for modern Web APIs, others operate under more stringent data privacy policies, and some are optimized for environments where our script to verify visitors may be hindered or blocked from running properly. These browsers are not bad or malicious. But their behavior may fall outside the typical patterns observed in mainstream browsers, which can lead to problematic or failed Challenge flows which we would like to avoid.
From an engineering perspective, our job is to strike a difficult balance. If our logic is too rigid that it expects only the behaviors of the majority, we risk excluding legitimate users on less conventional platforms. But if we relax our standards too much, we increase the attack surface for abuse. We cannot overfit to the top 5 browsers, nor can we afford to treat all clients as equal in capability or trustworthiness.
The Browser Developer Program is one way to close this gap. By working directly with browser teams, especially those building for niche or emerging environments, we can better understand the constraints they operate under and collaborate to make each of our systems more compatible and resilient.
Join us!
This program is free to join, and is open to any browser developer, no matter the size or the lifecycle stage. Our goal is to listen, learn, and collaborate with browser developers to create a better experience for everyone.
We believe this program will ultimately benefit end users the most. By joining this program, you will help us build solutions that prioritize both the security needs of businesses as well as the diverse ways people access the Internet.
Many developers, data scientists, and researchers do much of their work in Python notebooks: they’ve been the de facto standard for data science and sharing for well over a decade. Notebooks are popular because they make it easy to code, explore data, prototype ideas, and share results. We use them heavily at Cloudflare, and we’re seeing more and more developers use notebooks to work with data – from analyzing trends in HTTP traffic, querying Workers Analytics Engine through to querying their own Iceberg tables stored in R2.
Traditional notebooks are incredibly powerful — but they were not built with collaboration, reproducibility, or deployment as data apps in mind. As usage grows across teams and workflows, these limitations face the reality of work at scale.
marimo reimagines the notebook experience with these challenges in mind. It’s an open-source reactive Python notebook that’s built to be reproducible, easy to track in Git, executable as a standalone script, and deployable. We have partnered with the marimo team to bring this streamlined, production-friendly experience to Cloudflare developers. Spend less time wrestling with tools and more time exploring your data.
Want to start exploring your Cloudflare data with marimo right now? Head over to notebooks.cloudflare.com. Or, keep reading to learn more about marimo, how we’ve made authentication easy from within notebooks, and how you can use marimo to explore and share notebooks and apps on Cloudflare.
Why marimo?
marimo is an open-source reactive Python notebook designed specifically for working with data, built from the ground up to solve many problems with traditional notebooks.
The core feature that sets marimo apart from traditional notebooks is its reactive execution model, powered by a statically inferred dataflow graph on cells. Run a cell or interact with a UI element, and marimo either runs dependent cells or marks them as stale (your choice). This keeps code and outputs consistent, prevents bugs before they happen, and dramatically increases the speed at which you can experiment with data.
Thanks to reactive execution, notebooks are also deployable as data applications, making them easy to share. While you can run marimo notebooks locally, on cloud servers, GPUs — anywhere you can traditionally run software — you can also run them entirely in the browser with WebAssembly, bringing the cost of sharing down to zero.
Because marimo notebooks are stored as Python, they enjoy all the benefits of software: version with Git, execute as a script or pipeline, test with pytest, inline package requirements with uv, and import symbols from your notebook into other Python modules. Though stored as Python, marimo also supports SQL and data sources like DuckDB, Postgres, and Iceberg-based data catalogs (which marimo’s AI assistant can access, in addition to data in RAM).
To get an idea of what a marimo notebook is like, check out the embedded example notebook below:
Want to create your own notebook to run locally instead? Here’s a quick example that shows you how to authenticate with your Cloudflare account and list the zones you have access to:
mkdir cloudflare-zones-notebook
cd cloudflare-zones-notebook
3. Initialize a new uv project (this creates a .venv and a pyproject.toml):
uv init
4. Add marimo and required dependencies:
uv add marimo
5. Create a file called list-zones.py and paste in the following notebook:
import marimo

__generated_with = "0.14.10"
app = marimo.App(width="full", auto_download=["ipynb", "html"])


@app.cell
def _():
    from moutils.oauth import PKCEFlow
    import requests

    # Start OAuth PKCE flow to authenticate with Cloudflare
    auth = PKCEFlow(provider="cloudflare")

    # Renders login UI in notebook
    auth
    return (auth,)


@app.cell
def _(auth):
    import marimo as mo
    from cloudflare import Cloudflare

    mo.stop(not auth.access_token, mo.md("Please **sign in** using the button above."))
    client = Cloudflare(api_token=auth.access_token)

    zones = client.zones.list()
    [zone.name for zone in zones.result]
    return


if __name__ == "__main__":
    app.run()
6. Open the notebook editor:
uv run marimo edit list-zones.py --sandbox
7. Log in via the OAuth prompt in the notebook. Once authenticated, you’ll see a list of your Cloudflare zones in the final cell.
That’s it! From here, you can expand the notebook to call Workers AI models, query Iceberg tables in R2 Data Catalog, or interact with any Cloudflare API.
How OAuth works in notebooks
Think of OAuth like a secure handshake between your notebook and Cloudflare. Instead of copying and pasting API tokens, you just click “Sign in with Cloudflare” and the notebook handles the rest.
We built this experience using PKCE (Proof Key for Code Exchange), a secure OAuth 2.0 flow that avoids client secrets and protects against code interception attacks. PKCE works by generating a one-time code that’s exchanged for a token after login, without ever sharing a client secret. Learn more about how PKCE works.
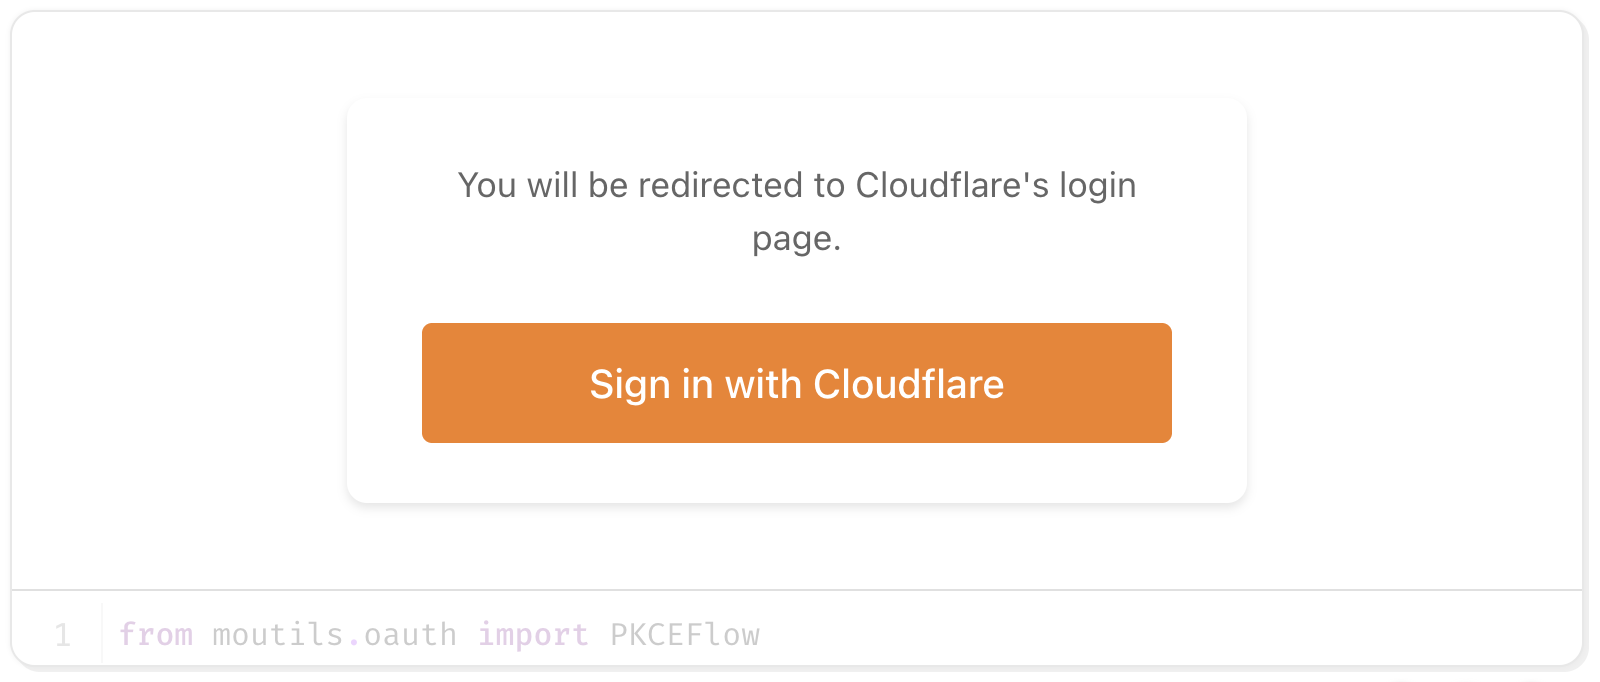
The login widget lives in moutils.oauth, a collaboration between Cloudflare and marimo to make OAuth authentication simple and secure in notebooks. To use it, just create a cell like this:
auth = PKCEFlow(provider="cloudflare")

# Renders login UI in notebook
auth
When you run the cell, you’ll see a Sign in with Cloudflare button:
Once logged in, you’ll have a read-only access token you can pass when using the Cloudflare API.
Running marimo on Cloudflare: Workers and Containers
If you have a local notebook you want to share, you can publish it to Workers. This works because marimo can export notebooks to WebAssembly, allowing them to run entirely in the browser. You can get started with just two commands:
If your notebook needs authentication, you can layer in Cloudflare Access for secure, authenticated access.
For notebooks that require more compute, persistent sessions, or long-running tasks, you can deploy marimo on our new container platform. To get started, check out our marimo container example on GitHub.
What’s next for Cloudflare + marimo
This blog post marks just the beginning of Cloudflare’s partnership with marimo. While we’re excited to see how you use our joint WebAssembly-based notebook platform to explore your Cloudflare data, we also want to help you bring serious compute to bear on your data — to empower you to run large scale analyses and batch jobs straight from marimo notebooks. Stay tuned!
We are thrilled to announce the General Availability of Cloudflare Log Explorer, a powerful new product designed to bring observability and forensics capabilities directly into your Cloudflare dashboard. Built on the foundation of Cloudflare’s vast global network, Log Explorer leverages the unique position of our platform to provide a comprehensive and contextualized view of your environment.
Security teams and developers use Cloudflare to detect and mitigate threats in real-time and to optimize application performance. Over the years, users have asked for additional telemetry with full context to investigate security incidents or troubleshoot application performance issues without having to forward data to third party log analytics and Security Information and Event Management (SIEM) tools. Besides avoidable costs, forwarding data externally comes with other drawbacks such as: complex setups, delayed access to crucial data, and a frustrating lack of context that complicates quick mitigation.
Log Explorer has been previewed by several hundred customers over the last year, and they attest to its benefits:
“Having WAF logs (firewall events) instantly available in Log Explorer with full context — no waiting, no external tools — has completely changed how we manage our firewall rules. I can spot an issue, adjust the rule with a single click, and immediately see the effect. It’s made tuning for false positives faster, cheaper, and far more effective.”
“While we use Logpush to ingest Cloudflare logs into our SIEM, when our development team needs to analyze logs, it can be more effective to utilize Log Explorer. SIEMs make it difficult for development teams to write their own queries and manipulate the console to see the logs they need. Cloudflare’s Log Explorer, on the other hand, makes it much easier for dev teams to look at logs and directly search for the information they need.”
With Log Explorer, customers have access to Cloudflare logs with all the context available within the Cloudflare platform. Compared to external tools, customers benefit from:
Reduced cost and complexity: Drastically reduce the expense and operational overhead associated with forwarding, storing, and analyzing terabytes of log data in external tools.
Faster detection and triage: Access Cloudflare-native logs directly, eliminating cumbersome data pipelines and the ingest lags that delay critical security insights.
Accelerated investigations with full context: Investigate incidents with Cloudflare’s unparalleled contextual data, accelerating your analysis and understanding of “What exactly happened?” and “How did it happen?”
Minimal recovery time: Seamlessly transition from investigation to action with direct mitigation capabilities via the Cloudflare platform.
Log Explorer is available as an add-on product for customers on our self serve or Enterprise plans. Read on to learn how each of the capabilities of Log Explorer can help you detect and diagnose issues more quickly.
Monitor security and performance issues with custom dashboards
Custom dashboards allow you to define the specific metrics you need in order to monitor unusual or unexpected activity in your environment.
Getting started is easy, with the ability to create a chart using natural language. A natural language interface is integrated into the chart create/edit experience, enabling you to describe in your own words the chart you want to create. Similar to the AI Assistant we announced during Security Week 2024, the prompt translates your language to the appropriate chart configuration, which can then be added to a new or existing custom dashboard.
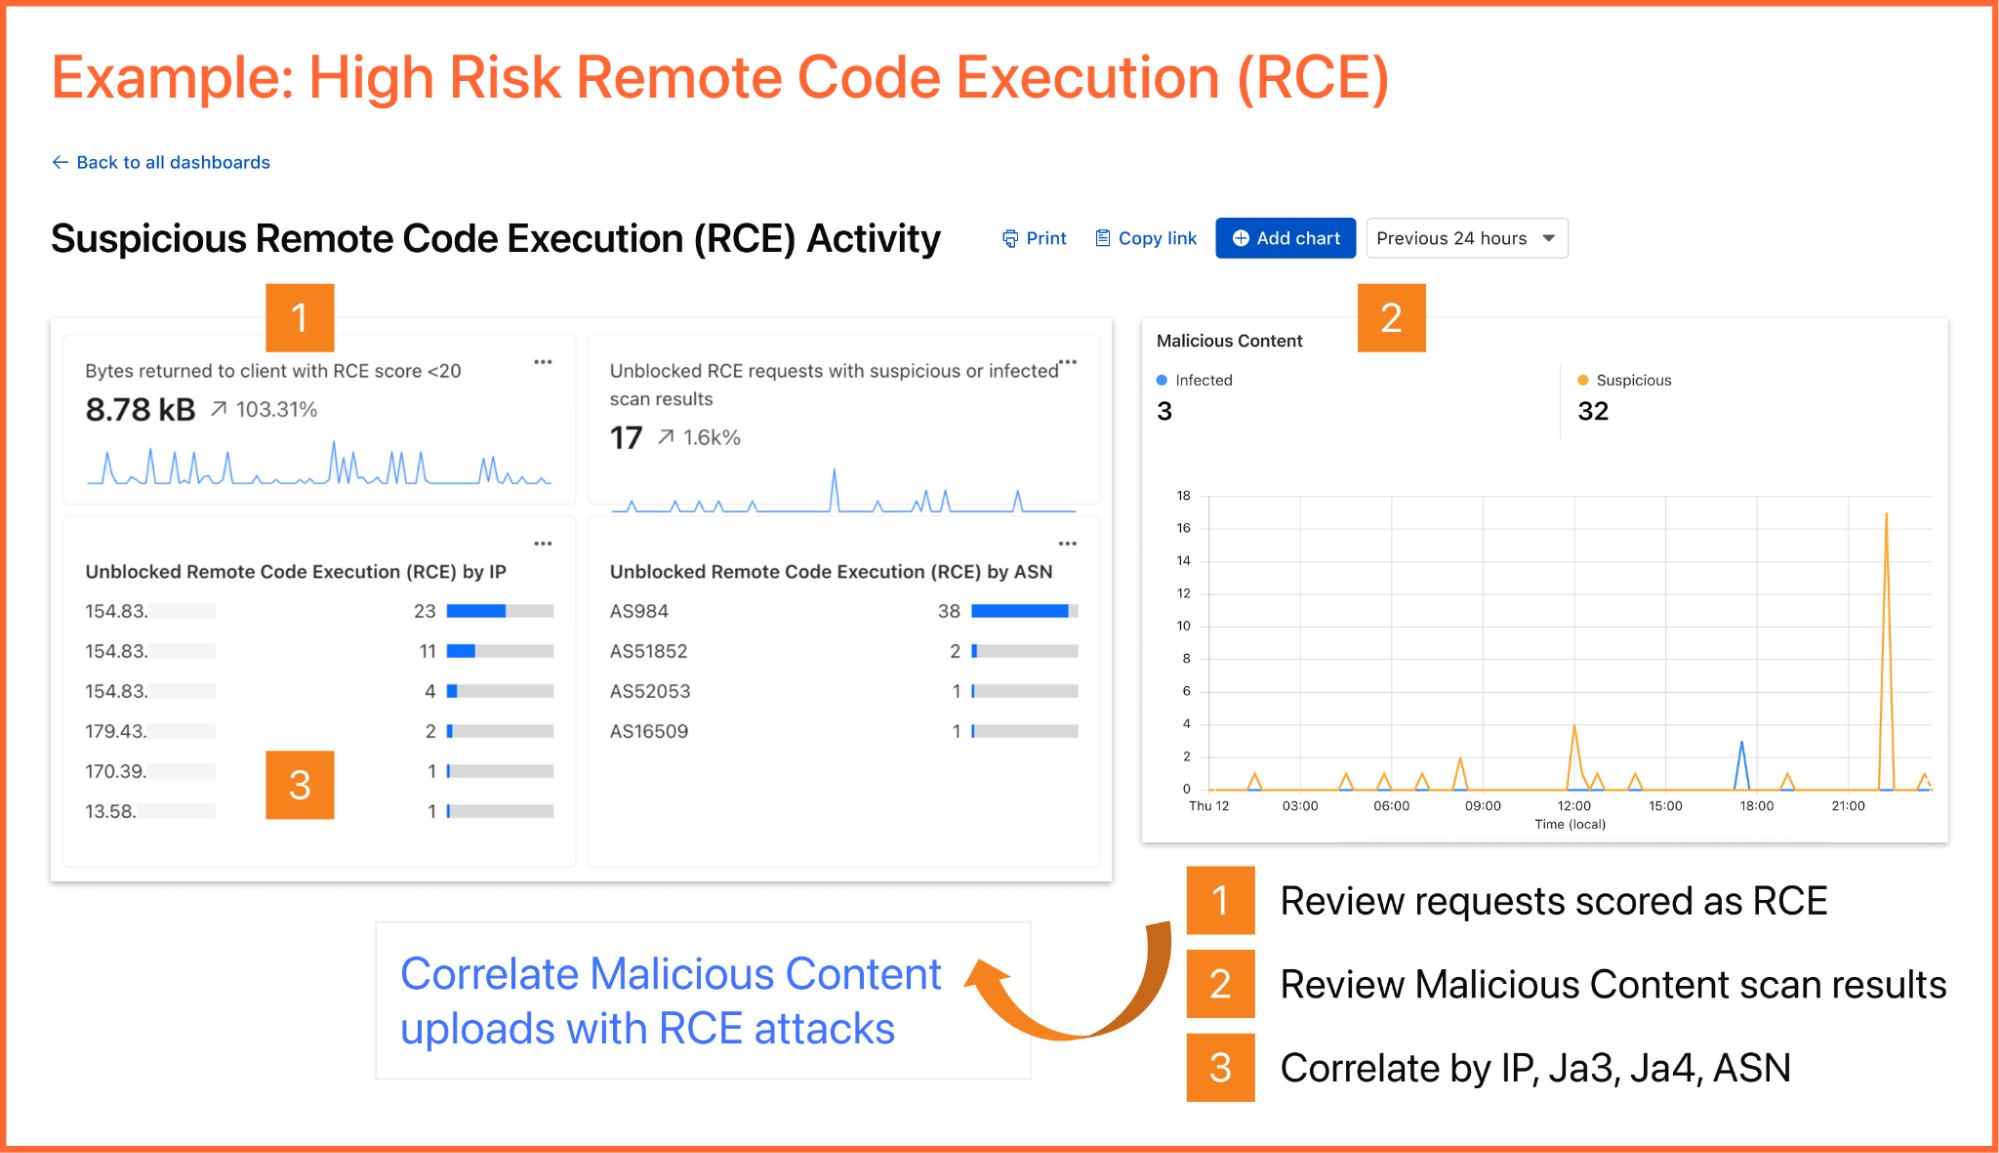
As an example, you can create a dashboard for monitoring for the presence of Remote Code Execution (RCE) attacks happening in your environment. An RCE attack is where an attacker is able to compromise a machine in your environment and execute commands. The good news is that RCE is a detection available in Cloudflare WAF. In the dashboard example below, you can not only watch for RCE attacks, but also correlate them with other security events such as malicious content uploads, source IP addresses, and JA3/JA4 fingerprints. Such a scenario could mean one or more machines in your environment are compromised and being used to spread malware — surely, a very high risk incident!
A reliability engineer might want to create a dashboard for monitoring errors. They could use the natural language prompt to enter a query like “Compare HTTP status code ranges over time.” The AI model then decides the most appropriate visualization and constructs their chart configuration.
While you can create custom dashboards from scratch, you could also use an expert-curated dashboard template to jumpstart your security and performance monitoring.
Available templates include:
Bot monitoring: Identify automated traffic accessing your website
API Security: Monitor the data transfer and exceptions of API endpoints within your application
API Performance: See timing data for API endpoints in your application, along with error rates
Account Takeover: View login attempts, usage of leaked credentials, and identify account takeover attacks
Performance Monitoring: Identify slow hosts and paths on your origin server, and view time to first byte (TTFB) metrics over time
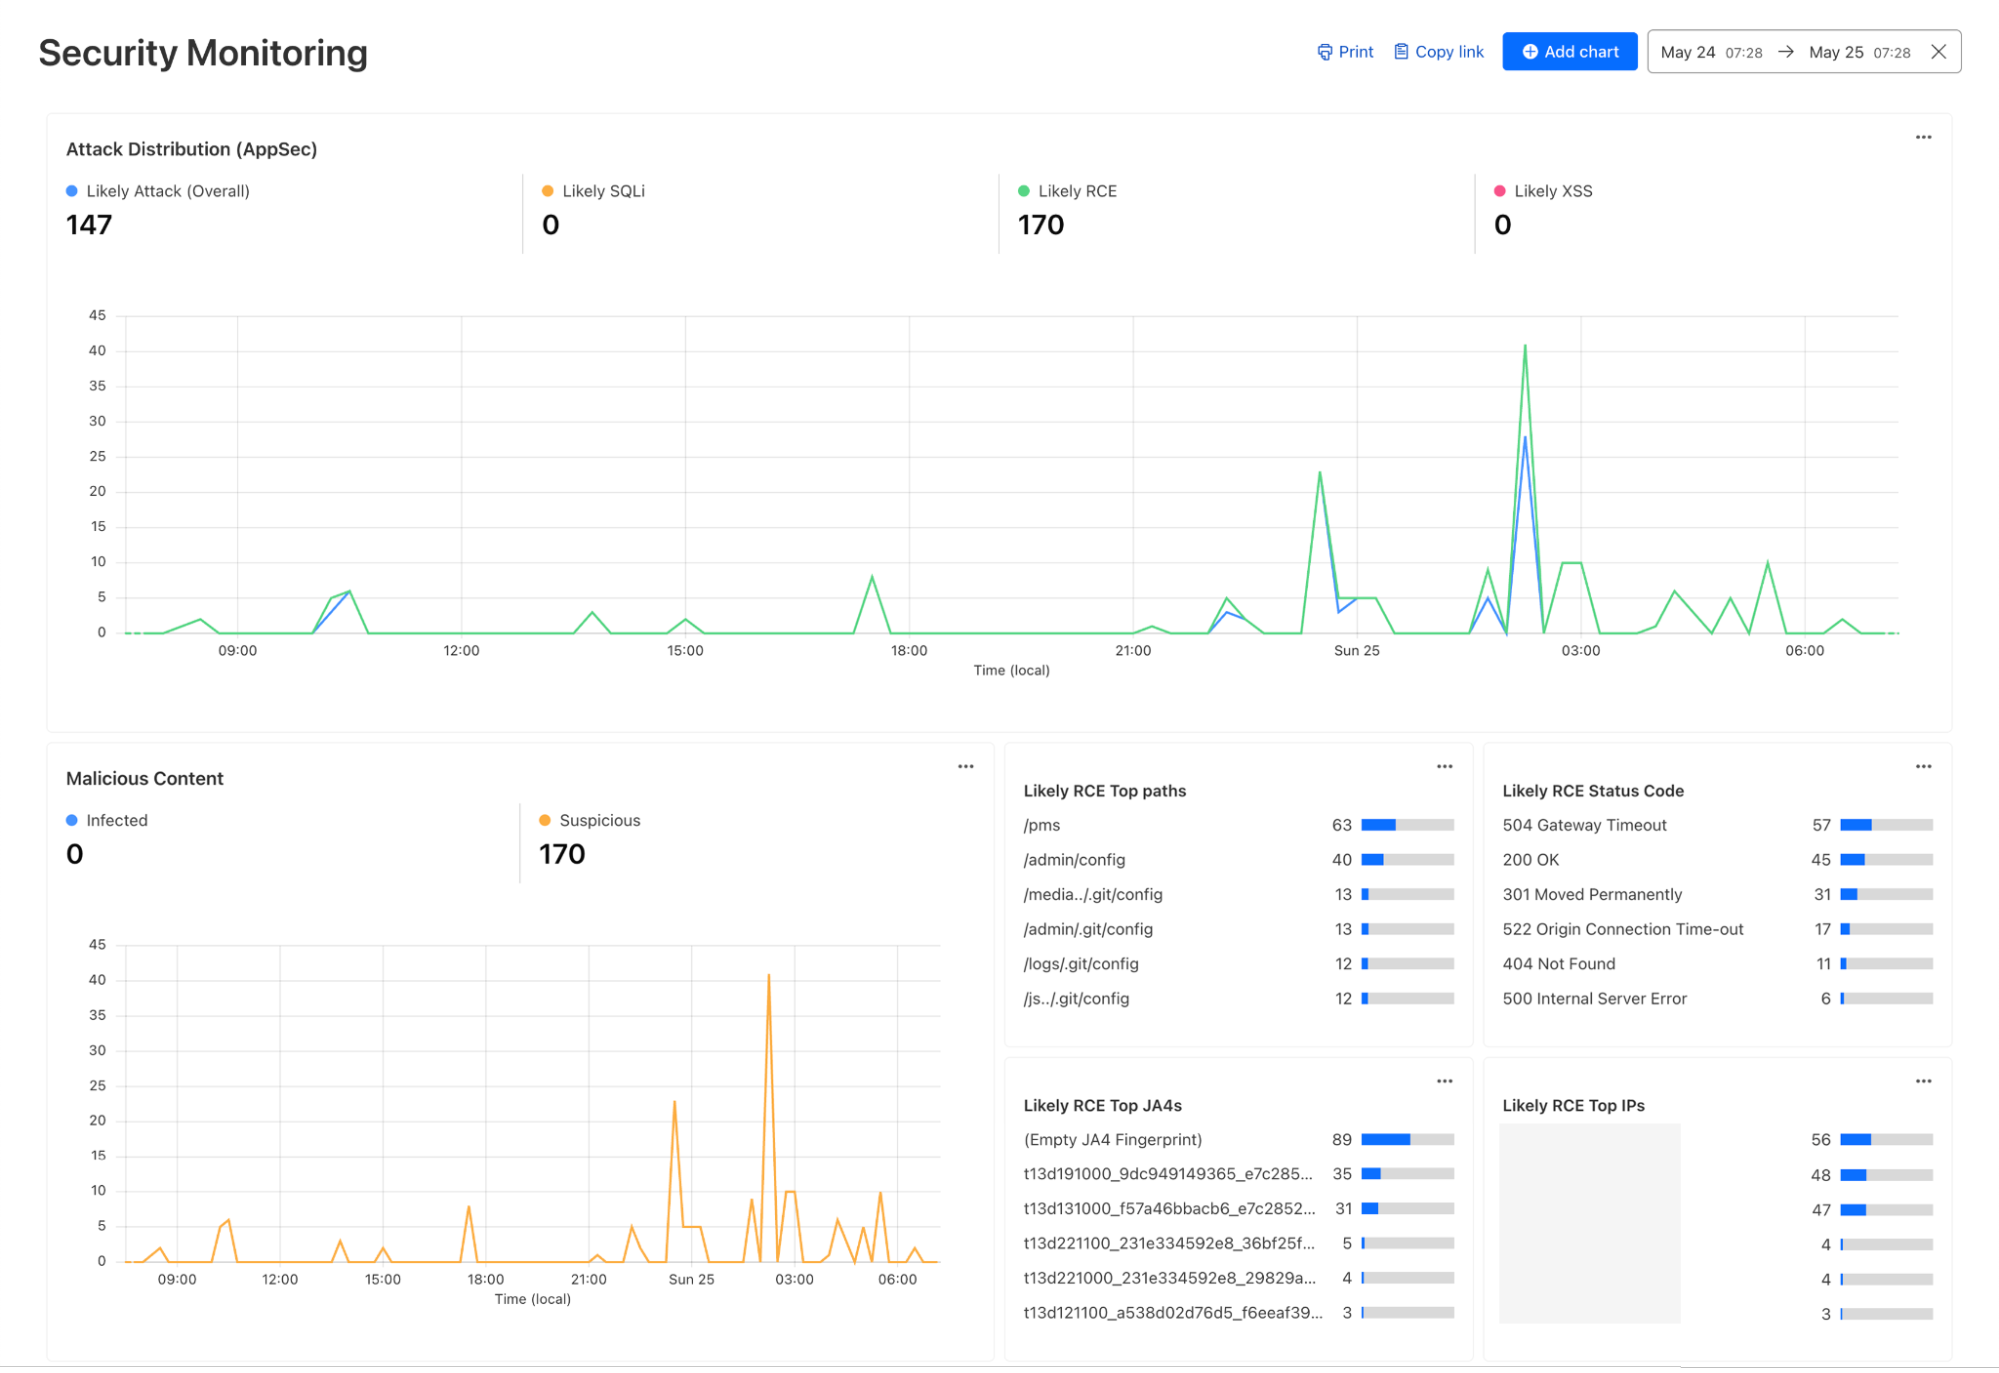
Security Monitoring: monitor attack distribution across top hosts and paths, correlate DDoS traffic with origin Response time to understand the impact of DDoS attacks.
Investigate and troubleshoot issues with Log Search
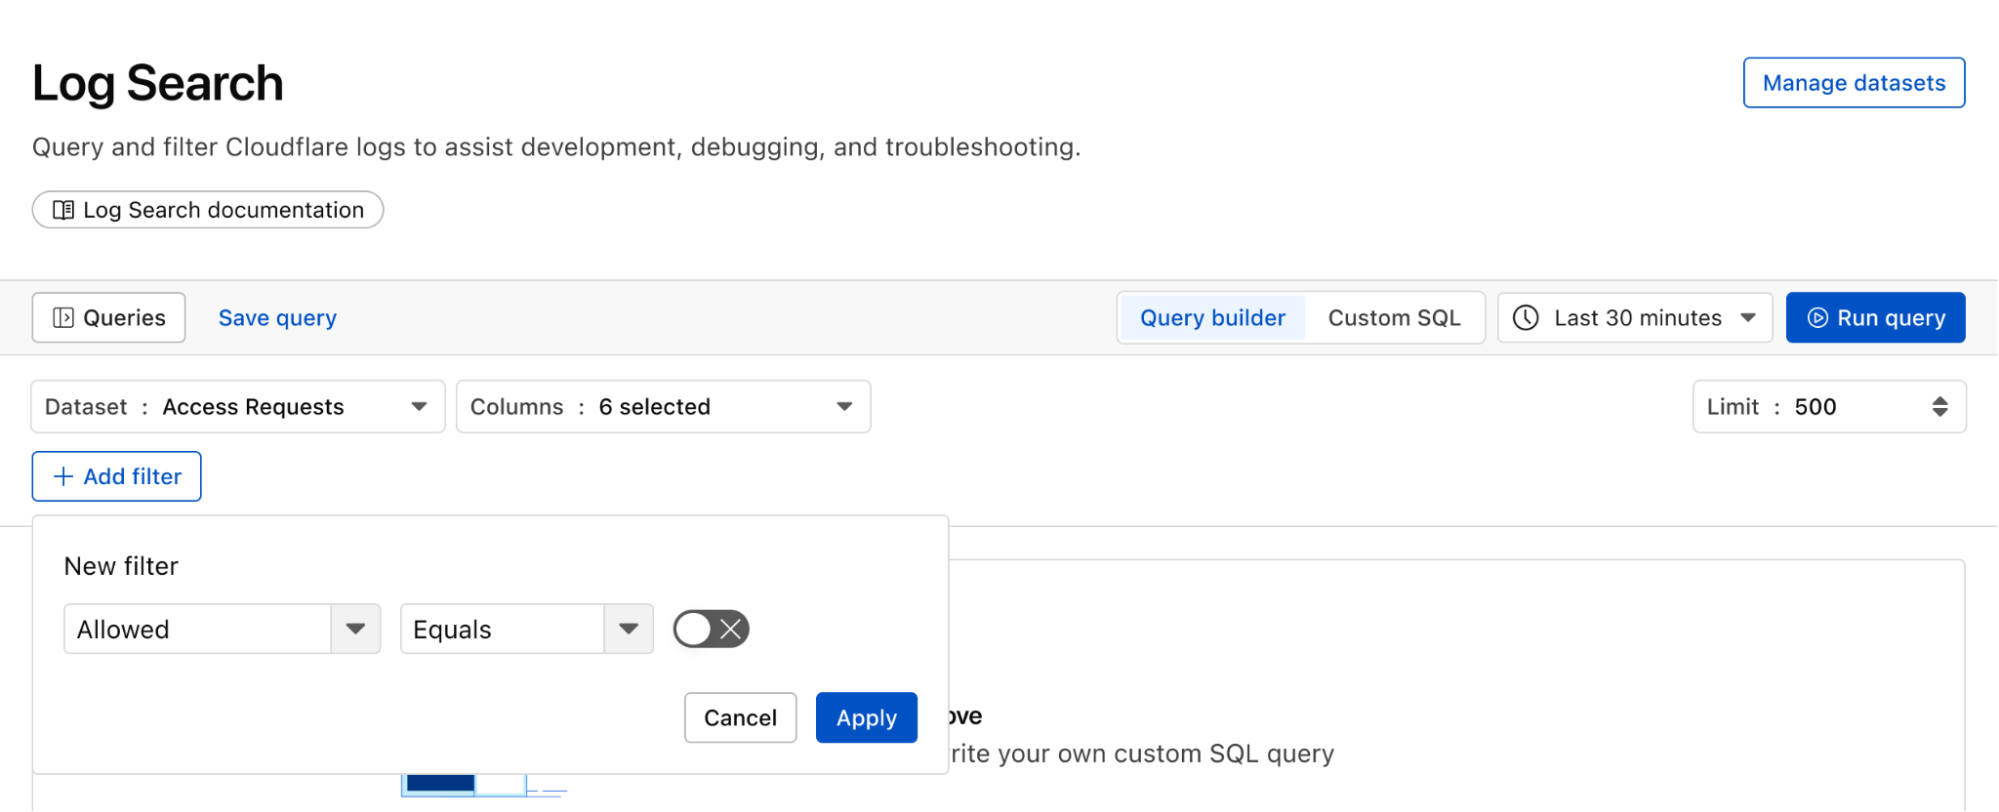
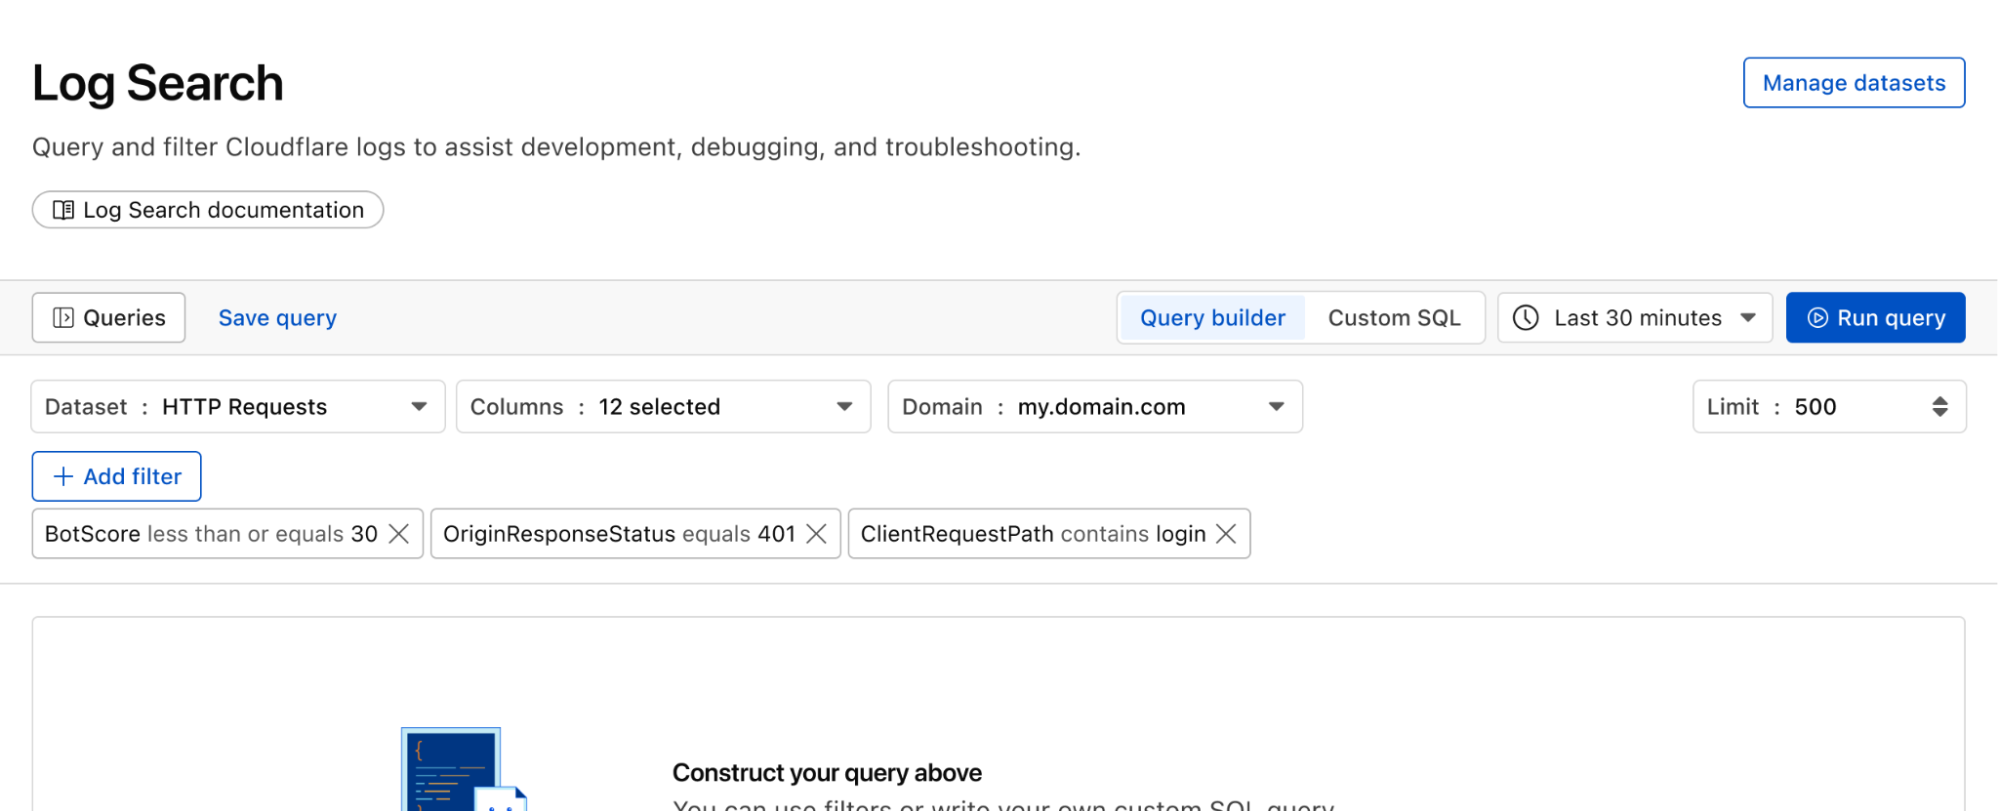
Continuing with the example from the prior section, after successfully diagnosing that some machines were compromised through the RCE issue, analysts can pivot over to Log Search in order to investigate whether the attacker was able to access and compromise other internal systems. To do that, the analyst could search logs from Zero Trust services, using context, such as compromised IP addresses from the custom dashboard, shown in the screenshot below:
Log Search is a streamlined experience including data type-aware search filters, or the ability to switch to a custom SQL interface for more powerful queries. Log searches are also available via a public API.
Save time and collaborate with saved queries
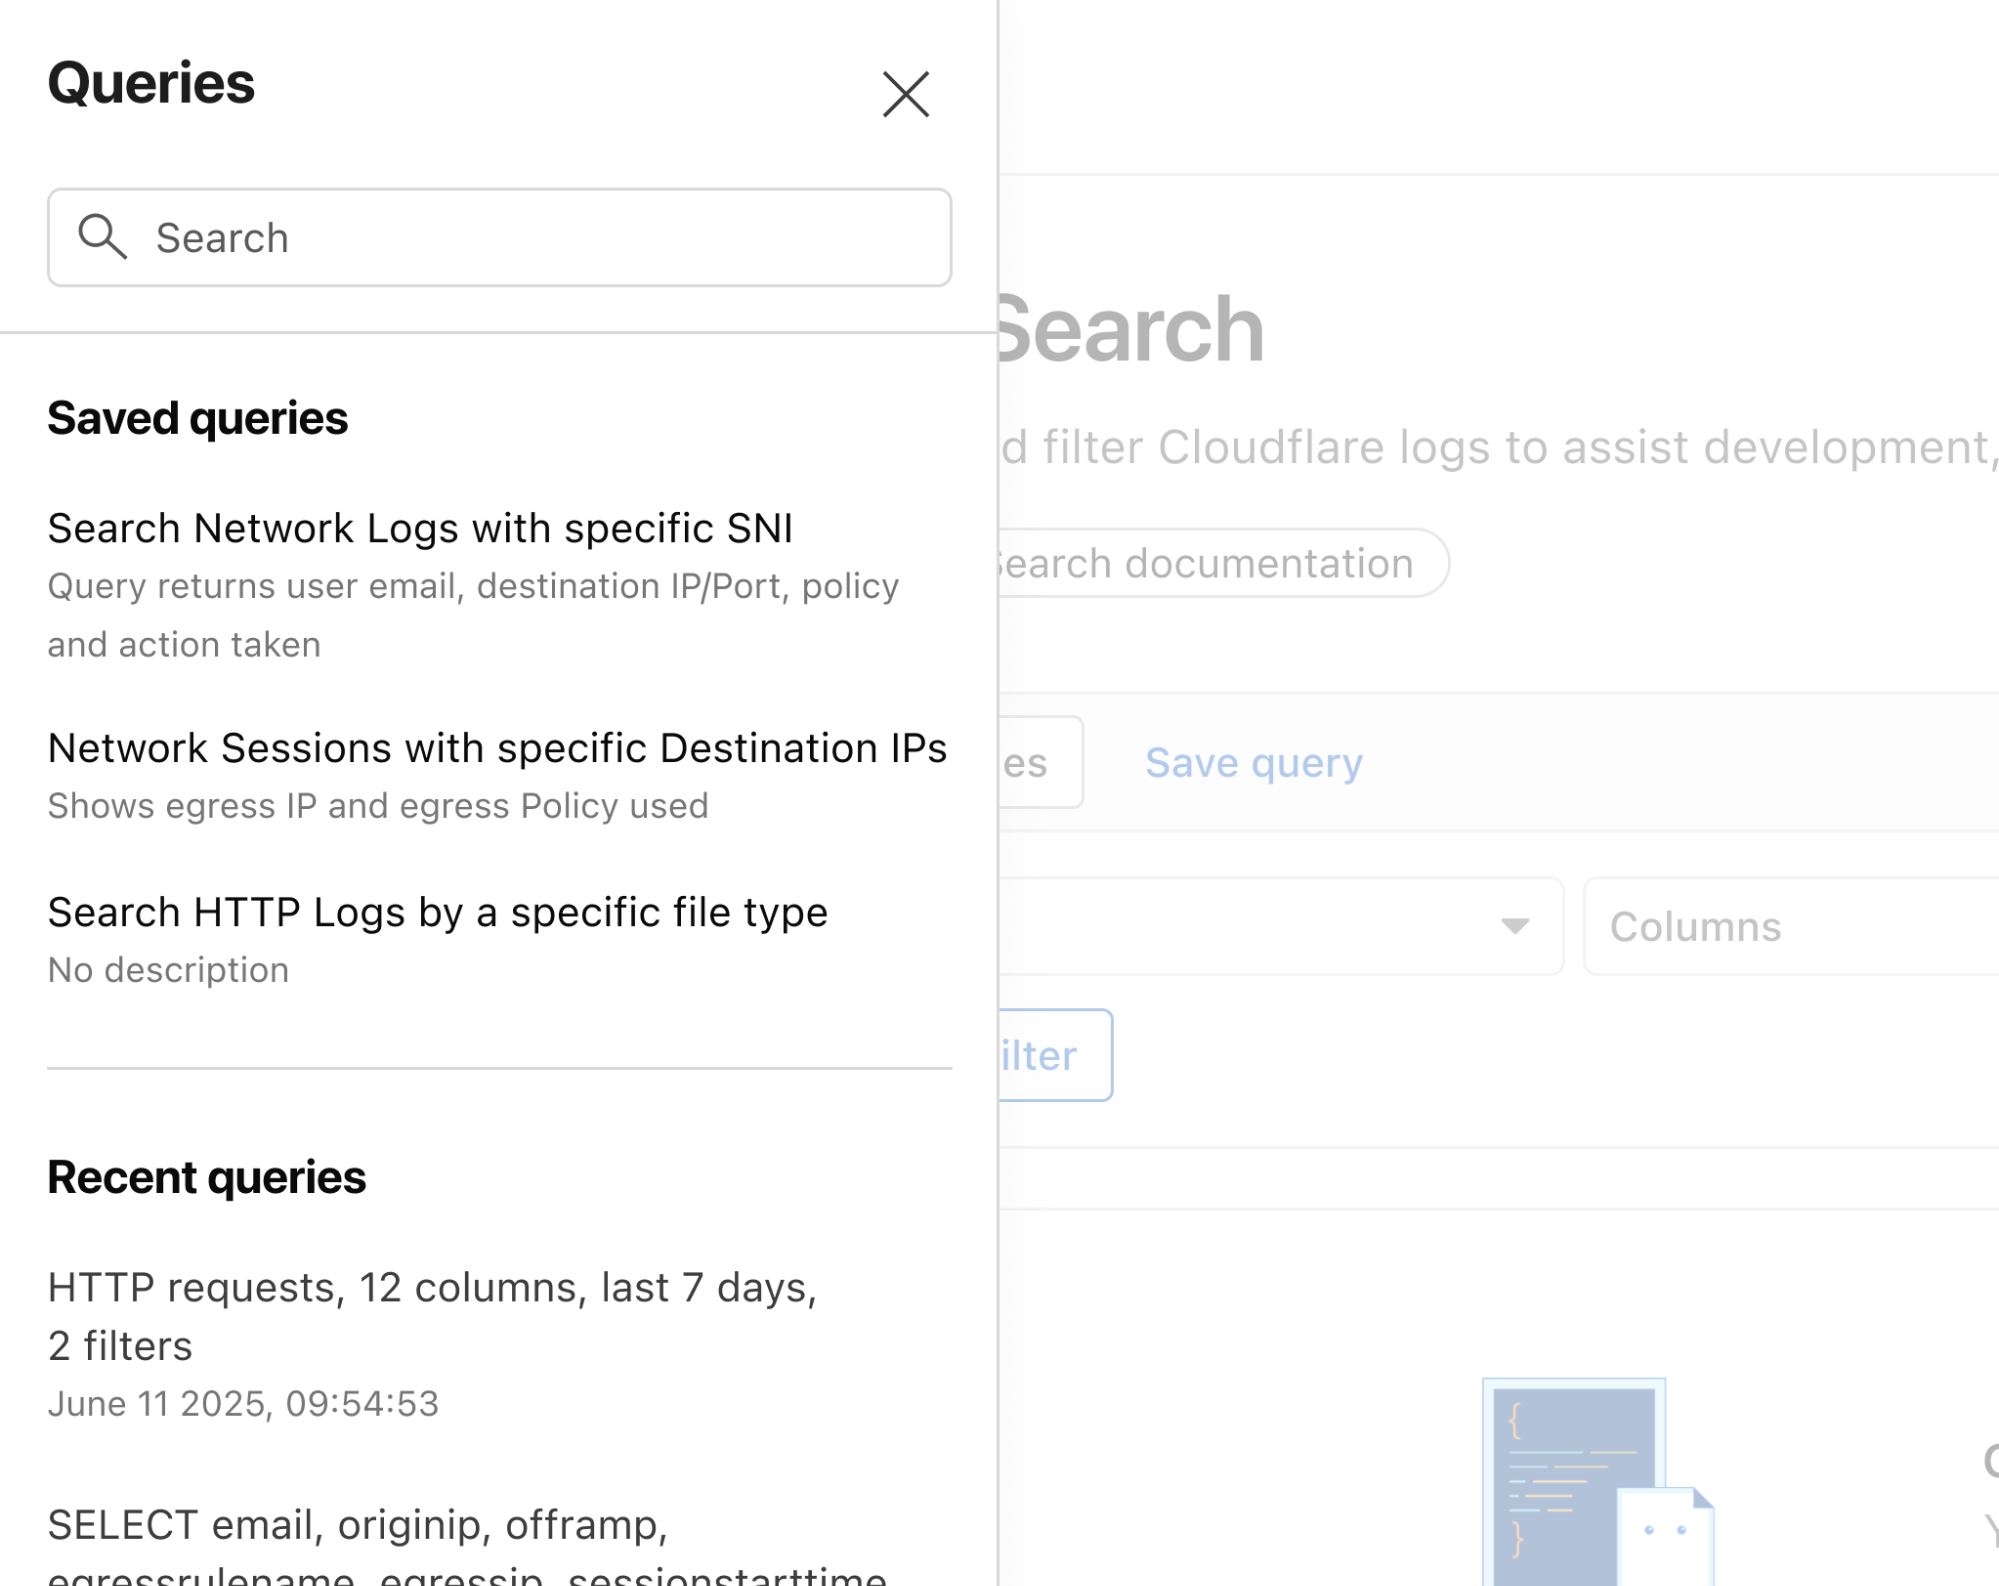
Queries built in Log Search can now be saved for repeated use and are accessible to other Log Explorer users in your account. This makes it easier than ever to investigate issues together.
Monitor proactively with Custom Alerting (coming soon)
With custom alerting, you can configure custom alert policies in order to proactively monitor the indicators that are important to your business.
Starting from Log Search, define and test your query. From here you can opt to save and configure a schedule interval and alerting policy. The query will run automatically on the schedule you define.
Tracking error rate for a custom hostname
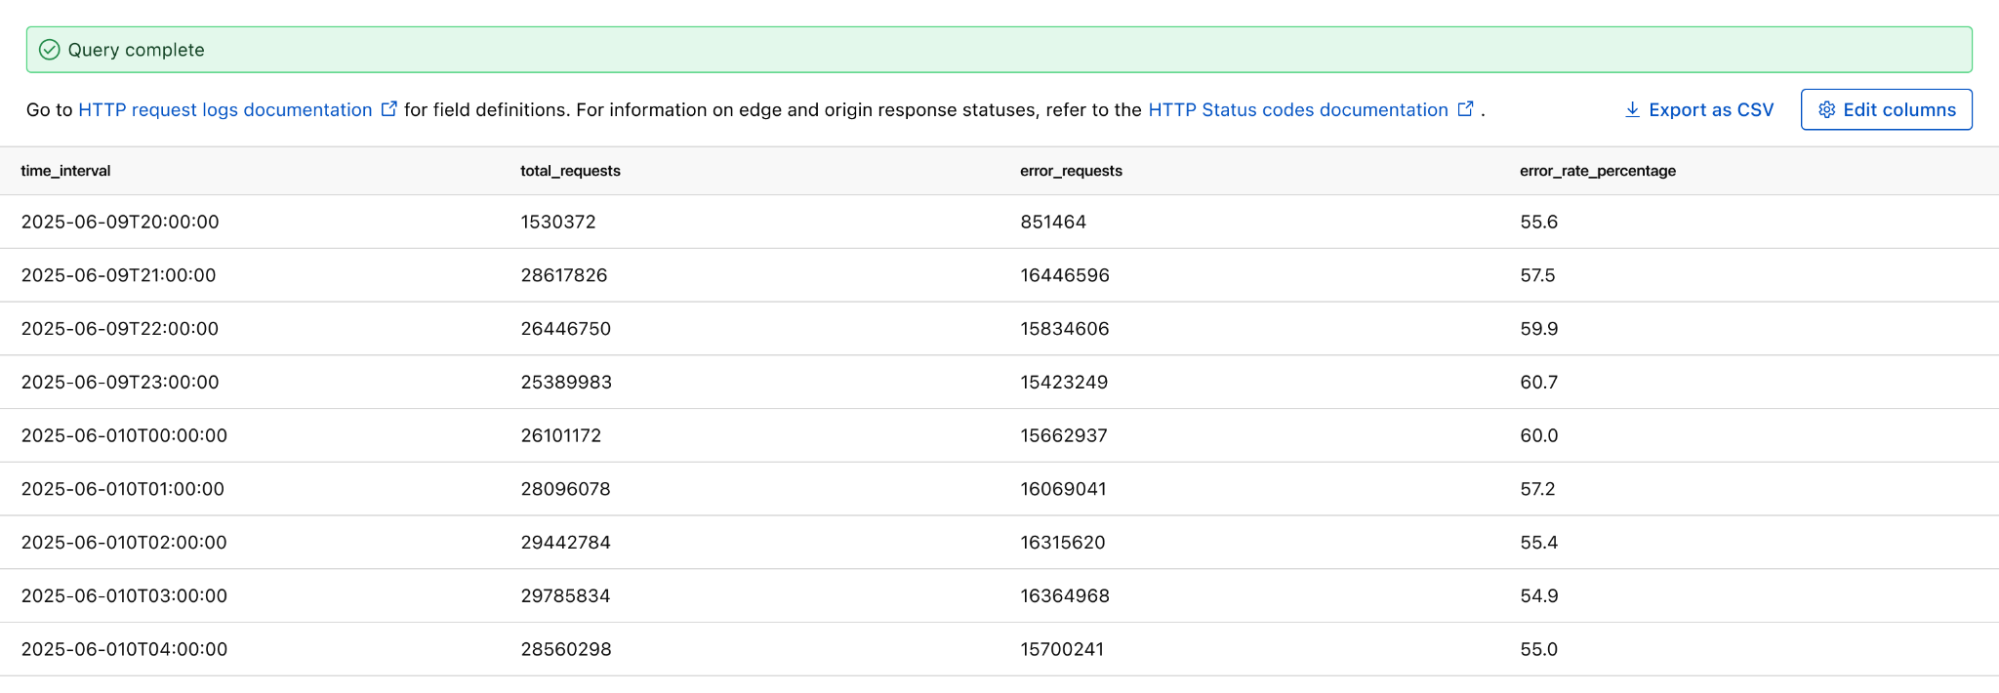
If you want to monitor the error rate for a particular host, you can use this Log Search query to calculate the error rate per time interval:
SELECT SUBSTRING(EdgeStartTimeStamp, 1, 14) || '00:00' AS time_interval,
       COUNT() AS total_requests,
       COUNT(CASE WHEN EdgeResponseStatus >= 500 THEN 1 ELSE NULL END) AS error_requests,
       COUNT(CASE WHEN EdgeResponseStatus >= 500 THEN 1 ELSE NULL END) * 100.0 / COUNT() AS error_rate_percentage
 FROM http_requests
WHERE EdgeStartTimestamp >= '2025-06-09T20:56:58Z'
  AND EdgeStartTimestamp <= '2025-06-10T21:26:58Z'
  AND ClientRequestHost = 'customhostname.com'
GROUP BY time_interval
ORDER BY time_interval ASC;
Running the above query returns the following results. You can see the overall error rate percentage in the far right column of the query results.
Proactively detect malware
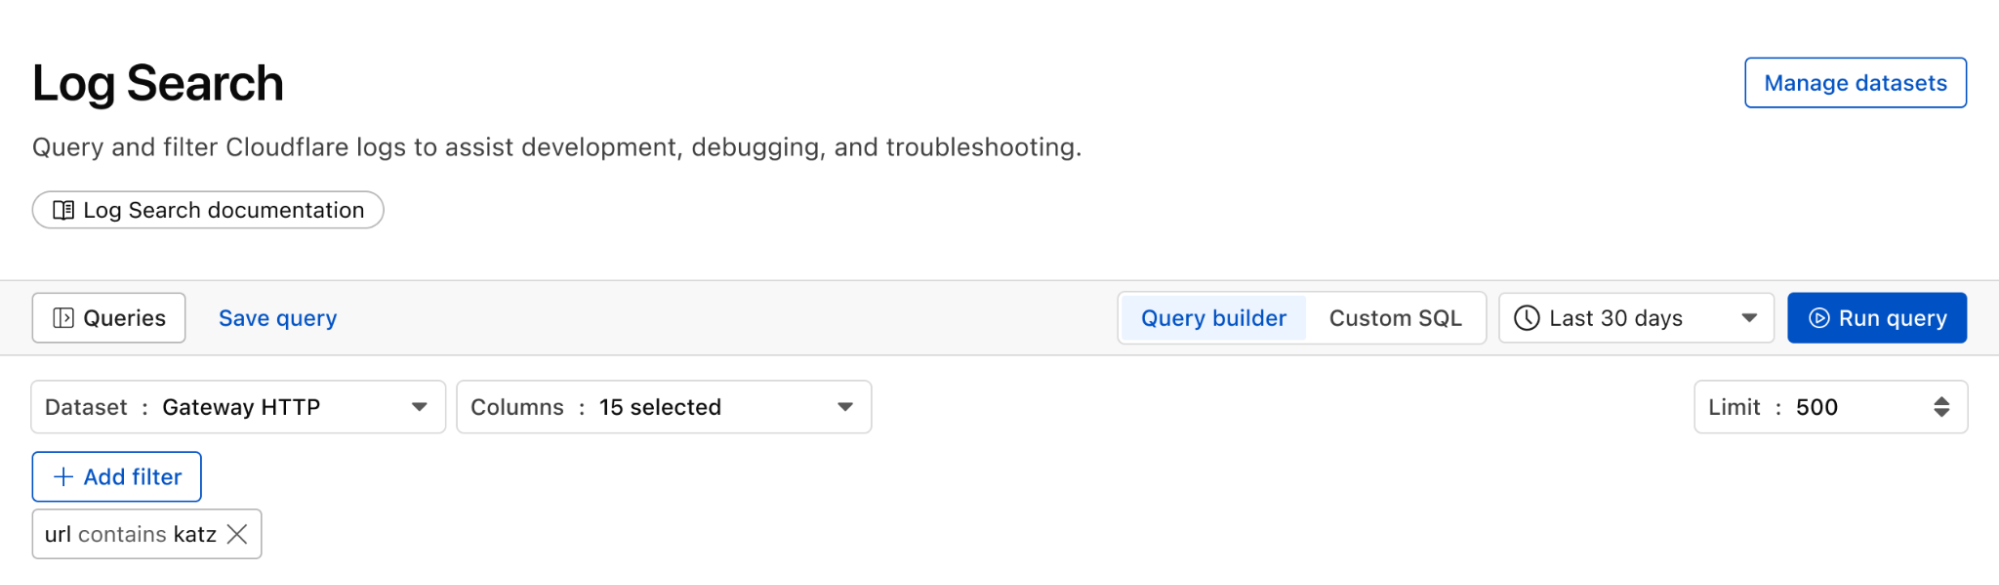
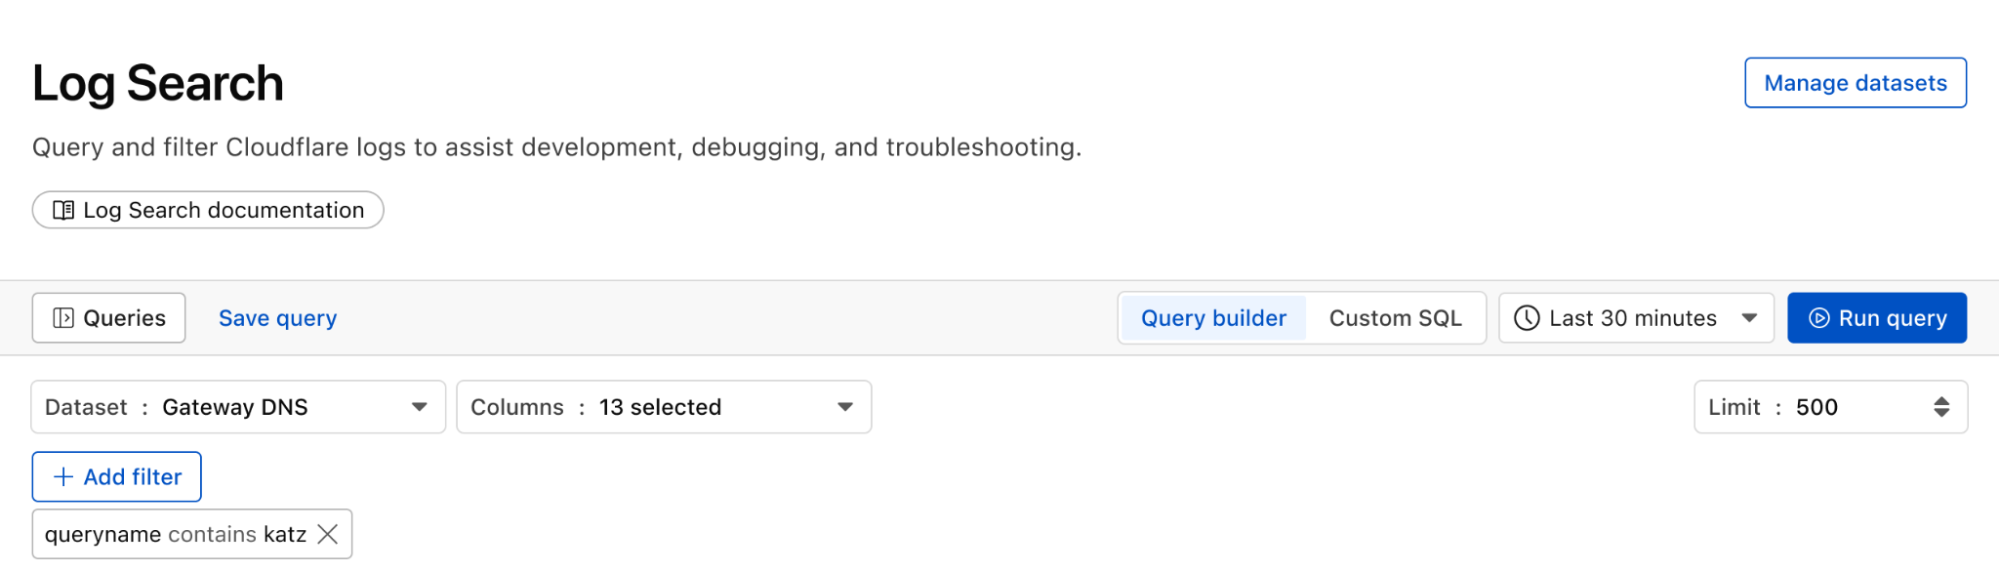
We can identify malware in the environment by monitoring logs from Cloudflare Secure Web Gateway. As an example, Katz Stealer is malware-as-a-service designed for stealing credentials. We can monitor DNS queries and HTTP requests from users within the company in order to identify any machines that may be infected with Katz Stealer malware.
And with custom alerts, you can configure an alert policy so that you can be notified via webhook or PagerDuty.
Maintain audit & compliance with flexible retention (coming soon)
With flexible retention, you can set the precise length of time you want to store your logs, allowing you to meet specific compliance and audit requirements with ease. Other providers require archiving or hot and cold storage, making it difficult to query older logs. Log Explorer is built on top of our R2 storage tier, so historical logs can be queried as easily as current logs.
How we built Log Explorer to run at Cloudflare scale
With Log Explorer, we have built a scalable log storage platform on top of Cloudflare R2 that lets you efficiently search your Cloudflare logs using familiar SQL queries. In this section, we’ll look into how we did this and how we solved some technical challenges along the way.
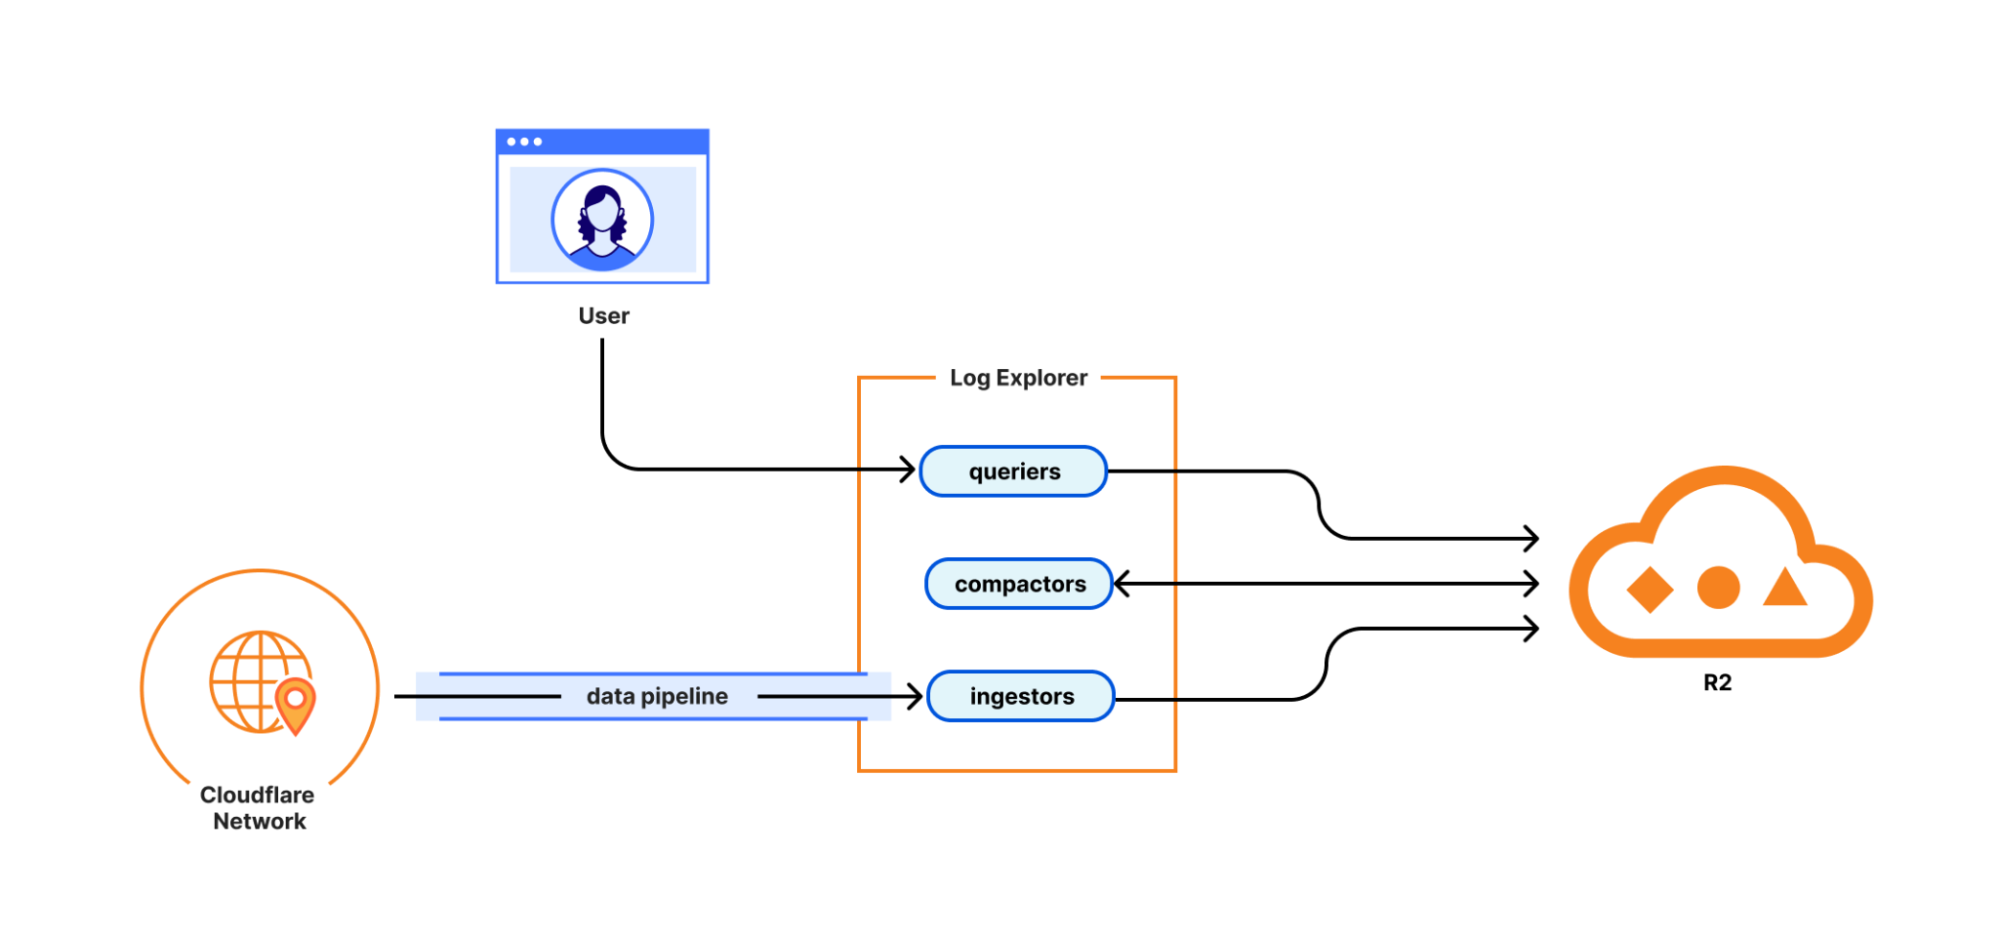
Log Explorer consists of three components: ingestors, compactors, and queriers. Ingestors are responsible for writing logs from Cloudflare’s data pipeline to R2. Compactors optimize storage files, so they can be queried more efficiently. Queriers execute SQL queries from users by fetching, transforming, and aggregating matching logs from R2.
During ingestion, Log Explorer writes each batch of log records to a Parquet file in R2. Apache Parquet is an open-source columnar storage file format, and it was an obvious choice for us: it’s optimized for efficient data storage and retrieval, such as by embedding metadata like the minimum and maximum values of each column across the file which enables the queriers to quickly locate the data needed to serve the query.
Log Explorer stores logs on a per-customer level, just like Cloudflare D1, so that your data isn’t mixed with that of other customers. In Q3 2025, per-customer logs will allow you the flexibility to create your own retention policies and decide in which regions you want to store your data.
But how does Log Explorer find those Parquet files when you query your logs? Log Explorer leverages the Delta Lake open table format to provide a database table abstraction atop R2 object storage. A table in Delta Lake pairs data files in Parquet format with a transaction log. The transaction log registers every addition, removal, or modification of a data file for the table – it’s stored right next to the data files in R2.
Given a SQL query for a particular log dataset such as HTTP Requests or Gateway DNS, Log Explorer first has to load the transaction log of the corresponding Delta table from R2. Transaction logs are checkpointed periodically to avoid having to read the entire table history every time a user queries their logs.
Besides listing Parquet files for a table, the transaction log also includes per-column min/max statistics for each Parquet file. This has the benefit that Log Explorer only needs to fetch files from R2 that can possibly satisfy a user query. Finally, queriers use the min/max statistics embedded in each Parquet file to decide which row groups to fetch from the file.
Log Explorer processes SQL queries using Apache DataFusion, a fast, extensible query engine written in Rust, and delta-rs, a community-driven Rust implementation of the Delta Lake protocol. While standing on the shoulders of giants, our team had to solve some unique problems to provide log search at Cloudflare scale.
Log Explorer ingests logs from across Cloudflare’s vast global network, spanning more than 330 cities in over 125 countries. If Log Explorer were to write logs from our servers straight to R2, its storage would quickly fragment into a myriad of small files, rendering log queries prohibitively expensive.
Log Explorer’s strategy to avoid this fragmentation is threefold. First, it leverages Cloudflare’s data pipeline, which collects and batches logs from the edge, ultimately buffering each stream of logs in an internal system named Buftee. Second, log batches ingested from Buftee aren’t immediately committed to the transaction log; rather, Log Explorer stages commits for multiple batches in an intermediate area and “squashes” these commits before they’re written to the transaction log. Third, once log batches have been committed, a process called compaction merges them into larger files in the background.
While the open-source implementation of Delta Lake provides compaction out of the box, we soon encountered an issue when using it for our workloads. Stock compaction merges data files to a desired target size S by sorting the files in reverse order of their size and greedily filling bins of size S with them. By merging logs irrespective of their timestamps, this process distributed ingested batches randomly across merged files, destroying data locality. Despite compaction, a user querying for a specific time frame would still end up fetching hundreds or thousands of files from R2.
For this reason, we wrote a custom compaction algorithm that merges ingested batches in order of their minimum log timestamp, leveraging the min/max statistics mentioned previously. This algorithm reduced the number of overlaps between merged files by two orders of magnitude. As a result, we saw a significant improvement in query performance, with some large queries that had previously taken over a minute completing in just a few seconds.
Follow along for more updates
We’re just getting started! We’re actively working on even more powerful features to further enhance your experience with Log Explorer. Subscribe to the blog and keep an eye out for more updates in our Change Log to our observability and forensics offering soon.
Get access to Log Explorer
To get access to Log Explorer, reach out for a consultation or contact your account manager. Additionally, you can read more in our Developer Documentation.
There’s a lot of talk right now about building AI agents, but not a lot out there about what it takes to make those agents truly useful.
An Agent is an autonomous system designed to make decisions and perform actions to achieve a specific goal or set of goals, without human input.
No matter how good your agent is at making decisions, you will need a person to provide guidance or input on the agent’s path towards its goal. After all, an agent that cannot interact or respond to the outside world and the systems that govern it will be limited in the problems it can solve.
That’s where the “human-in-the-loop” interaction pattern comes in. You’re bringing a human into the agent’s loop and requiring an input from that human before the agent can continue on its task.
In this blog post, we’ll useKnock and the CloudflareAgents SDK to build an AI Agent for a virtual card issuing workflow that requires human approval when a new card is requested.
Knock is messaging infrastructure you can use to send multi-channel messages across in-app, email, SMS, push, and Slack, without writing any integration code.
With Knock, you gain complete visibility into the messages being sent to your users while also handling reliable delivery, user notification preferences, and more.
You can use Knock to power human-in-the-loop flows for your agents using Knock’sAgent Toolkit, which is a set of tools that expose Knock’s APIs and messaging capabilities to your AI agents.
Using the Agent SDK as the foundation of our AI Agent
The Agents SDK provides an abstraction for building stateful, real-time agents on top of Durable Objects that are globally addressable and persist state using an embedded, zero-latency SQLite database.
Building an AI agent outside of using the Agents SDK and the Cloudflare platform means we need to consider WebSocket servers, state persistence, and how to scale our service horizontally. Because a Durable Object backs the Agents SDK, we receive these benefits for free, while having a globally addressable piece of compute with built-in storage, that’s completely serverless and scales to zero.
In the example, we’ll use these features to build an agent that users interact with in real-time via chat, and that can be paused and resumed as needed. The Agents SDK is the ideal platform for powering asynchronous agentic workflows, such as those required in human-in-the-loop interactions.
Setting up our Knock messaging workflow
Within Knock, we design our approval workflow using the visual workflow builder to create the cross-channel messaging logic. We then make the notification templates associated with each channel to which we want to send messages.
Knock will automatically apply theuser’s preferences as part of the workflow execution, ensuring that your user’s notification settings are respected.
You can find an example workflow that we’ve already created for this demo in the repository. You can use this workflow template via theKnock CLI to import it into your account.
Building our chat UI
We’ve built the AI Agent as a chat interface on top of the AIChatAgent abstraction from Cloudflare’s Agents SDK (docs). The Agents SDK here takes care of the bulk of the complexity, and we’re left to implement our LLM calling code with our system prompt.
// src/index.ts

import { AIChatAgent } from "agents/ai-chat-agent";
import { openai } from "@ai-sdk/openai";
import { createDataStreamResponse, streamText } from "ai";

export class AIAgent extends AIChatAgent {
  async onChatMessage(onFinish) {
    return createDataStreamResponse({
      execute: async (dataStream) => {
        try {
          const stream = streamText({
            model: openai("gpt-4o-mini"),
            system: `You are a helpful assistant for a financial services company. You help customers with credit card issuing.`,
            messages: this.messages,
            onFinish,
            maxSteps: 5,
          });

          stream.mergeIntoDataStream(dataStream);
        } catch (error) {
          console.error(error);
        }
      },
    });
  }
}
On the client side, we’re using the useAgentChat hook from the agents/ai-react package to power the real-time user-to-agent chat.
We’ve modeled our agent as a chat per user, which we set up using the useAgent hook by specifying the name of the process as the userId.
This means we have an agent process, and therefore a durable object, per-user. For our human-in-the-loop use case, this becomes important later on as we talk about resuming our deferred tool call.
Deferring the tool call to Knock
We give the agent our card issuing capability through exposing an issueCard tool. However, instead of writing the approval flow and cross-channel logic ourselves, we delegate it entirely to Knock by wrapping the issue card tool in our requireHumanInput method.
Now when the user asks to request a new card, we make a call out to Knock to initiate our card request, which will notify the appropriate admins in the organization to request an approval.
To set this up, we need to use Knock’s Agent Toolkit, which exposes methods to work with Knock in our AI agent and power cross-channel messaging.
import { createKnockToolkit } from "@knocklabs/agent-toolkit/ai-sdk";
import { tool } from "ai";
import { z } from "zod";

import { AIAgent } from "./index";
import { issueCard } from "./api";
import { BASE_URL } from "./constants";

async function initializeToolkit(agent: AIAgent) {
  const toolkit = await createKnockToolkit({ serviceToken: agent.env.KNOCK_SERVICE_TOKEN });

  const issueCardTool = tool({
    description: "Issue a new credit card to a customer.",
    parameters: z.object({
      customerId: z.string(),
    }),
    execute: async ({ customerId }) => {
      return await issueCard(customerId);
    },
  });

  const { issueCard } = toolkit.requireHumanInput(
    { issueCard: issueCardTool },
    {
      workflow: "approve-issued-card",
      actor: agent.name,
      recipients: ["admin_user_1"],
      metadata: {
        approve_url: `${BASE_URL}/card-issued/approve`,
        reject_url: `${BASE_URL}/card-issued/reject`,
      },
    }
  );

  return { toolkit, tools: { issueCard } };
}
There’s a lot going on here, so let’s walk through the key parts:
We wrap our issueCard tool in the requireHumanInput method, exposed from the Knock Agent Toolkit
We want the messaging workflow to be invoked to be our approve-issued-card workflow
We pass the agent.name as the actor of the request, which translates to the user ID
We set the recipient of this workflow to be the user admin_user_1
We pass the approve and reject URLs so that they can be used in our message templates
The wrapped tool is then returned as issueCard
Under the hood, these options are passed to theKnock workflow trigger API to invoke a workflow per-recipient. The set of the recipients listed here could be dynamic, or go to a group of users throughKnock’s subscriptions API.
We can then pass the wrapped issue card tool to our LLM call in the onChatMessage method on the agent so that the tool call can be called as part of the interaction with the agent.
export class AIAgent extends AIChatAgent {
  // ... other methods

  async onChatMessage(onFinish) {
    const { tools } = await initializeToolkit(this);

    return createDataStreamResponse({
      execute: async (dataStream) => {
        const stream = streamText({
          model: openai("gpt-4o-mini"),
          system: "You are a helpful assistant for a financial services company. You help customers with credit card issuing.",
          messages: this.messages,
          onFinish,
          tools,
          maxSteps: 5,
        });

        stream.mergeIntoDataStream(dataStream);
      },
    });
  }
}
Now when the agent calls the issueCardTool, we invoke Knock to send our approval notifications, deferring the tool call to issue the card until we receive an approval. Knock’s workflows take care of sending out the message to the set of recipient’s specified, generating and delivering messages according to each user’s preferences.
Using Knockworkflows for our approval message makes it easy to build cross-channel messaging to reach the user according to their communicationpreferences. We can also leveragedelays,throttles,batching, andconditions to orchestrate more complex messaging.
Handling the approval
Once the message has been sent to our approvers, the next step is to handle the approval coming back, bringing the human into the agent’s loop.
The approval request is asynchronous, meaning that the response can come at any point in the future. Fortunately, Knock takes care of the heavy lifting here for you, routing the event to the agent worker via awebhook that tracks the interaction with the underlying message. In our case, that’s a click to the “approve” or “reject” button.
First, we set up a message.interacted webhook handler within the Knock dashboard to forward the interactions to our worker, and ultimately to our agent process.
In our example here, we route the approval click back to the worker to handle, appending a Knock message ID to the end of the approve_url and reject_url to track engagement against the specific message sent. We do this via liquid inside of our message templates in Knock: {{ data.approve_url }}?messageId={{ current_message.id }} . One caveat here is that if this were a production application, we’re likely going to handle our approval click in a different application than this agent is running. We co-located it here for the purposes of this demo only.
Once the link is clicked, we have a handler in our worker to mark the message as interacted using Knock’smessage interaction API, passing through the status as metadata so that it can be used later.
import Knock from '@knocklabs/node';
import { Hono } from "hono";

const app = new Hono();
const client = new Knock();

app.get("/card-issued/approve", async (c) => {
  const { messageId } = c.req.query();

  if (!messageId) return c.text("No message ID found", { status: 400 });

  await client.messages.markAsInteracted(messageId, {
    status: "approved",
  });

  return c.text("Approved");
});
The message interaction will flow from Knock to our worker via the webhook we set up, ensuring that the process is fully asynchronous. The payload of the webhook includes the full message, including metadata about the user that generated the original request, and keeps details about the request itself, which in our case contains the tool call.
import { getAgentByName, routeAgentRequest } from "agents";
import { Hono } from "hono";

const app = new Hono();

app.post("/incoming/knock/webhook", async (c) => {
  const body = await c.req.json();
  const env = c.env as Env;

  // Find the user ID from the tool call for the calling user
  const userId = body?.data?.actors[0];

  if (!userId) {
    return c.text("No user ID found", { status: 400 });
  }

  // Find the agent DO for the user
  const existingAgent = await getAgentByName(env.AIAgent, userId);

  if (existingAgent) {
    // Route the request to the agent DO to process
    const result = await existingAgent.handleIncomingWebhook(body);

    return c.json(result);
  } else {
    return c.text("Not found", { status: 404 });
  }
});
We leverage the agent’s ability to be addressed by a named identifier to route the request from the worker to the agent. In our case, that’s the userId. Because the agent is backed by a durable object, this process of going from incoming worker request to finding and resuming the agent is trivial.
Resuming the deferred tool call
We then use the context about the original tool call, passed through to Knock and round tripped back to the agent, to resume the tool execution and issue the card.
export class AIAgent extends AIChatAgent {
  // ... other methods

  async handleIncomingWebhook(body: any) {
    const { toolkit } = await initializeToolkit(this);

    const deferredToolCall = toolkit.handleMessageInteraction(body);

    if (!deferredToolCall) {
      return { error: "No deferred tool call given" };
    }

    // If we received an "approved" status then we know the call was approved
    // so we can resume the deferred tool call execution
    if (result.interaction.status === "approved") {
      const toolCallResult =
	      await toolkit.resumeToolExecution(result.toolCall);

      const { response } = await generateText({
        model: openai("gpt-4o-mini"),
        prompt: `You were asked to issue a card for a customer. The card is now approved. The result was: ${JSON.stringify(toolCallResult)}.`,
      });

      const message = responseToAssistantMessage(
        response.messages[0],
        result.toolCall,
        toolCallResult
      );

      // Save the message so that it's displayed to the user
      this.persistMessages([...this.messages, message]);
    }

    return { status: "success" };
  }
}
Again, there’s a lot going on here, so let’s step through the important parts:
We attempt to transform the body, which is the webhook payload from Knock, into a deferred tool call via the handleMessageInteraction method
If the metadata status we passed through to the interaction call earlier has an “approved” status then we resume the tool call via the resumeToolExecution method
Finally, we generate a message from the LLM and persist it, ensuring that the user is informed of the approved card
With this last piece in place, we can now request a new card be issued, have an approval request be dispatched from the agent, send the approval messages, and route those approvals back to our agent to be processed. The agent will asynchronously process our card issue request and the deferred tool call will be resumed for us, with very little code.
Protecting against duplicate approvals
One issue with the above implementation is that we’re prone to issuing multiple cards if someone clicks on the approve button more than once. To rectify this, we want to keep track of the tool calls being issued, and ensure that the call is processed at most once.
To power this we leverage theagent’s built-in state, which can be used to persist information without reaching for another persistence store like a database or Redis, although we could absolutely do so if we wished. We can track the tool calls by their ID and capture their current status, right inside the agent process.
Here, we create the initial state for the tool calls as an empty object. We also add a quick setter helper method to make interactions easier.
Next up, we need to record the tool call being made. To do so, we can use the onAfterCallKnock option in the requireHumanInput helper to capture that the tool call has been requested for the user.
const { issueCard }  = toolkit.requireHumanInput(
  { issueCard: issueCardTool },
  {
    // Keep track of the tool call state once it's been sent to Knock
    onAfterCallKnock: async (toolCall) =>
      agent.setToolCallStatus(toolCall.id, "requested"),
    // ... as before
  }
);
Finally, we then need to check the state when we’re processing the incoming webhook, and mark the tool call as approved (some code omitted for brevity).
export class AIAgent extends AIChatAgent {
  async handleIncomingWebhook(body: any) {
    const { toolkit } = await initializeToolkit(this);
    const deferredToolCall = toolkit.handleMessageInteraction(body);
    const toolCallId = result.toolCall.id;

    // Make sure this is a tool call that can be processed
    if (this.state.toolCalls[toolCallId] !== "requested") {
      return { error: "Tool call is not requested" };
    }

    if (result.interaction.status === "approved") {
      const toolCallResult = await toolkit.resumeToolExecution(result.toolCall);
      this.setToolCallStatus(toolCallId, "approved");
      // ... rest as before
    }
  }
}
Conclusion
Using the Agents SDK and Knock, it’s easy to build advanced human-in-the-loop experiences that defer tool calls.
Knock’s workflow builder and notification engine gives you building blocks to create sophisticated cross-channel messaging for your agents. You can easily create escalation flows that send messages through SMS, push, email, or Slack that respect the notification preferences of your users. Knock also gives you complete visibility into the messages your users are receiving.
The Durable Object abstraction underneath the Agents SDK means that we get a globally addressable agent process that’s easy to yield and resume back to. The persistent storage in the Durable Object means we can retain the complete chat history per-user, and any other state that’s required in the agent process to resume the agent with (like our tool calls). Finally, the serverless nature of the underlying Durable Object means we’re able to horizontally scale to support a large number of users with no effort.
If you’re looking to build your own AI Agent chat experience with a multiplayer human-in-the-loop experience, you’ll find the complete code from this guideavailable in GitHub.
Quickly identify any security misconfigurations for SaaS applications to safeguard applications, users, and data
… all through a natural language interface!
Today, we also announced our collaboration with Anthropic to bring remote MCP to Claude users, and showcased how other leading companies such as Atlassian, PayPal, Sentry, and Webflow have built remote MCP servers on Cloudflare to extend their service to their users. We’ve also been using the same infrastructure and tooling to build out our own suite of remote servers, and today we’re excited to show customers what’s ready for use and share what we’ve learned along the way.
Cloudflare’s MCP servers available today:
These MCP servers allow your MCP Client to read configurations from your account, process information, make suggestions based on data, and even make those suggested changes for you. All of these actions can happen across Cloudflare’s many services including application development, security, and performance.
Cloudflare Documentation Server: Get up to date reference information on Cloudflare
Our Cloudflare Documentation server enables any MCP Client to access up-to-date documentation in real-time, rather than relying on potentially outdated information from the model’s training data. If you’re new to building with Cloudflare, this server synthesizes information right from our documentation and exposes it to your MCP Client, so you can get reliable, up-to-date responses to any complex question like “Search Cloudflare for the best way to build an AI Agent”.
Workers Bindings server: Build with developer resources
Connecting to the Bindings MCP server lets you leverage application development primitives like D1 databases, R2 object storage and Key Value stores on the fly as you build out a Workers application. If you’re leveraging your MCP Client to generate code, the bindings server provides access to read existing resources from your account or create fresh resources to implement in your application. In combination with our base prompt designed to help you build robust Workers applications, you can add the Bindings MCP server to give your client all it needs to start generating full stack applications from natural language.
Full example output using the Workers Bindings MCP server can be found here.
Workers Observability server: Debug your application
The Workers Observability MCP server integrates with Workers Logs to browse invocation logs and errors, compute statistics across invocations, and find specific invocations matching specific criteria. By querying logs across all of your Workers, this MCP server can help isolate errors and trends quickly. The telemetry data that the MCP server returns can also be used to create new visualizations and improve observability.
Container server: Spin up a development environment
The Container MCP server provides any MCP client with access to a secure, isolated execution environment running on Cloudflare’s network where it can run and test code if your MCP client does not have a built in development environment (e.g. claude.ai). When building and generating application code, this lets the AI run its own commands and validate its assumptions in real time.
Browser Rendering server: Fetch and convert web pages, take screenshots
The Browser Rendering MCP server provides AI friendly tools from our RESTful interface for common browser actions such as capturing screenshots, extracting HTML content, and converting pages to Markdown. These are particularly useful when building agents that require interacting with a web browser.
Radar server: Ask questions about how we see the Internet and Scan URLs
Logpush server: Get quick summaries for Logpush job health
Logpush jobs deliver comprehensive logs to your destination of choice, allowing near real-time information processing. The Logpush MCP server can help you analyze your Logpush job results and understand your job health at a high level, allowing you to filter and narrow down for jobs or scenarios you care about. For example, you can ask “provide me with a list of recently failed jobs.” Now, you can quickly find out which jobs are failing with which error message and when, summarized in a human-readable format.
AI Gateway server: Check out your AI Gateway logs
Use this MCP server to inspect your AI Gateway logs and get details about the data from your prompts and the AI models responses. In this example we ask our agent “What is my average latency for my AI Gateway logs in the Cloudflare Radar account?”
AutoRAG server: List and search documents on your AutoRAGs
Having AutoRAG RAGs available to query as MCP tools greatly expands the typical static one-shot retrieval and opens doors to use cases where the agent can dynamically decide if and when to retrieve information from one or more RAGs, combine them with other tools and APIs, cross-check information and generate a much more rich and complete final answer.
Here we have a RAG that has a few blog posts that talk about retrocomputers. If we ask “tell me about restoring an amiga 1000 using the blog-celso autorag” the agent will go into a sequence of reasoning steps:
“Now that I have some information about Amiga 1000 restoration from blog-celso, let me search for more specific details.”
“Let me get more specific information about hardware upgrades and fixes for the Amiga 1000.”
“Let me get more information about the DiagROM and other tools used in the restoration.”
“Let me search for information about GBA1000 and other expansions mentioned in the blog.”
And finally, “Based on the comprehensive information I’ve gathered from the blog-celso AutoRAG, I can now provide you with a detailed guide on restoring an Amiga 1000.”
And at the end, it generates a very detailed answer based on all of the data from all of the queries:
Audit Logs server: Query audit logs and generate reports for review
Audit Logs record detailed information about actions and events within a system, providing a transparent history of all activity. However, because these logs can be large and complex, it may take effort to query and reconstruct a clear sequence of events. The Audit Logs MCP server helps by allowing you to query audit logs and generate reports. Common queries include if anything notable happened in a Cloudflare account under a user around a particular time of the day, or identifying whether any users used API keys to perform actions on the account. For example, you can ask “Were there any suspicious changes made to my Cloudflare account yesterday around lunch time?” and obtain the following response:
DNS Analytics server: Optimize DNS performance and debug issues based on current set up
Cloudflare’s DNS Analytics provides detailed insights into DNS traffic, which helps you monitor, analyze, and troubleshoot DNS performance and security across your domains. With Cloudflare’s DNS Analytics MCP server, you can review DNS configurations across all domains in your account, access comprehensive DNS performance reports, and receive recommendations for performance improvements. By leveraging documentation, the MCP server can help identify opportunities for improving performance.
Digital Experience Monitoring server: Get quick insight on critical applications for your organization
Cloudflare Digital Experience Monitoring (DEM) was built to help network professionals understand the performance and availability of their critical applications from self-hosted applications like Jira and Bitbucket to SaaS applications like Figma or Salesforce. The Digital Experience Monitoring MCP server fetches DEM test results to surface performance and availability trends within your Cloudflare One deployment, providing quick insights on users, applications, and the networks they are connected to. You can ask questions like: Which users had the worst experience? What times of the day were applications most and least performant? When do I see the most HTTP status errors? When do I see the shortest, longest, or most instability in the network path?
CASB server: Insights from SaaS Integrations
Cloudflare CASB provides the ability to integrate with your organization’s SaaS and cloud applications to discover assets and surface any security misconfigurations that may be present. A core task is helping security teams understand information about users, files, and other assets they care about that transcends any one SaaS application. The CASB MCP server can explore across users, files, and the many other asset categories to help understand relationships from data that can exist across many different integrations. A common query may include “Tell me about “Frank Meszaros” and what SaaS tools they appear to have accessed”.
Get started with our MCP servers
You can start using our Cloudflare MCP servers today! If you’d like to read more about specific tools available in each server, you can find them in our public GitHub repository. Each server is deployed to a server URL, such as
https://observability.mcp.cloudflare.com/sse.
If your MCP client has first class support for remote MCP servers, the client will provide a way to accept the server URL directly within its interface. For example, if you are using claude.ai, you can:
Navigate to your settings and add a new “Integration” by entering the URL of your MCP server
Authenticate with Cloudflare
Select the tools you’d like claude.ai to be able to call
If your client does not yet support remote MCP servers, you will need to set up its respective configuration file (mcp_config.json) using mcp-remote to specify which servers your client can access.
While we’re launching with these initial 13 MCP servers, we are just getting started! We want to hear your feedback as we shape existing and build out more Cloudflare MCP servers that unlock the most value for your teams leveraging AI in their daily workflows. If you’d like to provide feedback, request a new MCP server, or report bugs, please raise an issue on our GitHub repository.
Building your own MCP server?
If you’re interested in building your own servers, we’ve discovered valuable best practices that we’re excited to share with you as we’ve been building ours. While MCP is really starting to gain momentum and many organizations are just beginning to build their own servers, these principals should help guide you as you start building out MCP servers for your customers.
An MCP server is not our entire API schema: Our goal isn’t to build a large wrapper around all of Cloudflare’s API schema, but instead focus on optimizing for specific jobs to be done and reliability of the outcome. This means while one tool from our MCP server may map to one API, another tool may map to many. We’ve found that fewer but more powerful tools may be better for the agent with smaller context windows, less costs, a faster output, and likely more valid answers from LLMs. Our MCP servers were created directly by the product teams who are responsible for each of these areas of Cloudflare – application development, security and performance – and are designed with user stories in mind. This is a pattern you will continue to see us use as we build out more Cloudflare servers.
Specialize permissions with multiple servers: We built out several specialized servers rather than one for a critical reason: security through precise permission scoping. Each MCP server operates with exactly the permissions needed for its specific task – nothing more. By separating capabilities across multiple servers, each with its own authentication scope, we prevent the common security pitfall of over-privileged access.
Add robust server descriptions within parameters: Tool descriptions were core to providing helpful context to the agent. We’ve found that more detailed descriptions help the agent understand not just the expected data type, but also the parameter’s purpose, acceptable value ranges, and impact on server behavior. This context allows agents to make intelligent decisions about parameter values rather than providing arbitrary and potentially problematic inputs, allowing your natural language to go further with the agent.
Using evals at each iteration: For each server, we implemented evaluation tests or “evals” to assess the model’s ability to follow instructions, select appropriate tools, and provide correct arguments to those tools. This gave us a programmatic way to understand if any regressions occurred through each iteration, especially when tweaking tool descriptions.
Ready to start building? Click the button below to deploy your first remote MCP server to production:
Or check out our documentation to learn more! If you have any questions or feedback for us, you can reach us via email at [email protected] or join the chatter in the Cloudflare Developers Discord.
Today, we’re excited to collaborate with Anthropic, Asana, Atlassian, Block, Intercom, Linear, PayPal, Sentry, Stripe, and Webflow to bring a whole new set of remote MCP servers, all built on Cloudflare, to enable Claude users to manage projects, generate invoices, query databases, and even deploy full stack applications — without ever leaving the chat interface.
Since Anthropic’s introduction of the Model Context Protocol (MCP) in November, there’s been more and more excitement about it, and it seems like a new MCP server is being released nearly every day. And for good reason! MCP has been the missing piece to make AI agents a reality, and helped define how AI agents interact with tools to take actions and get additional context.
But to date, end-users have had to install MCP servers on their local machine to use them. Today, with Anthropic’s announcement of Integrations, you can access an MCP server the same way you would a website: type a URL and go.
At Cloudflare, we’ve been focused on building out the tooling that simplifies the development of remote MCP servers, so that our customers’ engineering teams can focus their time on building out the MCP tools for their application, rather than managing the complexities of the protocol. And if you’re wondering just how easy is it to deploy a remote MCP server on Cloudflare, we’re happy to tell you that it only takes one click to get an MCP server — pre-built with support for the latest MCP standards — deployed.
But you don’t have to take our word for it, see it for yourself! Industry leaders are taking advantage of the ease of use to deliver new AI-powered experiences to their users by building their MCP servers on Cloudflare and now, you can do the same — just click “Deploy to Cloudflare” to get started.
Keep reading to learn more about the new capabilities that these companies are unlocking for their users and how they were able to deliver them. Or, see it in action by joining us for Demo Day on May 1 (today) at 10:00 AM PST.
We’re also making Cloudflare’s remote MCP servers available to customers today and sharing what we learned from building them out.
MCP: Powering the next generation of applications
It wasn’t always the expectation that every service, whether a store, real estate agent, or service would have a website. But as more people gained access to an Internet connection, that quickly became the case.
We’re in the midst of a similar transition now to every web user having access to AI tools, turning to them for many tasks. If you’re a developer, it’s likely the case that the first place you turn when you go to write code now is to a tool like Claude. It seems reasonable then, that if Claude helped you write the code, it would also help you deploy it.
Or if you’re not a developer, if Claude helped you come up with a recipe, that it would also help you order the required groceries.
With remote MCP, all of these scenarios are now possible. And just like the first businesses built on the web had a first mover advantage, the first businesses to be built in an MCP-forward way are likely to reap the benefits.
The faster a user can experience the value of your product, the more likely they will be to succeed, upgrade, and continue to use your product. By connecting services to agents through MCP, users can simply ask for what they need and the agent will handle the rest, getting them to that “aha” moment faster.
Making your service AI-first with MCP
Businesses that adopt MCP will quickly see the impact:
Lower the barrier to entry
Not every user has the time to learn your dashboard or read through documentation to understand your product. With MCP, they don’t need to. They just describe what they want, and the agent figures out the rest.
Create personalized experiences
MCP can keep track of a user’s requests and interactions, so future tool calls can be adapted to their usage patterns and preferences. This makes it easy to deliver more personalized, relevant experiences based on how each person actually uses your product.
Drive upgrades naturally
Rather than relying on feature comparison tables, the AI agent can explain how a higher-tier plan helps a specific user accomplish their goals.
Ship new features and integrations
You don’t need to build every integration or experience in-house. By exposing your tools via MCP, you let users connect your product to the rest of their stack. Agents can combine tools across providers, enabling integrations without requiring you to support every third-party service directly.
We’re continuing to ship updates regularly — adding support for the latest changes to the MCP standard and making it even easier to get your server to production:
Supporting the new Streamable HTTP transport: Your MCP servers can now use the latest Streamable HTTP transport alongside SSE, ensuring compatibility with the latest standards. We’ve updated the AI Playground and mcp-remote proxy as well, giving you a remote MCP client to easily test the new transport.
Python support for MCP servers: You can now build MCP servers on Cloudflare using Python, not just JavaScript/TypeScript.
Improved docs, starter templates, and deploy flows: We’ve added new quickstart templates, expanded our documentation to cover the new transport method, and shared best practices for building MCP servers based on our learnings.
But rather than telling you, we thought it would be better to show you what our customers have built and why they chose Cloudflare for their MCP deployment.
Remote MCP servers you can connect to today
Asana
Today, work lives across many different apps and services. By investing in MCP, Asana can meet users where they are, enabling agent-driven interoperability across tools and workflows. Users can interact with the Asana Work Graph using natural language to get project updates, search for tasks, manage projects, send comments, and update deadlines from an MCP client.
Users will be able to orchestrate and integrate different pieces of work seamlessly — for example, turning a project plan or meeting notes from another app into a fully assigned set of tasks in Asana, or pulling Asana tasks directly into an MCP-enabled IDE for implementation. This flexibility makes managing work across systems easier, faster, and more natural than ever before.
To accelerate the launch of our first-party MCP server, Asana built on Cloudflare’s tooling, taking advantage of the foundational infrastructure to move quickly and reliably in this fast-evolving space.
“At Asana, we’ve always focused on helping teams coordinate work effortlessly. MCP connects our Work Graph directly to AI tools like Claude.ai, enabling AI to become a true teammate in work management. Our integration transforms natural language into structured work – creating projects from meeting notes or pulling updates into AI. Building on Cloudflare’s infrastructure allowed us to deploy quickly, handling authentication and scaling while we focused on creating the best experience for our users.” – Prashant Pandey, Chief Technology Officer, Asana
Jira and Confluence Cloud customers can now securely interact with their data directly from Anthropic’s Claude app via the Atlassian Remote MCP Server in beta. Hosted on Cloudflare infrastructure, users can summarize work, create issues or pages, and perform multi-step actions, all while keeping data secure and within permissioned boundaries.
Users can access information from Jira and Confluence wherever they use Claude to:
Summarize Jira work items or Confluence pages
Create Jira work items or Confluence pages directly from Claude
Get the model to take multiple actions in one go, like creating issues or pages in bulk
Enrich Jira work items with context from many different sources to which Claude has access
And so much more!
“AI is not one-size-fits-all and we believe that it needs to be embedded within a team’s jobs to be done. That’s why we’re so excited to invest in MCP and meet teams in more places where they already work. Hosting on Cloudflare infrastructure means we can bring this powerful integration to our customers faster and empower them to do more than ever with Jira and Confluence, all while keeping their enterprise data secure. Cloudflare provided everything from OAuth to out-of-the-box remote MCP support so we could quickly build, secure, and scale a fully operational setup.” — Taroon Mandhana, Head of Product Engineering, Atlassian
At Intercom, the transformative power of AI is becoming increasingly clear. Fin, Intercom’s AI Agent, is now autonomously resolving over 50% of customer support conversations for leading companies such as Anthropic. With MCP, connecting AI to internal tools and systems is easier than ever, enabling greater business value.
Customer conversations, for instance, offer valuable insights into how products are being used and the experiences customers are having. However, this data is often locked within the support platform. The Intercom MCP server unlocks this rich source of customer data, making it accessible to anyone in the organization using AI tools. Engineers, for example, can leverage conversation history and user data from Intercom in tools like Cursor or Claude Code to diagnose and resolve issues more efficiently.
“The momentum behind MCP is exciting. It’s making it easier and easier to connect assistants like Claude.ai and agents like Fin to your systems and get real work done. Cloudflare’s toolkit is accelerating that movement even faster. Their clear documentation, purpose-built tools, and developer-first platform helped Intercom go from concept to production in under a day, making the Intercom MCP server launch effortless. We’ll be encouraging our customers to leverage Cloudflare to build and deploy their own MCP servers to securely and reliably connect their internal systems to Fin and other clients.” — Jordan Neill, SVP Engineering, Intercom
Linear
The Linear MCP server allows users to bring the context of their issues and product development process directly into AI assistants when it’s needed. Whether that is refining a product spec in Claude, collaborating on fixing a bug with Cursor, or creating issues on the fly from an email.
“We’re building on Cloudflare to take advantage of their frameworks in this fast-moving space and flexible, fast, compute at the edge. With MCP, we’re bringing Linear’s issue tracking and product development workflows directly into their AI tools of choice, eliminating context switching for teams. Our goal is simple: let developers and product teams access their work where they already are—whether refining specs in Claude, debugging in Cursor, or creating issues from conversations. This seamless integration helps our customers stay in flow and focused on building great products” — Tom Moor, Head of US Engineering, Linear
“MCPs represent a new paradigm for software development. With PayPal’s remote MCP server on Cloudflare, now developers can delegate to an agent with natural language to seamlessly integrate with PayPal’s portfolio of commerce capabilities. Whether it’s managing inventory, processing payments, tracking shipping, handling refunds, AI agents via MCP can tap into these capabilities to autonomously execute and optimize commerce workflows. This is a revolutionary development for commerce, and the best part is, developers can begin integrating with our MCP server on Cloudflare today.” – Prakhar Mehrotra, SVP of Artificial Intelligence, PayPal
With the Sentry MCP server, developers are able to query Sentry’s context right from their IDE, or an assistant like Claude, to get errors and issue information across projects or even for individual files.
Developers can also use the MCP to create projects, capture setup information, and query project and organization information – and use the information to set up their applications for Sentry. As we continue to build out the MCP further, we’ll allow teams to bring in root cause analysis and solution information from Seer, our Agent, and also look at simplifying instrumentation for sentry functionality like traces, and exception handling.
Hosting this on Cloudflare and using Remote MCP, we were able to sidestep a number of the complications of trying to run locally, like scaling or authentication. Remote MCP lets us leverage Sentry’s own OAuth configuration directly. Durable Object support also lets us maintain state within the MCP, which is important when you’re not running locally.
“Sentry’s commitment has always been to the developer, and making it easier to keep production software running stable, and that’s going to be even more true in the AI era. Developers are utilizing tools like MCP to integrate their stack with AI models and data sources. We chose to build our MCP on Cloudflare because we share a vision of making it easier for developers to ship software, and are both invested in ensuring teams can build and safely run the next generation of AI agents. Debugging the complex interactions arising from these integrations is increasingly vital, and Sentry provides the essential visibility needed to rapidly diagnose and resolve issues. MCP integrates this crucial Sentry context directly into the developer workflow, empowering teams to consistently build and deploy reliable applications.” — David Cramer, CPO and Co-Founder, Sentry
Square’s APIs are a comprehensive set of tools that help sellers take payments, create and track orders, manage inventory, organize customers, and more. Now, with a dedicated Square MCP server, sellers can enlist the help of an AI agent to build their business on Square’s entire suite of API resources and endpoints. By integrating with AI agents like Claude and codename goose, sellers can craft sophisticated, customized use cases that fully utilize Square’s capabilities, at a lower technical barrier.
“MCP is emerging as a new AI interface. In the near-future, MCP may become the default way, or in some cases the only way, people, businesses, and code discover and interact with services. With Stripe’s agent toolkit and Cloudflare’s Agent SDK, developers can now monetize their MCPs with just a few lines of code.” — Jeff Weinstein, Product Lead at Stripe
Webflow
The Webflow MCP server supports CMS management, auditing and improving SEO, content localization, site publishing, and more. This enables users to manage and improve their site directly from their AI agent.
“We see MCP as a new way to interact with Webflow that aligns well with our mission of bringing development superpowers to everyone. MCP is not just a different surface over our APIs, instead we’re thinking of it in terms of the actions it supports: publish a website, create a CMS collection, update content, and more. MCP lets us expose those actions in a way that’s discoverable, secure, and deeply contextual. It opens the door to new workflows where AI and humans can work side-by-side, without needing to cobble together solutions or handle low-level API details. Cloudflare supports this aim by offering the reliability, performance, and developer tooling we need to build modern web infrastructure. Their support for remote MCP servers is mature and well-integrated, and their approach to authentication and durability aligns with how we think about the scale and security of these offerings.” — Utkarsh Sengar, VP of Engineering, Webflow
If you’re looking to build a remote MCP server for your service, get started with our documentation, watch the tutorial below, or use the button below to get a starter remote MCP server deployed to production. Once the remote MCP server is deployed, it can be used from Claude, Cloudflare’s AI playground, or any remote MCP client.
In addition, we launched a new YouTube video walking you through building MCP servers, using two of our MCP templates.
If you have any questions or feedback for us, you can reach us via email at [email protected].
Cloudflare plays a significant role in supporting the Internet’s infrastructure. As a reverse proxy by approximately 20% of all websites, we sit directly in the request path between users and the origin, helping to improve performance, security, and reliability at scale. Beyond that, our global network powers services like delivery, Workers, and R2 — making Cloudflare not just a passive intermediary, but an active platform for delivering and hosting content across the Internet.
Since Cloudflare’s launch in 2010, we have collaborated with the National Center for Missing and Exploited Children (NCMEC), a US-based clearinghouse for reporting child sexual abuse material (CSAM), and are committed to doing what we can to support identification and removal of CSAM content.
Members of the public, customers, and trusted organizations can submit reports of abuse observed on Cloudflare’s network. A minority of these reports relate to CSAM, which are triaged with the highest priority by Cloudflare’s Trust & Safety team. We will also forward details of the report, along with relevant files (where applicable) and supplemental information to NCMEC.
The process to generate and submit reports to NCMEC involves multiple steps, dependencies, and error handling, which quickly became complex under our original queue-based architecture. In this blog post, we discuss how Cloudflare Workflows helped streamline this process and simplify the code behind it.
Life before Cloudflare Workflows
When we designed our latest NCMEC reporting system in early 2024, Cloudflare Workflows did not exist yet. We used the Workers platform Queues as a solution for managing asynchronous tasks, and structured our system around them.
Our goal was to ensure reliability, fault tolerance, and automatic retries. However, without an orchestrator, we had to manually handle state, retries, and inter-queue messaging. While Queues worked, we needed something more explicit to help debug and observe the more complex asynchronous workflows we were building on top of the messaging system that Queues gave us.
In our queue-based architecture each report would go through multiple steps:
Validate input: Ensure the report has all necessary details.
Initiate report: Call the NCMEC API to create a report.
Fetch impounded files (if applicable): Retrieve files stored in R2.
Upload files: Send files to NCMEC via API.
Finalize report: Mark the report as completed.
A diagram of our queue-based architecture
Each of these steps was handled by a separate queue, and if an error occurred, the system would retry the message several times before marking the report as failed. But errors weren’t always straightforward — for instance, if an external API call consistently failed due to bad input or returned an unexpected response shape, retries wouldn’t help. In those cases, the report could get stuck in an intermediate state, and we’d often have to manually dig through logs across different queues to figure out what went wrong.
Even more frustrating, when handling failed reports, we relied on a “Reaper” — a cron job that ran every hour to resubmit failed reports. Since a report could fail at any step, the Reaper had to deduce which queue failed and send a message to begin reprocessing. This meant:
Debugging was a nightmare: Tracing the journey of a single report meant jumping between logs for multiple queues.
Retries were unreliable: Some queues had retry logic, while others relied on the Reaper, leading to inconsistencies.
State management was painful: We had no clear way to track whether a report was halfway through the pipeline or completely lost, except by looking through the logs.
Operational overhead was high: Developers frequently had to manually inspect failed reports and resubmit them.
Queues gave us a solid foundation for moving messages around, but it wasn’t meant to handle orchestration. What we’d really done was build a bunch of loosely connected steps on top of a message bus and hoped it would all hold together. It worked, for the most part, but it was clunky, hard to reason about, and easy to break. Just understanding how a single report moved through the system meant tracing messages across multiple queues and digging through logs.
We knew we needed something better: a way to define workflows explicitly, with clear visibility into where things were and what had failed. But back then, we didn’t have a good way to do that without bringing in heavyweight tools or writing a bunch of glue code ourselves. When Cloudflare Workflows came along, it felt like the missing piece, finally giving us a simple, reliable way to orchestrate everything without duct tape.
The solution: Cloudflare Workflows
Once Cloudflare Workflows was announced, we saw an immediate opportunity to replace our queue-based architecture with a more structured, observable, and retryable system. Instead of relying on a web of multiple queues passing messages to each other, we now have a single workflow that orchestrates the entire process from start to finish. Critically, if any step failed, the Workflow could pick back up from where it left off, without having to repeat earlier processing steps, re-parsing files, or duplicating uploads.
With Cloudflare Workflows, each report follows a clear sequence of steps:
Creating the report: The system validates the incoming report and initiates it with NCMEC.
Checking for impounded files: If there are impounded files associated with the report, the workflow proceeds to file collection.
Gathering files: The system retrieves impounded files stored in R2 and prepares them for upload.
Uploading files to NCMEC: Each file is uploaded to NCMEC using their API, ensuring all relevant evidence is submitted.
Adding file metadata: Metadata about the uploaded files (hashes, timestamps, etc.) is attached to the report.
Finalizing the report: Once all files are processed, the report is finalized and marked as complete.
Here’s a simplified version of the orchestrator:
import { WorkflowEntrypoint, WorkflowEvent, WorkflowStep } from 'cloudflare:workers';


export class ReportWorkflow extends WorkflowEntrypoint<Env, ReportType> {
  async run(event: WorkflowEvent<ReportType>, step: WorkflowStep) {
    const reportToCreate: ReportType = event.payload;
    let reportId: number | undefined;


    try {
      await step.do('Create Report', async () => {
        const createdReport = await createReportStep(reportToCreate, this.env);
        reportId = createdReport?.id;
      });


      if (reportToCreate.hasImpoundedFiles) {
        await step.do('Gather Files', async () => {
          if (!reportId) throw new Error('Report ID is undefined.');
          await gatherFilesStep(reportId, this.env);
        });


        await step.do('Upload Files', async () => {
          if (!reportId) throw new Error('Report ID is undefined.');
          await uploadFilesStep(reportId, this.env);
        });


        await step.do('Add File Metadata', async () => {
          if (!reportId) throw new Error('Report ID is undefined.');
          await addFilesInfoStep(reportId, this.env);
        });
      }


      await step.do('Finalize Report', async () => {
        if (!reportId) throw new Error('Report ID is undefined.');
        await finalizeReportStep(reportId, this.env);
      });
    } catch (error) {
      console.error(error);
      throw error;
    }
  }
}
Not only can tasks be broken into discrete steps, but the Workflows dashboard gives us real-time visibility into each report processed and the status of each step in the workflow!
This allows us to easily see active and completed workflows, identify which steps failed and where, and retry failed steps or terminate workflows. These features revolutionize how we troubleshoot issues, providing us with a tool to deep dive into any issues that arise and retry steps with a click of a button.
Below are two dashboard screenshots, one of our running workflows and the second of an inspection of the success and failures of each step in the workflow. Some workflows look slower or “stuck” — that’s because failed steps are retried with exponential backoff. This helps smooth over transient issues like flaky APIs without manual intervention.
Cloudflare Workflows Dashboard for our NCMEC Workflow
Cloudflare Workflows Dashboard containing a breakout of the NCMEC Workflow Steps
Cloudflare Workflows transformed how we handle NCMEC incident reports. What was once a complex, queue-based architecture is now a structured, retryable, and observable process. Debugging is easier, error handling is more robust, and monitoring is seamless.
Deploy your own Workflows
If you’re also building larger, multi-step applications, or have an existing Workers application that has started to approach what we ended up with for our incident reporting process, then you can typically wrap that code within a Workflow with minimal changes. Workflows can read from R2, write to KV, query D1 and call other APIs just like any other Worker, but are designed to help orchestrate asynchronous, long-running tasks.
To get started with Workflows, you can head to the Workflows developer documentation and/or pull down the starter project and dive into the code immediately:
During Cloudflare’s Birthday Week in September 2024, we introduced a revamped Startup Program designed to make it easier for startups to adopt Cloudflare through a new credits system. This update focused on better aligning the program with how startups and developers actually consume Cloudflare, by providing them with clearer insight into their projected usage, especially as they approach graduation from the program.
Today, we’re excited to announce an expansion to that program: new credit tiers that better match startups at every stage of their journey. But before we dive into what’s new, let’s take a quick look at what the Startup Program is and why it exists.
A refresher: what is the Startup Program?
Cloudflare for Startups provides credits to help early-stage companies build the next big idea on our platform. Startups accepted into the program receive credits valid for one year or until they’re fully used, whichever comes first.
Beyond credits, the program includes access to up to three domains with enterprise-level services, giving startups the same advanced tools we provide to large companies to protect and accelerate their most critical applications.
We know that building a startup is expensive, and Cloudflare is uniquely positioned to support the full-stack needs of modern applications. Our goal is simple: ensure that you have access to the best of Cloudflare’s global network, without the barriers of cost or availability.
Since launching the revamped credits system in September, we’ve learned a lot from the startups in our program, including what they’re building, what they need, and where they need more flexibility. One of the most common requests was more credit tier options.
That’s why we’re introducing new tiers that provide even more options to startups as they scale.
Introducing additional credit tiers
The Cloudflare for Startups Program now offers four credit tiers:
Credit Amount
$5,000
$25,000
$100,000
$250,000
Stage
Bootstrapped, stealth startups
Up-and-coming startups
Seed-funded startups
Tier 1 startups
Description
For startups who are just getting started. This tier is great for building, testing, and iterating your product.
For startups with early adopters and proving product market fit.
For startups that have raised capital, and are experiencing high growth.
For scaling startups that belong to our Tier 1 VC and accelerator network, are building a mission-critical AI application, or are participating in our Workers Launchpad Program.
Criteria
Building a software-based product or service
Founded in the last 5 years
Valid and matching email address
$5,000 criteria plus:
Active LinkedIn
Funded up to $1M
$25,000 criteria plus:
Funded between $1M and $5M
Belong to any of our 250+ approved VC or Accelerator partners
$100,000 criteria plus:
High growth / AI companies, OR
Tier 1 VC & Accelerators
These tiers are designed to offer simplicity and clarity by aligning with where you are in your growth journey. (You can check out eligibility criteria and apply to the Startup Program here). These tiers are still subject to the same Cloudflare for Startups Terms of Service. Credits are valid for up to one year or when all credits are consumed (whichever comes first).
Why are we adding additional credit tiers?
We understand that each startup may have different needs depending on where they’re at in their journey. Some are just getting off the ground, others are scaling rapidly, and each has unique infrastructure needs. With this expansion, we’re reaffirming Cloudflare’s commitment to startups of all sizes, making it easier for you to access the right level of support and resources, exactly when you need them.
Whether you’re launching your MVP or preparing for your next funding round, Cloudflare is here to help you grow.
What can I use the credit tiers for?
The vast majority of Cloudflare products (including all products found on the pay-as-you-go plans) can be used on the Startup Program. Beyond going to the website to see what products are included, below are a few examples of what you can use your credits for:
Build AI applications
Store your training data in R2, build AI-powered agents (via Agents SDK) that autonomously perform tasks with Durable Objects and Workers, or use one of over 50 models to run inference tasks on Cloudflare’s global network.
Create immersive realtime experiences
Deliver live audio and video via our Realtime Kit, enhance the experience with an AI-powered chatbot running on Workers AI to transcribe the call, broadcast to large audiences with Stream.
Build durable multi-step applications
Design and run long-lived, multi-step processes like onboarding flows, document processing, or order fulfillment. Use Workflows to coordinate logic across Workers, Durable Objects, Queues, and AI tasks. Easily handle retries, timeouts, and state management without complex orchestration infrastructure.
What are startups saying about Cloudflare?
Webstudio’s no-code platform is powered by Cloudflare’s Developer Platform
“From a modern design tool, you’d expect real-time collaborative features and would like to have resources as close to users as possible. Since betting on the Developer Platform architecture, Cloudflare has done more for us than any other vendor out there!” – Oleg Isonen (Founder & CEO)
GrackerAI’s cybersecurity research engine runs on Cloudflare’s AI and serverless architecture
“Cloudflare’s fusion of edge computing and AI empowers developers to deploy and utilize AI models with unprecedented efficiency and scale, marking a significant leap forward in how we build and interact with intelligent systems.” – Deepak Gupta (Co-founder & CEO)
Render Better powers faster ecommerce experiences with Cloudflare Workers
“Each month Render Better optimizes billions of monthly requests for ecommerce visitors, delivering faster loading sites that make top brands millions more in revenue. We’re able to scale up with Cloudflare’s serverless workers, handling every request at the network edge within milliseconds, thanks to the rock solid, DX-friendly scope of the Developer Platform.” – James Koshigoe (Co-founder & CEO)
What will you build on Cloudflare?
We can’t wait to see what you will build on Cloudflare. Apply here to take advantage of the Cloudflare for Startups Program.
With quick access to flexible infrastructure and innovative AI tools, startups are able to deploy production-ready applications with speed and efficiency. Cloudflare plays a pivotal role for countless applications, empowering founders and engineering teams to build, scale, and accelerate their innovations with ease — and without the burden of technical overhead. And when applicable, initiatives like our Startup Program and Workers Launchpad offer the tooling and resources that further fuel these ambitious projects.
Cloudflare recently announcedAI agents, allowing developers to leverage Cloudflare to deploy agents to complete autonomous tasks. We’re already seeing some great examples of startups leveraging Cloudflare as their platform of choice to invest in building their agent infrastructure. Read on to see how a few up-and-coming startups are building their AI agent platforms, powered by Cloudflare.
Lamatic AI built a scalable AI agent platform using Workers for Platform
Founded in 2023, Lamatic.ai empowers SaaS startups to seamlessly integrate intelligent AI agents into their products. Lamatic.ai simplifies the deployment of AI agents by offering a fully managed lifecycle with scalability and security in mind. SaaS providers have been leveraging Lamatic to replatform their AI workflows via a no-code visual builder to reduce technical debt and ship products faster. Designed for high availability, scalability, and low latency, Lamatic’s architecture enables developers to build AI-driven applications that remain performant under heavy load. After acquiring a high amount of users in a short amount of time on Product Hunt, Lamatic identified there was real interest to solve complex problems with AI Agents, and the team knew they needed to build a solution with scalability and performance in mind.
Cloudflare plays a key role in supporting Lamatic’s growth. Powered by Cloudflare Workers, Lamatic ensures requests process closer to end users, minimizing latency while offloading computational strain from centralized servers. In just a few months, Lamatic.ai has efficiently scaled to over three million serverless requests per month, supporting over 1,000 customers — all managed by a lean three-person team.
Customers design their Agent Flows through a no-code visual builder, which generates an interoperable YAML configuration. Sensitive credentials such as API keys and model access tokens are securely encrypted and stored in Workers KV, ensuring they are only decrypted at runtime for enhanced security. All YAML configurations are then compiled into a Workers-compatible JavaScript bundle. When a project is deployed, Lamatic orchestrates critical components like sync jobs for scheduled data ETL operations and incoming webhooks to handle event-driven workflows via Cloudflare Queues. Once deployed, the project is fully operational as a Cloudflare Worker with an exposed API endpoint, allowing customers to integrate AI-powered automation directly into their applications with minimal friction.
To scale out their platform, Lamatic.ai built their architecture isolating serverless and AI logic on a per-customer basis. Rather than batching requests into a centralized cluster, Lamatic.ai distributes workloads across Cloudflare’s global network, ensuring each customer and endpoint is served by its own Worker executing dedicated logic. This per-customer deployment model — enabled by Workers for Platforms— allows Lamatic.ai to deliver customer-specific serverless functions at scale, and reduces technical overhead as they onboard additional customers. Each customer gets a dedicated Worker whose request and rate limits are enabled based on their level of subscription.
Beyond request processing, Lamatic uses Cloudflare Workers KV as a distributed config store to ensure high availability and security. All values are encrypted at rest with AES-256-GCM and decrypted only at runtime, keeping operations both secure and low-latency. Tokens and user credentials are encrypted and stored in the database and KV.
To further enhance performance, Cloudflare Queues plays a key role in orchestrating task completion. Lamatic uses Queues to offload work from Workers requests, and handle tasks such as webhooks and coordinating distributed processes, both essential for maintaining system consistency and reliability at scale. While Workers handle sync requests at point of execution, longer running jobs process via Queues. For example, during a scheduled ETL sync, new data records generated are stored as a message queue on Cloudflare Pub/Sub. A consumer Worker collects these messages and makes an API request to the pod using the Workers Queue. The consumer Worker consumes more messages as each queue is finished processing.
Another example of where this has been optimal is for managing AI workflows. Many AI workflows involve concurrent requests to multiple data sources, Queues streamlines data processing and efficiently feeds information into customers’ Retrieval Augmented Generation (RAG) workflows. This approach smooths out workload spikes, reduces bottlenecks, and ensures that AI agents can reliably aggregate and process data without delays.
Beyond this, Lamatic.ai offers Workers AI as one of the support inference providers that customers can use across their platform. Customers can choose to run one of the many open source models hosted on Workers AI, depending on their use case (chatbot, image generation, voice, etc.). Together, these layers solve the challenges of scaling AI agents by handling high volumes of data, maintaining low-latency responses, and ensuring robust security. With Cloudflare’s infrastructure as its backbone, Lamatic.ai has built a resilient and high-performing platform that meets the rigorous demands of modern AI applications, making it an ideal choice for startups embedding AI-driven features into their products.
Skyward AI automates compliance using AI agents with Durable Objects and agents
Skyward AI is transforming compliance operations by leveraging Cloudflare’s serverless computing capabilities to build AI-driven compliance agents that streamline critical tasks like evidence collection, real-time risk analysis, and policy updates. Compliance teams in fintech, supply chain, and other highly regulated industries use these AI Agents to extract and organize evidence, provide real-time recommendations, and orchestrate policy and procedural updates automatically. By handling document parsing, risk monitoring, and policy enforcement, these AI Agents reduce the risk of human error while allowing compliance professionals to focus on high-value tasks.
Skyward has built an AI agents platform designed with a serverless-first approach, avoiding the constraints of centralized cloud computing. To achieve this, the company leverages Cloudflare’s Developer Platform to create and maintain a highly responsive and scalable infrastructure. Workers handle incoming requests like chat inputs, compliance checks, or authentication, and route them efficiently across multiple geographies. Skyward initially built their AI agents infrastructure using Durable Objects,Workflows and JavaScript-native RPC for AI coordination, but has recently transitioned to Cloudflare’s new AI agents framework. Given that agents provides a framework for building and orchestrating AI agents, the migration has helped Skyward abstract the need to manage Durable Objects manually, significantly reducing time spent on managing these tools. While this release is fairly recent, the transition has helped simplify the way that agents communicate, but it also preserved the benefits of their original design like data privacy, isolation, and concurrency management. This has also made it easier to provide real-time feedback and responses to their end users.
Skyward optimizes real-time compliance automation by achieving sub-100 ms response times for AI agent queries. Workloads are structured to minimize unnecessary network round-trips, and a sync-engine approach proactively preloads and pushes data to clients, delivering a highly responsive user experience. To proxy AI inference, Skyward uses AI Gateway to provide observability into usage, performance, and costs across multiple vendors, improving their AI operational efficiency. Leveraging Cloudflare’s serverless Developer Platform has allowed Skyward to simplify their architecture while supporting global availability, avoiding the need for Kubernetes clusters or complex locking mechanisms. The team also avoids the burden of managing regional deployments, as Cloudflare’s multi-region support ensures consistent performance worldwide without added operational complexity.
State management is a critical component to execute agentic workflows. Each compliance session runs within a dedicated Durable Object, which keeps relevant data close to the execution layer. This setup minimizes database round-trips and ensures that tasks like Anti-Money Laundering (AML) checks, Know Your Business (KYB) validation, and document processing remain efficient. Once a compliance session is complete, the system summarizes and stores the relevant information in Postgres and R2, optimizing memory usage without requiring persistent cloud infrastructure.
To balance low-latency operations with long-term storage, Skyward employs a multi-layered data management strategy. The Skyward team, using Hyperdrive, has been able to reduce query latency by nearly 50%, allowing compliance teams to receive immediate feedback. At the company’s core, Skyward’s goal is to offer a platform that is “streamlined for compliance teams”. The team maintains that a speedy feedback loop ensures end customers get the data and responses needed to act. Whether there’s one agent or hundreds of agents processing tasks in parallel, Hyperdrive ensures that database requests to assets like extensive company documentation (i.e. regulations, policies, procedures, internal documents), complex regulatory knowledge graphs, and on-demand context information for conversational workflows are all as performant as possible.
Durable Objects facilitate real-time session state, ensuring AI agents function smoothly without complex locking mechanisms. For larger compliance-related documents, such as legal PDFs and archived data, Cloudflare R2 provides long-term storage, ensuring only frequently accessed information remains readily available. This approach enhances performance while keeping storage management efficient and cost-effective.
Security and scalability remain priorities for compliance-focused AI applications. Skyward enforces strict access controls, ensuring that only authorized users can access development and production environments. Each AI session maintains an auditable log of key events, user actions, and approvals, supporting the ability to export these insights for compliance and legal requirements. Because each agent is deployed in its own instance and has its own database, Skyward ensures that there is a detailed record of every required user, agent interaction, and auditing requirements. On top of this, the ability to deploy and scale globally with Cloudflare’s network has allowed Skyward to maintain consistent, high-performance operations across multiple regions without extensive infrastructure overhead.
Looking ahead, Skyward plans to further enhance AI agent responsiveness by running select models directly on Cloudflare Workers AI, reducing reliance on external inference providers. The team plans to further integrate Workers for Platforms in an effort to better isolate customer data and workflows, giving end users greater control over their compliance automation. As Cloudflare continues to evolve its AI capabilities, Skyward aims to push the boundaries of distributed AI compliance solutions, making regulatory adherence more automated, scalable, and secure.
Building on Cloudflare
We’re inspired by how startups like Lamatic AI and Skyward AI are building their AI agent platforms on Cloudflare. This kind of innovation is why we’re proud to see so many startups trust Cloudflare for a scalable, reliable, and efficient foundation.
We’re also thrilled to share that both Lamatic AI and Skyward AI have been invited to join Cloudflare’s upcoming Workers Launchpad Cohort #5. Speaking of Workers Launchpad, it’s been a few months since our last update — let’s take a look at what’s new.
Thank you to Workers Launchpad Cohort #4, and a warm welcome to Cohort #5
The Workers Launchpad team is blown away by what customers are demonstrating on the Developer Platform. Members of Cohort #4 presented at our bi-annual Demo Day. We had customers demonstrate what they’re building across a multitude of industries, including (of course) AI / ML, developer tools, 3D design, cloud infrastructure, adtech, media, and beyond. It’s incredibly encouraging to see what all these amazing companies are building on the Cloudflare network, and we look forward to continuing to partner with them throughout their startup journey.
Following the Demo Day for Workers Launchpad Cohort #4, we’ve seen the largest influx of applications from startups across the globe eager to join Cohort #5. This next wave of founders is pushing the boundaries of what’s possible, building in areas like AI agents, developer tooling, MCP, media, and beyond. With each new cohort, we’re continually inspired by the caliber of founding teams, the bold ideas they bring to life, and the real-world problems they’re tackling with technology.
Help us give some love and a warm welcome to the participants of Cohort #5:
We can’t wait to share more about what Cohort #5 achieves. Be sure to follow @CloudflareDev on X and join our Developer Discord server to hear updates on the cohorts.
If you’re developing your application on our Developer Platform, we’d love to learn how Cloudflare is powering your journey. Please share more about what you’re building, and our team will be sure to review your submission. And if you’re a startup and interested in joining Workers Launchpad, feel free to apply for Cohort 6 — applications are now open!
Since the launch of Workers AI in September 2023, our mission has been to make inference accessible to everyone.
Over the last few quarters, our Workers AI team has been heads down on improving the quality of our platform, working on various routing improvements, GPU optimizations, and capacity management improvements. Managing a distributed inference platform is not a simple task, but distributed systems are also what we do best. You’ll notice a recurring theme from all these announcements that has always been part of the core Cloudflare ethos — we try to solve problems through clever engineering so that we are able to do more with less.
Today, we’re excited to introduce speculative decoding to bring you faster inference, an asynchronous batch API for large workloads, and expanded LoRA support for more customized responses. Lastly, we’ll be recapping some of our newly added models, updated pricing, and unveiling a new dashboard to round out the usability of the platform.
Speeding up inference by 2-4x with speculative decoding and more
We’re excited to roll out speed improvements to models in our catalog, starting with the Llama 3.3 70b model. These improvements include speculative decoding, prefix caching, an updated inference backend, and more. We’ve previously done a technical deep dive on speculative decoding and how we’re making Workers AI faster, which you can read about here. With these changes, we’ve been able to improve inference times by 2-4x, without any significant change to the quality of answers generated. We’re planning to incorporate these improvements into more models in the future as we release them. Today, we’re starting to roll out these changes so all Workers AI users of @cf/meta/llama-3.3-70b-instruct-fp8-fast will enjoy this automatic speed boost.
What is speculative decoding?
The way LLMs work is by generating text by predicting the next token in a sentence given the previous tokens. Typically, an LLM is able to predict a single future token (n+1) with one forward pass through the model. These forward passes can be computationally expensive, since they need to work through all the parameters of a model to generate one token (e.g., 70 billion parameters for Llama 3.3 70b).
With speculative decoding, we put a small model (known as the draft model) in front of the original model that helps predict n+x future tokens. The draft model generates a subset of candidate tokens, and the original model just has to evaluate and confirm if they should be incorporated into the generation. Evaluating tokens is less computationally expensive, as the model can evaluate multiple tokens concurrently in a forward pass. As such, inference times can be sped up by 2-4x — meaning that users can get responses much faster.
What makes speculative decoding particularly efficient is that it’s able to use unused GPU compute left behind due to the GPU memory bottleneck LLMs create. Speculative decoding takes advantage of the unused compute by squeezing in a draft model to generate tokens faster. This means we’re able to improve the utilization of our GPUs by using them to their full extent without having parts of the GPU sit idle.
What is prefix caching?
With LLMs, there are usually two stages of generation – the first is known as “pre-fill”, which processes the user’s input tokens such as the prompt and context. Prefix caching is aimed at reducing the pre-fill time of a request. As an example, if you were asking a model to generate code based on a given file, you might insert the whole file into the context window of a request. Then, if you want to make a second request to generate the next line of code, you might send us the whole file again in the second request. Prefix caching allows us to cache the pre-fill tokens so we don’t have to process the context twice. With the same example, we would only do the pre-fill stage once for both requests, rather than doing it per request. This method is especially useful for requests that reuse the same context, such as Retrieval Augmented Generation (RAG), code generation, chatbots with memory, and more. Skipping the pre-fill stage for similar requests means faster responses for our users and more efficient usage of resources.
How did you validate that quality is preserved through these optimizations?
Since this is an in-place update to an existing model, we were particularly cautious in ensuring that we would not break any existing applications with this update. We did extensive A/B testing through a blind arena with internal employees to validate the model quality, and we asked internal and external customers to test the new version of the model to ensure that response formats were compatible and model quality was acceptable. Our testing concluded that the model performed up to standards, with people being extremely excited about the speed of the model. Most LLMs are not perfectly deterministic even with the same set of inputs, but if you do notice something off, please let us know through Discord or X.
Asynchronous batch API
Next up, we’re announcing an asynchronous (async) batch API which is helpful for users of large workloads. This feature allows customers to receive their inference responses asynchronously, with the promise that the inference will be completed at a later time rather than immediately erroring out due to capacity.
An example use case of batch workloads is people generating summaries of a large number of documents. You probably don’t need to use those summaries immediately, as you’ll likely use them once the whole document is complete versus one paragraph at a time. For these use cases, we’ve made it super simple for you to start sending us these requests in batches.
Why batch requests?
From talking to our customers, the most common use case we hear about is people creating embeddings or summarizing a large number of documents. Unfortunately, this is also one of the hardest use cases to manage capacity for as a serverless platform.
To illustrate this, imagine that you want to summarize a 70 page PDF. You typically chunk the document and then send an inference request for each chunk. If each chunk is a few paragraphs on a page, that means that we receive around 4 requests per page multiplied by 70 pages, which is about 280 requests. Multiply that by tens or hundreds of documents, and multiply that by a handful of concurrent users — this means that we get a sudden massive influx of thousands of requests when users start these large workloads.
The way we originally built Workers AI was to handle incoming requests as quickly as possible, assuming there’s a human on the other side that needed an immediate response. The unique thing about batch workloads is that while they’re not latency sensitive, they do require completeness guarantees — you don’t want to come back the next day to realize none of your inference requests actually executed.
With the async API, you send us a batch of requests, and we promise to fulfill them as fast as possible and return them to you as a batch. This guarantees that your inference request will be fulfilled, rather than immediately (or eventually) erroring out. The async API also benefits users who have real-time use cases, as the model instances won’t be immediately consumed by these batch requests that can wait for a response. Inference times will be faster since there won’t be a bunch of competing requests in a queue waiting to reach the inference servers.
We have select models that support batch inference today, which include:
Users can send a batch request to supported models by passing a flag:
let res = await env.AI.run("@cf/meta/llama-3.3-70b-instruct-batch", {
  "requests": [{
    "prompt": "Explain mechanics of wormholes"
  }, {
    "prompt": "List different plant species found in America"
  }]
}, {
  queueRequest: true
});
Check out our developer docs to learn more about the batch API, or use our template to deploy a worker that implements the batch API.
Today, our batch API can be used by sending us an array of requests, and we’ll return your responses in an array. This is helpful for use cases like summarizing large amounts of data that you know beforehand. This means you can send us a single HTTP request with all of your requests, and receive a single HTTP request back with your responses. You can check on the status of the batch by polling it with the request ID we return when your batch is submitted. For the next iteration of our async API, we plan to allow queue-based inputs and outputs, where you push requests and pull responses from a queue. This will integrate tightly with Event Notifications and Workflows, so you can execute subsequent actions upon receiving a response.
iterated on this and now support 8 models as well as larger ranks of up to 32 and LoRA files up to 500 MB. Models that support LoRA inference now include:
In essence, a Low Rank Adaptation (LoRA) adapter allows people to take a trained adapter file and use it in conjunction with a model to alter the response of a model. We did a deep dive on LoRAs in our Birthday Week blog post, which goes into further technical detail. LoRA adapters are great alternatives to fine-tuning a model, as it isn’t as expensive to train and adapters are much smaller and more portable. They are also effective enough to tweak the output of a model to fit a certain style of response.
How do I get started?
To get started, you first need to train your own LoRA adapter or find a public one on HuggingFace. Then, you’ll upload the adapter_model.safetensors and adapter_config.json to your account with the documented wrangler commands or through the REST API. LoRA files are private and scoped to your own account. After that, you can start running fine-tuned inference — check out our LoRA developer docs to get started.
const response = await env.AI.run(
  "@cf/qwen/qwen2.5-coder-32b-instruct", //the model supporting LoRAs
  {
      messages: [{"role": "user", "content": "Hello world"}],
      raw: true, //skip applying the default chat template
      lora: "00000000-0000-0000-0000-000000000", //the finetune id OR finetune name
  }
);
Quality of life improvements: updated pricing and a new dashboard for Workers AI
While the team has been focused on large engineering milestones, we’ve also landed some quality of life improvements over the last few months. In case you missed it, we’ve announced an updated pricing model where usage will be shown in units such as tokens, audio seconds, image size/steps, etc. but still billed in neurons in the backend.
Today, we’re unveiling a new dashboard that allows users to see their usage in both units as well as neurons (built on new Workers Observability components!). Model pricing is also available via dashboard and developer docs on the models page. And if you use AI Gateway, Workers AI usage will also be displayed as metrics now.
New models available in Workers AI
Lastly, we’ve steadily been adding new models on Workers AI, with over 10 new models and a few updates on existing models. Pricing is also now listed directly on the model page in the developer docs. To summarize, here are the new models we’ve added on Workers AI, including four new ones we’re releasing today:
@cf/baai/bge-m3: a multi-lingual embeddings model that supports over 100 languages. It can also simultaneously perform dense retrieval, multi-vector retrieval, and sparse retrieval, with the ability to process inputs of different granularities.
@cf/baai/bge-reranker-base: our first reranker model! Rerankers are a type of text classification model that takes a query and context, and outputs a similarity score between the two. When used in RAG systems, you can use a reranker after the initial vector search to find the most relevant documents to return to a user by reranking the outputs.
@cf/openai/whisper-large-v3-turbo: a faster, more accurate speech-to-text model. This model was added earlier but is graduating out of beta with pricing included today.
@cf/myshell-ai/melotts: our first text-to-speech model that allows users to generate an MP3 with voice audio from text input.
@cf/meta/llama-4-scout-17b-16e-instruct: 17 billion parameter MoE model with 16 experts that is natively multimodal. Offers industry-leading performance in text and image understanding.
[NEW] @cf/mistralai/mistral-small-3.1-24b-instruct: a 24B parameter model achieving state-of-the-art capabilities comparable to larger models, with support for vision and tool calling.
[NEW] @cf/google/gemma-3-12b-it: well-suited for a variety of text generation and image understanding tasks, including question answering, summarization and reasoning, with a 128K context window, and multilingual support in over 140 languages.
[NEW] @cf/qwen/qwq-32b: a medium-sized reasoning model, which is capable of achieving competitive performance against state-of-the-art reasoning models, e.g., DeepSeek-R1, o1-mini.
[NEW] @cf/qwen/qwen2.5-coder-32b-instruct: the current state-of-the-art open-source code LLM, with its coding abilities matching those of GPT-4o.
In addition, we are rolling out some in-place updates to existing models in our catalog:
As we release these new models, we’ll be deprecating old models to encourage use of the state-of-the-art models and make room in our catalog. We will send out an email notice on this shortly. Stay up to date with our model releases and deprecation announcements by subscribing to our Developer Docs changelog.
We’re (still) just getting started
Workers AI is one of Cloudflare’s newer products in a nascent industry, but we still operate with very traditional Cloudflare principles – learning how we can do more with less. Our engineering team is focused on solving the difficult problems that come with growing a distributed inference platform at a global scale, and we’re excited to release these new features today that we think will improve the platform as a whole for all our users. With faster inference times, better reliability, more customization possibilities, and better usability, we’re excited to see what you can do with more Workers AI — let us know what you think!
Today, we’re launching the open beta of Pipelines, our streaming ingestion product. Pipelines allows you to ingest high volumes of structured, real-time data, and load it into our object storage service, R2. You don’t have to manage any of the underlying infrastructure, worry about scaling shards or metadata services, and you pay for the data processed (and not by the hour). Anyone on a Workers paid plan can start using it to ingest and batch data — at tens of thousands of requests per second (RPS) — directly into R2.
But this is just the tip of the iceberg: you often want to transform the data you’re ingesting, hydrate it on-the-fly from other sources, and write it to an open table format (such as Apache Iceberg), so that you can efficiently query that data once you’ve landed it in object storage.
The good news is that we’ve thought about that too, and we’re excited to announce that we’ve acquired Arroyo, a cloud-native, distributed stream processing engine, to make that happen.
With Arroyo and our just announced R2 Data Catalog, we’re getting increasingly serious about building a data platform that allows you to ingest data across the planet, store it at scale, and run compute over it.
However, the true power comes from the processing of data streams between ingestion and when they’re written to sinks like R2. Being able to write SQL that acts on windows of data as it’s being ingested, that can transform & aggregate it, and even extract insights from the data in real-time, turns out to be extremely powerful.
This is where Arroyo comes in, and we’re going to be bringing the best parts of Arroyo into Pipelines and deeply integrate it with Workers, R2, and the rest of our Developer Platform.
The Arroyo origin story
(By Micah Wylde, founder of Arroyo)
We started Arroyo in 2023 to bring real-time (stream) processing to everyone who works with data. Modern companies rely on data pipelines to power their applications and businesses — from user customization, recommendations, and anti-fraud, to the emerging world of AI agents.
But today, most of these pipelines operate in batch, running once per hour, day, or even month. After spending many years working on stream processing at companies like Lyft and Splunk, it was no mystery why: it was just too hard for developers and data scientists to build correct, performant, and reliable pipelines. Large tech companies hire streaming experts to build and operate these systems, but everyone else is stuck waiting for batches to arrive.
When we started, the dominant solution for streaming pipelines — and what we ran at Lyft and Splunk — was Apache Flink. Flink was the first system that successfully combined a fault-tolerant (able to recover consistently from failures), distributed (across multiple machines), stateful (and remember data about past events) dataflow with a graph-construction API. This combination of features meant that we could finally build powerful real-time data applications, with capabilities like windows, aggregations, and joins. But while Flink had the necessary power, in practice the API proved too hard and low-level for non-expert users, and the stateful nature of the resulting services required endless operations.
We realized we would need to build a new streaming engine — one with the power of Flink, but designed for product engineers and data scientists and to run on modern cloud infrastructure. We started with SQL as our API because it’s easy to use, widely known, and declarative. We built it in Rust for speed and operational simplicity (no JVM tuning required!). We constructed an object-storage-native state backend, simplifying the challenge of running stateful pipelines — which each are like a weird, specialized database. And then in the summer of 2023, we open-sourced it. Today, dozens of companies are running Arroyo pipelines with use cases including data ingestion, anti-fraud, IoT observability, and financial trading.
But we always knew that the engine was just one piece of the puzzle. To make streaming as easy as batch, users need to be able to develop and test query logic, backfill on historical data, and deploy serverlessly without having to worry about cluster sizing or ongoing operations. Democratizing streaming ultimately meant building a complete data platform. And when we started talking with Cloudflare, we realized they already had all of the pieces in place: R2 provides object storage for state and data at rest, Cloudflare Queues for data in transit, and Workers to safely and efficiently run user code. And Cloudflare, uniquely, allows us to push these systems all the way to the edge, enabling a new paradigm of local stream processing that will be key for a future of data sovereignty and AI.
That’s why we’re incredibly excited to join with the Cloudflare team to make this vision a reality.
Ingestion at scale
While transformations and a streaming SQL API are on the way for Pipelines, it already solves two critical parts of the data journey: globally distributed, high-throughput ingestion and efficient loading into object storage.
Creating a pipeline is as simple as running one command:
$ npx wrangler@latest pipelines create my-clickstream-pipeline --r2-bucket my-bucket

🌀 Creating pipeline named "my-clickstream-pipeline"
✅ Successfully created pipeline my-clickstream-pipeline with ID
0e00c5ff09b34d018152af98d06f5a1xvc

Id:    0e00c5ff09b34d018152af98d06f5a1xvc
Name:  my-clickstream-pipeline
Sources:
  HTTP:
    Endpoint:        https://0e00c5ff09b34d018152af98d06f5a1xvc.pipelines.cloudflare.com/
    Authentication:  off
    Format:          JSON
  Worker:
    Format:  JSON
Destination:
  Type:         R2
  Bucket:       my-bucket
  Format:       newline-delimited JSON
  Compression:  GZIP
Batch hints:
  Max bytes:     100 MB
  Max duration:  300 seconds
  Max records:   100,000

🎉 You can now send data to your pipeline!

Send data to your pipeline's HTTP endpoint:
curl "https://0e00c5ff09b34d018152af98d06f5a1xvc.pipelines.cloudflare.com/" -d '[{ ...JSON_DATA... }]'
By default, a pipeline can ingest data from two sources – Workers and an HTTP endpoint – and load batched events into an R2 bucket. This gives you an out-of-the-box solution for streaming raw event data into object storage. If the defaults don’t work, you can configure pipelines during creation or anytime after. Options include: adding authentication to the HTTP endpoint, configuring CORS to allow browsers to make cross-origin requests, and specifying output file compression and batch settings.
We’ve built Pipelines for high ingestion volumes from day 1. Each pipeline can scale to ~100,000 records per second (and we’re just getting started here). Once records are written to a Pipeline, they are then durably stored, batched, and written out as files in an R2 bucket. Batching is critical here: if you’re going to act on and query that data, you don’t want your query engine querying millions (or tens of millions) of tiny files. It’s slow (per-file & request overheads), inefficient (more files to read), and costly (more operations). Instead, you want to find the right balance between batch size for your query engine and latency (not waiting too long for a batch): Pipelines allows you to configure this.
To further optimize queries, output files are partitioned by date and time, using the standard Hive partitioning scheme. This can optimize queries even further, because your query engine can just skip data that is irrelevant to the query you’re running. The output in your R2 bucket might look like this:
Hive-partioned files from Pipelines in an R2 bucket
Output files are stored as new-line delimited JSON (NDJSON) — which makes it easy to materialize a stream from these files (hint: in the future you’ll be able to use R2 as a pipeline source too). Finally, the file names are ULIDs – so they’re sorted by time by default.
First you shard, then you shard some more
What makes Pipelines so horizontally scalable and able to acknowledge writes quickly is how we built it: we use Durable Objects and the embedded, zero-latency SQLite storage within each Durable Object to immediately persist data as it’s written, before then processing it and writing it to R2.
For example: imagine you’re an e-commerce or SaaS site and need to ingest website usage data (known as clickstream data), and make it available to your data science team to query. The infrastructure which handles this workload has to be resilient to several failure scenarios. The ingestion service needs to maintain high availability in the face of bursts in traffic. Once ingested, the data needs to be buffered, to minimize downstream invocations and thus downstream cost. Finally, the buffered data needs to be delivered to a sink, with appropriate retry & failure handling if the sink is unavailable. Each step of this process needs to signal backpressure upstream when overloaded. It also needs to scale: up during major sales or events, and down during the quieter periods of the day.
Data engineers reading this post might be familiar with the status quo of using Kafka and the associated ecosystem to handle this. But if you’re an application engineer: you use Pipelines to build an ingestion service without learning about Kafka, Zookeeper, and Kafka streams.
Pipelines horizontal sharding
The diagram above shows how Pipelines splits the control plane, which is responsible for accounting, tracking shards, and Pipelines lifecycle events, and the data path, which is a scalable group of Durable Objects shards.
When a record (or batch of records) is written to Pipelines:
The Pipelines Worker receives the records either through the fetch handler or worker binding.
Contacts the Coordinator, based upon the pipeline_id to get the execution plan: subsequent reads are cached to reduce pressure on the coordinator.
Executes the plan, which first shards to a set of Executors, while are primarily serving to scale read request handling
These then re-shard to another set of executors that are actually handling the writes, beginning with persisting to Durable Object storage, which will be replicated for durability and availability by the Storage Relay Service (SRS).
After SRS, we pass to any configured Transform Workers to customize the data.
The data is batched, written to output files, and compressed (if applicable).
The files are compressed, data is packaged into the final batches, and written to the configured R2 bucket.
Each step of this pipeline can signal backpressure upstream. We do this by leveraging ReadableStreams and responding with 429s when the total number of bytes awaiting write exceeds a threshold. Each ReadableStream is able to cross Durable Object boundaries by using JSRPC calls between Durable Objects. To improve performance, we use RPC stubs for connection reuse between Durable Objects. Each step is also able to retry operations, to handle any temporary unavailability in the Durable Objects or R2.
We also guarantee delivery even while updating an existing pipeline. When you update an existing pipeline, we create a new deployment, including all the shards and Durable Objects described above. Requests are gracefully re-routed to the new pipeline. The old pipeline continues to write data into R2, until all the Durable Object storage is drained. We spin down the old pipeline only after all the data has been written out. This way, you won’t lose data even while updating a pipeline.
You’ll notice there’s one interesting part in here — the Transform Workers — which we haven’t yet exposed. As we work to integrate Arroyo’s streaming engine with Pipelines, this will be a key part of how we hand over data for Arroyo to process.
So, what’s it cost?
During the first phase of the open beta, there will be no additional charges beyond standard R2 storage and operation costs incurred when loading and accessing data. And as always, egress directly from R2 buckets is free, so you can process and query your data from any cloud or region without worrying about data transfer costs adding up.
In the future, we plan to introduce pricing based on volume of data ingested into Pipelines and delivered from Pipelines:
Workers Paid ($5 / month)
Ingestion
First 50 GB per month included
\$0.02 per additional GB
Delivery to R2
First 50 GB per month included
\$0.02 per additional GB
We’re also planning to make Pipelines available on the Workers Free plan as the beta progresses.
We’ll be sharing more as we bring transformations and additional sinks to Pipelines. We’ll provide at least 30 days notice before we make any changes or start charging for usage, which we expect to do by September 15, 2025.
What’s next?
There’s a lot to build here, and we’re keen to build on a lot of the powerful components that Arroyo has built: integrating Workers as UDFs (User-Defined Functions), adding new sources like Kafka clients, and extending Pipelines with new sinks (beyond R2).
We’ll also be integrating Pipelines with our just-launched R2 Data Catalog: enabling you ingest streams of data directly into Iceberg tables and immediately query them, without needing to rely on other systems.
Read replication of D1 databases is in public beta!
D1 read replication makes read-only copies of your database available in multiple regions across Cloudflare’s network. For busy, read-heavy applications like e-commerce websites, content management tools, and mobile apps:
D1 read replication lowers average latency by routing user requests to read replicas in nearby regions.
D1 read replication increases overall throughput by offloading read queries to read replicas, allowing the primary database to handle more write queries.
The main copy of your database is called the primary database and the read-only copies are called read replicas. When you enable replication for a D1 database, the D1 service automatically creates and maintains read replicas of your primary database. As your users make requests, D1 routes those requests to an appropriate copy of the database (either the primary or a replica) based on performance heuristics, the type of queries made in those requests, and the query consistency needs as expressed by your application.
All of this global replica creation and request routing is handled by Cloudflare at no additional cost.
To take advantage of read replication, your Worker needs to use the new D1 Sessions API. Click the button below to run a Worker using D1 read replication with this code example to see for yourself!
D1 Sessions API
D1’s read replication feature is built around the concept of database sessions. A session encapsulates all the queries representing one logical session for your application. For example, a session might represent all requests coming from a particular web browser or all requests coming from a mobile app used by one of your users. If you use sessions, your queries will use the appropriate copy of the D1 database that makes the most sense for your request, be that the primary database or a nearby replica.
The sessions implementation ensures sequential consistency for all queries in the session, no matter what copy of the database each query is routed to. The sequential consistency model has important properties like “read my own writes” and “writes follow reads,” as well as a total ordering of writes. The total ordering of writes means that every replica will see transactions committed in the same order, which is exactly the behavior we want in a transactional system. Said another way, sequential consistency guarantees that the reads and writes are executed in the order in which you write them in your code.
Some examples of consistency implications in real-world applications:
You are using an online store and just placed an order (write query), followed by a visit to the account page to list all your orders (read query handled by a replica). You want the newly placed order to be listed there as well.
You are using your bank’s web application and make a transfer to your electricity provider (write query), and then immediately navigate to the account balance page (read query handled by a replica) to check the latest balance of your account, including that last payment.
Why do we need the Sessions API? Why can we not just query replicas directly?
Applications using D1 read replication need the Sessions API because D1 runs on Cloudflare’s global network and there’s no way to ensure that requests from the same client get routed to the same replica for every request. For example, the client may switch from WiFi to a mobile network in a way that changes how their requests are routed to Cloudflare. Or the data center that handled previous requests could be down because of an outage or maintenance.
D1’s read replication is asynchronous, so it’s possible that when you switch between replicas, the replica you switch to lags behind the replica you were using. This could mean that, for example, the new replica hasn’t learned of the writes you just completed. We could no longer guarantee useful properties like “read your own writes”. In fact, in the presence of shifty routing, the only consistency property we could guarantee is that what you read had been committed at some point in the past (read committed consistency), which isn’t very useful at all!
Since we can’t guarantee routing to the same replica, we flip the script and use the information we get from the Sessions API to make sure whatever replica we land on can handle the request in a sequentially-consistent manner.
Here’s what the Sessions API looks like in a Worker:
export default {
  async fetch(request: Request, env: Env) {
    // A. Create the session.
    // When we create a D1 session, we can continue where we left off from a previous
    // session if we have that session's last bookmark or use a constraint.
    const bookmark = request.headers.get('x-d1-bookmark') ?? 'first-unconstrained'
    const session = env.DB.withSession(bookmark)

    // Use this session for all our Workers' routes.
    const response = await handleRequest(request, session)

    // B. Return the bookmark so we can continue the session in another request.
    response.headers.set('x-d1-bookmark', session.getBookmark())

    return response
  }
}

async function handleRequest(request: Request, session: D1DatabaseSession) {
  const { pathname } = new URL(request.url)

  if (request.method === "GET" && pathname === '/api/orders') {
    // C. Session read query.
    const { results } = await session.prepare('SELECT * FROM Orders').all()
    return Response.json(results)

  } else if (request.method === "POST" && pathname === '/api/orders') {
    const order = await request.json<Order>()

    // D. Session write query.
    // Since this is a write query, D1 will transparently forward it to the primary.
    await session
      .prepare('INSERT INTO Orders VALUES (?, ?, ?)')
      .bind(order.orderId, order.customerId, order.quantity)
      .run()

    // E. Session read-after-write query.
    // In order for the application to be correct, this SELECT statement must see
    // the results of the INSERT statement above.
    const { results } = await session
      .prepare('SELECT * FROM Orders')
      .all()

    return Response.json(results)
  }

  return new Response('Not found', { status: 404 })
}
To use the Session API, you first need to create a session using the withSession method (step A). The withSession method takes a bookmark as a parameter, or a constraint. The provided constraint instructs D1 where to forward the first query of the session. Using first-unconstrained allows the first query to be processed by any replica without any restriction on how up-to-date it is. Using first-primary ensures that the first query of the session will be forwarded to the primary.
// A. Create the session.
const bookmark = request.headers.get('x-d1-bookmark') ?? 'first-unconstrained'
const session = env.DB.withSession(bookmark)
Providing an explicit bookmark instructs D1 that whichever database instance processes the query has to be at least as up-to-date as the provided bookmark (in case of a replica; the primary database is always up-to-date by definition). Explicit bookmarks are how we can continue from previously-created sessions and maintain sequential consistency across user requests.
Once you’ve created the session, make queries like you normally would with D1. The session object ensures that the queries you make are sequentially consistent with regards to each other.
// C. Session read query.
const { results } = await session.prepare('SELECT * FROM Orders').all()
For example, in the code example above, the session read query for listing the orders (step C) will return results that are at least as up-to-date as the bookmark used to create the session (step A).
More interesting is the write query to add a new order (step D) followed by the read query to list all orders (step E). Because both queries are executed on the same session, it is guaranteed that the read query will observe a database copy that includes the write query, thus maintaining sequential consistency.
// D. Session write query.
await session
  .prepare('INSERT INTO Orders VALUES (?, ?, ?)')
  .bind(order.orderId, order.customerId, order.quantity)
  .run()

// E. Session read-after-write query.
const { results } = await session
  .prepare('SELECT * FROM Orders')
  .all()
Note that we could make a single batch query to the primary including both the write and the list, but the benefit of using the new Sessions API is that you can use the extra read replica databases for your read queries and allow the primary database to handle more write queries.
The session object does the necessary bookkeeping to maintain the latest bookmark observed across all queries executed using that specific session, and always includes that latest bookmark in requests to D1. Note that any query executed without using the session object is not guaranteed to be sequentially consistent with the queries executed in the session.
When possible, we suggest continuing sessions across requests by including bookmarks in your responses to clients (step B), and having clients passing previously received bookmarks in their future requests.
// B. Return the bookmark so we can continue the session in another request.
response.headers.set('x-d1-bookmark', session.getBookmark())
This allows all of a client’s requests to be in the same session. You can do this by grabbing the session’s current bookmark at the end of the request (session.getBookmark()) and sending the bookmark in the response back to the client in HTTP headers, in HTTP cookies, or in the response body itself.
Consistency with and without Sessions API
In this section, we will explore the classic scenario of a read-after-write query to showcase how using the new D1 Sessions API ensures that we get sequential consistency and avoid any issues with inconsistent results in our application.
The Client, a user Worker, sends a D1 write query that gets processed by the database primary and gets the results back. However, the subsequent read query ends up being processed by a database replica. If the database replica is lagging far enough behind the database primary, such that it does not yet include the first write query, then the returned results will be inconsistent, and probably incorrect for your application business logic.
Using the Sessions API fixes the inconsistency issue. The first write query is again processed by the database primary, and this time the response includes “Bookmark 100”. The session object will store this bookmark for you transparently.
The subsequent read query is processed by database replica as before, but now since the query includes the previously received “Bookmark 100”, the database replica will wait until its database copy is at least up-to-date as “Bookmark 100”. Only once it’s up-to-date, the read query will be processed and the results returned, including the replica’s latest bookmark “Bookmark 104”.
Notice that the returned bookmark for the read query is “Bookmark 104”, which is different from the one passed in the query request. This can happen if there were other writes from other client requests that also got replicated to the database replica in-between the two queries our own client executed.
Enabling read replication
To start using D1 read replication:
Update your Worker to use the D1 Sessions API to tell D1 what queries are part of the same database session. The Sessions API works with databases that do not have read replication enabled as well, so it’s safe to ship this code even before you enable replicas. Here’s an example.
D1 read replication is built into D1, and you don’t pay extra storage or compute costs for replicas. You incur the exact same D1 usage with or without replicas, based on rows_read and rows_written by your queries. Unlike other traditional database systems with replication, you don’t have to manually create replicas, including where they run, or decide how to route requests between the primary database and read replicas. Cloudflare handles this when using the Sessions API while ensuring sequential consistency.
Since D1 read replication is in beta, we recommend trying D1 read replication on a non-production database first, and migrate to your production workloads after validating read replication works for your use case.
If you don’t have a D1 database and want to try out D1 read replication, create a test database in the Cloudflare dashboard.
Observing your replicas
Once you’ve enabled D1 read replication, read queries will start to be processed by replica database instances. The response of each query includes information in the nested meta object relevant to read replication, like served_by_region and served_by_primary. The first denotes the region of the database instance that processed the query, and the latter will be true if-and-only-if your query was processed by the primary database instance.
In addition, the D1 dashboard overview for a database now includes information about the database instances handling your queries. You can see how many queries are handled by the primary instance or by a replica, and a breakdown of the queries processed by region. The example screenshots below show graphs displaying the number of queries executed and number of rows read by each region.
Under the hood: how D1 read replication is implemented
D1 is implemented on top of SQLite-backed Durable Objects running on top of Cloudflare’s Storage Relay Service.
D1 is structured with a 3-layer architecture. First is the binding API layer that runs in the customer’s Worker. Next is a stateless Worker layer that routes requests based on database ID to a layer of Durable Objects that handle the actual SQL operations behind D1. This is similar to how most applications using Cloudflare Workers and Durable Objects are structured.
For a non-replicated database, there is exactly one Durable Object per database. When a user’s Worker makes a request with the D1 binding for the database, that request is first routed to a D1 Worker running in the same location as the user’s Worker. The D1 Worker figures out which D1 Durable Object backs the user’s D1 database and fetches an RPC stub to that Durable Object. The Durable Objects routing layer figures out where the Durable Object is located, and opens an RPC connection to it. Finally, the D1 Durable Object then handles the query on behalf of the user’s Worker using the Durable Objects SQL API.
In the Durable Objects SQL API, all queries go to a SQLite database on the local disk of the server where the Durable Object is running. Durable Objects run SQLite in WAL mode. In WAL mode, every write query appends to a write-ahead log (the WAL). As SQLite appends entries to the end of the WAL file, a database-specific component called the Storage Relay Service leader synchronously replicates the entries to 5 durability followers on servers in different datacenters. When a quorum (at least 3 out of 5) of the durability followers acknowledge that they have safely stored the data, the leader allows SQLite’s write queries to commit and opens the Durable Object’s output gate, so that the Durable Object can respond to requests.
Our implementation of WAL mode allows us to have a complete log of all of the committed changes to the database. This enables a couple of important features in SQLite-backed Durable Objects and D1:
We construct databases anywhere in the world by downloading all of the WAL entries from cold storage and replaying each WAL entry in order.
We implement Point-in-time recovery (PITR) by replaying WAL entries up to a specific bookmark rather than to the end of the log.
Unfortunately, having the main data structure of the database be a log is not ideal. WAL entries are in write order, which is often neither convenient nor fast. In order to cut down on the overheads of the log, SQLite checkpoints the log by copying the WAL entries back into the main database file. Read queries are serviced directly by SQLite using files on disk — either the main database file for checkpointed queries, or the WAL file for writes more recent than the last checkpoint. Similarly, the Storage Relay Service snapshots the database to cold storage so that we can replay a database by downloading the most recent snapshot and replaying the WAL from there, rather than having to download an enormous number of individual WAL entries.
WAL mode is the foundation for implementing read replication, since we can stream writes to locations other than cold storage in real time.
We implemented read replication in 5 major steps.
First, we made it possible to make replica Durable Objects with a read-only copy of the database. These replica objects boot by fetching the latest snapshot and replaying the log from cold storage to whatever bookmark primary database’s leader last committed. This basically gave us point-in-time replicas, since without continuous updates, the replicas never updated until the Durable Object restarted.
Second, we registered the replica leader with the primary’s leader so that the primary leader sends the replicas every entry written to the WAL at the same time that it sends the WAL entries to the durability followers. Each of the WAL entries is marked with a bookmark that uniquely identifies the WAL entry in the sequence of WAL entries. We’ll use the bookmark later.
Note that since these writes are sent to the replicas before a quorum of durability followers have confirmed them, the writes are actually unconfirmed writes, and the replica leader must be careful to keep the writes hidden from the replica Durable Object until they are confirmed. The replica leader in the Storage Relay Service does this by implementing enough of SQLite’s WAL-index protocol, so that the unconfirmed writes coming from the primary leader look to SQLite as though it’s just another SQLite client doing unconfirmed writes. SQLite knows to ignore the writes until they are confirmed in the log. The upshot of this is that the replica leader can write WAL entries to the SQLite WAL immediately, and then “commit” them when the primary leader tells the replica that the entries have been confirmed by durability followers.
One neat thing about this approach is that writes are sent from the primary to the replica as quickly as they are generated by the primary, helping to minimize lag between replicas. In theory, if the write query was proxied through a replica to the primary, the response back to the replica will arrive at almost the same time as the message that updates the replica. In such a case, it looks like there’s no replica lag at all!
In practice, we find that replication is really fast. Internally, we measure confirm lag, defined as the time from when a primary confirms a change to when the replica confirms a change. The table below shows the confirm lag for two D1 databases whose primaries are in different regions.
Replica Region
Database A
(Primary region: ENAM)
Database B (Primary region: WNAM)
ENAM
N/A
30 ms
WNAM
45 ms
N/A
WEUR
55 ms
75 ms
EEUR
67 ms
75 ms
Confirm lag for 2 replicated databases. N/A means that we have no data for this combination. The region abbreviations are the same ones used for Durable Object location hints.
The table shows that confirm lag is correlated with the network round-trip time between the data centers hosting the primary databases and their replicas. This is clearly visible in the difference between the confirm lag for the European replicas of the two databases. As airline route planners know, EEUR is appreciably further away from ENAM than WNAM, but from WNAM, both European regions (WEUR and EEUR) are about equally as far away. We see that in our replication numbers.
The exact placement of the D1 database in the region matters too. Regions like ENAM and WNAM are quite large in themselves. Database A’s placement in ENAM happens to be further away from most data centers in WNAM compared to database B’s placement in WNAM relative to the ENAM data centers. As such, database B sees slightly lower confirm lag.
Try as we might, we can’t beat the speed of light!
Third, we updated the Durable Object routing system to be aware of Durable Object replicas. When read replication is enabled on a Durable Object, two things happen. First, we create a set of replicas according to a replication policy. The current replication policy that D1 uses is simple: a static set of replicas in every region that D1 supports. Second, we turn on a routing policy for the Durable Object. The current policy that D1 uses is also simple: route to the Durable Object replica in the region close to where the user request is. With this step, we have updateable read-only replicas, and can route requests to them!
Fourth, we updated D1’s Durable Object code to handle write queries on replicas. D1 uses SQLite to figure out whether a request is a write query or a read query. This means that the determination of whether something is a read or write query happens after the request is routed. Read replicas will have to handle write requests! We solve this by instantiating each replica D1 Durable Object with a reference to its primary. If the D1 Durable Object determines that the query is a write query, it forwards the request to the primary for the primary to handle. This happens transparently, keeping the user code simple.
As of this fourth step, we can handle read and write queries at every copy of the D1 Durable Object, whether it’s a primary or not. Unfortunately, as outlined above, if a user’s requests get routed to different read replicas, they may see different views of the database, leading to a very weak consistency model. So the last step is to implement the Sessions API across the D1 Worker and D1 Durable Object. Recall that every WAL entry is marked with a bookmark. These bookmarks uniquely identify a point in (logical) time in the database. Our bookmarks are strictly monotonically increasing; every write to a database makes a new bookmark with a value greater than any other bookmark for that database.
Using bookmarks, we implement the Sessions API with the following algorithm split across the D1 binding implementation, the D1 Worker, and D1 Durable Object.
First up in the D1 binding, we have code that creates the D1DatabaseSession object and code within the D1DatabaseSession object to keep track of the latest bookmark.
// D1Binding is the binding code running within the user's Worker
// that provides the existing D1 Workers API and the new withSession method.
class D1Binding {
  // Injected by the runtime to the D1 Binding.
  d1Service: D1ServiceBinding

  function withSession(initialBookmark) {
    return D1DatabaseSession(this.d1Service, this.databaseId, initialBookmark);
  }
}

// D1DatabaseSession holds metadata about the session, most importantly the
// latest bookmark we know about for this session.
class D1DatabaseSession {
  constructor(d1Service, databaseId, initialBookmark) {
    this.d1Service = d1Service;
    this.databaseId = databaseId;
    this.bookmark = initialBookmark;
  }

  async exec(query) {
    // The exec method in the binding sends the query to the D1 Worker
    // and waits for the the response, updating the bookmark as
    // necessary so that future calls to exec use the updated bookmark.
    var resp = await this.d1Service.handleUserQuery(databaseId, query, bookmark);
    if (isNewerBookmark(this.bookmark, resp.bookmark)) {
      this.bookmark = resp.bookmark;
    }
    return resp;
  }

  // batch and other SQL APIs are implemented similarly.
}
The binding code calls into the D1 stateless Worker (d1Service in the snippet above), which figures out which Durable Object to use, and proxies the request to the Durable Object.
class D1Worker {
  async handleUserQuery(databaseId, query) {
    var doId = /* look up Durable Object for databaseId */;
    return await this.D1_DO.get(doId).handleWorkerQuery(query, bookmark)
  }
}
Finally, we reach the Durable Objects layer, which figures out how to actually handle the request.
class D1DurableObject {
  async handleWorkerQuery(queries, bookmark) {
    var bookmark = bookmark ?? "first-primary";
    var results = {};

    if (this.isPrimaryDatabase()) {
      // The primary always has the latest data so we can run the
      // query without checking the bookmark.
      var result = /* execute query directly */;
      bookmark = getCurrentBookmark();
      results = result;
    } else {
      // This is running on a replica.
      if (bookmark === "first-primary" || isWriteQuery(query)) {
        // The primary must handle this request, so we'll proxy the
        // request to the primary.
        var resp = await this.primary.handleWorkerQuery(query, bookmark);
        bookmark = resp.bookmark;
        results = resp.results;
      } else {
        // The replica can handle this request, but only after the
        // database is up-to-date with the bookmark.
        if (bookmark !== "first-unconstrained") {
          await waitForBookmark(bookmark);
        }
        var result = /* execute query locally */;
        bookmark = getCurrentBookmark();
        results = result;
      }
    }
    return { results: results, bookmark: bookmark };
  }
}
The D1 Durable Object first figures out if this instance can handle the query, or if the query needs to be sent to the primary. If the Durable Object can execute the query, it ensures that we execute the query with a bookmark at least as up-to-date as the bookmark requested by the binding.
The upshot is that the three pieces of code work together to ensure that all of the queries in the session see the database in a sequentially consistent order, because each new query will be blocked until it has seen the results of previous queries within the same session.
Conclusion
D1’s new read replication feature is a significant step towards making globally distributed databases easier to use without sacrificing consistency. With automatically provisioned replicas in every region, your applications can now serve read queries faster while maintaining strong sequential consistency across requests, and keeping your application Worker code simple.
We’re excited for developers to explore this feature and see how it improves the performance of your applications. The public beta is just the beginning—we’re actively refining and expanding D1’s capabilities, including evolving replica placement policies, and your feedback will help shape what’s next.
Note that the Sessions API is only available through the D1 Worker Binding for now, and support for the HTTP REST API will follow soon.
Try out D1 read replication today by clicking the “Deploy to Cloudflare” button, check out documentation and examples, and let us know what you build in the D1 Discord channel!
Apache Iceberg is quickly becoming the standard table format for querying large analytic datasets in object storage. We’re seeing this trend firsthand as more and more developers and data teams adopt Iceberg on Cloudflare R2. But until now, using Iceberg with R2 meant managing additional infrastructure or relying on external data catalogs.
So we’re fixing this. Today, we’re launching the R2 Data Catalog in open beta, a managed Apache Iceberg catalog built directly into your Cloudflare R2 bucket.
If you’re not already familiar with it, Iceberg is an open table format built for large-scale analytics on datasets stored in object storage. With R2 Data Catalog, you get the database-like capabilities Iceberg is known for – ACID transactions, schema evolution, and efficient querying – without the overhead of managing your own external catalog.
R2 Data Catalog exposes a standard Iceberg REST catalog interface, so you can connect the engines you already use, like PyIceberg, Snowflake, and Spark. And, as always with R2, there are no egress fees, meaning that no matter which cloud or region your data is consumed from, you won’t have to worry about growing data transfer costs.
Ready to query data in R2 right now? Jump into the developer docs and enable a data catalog on your R2 bucket in just a few clicks. Or keep reading to learn more about Iceberg, data catalogs, how metadata files work under the hood, and how to create your first Iceberg table.
What is Apache Iceberg?
Apache Iceberg is an open table format for analyzing large datasets in object storage. It brings database-like features – ACID transactions, time travel, and schema evolution – to files stored in formats like Parquet or ORC.
Historically, data lakes were just collections of raw files in object storage. However, without a unified metadata layer, datasets could easily become corrupted, were difficult to evolve, and queries often required expensive full-table scans.
Iceberg solves these problems by:
Providing ACID transactions for reliable, concurrent reads and writes.
Maintaining optimized metadata, so engines can skip irrelevant files and avoid unnecessary full-table scans.
Supporting schema evolution, allowing columns to be added, renamed, or dropped without rewriting existing data.
Iceberg is already widely supported by engines like Apache Spark, Trino, Snowflake, DuckDB, and ClickHouse, with a fast-growing community behind it.
How Iceberg tables are stored
Internally, an Iceberg table is a collection of data files (typically stored in columnar formats like Parquet or ORC) and metadata files (typically stored in JSON or Avro) that describe table snapshots, schemas, and partition layouts.
To understand how query engines interact efficiently with Iceberg tables, it helps to look at an Iceberg metadata file (simplified):
schemas: Iceberg tracks schema changes over time. Engines use schema information to safely read and write data without needing to rewrite underlying files.
snapshots: Each snapshot references a specific set of data files that represent the state of the table at a point in time. This enables features like time travel.
partition-specs: These define how the table is logically partitioned. Query engines leverage this information during planning to skip unnecessary partitions, greatly improving query performance.
By reading Iceberg metadata, query engines can efficiently prune partitions, load only the relevant snapshots, and fetch only the data files it needs, resulting in faster queries.
Why do you need a data catalog?
Although the Iceberg data and metadata files themselves live directly in object storage (like R2), the list of tables and pointers to the current metadata need to be tracked centrally by a data catalog.
Think of a data catalog as a library’s index system. While books (your data) are physically distributed across shelves (object storage), the index provides a single source of truth about what books exist, their locations, and their latest editions. Without this index, readers (query engines) would waste time searching for books, might access outdated versions, or could accidentally shelve new books in ways that make them unfindable.
Similarly, data catalogs ensure consistent, coordinated access, allowing multiple query engines to safely read from and write to the same tables without conflicts or data corruption.
Create your first Iceberg table on R2
Ready to try it out? Here’s a quick example using PyIceberg and Python to get you started. For a detailed step-by-step guide, check out our developer docs.
1. Enable R2 Data Catalog on your bucket:
npx wrangler r2 bucket catalog enable my-bucket
Or use the Cloudflare dashboard: Navigate to R2 Object Storage > Settings > R2 Data Catalog and click Enable.
2. Create a Cloudflare API token with permissions for both R2 storage and the data catalog.
3. Install PyIceberg and PyArrow, then open a Python shell or notebook:
You can now append more data or run queries, just as you would with any Apache Iceberg table.
Pricing
While R2 Data Catalog is in open beta, there will be no additional charges beyond standard R2 storage and operations costs incurred by query engines accessing data. Storage pricing for buckets with R2 Data Catalog enabled remains the same as standard R2 buckets – \$0.015 per GB-month. As always, egress directly from R2 buckets remains \$0.
In the future, we plan to introduce pricing for catalog operations (e.g., creating tables, retrieving table metadata, etc.) and data compaction.
Below is our current thinking on future pricing. We’ll communicate more details around timing well before billing begins, so you can confidently plan your workloads.
Pricing
R2 storage
For standard storage class
$0.015 per GB-month (no change)
R2 Class A operations
$4.50 per million operations (no change)
R2 Class B operations
$0.36 per million operations (no change)
Data Catalog operations
e.g., create table, get table metadata, update table properties
$9.00 per million catalog operations
Data Catalog compaction data processed
$0.05 per GB processed
$4.00 per million objects processed
Data egress
$0 (no change, always free)
What’s next?
We’re excited to see how you use R2 Data Catalog! If you’ve never worked with Iceberg – or even analytics data – before, we think this is the easiest way to get started.
Next on our roadmap is tackling compaction and table optimization. Query engines typically perform better when dealing with fewer, but larger data files. We will automatically re-write collections of small data files into larger files to deliver even faster query performance.
We’re also collaborating with the broad Apache Iceberg community to expand query-engine compatibility with the Iceberg REST Catalog spec.
In acknowledgement of its pivotal role in building distributed applications that rely on regional databases, we’re making Hyperdrive available on the free plan of Cloudflare Workers!
Hyperdrive enables you to build performant, global apps on Workers with your existing SQL databases. Tell it your database connection string, bring your existing drivers, and Hyperdrive will make connecting to your database faster. No major refactors or convoluted configuration required.
Over the past year, Hyperdrive has become a key service for teams that want to build their applications on Workers and connect to SQL databases. This includes our own engineering teams, with Hyperdrive serving as the tool of choice to connect from Workers to our own Postgres clusters for many of the control-plane actions of our billing, D1, R2, and Workers KV teams (just to name a few).
This has highlighted for us that Hyperdrive is a fundamental building block, and it solves a common class of problems for which there isn’t a great alternative. We want to make it possible for everyone building on Workers to connect to their database of choice with the best performance possible, using the drivers and frameworks they already know and love.
Performance is a feature
To illustrate how much Hyperdrive can improve your application’s performance, let’s write the world’s simplest benchmark. This is obviously not production code, but is meant to be reflective of a common application you’d bring to the Workers platform. We’re going to use a simple table, a very popular OSS driver (postgres.js), and run a standard OLTP workload from a Worker. We’re going to keep our origin database in London, and query it from Chicago (those locations will come back up later, so keep them in mind).
// This is the test table we're using
// CREATE TABLE IF NOT EXISTS test_data(userId bigint, userText text, isActive bool);

import postgres from 'postgres';

let direct_conn = '<direct connection string here!>';
let hyperdrive_conn = env.HYPERDRIVE.connectionString;

async function measureLatency(connString: string) {
	let beginTime = Date.now();
	let sql = postgres(connString);

	await sql`INSERT INTO test_data VALUES (${999}, 'lorem_ipsum', ${true})`;
	await sql`SELECT userId, userText, isActive FROM test_data WHERE userId = ${999}`;

	let latency = Date.now() - beginTime;
	ctx.waitUntil(sql.end());
	return latency;
}

let directLatency = await measureLatency(direct_conn);
let hyperdriveLatency = await measureLatency(hyperdrive_conn);
The code above
Takes a standard database connection string, and uses it to create a database connection.
Loads a user record into the database.
Queries all records for that user.
Measures how long this takes to do with a direct connection, and with Hyperdrive.
When connecting directly to the origin database, this set of queries takes an average of 1200 ms. With absolutely no other changes, just swapping out the connection string for env.HYPERDRIVE.connectionString, this number is cut down to 500 ms (an almost 60% reduction). If you enable Hyperdrive’s caching, so that the SELECT query is served from cache, this takes only 320 ms. With this one-line change, Hyperdrive will reduce the latency of this Worker by almost 75%! In addition to this speedup, you also get secure auth and transport, as well as a connection pool to help protect your database from being overwhelmed when your usage scales up. See it for yourself using our demo application.
A demo application comparing latencies between Hyperdrive and direct-to-database connections.
Traditional SQL databases are familiar and powerful, but they are designed to be colocated with long-running compute. They were not conceived in the era of modern serverless applications, and have connection models that don’t take the constraints of such an environment into account. Instead, they require highly stateful connections that do not play well with Workers’ global and stateless model. Hyperdrive solves this problem by maintaining database connections across Cloudflare’s network ready to be used at a moment’s notice, caching your queries for fast access, and eliminating round trips to minimize network latency.
With this announcement, many developers are going to be taking a look at Hyperdrive for the first time over the coming weeks and months. To help people dive in and try it out, we think it’s time to talk about how Hyperdrive actually works.
Staying warm in the pool
Let’s talk a bit about database connection poolers, how they work, and what problems they already solve. They are hardly a new technology, after all.
The point of any connection pooler, Hyperdrive or others, is to minimize the overhead of establishing and coordinating database connections. Every new database connection requires additional memory and CPU time from the database server, and this can only scale just so well as the number of concurrent connections climbs. So the question becomes, how should database connections be shared across clients?
Session mode: whenever a client connects, it is assigned a connection of its own until it disconnects. This dramatically reduces the available concurrency, in exchange for much simpler implementation and a broader selection of supported features
Transaction mode: when a client is ready to send a query or open a transaction, it is assigned a connection on which to do so. This connection will be returned to the pool when the query or transaction concludes. Subsequent queries during the same client session may (or may not) be assigned a different connection.
Statement mode: Like transaction mode, but a connection is given out and returned for each statement. Multi-statement transactions are disallowed.
When building Hyperdrive, we had to decide which of these modes we wanted to use. Each of the approaches implies some fairly serious tradeoffs, so what’s the right choice? For a service intended to make using a database from Workers as pleasant as possible we went with the choice that balances features and performance, and designed Hyperdrive as a transaction-mode pooler. This best serves the goals of supporting a large number of short-lived clients (and therefore very high concurrency), while still supporting the transactional semantics that cause so many people to reach for an RDBMS in the first place.
In terms of this part of its design, Hyperdrive takes its cues from many pre-existing popular connection poolers, and manages operations to allow our users to focus on designing their full-stack applications. There is a configured limit to the number of connections the pool will give out, limits to how long a connection will be held idle until it is allowed to drop and return resources to the database, bookkeeping around prepared statements being shared across pooled connections, and other traditional concerns of the management of these resources to help ensure the origin database is able to run smoothly. These are all described in our documentation.
Round and round we go
Ok, so why build Hyperdrive then? Other poolers that solve these problems already exist — couldn’t developers using Workers just run one of those and call it a day? It turns out that connecting to regional poolers from Workers has the same major downside as connecting to regional databases: network latency and round trips.
Establishing a connection, whether to a database or a pool, requires many exchanges between the client and server. While this is true for all fully-fledged client-server databases (e.g. MySQL, MongoDB), we are going to focus on the PostgreSQL connection protocol flow in this post. As we work through all of the steps involved, what we most want to keep track of is how many round trips it takes to accomplish. Note that we’re mostly concerned about having to wait around while these happen, so “half” round trips such as in the first diagram are not counted. This is because we can send off the message and then proceed without waiting.
The first step to establishing a connection between Postgres client and server is very familiar ground to anyone who’s worked much with networks: a TCP startup handshake. Postgres uses TCP for its underlying transport, and so we must have that connection before anything else can happen on top of it.
With our transport layer in place, the next step is to encrypt the connection. The TLS Handshake involves some back-and-forth in its own right, though this has been reduced to just one round trip for TLS 1.3. Below is the simplest and fastest version of this exchange, but there are certainly scenarios where it can be much more complex.
After the underlying transport is established and secured, the application-level traffic can actually start! However, we’re not quite ready for queries, the client still needs to authenticate to a specific user and database. Again, there are multiple supported approaches that offer varying levels of speed and security. To make this comparison as fair as possible, we’re again going to consider the version that offers the fastest startup (password-based authentication).
So, for those keeping score, establishing a new connection to your database takes a bare minimum of 5 round trips, and can very quickly climb from there.
While the latency of any given network round trip is going to vary based on so many factors that “it depends” is the only meaningful measurement available, some quick benchmarking during the writing of this post shows ~125 ms from Chicago to London. Now multiply that number by 5 round trips and the problem becomes evident: 625 ms to start up a connection is not viable in a distributed serverless environment. So how does Hyperdrive solve it? What if I told you the trick is that we do it all twice? To understand Hyperdrive’s secret sauce, we need to dive into Hyperdrive’s architecture.
Impersonating a database server
The rest of this post is a deep dive into answering the question of how Hyperdrive does what it does. To give the clearest picture, we’re going to talk about some internal subsystems by name. To help keep everything straight, let’s start with a short glossary that you can refer back to if needed. These descriptions may not make sense yet, but they will by the end of the article.
Hyperdrive subsystem name
Brief description
Client
Lives on the same server as your Worker, talks directly to your database driver. This caches query results and sends queries to Endpoint if needed.
Endpoint
Lives in the data center nearest to your origin database, talks to your origin database. This caches query results and houses a pool of connections to your origin database.
Edge Validator
Sends a request to a Cloudflare data center to validate that Hyperdrive can connect to your origin database at time of creation.
Placement
Builds on top of Edge Validator to connect to your origin database from all eligible data centers, to identify which have the fastest connections.
The first subsystem we want to dig into is named Client. Client’s first job is to pretend to be a database server. When a user’s Worker wants to connect to their database via Hyperdrive, they use a special connection string that the Worker runtime generates on the fly. This tells the Worker to reach out to a Hyperdrive process running on the same Cloudflare server, and direct all traffic to and from the database client to it.
import postgres from "postgres";

// Connect to Hyperdrive
const sql = postgres(env.HYPERDRIVE.connectionString);

// sql will now talk over an RPC channel to Hyperdrive, instead of via TCP to Postgres
Once this connection is established, the database driver will perform the usual handshake expected of it, with our Client playing the role of a database server and sending the appropriate responses. All of this happens on the same Cloudflare server running the Worker, and we observe that the p90 for all this is 4 ms (p50 is 2 ms). Quite a bit better than 625 ms, but how does that help? The query still needs to get to the database, right?
Client’s second main job is to inspect the queries sent from a Worker, and decide whether they can be served from Cloudflare’s cache. We’ll talk more about that later on. Assuming that there are no cached query results available, Client will need to reach out to our second important subsystem, which we call Endpoint.
In for the long haul
Before we dig into the role Endpoint plays, it’s worth talking more about how the Client→Endpoint connection works, because it’s a key piece of our solution. We have already talked a lot about the price of network round trips, and how a Worker might be quite far away from the origin database, so how does Hyperdrive handle the long trip from the Client running alongside their Worker to the Endpoint running near their database without expensive round trips?
This is accomplished with a very handy bit of Cloudflare’s networking infrastructure. When Client gets a cache miss, it will submit a request to our networking platform for a connection to whichever data center Endpoint is running on. This platform keeps a pool of ready TCP connections between all of Cloudflare’s data centers, such that we don’t need to do any preliminary handshakes to begin sending application-level traffic. You might say we put a connection pooler in our connection pooler.
Over this TCP connection, we send an initialization message that includes all of the buffered query messages the Worker has sent to Client (the mental model would be something like a SYN and a payload all bundled together). Endpoint will do its job processing this query, and respond by streaming the response back to Client, leaving the streaming channel open for any followup queries until Client disconnects. This approach allows us to send queries around the world with zero wasted round trips.
Impersonating a database client
Endpoint has a couple different jobs it has to do. Its first job is to pretend to be a database client, and to do the client half of the handshake shown above. Second, it must also do the same query processing that Client does with query messages. Finally, Endpoint will make the same determination on when it needs to reach out to the origin database to get uncached query results.
When Endpoint needs to query the origin database, it will attempt to take a connection out of a limited-size pool of database connections that it keeps. If there is an unused connection available, it is handed out from the pool and used to ferry the query to the origin database, and the results back to Endpoint. Once Endpoint has these results, the connection is immediately returned to the pool so that another Client can use it. These warm connections are usable in a matter of microseconds, which is obviously a dramatic improvement over the round trips from one region to another that a cold startup handshake would require.
If there are no currently unused connections sitting in the pool, it may start up a new one (assuming the pool has not already given out as many connections as it is allowed to). This set of handshakes looks exactly the same as the one Client does, but it happens across the network between a Cloudflare data center and wherever the origin database happens to be. These are the same 5 round trips as our original example, but instead of a full Chicago→London path on every single trip, perhaps it’s Virginia→London, or even London→London. Latency here will depend on which data center Endpoint is being housed in.
Distributed choreography
Earlier, we mentioned that Hyperdrive is a transaction-mode pooler. This means that when a driver is ready to send a query or open a transaction it must get a connection from the pool to use. The core challenge for a transaction-mode pooler is in aligning the state of the driver with the state of the connection checked out from the pool. For example, if the driver thinks it’s in a transaction, but the database doesn’t, then you might get errors or even corrupted results.
Hyperdrive achieves this by ensuring all connections are in the same state when they’re checked out of the pool: idle and ready for a query. Where Hyperdrive differs from other transaction-mode poolers is that it does this dance of matching up the states of two different connections across machines, such that there’s no need to share state between Client and Endpoint! Hyperdrive can terminate the incoming connection in Client on the same machine running the Worker, and pool the connections to the origin database wherever makes the most sense.
The job of a transaction-mode pooler is a hard one. Database connections are fundamentally stateful and keeping track of that state is important to maintain our guise when impersonating either a database client or a server. As an example, one of the trickier pieces of state to manage are prepared statements. When a user creates a new prepared statement, the prepared statement is only created on whichever database connection happened to be checked out at that time. Once the user finishes the transaction or query they are processing, the connection holding that statement is returned to the pool. From the user’s perspective they’re still connected using the same database connection, so a new query or transaction can reasonably expect to use that previously prepared statement. If a different connection is handed out for the next query and the query wants to make use of this resource, the pooler has to do something about it. We went into some depth on this topic in a previous blog post when we released this feature, but in sum, the process looks like this:
Hyperdrive implements this by keeping track of what statements have been prepared by a given client, as well as what statements have been prepared on each origin connection in the pool. When a query comes in expecting to re-use a particular prepared statement (#8 above), Hyperdrive checks if it’s been prepared on the checked-out origin connection. If it hasn’t, Hyperdrive will replay the wire-protocol message sequence to prepare it on the newly-checked-out origin connection (#10 above) before sending the query over it. Many little corrections like this are necessary to keep the client’s connection to Hyperdrive and Hyperdrive’s connection to the origin database lined up so that both sides see what they expect.
Better, faster, smarter, closer
This “split connection” approach is the founding innovation of Hyperdrive, and one of the most vital aspects of it is how it affects starting up new connections. While the same 5+ round trips must always happen on startup, the actual time spent on the round trips can be dramatically reduced by conducting them over the smallest possible distances. This impact of distance can be so big that there is still a huge latency reduction even though the startup round trips must now happen twice (once each between the Worker and Client, and Endpoint and your origin database). So how do we decide where to run everything, to lean into that advantage as much as possible?
The placement of Client has not really changed since the original design of Hyperdrive. Sharing a server with the Worker sending the queries means that the Worker runtime can connect directly to Hyperdrive with no network hop needed. While there is always room for microoptimizations, it’s hard to do much better than that from an architecture perspective. By far the bigger piece of the latency puzzle is where to run Endpoint.
Hyperdrive keeps a list of data centers that are eligible to house Endpoints, requiring that they have sufficient capacity and the best routes available for pooled connections to use. The key challenge to overcome here is that a database connection string does not tell you where in the world a database actually is. The reality is that reliably going from a hostname to a precise (enough) geographic location is a hard problem, even leaving aside the additional complexity of doing so within a private network. So how do we pick from that list of eligible data centers?
For much of the time since its launch, Hyperdrive solved this with a regional pool approach. When a Worker connected to Hyperdrive, the location of the Worker was used to infer what region the end user was connecting from (e.g. ENAM, WEUR, APAC, etc. — see a rough breakdown here). Data centers to house Endpoints for any given Hyperdrive were deterministically selected from that region’s list of eligible options using rendezvous hashing, resulting in one pool of connections per region.
This approach worked well enough, but it had some severe shortcomings. The first and most obvious is that there’s no guarantee that the data center selected for a given region is actually closer to the origin database than the user making the request. This means that, while you’re getting the benefit of the excellent routing available on Cloudflare’s network, you may be going significantly out of your way to do so. The second downside is that, in the scenario where a new connection must be created, the round trips to do so may be happening over a significantly larger distance than is necessary if the origin database is in a different region than the Endpoint housing the regional connection pool. This increases latency and reduces throughput for the query that needs to instantiate the connection.
The final key downside here is an unfortunate interaction with Smart Placement, a feature of Cloudflare Workers that analyzes the duration of your Worker requests to identify the data center to run your Worker in. With regional Endpoints, the best Smart Placement can possibly do is to put your requests close to the Endpoint for whichever region the origin database is in. Again, there may be other data centers that are closer, but Smart Placement has no way to do better than where the Endpoint is because all Hyperdrive queries must route through it.
We recently shipped some improvements to this system that significantly enhanced performance. The new system discards the concept of regional pools entirely, in favor of a single global Endpoint for each Hyperdrive that is in the eligible data center as close as possible to the origin database.
The way we solved locating the origin database such that we can accomplish this was ultimately very straightforward. We already had a subsystem to confirm, at the time of creation, that Hyperdrive could connect to an origin database using the provided information. We call this subsystem our Edge Validator.
It’s bad user experience to allow someone to create a Hyperdrive, and then find out when they go to use it that they mistyped their password or something. Now they’re stuck trying to debug with extra layers in the way, with a Hyperdrive that can’t possibly work. Instead, whenever a Hyperdrive is created, the Edge Validator will send a request to an arbitrary data center to use its instance of Hyperdrive to connect to the origin database. If this connection fails, the creation of the Hyperdrive will also fail, giving immediate feedback to the user at the time it is most helpful.
With our new subsystem, affectionately called Placement, we now have a solution to the geolocation problem. After Edge Validator has confirmed that the provided information works and the Hyperdrive is created, an extra step is run in the background. Placement will perform the exact same connection routine, except instead of being done once from an arbitrary data center, it is run a handful of times from every single data center that is eligible to house Endpoints. The latency of establishing these connections is collected, and the average is sent back to a central instance of Placement. The data centers that can connect to the origin database the fastest are, by definition, where we want to run Endpoint for this Hyperdrive. The list of these is saved, and at runtime is used to select the Endpoint best suited to housing the pool of connections to the origin database.
Given that the secret sauce of Hyperdrive is in managing and minimizing the latency of establishing these connections, moving Endpoints right next to their origin databases proved to be pretty impactful.
Pictured: query latency as measured from Endpoint to origin databases. The backfill of Placement to existing customers was done in stages on 02/22 and 02/25.
Serverless drivers exist, though?
While we went in a different direction, it’s worth acknowledging that other teams have solved this same problem with a very different approach. Custom database drivers, usually called “serverless drivers”, have made several optimization efforts to reduce both the number of round trips and how quickly they can be conducted, while still connecting directly from your client to your database in the traditional way. While these drivers are impressive, we chose not to go this route for a couple of reasons.
First off, a big part of the appeal of using Postgres is its vibrant ecosystem. Odds are good you’ve used Postgres before, and it can probably help solve whichever problem you’re tackling with your newest project. This familiarity and shared knowledge across projects is an absolute superpower. We wanted to lean into this advantage by supporting the most popular drivers already in this ecosystem, instead of fragmenting it by adding a competing one.
Second, Hyperdrive also functions as a cache for individual queries (a bit of trivia: its name while still in Alpha was actually sql-query-cache). Doing this as effectively as possible for distributed users requires some clever positioning of where exactly the query results should be cached. One of the unique advantages of running a distributed service on Cloudflare’s network is that we have a lot of flexibility on where to run things, and can confidently surmount challenges like those. If we’re going to be playing three-card monte with where things are happening anyway, it makes the most sense to favor that route for solving the other problems we’re trying to tackle too.
Pick your favorite cache pun
As we’ve talked about in the past, Hyperdrive buffers protocol messages until it has enough information to know whether a query can be served from cache. In a post about how Hyperdrive works it would be a shame to skip talking about how exactly we cache query results, so let’s close by diving into that.
First and foremost, Hyperdrive uses Cloudflare’s cache, because when you have technology like that already available to you, it’d be silly not to use it. This has some implications for our architecture that are worth exploring.
The cache exists in each of Cloudflare’s data centers, and by default these are separate instances. That means that a Client operating close to the user has one, and an Endpoint operating close to the origin database has one. However, historically we weren’t able to take full advantage of that, because the logic for interacting with cache was tightly bound to the logic for managing the pool of connections.
Part of our recent architecture refactoring effort, where we switched to global Endpoints, was to split up this logic such that we can take advantage of Client’s cache too. This was necessary because, with Endpoint moving to a single location for each Hyperdrive, users from other regions would otherwise have gotten cache hits served from almost as far away as the origin.
With the new architecture, the role of Client during active query handling transitioned from that of a “dumb pipe” to more like what Endpoint had always been doing. It now buffers protocol messages, and serves results from cache if possible. In those scenarios, Hyperdrive’s traffic never leaves the data center that the Worker is running in, reducing query latencies from 20-70 ms to an average of around 4 ms. As a side benefit, it also substantially reduces the network bandwidth Hyperdrive uses to serve these queries. A win-win!
In the scenarios where query results can’t be served from the cache in Client’s data center, all is still not lost. Endpoint may also have cached results for this query, because it can field traffic from many different Clients around the world. If so, it will provide these results back to Client, along with how much time is remaining before they expire, such that Client can both return them and store them correctly into its own cache. Likewise, if Endpoint does need to go to the origin database for results, they will be stored into both Client and Endpoint caches. This ensures that followup queries from that same Client data center will get the happy path with single-digit ms response times, and also reduce load on the origin database from any other Client’s queries. This functions similarly to how Cloudflare’s Tiered Cache works, with Endpoint’s cache functioning as a final layer of shielding for the origin database.
Come on in, the water’s fine!
With this announcement of a Free Plan for Hyperdrive, and newly armed with the knowledge of how it works under the hood, we hope you’ll enjoy building your next project with it! You can get started with a single Wrangler command (or using the dashboard):
We’ve also included a Deploy to Cloudflare button below to let you get started with a sample Worker app using Hyperdrive, just bring your existing Postgres database! If you have any questions or ideas for future improvements, please feel free to visit our Discord channel!
Today we’re excited to announce AutoRAG in open beta, a fully managed Retrieval-Augmented Generation (RAG) pipeline powered by Cloudflare, designed to simplify how developers integrate context-aware AI into their applications. RAG is a method that improves the accuracy of AI responses by retrieving information from your own data, and providing it to the large language model (LLM) to generate more grounded responses.
Building a RAG pipeline is a patchwork of moving parts. You have to stitch together multiple tools and services — your data storage, a vector database, an embedding model, LLMs, and custom indexing, retrieval, and generation logic — all just to get started. Maintaining it is even harder. As your data changes, you have to manually reindex and regenerate embeddings to keep the system relevant and performant. What should be a simple “ask a question, get a smart answer” experience becomes a brittle pipeline of glue code, fragile integrations, and constant upkeep.
AutoRAG removes that complexity. With just a few clicks, it delivers a fully-managed RAG pipeline end-to-end: from ingesting your data and automatically chunking and embedding it, to storing vectors in Cloudflare’s Vectorize database, performing semantic retrieval, and generating high-quality responses using Workers AI. AutoRAG continuously monitors your data sources and indexes in the background so your AI stays fresh without manual effort. It abstracts away the mess, letting you focus on building smarter, faster applications on Cloudflare’s developer platform. Get started today in the Cloudflare Dashboard!
Why use RAG in the first place?
LLMs like Llama 3.3 from Meta are powerful, but they only know what they’ve been trained on. They often struggle to produce accurate answers when asked about new, proprietary, or domain-specific information. System prompts providing relevant information can help, but they bloat input size and are limited by context windows. Fine-tuning a model is expensive and requires ongoing retraining to keep up to date.
RAG solves this by retrieving relevant information from your data source at query time, combining it with the user’s input query, and feeding both into the LLM to generate responses grounded with your data. This makes RAG a great fit for AI-driven support bots, internal knowledge assistants, semantic search across documentation, and other use cases where the source of truth is always evolving.
What’s under the hood of AutoRAG?
AutoRAG sets up a RAG pipeline for you, using the building blocks of Cloudflare’s developer platform. Instead of you having to write code to create a RAG system using Workers AI, Vectorize, and AI Gateway, you just create an AutoRAG instance and point it at a data source, like an R2 storage bucket.
Behind the scenes, AutoRAG is powered by two processes: indexing and querying.
Indexing is an asynchronous process that runs in the background. It kicks off as soon as you create an AutoRAG, and automatically continues in cycles — reprocessing new or updated files after each previous job completes. During indexing, your content is transformed into vectors optimized for semantic search.
Querying is a synchronous process triggered when a user sends a search request. AutoRAG takes the query, retrieves the most relevant content from your vector database, and uses it to generate a context-aware response using an LLM.
Let’s take a closer look at how they work.
Indexing process
When you connect a data source, AutoRAG automatically ingests, transforms, and stores it as vectors, optimizing it for semantic search when querying:
File ingestion from data source: AutoRAG reads directly from your data source. Today, it supports integration with Cloudflare R2, where you can store documents like PDFs, images, text, HTML, CSV, and more for processing. Check out the RAG to riches in 5 minutes tutorial below to learn how you can use Browser Rendering to parse webpages to use within your AutoRAG.
Markdown conversion: AutoRAG uses Workers AI’s Markdown Conversion to convert all files into structured Markdown. This ensures consistency across diverse file types. For images, Workers AI is used to perform object detection followed by vision-to-language transformation to convert images into Markdown text.
Chunking: The extracted text is chunked into smaller pieces to improve retrieval granularity.
Embedding: Each chunk is embedded using Workers AI’s embedding model to transform the content into vectors.
Vector storage: The resulting vectors, along with metadata like source location and file name, are stored in a Cloudflare’s Vectorize database created on your account.
Querying process
When an end user makes a request, AutoRAG orchestrates the following:
Receive query from AutoRAG API: The query workflow begins when you send a request to either the AutoRAG’s AI Search or Search endpoint.
Query rewriting (optional): AutoRAG provides the option to rewrite the input query using one of Workers AI’s LLMs to improve retrieval quality by transforming the original query into a more effective search query.
Embedding the query: The rewritten (or original) query is transformed into a vector via the same embedding model used to embed your data so that it can be compared against your vectorized data to find the most relevant matches.
Vector search in Vectorize: The query vector is searched against stored vectors in the associated Vectorize database for your AutoRAG.
Metadata + content retrieval: Vectorize returns the most relevant chunks and their metadata. And the original content is retrieved from the R2 bucket. These are passed to a text-generation model.
Response generation: A text-generation model from Workers AI is used to generate a response using the retrieved content and the original user’s query.
The end result is an AI-powered answer grounded in your private data — accurate, and up to date.
RAG to riches in under 5 minutes
Most of the time, getting started with AutoRAG is as simple as pointing it to an existing R2 bucket — just drop in your content, and you’re ready to go. But what if your content isn’t already in a bucket? What if it’s still on a webpage or needs to first be rendered dynamically by a frontend UI? You’re in luck, because with the Browser Rendering API, you can crawl your own websites to gather information that powers your RAG. The Browser Rendering REST API is now generally available, offering endpoints for common browser actions including extracting HTML content, capturing screenshots, and generating PDFs. Additionally, a crawl endpoint is coming soon, making it even easier to ingest websites.
In this walkthrough, we’ll show you how to take your website and feed it into AutoRAG for Q&A. We’ll use a Cloudflare Worker to render web pages in a headless browser, upload the content to R2, and hook that into AutoRAG for semantic search and generation.
Step 1. Create a Worker to fetch webpages and upload into R2
We’ll create a Cloudflare Worker that uses Puppeteer to visit your URL, render it, and store the full HTML in your R2 bucket. If you already have an R2 bucket with content you’d like to build a RAG for then you can skip this step.
Create a new Worker project named browser-r2-worker by running:
npm create cloudflare@latest -- browser-r2-worker
For setup, select the following options:
What would you like to start with? Choose Hello World Starter.
Which template would you like to use? Choose Worker only.
Which language do you want to use? Choose TypeScript.
2. Install @cloudflare/puppeteer, which allows you to control the Browser Rendering instance:
npm i @cloudflare/puppeteer
3. Create a new R2 bucket named html-bucket by running:
npx wrangler r2 bucket create html-bucket
4. Add the following configurations to your Wrangler configuration file, so your Worker can use browser rendering and your new R2 bucket:
5. Replace the contents of src/index.ts with the following skeleton script:
import puppeteer from "@cloudflare/puppeteer";

// Define our environment bindings
interface Env {
	MY_BROWSER: any;
	HTML_BUCKET: R2Bucket;
}

// Define request body structure
interface RequestBody {
	url: string;
}

export default {
	async fetch(request: Request, env: Env): Promise<Response> {
		// Only accept POST requests
		if (request.method !== 'POST') {
return new Response('Please send a POST request with a target URL', { status: 405 });
		}

		// Get URL from request body
		const body = await request.json() as RequestBody;
		// Note: Only use this parser for websites you own
		const targetUrl = new URL(body.url);

		// Launch browser and create new page
		const browser = await puppeteer.launch(env.MY_BROWSER);
		const page = await browser.newPage();

		// Navigate to the page and fetch its html
		await page.goto(targetUrl.href);
		const htmlPage = await page.content();

		// Create filename and store in R2
		const key = targetUrl.hostname + '_' + Date.now() + '.html';
		await env.HTML_BUCKET.put(key, htmlPage);

		// Close browser
		await browser.close();

		// Return success response
		return new Response(JSON.stringify({
			success: true,
			message: 'Page rendered and stored successfully',
			key: key
		}), {
			headers: { 'Content-Type': 'application/json' }
		});
	}
} satisfies ExportedHandler<Env>;
6. Once the code is ready, you can deploy it to your Cloudflare account by running:
npx wrangler deploy
7. To test your Worker, you can use the following cURL request to fetch the HTML file of a page. In this example we are fetching this blog page to upload into the html-bucket bucket:
Select Create AutoRAG and complete the setup process:
Select the R2 bucket which contains your knowledge base, in this case, select the html-bucket.
Select an embedding model used to convert your data to vector representation. It is recommended to use the Default.
Select an LLM to use to generate your responses. It is recommended to use the Default.
Select or create an AI Gateway to monitor and control your model usage.
Name your AutoRAG as my-rag.
Select or create a Service API token to grant AutoRAG access to create and access resources in your account.
Select Create to spin up your AutoRAG.
Once you’ve created your AutoRAG, it will automatically create a Vectorize database in your account and begin indexing the data. You can view the progress of your indexing job in the Overview page of your AutoRAG. The indexing time may vary depending on the number and type of files you have in your data source.
Step 3. Test and add to your application
Once AutoRAG finishes indexing your content, you’re ready to start asking it questions. You can open up your AutoRAG instance, navigate to the Playground tab, and ask a question based on your uploaded content, like “What is AutoRAG?”.
Once you’re happy with the results in the Playground, you can integrate AutoRAG directly into the application that you are building. If you are using a Worker to build your application, then you can use the AI binding to directly call your AutoRAG:
{
  "ai": {
    "binding": "AI"
  }
}
Then, query your AutoRAG instance from your Worker code by calling the aiSearch() method. Alternatively you can use the Search() method to get a list of retrieved results without an AI generated response.
const answer = await env.AI.autorag('my-rag').aiSearch({
   query: 'What is AutoRAG?'
});
For more information on how to add AutoRAG into your application, go to your AutoRAG then navigate to Use AutoRAG for more instructions.
Start building today
During the open beta, AutoRAG is free to enable. Compute operations for indexing, retrieval and augmentation incur no additional cost during this phase.
AutoRAG is built entirely on top of Cloudflare’s Developer Platform, using the same tools you’d reach for if you were building a RAG pipeline yourself. When you create an AutoRAG instance, it provisions and runs on top of Cloudflare services within your own account, giving you full visibility into performance, cost, and behavior with fewer black boxes.
Vectorize: stores vector embeddings and powers semantic retrieval.
Workers AI: converts images to markdown, generates embeddings, rewrites queries, and generates responses.
AI Gateway: tracks and controls your model’s usage.
To help manage resources during the beta, each account is limited to 10 AutoRAG instances, with up to 100,000 filesper AutoRAG.
What’s on the roadmap?
We’re just getting started with AutoRAG and we have more planned throughout 2025 to make it more powerful and flexible. Here are a few things we’re actively working on:
More data source integrations: We’re expanding beyond R2, with support for new input types like direct website URL parsing (powered by browser rendering) and structured data sources like Cloudflare D1.
Smarter, higher-quality responses: We’re exploring built-in reranking, recursive chunking, and other processing techniques to improve the quality and relevance of generated answers.
These features will roll out incrementally, and we’d love your feedback as we shape what’s next. AutoRAG is built to evolve with your use cases so stay tuned.
Try it out today!
Get started with AutoRAG today by visiting the Cloudflare Dashboard, navigate to AI > AutoRAG, and select Create AutoRAG. Whether you’re building an AI-powered search experience, an internal knowledge assistant, or just experimenting with LLMs, AutoRAG gives you a fast and flexible way to get started with RAG on Cloudflare’s global network. For more details, refer to the Developer Docs. Also, try out the Browser Rendering API that is now generally available for your browser action needs.
We’re excited to see what you build and we’re here to help. Have questions or feedback? Join the conversation on the Cloudflare Developers Discord.
Betas are useful for feedback and iteration, but at the end of the day, not everyone is willing to be a guinea pig or can tolerate the occasional sharp edge that comes along with beta software. Sometimes you need that big, shiny “Generally Available” label (or blog post), and now it’s Workflows’ turn.
Workflows, our serverless durable execution engine that allows you to build long-running, multi-step applications (some call them “step functions”) on Workers, is now GA.
In short, that means it’s production ready — but it also doesn’t mean Workflows is going to ossify. We’re continuing to scale Workflows (including more concurrent instances), bring new capabilities (like the new waitForEvent API), and make it easier to build AI agents with our Agents SDK and Workflows.
If you prefer code to prose, you can quickly install the Workflows starter project and start exploring the code and the API with a single command:
How does Workflows work? What can I build with it? How do I think about building AI agents with Workflows and the Agents SDK? Well, read on.
Building with Workflows
Workflows is a durable execution engine built on Cloudflare Workers that allows you to build resilient, multi-step applications.
At its core, Workflows implements a step-based architecture where each step in your application is independently retriable, with state automatically persisted between steps. This means that even if a step fails due to a transient error or network issue, Workflows can retry just that step without needing to restart your entire application from the beginning.
When you define a Workflow, you break your application into logical steps.
Each step can either execute code (step.do), put your Workflow to sleep (step.sleep or step.sleepUntil), or wait on an event (step.waitForEvent).
As your Workflow executes, it automatically persists the state returned from each step, ensuring that your application can continue exactly where it left off, even after failures or hibernation periods.
This durable execution model is particularly powerful for applications that coordinate between multiple systems, process data in sequence, or need to handle long-running tasks that might span minutes, hours, or even days.
Workflows are particularly useful at handling complex business processes that traditional stateless functions struggle with.
For example, an e-commerce order processing workflow might check inventory, charge a payment method, send an email confirmation, and update a database — all as separate steps. If the payment processing step fails due to a temporary outage, Workflows will automatically retry just that step when the payment service is available again, without duplicating the inventory check or restarting the entire process.
You can see how this works below: each call to a service can be modelled as a step, independently retried, and if needed, recovered from that step onwards:
import { WorkflowEntrypoint, WorkflowStep, WorkflowEvent } from 'cloudflare:workers';

// The params we expect when triggering this Workflow
type OrderParams = {
	orderId: string;
	customerId: string;
	items: Array<{ productId: string; quantity: number }>;
	paymentMethod: {
		type: string;
		id: string;
	};
};

// Our Workflow definition
export class OrderProcessingWorkflow extends WorkflowEntrypoint<Env, OrderParams> {
	async run(event: WorkflowEvent<OrderParams>, step: WorkflowStep) {
		// Step 1: Check inventory
		const inventoryResult = await step.do('check-inventory', async () => {
			console.log(`Checking inventory for order ${event.payload.orderId}`);

			// Mock: In a real workflow, you'd query your inventory system
			const inventoryCheck = await this.env.INVENTORY_SERVICE.checkAvailability(event.payload.items);

			// Return inventory status as state for the next step
			return {
				inStock: true,
				reservationId: 'inv-123456',
				itemsChecked: event.payload.items.length,
			};
		});

		// Exit workflow if items aren't in stock
		if (!inventoryResult.inStock) {
			return { status: 'failed', reason: 'out-of-stock' };
		}

		// Step 2: Process payment
		// Configure specific retry logic for payment processing
		const paymentResult = await step.do(
			'process-payment',
			{
				retries: {
					limit: 3,
					delay: '30 seconds',
					backoff: 'exponential',
				},
				timeout: '2 minutes',
			},
			async () => {
				console.log(`Processing payment for order ${event.payload.orderId}`);

				// Mock: In a real workflow, you'd call your payment processor
				const paymentResponse = await this.env.PAYMENT_SERVICE.processPayment({
					customerId: event.payload.customerId,
					orderId: event.payload.orderId,
					amount: calculateTotal(event.payload.items),
					paymentMethodId: event.payload.paymentMethod.id,
				});

				// If payment failed, throw an error that will trigger retry logic
				if (paymentResponse.status !== 'success') {
					throw new Error(`Payment failed: ${paymentResponse.message}`);
				}

				// Return payment info as state for the next step
				return {
					transactionId: 'txn-789012',
					amount: 129.99,
					timestamp: new Date().toISOString(),
				};
			},
		);

		// Step 3: Send email confirmation
		await step.do('send-confirmation-email', async () => {
			console.log(`Sending confirmation email for order ${event.payload.orderId}`);
			console.log(`Including payment confirmation ${paymentResult.transactionId}`);
			return await this.env.EMAIL_SERVICE.sendOrderConfirmation({ ... })
		});

		// Step 4: Update database
		const dbResult = await step.do('update-database', async () => {
			console.log(`Updating database for order ${event.payload.orderId}`);
			await this.updateOrderStatus(...)

			return { dbUpdated: true };
		});

		// Return final workflow state
		return {
			orderId: event.payload.orderId,
			processedAt: new Date().toISOString(),
		};
	}
}
This combination of durability, automatic retries, and state persistence makes Workflows ideal for building reliable distributed applications that can handle real-world failures gracefully.
Human-in-the-loop
Workflows are just code, and that makes them extremely powerful: you can define steps dynamically and on-the-fly, conditionally branch, and make API calls to any system you need. But sometimes you also need a Workflow to wait for something to happen in the real world.
For example:
Approval from a human to progress.
An incoming webhook, like from a Stripe payment or a GitHub event.
A state change, such as a file upload to R2 that triggers an Event Notification, and then pushes a reference to the file to the Workflow, so it can process the file (or run it through an AI model).
The new waitForEvent API in Workflows allows you to do just that:
let event = await step.waitForEvent<IncomingStripeWebhook>("receive invoice paid webhook from Stripe", { type: "stripe-webhook", timeout: "1 hour" })
You can then send an event to a specific instance from any external service that can make a HTTP request:
interface Env {
  MY_WORKFLOW: Workflow;
}

interface Payload {
  transaction: string;
  id: string;
}

export default {
  async fetch(req: Request, env: Env) {
    const instanceId = new URL(req.url).searchParams.get("instanceId")
    const webhookPayload = await req.json<Payload>()

    let instance = await env.MY_WORKFLOW.get(instanceId);
    // Send our event, with `type` matching the event type defined in
    // our step.waitForEvent call
    await instance.sendEvent({type: "stripe-webhook", payload: webhookPayload})

    return Response.json({
      status: await instance.status(),
    });
  },
};
You can even wait for multiple events, using the type parameter, and/or race multiple events using Promise.race to continue on depending on which event was received first:
export class MyWorkflow extends WorkflowEntrypoint<Env, Params> {
	async run(event: WorkflowEvent<Params>, step: WorkflowStep) {
		let state = await step.do("get some data", () => { /* step call here /* })
		// Race the events, resolving the Promise based on which event
// we receive first
		let value = Promise.race([
step.waitForEvent("payment success", { type: "payment-success-webhook", timeout: "4 hours" ),
step.waitForEvent("payment failure", { type: "payment-failure-webhook", timeout: "4 hours" ),
])
// Continue on based on the value and event received
	}
}
To visualize waitForEvent in a bit more detail, let’s assume we have a Workflow that is triggered by a code review agent that watches a GitHub repository.
Without the ability to wait on events, our Workflow can’t easily get human approval to write suggestions back (or even submit a PR of its own). It could potentially poll for some state that was updated, but that means we have to call step.sleep for arbitrary periods of time, poll a storage service for an updated value, and repeat if it’s not there. That’s a lot of code and room for error:
Without waitForEvent, it’s harder to send data to a Workflow instance that’s running
If we modified that same example to incorporate the new waitForEvent API, we could use it to wait for human approval before making a mutating change:
Adding waitForEvent to our code review Workflow, so it can seek explicit approval.
You could even imagine an AI agent itself sending and/or acting on behalf of a human here: waitForEvent simply exposes a way for a Workflow to retrieve and pause on something in the world to change before it continues (or not).
Critically, you can call waitForEvent just like any other step in Workflows: you can call it conditionally, and/or multiple times, and/or in a loop. Workflows are just Workers: you have the full power of a programming language and are not restricted by a domain specific language (DSL) or config language.
Pricing
Good news: we haven’t changed much since our original beta announcement! We’re adding storage pricing for state stored by your Workflows, and retaining our CPU-based and request (invocation) based pricing as follows:
Because the storage pricing is new, we will not actively bill for storage until September 15, 2025. We will notify users above the included 1 GB limit ahead of charging for storage, and by default, Workflows will expire stored state after three (3) days (Free plan) or thirty (30) days (Paid plan).
If you’re wondering what “CPU time” is here: it’s the time your Workflow is actively consuming compute resources. It doesn’t include time spent waiting on API calls, reasoning LLMs, or other I/O (like writing to a database). That might seem like a small thing, but in practice, it adds up: most applications have single digit milliseconds of CPU time, and multiple seconds of wall time: an API or two taking 100 – 250 ms to respond adds up!
Bill for CPU, not for time spent when a Workflow is idle or waiting.
Workflow engines, especially, tend to spend a lot of time waiting: reading data from object storage (like Cloudflare R2), calling third-party APIs or LLMs like o3-mini or Claude 3.7, even querying databases like D1, Postgres, or MySQL. With Workflows, just like Workers: you don’t pay for time your application is just waiting.
Start building
So you’ve got a good handle on Workflows, how it works, and want to get building. What next?
I’m thrilled to share that Cloudflare has acquired Outerbase. This is such an amazing opportunity for us, and I want to explain how we got here, what we’ve built so far, and why we are so excited about becoming part of the Cloudflare team.
Databases are key to building almost any production application: you need to persist state for your users (or agents), be able to query it from a number of different clients, and you want it to be fast. But databases aren’t always easy to use: designing a good schema, writing performant queries, creating indexes, and optimizing your access patterns tends to require a lot of experience. Add that to exposing your data through easy-to-grok APIs that make the ‘right’ way to do things obvious, a great developer experience (from dashboard to CLI), and well… there’s a lot of work involved.
The Outerbase team is already getting to work on some big changes to how databases (and your data) are viewed, edited, and visualized from within Workers, and we’re excited to give you a few sneak peeks into what we’ll be landing as we get to work.
Database DX
When we first started Outerbase, we saw how complicated databases could be. Even experienced developers struggled with writing queries, indexing data, and locking down their data. Meanwhile, non-developers often felt locked out and that they couldn’t access the data they needed. We believed there had to be a better way. From day one, our goal was to make data accessible to everyone, no matter their skill level. While it started out by simply building a better database interface, it quickly evolved into something much more special.
Outerbase became a platform that helps you manage data in a way that feels natural. You can browse tables, edit rows, and run queries without having to deal with memorizing SQL structure. Even if you do know SQL, you can use Outerbase to dive in deeper and share your knowledge with your team. We also added visualization features so entire teams, both technical and not, could see what’s happening with their data at a glance. Then, with the growth of AI, we realized we could use it to handle many of the more complicated tasks.
One of our more exciting offerings is Starbase, a SQLite-compatible database built on top of Cloudflare’s Durable Objects. Our goal was never to simply wrap a legacy system in a shiny interface; we wanted to make it so easy to get started from day one with nothing, and Cloudflare’s Durable Objects gave us a way to easily manage and spin up databases for anyone who needed one. On top of them, we provided automatic REST APIs, row-level security, WebSocket support for streaming queries, and much more.
1 + 1 = 3
Our collaboration with Cloudflare first started last year, when we introduced a way for developers to import and manage their D1 databases inside Outerbase. We were impressed with how powerful Cloudflare’s tools are for deploying and scaling applications. As we worked together, we quickly saw how well our missions aligned. Cloudflare was building the infrastructure we wished we’d had when we first started, and we were building the data experience that many Cloudflare developers were asking for. This eventually led to the seemingly obvious decision of Outerbase joining Cloudflare — it just made so much sense.
Going forward, we’ll integrate Outerbase’s core features into Cloudflare’s platform. If you’re a developer using D1 or Durable Objects, you’ll start seeing features from Outerbase show up in the Cloudflare dashboard. Expect to see our data explorer for browsing and editing tables, new REST APIs, query editor with type-ahead functionality, real-time data capture, and more of the other tooling we’ve been refining over the last couple of years show up inside the Cloudflare dashboard.
As part of this transition, the hosted Outerbase cloud will shut down on October 15, 2025, which is about six months from now. We know some of you rely on Outerbase as it stands today, so we’re leaving the open-source repositories as they are.
You will still be able to self-host Outerbase if you prefer, and we’ll provide guidance on how to do that within your own Cloudflare account. Our main goal will be to ensure that the best parts of Outerbase become part of the Cloudflare developer experience, so you no longer have to make a choice (it’ll be obvious!).
Sneak peek
We’ve already done a lot of thinking about how we’re going to bring the best parts of Outerbase into D1, Durable Objects, Workflows, and Agents, and we’re going to a share a little about what will be landing over the course of Q2 2025 as the Outerbase team gets to work.
Specifically, we’ll be heads-down focusing on:
Adapting the powerful table viewer and query runner experiences to D1 and Durable Objects (amongst many other things!)
Making it easier to get started with Durable Objects: improving the experience in Wrangler (our CLI tooling), the Cloudflare dashboard, and how you plug into them from your client applications
Improvements to how you visualize the state of a Workflow and the (thousands to millions!) of Workflow instances you might have at any point in time
Pre- and post-query hooks for D1 that allow you to automatically register handlers that can act on your data
Bringing the Starbase API to D1, expanding D1’s existing REST API, and adding WebSockets support — making it easier to use D1, even for applications hosted outside of Workers.
We have already started laying the groundwork for these changes. In the coming weeks, we’ll release a unified data explorer for D1 and Durable Objects that borrows heavily from the Outerbase interface you know.
Bringing Outerbase’s Data Explorer into the Cloudflare Dashboard
We’ll also tie some of Starbase’s features directly into Cloudflare’s platform, so you can tap into its unique offerings like pre- and post-query hooks or row-level security right from your existing D1 databases and Durable Objects:
const beforeQuery = ({ sql, params }) => {
    // Prevent unauthorized queries
    if (!isAllowedQuery(sql)) throw new Error('Query not allowed');
};

const afterQuery = ({ sql, result }) => {
    // Basic PII masking example
    for (const row of result) {
        if ('email' in row) row.email = '[redacted]';
    }
};

// Execute the query with pre- and post- query hooks
const { results } = await env.DB.prepare("SELECT * FROM users;", beforeQuery, afterQuery);
Define hooks on your D1 queries that can be re-used, shared and automatically executed before or after your queries run.
This should give you more clarity and control over your data, as well as new ways to secure and optimize it.
Rethinking the Durable Objects getting started experience
We have even begun optimizing the Cloudflare dashboard experience around Durable Objects and D1 to improve the empty state, provide more Getting Started resources, and overall, make managing and tracking your database resources even easier.
For those of you who’ve supported us, given us feedback, and stuck with us as we grew: thank you. You have helped shape Outerbase into what it is today. This acquisition means we can pour even more resources and attention into building the data experience we’ve always wanted to deliver. Our hope is that, by working as part of Cloudflare, we can help reach even more developers by building intuitive experiences, accelerating the speed of innovation, and creating tools that naturally fit into your workflows.
This is a big step for Outerbase, and we couldn’t be more excited. Thank you for being part of our journey so far. We can’t wait to show you what we’ve got in store as we continue to make data more accessible, intuitive, and powerful — together with Cloudflare.
What’s next?
We’re planning to get to work on some of the big changes to how you interact with your data on Cloudflare, starting with D1 and Durable Objects.
We’ll also be ensuring we bring a great developer experience to the broader database & storage platform on Cloudflare, including how you access data in Workers KV, R2, Workflows and even your AI Agents (just to name a few).
So the story begins with a pair programming session I had with my colleague, which I desperately needed because my node skill tree is still at level 1, and I needed to get started with React because I’ll be working on our internal backstage instance.
We worked together on a small feature, tested it locally, and it worked. Great. Now it’s time to make My Very First React Commit. So I ran the usual git add and git commit, which hooked into yarn test, to automatically run unit tests for backstage, and that’s when everything got derailed. For all the React tutorials I have followed, I have never actually run a yarn test on my machine. And the first time I tried yarn test, it hung, and after a long time, the command eventually failed:
Determining test suites to run...

  ● Test suite failed to run

thrown: [Error]

error Command failed with exit code 1.
info Visit https://yarnpkg.com/en/docs/cli/run for documentation about this command.
🌈  backstage  ⚡
I could tell it was obviously unhappy about something, and then it threw some [Error]. I have very little actual JavaScript experience, but this looks suspiciously like someone had neglected to write a proper toString() or whatever, and thus we’re stuck with the monumentally unhelpful [Error]. Searching the web yielded an entire ocean of false positives due to how vague the error message is. What a train wreck!
Fine, let’s put on our troubleshooting hats. My memory is not perfect, but thankfully shell history is. Let’s see all the (ultimately useless) things that were tried (with commentary):
2025-03-19 14:18  yarn test --help
2025-03-19 14:20  yarn test --verbose
2025-03-19 14:21  git diff --staged
2025-03-19 14:25  vim README.md                    # Did I miss some setup?
2025-03-19 14:28  i3lock -c 336699                 # "I need a drink"
2025-03-19 14:34  yarn test --debug                # Debug, verbose, what's the diff
2025-03-19 14:35  yarn backstage-cli repo test     # Maybe if I invoke it directly ...
2025-03-19 14:36  yarn backstage-cli --version     # Nope, same as mengnan's
2025-03-19 14:36  yarn backstage-cli repo --help
2025-03-19 14:36  yarn backstage-cli repo test --since HEAD~1   # Minimal changes?
2025-03-19 14:36  yarn backstage-cli repo test --since HEAD     # Uhh idk no changes???
2025-03-19 14:38  yarn backstage-cli repo test plugins          # The first breakthrough. More on this later
2025-03-19 14:39  n all tests.\n › Press f to run only failed tests.\n › Press o to only run tests related to changed files.\n › Pres
filter by a filename regex pattern.\n › Press t to filter by a test name regex pattern.\n › Press q to quit watch mode.\n › Press Ent
rigger a test run all tests.\n › Press f to run only failed tests.\n › Press o to only run tests related to changed files.\n › Press
lter by a filename regex pattern.\n › Press t to filter by a test name regex pattern.\n › Press q to quit watch mode.\n › Press Enter
gger a test ru                                     # Got too excited and pasted rubbish
2025-03-19 14:44  ls -a | fgrep log
2025-03-19 14:44  find | fgrep log                 # Maybe it leaves a log file?
2025-03-19 14:46  yarn backstage-cli repo test --verbose --debug --no-cache plugins    # "clear cache"
2025-03-19 14:52  yarn backstage-cli repo test --no-cache --runInBand .                # No parallel
2025-03-19 15:00  yarn backstage-cli repo test --jest-help
2025-03-19 15:03  yarn backstage-cli repo test --resetMocks --resetModules plugins     # I have no idea what I'm resetting
The first real breakthrough was test plugins, which runs only tests matching “plugins”. This effectively bypassed the “determining suites to run…” logic, which was the thing that was hanging. So, I am now able to get tests to run. However, these too eventually crash with the same cryptic [Error]:
PASS   @cloudflare/backstage-components  plugins/backstage-components/src/components/Cards/TeamMembersListCard/TeamMembersListCard.test.tsx (6.787 s)
PASS   @cloudflare/backstage-components  plugins/backstage-components/src/components/Cards/ClusterDependencyCard/ClusterDependencyCard.test.tsx
PASS   @internal/plugin-software-excellence-dashboard  plugins/software-excellence-dashboard/src/components/AppDetail/AppDetail.test.tsx
PASS   @cloudflare/backstage-entities  plugins/backstage-entities/src/AccessLinkPolicy.test.ts


  ● Test suite failed to run

thrown: [Error]
Re-running it or matching different tests will give slightly different run logs, but they always end with the same error.
By now, I’ve figured out that yarn test is actually backed by Jest, a JavaScript testing framework, so my next strategy is simply trying different Jest flags to see what sticks, but invariably, none do:
2025-03-19 15:16  time yarn test --detectOpenHandles plugins
2025-03-19 15:18  time yarn test --runInBand .
2025-03-19 15:19  time yarn test --detectLeaks .
2025-03-19 15:20  yarn test --debug aetsnuheosnuhoe
2025-03-19 15:21  yarn test --debug --no-watchman nonexisis
2025-03-19 15:21  yarn test --jest-help
2025-03-19 15:22  yarn test --debug --no-watch ooooooo > ~/jest.config
A pattern finally emerges
Eventually, after re-running it so many times, I started to notice a pattern. So by default after a test run, Jest drops you into an interactive menu where you can (Q)uit, Run (A)ll tests, etc. and I realized that Jest would eventually crash, even if it’s idling in the menu. I started timing the runs, which led me to the second breakthrough:
› Press q to quit watch mode.
 › Press Enter to trigger a test run.


  ● Test suite failed to run

thrown: [Error]

error Command failed with exit code 1.
info Visit https://yarnpkg.com/en/docs/cli/run for documentation about this command.
yarn test .  109.96s user 14.21s system 459% cpu 27.030 total
RUNS   @cloudflare/backstage-components  plugins/backstage-components/src/components/Cards/TeamRoles/CustomerSuccessCard.test.tsx
 RUNS   @cloudflare/backstage-app  packages/app/src/components/catalog/EntityFipsPicker/EntityFipsPicker.test.tsx

Test Suites: 2 failed, 23 passed, 25 of 65 total
Tests:       217 passed, 217 total
Snapshots:   0 total
error Command failed with exit code 1.
info Visit https://yarnpkg.com/en/docs/cli/run for documentation about this command.
yarn test .  110.85s user 14.04s system 463% cpu 26.974 total
No matter what Jest was doing, it always crashes after almost exactly 27 wallclock seconds. It literally didn’t matter what tests I selected or re-ran. Even the original problem, a bare yarn test (no tests selected, just hangs), will crash after 27 seconds:
Determining test suites to run...

  ● Test suite failed to run

thrown: [Error]

error Command failed with exit code 1.
info Visit https://yarnpkg.com/en/docs/cli/run for documentation about this command.
yarn test  2.05s user 0.71s system 10% cpu 27.094 total
Obviously, some sort of timeout. 27 seconds is kind of a weird number (unlike, say, 5 seconds or 60 seconds) but let’s try:
How about something like 20+7 or even 20+5+2? Nope.
Googling/GPT-4oing for “jest timeout 27 seconds” again yielded nothing useful. Far more people were having problems with testing asynchronously, or getting their tests to timeout, than with Jest proper.
At this time, my colleague came back from his call, and with his help we determined some other things:
his system (MacOS) is not affected at all versus mine (Linux)
I can reproduce it on a clean clone of github.com/backstage/backstage. The tests seem to progress further, about 50+ seconds. This lends credence to a running theory that the filesystem crawler/watcher is the one crashing, and backstage/backstage is a bigger repo than the internal Cloudflare instance, so it takes longer.
I next went on a little detour to grab another colleague who I know has been working on a Next.js project. He’s one of the few other people nearby who knows anything about Node.js. In my experience with troubleshooting it’s helpful to get multiple perspectives, so we can cover each other’s blind spots and avoid tunnel vision.
I then tried invoking many yarn tests in parallel, and I did manage to get the crash time to stretch out to 28 or 29 seconds if the system was under heavy load. So this tells me that it might not be a hard timeout but rather processing driven. A series of sleeps chugging along perhaps?
By now, there is a veritable crowd of curious onlookers gathered in front of my terminal marveling at the consistent 27 seconds crash and trading theories. At some point, someone asked if I had tried rebooting yet, and I had to sheepishly reply that I haven’t but “I’m absolutely sure it wouldn’t help whatsoever”.
And the astute reader can already guess that rebooting did nothing at all, or else this wouldn’t even be a story worth telling. Besides, haven’t I teased in the clickbaity title about some crazy Steam Locomotive from 1993?
Strace to the rescue
My colleague then put us back on track and suggested strace, and I decided to trace the simpler case of the idling menu (rather than trace running tests, which generated far more syscalls).
Watch Usage
 › Press a to run all tests.
 › Press f to run only failed tests.
 › Press o to only run tests related to changed files.
 › Press p to filter by a filename regex pattern.
 › Press t to filter by a test name regex pattern.
 › Press q to quit watch mode.
 › Press Enter to trigger a test run.
[], 1024, 1000)          = 0
openat(AT_FDCWD, "/proc/self/stat", O_RDONLY) = 21
read(21, "42375 (node) R 42372 42372 11692"..., 1023) = 301
close(21)                               = 0
epoll_wait(13, [], 1024, 0)             = 0
epoll_wait(13, [], 1024, 999)           = 0
openat(AT_FDCWD, "/proc/self/stat", O_RDONLY) = 21
read(21, "42375 (node) R 42372 42372 11692"..., 1023) = 301
close(21)                               = 0
epoll_wait(13, [], 1024, 0)             = 0
epoll_wait(13,
It basically epoll_waits until 27 seconds are up and then, right when the crash happens:
I don’t know about you, but sometimes I look at straces and wonder “Do people actually read this gibberish?” Fortunately, in the modern generative AI era, we can count on GPT-4o to gently chide: the process was interrupted EINTR by its child SIGCHLD, which means you forgot about the children, silly human. Is the problem with one of the cars rather than the engine?
Following this train of thought, I now re-ran with strace --follow-forks, which revealed a giant flurry of activity that promptly overflowed my terminal buffer. The investigation is really gaining steam now. The original trace weighs in at a hefty 500,000 lines, but here is a smaller equivalent version derived from a clean instance of backstage: trace.log.gz. I have uploaded this trace here because the by-now overhyped Steam Locomotive is finally making its grand appearanceand I know there’ll be people who’d love nothing more than to crawl through a haystack of system calls looking for a train-sized needle. Consider yourself lucky, I had to do it without even knowing what I was looking for, much less that it was a whole Steam Locomotive.
This section is left intentionally blank to allow locomotive enthusiasts who want to find the train on their own to do so first.
Remember my comment about straces being gibberish? Actually, I was kidding. So there are a few ways to make it more manageable, and with experience you’ll learn which system calls to pay attention to, such as execve, chdir, open, read, fork, and signals, and which ones to skim over, such as mprotect,mmap, and futex.
Since I’m writing this account after the fact, let’s cheat a little and assume I was super smart and zeroed in on execve correctly on the first try:
🌈  ~  zgrep execve trace.log.gz | head
execve("/home/yew/.nvm/versions/node/v18.20.6/bin/yarn", ["yarn", "test", "steam-regulator"], 0x7ffdff573148 /* 72 vars */) = 0
execve("/home/yew/.pyenv/shims/node", ["node", "/home/yew/.nvm/versions/node/v18"..., "test", "steam-regulator"], 0x7ffd64f878c8 /* 72 vars */) = -1 ENOENT (No such file or directory)
execve("/home/yew/.pyenv/bin/node", ["node", "/home/yew/.nvm/versions/node/v18"..., "test", "steam-regulator"], 0x7ffd64f878c8 /* 72 vars */) = -1 ENOENT (No such file or directory)
execve("/home/yew/repos/secrets/bin/node", ["node", "/home/yew/.nvm/versions/node/v18"..., "test", "steam-regulator"], 0x7ffd64f878c8 /* 72 vars */) = -1 ENOENT (No such file or directory)
execve("/home/yew/.nvm/versions/node/v18.20.6/bin/node", ["node", "/home/yew/.nvm/versions/node/v18"..., "test", "steam-regulator"], 0x7ffd64f878c8 /* 72 vars */) = 0
[pid 49307] execve("/bin/sh", ["/bin/sh", "-c", "backstage-cli repo test resource"...], 0x3d17d6d0 /* 156 vars */ <unfinished ...>
[pid 49307] <... execve resumed>)   	= 0
[pid 49308] execve("/home/yew/cloudflare/repos/backstage/node_modules/.bin/backstage-cli", ["backstage-cli", "repo", "test", "steam-regulator"], 0x5e7ef80051d8 /* 156 vars */ <unfinished ...>
[pid 49308] <... execve resumed>)   	= 0
[pid 49308] execve("/tmp/yarn--1742459197616-0.9027914591640542/node", ["node", "/home/yew/cloudflare/repos/backs"..., "repo", "test", "steam-regulator"], 0x7ffcc18af270 /* 156 vars */) = 0
🌈  ~  zgrep execve trace.log.gz | wc -l
2254
Phew, 2,000 is a lot of execves . Let’s get the unique ones, plus their counts:
Have you spotted the Steam Locomotive yet? I spotted it immediately because this is My Own System and Surely This Means I Am Perfectly Aware Of Everything That Is Installed Unlike, er, node_modules.
sl is actually afun little joke program from 1993 that plays on users’ tendencies to make a typo on ls. When sl runs, it clears your terminal to make way for an animated steam locomotive to come chugging through.
When I first saw that Jest was running sl so many times, my first thought was to ask my colleague if sl is a valid command on his Mac, and of course it is not. After all, which serious engineer would stuff their machine full of silly commands like sl, gti, cowsay, or toilet ? The next thing I tried was to rename sl to something else, and sure enough all my problems disappeared: yarn test started working perfectly.
So what does Jest have to do with Steam Locomotives?
Nothing, that’s what. The whole affair is an unfortunate naming clash between sl the Steam Locomotive and sl theSapling CLI. Jest wanted sl the source control system, but ended up getting steam-rolled by sl the Steam Locomotive.
At this point the main story has ended. However, there are still some unresolved nagging questions, like…
How did the crash arrive at the magic number of a relatively even 27 seconds?
I don’t know. Actually I’m not sure if a forked child executing sl still has a terminal anymore, but the travel time of the train does depend on the terminal width. The wider it is, the longer it takes:
🌈  ~  tput cols
425
🌈  ~  time sl
sl  0.19s user 0.06s system 1% cpu 20.629 total
🌈  ~  tput cols
58
🌈  ~  time sl
sl  0.03s user 0.01s system 0% cpu 5.695 total
So the first thing I tried was to run yarn test in a ridiculously narrow terminal and see what happens:
Determin
ing test
 suites
to run..
.

  ● Test
 suite f
ailed to
 run

thrown:
[Error]

error Co
mmand fa
iled wit
h exit c
ode 1.
info Vis
it https
://yarnp
kg.com/e
n/docs/c
li/run f
or docum
entation
 about t
his comm
and.
yarn tes
t  1.92s
 user 0.
67s syst
em 9% cp
u 27.088
 total
🌈  back
stage [m
aster] t
put cols

8
Alas, the terminal width doesn’t affect jest at all. Jest callssl via execa so let’s mock that up locally:
🌈  choochoo  cat runSl.mjs
import {execa} from 'execa';
const { stdout } = await execa('tput', ['cols']);
console.log('terminal colwidth:', stdout);
await execa('sl', ['root']);
🌈  choochoo  time node runSl.mjs
terminal colwidth: 80
node runSl.mjs  0.21s user 0.06s system 4% cpu 6.730 total
So execa uses the default terminal width of 80, which takes the train 6.7 seconds to cross. And 27 seconds divided by 6.7 is awfully close to 4. So is Jest running sl 4 times? Let’s do a poor man’s bpftrace by hooking into sl like so:
And if we check executed.log, sl is indeed executed in 4 waves, albeit by 5 workers simultaneously in each wave:
#wave1
2025-03-20 13:23:57.125482563 21049 started
2025-03-20 13:23:57.127526987 21666 started
2025-03-20 13:23:57.131099388 4897 started
2025-03-20 13:23:57.134237754 102 started
2025-03-20 13:23:57.137091737 15733 started
#wave1 ends, wave2 starts
2025-03-20 13:24:03.704588580 21666 ended
2025-03-20 13:24:03.704621737 21049 ended
2025-03-20 13:24:03.707780748 4897 ended
2025-03-20 13:24:03.712086346 15733 ended
2025-03-20 13:24:03.711953000 102 ended
2025-03-20 13:24:03.714831149 18018 started
2025-03-20 13:24:03.721293279 23293 started
2025-03-20 13:24:03.724600164 27918 started
2025-03-20 13:24:03.729763900 15091 started
2025-03-20 13:24:03.733176122 18473 started
#wave2 ends, wave3 starts
2025-03-20 13:24:10.294286746 18018 ended
2025-03-20 13:24:10.297261754 23293 ended
2025-03-20 13:24:10.300925031 27918 ended
2025-03-20 13:24:10.300950334 15091 ended
2025-03-20 13:24:10.303498710 24873 started
2025-03-20 13:24:10.303980494 18473 ended
2025-03-20 13:24:10.308560194 31825 started
2025-03-20 13:24:10.310595182 18452 started
2025-03-20 13:24:10.314222848 16121 started
2025-03-20 13:24:10.317875812 30892 started
#wave3 ends, wave4 starts
2025-03-20 13:24:16.883609316 24873 ended
2025-03-20 13:24:16.886708598 18452 ended
2025-03-20 13:24:16.886867725 31825 ended
2025-03-20 13:24:16.890735338 16121 ended
2025-03-20 13:24:16.893661911 21975 started
2025-03-20 13:24:16.898525968 30892 ended
#crash imminent! wave4 ending, wave5 starting...
2025-03-20 13:24:23.474925807 21975 ended
The logs were emitted for about 26.35 seconds, which is close to 27. It probably crashed just as wave4 was reporting back. And each wave lasts about 6.7 seconds, right on the money with manual measurement.
So why is Jest running sl in 4 waves? Why did it crash at the start of the 5th wave?
Let’s again modify the poor man’s bpftrace to also log the args and working directory:
From the results we can see that the 5 workers are busy executing sl root, which corresponds to the getRoot() function in jest-change-files/sl.ts
2025-03-21 05:50:22.663263304  started: root at /home/yew/cloudflare/repos/backstage/packages/app/src
2025-03-21 05:50:22.665550470  started: root at /home/yew/cloudflare/repos/backstage/packages/backend/src
2025-03-21 05:50:22.667988509  started: root at /home/yew/cloudflare/repos/backstage/plugins/access/src
2025-03-21 05:50:22.671781519  started: root at /home/yew/cloudflare/repos/backstage/plugins/backstage-components/src
2025-03-21 05:50:22.673690514  started: root at /home/yew/cloudflare/repos/backstage/plugins/backstage-entities/src
2025-03-21 05:50:29.247573899  started: root at /home/yew/cloudflare/repos/backstage/plugins/catalog-types-common/src
2025-03-21 05:50:29.251173536  started: root at /home/yew/cloudflare/repos/backstage/plugins/cross-connects/src
2025-03-21 05:50:29.255263605  started: root at /home/yew/cloudflare/repos/backstage/plugins/cross-connects-backend/src
2025-03-21 05:50:29.257293780  started: root at /home/yew/cloudflare/repos/backstage/plugins/pingboard-backend/src
2025-03-21 05:50:29.260285783  started: root at /home/yew/cloudflare/repos/backstage/plugins/resource-insights/src
2025-03-21 05:50:35.823374079  started: root at /home/yew/cloudflare/repos/backstage/plugins/scaffolder-backend-module-gaia/src
2025-03-21 05:50:35.825418386  started: root at /home/yew/cloudflare/repos/backstage/plugins/scaffolder-backend-module-r2/src
2025-03-21 05:50:35.829963172  started: root at /home/yew/cloudflare/repos/backstage/plugins/security-scorecard-dash/src
2025-03-21 05:50:35.832597778  started: root at /home/yew/cloudflare/repos/backstage/plugins/slo-directory/src
2025-03-21 05:50:35.834631869  started: root at /home/yew/cloudflare/repos/backstage/plugins/software-excellence-dashboard/src
2025-03-21 05:50:42.404063080  started: root at /home/yew/cloudflare/repos/backstage/plugins/teamcity/src
The 16 entries here correspond neatly to the 16 rootDirs configured in Jest for Cloudflare’s backstage. We have 5 trains, and we want to visit 16 stations so let’s do some simple math. 16/5.0 = 3.2 which means our trains need to go back and forth 4 times at a minimum to cover them all.
Final mystery: Why did it crash?
Let’s go back to the very start of our journey. The original [Error] thrown was actuallyfrom here and after modifying node_modules/jest-changed-files/index.js, I found that the error is shortMessage: 'Command failed with ENAMETOOLONG: sl status...‘ and the reason why became clear when I interrogated Jest about what it thinks the repos are.
While the git repo is what you’d expect, the sl “repo” looks amazingly like a train wreck in motion:
got repos.git as Set(1) { '/home/yew/cloudflare/repos/backstage' }
got repos.sl as Set(1) {
  '\x1B[?1049h\x1B[1;24r\x1B[m\x1B(B\x1B[4l\x1B[?7h\x1B[?25l\x1B[H\x1B[2J\x1B[15;80H_\x1B[15;79H_\x1B[16d|\x1B[9;80H_\x1B[12;80H|\x1B[13;80H|\x1B[14;80H|\x1B[15;78H__/\x1B[16;79H|/\x1B[17;80H\\\x1B[9;
  79H_D\x1B[10;80H|\x1B[11;80H/\x1B[12;79H|\x1B[K\x1B[13d\b|\x1B[K\x1B[14d\b|/\x1B[15;1H\x1B[1P\x1B[16;78H|/-\x1B[17;79H\\_\x1B[9;1H\x1B[1P\x1B[10;79H|(\x1B[11;79H/\x1B[K\x1B[12d\b\b|\x1B[K\x1B[13d\b|
  _\x1B[14;1H\x1B[1P\x1B[15;76H__/ =\x1B[16;77H|/-=\x1B[17;78H\\_/\x1B[9;77H_D _\x1B[10;78H|(_\x1B[11;78H/\x1B[K\x1B[12d\b\b|\x1B[K\x1B[13d\b| _\x1B[14;77H|/ |\x1B[15;75H__/
  =|\x1B[16;76H|/-=|\x1B[17;1H\x1B[1P\x1B[8;80H=\x1B[9;76H_D _|\x1B[10;77H|(_)\x1B[11;77H/\x1B[K\x1B[12d\b\b|\x1B[K\x1B[13d\b|
  _\r\x1B[14d\x1B[1P\x1B[15d\x1B[1P\x1B[16;75H|/-=|_\x1B[17;1H\x1B[1P\x1B[8;79H=\r\x1B[9d\x1B[1P\x1B[10;76H|(_)-\x1B[11;76H/\x1B[K\x1B[12d\b\b|\x1B[K\x1B[13d\b| _\r\x1B[14d\x1B[1P\x1B[15;73H__/ =|
  o\x1B[16;74H|/-=|_\r\x1B[17d\x1B[1P\x1B[8;78H=\r\x1B[9d\x1B[1P\x1B[10;75H|(_)-\x1B[11;75H/\x1B[K\x1B[12d\b\b|\x1B[K\x1B[13d\b|
  _\r\x1B[14d\x1B[1P\x1B[15d\x1B[1P\x1B[16;73H|/-=|_\r\x1B[17d\x1B[1P\x1B[8;77H=\x1B[9;73H_D _|  |\x1B[10;74H|(_)-\x1B[11;74H/     |\x1B[12;73H|      |\x1B[13;73H| _\x1B[14;73H|/ |   |\x1B[15;71H__/
  =| o |\x1B[16;72H|/-=|___|\x1B[17;1H\x1B[1P\x 1B[5;79H(@\x1B[7;77H(\r\x1B[8d\x1B[1P\x1B[9;72H_D _|  |_\x1B[10;1H\x1B[1P\x1B[11d\x1B[1P\x1B[12d\x1B[1P\x1B[13;72H| _\x1B[14;72H|/ |   |-\x1B[15;70H__/
  =| o |=\x1B[16;71H|/-=|___|=\x1B[17;1H\x1B[1P\x1B[8d\x1B[1P\x1B[9;71H_D _|  |_\r\x1B[10d\x1B[1P\x1B[11d\x1B[1P\x1B[12d\x1B[1P\x1B[13;71H| _\x1B[14;71H|/ |   |-\x1B[15;69H__/ =| o
  |=-\x1B[16;70H|/-=|___|=O\x1B[17;71H\\_/      \\\x1B[8;1H\x1B[1P\x1B[9;70H_D _|  |_\x1B[10;71H|(_)---  |\x1B[11;71H/     |  |\x1B[12;70H|      |  |\x1B[13;70H| _\x1B[80G|\x1B[14;70H|/ |
  |-\x1B[15;68H__/ =| o |=-~\x1B[16;69H|/-=|___|=\x1B[K\x1B[17;70H\\_/      \\O\x1B[8;1H\x1B[1P\x1B[9;69H_D _|  |_\r\x1B[10d\x1B[1P\x1B[11d\x1B[1P\x1B[12d\x1B[1P\x1B[13;69H| _\x1B[79G|_\x1B[14;69H|/ |
  |-\x1B[15;67H__/ =| o |=-~\r\x1B[16d\x1B[1P\x1B[17;69H\\_/      \\_\x1B[4d\b\b(@@\x1B[5;75H(    )\x1B[7;73H(@@@)\r\x1B[8d\x1B[1P\x1B[9;68H_D _|
  |_\r\x1B[10d\x1B[1P\x1B[11d\x1B[1P\x1B[12d\x1B[1P\x1B[13;68H| _\x1B[78G|_\x1B[14;68H|/ |   |-\x1B[15;66H__/ =| o |=-~~\\\x1B[16;67H|/-=|___|=   O\x1B[17;68H\\_/ \\__/\x1B[8;1H\x1B[1P\x1B[9;67H_D _|
  |_\r\x1B[10d\x1B[1P\x1B[11d\x1B[1P\x1B[12d\x1B[1P\x1B[13;67H| _\x1B[77G|_\x1B[14;67H|/ |   |-\x1B[15;65H__/ =| o |=-~O==\x1B[16;66H|/-=|___|= |\x1B[17;1H\x1B[1P\x1B[8d\x1B[1P\x1B[9;66H_D _|
  |_\x1B[10;67H|(_)---  |   H\x1B[11;67H/     |  |   H\x1B[12;66H|      |  |   H\x1B[13;66H| _\x1B[76G|___H\x1B[14;66H|/ |   |-\x1B[15;64H__/ =| o |=-O==\x1B[16;65H|/-=|___|=
  |\r\x1B[17d\x1B[1P\x1B[8d\x1B[1P\x1B[9;65H_D _|  |_\x1B[80G/\x1B[10;66H|(_)---  |   H\\\x1B[11;1H\x1B[1P\x1B[12d\x1B[1P\x1B[13;65H| _\x1B[75G|___H_\x1B[14;65H|/ | |-\x1B[15;63H__/ =| o |=-~~\\
  /\x1B[16;64H|/-=|___|=O=====O\x1B[17;65H\\_/      \\__/  \\\x1B[1;4r\x1B[4;1H\n' + '\x1B[1;24r\x1B[4;74H(    )\x1B[5;71H(@@@@)\x1B[K\x1B[7;69H(   )\x1B[K\x1B[8;68H====
  \x1B[80G_\x1B[9;1H\x1B[1P\x1B[10;65H|(_)---  |   H\\_\x1B[11;1H\x1B[1P\x1B[12d\x1B[1P\x1B[13;64H| _\x1B[74G|___H_\x1B[14;64H|/ |   |-\x1B[15;62H__/ =| o |=-~~\\  /~\x1B[16;63H|/-=|___|=
  ||\x1B[K\x1B[17;64H\\_/      \\O=====O\x1B[8;67H==== \x1B[79G_\r\x1B[9d\x1B[1P\x1B[10;64H|(_)---  |   H\\_\x1B[11;64H/     |  |   H  |\x1B[12;63H|      |  |   H  |\x1B[13;63H|
  _\x1B[73G|___H__/\x1B[14;63H|/ |   |-\x1B[15;61H__/ =| o |=-~~\\  /~\r\x1B[16d\x1B[1P\x1B[17;63H\\_/      \\_\x1B[8;66H==== \x1B[78G_\r\x1B[9d\x1B[1P\x1B[10;63H|(_)---  |
  H\\_\r\x1B[11d\x1B[1P\x1B[12;62H|      |  |   H  |_\x1B[13;62H| _\x1B[72G|___H__/_\x1B[14;62H|/ |   |-\x1B[15;60H__/ =| o |=-~~\\  /~~\\\x1B[16;61H|/-=|___|=   O=====O\x1B[17;62H\\_/      \\__/
  \\__/\x1B[8;65H==== \x1B[77G_\r\x1B[9d\x1B[1P\x1B[10;62H|(_)---  |   H\\_\r\x1B[11d\x1B[1P\x1B[12;61H|      |  |   H  |_\x1B[13;61H| _\x1B[71G|___H__/_\x1B[14;61H|/ |   |-\x1B[80GI\x1B[15;59H__/ =|
  o |=-~O=====O==\x1B[16;60H|/-=|___|=    ||    |\x1B[17;1H\x1B[1P\x1B[2;79H(@\x1B[3;74H(   )\x1B[K\x1B[4;70H(@@@@)\x1B[K\x1B[5;67H(    )\x1B[K\x1B[7;65H(@@@)\x1B[K\x1B[8;64H====
  \x1B[76G_\r\x1B[9d\x1B[1P\x1B[10;61H|(_)---  |   H\\_\x1B[11;61H/     |  |   H  |  |\x1B[12;60H|      |  |   H  |__-\x1B[13;60H| _\x1B[70G|___H__/__|\x1B[14;60H|/ |   |-\x1B[79GI_\x1B[15;58H__/ =| o
  |=-O=====O==\x1B[16;59H|/-=|___|=    ||    |\r\x1B[17d\x1B[1P\x1B[8;63H==== \x1B[75G_\r\x1B[9d\x1B[1P\x1B[10;60H|(_)---  |   H\\_\r\x1B[11d\x1B[1P\x1B[12;59H|      |  |   H  |__-\x1B[13;59H|
  _\x1B[69G|___H__/__|_\x1B[14;59H|/ |   |-\x1B[78GI_\x1B[15;57H__/ =| o |=-~~\\  /~~\\  /\x1B[16;58H|/-=|___|=O=====O=====O\x1B[17;59H\\_/      \\__/  \\__/  \\\x1B[8;62H====
  \x1B[74G_\r\x1B[9d\x1B[1P\x1B[10;59H|(_)---  |   H\\_\r\x1B  |  |   H  |__-\x1B[13;58H| _\x1B[68G|___H__/__|_\x1B[14;58H|/ |   |-\x1B[77GI_\x1B[15;56H__/ =| o |=-~~\\ /~~\\  /~\x1B[16;57H|/-=|___|=
  ||    ||\x1B[K\x1B[17;58H\\_/      \\O=====O=====O\x1B[8;61H==== \x1B[73G_\r\x1B[9d\x1B[1P\x1B[10;58H|(_)---    _\x1B[67G|___H__/__|_\x1B[14;57H|/ |   |-\x1B[76GI_\x1B[15;55H__/ =| o |=-~~\\  /~~\\
  /~\r\x1B[16d\x1B[1P\x1B[17;57H\\_/      \\_\x1B[2;75H(  ) (\x1B[3;70H(@@@)\x1B[K\x1B[4;66H()\x1B[K\x1B[5;63H(@@@@)\x1B[
Acknowledgements
Thank you to my colleagues Mengnan Gong and Shuhao Zhang, whose ideas and perspectives helped narrow down the root causes of this mystery.
It’s a big day here at Cloudflare! Not only is it Security Week, but today marks Cloudflare’s first step into a completely new area of functionality, intended to improve how our users both interact with, and get value from, all of our products.
We’re excited to share a first glance of how we’re embedding AI features into the management of Cloudflare products you know and love. Our first mission? Focus on security and streamline the rule and policy management experience. The goal is to automate away the time-consuming task of manually reviewing and contextualizing Custom Rules in Cloudflare WAF, and Gateway policies in Cloudflare One, so you can instantly understand what each policy does, what gaps they have, and what you need to do to fix them.
Meet Cloudy, Cloudflare’s first AI agent
Our initial step toward a fully AI-enabled product experience is the introduction of Cloudy, the first version of Cloudflare AI agents, assistant-like functionality designed to help users quickly understand and improve their Cloudflare configurations in multiple areas of the product suite. You’ll start to see Cloudy functionality seamlessly embedded into two Cloudflare products across the dashboard, which we’ll talk about below.
And while the name Cloudy may be fun and light-hearted, our goals are more serious: Bring Cloudy and AI-powered functionality to every corner of Cloudflare, and optimize how our users operate and manage their favorite Cloudflare products. Let’s start with two places where Cloudy is now live and available to all customers using the WAF and Gateway products.
WAF Custom Rules
Let’s begin with AI-powered overviews of WAF Custom Rules. For those unfamiliar, Cloudflare’s Web Application Firewall (WAF) helps protect web applications from attacks like SQL injection, cross-site scripting (XSS), and other vulnerabilities.
One specific feature of the WAF is the ability to create WAF Custom Rules. These allow users to tailor security policies to block, challenge, or allow traffic based on specific attributes or security criteria.
However, for customers with dozens or even hundreds of rules deployed across their organization, it can be challenging to maintain a clear understanding of their security posture. Rule configurations evolve over time, often managed by different team members, leading to potential inefficiencies and security gaps. What better problem for Cloudy to solve?
Powered by Workers AI, today we’ll share how Cloudy will help review your WAF Custom Rules and provide a summary of what’s configured across them. Cloudy will also help you identify and solve issues such as:
Identifying redundant rules: Identify when multiple rules are performing the same function, or using similar fields, helping you streamline your configuration.
Optimising execution order: Spot cases where rules ordering affects functionality, such as when a terminating rule (block/challenge action) prevents subsequent rules from executing.
Analysing conflicting rules: Detect when rules counteract each other, such as one rule blocking traffic that another rule is designed to allow or log.
Identifying disabled rules: Highlight potentially important security rules that are in a disabled state, helping ensure that critical protections are not accidentally left inactive.
Cloudy won’t just summarize your rules, either. It will analyze the relationships and interactions between rules to provide actionable recommendations. For security teams managing complex sets of Custom Rules, this means less time spent auditing configurations and more confidence in your security coverage.
Available to all users, we’re excited to show how Cloudflare AI Agents can enhance the usability of our products, starting with WAF Custom Rules. But this is just the beginning.
Cloudflare One Firewall policies
We’ve also added Cloudy to Cloudflare One, our SASE platform, where enterprises manage the security of their employees and tools from a single dashboard.
In Cloudflare Gateway, our Secure Web Gateway offering, customers can configure policies to manage how employees do their jobs on the Internet. These Gateway policies can block access to malicious sites, prevent data loss violations, and control user access, among other things.
But similar to WAF Custom Rules, Gateway policy configurations can become overcomplicated and bogged down over time, with old, forgotten policies that do who-knows-what. Multiple selectors and operators working in counterintuitive ways. Some blocking traffic, others allowing it. Policies that include several user groups, but carve out specific employees. We’ve even seen policies that block hundreds of URLs in a single step. All to say, managing years of Gateway policies can become overwhelming.
So, why not have Cloudy summarize Gateway policies in a way that makes their purpose clear and concise?
Available to all Cloudflare Gateway users (create a free Cloudflare One account here), Cloudy will now provide a quick summary of any Gateway policy you view. It’s now easier than ever to get a clear understanding of each policy at a glance, allowing admins to spot misconfigurations, redundant controls, or other areas for improvement, and move on with confidence.
Built on Workers AI
At the heart of our new functionality is Cloudflare Workers AI (yes, the same version that everyone uses!) that leverages advanced large language models (LLMs) to process vast amounts of information; in this case, policy and rules data. Traditionally, manually reviewing and contextualizing complex configurations is a daunting task for any security team. With Workers AI, we automate that process, turning raw configuration data into consistent, clear summaries and actionable recommendations.
How it works
Cloudflare Workers AI ingests policy and rule configurations from your Cloudflare setup and combines them with a purpose-built LLM prompt. We leverage the same publicly-available LLM models that we offer our customers, and then further enrich the prompt with some additional data to provide it with context. For this specific task of analyzing and summarizing policy and rule data, we provided the LLM:
Policy & rule data: This is the primary data itself, including the current configuration of policies/rules for Cloudy to summarize and provide suggestions against.
Documentation on product abilities: We provide the model with additional technical details on the policy/rule configurations that are possible with each product, so that the model knows what kind of recommendations are within its bounds.
Enriched datasets: Where WAF Custom Rules or CF1 Gateway policies leverage other ‘lists’ (e.g., a WAF rule referencing multiple countries, a Gateway policy leveraging a specific content category), the list item(s) selected must be first translated from an ID to plain-text wording so that the LLM can interpret which policy/rule values are actually being used.
Output instructions: We specify to the model which format we’d like to receive the output in. In this case, we use JSON for easiest handling.
Additional clarifications: Lastly, we explicitly instruct the LLM to be sure about its output, valuing that aspect above all else. Doing this helps us ensure that no hallucinations make it to the final output.
By automating the analysis of your WAF Custom Rules and Gateway policies, Cloudflare Workers AI not only saves you time but also enhances security by reducing the risk of human error. You get clear, actionable insights that allow you to streamline your configurations, quickly spot anomalies, and maintain a strong security posture—all without the need for labor-intensive manual reviews.
What’s next for Cloudy
Beta previews of Cloudy are live for all Cloudflare customers today. But this is just the beginning of what we envision for AI-powered functionality across our entire product suite.
Throughout the rest of 2025, we plan to roll out additional AI agent capabilities across other areas of Cloudflare. These new features won’t just help customers manage security more efficiently, but they’ll also provide intelligent recommendations for optimizing performance, streamlining operations, and enhancing overall user experience.
We’re excited to hear your thoughts as you get to meet Cloudy and try out these new AI features – send feedback to us at [email protected], or post your thoughts on X, LinkedIn, or Mastodon tagged with #SecurityWeek! Your feedback will help shape our roadmap for AI enhancement, and bring our users smarter, more efficient tooling that helps everyone get more secure.
Watch on Cloudflare TV
The collective thoughts of the interwebz
Manage Consent
To provide the best experiences, we use technologies like cookies to store and/or access device information. Consenting to these technologies will allow us to process data such as browsing behavior or unique IDs on this site. Not consenting or withdrawing consent, may adversely affect certain features and functions.
Functional
Always active
The technical storage or access is strictly necessary for the legitimate purpose of enabling the use of a specific service explicitly requested by the subscriber or user, or for the sole purpose of carrying out the transmission of a communication over an electronic communications network.
Preferences
The technical storage or access is necessary for the legitimate purpose of storing preferences that are not requested by the subscriber or user.
Statistics
The technical storage or access that is used exclusively for statistical purposes.The technical storage or access that is used exclusively for anonymous statistical purposes. Without a subpoena, voluntary compliance on the part of your Internet Service Provider, or additional records from a third party, information stored or retrieved for this purpose alone cannot usually be used to identify you.
Marketing
The technical storage or access is required to create user profiles to send advertising, or to track the user on a website or across several websites for similar marketing purposes.