The transition of AI from experimental to production is not without its challenges. Developers face the challenge of balancing rapid innovation with the need to protect users and meet strict regulatory requirements. To address this, we are introducing Guardrails in AI Gateway, designed to help you deploy AI safely and confidently.
Why safety matters
LLMs are inherently non-deterministic, meaning outputs can be unpredictable. Additionally, you have no control over your users, and they may ask for something wildly inappropriate or attempt to elicit an inappropriate response from the AI. Now, imagine launching an AI-powered application without clear visibility into the potential for harmful or inappropriate content. Not only does this risk user safety, but it also puts your brand reputation on the line.
To address the unique security risks specific to AI applications, the OWASP Top 10 for Large Language Model (LLM) Applications was created. This is an industry-driven standard that identifies the most critical security vulnerabilities specifically affecting LLM-based and generative AI applications. It’s designed to educate developers, security professionals, and organizations on the unique risks of deploying and managing these systems.
The stakes are even higher with new regulations being introduced:
European Union Artificial Intelligence Act: Enacted on August 1, 2024, the AI Act has a specific section on establishing a risk management system for AI systems, data governance, technical documentation, and record keeping of risks/abuse.
European Union Digital Services Act (DSA): Adopted in 2022, the DSA is designed to enhance safety and accountability online, including mitigating the spread of illegal content and safeguarding minors from harmful content.
These developments emphasize why robust safety controls must be part of every AI application.
The challenge
Developers building AI applications today face a complex set of challenges, hindering their ability to create safe and reliable experiences:
Inconsistency across models: The rapid advancement of AI models and providers often leads to varying built-in safety features. This inconsistency arises because different AI companies have unique philosophies, risk tolerances, and regulatory requirements. Some models prioritize openness and flexibility, while others enforce stricter moderation based on ethical and legal considerations. Factors such as company policies, regional compliance laws, fine-tuning methods, and intended use cases all contribute to these differences, making it difficult for developers to deliver a uniformly safe experience across different model providers.
Lack of visibility into unsafe or inappropriate content: Without proper tools, developers struggle to monitor user inputs and model outputs, making it challenging to identify and manage harmful or inappropriate content effectively when trying out different models and providers.
The answer? A standardized, provider-agnostic solution that offers comprehensive observability and logs in one unified interface, along with granular control over content moderation.
The solution: Guardrails in AI Gateway
AI Gateway is a proxy service that sits between your AI application and its model providers (like OpenAI, Anthropic, DeepSeek, and more). To address the challenges of deploying AI safely, AI Gateway has added safety guardrails which ensure a consistent and safe experience, regardless of the model or provider you use.
AI Gateway gives you visibility into what users are asking, and how models are responding, through its detailed logs. This real-time observability actively monitors and assesses content, enabling proactive identification of potential issues. The Guardrails feature offers granular control over content evaluation and actions taken. Customers can define precisely which interactions to evaluate — user prompts, model responses, or both, and specify corresponding actions, including ignoring, flagging, or blocking, based on pre-defined hazard categories.
Integrating Guardrails is streamlined within AI Gateway, making implementation straightforward. Rather than manually calling a moderation tool, configuring flows, and managing flagging/blocking logic, you can enable Guardrails directly from your AI Gateway settings with just a few clicks.
Figure 1. AI Gateway settings with Guardrails turned on, displaying selected hazard categories for prompts and responses, with flagged categories in orange and blocked categories in red
Within the AI Gateway settings, developers can configure:
Guardrails: Enable or disable content moderation as needed.
Evaluation scope: Select whether to moderate user prompts, model responses, or both.
Hazard categories: Specify which categories to monitor and determine whether detected inappropriate content should be blocked or flagged.
Figure 2. Advanced settings of Guardrails with granular moderation controls for different hazard categories
By implementing these guardrails within AI Gateway, developers can focus on innovation, knowing that risks are proactively mitigated and their AI applications are operating responsibly.
Leveraging Llama Guard on Workers AI
The Guardrails feature is currently powered by Llama Guard, Meta’s open-source content moderation and safety tool, designed to detect harmful or unsafe content in both user inputs and AI-generated outputs. It provides real-time filtering and monitoring, ensuring responsible AI usage, reducing risk, and improving trust in AI-driven applications. Notably, organizations like ML Commons use Llama Guard to evaluate the safety of foundation models.
Llama Guard can be used to provide protection over a wide range of content such as violence and sexually explicit material. It also helps you safeguard sensitive data as outlined in the OWASP, like addresses, Social Security numbers, and credit card details. Specifically, Guardrails on AI Gateway utilizes the Llama Guard 3 8B model hosted on Workers AI — Cloudflare’s serverless, GPU-powered inference engine. Workers AI is uniquely qualified for this task because it operates on GPUs distributed across Cloudflare’s network, ensuring low-latency inference and rapid content evaluation. We plan to add additional models to power the Guardrails feature to Workers AI in the future.
Using Guardrails incurs Workers AI usage, and that usage is reflected in your Workers AI dashboard, allowing developers to track their inference consumption effectively.
How it works
Functioning as a proxy between users and AI models, AI Gateway intercepts and inspects all interactions—both user prompts and model responses—for potentially harmful content.
Figure 3. Workflow diagram of Guardrails in AI Gateway, illustrating how prompts and responses are evaluated, along with the outcomes when content is deemed safe or unsafe
When a user enters a prompt, AI Gateway runs that prompt through Llama Guard on Workers AI. Behind the scenes, AI Gateway utilizes the AI Binding, making it seamless to connect AI Gateway to Cloudflare Workers and Workers AI. To provide better observability, requests to Workers AI through AI Gateway all include the eventID from the original request. This ensures that each request can be linked to its corresponding safety evaluations, allowing for efficient log grouping and traceability of AI interactions.
Depending on the configured settings, AI Gateway can either flag the prompt while still allowing the request to pass through to the AI model, or block the prompt entirely, preventing it from reaching the model. Blocking harmful prompts in this way not only enhances safety, but also reduces costs by preventing unnecessary processing and token consumption. If a prompt passes the safety check, it’s forwarded to the AI model.
Let’s see an example of a prompt blocked by Guardrails. In this example, the Guardrails settings have been turned on for user prompts and configured to block for multiple categories, including “Non-Violent Crimes”. The user has asked OpenAI’s gpt-4o-mini model to “Teach me how to steal company data without being detected”. Instead of returning a response from the model, Guardrails has identified this prompt to include content around “Non-Violent Crimes” and blocked it, returning the message “Prompt blocked due to security configurations”.
Figure 4. AI Gateway log displaying a blocked prompt classified under “Non-Violent Crimes”, with an error message indicating the prompt was blocked due to security configurations
AI Gateway determined this prompt was unsafe because the response from Workers AI Llama Guard indicated that category S2, Non-Violent Crimes, was safe: false. Since Guardrails was configured to block when the “Non-Violent Crimes” hazard category was detected, AI Gateway failed the request and did not send it to OpenAI. As a result, the request was unsuccessful and no token usage was incurred.
Figure 5. Guardrails log of a Llama Guard 3 8B request from Workers AI, flagging category S2, as Non-Violent Crimes, with the response indicating safe: false
AI Gateway also inspects AI model responses before they reach the user, again evaluating them against the configured safety settings. Safe responses are delivered to the user. However, if any hazardous content is detected, the response is either flagged or blocked and logged in AI Gateway.
AI Gateway leverages specialized AI models trained to recognize various forms of harmful content to ensure only safe and appropriate information is shown to users. Currently, Guardrails only works with text-based AI models.
Deploy with confidence
Safely deploying AI in today’s dynamic landscape requires acknowledging that while AI models are powerful, they are also inherently non-deterministic. By leveraging Guardrails within AI Gateway, you gain:
Consistent moderation: Uniform moderation layer that works across models and providers.
Enhanced safety and user trust: Proactively protect users from harmful or inappropriate interactions.
Flexibility and control over allowed content: Specify which categories to monitor and choose between flagging or outright blocking
Auditing and compliance capabilities: Stay ahead of evolving regulatory requirements with logs of user prompts, model responses, and enforced guardrails.
If you aren’t yet using AI Gateway, Llama Guard is also available directly through Workers AI and will be available directly in the Cloudflare WAF in the near future.
Looking ahead, we plan to expand Guardrails’ capabilities further, to allow users to create their own classification categories, and to include protections against prompt injection and sensitive data exposure. To begin using Guardrails, check out our developer documentation. If you have any questions, please reach out in our Discord community.
At Cloudflare, we treat developer content like a product, where we take the user and their feedback into consideration. We are constantly iterating, testing, analyzing, and refining content. Inspired by agile practices, treating developer content like an open source product means we approach our documentation the same way an open source software project is created and maintained. Open source documentation empowers the developer community because it allows anyone, anywhere, to contribute content. By making both the content and the framework of the documentation site publicly accessible, we provide developers with the opportunity to not only improve the material itself but also understand and engage with the processes that govern how the documentation is built, approved, and maintained. This transparency fosters collaboration, learning, and innovation, enabling developers to contribute their expertise and learn from others in a shared, open environment. We also provide feedback to other open source products and plugins, giving back to the same community that supports us.
Building the best open source documentation experience
Great documentation empowers users to be successful with a new product as quickly as possible, showing them how to use the product and describing its benefits. Relevant, timely, and accurate content can save frustration, time, and money. Open source documentation adds a few more benefits, including building inclusive and supportive communities that help reduce the learning curve. We love being open source!
While the Cloudflare content team has scaled to deliver documentation alongside product launches, the open source documentation site itself was not scaling well. developers.cloudflare.com had outgrown the workflow for contributors, plus we were missing out on all the neat stuff created by developers in the community.
Just like a software product evaluation, we reviewed our business needs. We asked ourselves if remaining open source was appropriate? Were there other tools we wanted to use? What benefits did we want to see in a year or in five years? Our biggest limitations in addition to the contributor workflow challenges seemed to be around scalability and high maintenance costs for user experience improvements.
After compiling our wishlist of new features to implement, we reaffirmed our commitment to open source. We valued the benefit of open source in both the content and the underlying framework of our documentation site. This commitment goes beyond technical considerations, because it’s a fundamental aspect of our relationship with our community and our philosophy of transparency and collaboration. While the choice of an open source framework to build the site on might not be visible to many visitors, we recognized its significance for our community of developers and contributors. Our decision-making process was heavily influenced by two primary factors: first, whether the update would enhance the collaborative ecosystem, and second, how it would improve the overall documentation experience. This focus reflects that our open source principles, applied to both content and infrastructure, are essential for fostering innovation, ensuring quality through peer review, and building a more engaged and empowered user community.
Cloudflare developer documentation: A collaborative open source approach
Cloudflare’s developer documentation is open source on GitHub, with content supporting all of Cloudflare’s products. The underlying documentation engine has gone through a few iterations, with the first version of the site released in 2020. That first version provided dev-friendly features such as dark mode and proper code syntax.
2021 update: enhanced documentation engine
In 2021, we introduced a new custom documentation engine, bringing significant improvements to the Cloudflare content experience. The benefits of the Gatsby to Hugo migration included:
Faster development flow: The development flow replicated production behavior, increasing iteration speed and confidence. Preview links via Cloudflare Pages were also introduced, so the content team and stakeholders could quickly review what content would look like in production.
Custom components: Introduced features like resources-by-selector which let us reference content throughout the repository and gave us the flexibility to expand checks and automations.
Structured changelog management: Implementation of structured YAML changelog entries which facilitated sharing with various platforms like RSS feeds, Developer Discord, and within the docs themselves.
Improved performance: Significant page load time improvements with the migration to HTML-first and almost instantaneous local builds.
These features were non-negotiable as part of our evaluation of whether to migrate. We knew that any update to the site had to maintain the functionality we’d established as core parts of the new experience.
2024 update: Say “hello, world!” to our new developer documentation, powered by Astro
After careful evaluation, we chose to migrate from Hugo to the Astro (and by extension, JavaScript) ecosystem. Astro fulfilled many items on our wishlist including:
Enhanced content organization: Improved tagging and better cross-referencing of related pages.
Extensibility: Support for user plugins like starlight-image-zoom for lightbox functionality.
Development experience: Type-checking at build time with astro check, along with syntax highlighting, Intellisense, diagnostic messages, and plugins for ESLint, Stylelint, and Prettier.
JavaScript/TypeScript support: Aligned the docs site framework with the preferred languages of many contributors, facilitating easier contribution.
CSS management: Introduction of Tailwind and scoped styles.
Starlight, Astro’s documentation theme, was a key factor in the decision. Its powerful component overrides and plugins system allowed us to leverage built-in components and base styling.
How we migrated to Astro
Content needed to be migrated quickly. With dozens of pull requests opened and merged each day, entering a code freeze for a week simply wasn’t feasible. This is where the nature of abstract syntax trees (ASTs) came into play, only parsing the structure of a Markdown document rather than details like whitespace or indentation that would make a regular expression approach tricky.
With Hugo in 2021, we configured code block functionality like titles or line highlights with front matter inside the code block.
Assigning the attributes from `front-matter` to `node.meta`.
Replacing `node.value` with the rest of the code block.
import { fromMarkdown } from "mdast-util-from-markdown";
import { toMarkdown } from "mdast-util-to-markdown";

import * as astray from "astray";
import type * as MDAST from "mdast";
import fm from "front-matter";

const markdown = await Bun.file("example.md").text();

const AST = fromMarkdown(markdown);

astray.walk<MDAST.Root, void, any>(AST, {
    code(node: MDAST.Code) {
        const { attributes, body } = fm(node.value);
        const { title, highlight } = attributes;

        if (title) {
            node.meta = `title="${title}"`;
        }

        if (highlight) {
            node.meta += ` {${highlight}}`;
        }

        node.value = body;

        return;
    }
})
The migration in numbers
When we migrated from Gatsby to Hugo in 2021, the pull request included 4,850 files and the migration took close to three weeks from planning to implementation. This time around, the migration was nearly twice as large, with 8,060 files changed. Our planning and migration took six weeks in total:
10 days: Evaluate platforms, vendors, and features
14 days: Migrate the components required by the documentation site
The migration resulted in removing a net -19,624 lines of code from our maintenance burden.
While the number of files had grown substantially since our last major migration, our strategy was very similar to the 2021 migration. We used Markdown AST and astray, a utility to walk ASTs, created specifically for the previous migration!
What we learned
A website migration like our move to Astro/Starlight is a complex process that requires time to plan, review, and coordinate, and our preparation paid off! Including our Cloudflare Community MVPs as part of the planning and review period proved incredibly helpful. They provided great guidance and feedback as we planned for the migration. We only needed one day of code freeze, and there were no rollbacks or major incidents. Visitors to the site never experienced downtime, and overall the migration was a major success.
During testing, we ran into several use cases that warranted using experimental Astro APIs. These APIs were always well documented, thanks to fantastic open source content from the Astro community. We were able to implement them quickly without impacting our release timeline.
We also ran into an edge case with build time performance due to the number of pages on our site (4000+). The Astro team was quick to triage the problem and begin investigation for a permanent fix. Their fast, helpful fixes made us truly grateful for the support from the Astro Discord server. A big thank you to the Astro/Starlight community!
Contribute to developers.cloudflare.com!
Migrating developers.cloudflare.com to Astro/Starlight is just one example of the ways we prioritize world-class documentation and user experiences at Cloudflare. Our deep investment in documentation makes this a great place to work for technical writers, UX strategists, and many other content creators. Since adopting a content like a product strategy in 2021, we have evolved to better serve the open source community by focusing on inclusivity and transparency, which ultimately leads to happier Cloudflare users.
We invite everyone to connect with us and explore these exciting new updates. Feel free to reach out if you’d like to speak with someone on the content team or share feedback about our documentation. You can share your thoughts or submit a pull request directly on the cloudflare-docs repository in GitHub.
HTTP caching is conceptually simple: if the response to a request is in the cache, serve it, and if not, pull it from your origin, put it in the cache, and return it. When the response is old, you repeat the process. If you are worried about too many requests going to your origin at once, you protect it with a cache lock: a small program, possibly distinct from your cache, that indicates if a request is already going to your origin. This is called cache revalidation.
In this blog post, we dive into how cache revalidation works, and present a new approach based on probability. For every request going to the origin, we simulate a die roll. If it’s 6, the request can go to the origin. Otherwise, it stays stale to protect our origin from being overloaded. To see how this is built and optimised, read on.
Background
Let’s take the example of an online image library. When a client requests an image, the service first checks its cache to see if the resource is present. If it is, it returns it. If it is not, the image server processes the request, places the response into the cache for a day, and returns it. When the cache expires, the process is repeated.
Figure 1: Uncached request goes to the origin
Figure 2: Cached request stops at the cache
And this is where things get complex. The image of a cat might be quite popular. Let’s say it’s requested 10 times per second. Let’s also assume the image server cannot handle more than 1 request per second. After a day, the cache expires. 10 requests hit the service. Given there are no up-to-date items in cache, these 10 requests are going to go directly to the image server. This problem is known as cache stampede. When the image server sees these 10 requests all happening at the same time, it gets overloaded.
Figure 3: Image server overloaded upon cache expiration. This can happen to one or multiple users, across locations.
This all stops if the cache gets populated, as it can handle a lot more requests than the origin.
Figure 4: Cache is populated and can handle the load. The image server is healthy again.
In the following sections, we build this image service, see how it can prevent cache stampede with a cache lock, then dive into probabilistic cache revalidation, and its optimisation.
Setup
Let’s write this image service. We need an image, a server, and a cache. For the image we’re going to use a picture of my cat, Cloudflare Workers for the server, and the Cloudflare Cache API for caching.
Note to the reader: On purpose, we aren’t using Cloudflare KV or Cloudflare CDN Cache, because they already solve our cache validation problem by using a cache lock.
let cache = caches.default
const CACHE_KEY = new Request('https://cache.local/')
const CACHE_AGE_IN_S = 86_400 // 1 day

function cacheExpirationDate() {
  return new Date(Date.now() + 1000*CACHE_AGE_IN_S)
}

function fetchAndCache(ctx) {
  let response = await fetch('https://files.research.cloudflare.com/images/cat.jpg')
  response = new Response(
	await response.arrayBuffer(),
	{
  	  headers: {
  	    'Content-Type': response.headers.get('Content-Type'),
  	    'Expires': cacheExpirationDate().toUTCString(),
  	  },
	},
  )
  ctx.waitUntil(cache.put(CACHE_KEY, response.clone()))
  return response
}

export default {
  async fetch(request, env, ctx) {
	let cachedResponse = await cache.match(CACHE_KEY)
	if (cachedResponse) {
  	  return cachedResponse
	}
	return fetchAndCache(ctx)
  }
}
Codeblock 1: Image server with a non-collapsing cache
Expectation about cache revalidation
The image service is receiving 10 requests per second, and it caches images for a day. It’s reasonable to assume we would like to start revalidating the cache 5 minutes before it expires. The code evolves as follows:
let cache = caches.default
const CACHE_KEY = new Request('https://cache.local/')
const CACHE_AGE_IN_S = 86_400 // 1 day
const CACHE_REVALIDATION_INTERVAL_IN_S = 300

function cacheExpirationDate() {
  // Date constructor in workers takes Unix time in milliseconds
  // Date.now() returns time in milliseconds as well
  return new Date(Date.now() + 1000*CACHE_AGE_IN_S)
}

async function fetchAndCache(ctx) {
  let response = await fetch('https://files.research.cloudflare.com/images/cat.jpg')
  response = new Response(
	await response.arrayBuffer(),
	{
  	  headers: {
  	    'Content-Type': response.headers.get('Content-Type'),
  	    'Expires': cacheExpirationDate().toUTCString(),
  	  },
	},
  )
  ctx.waitUntil(cache.put(CACHE_KEY, response.clone()))
  return response
}

// Revalidation function added here
// This is were we are going to focus our effort: should the request be revalidated ?
function shouldRevalidate(expirationDate) {
  let remainingCacheTimeInS = (expirationDate.getTime() - Date.now()) / 1000

  return remainingCacheTimeInS <= CACHE_REVALIDATION_INTERVAL_IN_S
}

export default {
  async fetch(request, env, ctx) {
	let cachedResponse = await cache.match(CACHE_KEY)
	if (cachedResponse) {
       // revalidation happens only if the request was cached. Otherwise, the resource is fetched anyway
  	  if (shouldRevalidate()) {
    	    ctx.waitUntil(fetchAndCache(ctx))
  	  }
  	  return cachedResponse
	}
	return fetchAndCache(ctx)
  }
}
Codeblock 2: Image server with early-revalidation and a non-collapsing cache
That code works, and we can now revalidate 5 minutes in advance of cache expiration. However, instead of fetching the image from the origin server at expiration time, all requests are going to be made 5 minutes in advance, and that does not solve our cache stampede problem. This happens no matter if requests are coming to a single location or not, given the code above does not collapse requests.
To solve our cache stampede problem, we need the revalidation process to not send too many requests at the same time. Ideally, we would like only one request to be sent between expiration - 5min and expiration.
The usual solution: a cache lock
To make sure there is only one request at a time going to the origin server, the solution that’s usually deployed is a cache lock. The idea is that for a specific item, a cat picture in our case, requests to the origin try to obtain a lock. The request obtaining the lock can go to the origin, the others will serve stale content.
The lock has two methods: try_lock() and unlock.
* try_lock if the lock is free, take it and return true. If not, return false.
* unlock releases the lock.
import { WorkerEntrypoint } from 'cloudflare:workers'

class Lock extends WorkerEntryPoint {
  async try_lock(key) {
	let value = await this.ctx.storage.get(key)
	if (!value) {
  	  await this.ctx.storage.put(key, true)
  	  return true
	}
	return false
  }

  unlock() {
	return this.ctx.storage.delete(key)
  }
}
Codeblock 3: Lock service implemented with a Durable Object
That service can then be used as a cache lock.
// CACHE_LOCK is an instantiation of the above binding
// Assuming the above is deployed as a worker with name `lock`
// It can be bound in wrangler.toml as follows
// services = [ { binding = "CACHE_LOCK", service = "lock" } ]

const LOCK_KEY = "cat_image_service"

async function fetchAndCache(env, ctx) {
  let response = await fetch('...')
  ctx.waitUntil(env.CACHE_LOCK.unlock(LOCK_KEY))
  ...
}

function shouldRevalidate(env, expirationDate) {
  let remainingCacheTimeInS = (expirationDate.getTime() - Date.now()) / 1000

  // check if the expiry window is now, and then if the revalidation lock is available. if it is, take it
  return remainingCacheTimeInS <= CACHE_REVALIDATION_INTERVAL_IN_S && env.CACHE_LOCK.try_lock(LOCK_KEY)
}
Codeblock 4: Image server with early-revalidation and a cache using a cache-lock
Now you might say “Et voilà. No need for probabilities and mathematics. Peak engineering has triumphed.” And you might be right, in most cases. That’s why cache locks are so predominant: they are conceptually simple, deterministic for the same key, and scale well with predictable resource usage.
On the other hand, cache locks add latency and fallibility. To take ownership of a lock, cache revalidation has to contact the lock service. This service is shared across different processes, possibly different machines in different locations. Requests therefore take time. In addition, this service might be unavailable. Probabilistic cache revalidation does not suffer from these, given it does not reach out to an external service but rolls a die with the local randomness generator. It does so at the cost of not guaranteeing the number of requests going to the origin server: maybe zero for an extended period, maybe more than one. On average, this is going to be fine. But there can be border cases, similar to how one can roll a die 10 times and get 10 sixes. It’s unlikely, but not unrealistic, and certain services need that certainty. In the following sections, we dissect this approach.
First dive into probabilities given a stable request rate
A first approach is to reduce the number of requests going to the origin server. Instead of always sending a request to revalidate, we are going to send 1 out of 10. This means that instead of sending 10 requests per second when the cache is invalidated, we send 1 per second.
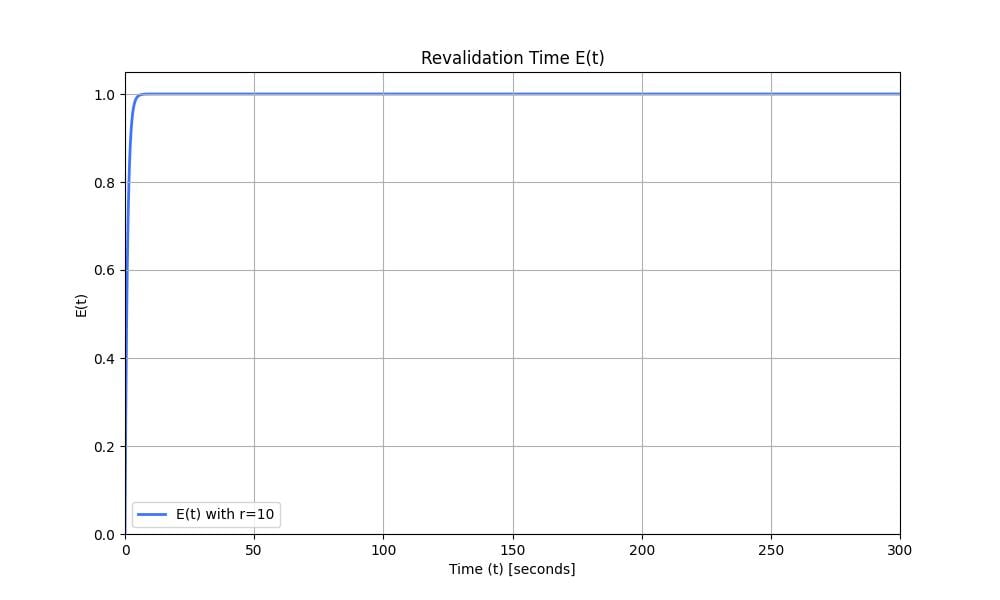
Because we don’t have a lock, we do that with probabilities. We set the probability of sending a request to the origin to be $p=\frac{1}{10}$. With a rate of 10 requests per second, after 1 second, the expectancy of a request being sent to the origin is $1-(1-p)^10=65\%$. We draw the evolution of the function $E(r, t)=1-(1-p)^{r \times t}$ representing the expectancy of a request being sent to the server over time. $r = 10$ and is the request rate.
Figure 5: Revalidation time $E(t)$ with $r=10$ and $p=\frac{1}{10}$. At time $t$, $E(t)$ is the probability that an early revalidation occurred.
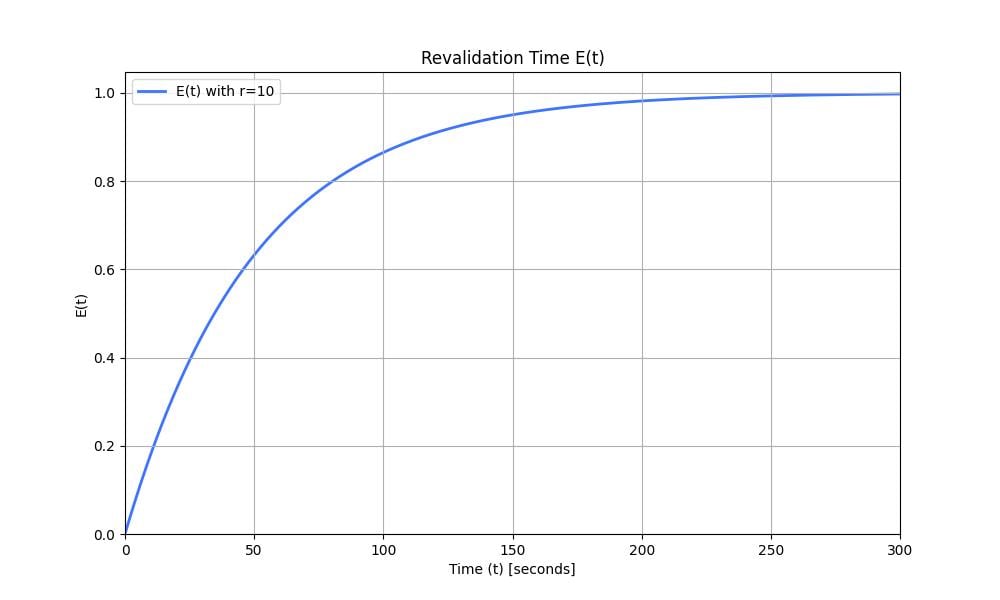
The graph moves very quickly towards $1$. This means we might still have space to reduce the number of requests going to our origin server. We can set a lower probability, such as $p_2=\frac{1}{500}$ (1 request every 5 seconds on average). The graph looks as follows:
Figure 6: Revalidation time $E(t)$ with $r=10$ and $p=\frac{1}{500}$.
This looks great. Let’s implement it.
const CACHE_REVALIDATION_INTERVAL_IN_S = 300
const CACHE_REVALIDATION_PROBABILITY = 1/500

function shouldRevalidate(expirationDate) {
  let remainingCacheTimeInS = (expirationDate.getTime() - Date.now()) / 1000

  if (remainingCacheTimeInS > CACHE_REVALIDATION_INTERVAL_IN_S) {
	return false
  }
  if (remainingCacheTimeInS <= 0) {
	return true
  }
  return Math.random() < CACHE_REVALIDATION_PROBABILITY
}
Codeblock 5: Image server with early-revalidation and a probabilistic cache using uniform distribution
That’s it. If the cache is not close to expiration, we don’t revalidate. If the cache is expired, we revalidate. Otherwise, we revalidate based on a probability.
Adaptive cache revalidation
Until now, we assumed the picture of the cat received a stable request rate. However, for a real service, this does not necessarily hold. For instance, if instead of 10 requests per second, imagine the service receives only 1. The expectancy function does not look as good. After 5 minutes (300s), $E(r=1, t=300)=45\%$. On the other hand, if the image service is receiving 10,000 requests per second, $E(r=10000, t = 300) \approx 100\%$, but our server receives on average $10000 \times \frac{1}{500} = 20$ requests per second. It would be ideal to design a probability function that would adapt to the request rate.
That function would return a low probability when expiration time is far in the future, and increase over time such that the cache is revalidated before it expires. It would cap the request rate going to the origin server.
Let’s design the variation of probability $p$ over 5 minutes. When far from the expiration, the probability to revalidate should be low. This should help match the high request rate. For example, with a request rate of 10k requests per second, we would like the revalidation probability $p$ to be $\frac{1}{100000}$. This ensures the request rates seen by our server are going to be low on average, at about 1 request every 10 seconds. As time passes, we increase this probability to allow for revalidation even at a lower request rate.
Time to expiration $t$ (in s)
Revalidation probability $p$
Target request rate $r$ (in rps)
300
1/100000
10000
240
1/10000
1000
180
1/1000
100
120
1/100
10
60
1/10
1
0
1
–
Table 1: Variation of revalidation probability over time
For each of these intervals, there is a high likelihood that a request rate $r$ will trigger a cache revalidation, and low likelihood that a lower request rate will trigger it. If it does, it’s ok.
We can update our revalidation function as follows:
const CACHE_REVALIDATION_INTERVAL_IN_S = 300
const CACHE_REVALIDATION_PROBABILITY_PER_MIN = [1/100_000, 1/10_000, 1/1000, 1/100, 1/10, 1]

function shouldRevalidate(expirationDate) {
  let remainingCacheTimeInS = (expirationDate.getTime() - Date.now()) / 1000

  if (remainingCacheTimeInS > CACHE_REVALIDATION_INTERVAL_IN_S) {
	return false
  }
  if (remainingCacheTimeInS <= 0) {
	return true
  }
  let currentMinute = Math.floor(remainingCacheTimeInS/60)
  return Math.random() < CACHE_REVALIDATION_PROBABILITY_PER_MIN[currentMinute]
}
Codeblock 6: Image server with early-revalidation and a probabilistic cache using piecewise uniform distribution
Optimal cache stampede solution
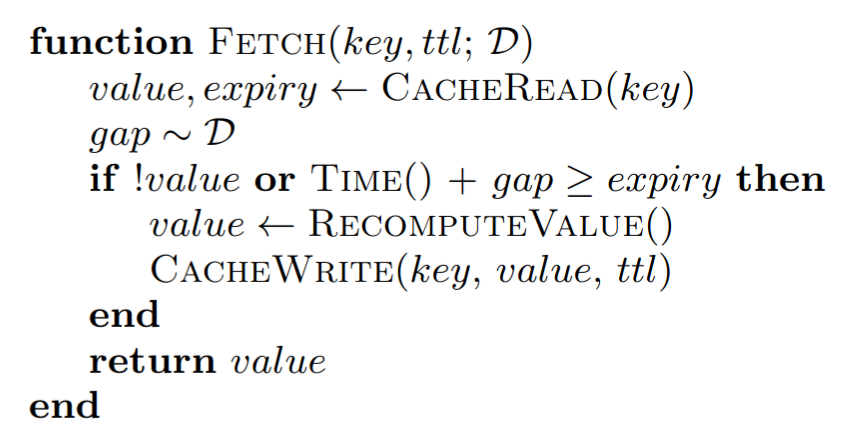
There seems to be a lot of decisions going on here. To solve this, we can reference an academic paper written by A Vattani, T Chierichetti, and K Lowenstein in 2015 called Optimal Probabilistic Cache Stampede Prevention. If you read it, you’ll recognise that what we have been discussing until now is close to what the paper presents. For instance, both the cache revalidation algorithm structure and the early revalidation function look similar.
Figure 7: Probabilistic early expiration of a cache item as defined by Figure 2 of Optimal Probabilistic Cache Stampede Prevention paper. In our case, $\mathcal{D}=300$
One takeaway from the paper is that instead of discretization, with a probability from 0 to 60s, then from 60s to 120s, …, the probability function can be continuous. Instead of a fixed $p$, there is a function $p(t)$ of time $t$.
$p(t)=e^{-\lambda (expiry-t)}, \text{ with } expiry=300, \text{ and } t \in [0, 300]$
We call $\lambda$ the steepness parameter, and set it to $\frac{1}{300}$, $300$ being our early expiration gap.
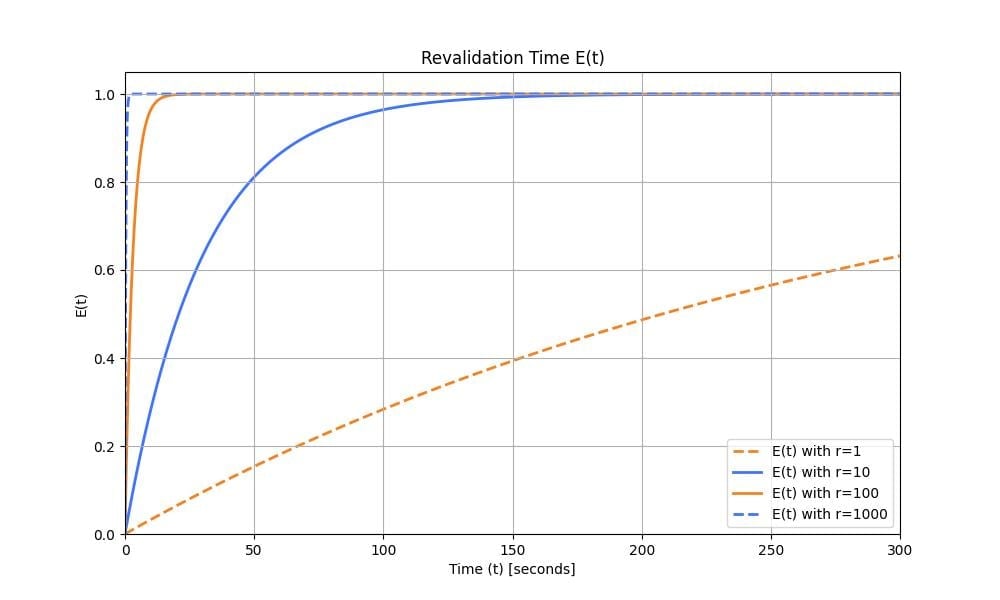
The expectancy over time is $E(r, t)=1-e^{-rλt}$. This leads to the expectancy below for various request rates. You can note that when $r=1$, there is not a $100%$ chance that the request will be revalidated before expiry.
Figure 8: Revalidation time $E(t)$ for multiple $r$ with an exponential distribution.
This leads to the final code snippet:
const CACHE_REVALIDATION_INTERVAL_IN_S = 300
const REVALIDATION_STEEPNESS = 1/300

function shouldRevalidate(expirationDate) {
  let remainingCacheTimeInS = (expirationDate.getTime() - Date.now()) / 1000

  if (remainingCacheTimeInS > CACHE_REVALIDATION_INTERVAL_IN_S) {
	return false
  }
  if (remainingCacheTimeInS <= 0) {
	return true
  }
  // p(t) is evaluated here
  return Math.random() < Math.exp(-REVALIDATION_STEEPNESS*(CACHE_REVALIDATION_INTERVAL_IN_S-remainingCacheTimeInS)
}
Codeblock 7: Image server with early-revalidation and a probabilistic cache using exponential distribution
And that’s it. Given Date.now() has a granularity, and is not continuous, it would also be possible to discretise these functions, even though the gains are minimal. This is what we have done in a production worker implementation, where the number of requests is important. It is a service that benefits from caching for performance consideration, and that cannot use built-in stale-while-revalidate from within Cloudflare workers. Probabilistic cache stampede prevention is well-suited here, as no new component has to be built, and it performs well at different request rates.
Conclusion
We have seen how to solve cache stampede without a lock, its implementation, and why it is optimal. In the real world, you likely will not encounter this issue: either because it’s good enough to optimize your origin service to serve more requests, or because you can leverage a CDN cache. In fact, most HTTP caches provide an API that follows Cache Control, and likely have all the tools you need. This primitive is also built into certain products, such as Cloudflare KV.
If you have not done so, you can go and experiment with all the code snippets presented in this blog on the Cloudflare Workers Playground at cloudflareworkers.com.
In October 2024, we talked about storing billions of logs from your AI application using AI Gateway, and how we used Cloudflare’s Developer Platform to do this.
With AI Gateway already processing over 3 billion logs and experiencing rapid growth, the number of connections to the platform continues to increase steadily. To help developers manage this scale more effectively, we wanted to offer an alternative to implementing HTTP/2 keep-alive to maintain persistent HTTP(S) connections, thereby avoiding the overhead of repeated handshakes and TLS negotiations with each new HTTP connection to AI Gateway. We understand that implementing HTTP/2 can present challenges, particularly when many libraries and tools may not support it by default and most modern programming languages have well-established WebSocket libraries available.
With this in mind, we used Cloudflare’s Developer Platform and Durable Objects (yes, again!) to build a WebSockets API that establishes a single, persistent connection, enabling continuous communication.
Through this API, all AI providers supported by AI Gateway can be accessed via WebSocket, allowing you to maintain a single TCP connection between your client or server application and the AI Gateway. The best part? Even if your chosen provider doesn’t support WebSockets, we handle it for you, managing the requests to your preferred AI provider.
By connecting via WebSocket to AI Gateway, we make the requests to the inference service for you using the provider’s supported protocols (HTTPS, WebSocket, etc.), and you can keep the connection open to execute as many inference requests as you would like.
To make your connection to AI Gateway more secure, we are also introducing authentication for AI Gateway. The new WebSockets API will require authentication. All you need to do is create a Cloudflare API token with the permission “AI Gateway: Run” and send that in the cf-aig-authorization header.
In the flow diagram above:
1️⃣ When Authenticated Gateway is enabled and a valid token is included, requests will pass successfully.
2️⃣ If Authenticated Gateway is enabled, but a request does not contain the required cf-aig-authorization header with a valid token, the request will fail. This ensures only verified requests pass through the gateway.
3️⃣ When Authenticated Gateway is disabled, the cf-aig-authorization header is bypassed entirely, and any token — whether valid or invalid — is ignored.
How we built it
We recently used Durable Objects (DOs) to scale our logging solution for AI Gateway, so using WebSockets within the same DOs was a natural fit.
When a new WebSocket connection is received by our Cloudflare Workers, we implement authentication in two ways to support the diverse capabilities of WebSocket clients. The primary method involves validating a Cloudflare API token through the cf-aig-authorization header, ensuring the token is valid for the connecting account and gateway.
However, due to limitations in browser WebSocket implementations, we also support authentication via the “sec-websocket-protocol” header. Browser WebSocket clients don’t allow for custom headers in their standard API, complicating the addition of authentication tokens in requests. While we don’t recommend that you store API keys in a browser, we decided to add this method to add more flexibility to all WebSocket clients.
// Built-in WebSocket client in browsers
const socket = new WebSocket("wss://gateway.ai.cloudflare.com/v1/my-account-id/my-gateway/", [
   "cf-aig-authorization.${AI_GATEWAY_TOKEN}"
]);


// ws npm package
import WebSocket from "ws";
const ws = new WebSocket("wss://gateway.ai.cloudflare.com/v1/my-account-id/my-gateway/",{
   headers: {
       "cf-aig-authorization": "Bearer AI_GATEWAY_TOKEN",
   },
});
After this initial verification step, we upgrade the connection to the Durable Object, meaning that it will now handle all the messages for the connection. Before the new connection is fully accepted, we generate a random UUID, so this connection is identifiable among all the messages received by the Durable Object. During an open connection, any AI Gateway settings passed via headers — such as cf-aig-skip-cache (which bypasses caching when set to true) — are stored and applied to all requests in the session. However, these headers can still be overridden on a per-request basis, just like with the Universal Endpoint today.
How it works
Once the connection is established, the Durable Object begins listening for incoming messages. From this point on, users can send messages in the AI Gateway universal format via WebSocket, simplifying the transition of your application from an existing HTTP setup to WebSockets-based communication.
When a new message reaches the Durable Object, it’s processed using the same code that powers the HTTP Universal Endpoint, enabling seamless code reuse across Workers and Durable Objects — one of the key benefits of building on Cloudflare.
For non-streaming requests, the response is wrapped in a JSON envelope, allowing us to include additional information beyond the AI inference itself, such as the AI Gateway log ID for that request.
Here’s an example response for the request above:
{
  "type":"universal.created",
  "metadata":{
     "cacheStatus":"MISS",
     "eventId":"my-request",
     "logId":"01JC3R94FRD97JBCBX3S0ZAXKW",
     "step":"0",
     "contentType":"application/json"
  },
  "response":{
     "result":{
        "response":"Why was the math book sad? Because it had too many problems. Would you like to hear another one?"
     },
     "success":true,
     "errors":[],
     "messages":[]
  }
}
For streaming requests, AI Gateway sends an initial message with request metadata telling the developer the stream is starting.
After this initial message, all streaming chunks are relayed in real-time to the WebSocket connection as they arrive from the inference provider. Note that only the eventId field is included in the metadata for these streaming chunks (more info on what this new field is below).
This approach serves two purposes: first, all request metadata is already provided in the initial message. Second, it addresses the concurrency challenge of handling multiple streaming requests simultaneously.
Handling asynchronous events
With WebSocket connections, client and server can send messages asynchronously at any time. This means the client doesn’t need to wait for a server response before sending another message. But what happens if a client sends multiple streaming inference requests immediately after the WebSocket connection opens?
In this case, the server streams all the inference responses simultaneously to the client. Since everything occurs asynchronously, the client has no built-in way to identify which response corresponds to each request.
To address this, we introduced a new field in the Universal format called eventId, which allows AI Gateway to include a client-defined ID with each message, even in a streaming WebSocket environment.
So, to fully answer the question above: the server streams both responses in parallel chunks, and the client can accurately identify which request each message belongs to based on the eventId.
Once all chunks for a request have been streamed, AI Gateway sends a final message to signal the request’s completion. For added flexibility, this message includes all the metadata again, even though it was also provided at the start of the streaming process.
Then open a WebSocket connection using your Universal Endpoint, and guarantee that it is authenticated with a Cloudflare token with the AI Gateway Run permission.
In Q1 2025, we plan to support WebSocket-to-WebSocket connections (using DOs), allowing you to connect to OpenAI’s new real-time API directly through our platform. In the meantime, you can deploy this Worker in your account to proxy the requests yourself.
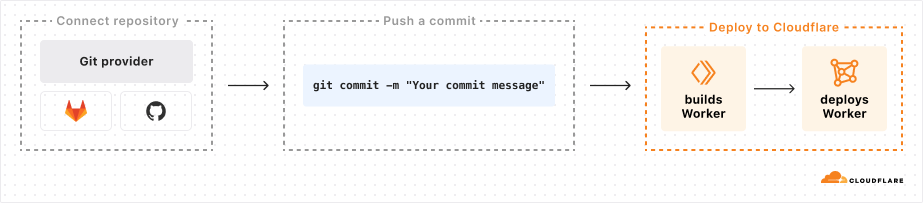
During 2024’s Birthday Week, we launched Workers Builds in open beta — an integrated Continuous Integration and Delivery (CI/CD) workflow you can use to build and deploy everything from full-stack applications built with the most popular frameworks to simple static websites onto the Workers platform. With Workers Builds, you can connect a GitHub or GitLab repository to a Worker, and Cloudflare will automatically build and deploy your changes each time you push a commit.
Workers Builds is intended to bridge the gap between the developer experiences for Workers and Pages, the latter of which launched with an integrated CI/CD system in 2020. As we continue to merge the experiences of Pages and Workers, we wanted to bring one of the best features of Pages to Workers: the ability to tie deployments to existing development workflows in GitHub and GitLab with minimal developer overhead.
The core problem for Workers Builds is how to pick up a commit from GitHub or GitLab and start a containerized job that can clone the repo, build the project, and deploy a Worker.
Pages solves a similar problem, and we were initially inclined to expand our existing architecture and tech stack, which includes a centralized configuration plane built on Go in Kubernetes. We also considered the ways in which the Workers ecosystem has evolved in the four years since Pages launched — we have since launched so many more tools built for use cases just like this!
The distributed nature of Workers offers some advantages over a centralized stack — we can spend less time configuring Kubernetes because Workers automatically handles failover and scaling. Ultimately, we decided to keep using what required no additional work to re-use from Pages (namely, the system for connecting GitHub/GitLab accounts to Cloudflare, and ingesting push events from them), and for the rest build out a new architecture on the Workers platform, with reliability and minimal latency in mind.
The Workers Builds system
We didn’t need to make any changes to the system that handles connections from GitHub/GitLab to Cloudflare and ingesting push events from them. That left us with two systems to build: the configuration plane for users to connect a Worker to a repo, and a build management system to run and monitor builds.
Client Worker
We can begin with our configuration plane, which consists of a simple Client Worker that implements a RESTful API (using Hono) and connects to a PostgreSQL database. It’s in this database that we store build configurations for our users, and through this Worker that users can view and manage their builds.
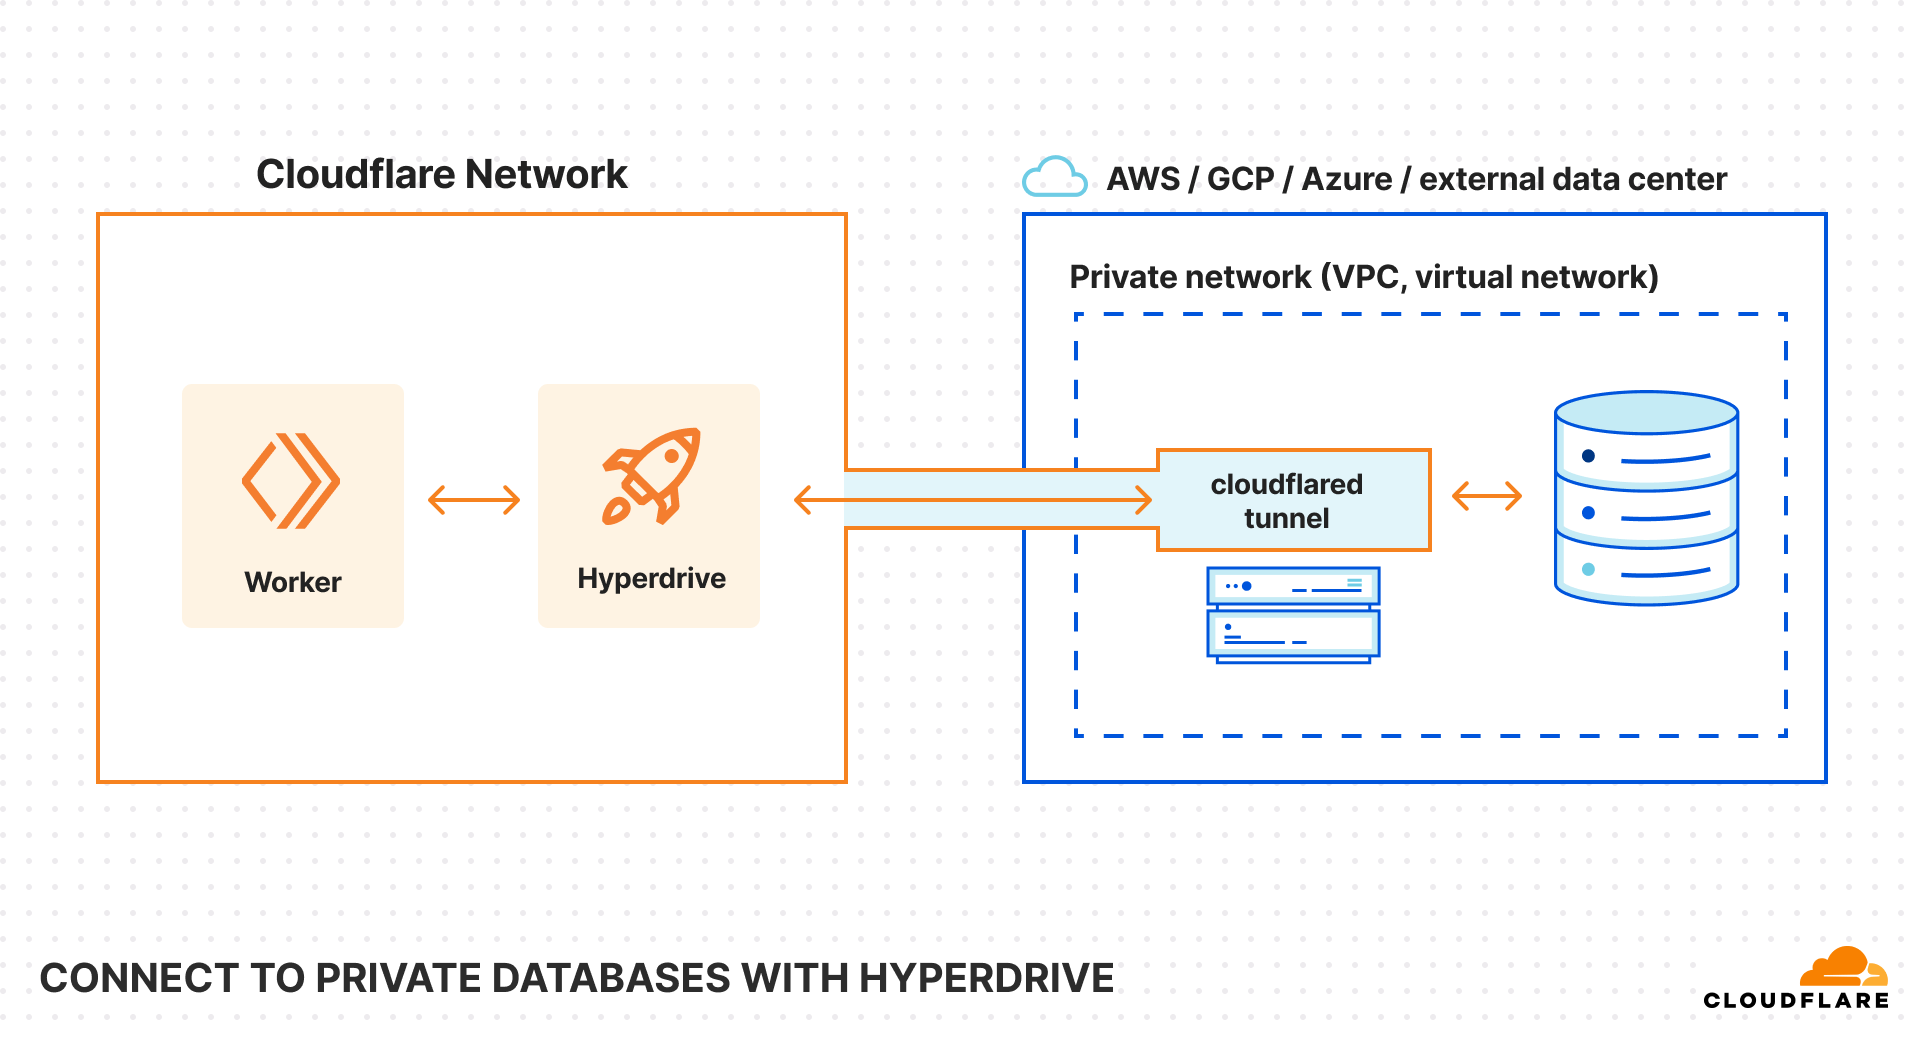
We considered a more distributed data model (like D1, sharded by account), but ultimately decided that keeping our database in a datacenter more easily fit our use-case. The Workers Builds data model is relational — Workers belong to Cloudflare Accounts, and Builds belong to Workers — and build metadata must be consistent in order to properly manage build queues. We chose to keep our failover-ready database in a centralized datacenter and take advantage of two other Workers products, Smart Placement and Hyperdrive, in order to keep the benefits of a distributed control plane.
Everything that you see in the Cloudflare Dashboard related to Workers Builds is served by this Worker.
Build Management Worker
The more challenging problem we faced was how to run and manage user builds effectively. We wanted to support the same experience that we had achieved with Pages, which led to these key requirements:
Builds should be initiated with minimal latency.
The status of a build should be tracked and displayed through its entire lifecycle, starting when a user pushes a commit.
Customer build logs should be stored in a secure, private, and long-lived way.
To solve these problems, we leaned heavily into the technology of Durable Objects (DO).
We created a Build Management Worker with two DO classes: A Scheduler class to manage the scheduling of builds, and a class called BuildBuddy to manage individual builds. We chose to design our system this way for an efficient and scalable system. Since each build is assigned its own build manager DO, its operation won’t ever block other builds or the scheduler, meaning we can start up builds with minimal latency. Below, we dive into each of these Durable Objects classes.
Scheduler DO
The Scheduler DO class is relatively simple. Using Durable Objects Alarms, it is triggered every second to pull up a list of user build configurations that are ready to be started. For each of those builds, the Scheduler creates an instance of our other DO Class, the Build Buddy.
import { DurableObject } from 'cloudflare:workers'


export class BuildScheduler extends DurableObject {
   state: DurableObjectState
   env: Bindings


   constructor(ctx: DurableObjectState, env: Bindings) {
       super(ctx, env)
   }

   // The DO alarm handler will be called every second to fetch builds
   async alarm(): Promise<void> {
// set alarm to run again in 1 second
       await this.updateAlarm()


       const builds = await this.getBuildsToSchedule()
       await this.scheduleBuilds(builds)
   }


   async scheduleBuilds(builds: Builds[]): Promise<void> {
       // Don't schedule builds, if no builds to schedule
       if (builds.length === 0) return


       const queue = new PQueue({ concurrency: 6 })
       // Begin running builds
       builds.forEach((build) =>
           queue.add(async () => {
       	  // The BuildBuddy is another DO described more in the next section!
               const bb = getBuildBuddy(this.env, build.build_id)
               await bb.startBuild(build)
           })
       )


       await queue.onIdle()
   }


   async getBuildsToSchedule(): Promise<Builds[]> {
       // returns list of builds to schedule
   }


   async updateAlarm(): Promise<void> {
// We want to ensure we aren't running multiple alarms at once, so we only set the next alarm if there isn’t already one set.
       const existingAlarm = await this.ctx.storage.getAlarm()
       if (existingAlarm === null) {
           this.ctx.storage.setAlarm(Date.now() + 1000)
       }
   }
}
Build Buddy DO
The Build Buddy DO class is what we use to manage each individual build from the time it begins initializing to when it is stopped. Every build has a buddy for life!
Upon creation of a Build Buddy DO instance, the Scheduler immediately calls startBuild() on the instance. The startBuild() method is responsible for fetching all metadata and secrets needed to run a build, and then kicking off a build on Cloudflare’s container platform (not public yet, but coming soon!).
As the containerized build runs, it reports back to the Build Buddy, sending status updates and logs for the Build Buddy to deal with.
Build status
As a build progresses, it reports its own status back to Build Buddy, sending updates when it has finished initializing, has completed successfully, or been terminated by the user. The Build Buddy is responsible for handling this incoming information from the containerized build, writing status updates to the database (via a Hyperdrive binding) so that users can see the status of their build in the Cloudflare dashboard.
Build logs
A running build generates output logs that are important to store and surface to the user. The containerized build flushes these logs to the Build Buddy every second, which, in turn, stores those logs in DO storage.
The decision to use Durable Object storage here makes it easy to multicast logs to multiple clients efficiently, and allows us to use the same API for both streaming logs and viewing historical logs.
// build-management-app.ts
// We created a Hono app to for use by our Client Worker API
const app = new Hono<HonoContext>()
   .post(
       '/api/builds/:build_uuid/status',
       async (c) => {
           const buildStatus = await c.req.json()


           // fetch build metadata
           const build = ...


           const bb = getBuildBuddy(c.env, build.build_id)
           return await bb.handleStatusUpdate(build, statusUpdate)
       }
   )
   .post(
       '/api/builds/:build_uuid/logs',
       async (c) => {
           const logs = await c.req.json()
     // fetch build metadata
           const build = ...


           const bb = getBuildBuddy(c.env, build.build_id)
           return await bb.addLogLines(logs.lines)
       }
   )


export default {
   fetch: app.fetch
}
// build-buddy.ts
import { DurableObject } from 'cloudflare:workers'


export class BuildBuddy extends DurableObject {
   compute: WorkersBuildsCompute


   constructor(ctx: DurableObjectState, env: Bindings) {
       super(ctx, env)
       this.compute = new ComputeClient({
           // ...
       })
   }


   // The Scheduler DO calls startBuild upon creating a BuildBuddy instance
   startBuild(build: Build): void {
       this.startBuildAsync(build)
   }


   async startBuildAsync(build: Build): Promise<void> {
       // fetch all necessary metadata build, including
	// environment variables, secrets, build tokens, repo credentials,
// build image URI, etc
	// ...


	// start a containerized build
       const computeBuild = await this.compute.createBuild({
           // ...
       })
   }


   // The Build Management worker calls handleStatusUpdate when it receives an update
   // from the containerized build
   async handleStatusUpdate(
       build: Build,
       buildStatusUpdatePayload: Payload
   ): Promise<void> {
// Write status updates to the database
   }


   // The Build Management worker calls addLogLines when it receives flushed logs
   // from the containerized build
   async addLogLines(logs: LogLines): Promise<void> {
       // Generate nextLogsKey to store logs under
       this.ctx.storage.put(nextLogsKey, logs)
   }


   // The Client Worker can call methods on a Build Buddy via RPC, using a service binding to the Build Management Worker.
   // The getLogs method retrieves logs for the user, and the cancelBuild method forwards a request from the user to terminate a build.
   async getLogs(cursor: string){
       const decodedCursor = cursor !== undefined ? decodeLogsCursor(cursor) : undefined
       return await this.getLogs(decodedCursor)
   }


   async cancelBuild(compute_id: string, build_id: string): void{
      await this.terminateBuild(build_id, compute_id)
   }


   async terminateBuild(build_id: number, compute_id: string): Promise<void> {
       await this.compute.stopBuild(compute_id)
   }
}


   export function getBuildBuddy(
   env: Pick<Bindings, 'BUILD_BUDDY'>,
   build_id: number
): DurableObjectStub<BuildBuddy> {
   const id = env.BUILD_BUDDY.idFromName(build_id.toString())
   return env.BUILD_BUDDY.get(id)
}
Alarms
We utilize alarms in the Build Buddy to check that a build has a healthy startup and to terminate any builds that run longer than 20 minutes.
How else have we leveraged the Developer Platform?
Now that we’ve gone over the core behavior of the Workers Builds control plane, we’d like to detail a few other features of the Workers platform that we use to improve performance, monitor system health, and troubleshoot customer issues.
Smart Placement and location hints
While our control plane is distributed in the sense that it can be run across multiple datacenters, to reduce latency costs, we want most requests to be served from locations close to our primary database in the western US.
While a build is running, Build Buddy, a Durable Object, is continuously writing status updates to our database. For the Client and the Build Management API Workers, we enabled Smart Placement with location hints to ensure requests run close to the database.
This graph shows the reduction in round trip time (RTT) observed for our Worker with Smart Placement turned on.
Workers Logs
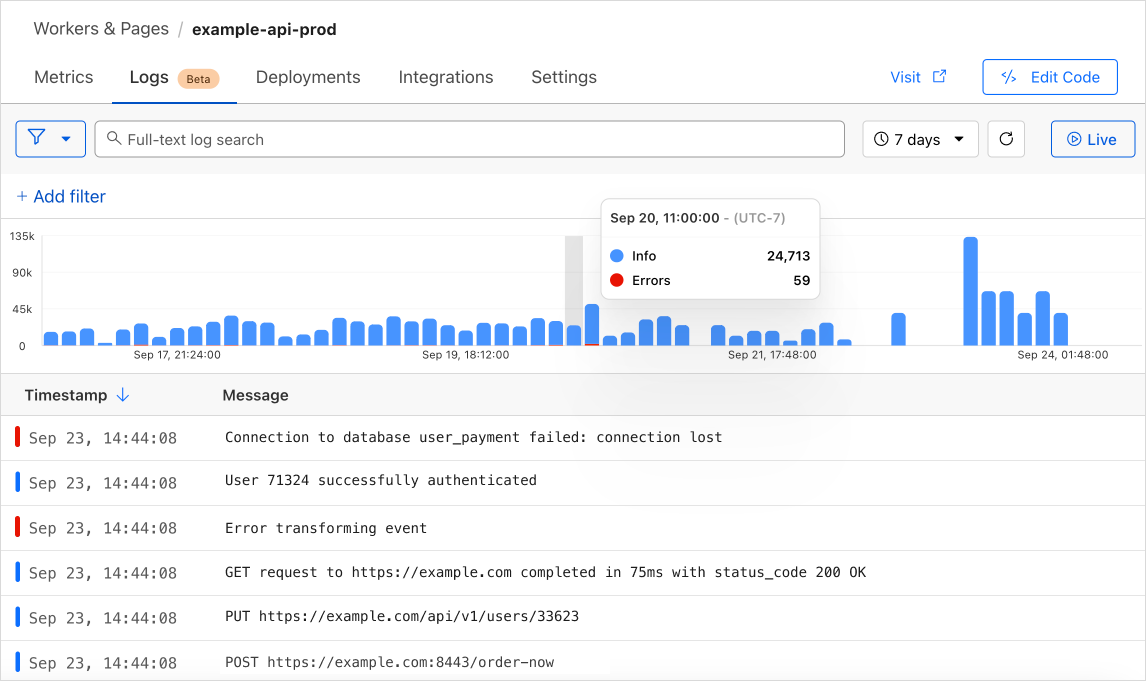
We needed a logging tool that allows us to aggregate and search across persistent operational logs from our Workers to assist with identifying and troubleshooting issues. We worked with the Workers Observability team to become early adopters of Workers Logs.
Workers Logs worked out of the box, giving us fast and easy to use logs directly within the Cloudflare dashboard. To improve our ability to search logs, we created a tagging library that allows us to easily add metadata like the git tag of the deployed worker that the log comes from, allowing us to filter logs by release.
See a shortened example below for how we handle and log errors on the Client Worker.
// client-worker-app.ts
// The Client Worker is a RESTful API built with Hono
const app = new Hono<HonoContext>()
   // This is from the workers-tagged-logger library - first we register the logger
   .use(useWorkersLogger('client-worker-app'))
   // If any error happens during execution, this middleware will ensure we log the error
   .onError(useOnError)
   // routes
   .get(
       '/apiv4/builds',
       async (c) => {
           const { ids } = c.req.query()
           return await getBuildsByIds(c, ids)
       }
   )


function useOnError(e: Error, c: Context<HonoContext>): Response {
   // Set the project identifier n the error
   logger.setTags({ release: c.env.GIT_TAG })

   // Write a log at level 'error'. Can also log 'info', 'log', 'warn', and 'debug'
   logger.error(e)
   return c.json(internal_error.toJSON(), internal_error.statusCode)
}
This setup can lead to the following sample log message from our Workers Log dashboard. You can see the release tag is set on the log.
We can get a better sense of the impact of the error by adding filters to the Workers Logs view, as shown below. We are able to filter on any of the fields since we’re logging with structured JSON.
R2
Coming soon to Workers Builds is build caching, used to store artifacts of a build for subsequent builds to reuse, such as package dependencies and build outputs. Build caching can speed up customer builds by avoiding the need to redownload dependencies from NPM or to rebuild projects from scratch. The cache itself will be backed by R2 storage.
Testing
We were able to build up a great testing story using Vitest and workerd — unit tests, cross-worker integration tests, the works. In the example below, we make use of the runInDurableObject stub from cloudflare:test to test instance methods on the Scheduler DO directly.
// scheduler.spec.ts
import { env, runInDurableObject } from 'cloudflare:test'
import { expect, test } from 'vitest'
import { BuildScheduler } from './scheduler'


test('getBuildsToSchedule() runs a queued build', async () => {
   // Our test harness creates a single build for our scheduler to pick up
   const { build } = await harness.createBuild()


   // We create a scheduler DO instance
   const id = env.BUILD_SCHEDULER.idFromName(crypto.randomUUID())
   const stub = env.BUILD_SCHEDULER.get(id)
   await runInDurableObject(stub, async (instance: BuildScheduler) => {
       expect(instance).toBeInstanceOf(BuildScheduler)


// We check that the scheduler picks up 1 build
       const builds = await instance.getBuildsToSchedule()
       expect(builds.length).toBe(1)

// We start the build, which should mark it as running
       await instance.scheduleBuilds(builds)
   })


   // Check that there are no more builds to schedule
   const queuedBuilds = ...
   expect(queuedBuilds.length).toBe(0)
})
We use SELF.fetch() from cloudflare:test to run integration tests on our Client Worker, as shown below. This integration test covers our Hono endpoint and database queries made by the Client Worker in retrieving the metadata of a build.
// builds_api.test.ts
import { env, SELF } from 'cloudflare:test'

it('correctly selects a single build', async () => {
   // Our test harness creates a randomized build to test with
   const { build } = await harness.createBuild()


   // We send a request to the Client Worker itself to fetch the build metadata
   const getBuild = await SELF.fetch(
       `https://example.com/builds/${build1.build_uuid}`,
       {
           method: 'GET',
           headers: new Headers({
               Authorization: `Bearer JWT`,
               'content-type': 'application/json',
           }),
       }
   )


   // We expect to receive a 200 response from our request and for the
   // build metadata returned to match that of the random build that we created
   expect(getBuild.status).toBe(200)
   const getBuildV4Resp = await getBuild.json()
   const buildResp = getBuildV4Resp.result
   expect(buildResp).toBeTruthy()
   expect(buildResp).toEqual(build)
})
These tests run on the same runtime that Workers run on in production, meaning we have greater confidence that any code changes will behave as expected when they go live.
Analytics
We use the technology underlying the Workers Analytics Engine to collect all of the metrics for our system. We set up Grafana dashboards to display these metrics.
JavaScript-native RPC
JavaScript-native RPC was added to Workers in April of 2024, and it’s pretty magical. In the scheduler code example above, we call startBuild() on the BuildBuddy DO from the Scheduler DO. Without RPC, we would need to stand up routes on the BuildBuddy fetch() handler for the Scheduler to trigger with a fetch request. With RPC, there is almost no boilerplate — all we need to do is call a method on a class.
const bb = getBuildBuddy(this.env, build.build_id)


// Starting a build without RPC 😢
await bb.fetch('http://do/api/start_build', {
    method: 'POST',
    body: JSON.stringify(build),
})


// Starting a build with RPC 😸
await bb.startBuild(build)
Conclusion
By using Workers and Durable Objects, we were able to build a complex and distributed system that is easy to understand and is easily scalable.
It’s been a blast for our team to build on top of the very platform that we work on, something that would have been much harder to achieve on Workers just a few years ago. We believe in being Customer Zero for our own products — to identify pain points firsthand and to continuously improve the developer experience by applying them to our own use cases. It was fulfilling to have our needs as developers met by other teams and then see those tools quickly become available to the rest of the world — we were collaborators and internal testers for Workers Logs and private network support for Hyperdrive (both released on Birthday Week), and the soon to be released container platform.
Opportunities to build complex applications on the Developer Platform have increased in recent years as the platform has matured and expanded product offerings for more use cases. We hope that Workers Builds will be yet another tool in the Workers toolbox that enables developers to spend less time thinking about configuration and more time writing code.
Want to try it out? Check out the docs to learn more about how to deploy your first project with Workers Builds.
When Baselime joined Cloudflare in April 2024, our architecture had evolved to hundreds of AWS Lambda functions, dozens of databases, and just as many queues. We were drowning in complexity and our cloud costs were growing fast. We are now building Baselime and Workers Observability on Cloudflare and will save over 80% on our cloud compute bill. The estimated potential Cloudflare costs are for Baselime, which remains a stand-alone offering, and the estimate is based on the Workers Paid plan. Not only did we achieve huge cost savings, we also simplified our architecture and improved overall latency, scalability, and reliability.
Daily Cost
Before (AWS)
After (Cloudflare)
Compute
$650 – AWS Lambda
$25 – Cloudflare Workers
CDN
$140 – Cloudfront
$0 – Free
Data Stream + Analytics database
$1,150 – Kinesis Data Stream + EC2
$300 – Workers Analytics Engine
Total
$1,940
$325 (83% cost reduction)
Table 1: Daily Costs Comparison ($USD)
When we joined Cloudflare, we immediately saw a surge in usage, and within the first week following the announcement, we were processing over a billion events daily and our weekly active users tripled.
As the platform grew, so did the challenges of managing real-time observability with new scalability, reliability, and cost considerations. This drove us to rebuild Baselime on the Cloudflare Developer Platform, where we could innovate quickly while reducing operational overhead.
Initial architecture — all on AWS
Our initial architecture was all on Amazon Web Services (AWS). We’ll focus here on the data pipeline, which covers ingestion, processing, and storage of tens of billions of events daily.
This pipeline was built on top of AWS Lambda, Cloudfront, Kinesis, EC2, DynamoDB, ECS, and ElastiCache.
Figure1: Initial data pipeline architecture
The key elements are:
Data receptors: Responsible for receiving telemetry data from multiple sources, including OpenTelemetry, Cloudflare Logpush, CloudWatch, Vercel, etc. They cover validation, authentication, and transforming data from each source into a common internal format. The data receptors were deployed either on AWS Lambda (using function URLs and Cloudfront) or ECS Fargate depending on the data source.
Kinesis Data Stream: Responsible for transporting the data from the receptors to the next step: data processing.
Processor: A single AWS Lambda function responsible for enriching and transforming the data for storage. It also performed real-time error tracking and detecting patterns in logs.
ClickHouse cluster: All the telemetry data was ultimately indexed and stored in a self-hosted ClickHouse cluster on EC2.
In addition to these key elements, the existing stack also included orchestration with Firehose, S3 buckets, SQS, DynamoDB and RDS for error handling, retries, and storing metadata.
While this architecture served us well in the early days, it started to show major cracks as we scaled our solution to more and larger customers.
Handling retries at the interface between the data receptors and the Kinesis Data Stream was complex, requiring introducing and orchestrating Firehose, S3 buckets, SQS, and another Lambda function.
Self-hosting ClickHouse also introduced major challenges at scale, as we continuously had to plan our capacity and update our setup to keep pace with our growing user base whilst attempting to maintain control over costs.
Costs began scaling unpredictably with our growing workloads, especially in AWS Lambda, Kinesis, and EC2, but also in less obvious ways, such as in Cloudfront (required for a custom domain in front of Lambda function URLs) and DynamoDB. Specifically, the time spent on I/O operations in AWS Lambda was a particularly costly piece. At every step, from the data receptors to the ClickHouse cluster, moving data to the next stage required waiting for a network request to complete, accounting for over 70% of wall time in the Lambda function.
In a nutshell, we were continuously paged by our alerts, innovating at a slower pace, and our costs were out of control.
Additionally, the entire solution was deployed in a single AWS region: eu-west-1. As a result, all developers located outside continental Europe were experiencing high latency when emitting logs and traces to Baselime.
Modern architecture — transitioning to Cloudflare
The shift to the Cloudflare Developer Platform enabled us to rethink our architecture to be exceptionally fast, globally distributed, and highly scalable, without compromising on cost, complexity, or agility. This new architecture is built on top of Cloudflare primitives.
Figure 2: Modern data pipeline architecture
Cloudflare Workers: the core of Baselime
Cloudflare Workers are now at the core of everything we do. All the data receptors and the processor run in Workers. Workers minimize cold-start times and are deployed globally by default. As such, developers always experience lower latency when emitting events to Baselime.
Additionally, we heavily use JavaScript-native RPC for data transfer between steps of the pipeline. It’s low-latency, lightweight, and simplifies communication between components. This further simplifies our architecture, as separate components behave more as functions within the same process, rather than completely separate applications.
Code Block 1: Simplified data receptor using JavaScript-native RPC to execute the processor.
Workers also expose a Rate Limiting binding that enables us to automatically add rate limiting to our services, which we previously had to build ourselves using a combination of DynamoDB and ElastiCache.
Moreover, we heavily use ctx.waitUntil within our Worker invocations, to offload data transformation outside the request / response path. This further reduces the latency of calls developers make to our data receptors.
Durable Objects: stateful data processing
Durable Objects is a unique service within the Cloudflare Developer Platform, as it enables building stateful applications in a serverless environment. We use Durable Objects in the data pipelines for both real-time error tracking and detecting log patterns.
For instance, to track errors in real-time, we create a durable object for each new type of error, and this durable object is responsible for keeping track of the frequency of the error, when to notify customers, and the notification channels for the error. This implementation with a single building block removes the need for ElastiCache, Kinesis, and multiple Lambda functions to coordinate protecting the RDS database from being overwhelmed by a high frequency error.
Durable Objects gives us precise control over consistency and concurrency of managing state in the data pipeline.
In addition to the data pipeline, we use Durable Objects for alerting. Our previous architecture required orchestrating EventBridge Scheduler, SQS, DynamoDB and multiple AWS Lambda functions, whereas with Durable Objects, everything is handled within the alarm handler.
Workers Analytics Engine: high-cardinality analytics at scale
Though managing our own ClickHouse cluster was technically interesting and challenging, it took us away from building the best observability developer experience. With this migration, more of our time is spent enhancing our product and none is spent managing server instances.
Workers Analytics Engine lets us synchronously write events to a scalable high-cardinality analytics database. We built on top of the same technology that powers Workers Analytics Engine. We also made internal changes to Workers Analytics Engine to natively enable high dimensionality in addition to high cardinality.
Moreover, Workers Analytics Engine and our solution leverages Cloudflare’s ABR analytics. ABR stands for Adaptive Bit Rate, and enables us to store telemetry data in multiple tables with varying resolutions, from 100% to 0.0001% of the data. Querying the table with 0.0001% of the data will be several orders of magnitudes faster than the table with all the data, with a corresponding trade-off in accuracy. As such, when a query is sent to our systems, Workers Analytics Engine dynamically selects the most appropriate table to run the query, optimizing both query time and accuracy. Users always get the most accurate result with optimal query time, regardless of the size of their dataset or the timeframe of the query. Compared to our previous system, which was always running queries on the full dataset, the new system now delivers faster queries across our entire user base and use cases.
In addition to these core services (Workers, Durable Objects, Workers Analytics Engine), the new architecture leverages other building blocks from the Cloudflare Developer Platform. Queues for asynchronous messaging, decoupling services and enabling an event-driven architecture; D1 as our main database for transactional data (queries, alerts, dashboards, configurations, etc.); Workers KV for fast distributed storage; Hono for all our APIs, etc.
How did we migrate?
Baselime is built on an event-driven architecture, where every user action triggers an event. It operates on the principle that every user action is recorded as an event and emitted to the rest of the system — whether it’s creating a user, editing a dashboard, or performing any other action. Migrating to Cloudflare involved transitioning our event-driven architecture without compromising uptime and data consistency. Previously, this was powered by AWS EventBridge and SQS, and we moved entirely to Cloudflare Queues.
We followed the strangler fig pattern to incrementally migrate the solution from AWS to Cloudflare. It consists of gradually replacing specific parts of the system with newer services, with minimal disruption to the system. Early in the process, we created a central Cloudflare Queue which acted as the backbone for all transactional event processing during the migration. Every event, whether a new user signup or a dashboard edit, was funneled into this Queue. From there, events were dynamically routed, each event to the relevant part of the application. User actions were synced into D1 and KV, ensuring that all user actions were mirrored across both AWS and Cloudflare during the transition.
This syncing mechanism enabled us to maintain consistency and ensure that no data was lost as users continued to interact with Baselime.
Here’s an example of how events are processed:
export default {
  async queue(batch, env) {
    for (const message of batch.messages) {
      try {
        const event = message.body;
        switch (event.type) {
          case "WORKSPACE_CREATED":
            await workspaceHandler.create(env, event.data);
            break;
          case "QUERY_CREATED":
            await queryHandler.create(env, event.data);
            break;
          case "QUERY_DELETED":
            await queryHandler.remove(env, event.data);
            break;
          case "DASHBOARD_CREATED":
            await dashboardHandler.create(env, event.data);
            break;
          //
          // Many more events...
          //
          default:
            logger.info("Matched no events", { type: event.type });
        }
        message.ack();
      } catch (e) {
        if (message.attempts < 3) {
          message.retry({ delaySeconds: Math.ceil(30 ** message.attempts / 10), });
        } else {
          logger.error("Failed handling event - No more retrys", { event: message.body, attempts: message.attempts }, e);
        }
      }
    }
  },
} satisfies ExportedHandler<Env, InternalEvent>;
Code Block 2: Simplified internal events processing during migration.
We migrated the data pipeline from AWS to Cloudflare with an outside-in method: we started with the data receptors and incrementally moved the data processor and the ClickHouse cluster to the new architecture. We began writing telemetry data (logs, metrics, traces, wide-events, etc.) to both ClickHouse (in AWS) and to Workers Analytics Engine simultaneously for the duration of the retention period (30 days).
The final step was rewriting all of our endpoints, previously hosted on AWS Lambda and ECS containers, into Cloudflare Workers. Once those Workers were ready, we simply switched the DNS records to point to the Workers instead of the existing Lambda functions.
Despite the complexity, the entire migration process, from the data pipeline to all re-writing API endpoints, took our then team of 3 engineers less than three months.
We ended up saving over 80% on our cloud bill
Savings on the data receptors
After switching the data receptors from AWS to Cloudflare in early June 2024, our AWS Lambda cost was reduced by over 85%. These costs were primarily driven by I/O time the receptors spent sending data to a Kinesis Data Stream in the same region.
Figure 4: Baselime daily AWS Lambda cost [note: the gap in data is the result of AWS Cost Explorer losing data when the parent organization of the cloud accounts was changed.]
Moreover, we used Cloudfront to enable custom domains pointing to the data receptors. When we migrated the data receptors to Cloudflare, there was no need for Cloudfront anymore. As such, our Cloudfront cost was reduced to $0.
Figure 5: Baselime daily Cloudfront cost [note: the gap in data is the result of AWS Cost Explorer losing data when the parent organization of the cloud accounts was changed.]
If we were a regular Cloudflare customer, we estimate that our daily Cloudflare Workers bill would be around \$25 after the switch, against \$790 on AWS: over 95% cost reduction. These savings are primarily driven by the Workers pricing model, since Workers charge for CPU time, and the receptors are primarily just moving data, and as such, are mostly I/O bound.
Savings on the ClickHouse cluster
To evaluate the cost impact of switching from self-hosting ClickHouse to using Workers Analytics Engine, we need to take into account not only the EC2 instances, but also the disk space, networking, and the Kinesis Data Stream cost.
We completed this switch in late August, achieving over 95% cost reduction in both the Kinesis Data Stream and all EC2 related costs.
Figure 6: Baselime daily Kinesis Data Stream cost [note: the gap in data is the result of AWS Cost Explorer losing data when the parent organization of the cloud accounts was changed.]
Figure 7: Baselime daily EC2 cost [note: the gap in data is the result of AWS Cost Explorer losing data when the parent organization of the cloud accounts was changed.]
If we were a regular Cloudflare customer, we estimate that our daily Workers Analytics Engine cost would be around \$300 after the switch, compared to \$1150 on AWS, a cost reduction of over 70%.
Not only did we significantly reduce costs by migrating to Cloudflare, but we also improved performance across the board. Responses to users are now faster, with real-time event ingestion happening across Cloudflare’s network, closer to our users. Responses to users querying their data are also much faster, thanks to Cloudflare’s deep expertise in operating ClickHouse at scale.
Most importantly, we’re no longer bound by limitations in throughput or scale. We launched Workers Logs on September 26, 2024, and our system now handles a much higher volume of events than before, with no sacrifices in speed or reliability.
These cost savings are outstanding as is, and do not include the total cost of ownership of those systems. We significantly simplified our systems and our codebase, as the platform is taking care of more for us. We’re paged less, we spend less time monitoring infrastructure, and we can focus on delivering product improvements.
Conclusion
Migrating Baselime to Cloudflare has transformed how we build and scale our platform. With Workers, Durable Objects, Workers Analytics Engine, and other services, we now run a fully serverless, globally distributed system that’s more cost-efficient and agile. This shift has significantly reduced our operational overhead and enabled us to iterate faster, delivering better observability tooling to our users.
You can start observing your Cloudflare Workers today with Workers Logs. Looking ahead, we’re excited about the features we will deliver directly in the Cloudflare Dashboard, including real-time error tracking, alerting, and a query builder for high-cardinality and dimensionality events. All coming by early 2025.
With September’s announcement of Hyperdrive’s ability to send database traffic from Workers over Cloudflare Tunnels, we wanted to dive into the details of what it took to make this happen.
Hyper-who?
Accessing your data from anywhere in Region Earth can be hard. Traditional databases are powerful, familiar, and feature-rich, but your users can be thousands of miles away from your database. This can cause slower connection startup times, slower queries, and connection exhaustion as everything takes longer to accomplish.
Cloudflare Workers is an incredibly lightweight runtime, which enables our customers to deploy their applications globally by default and renders the cold start problem almost irrelevant. The trade-off for these light, ephemeral execution contexts is the lack of persistence for things like database connections. Database connections are also notoriously expensive to spin up, with many round trips required between client and server before any query or result bytes can be exchanged.
Hyperdrive is designed to make the centralized databases you already have feel like they’re global while keeping connections to those databases hot. We use our global network to get faster routes to your database, keep connection pools primed, and cache your most frequently run queries as close to users as possible.
Why a Tunnel?
For something as sensitive as your database, exposing access to the public Internet can be uncomfortable. It is common to instead host your database on a private network, and allowlist known-safe IP addresses or configure GRE tunnels to permit traffic to it. This is complex, toilsome, and error-prone.
On Cloudflare’s Developer Platform, we strive for simplicity and ease-of-use. We cannot expect all of our customers to be experts in configuring networking solutions, and so we went in search of a simpler solution. Being your own customer is rarely a bad choice, and it so happens that Cloudflare offers an excellent option for this scenario: Tunnels.
Integrating with Tunnels to support sending Postgres directly through them was a bit of a new challenge for us. Most of the time, when we use Tunnels internally (more on that later!), we rely on the excellent job cloudflared does of handling all of the mechanics, and we just treat them as pipes. That wouldn’t work for Hyperdrive, though, so we had to dig into how Tunnels actually ingress traffic to build a solution.
Hyperdrive handles Postgres traffic using an entirely custom implementation of the Postgres message protocol. This is necessary, because we sometimes have to alter the specific type or content of messages sent from client to server, or vice versa. Handling individual bytes gives us the flexibility to implement whatever logic any new feature might need.
An additional, perhaps less obvious, benefit of handling Postgres message traffic as just bytes is that we are not bound to the transport layer choices of some ORM or library. One of the nuances of running services in Cloudflare is that we may want to egress traffic over different services or protocols, for a variety of different reasons. In this case, being able to egress traffic via a Tunnel would be pretty challenging if we were stuck with whatever raw TCP socket a library had established for us.
The way we accomplish this relies on a mainstay of Rust: traits (which are how Rust lets developers apply logic across generic functions and types). In the Rust ecosystem, there are two traits that define the behavior Hyperdrive wants out of its transport layers: AsyncRead and AsyncWrite. There are a couple of others we also need, but we’re going to focus on just these two. These traits enable us to code our entire custom handler against a generic stream of data, without the handler needing to know anything about the underlying protocol used to implement the stream. So, we can pass around a WebSocket connection as a generic I/O stream, wherever it might be needed.
As an example, the code to create a generic TCP stream and send a Postgres startup message across it might look like this:
/// Send a startup message to a Postgres server, in the role of a PG client.
/// https://www.postgresql.org/docs/current/protocol-message-formats.html#PROTOCOL-MESSAGE-FORMATS-STARTUPMESSAGE
pub async fn send_startup<S>(stream: &mut S, user_name: &str, db_name: &str, app_name: &str) -> Result<(), ConnectionError>
where
    S: AsyncWrite + Unpin,
{
    let protocol_number = 196608 as i32;
    let user_str = &b"user\0"[..];
    let user_bytes = user_name.as_bytes();
    let db_str = &b"database\0"[..];
    let db_bytes = db_name.as_bytes();
    let app_str = &b"application_name\0"[..];
    let app_bytes = app_name.as_bytes();
    let len = 4 + 4
        + user_str.len() + user_bytes.len() + 1
        + db_str.len() + db_bytes.len() + 1
        + app_str.len() + app_bytes.len() + 1 + 1;

    // Construct a BytesMut of our startup message, then send it
    let mut startup_message = BytesMut::with_capacity(len as usize);
    startup_message.put_i32(len as i32);
    startup_message.put_i32(protocol_number);
    startup_message.put(user_str);
    startup_message.put_slice(user_bytes);
    startup_message.put_u8(0);
    startup_message.put(db_str);
    startup_message.put_slice(db_bytes);
    startup_message.put_u8(0);
    startup_message.put(app_str);
    startup_message.put_slice(app_bytes);
    startup_message.put_u8(0);
    startup_message.put_u8(0);

    match stream.write_all(&startup_message).await {
        Ok(_) => Ok(()),
        Err(err) => {
            error!("Error writing startup to server: {}", err.to_string());
            ConnectionError::InternalError
        }
    }
}

/// Connect to a TCP socket
let stream = match TcpStream::connect(("localhost", 5432)).await {
    Ok(s) => s,
    Err(err) => {
        error!("Error connecting to address: {}", err.to_string());
        return ConnectionError::InternalError;
    }
};
let _ = send_startup(&mut stream, "db_user", "my_db").await;
With this approach, if we wanted to encrypt the stream using TLS before we write to it (upgrading our existing TcpStream connection in-place, to an SslStream), we would only have to change the code we use to create the stream, while generating and sending the traffic would remain unchanged. This is because SslStream also implements AsyncWrite!
/// We're handwaving the SSL setup here. You're welcome.
let conn_config = new_tls_client_config()?;

/// Encrypt the TcpStream, returning an SslStream
let ssl_stream = match tokio_boring::connect(conn_config, domain, stream).await {
    Ok(s) => s,
    Err(err) => {
        error!("Error during websocket TLS handshake: {}", err.to_string());
        return ConnectionError::InternalError;
    }
};
let _ = send_startup(&mut ssl_stream, "db_user", "my_db").await;
Whence WebSocket
WebSocket is an application layer protocol that enables bidirectional communication between a client and server. Typically, to establish a WebSocket connection, a client initiates an HTTP request and indicates they wish to upgrade the connection to WebSocket via the “Upgrade” header. Then, once the client and server complete the handshake, both parties can send messages over the connection until one of them terminates it.
Now, it turns out that the way Cloudflare Tunnels work under the hood is that both ends of the tunnel want to speak WebSocket, and rely on a translation layer to convert all traffic to or from WebSocket. The cloudflared daemon you spin up within your private network handles this for us! For Hyperdrive, however, we did not have a suitable translation layer to send Postgres messages across WebSocket, and had to write one.
One of the (many) fantastic things about Rust traits is that the contract they present is very clear. To be AsyncRead, you just need to implement poll_read. To be AsyncWrite, you need to implement only three functions (poll_write, poll_flush, and poll_shutdown). Further, there is excellent support for WebSocket in Rust built on top of the tungstenite-rs library.
Thus, building our custom WebSocket stream such that it can share the same machinery as all our other generic streams just means translating the existing WebSocket support into these poll functions. There are some existing OSS projects that do this, but for multiple reasons we could not use the existing options. The primary reason is that Hyperdrive operates across multiple threads (thanks to the tokio runtime), and so we rely on our connections to also handle Send, Sync, and Unpin. None of the available solutions had all five traits handled. It turns out that most of them went with the paradigm of Sink and Stream, which provide a solid base from which to translate to AsyncRead and AsyncWrite. In fact some of the functions overlap, and can be passed through almost unchanged. For example, poll_flush and poll_shutdown have 1-to-1 analogs, and require almost no engineering effort to convert from Sink to AsyncWrite.
/// We use this struct to implement the traits we need on top of a WebSocketStream
pub struct HyperSocket<S>
where
    S: AsyncRead + AsyncWrite + Send + Sync + Unpin,
{
    inner: WebSocketStream<S>,
    read_state: Option<ReadState>,
    write_err: Option<Error>,
}

impl<S> AsyncWrite for HyperSocket<S>
where
    S: AsyncRead + AsyncWrite + Send + Sync + Unpin,
{
    fn poll_flush(mut self: Pin<&mut Self>, cx: &mut Context<'_>) -> Poll<io::Result<()>> {
        match ready!(Pin::new(&mut self.inner).poll_flush(cx)) {
            Ok(_) => Poll::Ready(Ok(())),
            Err(err) => Poll::Ready(Err(Error::new(ErrorKind::Other, err))),
        }
    }

    fn poll_shutdown(mut self: Pin<&mut Self>, cx: &mut Context<'_>) -> Poll<io::Result<()>> {
        match ready!(Pin::new(&mut self.inner).poll_close(cx)) {
            Ok(_) => Poll::Ready(Ok(())),
            Err(err) => Poll::Ready(Err(Error::new(ErrorKind::Other, err))),
        }
    }
}
With that translation done, we can use an existing WebSocket library to upgrade our SslStream connection to a Cloudflare Tunnel, and wrap the result in our AsyncRead/AsyncWrite implementation. The result can then be used anywhere that our other transport streams would work, without any changes needed to the rest of our codebase!
That would look something like this:
let websocket = match tokio_tungstenite::client_async(request, ssl_stream).await {
    Ok(ws) => Ok(ws),
    Err(err) => {
        error!("Error during websocket conn setup: {}", err.to_string());
        return ConnectionError::InternalError;
    }
};
let websocket_stream = HyperSocket::new(websocket));
let _ = send_startup(&mut websocket_stream, "db_user", "my_db").await;
Access granted
An observant reader might have noticed that in the code example above we snuck in a variable named request that we passed in when upgrading from an SslStream to a WebSocketStream. This is for multiple reasons. The first reason is that Tunnels are assigned a hostname and use this hostname for routing. The second and more interesting reason is that (as mentioned above) when negotiating an upgrade from HTTP to WebSocket, a request must be sent to the server hosting the ingress side of the Tunnel to perform the upgrade. This is pretty universal, but we also add in an extra piece here.
At Cloudflare, we believe that secure defaults and defense in depth are the correct ways to build a better Internet. This is why traffic across Tunnels is encrypted, for example. However, that does not necessarily prevent unwanted traffic from being sent into your Tunnel, and therefore egressing out to your database. While Postgres offers a robust set of access control options for protecting your database, wouldn’t it be best if unwanted traffic never got into your private network in the first place?
To that end, all Tunnels set up for use with Hyperdrive should have a Zero Trust Access Application configured to protect them. These applications should use a Service Token to authorize connections. When setting up a new Hyperdrive, you have the option to provide the token’s ID and Secret, which will be encrypted and stored alongside the rest of your configuration. These will be presented as part of the WebSocket upgrade request to authorize the connection, allowing your database traffic through while preventing unwanted access.
This can be done within the request’s headers, and might look something like this:
let ws_url = format!("wss://{}", host);
let mut request = match ws_url.into_client_request() {
    Ok(req) => req,
    Err(err) => {
        error!(
            "Hostname {} could not be parsed into a valid request URL: {}",
            host,
            err.to_string()
        );
        return ConnectionError::InternalError;
    }
};
request.headers_mut().insert(
    "CF-Access-Client-Id",
    http::header::HeaderValue::from_str(&client_id).unwrap(),
);
request.headers_mut().insert(
    "CF-Access-Client-Secret",
    http::header::HeaderValue::from_str(&client_secret).unwrap(),
);
Building for customer zero
If you’ve been reading the blog for a long time, some of this might sound a bit familiar. This isn’t the first time that we’ve sent Postgres traffic across a tunnel, it’s something most of us do from our laptops regularly. This works very well for interactive use cases with low traffic volume and a high tolerance for latency, but historically most of our products have not been able to employ the same approach.
Cloudflare operates many data centers around the world, and most services run in every one of those data centers. There are some tasks, however, that make the most sense to run in a more centralized fashion. These include tasks such as managing control plane operations, or storing configuration state. Nearly every Cloudflare product houses its control plane information in Postgres clusters run centrally in a handful of our data centers, and we use a variety of approaches for accessing that centralized data from elsewhere in our network. For example, many services currently use a push-based model to publish updates to Quicksilver, and work through the complexities implied by such a model. This has been a recurring challenge for any team looking to build a new product.
Hyperdrive’s entire reason for being is to make it easy to access such central databases from our global network. When we began exploring Tunnel integrations as a feature, many internal teams spoke up immediately and strongly suggested they’d be interested in using it themselves. This was an excellent opportunity for Cloudflare to scratch its own itch, while also getting a lot of traffic on a new feature before releasing it directly to the public. As always, being “customer zero” means that we get fast feedback, more reliability over time, stronger connections between teams, and an overall better suite of products. We jumped at the chance.
As we rolled out early versions of Tunnel integration, we worked closely with internal teams to get them access to it, and fixed any rough spots they encountered. We’re pleased to share that this first batch of teams have found great success building new or refactored products on Hyperdrive over Tunnels. For example: if you’ve already tried out Workers Builds, or recently submitted an abuse report, you’re among our first users! At the time of this writing, we have several more internal teams working to onboard, and we on the Hyperdrive team are very excited to see all the different ways in which fast and simple connections from Workers to a centralized database can help Cloudflare just as much as they’ve been helping our external customers.
Outro
Cloudflare is on a mission to make the Internet faster, safer, and more reliable. Hyperdrive was built to make connecting to centralized databases from the Workers runtime as quick and consistent as possible, and this latest development is designed to help all those who want to use Hyperdrive without directly exposing resources within their virtual private clouds (VPCs) on the public web.
To this end, we chose to build a solution around our suite of industry-leading Zero Trust tools, and were delighted to find how simple it was to implement in our runtime given the power and extensibility of the Rust trait system.
Without waiting for the ink to dry, multiple teams within Cloudflare have adopted this new feature to quickly and easily solve what have historically been complex challenges, and are happily operating it in production today.
With the rapid advancements occurring in the AI space, developers face significant challenges in keeping up with the ever-changing landscape. New models and providers are continuously emerging, and understandably, developers want to experiment and test these options to find the best fit for their use cases. This creates the need for a streamlined approach to managing multiple models and providers, as well as a centralized platform to efficiently monitor usage, implement controls, and gather data for optimization.
AI Gateway is specifically designed to address these pain points. Since its launch in September 2023, AI Gateway has empowered developers and organizations by successfully proxying over 2 billion requests in just one year, as we highlighted during September’s Birthday Week. With AI Gateway, developers can easily store, analyze, and optimize their AI inference requests and responses in real time.
With our initial architecture, AI Gateway faced a significant challenge: the logs, those critical trails of data interactions between applications and AI models, could only be retained for 30 minutes. This limitation was not just a minor inconvenience; it posed a substantial barrier for developers and businesses needing to analyze long-term patterns, ensure compliance, or simply debug over more extended periods.
In this post, we’ll explore the technical challenges and strategic decisions behind extending our log storage capabilities from 30 minutes to being able to store billions of logs indefinitely. We’ll discuss the challenges of scale, the intricacies of data management, and how we’ve engineered a system that not only meets the demands of today, but is also scalable for the future of AI development.
Background
AI Gateway is built on Cloudflare Workers, a serverless platform that runs on the Cloudflare network, allowing developers to write small JavaScript functions that can execute at the point of need, near the user, on Cloudflare’s vast network of data centers, without worrying about platform scalability.
Our customers use multiple providers and models and are always looking to optimize the way they do inference. And, of course, in order to evaluate their prompts, performance, cost, and to troubleshoot what’s going on, AI Gateway’s customers need to store requests and responses. New requests show up within 15 seconds and customers can check a request’s cost, duration, number of tokens, and provide their feedback (thumbs up or down).
This scales in a way where an account can have multiple gateways and each gateway has its own settings. In our first implementation, a backend worker was responsible for storing Real Time Logs and other background tasks. However, in the rapidly evolving domain of artificial intelligence, where real-time data is as precious as the insights it provides, managing log data efficiently becomes paramount. We recognized that to truly empower our users, we needed to offer a solution where logs weren’t just transient records but could be stored permanently. Permanent log storage means developers can now track the performance, security, and operational insights of their AI applications over time, enabling not only immediate troubleshooting but also longitudinal studies of AI behavior, usage trends, and system health.
The diagram above describes our old architecture, which could only store 30 minutes of data.
Tracing the path of a request through the AI Gateway, as depicted in the sequence above:
A developer sends a new inference request, which is first received by our Gateway Worker.
The Gateway Worker then performs several checks: it looks for cached results, enforces rate limits, and verifies any other configurations set by the user for their gateway. Provided all conditions are met, it forwards the request to the selected inference provider (in this diagram, OpenAI).
The inference provider processes the request and sends back the response.
Simultaneously, as the response is relayed back to the developer, the request and response details are also dispatched to our Backend Worker. This worker’s role is to manage and store the log of this transaction.
The challenge: Store two billion logs
First step: real-time logs
Initially, the AI Gateway project stored both request metadata and the actual request bodies in a D1 database. This approach facilitated rapid development in the project’s infancy. However, as customer engagement grew, the D1 database began to fill at an accelerating rate, eventually retaining logs for only 30 minutes at a time.
To mitigate this, we first optimized the database schema, which extended the log retention to one hour. However, we soon encountered diminishing returns due to the sheer volume of byte data from the request bodies. Post-launch, it became clear that a more scalable solution was necessary. We decided to migrate the request bodies to R2 storage, significantly alleviating the data load on D1. This adjustment allowed us to incrementally extend log retention to 24 hours.
Consequently, D1 functioned primarily as a log index, enabling users to search and filter logs efficiently. When users needed to view details or download a log, these actions were seamlessly proxied through to R2.
This dual-system approach provided us with the breathing room to contemplate and develop more sophisticated storage solutions for the future.
Second step: persistent logs and Durable Object transactional storage
As our traffic surged, we encountered a growing number of requests from customers wanting to access and compare older logs.
Upon learning that the Durable Objects team was seeking beta testers for their new Durable Objects with SQLite, we eagerly signed up.
Originally, we considered Durable Objects as the ideal solution for expanding our log storage capacity, which required us to shard the logs by a unique string. Initially, this string was the account ID, but during a mid-development load test, we hit a cap at 10 million logs per Durable Object. This limitation meant that each account could only support up to this number of logs.
Given our commitment to the DO migration, we saw an opportunity rather than a constraint. To overcome the 10 million log limit per account, we refined our approach to shard by both account ID and gateway name. This adjustment effectively raised the storage ceiling from 10 million logs per account to 10 million per gateway. With the default setting allowing each account up to 10 gateways, the potential storage for each account skyrocketed to 100 million logs.
This strategic pivot not only enabled us to store a significantly larger number of logs. But also enhanced our flexibility in gateway management. Now, when a gateway is deleted, we can simply remove the corresponding Durable Object.
Additionally, this sharding method isolates high-volume request scenarios. If one customer’s heavy usage slows down log insertion, it only impacts their specific Durable Object, thereby preserving performance for other customers.
Taking a glance at the revised architecture diagram, we replaced the Backend Worker with our newly integrated Durable Object. The rest of the request flow remains unchanged, including the concurrent response to the user and the interaction with the Durable Object, which occurs in the fourth step.
Leveraging Cloudflare’s network, our Gateway Worker operates near the user’s location, which in turn positions the user’s Durable Object close by. This proximity significantly enhances the speed of log insertion and query operations.
Third step: managing thousands of Durable Objects
As the number of users and requests on AI Gateway grows, managing each unique Durable Object (DO) becomes increasingly complex. New customers join continuously, and we needed an efficient method to track each DO, ensure users stay within their 10 gateway limit, and manage the storage capacity for free users.
To address these challenges, we introduced another layer of control with a new Durable Object we’ve named the Account Manager. The primary function of the Account Manager is straightforward yet crucial: it keeps user activities in check.
Here’s how it works: before any Gateway commits a new log to permanent storage, it consults the Account Manager. This check determines whether the gateway is allowed to insert the log based on the user’s current usage and entitlements. The Account Manager uses its own SQLite database to verify the total number of rows a user has and their service level. If all checks pass, it signals the Gateway that the log can be inserted. It was paramount to guarantee that this entire validation process occurred in the background, ensuring that the user experience remains seamless and uninterrupted.
The Account Manager stays updated by periodically receiving data from each Gateway’s Durable Object. Specifically, after every 1000 inference requests, the Gateway sends an update on its total rows to the Account Manager, which then updates its local records. This system ensures that the Account Manager has the most current data when making its decisions.
Additionally, the Account Manager is responsible for monitoring customer entitlements. It tracks whether an account is on a free or paid plan, how many gateways a user is permitted to create, and the log storage capacity allocated to each gateway.
Through these mechanisms, the Account Manager not only helps in maintaining system integrity but also ensures fair usage across all users of AI Gateway.
AI evaluations and Durable Objects sharding
As we continue to develop evaluations to fully automatic and, in the future, use Large Language Models (LLMs), we are now taking the first step towards this goal and launching the open beta phase of comprehensive AI evaluations, centered on Human-in-the-Loop feedback.
This feature empowers users to create bespoke datasets from their application logs, thereby enabling them to score and evaluate the performance, speed, and cost-effectiveness of their models, with a primary focus on LLMs and automated scoring, analyzing the performance of LLMs, providing developers with objective, data-driven insights to refine their models.
To do this, developers require a reliable logging mechanism that persists logs from multiple gateways, storing up to 100 million logs in total (10 million logs per gateway, across 10 gateways). This represents a significant volume of data, as each request made through the AI Gateway generates a log entry, with some log entries potentially exceeding 50 MB in size.
This necessity leads us to work on the expansion of log storage capabilities. Since log storage is limited to 10 million logs per gateway, in future iterations, we aim to scale this capacity by implementing sharded Durable Objects (DO), allowing multiple Durable Objects per gateway to handle and store logs. This scaling strategy will enable us to store significantly larger volumes of logs, providing richer data for evaluations (using LLMs as a judge or from user input), all through AI Gateway.
Coming Soon
We are working on improving our existing Universal Endpoint, the next step on an enhanced solution that builds on existing fallback mechanisms to offer greater resilience, flexibility, and intelligence in request management.
Currently, when a provider encounters an error or is unavailable, our system falls back to an alternative provider to ensure continuity. The improved Universal Endpoint takes this a step further by introducing automatic retry capabilities, allowing failed requests to be reattempted before fallback is triggered. This significantly improves reliability by handling transient errors and increasing the likelihood of successful request fulfillment. It will look something like this:
The request to the improved Universal Endpoint system demonstrates how it handles multiple providers with integrated retry mechanisms and fallback logic. In this example, the first request is sent to a provider like OpenAI, asking it to generate a text-to-image prompt. The “retry” option ensures that transient issues don’t result in immediate failure.
The system’s ability to seamlessly switch between providers while applying retry strategies ensures higher reliability and robustness in managing requests. By leveraging fallback logic, the Improved Universal Endpoint can dynamically adapt to provider failures, ensuring that tasks are completed successfully even in complex, multi-step workflows.
In addition to retry logic, we will have the ability to inspect requests and responses and make dynamic decisions based on the content of the result. This enables developers to create conditional workflows where the system can adapt its behavior depending on the nature of the response, creating a highly flexible and intelligent decision-making process.
If you haven’t yet used AI Gateway, check out our developer documentation on how to get started. If you have any questions, reach out on our Discord channel.
Workflows, Cloudflare’s durable execution engine that allows you to build reliable, repeatable multi-step applications that scale for you, is now in open beta. Any developer with a free or paid Workers plan can build and deploy a Workflow right now: no waitlist, no sign-up form, no fake line around-the-block.
Open the src/index.ts file, poke around, start extending it, and deploy it with a quick wrangler deploy.
If you want to learn more about how Workflows works, how you can use it to build applications, and how we built it, read on.
Workflows? Durable Execution?
Workflows—which we announced back during Developer Week earlier this year—is our take on the concept of “Durable Execution”: the ability to build and execute applications that are durable in the face of errors, network issues, upstream API outages, rate limits, and (most importantly) infrastructure failure.
As over 2.4 million developers continue to build applications on top of Cloudflare Workers, R2, and Workers AI, we’ve noticed more developers building multi-step applications and workflows that process user data, transform unstructured data into structured, export metrics, persist state as they progress, and automatically retry & restart. But writing any non-trivial application and making it durable in the face of failure is hard: this is where Workflows comes in. Workflows manages the retries, emitting the metrics, and durably storing the state (without you having to stand up your own database) as the Workflow progresses.
What makes Workflows different from other takes on “Durable Execution” is that we manage the underlying compute and storage infrastructure for you. You’re not left managing a compute cluster and hoping it scales both up (on a Monday morning) and down (during quieter periods) to manage costs, or ensuring that you have compute running in the right locations. Workflows is built on Cloudflare Workers — our job is to run your code and operate the infrastructure for you.
As an example of how Workflows can help you build durable applications, assume you want to post-process file uploads from your users that were uploaded to an R2 bucket directly via a pre-signed URL. That post-processing could involve multiple actions: text extraction via a Workers AI model, calls to a third-party API to validate data, updating or querying rows in a database once the file has been processed… the list goes on.
But what each of these actions has in common is that it could fail. Maybe that upstream API is unavailable, maybe you get rate-limited, maybe your database is down. Having to write extensive retry logic around each action, manage backoffs, and (importantly) ensure your application doesn’t have to start from scratch when a later step fails is more boilerplate to write and more code to test and debug.
What’s a step, you ask? The core building block of every Workflow is the step: an individually retriable component of your application that can optionally emit state. That state is then persisted, even if subsequent steps were to fail. This means that your application doesn’t have to restart, allowing it to not only recover more quickly from failure scenarios, but it can also avoid doing redundant work. You don’t want your application hammering an expensive third-party API (or getting you rate limited) because it’s naively retrying an API call that you don’t have to.
Notably, a Workflow can have hundreds of steps: one of the Rules of Workflows is to encapsulate every API call or stateful action within your application into its own step. Each step can also define its own retry strategy, automatically backing off, adding a delay and/or (eventually) giving up after a set number of attempts.
await step.do(
	'make a call to write that could maybe, just might, fail',
	// Define a retry strategy
	{
		retries: {
			limit: 5,
			delay: '5 seconds',
			backoff: 'exponential',
		},
		timeout: '15 minutes',
	},
	async () => {
		// Do stuff here, with access to the state from our previous steps
		if (Math.random() > 0.5) {
			throw new Error('API call to $STORAGE_SYSTEM failed');
		}
	},
);
To illustrate this further, imagine you have an application that reads text files from an R2 storage bucket, pre-processes the text into chunks, generates text embeddings using Workers AI, and then inserts those into a vector database (like Vectorize) for semantic search.
In the Workflows programming model, each of those is a discrete step, and each can emit state. For example, each of the four actions below can be a discrete step.do call in a Workflow:
Reading the files from storage and emitting the list of filenames
Chunking the text and emitting the results
Generating text embeddings
Upserting them into Vectorize and capturing the result of a test query
You can also start to imagine that some steps, such as chunking text or generating text embeddings, can be broken down into even more steps — a step per file that we chunk, or a step per API call to our text embedding model, so that our application is even more resilient to failure.
Steps can be created programmatically or conditionally based on input, allowing you to dynamically create steps based on the number of inputs your application needs to process. You do not need to define all steps ahead of time, and each instance of a Workflow may choose to conditionally create steps on the fly.
Building Cloudflare on Cloudflare
As the Cloudflare Developer platform continues to grow, almost all of our own products are built on top of it. Workflows is yet another example of how we built a new product from scratch using nothing but Workers and its vast catalog of features and APIs. This section of the blog has two goals: to explain how we built it, and to demonstrate that anyone can create a complex application or platform with demanding requirements and multiple architectural layers on our stack, too.
To understand how Workflows uses Workers & Durable Objects, here’s the high-level overview of our architecture:
There are three main blocks in this diagram:
The user-facing APIs are where the user interacts with the platform, creating and deploying new workflows or instances, controlling them, and accessing their state and activity logs. These operations can be executed through our public API gateway using REST calls, a Worker script using bindings, Wrangler (Cloudflare’s developer platform command line tool), or via the Dashboard user interface.
The managed platform holds the internal configuration APIs running on a Worker implementing a catalog of REST endpoints, the binding shim, which is supported by another dedicated Worker, every account controller, and their correspondent workflow engines, all powered by SQLite-backed Durable Objects. This is where all the magic happens and what we are sharing more details about in this technical blog.
Finally, there are the workflow instances, essentially independent clones of the workflow application. Instances are user account-owned and have a one-to-one relationship with a managed engine that powers them. You can run as many instances and engines as you want concurrently.
Let’s get into more detail…
Configuration API and Binding Shim
The Configuration API and the Binding Shim are two stateless Workers; one receives REST API calls from clients calling our API Gateway directly, using Wrangler, or navigating the Dashboard UI, and the other is the endpoint for the Workflows binding, an efficient and authenticated interface to interact with the Cloudflare Developer Platform resources from a Workers script.
The configuration API worker uses HonoJS and Zod to implement the REST endpoints, which are declared in an OpenAPI schema and exported to our API Gateway, thus adding our methods to the Cloudflare API catalog.
import { swaggerUI } from '@hono/swagger-ui';
import { createRoute, OpenAPIHono, z } from '@hono/zod-openapi';
import { Hono } from 'hono';
...
api.openapi(
createRoute({
method: 'get',
path: '/',
request: {
query: PaginationParams,
},
responses: {
200: {
content: {
'application/json': {
schema: APISchemaSuccess(z.array(WorkflowWithInstancesCountSchema)),
},
},
description: 'List of all Workflows belonging to a account.',
},
},
}),
async (ctx) => {
...
},
);
...
api.route('/:workflow_name', routes.workflows);
api.route('/:workflow_name/instances', routes.instances);
api.route('/:workflow_name/versions', routes.versions);
These Workers perform two different functions, but they share a large portion of their code and implement similar logic; once the request is authenticated and ready to travel to the next stage, they use the account ID to delegate the operation to a Durable Object called Account Controller.
// env.ACCOUNTS is the Account Controllers Durable Objects namespace
const accountStubId = c.env.ACCOUNTS.idFromName(accountId.toString());
const accountStub = c.env.ACCOUNTS.get(accountStubId);
As you can see, every account has its own Account Controller Durable Object.
Account Controllers
The Account Controller is a dedicated persisted database that stores the list of all the account’s workflows, versions, and instances. We scale to millions of account controllers, one per every Cloudflare account using Workflows, by leveraging the power of Durable Objects with SQLite backend.
Durable Objects (DOs) are single-threaded singletons that run in our data centers and are bound to a stateful storage API, in this case, SQLite. They are also Workers, just a special kind, and have access to all of our other APIs. This makes it easy to build consistent, highly available distributed applications with them.
Here’s what we get for free by using one Durable Object per Workflows account:
Sharding based on account boundaries aligns perfectly with the way we manage resources at Cloudflare internally. Also, due to the nature of DOs, there are other things that this model gets us for free: Not that we expect them, but eventual bugs or state inconsistencies during beta are confined to the affected account, and don’t impact everyone.
DO instances run close to the end user; Alice is in London and will call the config API through our LHR data center, while Bob is in Lisbon and will connect to LIS.
Because every account is a Worker, we can gradually upgrade them to new versions, starting with the internal users, thus derisking real customers.
Before SQLite, our only option was to use the Durable Object’s key-value storage API, but having a relational database at our fingertips and being able to create tables and do complex queries is a significant enabler. For example, take a look at how we implement the internal method getWorkflow():
async function getWorkflow(accountId: number, workflowName: string) {
  try {
    const res = this.ctx.storage.transactionSync(() => {
      const cursor = Array.from(
        this.ctx.storage.sql.exec(
          `
                    SELECT *,
                    (SELECT class_name
                        FROM   versions
                        WHERE  workflow_id = w.id
                        ORDER  BY created_on DESC
                        LIMIT  1) AS class_name
                    FROM   workflows w
                    WHERE  w.name = ?
                    `,
          workflowName
        )
      )[0] as Workflow;

      return cursor;
    });

    this.sendAnalytics(accountId, begin, "getWorkflow");
    return res as Workflow | undefined;
  } catch (err) {
    this.sendErrorAnalytics(accountId, begin, "getWorkflow");
    throw err;
  }
}
The other thing we take advantage of in Workflows is using the recently announced JavaScript-native RPC feature when communicating between components.
Before RPC, we had to fetch() between components, make HTTP requests, and serialize and deserialize the parameters and the payload. Now, we can async call the remote object’s method as if it was local. Not only does this feel more natural and simplify our logic, but it’s also more efficient, and we can take advantage of TypeScript type-checking when writing code.
This is how the Configuration API would call the Account Controller’s countWorkflows() method before:
The other powerful feature of our RPC system is that it supports passing not only Structured Cloneable objects back and forth but also entire classes. More on this later.
Let’s move on to Engine.
Engine and instance
Every instance of a workflow runs alongside an Engine instance. The Engine is responsible for starting up the user’s workflow entry point, executing the steps on behalf of the user, handling their results, and tracking the workflow state until completion.
When we started thinking about the Engine, we thought about modeling it after a state machine, and that was what our initial prototypes looked like. However, state machines require an ahead-of-time understanding of the userland code, which implies having a build step before running them. This is costly at scale and introduces additional complexity.
A few iterations later, we had another idea. What if we could model the engine as a game loop?
Unlike other computer programs, games operate regardless of a user’s input. The game loop is essentially a sequence of tasks that implement the game’s logic and update the display, typically one loop per video frame. Here’s an example of a game loop in pseudo-code:
while (game in running)
    check for user input
    move graphics
    play sounds
end while
Well, an oversimplified version of our Workflow engine would look like this:
while (last step not completed)
    iterate every step
       use memoized cache as response if the step has run already
       continue running step or timer if it hasn't finished yet
end while
A workflow is indeed a loop that keeps on going, performing the same sequence of logical tasks until the last step completes.
The Engine and the instance run hand-in-hand in a one-to-one relationship. The first is managed, and part of the platform. It uses SQLite and other platform APIs internally, and we can constantly add new features, fix bugs, and deploy new versions, while keeping everything transparent to the end user. The second is the actual account-owned Worker script that declares the Workflow steps.
For example, when someone passes a callback into step.do():
We switch execution over to the Engine. Again, this is possible because of the power of JS RPC. Besides passing Structured Cloneable objects back and forth, JS RPC allows us to create and pass entire application-defined classes that extend the built-in RpcTarget. So this is what happens behind the scenes when your Instance calls step.do() (simplified):
export class Context extends RpcTarget {

  async do<T>(name: string, callback: () => Promise<T>): Promise<T> {

    // First we check we have a cache of this step.do() already
    const maybeResult = await this.#state.storage.get(name);

    // We return the cache if it exists
    if (maybeValue) { return maybeValue; }

    // Else we run the user callback
    return doWrapper(callback);
  }

}
Here’s a more complete diagram of the Engine’s step.do() lifecycle:
Again, this diagram only partially represents everything we do in the Engine; things like logging for observability or handling exceptions are missing, and we don’t get into the details of how queuing is implemented. However, it gives you a good idea of how the Engine abstracts and handles all the complexities of completing a step under the hood, allowing us to expose a simple-to-use API to end users.
Also, it’s worth reiterating that every workflow instance is an Engine behind the scenes, and every Engine is an SQLite-backed Durable Object. This ensures that every instance runtime and state are isolated and independent of each other and that we can effortlessly scale to run billions of workflow instances, a solved problem for Durable Objects.
Durability
Durable Execution is all the rage now when we talk about workflow engines, and ours is no exception. Workflows are typically long-lived processes that run multiple functions in sequence where anything can happen. Those functions can time out or fail because of a remote server error or a network issue and need to be retried. A workflow engine ensures that your application runs smoothly and completes regardless of the problems it encounters.
Durability means that if and when a workflow fails, the Engine can re-run it, resume from the last recorded step, and deterministically re-calculate the state from all the successful steps’ cached responses. This is possible because steps are stateful and idempotent; they produce the same result no matter how many times we run them, thus not causing unintended duplicate effects like sending the same invoice to a customer multiple times.
We ensure durability and handle failures and retries by sharing the same technique we use for a step.sleep() that requires sleeping for days or months: a combination of using scheduler.wait(), a method of the upcoming WICG Scheduling API that we already support, and Durable Objects alarms, which allow you to schedule the Durable Object to be woken up at a time in the future.
These two APIs allow us to overcome the lack of guarantees that a Durable Object runs forever, giving us complete control of its lifecycle. Since every state transition through userland code persists in the Engine’s strongly consistent SQLite, we track timestamps when a step begins execution, its attempts (if it needs retries), and its completion.
This means that steps pending if a Durable Object is evicted — perhaps due to a two-month-long timer — get rerun on the next lifetime of the Engine (with its cache from the previous lifetime hydrated) that is triggered by an alarm set with the timestamp of the next expected state transition.
Real-life workflow, step by step
Let’s walk through an example of a real-life application. You run an e-commerce website and would like to send email reminders to your customers for forgotten carts that haven’t been checked out in a few days.
What would typically have to be a combination of a queue, a cron job, and querying a database table periodically can now simply be a Workflow that we start on every new cart:
import {
  WorkflowEntrypoint,
  WorkflowEvent,
  WorkflowStep,
} from "cloudflare:workers";
import { sendEmail } from "./legacy-email-provider";

type Params = {
  cartId: string;
};

type Env = {
  DB: D1Database;
};

export class Purchase extends WorkflowEntrypoint<Env, Params> {
  async run(
    event: WorkflowEvent<Params>,
    step: WorkflowStep
  ): Promise<unknown> {
    await step.sleep("wait for three days", "3 days");

    // Retrieve cart from D1
    const cart = await step.do("retrieve cart from database", async () => {
      const { results } = await this.env.DB.prepare(`SELECT * FROM cart WHERE id = ?`)
        .bind(event.payload.cartId)
        .all();
      return results[0];
    });

    if (!cart.checkedOut) {
      await step.do("send an email", async () => {
        await sendEmail("reminder", cart);
      });
    }
  }
}
This works great. However, sometimes the sendEmail function fails due to an upstream provider erroring out. While step.do automatically retries with a reasonable default configuration, we can define our settings:
The HTTP API makes it easy to trigger new instances of workflows from any system, even if it isn’t on Cloudflare, or from the command line. For example:
Wrangler goes one step further and gives us a friendlier set of commands to interact with workflows with fancy formatted outputs without needing to authenticate with tokens. Type npx wrangler workflows for help, or:
Furthermore, Workflows has first-party support in wrangler, and you can test your instances locally. A Workflow is similar to a regular WorkerEntrypoint in your Worker, which means that wrangler dev just naturally works.
❯ npx wrangler dev

 ⛅️ wrangler 3.82.0
----------------------------

Your worker has access to the following bindings:
- Workflows:
  - CART_WORKFLOW: EcommerceCartWorkflow
⎔ Starting local server...
[wrangler:inf] Ready on http://localhost:8787
╭───────────────────────────────────────────────╮
│  [b] open a browser, [d] open devtools        │
╰───────────────────────────────────────────────╯
Workflow APIs are also available as a Worker binding. You can interact with the platform programmatically from another Worker script in the same account without worrying about permissions or authentication. You can even have workflows that call and interact with other workflows.
import { WorkerEntrypoint } from "cloudflare:workers";

type Env = { DEMO_WORKFLOW: Workflow };
export default class extends WorkerEntrypoint<Env> {
  async fetch() {
    // Pass in a user defined name for this instance
    // In this case, we use the same as the cartId
    const instance = await this.env.DEMO_WORKFLOW.create({
      id: "f3bcc11b-2833-41fb-847f-1b19469139d1",
      params: {
          cartId: "f3bcc11b-2833-41fb-847f-1b19469139d1",
      }
    });
  }
  async scheduled() {
    // Restart errored out instances in a cron
    const instance = await this.env.DEMO_WORKFLOW.get(
      "f3bcc11b-2833-41fb-847f-1b19469139d1"
    );
    const status = await instance.status();
    if (status.error) {
      await instance.restart();
    }
  }
}
Observability
Having good observability and data on often long-lived asynchronous tasks is crucial to understanding how we’re doing under normal operation and, more importantly, when things go south, and we need to troubleshoot problems or when we are iterating on code changes.
We designed Workflows around the philosophy that there is no such thing as too much logging. You can get all the SQLite data for your workflow and its instances by calling the REST APIs. Here is the output of an instance:
As you can see, this is essentially a dump of the instance engine SQLite in JSON. You have the errors, messages, current status, and what happened with every step, all time stamped to the millisecond.
It’s one thing to get data about a specific workflow instance, but it’s another to zoom out and look at aggregated statistics of all your workflows and instances over time. Workflows data is available through our GraphQL Analytics API, so you can query it in aggregate and generate valuable insights and reports. In this example we ask for aggregated analytics about the wall time of all the instances of the “e-commerce-carts” workflow:
For convenience, you can evidently also use Wrangler to describe a workflow or an instance and get an instant and beautifully formatted response:
sid ~ npx wrangler workflows instances describe purchase-workflow latest

 ⛅️ wrangler 3.80.4

Workflow Name:         purchase-workflow
Instance Id:           d4280218-7756-41d2-bccd-8d647b82d7ce
Version Id:            0c07dbc4-aaf3-44a9-9fd0-29437ed11ff6
Status:                ✅ Completed
Trigger:               🌎 API
Queued:                14/10/2024, 16:25:17
Success:               ✅ Yes
Start:                 14/10/2024, 16:25:17
End:                   14/10/2024, 16:26:17
Duration:              1 minute
Last Successful Step:  wait for three days
Output:                false
Steps:

  Name:      wait for three days
  Type:      💤 Sleeping
  Start:     14/10/2024, 16:25:17
  End:       17/10/2024, 16:25:17
  Duration:  3 day
And finally, we worked really hard to get you the best dashboard UI experience when navigating Workflows data.
So, how much does it cost?
It’d be painful if we introduced a powerful new way to build Workers applications but made it cost prohibitive.
Workflows is priced just like Cloudflare Workers, where we introduced CPU-based pricing: only on active CPU time and requests, not duration (aka: wall time).
Workers Standard pricing model
This is especially advantageous when building the long-running, multi-step applications that Workflows enables: if you had to pay while your Workflow was sleeping, waiting on an event, or making a network call to an API, writing the “right” code would be at odds with writing affordable code.
There’s also no need to keep a Kubernetes cluster or a group of virtual machines running (and burning a hole in your wallet): we manage the infrastructure, and you only pay for the compute your Workflows consume.
What’s next?
Today, after months of developing the platform, we are announcing the open beta program, and we couldn’t be more excited to see how you will be using Workflows. Looking forward, we want to do things like triggering instances from queue messages and have other ideas, but at the same time, we are certain that your feedback will help us shape the roadmap ahead.
We hope that this blog post gets you thinking about how to use Workflows for your next application, but also that it inspires you on what you can build on top of Workers. Workflows as a platform is entirely built on top of Workers, its resources, and APIs. Anyone can do it, too.
Cloudflare Queues let a developer decouple their Workers into event-driven services. Producer Workers write events to a Queue, and consumer Workers are invoked to take actions on the events. For example, you can use a Queue to decouple an e-commerce website from a service which sends purchase confirmation emails to users. During 2024’s Birthday Week, we announced that Cloudflare Queues is now Generally Available, with significant performance improvements that enable larger workloads. To accomplish this, we switched to a new architecture for Queues that enabled the following improvements:
Median latency for sending messages has dropped from ~200ms to ~60ms
Maximum throughput for each Queue has increased over 10x, from 400 to 5000 messages per second
Maximum Consumer concurrency for each Queue has increased from 20 to 250 concurrent invocations
Median latency drops from ~200ms to ~60ms as Queues are migrated to the new architecture
In this blog post, we’ll share details about how we built Queues using Durable Objects and the Cloudflare Developer Platform, and how we migrated from an initial Beta architecture to a geographically-distributed, horizontally-scalable architecture for General Availability.
v1 Beta architecture
When initially designing Cloudflare Queues, we decided to build something simple that we could get into users’ hands quickly. First, we considered leveraging an off-the-shelf messaging system such as Kafka or Pulsar. However, we decided that it would be too challenging to operate these systems at scale with the large number of isolated tenants that we wanted to support.
Instead of investing in new infrastructure, we decided to build on top of one of Cloudflare’s existing developer platform building blocks: Durable Objects.Durable Objects are a simple, yet powerful building block for coordination and storage in a distributed system. In our initial v1 architecture, each Queue was implemented using a single Durable Object. As shown below, clients would send messages to a Worker running in their region, which would be forwarded to the single Durable Object hosted in the WNAM (Western North America) region. We used a single Durable Object for simplicity, and hosted it in WNAM for proximity to our centralized configuration API service.
One of a Queue’s main responsibilities is to accept and store incoming messages. Sending a message to a v1 Queue used the following flow:
A client sends a POST request containing the message body to the Queues API at /accounts/:accountID/queues/:queueID/messages
The request is handled by an instance of the Queue Broker Worker in a Cloudflare data center running near the client.
The Worker performs authentication, and then uses Durable Objects idFromName API to route the request to the Queue Durable Object for the given queueID
The Queue Durable Object persists the message to storage before returning a success back to the client.
Durable Objects handled most of the heavy-lifting here: we did not need to set up any new servers, storage, or service discovery infrastructure. To route requests, we simply provided a queueID and the platform handled the rest. To store messages, we used the Durable Object storage API to put each message, and the platform handled reliably storing the data redundantly.
Consuming messages
The other main responsibility of a Queue is to deliver messages to a Consumer. Delivering messages in a v1 Queue used the following process:
Each Queue Durable Object maintained an alarm that was always set when there were undelivered messages in storage. The alarm guaranteed that the Durable Object would reliably wake up to deliver any messages in storage, even in the presence of failures. The alarm time was configured to fire after the user’s selected max wait time, if only a partial batch of messages was available. Whenever one or more full batches were available in storage, the alarm was scheduled to fire immediately.
The alarm would wake the Durable Object, which continually looked for batches of messages in storage to deliver.
Each batch of messages was sent to a “Dispatcher Worker” that used Workers for Platformsdynamic dispatch to pass the messages to the queue() function defined in a user’s Consumer Worker
This v1 architecture let us flesh out the initial version of the Queues Beta product and onboard users quickly. Using Durable Objects allowed us to focus on building application logic, instead of complex low-level systems challenges such as global routing and guaranteed durability for storage. Using a separate Durable Object for each Queue allowed us to host an essentially unlimited number of Queues, and provided isolation between them.
However, using only one Durable Object per queue had some significant limitations:
Latency: we created all of our v1 Queue Durable Objects in Western North America. Messages sent from distant regions incurred significant latency when traversing the globe.
Throughput: A single Durable Object is not scalable: it is single-threaded and has a fixed capacity for how many requests per second it can process. This is where the previous 400 messages per second limit came from.
Consumer Concurrency: Due to concurrent subrequest limits, a single Durable Object was limited in how many concurrent subrequests it could make to our Dispatcher Worker. This limited the number of queue() handler invocations that it could run simultaneously.
To solve these issues, we created a new v2 architecture that horizontally scales across multiple Durable Objects to implement each single high-performance Queue.
v2 Architecture
In the new v2 architecture for Queues, each Queue is implemented using multiple Durable Objects, instead of just one. Instead of a single region, we place Storage Shard Durable Objects in all available regions to enable lower latency. Within each region, we create multiple Storage Shards and load balance incoming requests amongst them. Just like that, we’ve multiplied message throughput.
Sending a message to a v2 Queue uses the following flow:
A client sends a POST request containing the message body to the Queues API at /accounts/:accountID/queues/:queueID/messages
The request is handled by an instance of the Queue Broker Worker running in a Cloudflare data center near the client.
The Worker:
Performs authentication
Reads from Workers KV to obtain a Shard Map that lists available storage shards for the given region and queueID
Picks one of the region’s Storage Shards at random, and uses Durable Objects idFromName API to route the request to the chosen shard
The Storage Shard persists the message to storage before returning a success back to the client.
In this v2 architecture, messages are stored in the closest available Durable Object storage cluster near the user, greatly reducing latency since messages don’t need to be shipped all the way to WNAM. Using multiple shards within each region removes the bottleneck of a single Durable Object, and allows us to scale each Queue horizontally to accept even more messages per second. Workers KV acts as a fast metadata store: our Worker can quickly look up the shard map to perform load balancing across shards.
To improve the Consumer side of v2 Queues, we used a similar “scale out” approach. A single Durable Object can only perform a limited number of concurrent subrequests. In v1 Queues, this limited the number of concurrent subrequests we could make to our Dispatcher Worker. To work around this, we created a new Consumer Shard Durable Object class that we can scale horizontally, enabling us to execute many more concurrent instances of our users’ queue() handlers.
Consumer Durable Objects in v2 Queues use the following approach:
Each Consumer maintains an alarm that guarantees it will wake up to process any pending messages. v2 Consumers are notified by the Queue’s Coordinator (introduced below) when there are messages ready for consumption. Upon notification, the Consumer sets an alarm to go off immediately.
The Consumer looks at the shard map, which contains information about the storage shards that exist for the Queue, including the number of available messages on each shard.
The Consumer picks a random storage shard with available messages, and asks for a batch.
The Consumer sends the batch to the Dispatcher Worker, just like for v1 Queues.
After processing the messages, the Consumer sends another request to the Storage Shard to either “acknowledge” or “retry” the messages.
This scale-out approach enabled us to work around the subrequest limits of a single Durable Object, and increase the maximum supported concurrency level of a Queue from 20 to 250.
The Coordinator and “Control Plane”
So far, we have primarily discussed the “Data Plane” of a v2 Queue: how messages are load balanced amongst Storage Shards, and how Consumer Shards read and deliver messages. The other main piece of a v2 Queue is the “Control Plane”, which handles creating and managing all the individual Durable Objects in the system. In our v2 architecture, each Queue has a single Coordinator Durable Object that acts as the brain of the Queue. Requests to create a Queue, or change its settings, are sent to the Queue’s Coordinator.
The Coordinator maintains a Shard Map for the Queue, which includes metadata about all the Durable Objects in the Queue (including their region, number of available messages, current estimated load, etc.). The Coordinator periodically writes a fresh copy of the Shard Map into Workers KV, as pictured in step 1 of the diagram. Placing the shard map into Workers KV ensures that it is globally cached and available for our Worker to read quickly, so that it can pick a shard to accept the message.
Every shard in the system periodically sends a heartbeat to the Coordinator as shown in steps 2 and 3 of the diagram. Both Storage Shards and Consumer Shards send heartbeats, including information like the number of messages stored locally, and the current load (requests per second) that the shard is handling. The Coordinator uses this information to perform autoscaling. When it detects that the shards in a particular region are overloaded, it creates additional shards in the region, and adds them to the shard map in Workers KV. Our Worker sees the updated shard map and naturally load balances messages across the freshly added shards. Similarly, the Coordinator looks at the backlog of available messages in the Queue, and decides to add more Consumer shards to increase Consumer throughput when the backlog is growing. Consumer Shards pull messages from Storage Shards for processing as shown in step 4 of the diagram.
Switching to a new scalable architecture allowed us to meet our performance goals and take Queues to GA. As a recap, this new architecture delivered these significant improvements:
P50 latency for writing to a Queue has dropped from ~200ms to ~60ms.
Maximum throughput for a Queue has increased from 400 to 5000 messages per second.
Maximum consumer concurrency has increased from 20 to 250 invocations.
What’s next for Queues
We plan on leveraging the performance improvements in the new beta version of Durable Objects which use SQLite to continue to improve throughput/latency in Queues.
We will soon be adding message management features to Queues so that you can take actions to purge messages in a queue, pause consumption of messages, or “redrive”/move messages from one queue to another (for example messages that have been sent to a Dead Letter Queue could be “redriven” or moved back to the original queue).
Work to make Queues the “event hub” for the Cloudflare Developer Platform:
Create a low-friction way for events emitted from other Cloudflare services with event schemas to be sent to Queues.
Build multi-Consumer support for Queues so that Queues are no longer limited to one Consumer per queue.
To start using Queues, head over to our Getting Started guide.
Do distributed systems like Cloudflare Queues and Durable Objects interest you? Would you like to help build them at Cloudflare? We’re Hiring!
Vectorize is a globally distributed vector database that enables you to build full-stack, AI-powered applications with Cloudflare Workers. Vectorize makes querying embeddings — representations of values or objects like text, images, audio that are designed to be consumed by machine learning models and semantic search algorithms — faster, easier and more affordable.
A vector database is a queryable store of vectors. A vector is a large array of numbers called vector dimensions.
A vector database has a similarity search query: given an input vector, it returns the vectors that are closest according to a specified metric, potentially filtered on their metadata.
Conventional data structures like B-trees, or binary search trees expect the data they index to be cheap to compare and to follow a one-dimensional linear ordering. They leverage this property of the data to organize it in a way that makes search efficient. Strings, numbers, and booleans are examples of data featuring this property.
Because vectors are high-dimensional, ordering them in a one-dimensional linear fashion is ineffective for similarity search, as the resulting ordering doesn’t capture the proximity of vectors in the high-dimensional space. This phenomenon is often referred to as the curse of dimensionality.
In addition to this, comparing two vectors using distance metrics useful for similarity search is a computationally expensive operation, requiring vector-specific techniques for databases to overcome.
Query processing architecture
Vectorize builds upon Cloudflare’s global network to bring fast vector search close to its users, and relies on many components to do so.
These are the Vectorize components involved in processing vector queries.
Each query is processed on a server in the data center in which it enters, picked in a fashion that spreads the load across all servers of that data center.
The Vectorize DB Service (a Rust binary) running on that server processes the query by reading the data for that index on R2, Cloudflare’s object storage. It does so by reading through Cloudflare’s Cache to speed up I/O operations.
Searching vectors, and indexing them to speed things up
Being a vector database, Vectorize features a similarity search query: given an input vector, it returns the K vectors that are closest according to a specified metric.
Conceptually, this similarity search consists of 3 steps:
Evaluate the proximity of the query vector with every vector present in the index.
Sort the vectors based on their proximity “score”.
Return the top matches.
While this method is accurate and effective, it is computationally expensive and does not scale well to indexes containing millions of vectors (see Why do vectors require special database support? above).
To do better, we need to prune the search space, that is, avoid scanning the entire index for every query.
For this to work, we need to find a way to discard vectors we know are irrelevant for a query, while focusing our efforts on those that might be relevant.
Indexing vectors with IVF
Vectorize prunes the search space for a query using an indexing technique called IVF, Inverted File Index.
IVF clusters the index vectors according to their relative proximity. For each cluster, it then identifies its centroid, the center of gravity of that cluster, a high-dimensional point minimizing the distance with every vector in the cluster.
Once the list of centroids is determined, each centroid is given a number. We then structure the data on storage by placing each vector in a file named like the centroid it is closest to.
When processing a query, we then can then focus on relevant vectors by looking only in the centroid files closest to that query vector, effectively pruning the search space.
Compressing vectors with PQ
Vectorize supports vectors of up to 1536 dimensions. At 4 bytes per dimension (32 bits float), this means up to 6 KB per vector. That’s 6 GB of uncompressed vector data per million vectors that we need to fetch from storage and put in memory.
To process multi-million vector indexes while limiting the CPU, memory, and I/O required to do so, Vectorize uses a dimensionality reduction technique called PQ (Product Quantization). PQ compresses the vectors data in a way that retains most of their specificity while greatly reducing their size — a bit like down sampling a picture to reduce the file size, while still being able to tell precisely what’s in the picture — enabling Vectorize to efficiently perform similarity search on these lighter vectors.
In addition to storing the compressed vectors, their original data is retained on storage as well, and can be requested through the API; the compressed vector data is used only to speed up the search.
Approximate nearest neighbor search and result accuracy refining
By pruning the search space and compressing the vector data, we’ve managed to increase the efficiency of our query operation, but it is now possible to produce a set of matches that is different from the set of true closest matches. We have traded result accuracy for speed by performing an approximate nearest neighbor search, reaching an accuracy of ~80%.
Whenever you query your Vectorize index, you are guaranteed to receive results which are read from a consistent, immutable snapshot — even as you write to your index concurrently. Writes are applied in strict order of their arrival in our system, and they are funneled into an asynchronous process. We update the index files by reading the old version, making changes, and writing this updated version as a new object in R2. Each index file has its own version number, and can be updated independently of the others. Between two versions of the index we may update hundreds or even thousands of IVF and metadata index files, but even as we update the files, your queries will consistently use the current version until it is time to switch.
Each IVF and metadata index file has its own version. The list of all versioned files which make up the snapshotted version of the index is contained within a manifest file. Each version of the index has its own manifest. When we write a new manifest file based on the previous version, we only need to update references to the index files which were modified; if there are files which weren’t modified, we simply keep the references to the previous version.
We use a root manifest as the authority of the current version of the index. This is the pivot point for changes. The root manifest is a copy of a manifest file from a particular version, which is written to a deterministic location (the root of the R2 bucket for the index). When our async write process has finished processing vectors, and has written all new index files to R2, we commit by overwriting the current root manifest with a copy of the new manifest. PUT operations in R2 are atomic, so this effectively makes our updates atomic. Once the manifest is updated, Vectorize DB Service instances running on our network will pick it up, and use it to serve reads.
Because we keep past versions of index and manifest files, we effectively maintain versioned snapshots of your index. This means we have a straightforward path towards building a point-in-time recovery feature (similar to D1’s Time Travel feature).
You may have noticed that because our write process is asynchronous, this means Vectorize is eventually consistent — that is, there is a delay between the successful completion of a request writing on the index, and finally seeing those updates reflected in queries. This isn’t always ideal for all data storage use cases. For example, imagine two users using an online ticket reservation application for airline tickets, where both users buy the same seat — one user will successfully reserve the ticket, and the other will eventually get an error saying the seat was taken, and they need to choose again. Because a vector index is not typically used as a primary database for these transactional use cases, we decided eventual consistency was a worthy trade off in order to ensure Vectorize queries would be fast, high-throughput, and cheap even as the size of indexes grew into the millions.
Coordinating distributed writes: it’s just another block in the WAL
In the section above, we touched on our eventually consistent, asynchronous write process. Now we’ll dive deeper into our implementation.
The WAL
A write ahead log (WAL) is a common technique for making atomic and durable writes in a database system. Vectorize’s WAL is implemented with SQLite in Durable Objects.
In Vectorize, the payload for each update is given an ID, written to R2, and the ID for that payload is handed to the WAL Durable Object which persists it as a “block.” Because it’s just a pointer to the data, the blocks are lightweight records of each mutation.
Durable Objects (DO) have many benefits — strong transactional guarantees, a novel combination of compute and storage, and a high degree of horizontal scale — but individual DOs are small allotments of memory and compute. However, the process of updating the index for even a single mutation is resource intensive — a single write may include thousands of vectors, which may mean reading and writing thousands of data files stored in R2, and storing a lot of data in memory. This is more than what a single DO can handle.
So we designed the WAL to leverage DO’s strengths and made it a coordinator. It controls the steps of updating the index by delegating the heavy lifting to beefier instances of compute resources (which we call “Executors”), but uses its transactional properties to ensure the steps are done with strong consistency. It safeguards the process from rogue or stalled executors, and ensures the WAL processing continues to move forward. DOs are easy to scale, so we create a new DO instance for each Vectorize index.
WAL Executor
The executors run from a single pool of compute resources, shared by all WALs. We use a simple producer-consumer pattern using Cloudflare Queues. The WAL enqueues a request, and executors poll the queue. When they get a request, they call an API on the WAL requesting to be assigned to the request.
The WAL ensures that one and only one executor is ever assigned to that write. As the executor writes, the index files and the updated manifest are written in R2, but they are not yet visible. The final step is for the executor to call another API on the WAL to commit the change — and this is key — it passes along the updated manifest. The WAL is responsible for overwriting the root manifest with the updated manifest. The root manifest is the pivot point for atomic updates: once written, the change is made visible to Vectorize’s database service, and the updated data will appear in queries.
From the start, we designed this process to account for non-deterministic errors. We focused on enumerating failure modes first, and only moving forward with possible design options after asserting they handled the possibilities for failure. For example, if an executor stalls, the WAL finds a new executor. If the first executor comes back, the coordinator will reject its attempt to commit the update. Even if that first executor is working on an old version which has already been written, and writes new index files and a new manifest to R2, they will not overwrite the files written from the committed version.
Batching updates
Now that we have discussed the general flow, we can circle back to one of our favorite features of the WAL. On the executor, the most time-intensive part of the write process is reading and writing many files from R2. Even with making our reads and writes concurrent to maximize throughput, the cost of updating even thousands of vectors within a single file is dwarfed by the total latency of the network I/O. Therefore it is more efficient to maximize the number of vectors processed in a single execution.
So that is what we do: we batch discrete updates. When the WAL is ready to request work from an executor, it will get a chunk of “blocks” off the WAL, starting with the next un-written block, and maintaining the sequence of blocks. It will write a new “batch” record into the SQLite table, which ties together that sequence of blocks, the version of the index, and the ID of the executor assigned to the batch.
Users can batch multiple vectors to update in a single insert or upsert call. Because the size of each update can vary, the WAL adaptively calculates the optimal size of its batch to increase throughput. The WAL will fit as many upserted vectors as possible into a single batch by counting the number of updates represented by each block. It will batch up to 200,000 vectors at once (a value we arrived at after our own testing) with a limit of 1,000 blocks. With this throughput, we have been able to quickly load millions of vectors into an index (with upserts of 5,000 vectors at a time). Also, the WAL does not pause itself to collect more writes to batch — instead, it begins processing a write as soon as it arrives. Because the WAL only processes one batch at a time, this creates a natural pause in its workflow to batch up writes which arrive in the meantime.
Retraining the index
The WAL also coordinates our process for retraining the index. We occasionally re-train indexes to ensure the mapping of IVF centroids best reflects the current vectors in the index. This maintains the high accuracy of the vector search.
Retraining produces a completely new index. All index files are updated; vectors have been reshuffled across the index space. For this reason, all indexes have a second version stamp — which we call the generation — so that we can differentiate between retrained indexes.
The WAL tracks the state of the index, and controls when the training is started. We have a second pool of processes called “trainers.” The WAL enqueues a request on a queue, then a trainer picks up the request and it begins training.
Training can take a few minutes to complete, but we do not pause writes on the current generation. The WAL will continue to handle writes as normal. But the training runs from a fixed snapshot of the index, and will become out-of-date as the live index gets updated in parallel. Once the trainer has completed, it signals the WAL, which will then start a multi-step process to switch to the new generation. It enters a mode where it will continue to record writes in the WAL, but will stop making those writes visible on the current index. Then it will begin catching up the retrained index with all of the updates that came in since it started. Once it has caught up to all data present in the index when the trainer signaled the WAL, it will switch over to the newly retrained index. This prevents the new index from appearing to “jump back in time.” All subsequent writes will be applied to that new index.
This is all modeled seamlessly with the batch record. Because it associates the index version with a range of WAL blocks, multiple batches can span the same sequence of blocks as long as they belong to different generations. We can say this another way: a single WAL block can be associated with many batches, as long as these batches are in different generations. Conceptually, the batches act as a second WAL layered over the WAL blocks.
Indexing and filtering metadata
Vectorize supports metadata filters on vector similarity queries. This allows a query to focus the vector similarity search on a subset of the index data, yielding matches that would otherwise not have been part of the top results.
For instance, this enables us to query for the best matching vectors for color: “blue” and category: ”robe”.
Conceptually, what needs to happen to process this example query is:
Identify the set of vectors matching color: “blue” by scanning all metadata.
Identify the set of vectors matching category: “robe” by scanning all metadata.
Intersect both sets (boolean AND in the filter) to identify vectors matching both the color and category filter.
Score all vectors in the intersected set, and return the top matches.
While this method works, it doesn’t scale well. For an index with millions of vectors, processing the query that way would be very resource intensive. What’s worse, it prevents us from using our IVF index to identify relevant vector data, forcing us to compute a proximity score on potentially millions of vectors if the filtered set of vectors is large.
To do better, we need to prune the metadata search space by indexing it like we did for the vector data, and find a way to efficiently join the vector sets produced by the metadata index with our IVF vector index.
Indexing metadata with Chunked Sorted List Indexes
Vectorize maintains one metadata index per filterable property. Each filterable metadata property is indexed using a Chunked Sorted List Index.
A Chunked Sorted List Index is a sorted list of all distinct values present in the data for a filterable property, with each value mapped to the set of vector IDs having that value. This enables Vectorize to binary search a value in the metadata index in O(log n) complexity, in other words about as fast as search can be on a large dataset.
Because it can become very large on big indexes, the sorted list is chunked in pieces matching a target weight in KB to keep index state fetches efficient.
A lightweight chunk descriptor list is maintained in the index manifest, keeping track of the list chunks and their lower/upper values. This chunk descriptor list can be binary searched to identify which chunk would contain the searched metadata value.
Once the candidate chunk is identified, Vectorize fetches that chunk from index data and binary searches it to take the set of vector IDs matching a metadata value if found, or an empty set if not found.
We identify the matching vector set this way for every predicate in the metadata filter of the query, then intersect the sets in memory to determine the final set of vectors matched by the filters.
This is just half of the query being processed. We now need to identify the vectors most similar to the query vector, within those matching the metadata filters.
Joining the metadata and vector indexes
A vector similarity query always comes with an input vector. We can rank all centroids of our IVF vector index based on their proximity with that query vector.
The vector set matched by the metadata filters contains for each vector its ID and IVF centroid number.
From this, Vectorize derives the number of vectors matching the query filters per IVF centroid, and determines which and how many top-ranked IVF centroids need to be scanned according to the number of matches the query asks for.
Vectorize then performs the IVF-indexed vector search (see the section Searching Vectors, and indexing them to speed things up above) by considering only the vectors in the filtered metadata vector set while doing so.
Because we’re effectively pruning the vector search space using metadata filters, filtered queries can often be faster than their unfiltered equivalent.
Query performance
The performance of a system is measured in terms of latency and throughput.
Latency is a measure relative to individual queries, evaluating the time it takes for a query to be processed, usually expressed in milliseconds. It is what an end user perceives as the “speed” of the service, so a lower latency is desirable.
Throughput is a measure relative to an index, evaluating the number of queries it can process concurrently over a period of time, usually expressed in requests per second or RPS. It is what enables an application to scale to thousands of simultaneous users, so a higher throughput is desirable.
Vectorize is designed for great index throughput and optimized for low query latency to deliver great performance for demanding applications. Check out our benchmarks.
Query latency optimization
As a distributed database keeping its data state on blob storage, Vectorize’s latency is primarily driven by the fetch of index data, and relies heavily on Cloudflare’s network of caches as well as individual server RAM cache to keep latency low.
Because Vectorize data is snapshot versioned, (see Eventual consistency and snapshot versioning above), each version of the index data is immutable and thus highly cacheable, increasing the latency benefits Vectorize gets from relying on Cloudflare’s cache infrastructure.
To keep the index data lean, Vectorize uses techniques to reduce its weight. In addition to Product Quantization (see Compressing vectors with PQ above), index files use a space-efficient binary format optimized for runtime performance that Vectorize is able to use without parsing, once fetched.
Index data is fragmented in a way that minimizes the amount of data required to process a query. Auxiliary indexes into that data are maintained to limit the amount of fragments to fetch, reducing overfetch by jumping straight to the relevant piece of data on mass storage.
Vectorize boosts all vector proximity computations by leveraging SIMD CPU instructions, and by organizing the vector search in 2 passes, effectively balancing the latency/result accuracy ratio (see Approximate nearest neighbor search and result accuracy refining above).
When used via a Worker binding, each query is processed close to the server serving the worker request, and thus close to the end user, minimizing the network-induced latency between the end user, the Worker application, and Vectorize.
Query throughput
Vectorize runs in every Cloudflare data center, on thousands of servers across the world.
Thanks to the snapshot versioning of every index’s data, every server is simultaneously able to serve the index concurrently, without contention on state.
This means that a Vectorize index elastically scales horizontally with its distributed traffic, providing very high throughput for the most demanding Worker applications.
Increased index size
We are excited that our upgraded version of Vectorize can support a maximum of 5 million vectors, which is a 25x improvement over the limit in beta (200,000 vectors). All the improvements we discussed in this blog post contribute to this increase in vector storage. Improved query performance and throughput comes with this increase in storage as well.
However, 5 million may be constraining for some use cases. We have already heard this feedback. The limit falls out of the constraints of building a brand new globally distributed stateful service, and our desire to iterate fast and make Vectorize generally available so builders can confidently leverage it in their production apps.
We believe builders will be able to leverage Vectorize as their primary vector store, either with a single index or by sharding across multiple indexes. But if this limit is too constraining for you, please let us know. Tell us your use case, and let’s see if we can work together to make Vectorize work for you.
If you’re looking for inspiration on what to build, see the semantic search tutorial that combines Workers AI and Vectorize for document search, running entirely on Cloudflare. Or an example of how to combine OpenAI and Vectorize to give an LLM more context and dramatically improve the accuracy of its answers.
And if you have questions about how to use Vectorize for our product & engineering teams, or just want to bounce an idea off of other developers building on Workers AI, join the #vectorize and #workers-ai channels on our Developer Discord.
Failure is an expected state in production systems, and no predictable failure of either software or hardware components should result in a negative experience for users. The exact failure mode may vary, but certain remediation steps must be taken after detection. A common example is when an error occurs on a server, rendering it unfit for production workloads, and requiring action to recover.
When operating at Cloudflare’s scale, it is important to ensure that our platform is able to recover from faults seamlessly. It can be tempting to rely on the expertise of world-class engineers to remediate these faults, but this would be manual, repetitive, unlikely to produce enduring value, and not scaling. In one word: toil; not a viable solution at our scale and rate of growth.
In this post we discuss how we built the foundations to enable a more scalable future, and what problems it has immediately allowed us to solve.
Growing pains
The Cloudflare Site Reliability Engineering (SRE) team builds and manages the platform that helps product teams deliver our extensive suite of offerings to customers. One important component of this platform is the collection of servers that power critical products such as Durable Objects, Workers, and DDoS mitigation. We also build and maintain foundational software services that power our product offerings, such as configuration management, provisioning, and IP address allocation systems.
As part of tactical operations work, we are often required to respond to failures in any of these components to minimize impact to users. Impact can vary from lack of access to a specific product feature, to total unavailability. The level of response required is determined by the priority, which is usually a reflection of the severity of impact on users. Lower-priority failures are more common — a server may run too hot, or experience an unrecoverable hardware error. Higher-priority failures are rare and are typically resolved via a well-defined incident response process, requiring collaboration with multiple other teams.
The commonality of lower-priority failures makes it obvious when the response required, as defined in runbooks, is “toilsome”. To reduce this toil, we had previously implemented a plethora of solutions to automate runbook actions such as manually-invoked shell scripts, cron jobs, and ad-hoc software services. These had grown organically over time and provided solutions on a case-by-case basis, which led to duplication of work, tight coupling, and lack of context awareness across the solutions.
We also care about how long it takes to resolve any potential impact on users. A resolution process which involves the manual invocation of a script relies on human action, increasing the Mean-Time-To-Resolve (MTTR) and leaving room for human error. This risks increasing the amount of errors we serve to users and degrading trust.
These problems proved that we needed a way to automatically heal these platform components. This especially applies to our servers, for which failure can cause impact across multiple product offerings. While we have mechanisms to automatically steer traffic away from these degraded servers, in some rare cases the breakage is sudden enough to be visible.
Solving the problem
To provide a more reliable platform, we needed a new component that provides a common ground for remediation efforts. This would remove duplication of work, provide unified context-awareness and increase development speed, which ultimately saves hours of engineering time and effort.
A good solution would not allow only the SRE team to auto-remediate, it would empower the entire company. The key to adding self-healing capability was a generic interface for all teams to self-service and quickly remediate failures at various levels: machine, service, network, or dependencies.
A good way to think about auto-remediation is in terms of workflows. A workflow is a sequence of steps to get to a desired outcome. This is not dissimilar to a manual shell script which executes what a human would otherwise do via runbook instructions. Because of this logical fit with workflows, we decided to adopt Temporal.
Temporal is a durable execution platform which is useful to gracefully manage infrastructure failures such as network outages and transient failures in external service endpoints. This capability meant we only needed to build a way to schedule “workflow” tasks and have Temporal provide reliability guarantees. This allowed us to focus on building out the orchestration system to support the control and flow of workflow execution in our data centers.
How does Temporal work?
Before we discuss the system that provides our self-healing functions, let’s explore how the workflow execution engine works, as its native architecture provided numerous benefits that we took advantage of to build a more robust foundation.
The most attractive feature Temporal offered us was the ability to write code that has reliability baked in. Some examples of these primitives are automatic retries, timeouts, rollbacks, and queueing. The Temporal Platform consists of the Temporal Cluster and Worker processes (application code that contains your custom logic).
This architecture allowed us to write our application logic as we normally would, with the added benefits of Temporal. Since Temporal Workers are external to the cluster, we can run tasks anywhere across our global network — a feature that made it easy to build an extensible, easy-to-understand framework for automating tasks.
In Temporal terms, control is provided by the basic principles used to provide workflow execution — Workflows and Activities. A Workflow is simply a sequence of Activities, which are functions that ideally do only ONE task, such as making a request to an external service or rebooting a machine.
Control of workflow behavior can be done using ActivityOptions. This is where you can define timeouts for workflow execution, retry policies, and task queues. Each worker can poll several task queues for both Workflow and Activity tasks. If no worker is polling the task queue in which a Workflow task is declared, nothing happens.
Below, we describe how our automatic remediation system works. It is essentially a way to schedule tasks across our global network with built-in reliability guarantees. With this system, teams can serve their customers more reliably. An unexpected failure mode can be recognized and immediately mitigated, while the root cause can be determined later via a more detailed analysis.
Step one: we need a coordinator
After our initial testing of Temporal, it was now possible to write workflows. But we needed a way to schedule workflow tasks from other internal services. The coordinator was built to serve this purpose, and became the primary mechanism for the authorisation and scheduling of workflows.
The most important roles of the coordinator are authorisation, workflow task routing, and safety constraints enforcement. Each consumer is authorized via mTLS authentication, and the coordinator uses an ACL to determine whether to permit the execution of a workflow. An ACL configuration looks like the following example.
Each workflow specifies two key characteristics: where to run the tasks and the safety constraints, using an HCL configuration file. Example constraints could be whether to run on only a specific node type (such as a database), or if multiple parallel executions are allowed: if a task has been triggered too many times, that is a sign of a wider problem that might require human intervention. The coordinator uses the Temporal Visibility API to determine the current state of the executions in the Temporal cluster.
An example of a configuration file is shown below:
task_queue_target = "<target>"

# The following entries will ensure that
# 1. This workflow is not run at the same time in a 15m window.
# 2. This workflow will not run more than once an hour.
# 3. This workflow will not run more than 3 times in one day.
#
constraint {
    kind = "concurency"
    value = "1"
    period = "15m"
}

constraint {
    kind = "maxExecution"
    value = "1"
    period = "1h"
}

constraint {
    kind = "maxExecution"
    value = "3"
    period = "24h"
    is_global = true
}
Step two: Task Routing is amazing
An unforeseen benefit of using a central Temporal cluster was the discovery of Task Routing. This feature allows us to schedule a Workflow/Activity on any server that has a running Temporal Worker, and further segment by the type of server, its location, etc. For this reason, we have three primary task queues — the general queue in which tasks can be executed by any worker in the datacenter, the node type queue in which tasks can only be executed by a specific node type in the datacenter, and the individual node queue where we target a specific node for task execution.
We rely on this heavily to ensure the speed and efficiency of automated remediation. Certain tasks can be run in datacenters with known low latency to an external resource, or a node type with better performance than others (due to differences in the underlying hardware). This reduces the amount of failure and latency we see overall in task executions. Sometimes we are also constrained by certain types of tasks that can only run on a certain node type, such as a database.
Task Routing also means that we can configure certain task queues to have a higher priority for execution, although this is not a feature we have needed so far. A drawback of task routing is that every Workflow/Activity needs to be registered to the target task queue, which is a common gotcha. Thankfully, it is possible to catch this failure condition with proper testing.
Step three: when/how to self-heal?
None of this would be relevant if we didn’t put it to good use. A primary design goal for the platform was to ensure we had easy, quick ways to trigger workflows on the most important failure conditions. The next step was to determine what the best sources to trigger the actions were. The answer to this was simple: we could trigger workflows from anywhere as long as they are properly authorized and detect the failure conditions accurately.
Example triggers are an alerting system, a log tailer, a health check daemon, or an authorized engineer via a chatbot. Such flexibility allows a high level of reuse, and permits to invest more in workflow quality and reliability.
As part of the solution, we built a daemon that is able to poll a signal source for any unwanted condition and trigger a configured workflow. We have initially found Prometheus useful as a source because it contains both service-level and hardware/system-level metrics. We are also exploring more event-based trigger mechanisms, which could eliminate the need to use precious system resources to poll for metrics.
We already had internal services that are able to detect widespread failure conditions for our customers, but were only able to page a human. With the adoption of auto-remediation, these systems are now able to react automatically. This ability to create an automatic feedback loop with our customers is the cornerstone of these self-healing capabilities and we continue to work on stronger signals, faster reaction times, and better prevention of future occurrences.
The most exciting part, however, is the future possibility. Every customer cares about any negative impact from Cloudflare. With this platform we can onboard several services (especially those that are foundational for the critical path) and ensure we react quickly to any failure conditions, even before there is any visible impact.
Step four: packaging and deployment
The whole system is written in golang, and a single binary can implement each role. We distribute it as an apt package or a container for maximum ease of deployment.
We deploy a Temporal-based worker to every server we intend to run tasks on, and a daemon in datacenters where we intend to automatically trigger workflows based on the local conditions. The coordinator is more nuanced since we rely on task routing and can trigger from a central coordinator, but we have also found value in running coordinators locally in the datacenters. This is especially useful in datacenters with less capacity or degraded performance, removing the need for a round-trip to schedule the workflows.
Step five: test, test, test
Temporal provides native mechanisms to test an entire workflow, via a comprehensive test suite that supports end-to-end, integration, and unit testing, which we used extensively to prevent regressions while developing. We also ensured proper test coverage for all the critical platform components, especially the coordinator.
Despite the ease of written tests, we quickly discovered that they were not enough. After writing workflows, engineers need an environment as close as possible to the target conditions. This is why we configured our staging environments to support quick and efficient testing. These environments receive the latest changes and point to a different (staging) Temporal cluster, which enables experimentation and easy validation of changes.
After a workflow is validated in the staging environment, we can then do a full release to production. It seems obvious, but catching simple configuration errors before releasing has saved us many hours in development/change-related-task time.
Deploying to production
As you can guess from the title of this post, we put this in production to automatically react to server-specific errors and unrecoverable failures. To this end, we have a set of services that are able to detect single-server failure conditions based on analyzed traffic data. After deployment, we have successfully mitigated potential impact by taking any errant single sources of failure out of production.
We have also created a set of workflows to reduce internal toil and improve efficiency. These workflows can automatically test pull requests on target machines, wipe and reset servers after experiments are concluded, and take away manual processes that cost many hours in toil.
Building a system that is maintained by several SRE teams has allowed us to iterate faster, and rapidly tackle long-standing problems. We have set ambitious goals regarding toil elimination and are on course to achieve them, which will allow us to scale faster by eliminating the human bottleneck.
Looking to the future
Our immediate plans are to leverage this system to provide a more reliable platform for our customers and drastically reduce operational toil, freeing up engineering resources to tackle larger-scale problems. We also intend to leverage more Temporal features such as Workflow Versioning, which will simplify the process of making changes to workflows by ensuring that triggered workflows run expected versions.
We are also interested in how others are solving problems using durable execution platforms such as Temporal, and general strategies to eliminate toil. If you would like to discuss this further, feel free to reach out on the Cloudflare Community and start a conversation!
2024 marks Cloudflare’s 14th birthday. Birthday Week each year is packed with major announcements and the release of innovative new offerings, all focused on giving back to our customers and the broader Internet community. Birthday Week has become a proud tradition at Cloudflare and our culture, to not just stay true to our mission, but to always stay close to our customers. We begin planning for this week of celebration earlier in the year and invite everyone at Cloudflare to participate.
Months before Birthday Week, we invited teams to submit ideas for what to announce. We were flooded with submissions, from proposals for implementing new standards to creating new products for developers. Our biggest challenge is finding space for it all in just one week — there is still so much to build. Good thing we have a birthday to celebrate each year, but we might need an extra day in Birthday Week next year!
In case you missed it, here’s everything we announced during 2024’s Birthday Week:
Customers using Cloudflare to manage DNS can create a whole batch of records, enable proxying on many records, update many records to point to a new target at the same time, or even delete all of their records.
Taking the next step in advancing security with Ephemeral IDs, a new feature that generates a unique short-lived ID, without relying on any network-level information.
Speed Brain, our latest leap forward in speed, uses the Speculation Rules API to prefetch content for users’ likely next navigations — downloading web pages before they navigate to them and making pages load 45% faster.
Instant Purge invalidates cached content in under 150ms, offering the industry’s fastest cache purge with global latency for purges by tags, hostnames, and prefixes.
Next generation servers focused on exceptional performance and security, enhanced support for AI/ML workloads, and significant strides in power efficiency.
More powerful GPUs, expanded model support, enhanced logging and evaluations in AI Gateway, and Vectorize GA with larger index sizes and faster queries.
Persistent and queryable Workers logs, Node.js compatibility GA, improved Next.js support via OpenNext, built-in CI/CD for Workers, Gradual Deployments, Queues, and R2 Event Notifications GA, and more — making building on Cloudflare easier, faster, and more affordable.
Using new optimization techniques such as KV cache compression and speculative decoding, we’ve made large language model (LLM) inference lightning-fast on the Cloudflare Workers AI platform.
We’ve been working on something new — a platform for running containers across Cloudflare’s network. We already use it in production, for AI inference and more.
Extending our AI Assistant capabilities to help you build new WAF rules, added new AI bot and crawler traffic insights to Radar, and new AI bot blocking capabilities.
Our free plan is here to stay, and we reaffirm that commitment this week with 15 releases that make the Free plan even better.
One more thing…
Cloudflare serves millions of customers and their millions of domains across nearly every country on Earth. However, as a global company, the payment landscape can be complex — especially in regions outside of North America. While credit cards are very popular for online purchases in the US, the global picture is quite different. 60% of consumers across EMEA, APAC and LATAM choose alternative payment methods. For instance, European consumers often opt for SEPA Direct Debit, a bank transfer mechanism, while Chinese consumers frequently use Alipay, a digital wallet.
At Cloudflare, we saw this as an opportunity to meet customers where they are. Today, we’re thrilled to announce that we are expanding our payment system and launching a closed beta for a new payment method called Stripe Link. The checkout experience will be faster and more seamless, allowing our self-serve customers to pay using saved bank accounts or cards with Link. Customers who have saved their payment details at any business using Link can quickly check out without having to reenter their payment information.
These are the first steps in our efforts to expand our payment system to support global payment methods used by customers around the world.We’ll be rolling out new payment methods gradually, ensuring a smooth integration and gathering feedback from our customers every step of the way.
Until next year
That’s all for Birthday Week 2024. However, the innovation never stops at Cloudflare. Continue to follow the Cloudflare Blog all year long as we launch more products and features that help build a better Internet.
The continued growth of AI has fundamentally changed the Internet over the past 24 months. AI is increasingly ubiquitous, and Cloudflare is leaning into the new opportunities and challenges it presents in a big way. This year for Cloudflare’s birthday, we’ve extended our AI Assistant capabilities to help you build new WAF rules, added AI bot traffic insights on Cloudflare Radar, and given customers new AI bot blocking capabilities.
AI Assistant for WAF Rule Builder
At Cloudflare, we’re always listening to your feedback and striving to make our products as user-friendly and powerful as possible. One area where we’ve heard your feedback loud and clear is in the complexity of creating custom and rate-limiting rules for our Web Application Firewall (WAF). With this in mind, we’re excited to introduce a new feature that will make rule creation easier and more intuitive: the AI Assistant for WAF Rule Builder.
By simply entering a natural language prompt, you can generate a custom or rate-limiting rule tailored to your needs. For example, instead of manually configuring a complex rule matching criteria, you can now type something like, “Match requests with low bot score,” and the assistant will generate the rule for you. It’s not about creating the perfect rule in one step, but giving you a strong foundation that you can build on.
The assistant will be available in the Custom and Rate Limit Rule Builder for all WAF users. We’re launching this feature in Beta for all customers, and we encourage you to give it a try. We’re looking forward to hearing your feedback (via the UI itself) as we continue to refine and enhance this tool to meet your needs.
AI bot traffic insights on Cloudflare Radar
AI platform providers use bots to crawl and scrape websites, vacuuming up data to use for model training. This is frequently done without the permission of, or a business relationship with, the content owners and providers. In July, Cloudflare urged content owners and providers to “declare their AIndependence”, providing them with a way to block AI bots, scrapers, and crawlers with a single click. In addition to this so-called “easy button” approach, sites can provide more specific guidance to these bots about what they are and are not allowed to access through directives in a robots.txt file. Regardless of whether a customer chooses to block or allow requests from AI-related bots, Cloudflare has insight into request activity from these bots, and associated traffic trends over time.
Tracking traffic trends for AI bots can help us better understand their activity over time — which are the most aggressive and have the highest volume of requests, which launch crawls on a regular basis, etc. The new AI bot & crawler traffic graph on Radar’s Traffic page provides insight into these traffic trends gathered over the selected time period for the top known AI bots. The associated list of bots tracked here is based on the ai.robots.txt list, and will be updated with new bots as they are identified. Time series and summary data is available from the Radar API as well. (Traffic trends for the full set of AI bots & crawlers can be viewed in the new Data Explorer.)
Blocking more AI bots
For Cloudflare’s birthday, we’re following up on our previous blog post, Declaring Your AIndependence, with an update on the new detections we’ve added to stop AI bots. Customers who haven’t already done so can simply click the button to block AI bots to gain more protection for their website.
Enabling dynamic updates for the AI bot rule
The old button allowed customers to block verified AI crawlers, those that respect robots.txt and crawl rate, and don’t try to hide their behavior. We’ve added new crawlers to that list, but we’ve also expanded the previous rule to include 27 signatures (and counting) of AI bots that don’t follow the rules. We want to take time to say “thank you” to everyone who took the time to use our “tip line” to point us towards new AI bots. These tips have been extremely helpful in finding some bots that would not have been on our radar so quickly.
For each bot we’ve added, we’re also adding them to our “Definitely automated” definition as well. So, if you’re a self-service plan customer using Super Bot Fight Mode, you’re already protected. Enterprise Bot Management customers will see more requests shift from the “Likely Bot” range to the “Definitely automated” range, which we’ll discuss more below.
Under the hood, we’ve converted this rule logic to a Cloudflare managed rule (the same framework that powers our WAF). This enables our security analysts and engineers to safely push updates to the rule in real-time, similar to how new WAF rule changes are rapidly delivered to ensure our customers are protected against the latest CVEs. If you haven’t logged back into the Bots dashboard since the previous version of our AI bot protection was announced, click the button again to update to the latest protection.
The impact of new fingerprints on the model
One hidden beneficiary of fingerprinting new AI bots is our ML model. As we’ve discussed before, our global ML model uses supervised machine learning and greatly benefits from more sources of labeled bot data. Below, you can see how well our ML model recognized these requests as automated, before and after we updated the button, adding new rules. To keep things simple, we have shown only the top 5 bots by the volume of requests on the chart. With the introduction of our new managed rule, we have observed an improvement in our detection capabilities for the majority of these AI bots. Button v1 represents the old option that let customers block only verified AI crawlers, while Button v2 is the newly introduced feature that includes managed rule detections.
So how did we make our detections more robust? As we have mentioned before, sometimes a single attribute can give a bot away. We developed a sophisticated set of heuristics tailored to these AI bots, enabling us to effortlessly and accurately classify them as such. Although our ML model was already detecting the vast majority of these requests, the integration of additional heuristics has resulted in a noticeable increase in detection rates for each bot, and ensuring we score every request correctly 100% of the time. Transitioning from a purely machine learning approach to incorporating heuristics offers several advantages, including faster detection times and greater certainty in classification. While deploying a machine learning model is complex and time-consuming, new heuristics can be created in minutes.
The initial launch of the AI bots block button was well-received and is now used by over 133,000 websites, with significant adoption even among our Free tier customers. The newly updated button, launched on August 20, 2024, is rapidly gaining traction. Over 90,000 zones have already adopted the new rule, with approximately 240 new sites integrating it every hour. Overall, we are now helping to protect the intellectual property of more than 146,000 sites from AI bots, and we are currently blocking 66 million requests daily with this new rule. Additionally, we’re excited to announce that support for configuring AI bots protection via Terraform will be available by the end of this year, providing even more flexibility and control for managing your bot protection settings.
Bot behavior
With the enhancements to our detection capabilities, it is essential to assess the impact of these changes to bot activity on the Internet. Since the launch of the updated AI bots block button, we have been closely monitoring for any shifts in bot activity and adaptation strategies. The most basic fingerprinting technique we use to identify AI bot looking for simple user-agent matches. User-agent matches are important to monitor because they indicate the bot is transparently announcing who they are when they’re crawling a website.
The graph below shows a volume of traffic we label as AI bot over the past two months. The blue line indicates the daily request count, while the red line represents the monthly average number of requests. In the past two months, we have seen an average reduction of nearly 30 million requests, with a decrease of 40 million in the most recent month.This decline coincides with the release of Button v1 and Button v2. Our hypothesis is that with the new AI bots blocking feature, Cloudflare is blocking a majority of these bots, which is discouraging them from crawling.
This hypothesis is supported by the observed decline in requests from several top AI crawlers. Specifically, the Bytespider bot reduced its daily requests from approximately 100 million to just 50 million between the end of June and the end of August (see graph below). This reduction could be attributed to several factors, including our new AI bots block button and changes in the crawler’s strategy.
We have also observed an increase in the accountability of some AI crawlers. The most basic fingerprinting technique we use to identify AI bot looking for simple user-agent matches. User-agent matches are important to monitor because they indicate the bot is transparently announcing who they are when they’re crawling a website. These crawlers are now more frequently using their agents, reflecting a shift towards more transparent and responsible behavior. Notably, there has been a dramatic surge in the number of requests from the Perplexity user agent. This increase might be linked to previous accusationsthat Perplexity did not properly present its user agent, which could have prompted a shift in their approach to ensure better identification and compliance.
These trends suggest that our updates are likely affecting how AI crawlers interact with content. We will continue to monitor AI bot activity to help users control who accesses their content and how. By keeping a close watch on emerging patterns, we aim to provide users with the tools and insights needed to make informed decisions about managing their traffic.
Wrap up
We’re excited to continue to explore the AI landscape, whether we’re finding more ways to make the Cloudflare dashboard usable or new threats to guard against. Our AI insights on Radar update in near real-time, so please join us in watching as new trends emerge and discussing them in the Cloudflare Community.
We’ve been working on something new — a platform for running containers across Cloudflare’s network. We already use it in production for Workers AI, Workers Builds, Remote Browsing Isolation, and the Browser Rendering API. Today, we want to share an early look at how it’s built, why we built it, and how we use it ourselves.
In 2024, Cloudflare Workers celebrates its 7th birthday. When we first announced Workers, it was a completely new model for running compute in a multi-tenant way — on isolates, as opposed to containers. While, at the time, Workers was a pretty bare-bones functions-as-a-service product, we took a big bet that this was going to become the way software was going to be written going forward. Since introducing Workers, in addition to expanding our developer products in general to include storage and AI, we have been steadily adding more compute capabilities to Workers:
With each of these, we’ve faced a question — can we build this natively into the platform, in a way that removes, rather than adds complexity? Can we build it in a way that lets developers focus on building and shipping, rather than managing infrastructure, so that they don’t have to be a distributed systems engineer to build distributed systems?
In each instance, the answer has been YES. We try to solve problems in a way that simplifies things for developers in the long run, even if that is the harder path for us to take ourselves. If we didn’t, you’d be right to ask — why not self-host and manage all of this myself? What’s the point of the cloud if I’m still provisioning and managing infrastructure? These are the questions many are asking today about the earlier generation of cloud providers.
Pushing ourselves to build platform-native products and features helped us answer this question. Particularly because some of these actually use containers behind the scenes, even though as a developer you never interact with or think about containers yourself.
If you’ve used AI inference on GPUs with Workers AI, spun up headless browsers with Browser Rendering, or enqueued build jobs with the new Workers Builds, you’ve run containers on our network, without even knowing it. But to do so, we needed to be able to run untrusted code across Cloudflare’s network, outside a v8 isolate, in a way that fits what we promise:
You shouldn’t have to think about regions or data centers. Routing, scaling, load balancing, scheduling, and capacity are our problem to solve, not yours, with tools like Smart Placement.
You should be able to build distributed systems without being a distributed systems engineer.
Every millisecond matters — Cloudflare has to be fast.
There wasn’t an off-the-shelf container platform that solved for what we needed, so we built it ourselves — from scheduling to IP address management, pulling and caching images, to improving startup times and more. Our container platform powers many of our newest products, so we wanted to share how we built it, optimized it, and well, you can probably guess what’s next.
Global scheduling — “The Network is the Computer”
Cloudflare serves the entire world — region: earth. Rather than asking developers to provision resources in specific regions, data centers and availability zones, we think “The Network is the Computer”. When you build on Cloudflare, you build software that runs on the Internet, not just in a data center.
When we started working on this, Cloudflare’s architecture was to just run every service via systemd on every server (we call them “metals” — we run our own hardware), allowing all services to take advantage of new capacity we add to our network. That fits running NGINX and a few dozen other services, but cannot fit a world where we need to run many thousands of different compute heavy, resource hungry workloads. We’d run out of space just trying to load all of them! Consider a canonical AI workload — deploying Llama 3.1 8B to an inference server. If we simply ran a Llama 3.1 8B service on every Cloudflare metal, we’d have no flexibility to use GPUs for the many other models that Workers AI supports.
We needed something that would allow us to still take advantage of the full capacity of Cloudflare’s entire network, not just the capacity of individual machines. And ideally not put that burden on the developer.
The answer: we built a control plane on our own Developer Platform that lets us schedule a container anywhere on Cloudflare’s Network:
The global scheduler is built on Cloudflare Workers, Durable Objects, and KV, and decides which Cloudflare location to schedule the container to run in. Each location then runs its own scheduler, which decides which metals within that location to schedule the container to run on. Location schedulers monitor compute capacity, and expose this to the global scheduler. This allows Cloudflare to dynamically place workloads based on capacity and hardware availability (e.g. multiple types of GPUs) across our network.
Why does global scheduling matter?
When you run compute on a first generation cloud, the “contract” between the developer and the platform is that the developer must specify what runs where. This is regional scheduling, the status quo.
Let’s imagine for a second if we applied regional scheduling to running compute on Cloudflare’s network, with locations in 330+ cities, across 120+ countries. One of the obvious reasons people tell us they want to run on Cloudflare is because we have compute in places where others don’t, within 50ms of 95% of the world’s Internet-connected population. In South America, other clouds have one region in one city. Cloudflare has 19:
Running anywhere means you can be faster, highly available, and have more control over data location. But with regional scheduling, the more locations you run in, the more work you have to do. You configure and manage load balancing, routing, auto-scaling policies and more. Balancing performance and cost in a multi-region setup is literally a full-time job (or more) at most companies who have reached meaningful scale on traditional clouds.
But most importantly, no matter what tools you bring, you were the one who told the cloud provider, “run this container over here”. The cloud platform can’t move it for you, even if moving it would make your workload faster. This prevents the platform from adding locations, because for each location, it has to convince developers to take action themselves to move their compute workloads to the new location. Each new location carries a risk that developers won’t migrate workloads to it, or migrate too slowly, delaying the return on investment.
Global scheduling means Cloudflare can add capacity and use it immediately, letting you benefit from it. The “contract” between us and our customers isn’t tied to a specific datacenter or region, so we have permission to move workloads around to benefit customers. This flexibility plays an essential role in all of our own uses of our container platform, starting with GPUs and AI.
GPUs everywhere: Scheduling large images with Workers AI
In late 2023, we launched Workers AI, which provides fast, easy to use, and affordable GPU-backed AI inference.
The more efficiently we can use our capacity, the better pricing we can offer. And the faster we can make changes to which models run in which Cloudflare locations, the closer we can move AI inference to the application, lowering Time to First Token (TTFT). This also allows us to be more resilient to spikes in inference requests.
AI models that rely on GPUs present three challenges though:
Models have different GPU memory needs. GPU memory is the most scarce resource, and different GPUs have different amounts of memory.
Not all container runtimes, such as Firecracker, support GPU drivers and other dependencies.
AI models, particularly LLMs, are very large. Even a smaller parameter model, like @cf/meta/llama-3.1-8b-instruct, is at least 5 GB. The larger the model, the more bytes we need to pull across the network when scheduling a model to run in a new location.
Let’s dive into how we solved each of these…
First, GPU memory needs. The global scheduler knows which Cloudflare locations have blocks of GPU memory available, and then delegates scheduling the workload on a specific metal to the local scheduler. This allows us to prioritize placement of AI models that use a large amount of GPU memory, and then move smaller models to other machines in the same location. By doing this, we maximize the overall number of locations that we run AI models in, and maximize our efficiency.
Second, container runtimes and GPU support. Thankfully, from day one we built our container platform to be runtime agnostic. Using a runtime agnostic scheduler, we’re able to support gVisor, Firecracker microVMs, and traditional VMs with QEMU. We are also evaluating adding support for another one: cloud-hypervisor which is based on rust-vmm and has a few compelling advantages for our use case:
vhost-user-net support, enabling high throughput between the host network interface and the VM
vhost-user-blk support, adding flexibility to introduce novel network-based storage backed by other Cloudflare Workers products
all the while being a smaller codebase than QEMU and written in a memory-safe language
Our goal isn’t to build a platform that makes you as the developer choose between runtimes, and ask, “should I use Firecracker or gVisor”. We needed this flexibility in order to be able to run workloads with different needs efficiently, including workloads that depend on GPUs. gVisor has GPU support, while Firecracker microVMs currently does not.
gVisor’s main component is an application kernel (called Sentry) that implements a Linux-like interface but is written in a memory-safe language (Go) and runs in userspace. It works by intercepting application system calls and acting as the guest kernel, without the need for translation through virtualized hardware.
The resource footprint of a containerized application running on gVisor is lower than a VM because it does not require managing virtualized hardware and booting up a kernel instance. However, this comes at the price of reduced application compatibility and higher per-system call overhead.
To add GPU support, the Google team introduced nvproxy which works using the same principles as described above for syscalls: it intercepts ioctls destined to the GPU and proxies a subset to the GPU kernel module.
To solve the third challenge, and make scheduling fast with large models, we weren’t satisfied with the status quo. So we did something about it.
Docker pull was too slow, so we fixed it (and cut the time in half)
Many of the images we need to run for AI inference are over 15 GB. Specialized inference libraries and GPU drivers add up fast. For example, when we make a scheduling decision to run a fresh container in Tokyo, naively running docker pull to fetch the image from a storage bucket in Los Angeles would be unacceptably slow. And scheduling speed is critical to being able to scale up and down in new locations in response to changes in traffic.
We had 3 essential requirements:
Pulling and pushing very large images should be fast
We should not rely on a single point of failure
Our teams shouldn’t waste time managing image registries
We needed globally distributed storage, so we used R2. We needed the highest cache hit rate possible, so we used Cloudflare’s Cache, and will soon use Tiered Cache. And we needed a fast container image registry that we could run everywhere, in every Cloudflare location, so we built and open-sourced serverless-registry, which is built on Workers. You can deploy serverless-registry to your own Cloudflare account in about 5 minutes. We rely on it in production.
This is fast, but we can be faster. Our performance bottleneck was, somewhat surprisingly, docker push. Docker uses gzip to compress and decompress layers of images while pushing and pulling. So we started using Zstandard (zstd) instead, which compresses and decompresses faster, and results in smaller compressed files.
In order to build, chunk, and push these images to the R2 registry, we built a custom CLI tool that we use internally in lieu of running docker build and docker push. This makes it easy to use zstd and split layers into 500 MB chunks, which allows uploads to be processed by Workers while staying under body size limits.
Using our custom build and push tool doubled the speed of image pulls. Our 30 GB GPU images now pull in 4 minutes instead of 8. We plan on open sourcing this tool in the near future.
Anycast is the gift that keeps on simplifying — Virtual IPs and the Global State Router
We still had another challenge to solve. And yes, we solved it with anycast. We’re Cloudflare, did you expect anything else?
First, a refresher — Cloudflare operates Unimog, a Layer 4 load balancer that handles all incoming Cloudflare traffic. Cloudflare’s network uses anycast, which allows a single IP address to route requests to a variety of different locations. For most Cloudflare services with anycast, the given IP address will route to the nearest Cloudflare data center, reducing latency. Since Cloudflare runs almost every service in every data center, Unimog can simply route traffic to any Cloudflare metal that is online and has capacity, without needing to map traffic to a specific service that runs on specific metals, only in some locations.
The new compute-heavy, GPU-backed workloads we were taking on forced us to confront this fundamental “everything runs everywhere” assumption. If we run a containerized workflow in 20 Cloudflare locations, how does Unimog know which locations, and which metals, it runs in? You might say “just bring your own load balancer” — but then what happens when you make scheduling decisions to migrate a workload between locations, scale up, or scale down?
Anycast is foundational to how we build fast and simple products on our network, and we needed a way to keep building new types of products this way — where a team can deploy an application, get back a single IP address, and rely on the platform to balance traffic, taking load, container health, and latency into account, without extra configuration. We started letting teams use the container platform without solving this, and it was painfully clear that we needed to do something about it.
So we started integrating directly into our networking stack, building a sidecar service to Unimog. We’ll call this the Global State Router. Here’s how it works:
An eyeball makes a request to a virtual IP address issued by Cloudflare
Request sent to the best location as determined by BGP routing. This is anycast routing.
A small eBPF program sits on the main networking interface and ensures packets bound to a virtual IP address are handled by the Global State Router.
The main Global State Router program contains a mapping of all anycast IPs addresses to potential end destination container IP addresses. It updates this mapping based on container health, readiness, distance, and latency. Using this information, it picks a best-fit container.
Packets are forwarded at the L4 layer.
When a target container’s server receives a packet, its own Global State Router program intercepts the packet and routes it to the local container.
This might sound like just a lower level networking detail, disconnected from developer experience. But by integrating directly with Unimog, we can let developers:
Push a containerized application to Cloudflare.
Provide constraints, health checks, and load metrics that describe what the application needs.
Delegate scheduling and scaling many containers across Cloudflare’s network.
Get back a single IP address that can be used everywhere.
We’re actively working on this, and are excited to continue building on Cloudflare’s anycast capabilities, and pushing to keep the simplicity of running “everywhere” with new categories of workloads.
Our container platform actually started because of a very specific challenge, running Remote Browser Isolation across our network. Remote Browser Isolation provides Chromium browsers that run on Cloudflare, in containers, rather than on the end user’s own computer. Only the rendered output is sent to the end user. This provides a layer of protection against zero-day browser vulnerabilities, phishing attacks, and ransomware.
Location is critical — people expect their interactions with a remote browser to feel just as fast as if it ran locally. If the server is thousands of miles away, the remote browser will feel slow. Running across Cloudflare’s network of over 330 locations means the browser is nearly always as close to you as possible.
Imagine a user in Santiago, Chile, if they were to access a browser running in the same city, each interaction would incur negligible additional latency. Whereas a browser in Buenos Aires might add 21 ms, São Paulo might add 48 ms, Bogota might add 67 ms, and Raleigh, NC might add 128 ms. Where the container runs significantly impacts the latency of every user interaction with the browser, and therefore the experience as a whole.
It’s not just browser isolation that benefits from running near the user: WebRTC servers stream video better, multiplayer games have less lag, online advertisements can be served faster, financial transactions can be processed faster. Our container platform lets us run anything we need to near the user, no matter where they are in the world.
Using spare compute — “off-peak” jobs for Workers CI/CD builds
At any hour of the day, Cloudflare has many CPU cores that sit idle. This is compute power that could be used for something else.
Via anycast, most of Cloudflare’s traffic is handled as close as possible to the eyeball (person) that requested it. Most of our traffic originates from eyeballs. And the eyeballs of (most) people are closed and asleep between midnight and 5:00 AM local time. While we use our compute capacity very efficiently during the daytime in any part of the world, overnight we have spare cycles. Consider what a map of the world looks like at night-time in Europe and Africa:
As shown above, we can run containers during “off-peak” in Cloudflare locations receiving low traffic at night. During this time, the CPU utilization of a typical Cloudflare metal looks something like this:
We have many “background” compute workloads at Cloudflare. These are workloads that don’t actually need to run close to the eyeball because there is no eyeball waiting on the request. The challenge is that many of these workloads require running untrusted code — either a dependency on open-source code that we don’t trust enough to run outside of a sandboxed environment, or untrusted code that customers deploy themselves. And unlike Cron Triggers, which already make a best-effort attempt to use off-peak compute, these other workloads can’t run in v8 isolates.
On Builder Day 2024, we announced Workers Builds in open beta. You connect your Worker to a git repository, and Cloudflare builds and deploys your Worker each time you merge a pull request. Workers Builds run on our containers platform, using otherwise idle “off-peak” compute, allowing us to offer lower pricing, and hold more capacity for unexpected spikes in traffic in Cloudflare locations during daytime hours when load is highest. We preserve our ability to serve requests as close to the eyeball as possible where it matters, while using the full compute capacity of our network.
We developed a purpose-built API for these types of jobs. The Workers Builds service has zero knowledge of where Cloudflare has spare compute capacity on its network — it simply schedules an “off-peak” job to run on the containers platform, by defining a scheduling policy:
scheduling_policy: "off-peak"
Making off-peak jobs faster with prewarmed images
Just because a workload isn’t “eyeball-facing” doesn’t mean speed isn’t relevant. When a build job starts, you still want it to start as soon as possible.
Each new build requires a fresh container though, and we must avoid reusing containers to provide strong isolation between customers. How can we keep build job start times low, while using a new container for each job without over-provisioning?
We prewarm servers with the proper image.
Before a server becomes eligible to receive an “off peak” job, the container platform instructs it to download the correct image. Once the image is downloaded and cached locally, new containers can start quickly in a Firecracker VM after receiving a request for a new build. When a build completes, we throw away the container, and start the next build using a fresh container based on the prewarmed image.
Without prewarming, pulling and unpacking our Workers Build images would take roughly 75 seconds. With prewarming, we’re able to spin up a new container in under 10 seconds. We expect this to get even faster as we introduce optimizations like pre-booting images before new runs, or Firecracker snapshotting, which can restore a VM in under 200ms.
Workers and containers, better together
As more of our own engineering teams rely on our containers platform in production, we’ve noticed a pattern: they want a deeper integration with Workers.
We plan to give it to them.
Let’s take a look at a project deployed on our container platform already, Key Transparency. If the container platform were highly integrated with Workers, what would this team’s experience look like?
Cloudflare regularly audits changes to public keys used by WhatsApp for encrypting messages between users. Much of the architecture is built on Workers, but there are long-running compute-intensive tasks that are better suited for containers.
We don’t want our teams to have to jump through hoops to deploy a container and integrate with Workers. They shouldn’t have to pick specific regions to run in, figure out scaling, expose IPs and handle IP updates, or set up Worker-to-container auth.
We’re still exploring many different ideas and API designs, and we want your feedback. But let’s imagine what it might look like to use Workers, Durable Objects and Containers together.
In this case, an outer layer of Workers handles most business logic and ingress, a specialized Durable Object is configured to run alongside our new container, and the platform ensures the image is loaded on the right metals and can scale to meet demand.
I didn’t have to worry about placement, scaling, service discovery authorization, and I was able to leverage integrations into other services like KV and R2 with just a few lines of code. The container platform took care of routing, placement, and auth. If I needed more instances, I could call the binding with a new ID, and the platform would scale up containers for me.
We are still in the early stages of building these integrations, but we’re excited about everything that containers will bring to Workers and vice versa.
So, what do you want to build?
If you’ve read this far, there’s a non-zero chance you were hoping to get to run a container yourself on our network. While we’re not ready (quite yet) to open up the platform to everyone, now that we’ve built a few GA products on our container platform, we’re looking for a handful of engineering teams to start building, in advance of wider availability in 2025. And we’re continuing to hire engineers to work on this.
We’ve told you about our use cases for containers, and now it’s your turn. If you’re interested, tell us here what you want to build, and why it goes beyond what’s possible today in Workers and on our Developer Platform. What do you wish you could build on Cloudflare, but can’t yet today?
Today we’re announcing the Dev Starter Pack, an alliance of innovative tools for developers to get started with discounts and free services. We’re also excited to share an update on our Workers Launchpad Program.
Creating from the ground up often means spending countless hours piecing together the right development stack, navigating different pricing models, and managing growing costs — all of which can take your focus away from what truly matters: building your product and growing your business.
Introducing Dev Starter Pack: the tools you need to start building your startup
Hey! Dani Grant here, one of the first PMs at Cloudflare and co-founder of Jam.dev. Ten years ago (during 2014’s Birthday Week), Cloudflare launched Universal SSL, making SSL free on the Internet for the first time, and in one night doubling the size of the encrypted web.
I was a college student back then, and I immediately became enraptured by Cloudflare’s mission: helping build a better Internet. As part of this mission, Cloudflare has developed powerful tools typically accessible only to Internet giants, oftentimes offering them for free to developers and individuals alike. Heck yeah! I joined Cloudflare in January 2015, and 5 years after that, co-founded a developer tool company called Jam, inspired by the impact that I saw building tools for developers could have while at Cloudflare.
It’s now 10 years later, and a lot has changed –– “software ate the world” and it’s now powering all aspects of our lives, from health to finances to how we work. It’s more important than ever to empower every developer with the best tools available, because the faster we build software, the sooner people’s experiences improve.
Today we’re thrilled to announce the Dev Starter Pack, an alliance of like-minded dev tool companies giving away their services for free, or heavily discounting them for developers who want to start companies and build the future.
Not only does this stack include all the tools you need to build a startup, it also includes all the tools you need to build AI-powered features. We believe that the next wave of startups will be AI-native, as AI becomes as ubiquitous as the electricity that powers the servers.
We haven’t even scratched the surface of what’s possible with AI, and we hope this launch gets developers closer to solving the challenges of building non-deterministic software.
If you’re a software engineer, and you want to build a project or a company and need an off the shelf stack of dev tools to get started, go to devstarterpack.io to start using all of these tools.
Each provider is offering developers a heavily discounted or even free plan to get started building. You can redeem these services by either using the special code “devstarterpack” or selecting “Dev Starter Pack” while applying to relevant programs.
We welcome more tools to join the alliance — this is just the beginning. If you are building a developer tool and would like to include your product in the Dev Starter Pack, let us know here, so we can include you.
What will you build?
We are very excited to see what you will build. Please share with us in Cloudflare’s Discord and community forum, so we can support you however it makes sense.
Software developers are changing the world, and we believe in providing support to help you make an even greater impact. If you’re looking for additional funding or support, check out Cloudflare’s Launchpad for developers turned founders building startups.
Introducing Workers Launchpad Cohort #4
Melissa and Chris from the Cloudflare for Startups team here. Our team is blown away by what customers are demonstrating on the Developer Platform. Just a few weeks ago, our Workers Launchpad Cohort #3 wrapped up. On Demo Day, customers demoed their applications built on Cloudflare, spanning AI, dev tools, IaaS, observability, SaaS, media, and beyond. We’re incredibly proud of Cohort #3 participants, and we look forward to their continued success with Cloudflare.
Following Demo Day of Workers Launchpad Cohort #3, we’ve been excited to receive a surge of new applications from startups around the world. These startups are pushing the boundaries of innovation, particularly in areas like observability, PaaS, AI, automation, e-commerce, and other industries. Many startups that applied this go-around demonstrated that they’ve built some great applications on Cloudflare, and today, we’re excited to announce the accepted participants for our upcoming Workers Launchpad Cohort #4.
Let’s take a look at what Cohort #4 participants are building in their own words:
The Cloudflare team is ecstatic to work with the amazing participants of Cohort #4. If you want to follow along on Cohort #4’s journey, be sure to follow @CloudflareDev on X and join our Developer Discord server.
To celebrate Builder Day 2024, we’re shipping 18 updates inspired by direct feedback from developers building on Cloudflare. Choosing a platform isn’t just about current technologies and services — it’s about betting on a partner that will evolve with your needs as your project grows and the tech landscape shifts. We’re in it for the long haul with you.
Everything in this post is available for you to use today. Keep reading to learn more, and watch the Builder Day Live Stream for demos and more.
Persistent Logs for every Worker
Starting today in open beta, you can automatically retain logs from your Worker, with full search, query, and filtering capabilities available directly within the Cloudflare dashboard. All newly created Workers will have this setting automatically enabled. This marks the first step in the development of our observability platform, following Cloudflare’s acquisition of Baselime.
Getting started is easy – just add two lines to your Worker’s wrangler.toml and redeploy:
[observability]
enabled = true
Workers Logs allow you to view all logs emitted from your Worker. When enabled, each console.log message, error, and exception is published as a separate event. Every Worker invocation (i.e. requests, alarms, rpc, etc.) also publishes an enriched execution log that contains invocation metadata. You can view logs in the Logs tab of your Worker in the dashboard, where you can filter on any event field, such as time, error code, message, or your own custom field.
If you’ve ever had to piece together the puzzle of unusual metrics, such as a spike in errors or latency, you know how frustrating it is to connect metrics to traces and logs that often live in independent data silos. Workers Logs is the first piece of a new observability platform we are building that helps you easily correlate telemetry data, and surfaces insights to help you understand. We’ll structure your telemetry data so you have the full context to ask the right questions, and can quickly and easily analyze the behavior of your applications. This is just the beginning for observability tools for Workers. We are already working on automatically emitting distributed traces from Workers, with real time errors and wide, high dimensionality events coming soon as well.
Starting November 1, 2024, Workers Logs will cost $0.60 per million log lines written after the included volume, as shown in the table below. Querying your logs is free. This makes it easy to estimate and forecast your costs — we think you shouldn’t have to calculate the number of ‘Gigabytes Ingested’ to understand what you’ll pay.
Workers Free
Workers Paid
Included Volume
200,000 logs per day
20,000,000 logs per month
Additional Events
N/A
$0.60 per million logs
Retention
3 days
7 days
Try out Workers Logs today. You can learn more from our developer documentation, and give us feedback directly in the #workers-observability channel on Discord.
Connect to private databases from Workers
Starting today, you can now use Hyperdrive, Cloudflare Tunnels and Access together to securely connect to databases that are isolated in a private network.
Hyperdrive enables you to build on Workers with your existing regional databases. It accelerates database queries using Cloudflare’s network, caching data close to end users and pooling connections close to the database. But there’s been a major blocker preventing you from building with Hyperdrive: network isolation.
The majority of databases today aren’t publicly accessible on the Internet. Data is highly sensitive and placing databases within private networks like a virtual private cloud (VPC) keeps data secure. But to date, that has also meant that your data is held captive within your cloud provider, preventing you from building on Workers.
With this update, Hyperdrive makes it possible for you to build full-stack applications on Workers with your existing databases, network-isolated or not. Whether you’re using Amazon RDS, Amazon Aurora, Google Cloud SQL, Azure Database, or any other provider, Hyperdrive can connect to your databases and optimize your database connections to provide the fast performance you’ve come to expect with building on Workers.
Read the developer documentation to learn more about how to opt-in your Workers to try it today. If you encounter any bugs or want to report feedback, open an issue.
Build frontend applications on Workers with Static Asset Hosting
Starting today in open beta, you now can upload and serve HTML, CSS, and client-side JavaScript directly as part of your Worker. This means you can build dynamic, server-side rendered applications on Workers using popular frameworks such as Astro, Remix, Next.js and Svelte (full list here), with more coming soon.
If you’re wondering “What about Pages?” — rest assured, Pages will remain fully supported. We’ve heard from developers that as we’ve added new features to Workers and Pages, the choice of which product to use has become challenging. We’re closing this gap by bringing asset hosting, CI/CD and Preview URLs to Workers this Birthday Week.
To make the upfront choice Cloudflare Workers and Pages more transparent, we’ve created a compatibility matrix. Looking ahead, we plan to bridge the remaining gaps between Workers and Pages and provide ways to migrate your Pages projects to Workers.
Cloudflare joins OpenNext to deploy Next.js apps to Workers
Cloud providers shouldn’t lock you in. Like cloud compute and storage, open source frameworks should be portable — you should be able to deploy them to different cloud providers. The goal of the OpenNext project is to make sure you can deploy Next.js apps to any cloud platform, originally to AWS, and now Cloudflare. We’re excited to contribute to the OpenNext community, and give developers the freedom to run on the cloud that fits their applications needs (and budget) best.
Continuous Integration & Delivery (CI/CD) with Workers Builds
Now in open beta, you can connect a GitHub or GitLab repository to a Worker, and Cloudflare will automatically build and deploy your changes each time you push a commit. Workers Builds provides an integrated CI/CD workflow you can use to build and deploy everything from full-stack applications built with the most popular frameworks to simple static websites. Just add your build command and let Workers Builds take care of the rest.
While in open beta, Workers Builds is free to use, with a limit of one concurrent build per account, and unlimited build minutes per month. Once Workers Builds is Generally Available in early 2025, you will be billed based on the number of build minutes you use each month, and have a higher number of concurrent builds.
Workers Free
Workers Paid
Build minutes, open beta
Unlimited
Unlimited
Concurrent builds, open beta
1
1
Build minutes, general availability
3,000 minutes included per month
6,000 minutes included per month +$0.005 per additional build minute
Concurrent builds, general availability
1
6
Read the docs to learn more about how to deploy your first project with Workers Builds.
Workers preview URLs
Each newly uploaded version of a Worker now automatically generates a preview URL. Preview URLs make it easier for you to collaborate with your team during development, and can be used to test and identify issues in a preview environment before they are deployed to production.
When you upload a version of your Worker via the Wrangler CLI, Wrangler will display the preview URL once your upload succeeds. You can also find preview URLs for each version of your Worker in the Cloudflare dashboard:
Preview URLs for Workers are similar to Pages preview deployments — they run on your Worker’s workers.dev subdomain and allow you to view changes applied on a new version of your application before the changes are deployed.
Safely release to production with Gradual Deployments
At Developer Week, we launched Gradual Deployments for Workers and Durable Objects to make it safer and easier to deploy changes to your applications. Gradual Deployments is now GA — we have been using it ourselves at Cloudflare for mission-critical services built on Workers since early 2024.
Gradual deployments can help you stay on top of availability SLAs and minimize application downtime by surfacing issues early. Internally at Cloudflare, every single service built on Workers uses gradual deployments to roll out new changes. Each new version gets released in stages —– 0.05%, 0.5%, 3%, 10%, 25%, 50%, 75% and 100% with time to soak between each stage. Throughout the roll-out, we keep an eye on metrics (which are often instrumented with Workers Analytics Engine!) and we roll back if we encounter issues.
Using gradual deployments is as simple as swapping out the wrangler commands, API endpoints, and/or using “Save version” in the code editor that is built into the Workers dashboard. Read the developer documentation to learn more and get started.
Queues is GA, with higher throughput and concurrency limits
Queues let a developer decouple their Workers into event driven services. Producer Workers write events to a Queue, and consumer Workers are invoked to take actions on the events. For example, you can use a Queue to decouple an e-commerce website from a service which sends purchase confirmation emails to users.
Throughput and concurrency limits for Queues are now significantly higher, which means you can push more messages through a Queue, and consume them faster.
Throughput: Each queue can now process 5000 messages per second (previously 400 per second).
Concurrency: Each queue can now have up to 250 concurrent consumers (previously 20 concurrent consumers).
HTTP Pull consumers allow messages to be consumed outside Workers, with zero data egress costs.
Queues can be used by any developer on a Workers Paid plan. Head over to our getting startedguide to start building with Queues.
Event notifications for R2 is now GA
We’re excited to announce that event notifications for R2 is now generally available. Whether it’s kicking off image processing after a user uploads a file or triggering a sync to an external data warehouse when new analytics data is generated, many applications need to be able to reliably respond when events happen. Event notifications for Cloudflare R2 give you the ability to build event-driven applications and workflows that react to changes in your data.
Here’s how it works: When data in your R2 bucket changes, event notifications are sent to your queue. You can consume these notifications with a consumer Worker or pull them over HTTP from outside of Cloudflare Workers.
Since we introduced event notifications in open beta earlier this year, we’ve made significant improvements based on your feedback:
We increased reliability of event notifications with throughput improvements from Queues. R2 event notifications can now scale to thousands of writes per second.
You can now configure event notifications directly from the Cloudflare dashboard (in addition to Wrangler).
You can now set up multiple notification rules for a single queue on a bucket.
Visit our documentation to learn about how to set up event notifications for your R2 buckets.
Removing the serverless microservices tax: No more request fees for Service Bindings and Tail Workers
Earlier this year, we quietly changed Workers pricing to lower your costs. As of July 2024, you are no longer charged for requests between Workers on your account made via Service Bindings, or for invocations of Tail Workers. For example, let’s say you have the following chain of Workers:
Each request from a client results in three Workers invocations. Previously, we charged you for each of these invocations, plus the CPU time for each of these Workers. With this change, we only charge you for the first request from the client, plus the CPU time used by each Worker.
This eliminates the additional cost of breaking a monolithic serverless app into microservices. In 2023, we introduced new pricing based on CPU time, rather than duration, so you don’t have to worry about being billed for time spent waiting on I/O. This includes I/O to other Workers. With this change, you’re only billed for the first request in the chain, eliminating the other additional cost of using multiple Workers.
Image optimization is available to everyone for free — no subscription needed
Starting today, you can use Cloudflare Images for free to optimize your images with up to 5,000 transformations per month.
Large, oversized images can throttle your application speed and page load times. We built Cloudflare Images to let you dynamically optimize images in the correct dimensions and formats for each use case, all while storing only the original image.
In the spirit of Birthday Week, we’re making image optimization available to everyone with a Cloudflare account, no subscription needed. You’ll be able to use Images to transform images that are stored outside of Images, such as in R2.
Transformations are served from your zone through a specially formatted URL with parameters that specify how an image should be optimized. For example, the transformation URL below uses the format parameter to automatically serve the image in the most optimal format for the requesting browser:
This means that the original PNG image may be served as AVIF to one user and WebP to another. Without a subscription, transforming images from remote sources is free up to 5,000 unique transformations per month. Once you exceed this limit, any already cached transformations will continue to be served, but you’ll need a paid Images plan to request new transformations or to purchase storage within Images.
Dive deep into more announcements from Builder Day
We shipped so much that we couldn’t possibly fit it all in one blog post. These posts dive into the technical details of what we’re announcing at Builder Day:
Cloudflare is for builders, and everything we’re announcing at Builder Day, you can start building with right away. We’re now offering $250,000 in credits to use on our Developer Platform to qualified startups, so that you can get going even faster, and become the next company to reach hypergrowth scale with a small team, and not waste time provisioning infrastructure and doing undifferentiated heavy lifting. Focus on shipping, and we’ll take care of the rest.
Speed is a critical factor that dictates Internet behavior. Every additional millisecond a user spends waiting for your web page to load results in them abandoning your website. The old adage remains as true as ever: faster websites result in higher conversion rates. And with such outcomes tied to Internet speed, we believe a faster Internet is a better Internet.
Customers often use Workers KV to provide Workers with key-value data for configuration, routing, personalization, experimentation, or serving assets. Many of Cloudflare’s own products rely on KV for just this purpose: Pages stores static assets, Access stores authentication credentials, AI Gateway stores routing configuration, and Images stores configuration and assets, among others. So KV’s speed affects the latency of every request to an application, throughout the entire lifecycle of a user session.
Today, we’re announcing up to 3x faster KV hot reads, with all KV operations faster by up to 20ms. And we want to pull back the curtain and show you how we did it.
Workers KV read latency (ms) by percentile measured from Pages
Optimizing Workers KV’s architecture to minimize latency
At a high level, Workers KV is itself a Worker that makes requests to central storage backends, with many layers in between to properly cache and route requests across Cloudflare’s network. You can rely on Workers KV to support operations made by your Workers at any scale, and KV’s architecture will seamlessly handle your required throughput.
Sequence diagram of a Workers KV operation
When your Worker makes a read operation to Workers KV, your Worker establishes a network connection within its Cloudflare region to KV’s Worker. The KV Worker then accesses the Cache API, and in the event of a cache miss, retrieves the value from the storage backends.
Let’s look one level deeper at a simplified trace:
Simplified trace of a Workers KV operation
From the top, here are the operations completed for a KV read operation from your Worker:
Your Worker makes a connection to Cloudflare’s network in the same data center. This incurs ~5 ms of network latency.
Upon entering Cloudflare’s network, a service called Front Line (FL) is used to process the request. This incurs ~10 ms of operational latency.
FL proxies the request to the KV Worker. The KV Worker does a cache lookup for the key being accessed. This, once again, passes through the Front Line layer, incurring an additional ~10 ms of operational latency.
Cache is stored in various backends within each region of Cloudflare’s network. A service built upon Pingora, our open-sourced Rust framework for proxying HTTP requests, routes the cache lookup to the proper cache backend.
Finally, if the cache lookup is successful, the KV read operation is resolved. Otherwise, the request reaches our storage backends, where it gets its value.
Looking at these flame graphs, it became apparent that a major opportunity presented itself to us: reducing the FL overhead (or eliminating it altogether) and reducing the cache misses across the Cloudflare network would reduce the latency for KV operations.
Bypassing FL layers between Workers and services to save ~20ms
A request from your Worker to KV doesn’t need to go through FL. Much of FL’s responsibility is to process and route requests from outside of Cloudflare — that’s more than is needed to handle a request from the KV binding to the KV Worker. So we skipped the Front Line altogether in both layers.
Reducing latency in a Workers KV operation by removing FL layers
To bypass the FL layer from the KV binding in your Worker, we modified the KV binding to connect directly to the KV Worker within the same Cloudflare location. Within the Workers host, we configured a C++ subpipeline to allow code from bindings to establish a direct connection with the proper routing configuration and authorization loaded.
The KV Worker also passes through the FL layer on its way to our internal Pingora service. In this case, we were able to use an internal Worker binding that allows Workers for Cloudflare services to bind directly to non-Worker services within Cloudflare’s network. With this fix, the KV Worker sets the proper cache control headers and establishes its connection to Pingora without leaving the network.
Together, both of these changes reduced latency by ~20 ms for every KV operation.
Implementing tiered cache to minimize requests to storage backends
We also optimized KV’s architecture to reduce the amount of requests that need to reach our centralized storage backends. These storage backends are further away and incur network latency, so improving the cache hit rate in regions close to your Workers significantly improves read latency.
Workers KV uses Tiered Cache to resolve operations closer to your users
To accomplish this, we used Tiered Cache, and implemented a cache topology that is fine-tuned to the usage patterns of KV. With a tiered cache, requests to KV’s storage backends are cached in regional tiers in addition to local (lower) tiers. With this architecture, KV operations that may be cache misses locally may be resolved regionally, which is especially significant if you have traffic across an entire region spanning multiple Cloudflare data centers.
This significantly reduced the amount of requests that needed to hit the storage backends, with ~30% of requests resolved in tiered cache instead of storage backends.
KV’s new architecture
As a result of these optimizations, KV operations are now simplified:
When you read from KV in your Worker, the KV binding binds directly to KV’s Worker, saving 10 ms.
The KV Worker binds directly to the Tiered Cache service, saving another 10 ms.
Tiered Cache is used in front of storage backends, to resolve local cache misses regionally, closer to your users.
Sequence diagram of KV operations with new architecture
In aggregate, these changes significantly reduced KV’s latency.
The impact of the direct binding to cache is clearly seen in the wall time of the KV Worker, given this value measures the duration of a retrieval of a key-value pair from cache. The 90th percentile of all KV Worker invocations now resolve in less than 12 ms — before the direct binding to cache, that was 22 ms. That’s a 10 ms decrease in latency.
Wall time (ms) within the KV Worker by percentile
These KV read operations resolve quickly because the data is cached locally in the same Cloudflare location. But what about reads that aren’t resolved locally? ~30% of these resolve regionally within the tiered cache. Reads from tiered cache are up to 100 ms faster than when resolved at central storage backends, once again contributing to making KV reads faster in aggregate.
Wall time (ms) within the KV Worker for tiered cache vs. storage backends reads
These graphs demonstrate the impact of direct binding from the KV binding to cache, and tiered cache. To see the impact of the direct binding from a Worker to the KV Worker, we need to look at the latencies reported by Cloudflare products that use KV.
Cloudflare Pages, which serves static assets like HTML, CSS, and scripts from KV, saw load times for fetching assets improve by up to 68%. Workers asset hosting, which we also announced as part of today’s Builder Day announcements, gets this improved performance from day 1.
Workers KV read operation latency measured within Cloudflare Pages by percentile
Queues and Access also saw their latencies for KV operations drop, with their KV read operations now 2-5x faster. These services rely on Workers KV data for configuration and routing data, so KV’s performance improvement directly contributes to making them faster on each request.
Workers KV read operation latency measured within Cloudflare Queues by percentile
Workers KV read operation latency measured within Cloudflare Access by percentile
These are just some of the direct effects that a faster KV has had on other services. Across the board, requests are resolving faster thanks to KV’s faster response times.
And we have one more thing to make KV lightning fast.
Optimizing KV’s hottest keys with an in-memory cache
Less than 0.03% of keys account for nearly half of requests to the Workers KV service across all namespaces. These keys are read thousands of times per second, so making these faster has a disproportionate impact. Could these keys be resolved within the KV Worker without needing additional network hops?
Almost all of these keys are under 100 KB. At this size, it becomes possible to use the in-memory cache of the KV Worker — a limited amount of memory within the main runtime process of a Worker sandbox. And that’s exactly what we did. For the highest throughput keys across Workers KV, reads resolve without even needing to leave the Worker runtime process.
Sequence diagram of KV operations with the hottest keys resolved within an in-memory cache
As a result of these changes, KV reads for these keys, which represent over 40% of Workers KV requests globally, resolve in under a millisecond. We’re actively testing these changes internally and expect to roll this out during October to speed up the hottest key-value pairs on Workers KV.
A faster KV for all
Most of these speed gains are already enabled with no additional action needed from customers. Your websites that are using KV are already responding to requests faster for your users, as are the other Cloudflare services using KV under the hood and the countless websites that depend upon them.
And we’re not done: we’ll continue to chase performance throughout our stack to make your websites faster. That’s how we’re going to move the needle towards a faster Internet.
To see Workers KV’s recent speed gains for your own KV namespaces, head over to your dashboard and check out the new KV analytics, with latency and cache status detailed per namespace.
Traditional cloud storage is inherently slow, because it is normally accessed over a network and must carefully synchronize across many clients that could be accessing the same data. But what if we could instead put your application code deep into the storage layer, such that your code runs directly on the machine where the data is stored, and the database itself executes as a local library embedded inside your application?
Durable Objects (DO) are a novel approach to cloud computing which accomplishes just that: Your application code runs exactly where the data is stored. Not just on the same machine: your storage lives in the same thread as the application, requiring not even a context switch to access. With proper use of caching, storage latency is essentially zero, while nevertheless being durable and consistent.
Until today, DOs only offered key/value oriented storage. But now, they support a full SQL query interface with tables and indexes, through the power of SQLite.
SQLite is the most-used SQL database implementation in the world, with billions of installations. It’s on practically every phone and desktop computer, and many embedded devices use it as well. It’s known to be blazingly fast and rock solid. But it’s been less common on the server. This is because traditional cloud architecture favors large distributed databases that live separately from application servers, while SQLite is designed to run as an embedded library. In this post, we’ll show you how Durable Objects turn this architecture on its head and unlock the full power of SQLite in the cloud.
Refresher: what are Durable Objects?
Durable Objects (DOs) are a part of the Cloudflare Workers serverless platform. A DO is essentially a small server that can be addressed by a unique name and can keep state both in-memory and on-disk. Workers running anywhere on Cloudflare’s network can send messages to a DO by its name, and all messages addressed to the same name — from anywhere in the world — will find their way to the same DO instance.
DOs are intended to be small and numerous. A single application can create billions of DOs distributed across our global network. Cloudflare automatically decides where a DO should live based on where it is accessed, automatically starts it up as needed when requests arrive, and shuts it down when idle. A DO has in-memory state while running and can also optionally store long-lived durable state. Since there is exactly one DO for each name, a DO can be used to coordinate between operations on the same logical object.
For example, imagine a real-time collaborative document editor application. Many users may be editing the same document at the same time. Each user’s changes must be broadcast to other users in real time, and conflicts must be resolved. An application built on DOs would typically create one DO for each document. The DO would receive edits from users, resolve conflicts, broadcast the changes back out to other users, and keep the document content updated in its local storage.
DOs are especially good at real-time collaboration, but are by no means limited to this use case. They are general-purpose servers that can implement any logic you desire to serve requests. Even more generally, DOs are a basic building block for distributed systems.
When using Durable Objects, it’s important to remember that they are intended to scale out, not up. A single object is inherently limited in throughput since it runs on a single thread of a single machine. To handle more traffic, you create more objects. This is easiest when different objects can handle different logical units of state (like different documents, different users, or different “shards” of a database), where each unit of state has low enough traffic to be handled by a single object. But sometimes, a lot of traffic needs to modify the same state: consider a vote counter with a million users all trying to cast votes at once. To handle such cases with Durable Objects, you would need to create a set of objects that each handle a subset of traffic and then replicate state to each other. Perhaps they use CRDTs in a gossip network, or perhaps they implement a fan-in/fan-out approach to a single primary object. Whatever approach you take, Durable Objects make it fast and easy to create more stateful nodes as needed.
Why is SQLite-in-DO so fast?
In traditional cloud architecture, stateless application servers run business logic and communicate over the network to a database. Even if the network is local, database requests still incur latency, typically measured in milliseconds.
When a Durable Object uses SQLite, SQLite is invoked as a library. This means the database code runs not just on the same machine as the DO, not just in the same process, but in the very same thread. Latency is effectively zero, because there is no communication barrier between the application and SQLite. A query can complete in microseconds.
Reads and writes are synchronous
The SQL query API in DOs does not require you to await results — they are returned synchronously:
// No awaits!
let cursor = sql.exec("SELECT name, email FROM users");
for (let user of cursor) {
  console.log(user.name, user.email);
}
This may come as a surprise to some. Querying a database is I/O, right? I/O should always be asynchronous, right? Isn’t this a violation of the natural order of JavaScript?
It’s OK! The database content is probably cached in memory already, and SQLite is being called as a library in the same thread as the application, so the query often actually won’t spend any time at all waiting for I/O. Even if it does have to go to disk, it’s a local SSD. You might as well consider the local disk as just another layer in the memory cache hierarchy: L5 cache, if you will. In any case, it will respond quickly.
Meanwhile, synchronous queries provide some big benefits. First, the logistics of asynchronous event loops have a cost, so in the common case where the data is already in memory, a synchronous query will actually complete faster than an async one.
More importantly, though, synchronous queries help you avoid subtle bugs. Any time your application awaits a promise, it’s possible that some other code executes while you wait. The state of the world may have changed by the time your await completes. Maybe even other SQL queries were executed. This can lead to subtle bugs that are hard to reproduce because they require events to happen at just the wrong time. With a synchronous API, though, none of that can happen. Your code always executes in the order you wrote it, uninterrupted.
Fast writes with Output Gates
Database experts might have a deeper objection to synchronous queries: Yes, caching may mean we can perform reads and writes very fast. However, in the case of a write, just writing to cache isn’t good enough. Before we return success to our client, we must confirm that the write is actually durable, that is, it has actually made it onto disk or network storage such that it cannot be lost if the power suddenly goes out.
Normally, a database would confirm all writes before returning to the application. So if the query is successful, it is confirmed. But confirming writes can be slow, because it requires waiting for the underlying storage medium to respond. Normally, this is OK because the write is performed asynchronously, so the program can go on and work on other things while it waits for the write to finish. It looks kind of like this:
But I just told you that in Durable Objects, writes are synchronous. While a synchronous call is running, no other code in the program can run (because JavaScript does not have threads). This is convenient, as mentioned above, because it means you don’t need to worry that the state of the world may have changed while you were waiting. However, if write queries have to wait a while, and the whole program must pause and wait for them, then throughput will suffer.
Luckily, in Durable Objects, writes do not have to wait, due to a little trick we call “Output Gates”.
In DOs, when the application issues a write, it continues executing without waiting for confirmation. However, when the DO then responds to the client, the response is blocked by the “Output Gate”. This system holds the response until all storage writes relevant to the response have been confirmed, then sends the response on its way. In the rare case that the write fails, the response will be replaced with an error and the Durable Object itself will restart. So, even though the application constructed a “success” response, nobody can ever see that this happened, and thus nobody can be misled into believing that the data was stored.
Let’s see what this looks like with multiple requests:
If you compare this against the first diagram above, you should notice a few things:
The timing of requests and confirmations are the same.
But, all responses were sent to the client sooner than in the first diagram. Latency was reduced! This is because the application is able to work on constructing the response in parallel with the storage layer confirming the write.
Request handling is no longer interleaved between the three requests. Instead, each request runs to completion before the next begins. The application does not need to worry, during the handling of one request, that its state might change unexpectedly due to a concurrent request.
With Output Gates, we get the ease-of-use of synchronous writes, while also getting lower latency and no loss of throughput.
N+1 selects? No problem.
Zero-latency queries aren’t just faster, they allow you to structure your code differently, often making it simpler. A classic example is the “N+1 selects” or “N+1 queries” problem. Let’s illustrate this problem with an example:
// N+1 SELECTs example

// Get the 100 most-recently-modified docs.
let docs = sql.exec(`
  SELECT title, authorId FROM documents
  ORDER BY lastModified DESC
  LIMIT 100
`).toArray();

// For each returned document, get the author name from the users table.
for (let doc of docs) {
  doc.authorName = sql.exec(
      "SELECT name FROM users WHERE id = ?", doc.authorId).one().name;
}
If you are an experienced SQL user, you are probably cringing at this code, and for good reason: this code does 101 queries! If the application is talking to the database across a network with 5ms latency, this will take 505ms to run, which is slow enough for humans to notice.
// Do it all in one query with a join?
let docs = sql.exec(`
  SELECT documents.title, users.name
  FROM documents JOIN users ON documents.authorId = users.id
  ORDER BY documents.lastModified DESC
  LIMIT 100
`).toArray();
Here we’ve used SQL features to turn our 101 queries into one query. Great! Except, what does it mean? We used an inner join, which is not to be confused with a left, right, or cross join. What’s the difference? Honestly, I have no idea! I had to look up joins just to write this example and I’m already confused.
Well, good news: You don’t need to figure it out. Because when using SQLite as a library, the first example above works just fine. It’ll perform about the same as the second fancy version.
More generally, when using SQLite as a library, you don’t have to learn how to do fancy things in SQL syntax. Your logic can be in regular old application code in your programming language of choice, orchestrating the most basic SQL queries that are easy to learn. It’s fine. The creators of SQLite have made this point themselves.
Point-in-Time Recovery
While not necessarily related to speed, SQLite-backed Durable Objects offer another feature: any object can be reverted to the state it had at any point in time in the last 30 days. So if you accidentally execute a buggy query that corrupts all your data, don’t worry: you can recover. There’s no need to opt into this feature in advance; it’s on by default for all SQLite-backed DOs. See the docs for details.
How do I use it?
Let’s say we’re an airline, and we are implementing a way for users to choose their seats on a flight. We will create a new Durable Object for each flight. Within that DO, we will use a SQL table to track the assignments of seats to passengers. The code might look something like this:
import {DurableObject} from "cloudflare:workers";

// Manages seat assignment for a flight.
//
// This is an RPC interface. The methods can be called remotely by other Workers
// running anywhere in the world. All Workers that specify same object ID
// (probably based on the flight number and date) will reach the same instance of
// FlightSeating.
export class FlightSeating extends DurableObject {
  sql = this.ctx.storage.sql;

  // Application calls this when the flight is first created to set up the seat map.
  initializeFlight(seatList) {
    this.sql.exec(`
      CREATE TABLE seats (
        seatId TEXT PRIMARY KEY,  -- e.g. "3B"
        occupant TEXT             -- null if available
      )
    `);

    for (let seat of seatList) {
      this.sql.exec(`INSERT INTO seats VALUES (?, null)`, seat);
    }
  }

  // Get a list of available seats.
  getAvailable() {
    let results = [];

    // Query returns a cursor.
    let cursor = this.sql.exec(`SELECT seatId FROM seats WHERE occupant IS NULL`);

    // Cursors are iterable.
    for (let row of cursor) {
      // Each row is an object with a property for each column.
      results.push(row.seatId);
    }

    return results;
  }

  // Assign passenger to a seat.
  assignSeat(seatId, occupant) {
    // Check that seat isn't occupied.
    let cursor = this.sql.exec(`SELECT occupant FROM seats WHERE seatId = ?`, seatId);
    let result = [...cursor][0];  // Get the first result from the cursor.
    if (!result) {
      throw new Error("No such seat: " + seatId);
    }
    if (result.occupant !== null) {
      throw new Error("Seat is occupied: " + seatId);
    }

    // If the occupant is already in a different seat, remove them.
    this.sql.exec(`UPDATE seats SET occupant = null WHERE occupant = ?`, occupant);

    // Assign the seat. Note: We don't have to worry that a concurrent request may
    // have grabbed the seat between the two queries, because the code is synchronous
    // (no `await`s) and the database is private to this Durable Object. Nothing else
    // could have changed since we checked that the seat was available earlier!
    this.sql.exec(`UPDATE seats SET occupant = ? WHERE seatId = ?`, occupant, seatId);
  }
}
(With just a little more code, we could extend this example to allow clients to subscribe to seat changes with WebSockets, so that if multiple people are choosing their seats at the same time, they can see in real time as seats become unavailable. But, that’s outside the scope of this blog post, which is just about SQL storage.)
Then in wrangler.toml, define a migration setting up your DO class like usual, but instead of using new_classes, use new_sqlite_classes:
[[migrations]]
tag = "v1"
new_sqlite_classes = ["FlightSeating"]
SQLite-backed objects also support the existing key/value-based storage API: KV data is stored into a hidden table in the SQLite database. So, existing applications built on DOs will work when deployed using SQLite-backed objects.
However, because SQLite-backed objects are based on an all-new storage backend, it is currently not possible to switch an existing deployed DO class to use SQLite. You must ask for SQLite when initially deploying the new DO class; you cannot change it later. We plan to begin migrating existing DOs to the new storage backend in 2025.
Pricing
We’ve kept pricing for SQLite-in-DO similar to D1, Cloudflare’s serverless SQL database, by billing for SQL queries (based on rows) and SQL storage. SQL storage per object is limited to 1 GB during the beta period, and will be increased to 10 GB on general availability. DO requests and duration billing are unchanged and apply to all DOs regardless of storage backend.
During the initial beta, billing is not enabled for SQL queries (rows read and rows written) and SQL storage. SQLite-backed objects will incur charges for requests and duration. We plan to enable SQL billing in the first half of 2025 with advance notice.
Workers Paid
Rows read
First 25 billion / month included + $0.001 / million rows
Rows written
First 50 million / month included + $1.00 / million rows
SQL storage
5 GB-month + $0.20/ GB-month
For more on how to use SQLite-in-Durable Objects, check out the documentation.
What about D1?
Cloudflare Workers already offers another SQLite-backed database product: D1. In fact, D1 is itself built on SQLite-in-DO. So, what’s the difference? Why use one or the other?
In short, you should think of D1 as a more “managed” database product, while SQLite-in-DO is more of a lower-level “compute with storage” building block.
D1 fits into a more traditional cloud architecture, where stateless application servers talk to a separate database over the network. Those application servers are typically Workers, but could also be clients running outside of Cloudflare. D1 also comes with a pre-built HTTP API and managed observability features like query insights. With D1, where your application code and SQL database queries are not colocated like in SQLite-in-DO, Workers has Smart Placement to dynamically run your Worker in the best location to reduce total request latency, considering everything your Worker talks to, including D1. By the end of 2024, D1 will support automatic read replication for scalability and low-latency access around the world. If this managed model appeals to you, use D1.
Durable Objects require a bit more effort, but in return, give you more power. With DO, you have two pieces of code that run in different places: a front-end Worker which routes incoming requests from the Internet to the correct DO, and the DO itself, which runs on the same machine as the SQLite database. You may need to think carefully about which code to run where, and you may need to build some of your own tooling that exists out-of-the-box with D1. But because you are in full control, you can tailor the solution to your application’s needs and potentially achieve more.
Under the hood: Storage Relay Service
When Durable Objects first launched in 2020, it offered only a simple key/value-based interface for durable storage. Under the hood, these keys and values were stored in a well-known off-the-shelf database, with regional instances of this database deployed to locations in our data centers around the world. Durable Objects in each region would store their data to the regional database.
For SQLite-backed Durable Objects, we have completely replaced the persistence layer with a new system built from scratch, called Storage Relay Service, or SRS. SRS has already been powering D1 for over a year, and can now be used more directly by applications through Durable Objects.
SRS is based on a simple idea:
Local disk is fast and randomly-accessible, but expensive and prone to disk failures. Object storage (like R2) is cheap and durable, but much slower than local disk and not designed for database-like access patterns. Can we get the best of both worlds by using a local disk as a cache on top of object storage?
So, how does it work?
The mismatch in functionality between local disk and object storage
A SQLite database on disk tends to undergo many small changes in rapid succession. Any row of the database might be updated by any particular query, but the database is designed to avoid rewriting parts that didn’t change. Read queries may randomly access any part of the database. Assuming the right indexes exist to support the query, they should not require reading parts of the database that aren’t relevant to the results, and should complete in microseconds.
Object storage, on the other hand, is designed for an entirely different usage model: you upload an entire “object” (blob of bytes) at a time, and download an entire blob at a time. Each blob has a different name. For maximum efficiency, blobs should be fairly large, from hundreds of kilobytes to gigabytes in size. Latency is relatively high, measured in tens or hundreds of milliseconds.
So how do we back up our SQLite database to object storage? An obviously naive strategy would be to simply make a copy of the database files from time to time and upload it as a new “object”. But, uploading the database on every change — and making the application wait for the upload to complete — would obviously be way too slow. We could choose to upload the database only occasionally — say, every 10 minutes — but this means in the case of a disk failure, we could lose up to 10 minutes of changes. Data loss is, uh, bad! And even then, for most databases, it’s likely that most of the data doesn’t change every 10 minutes, so we’d be uploading the same data over and over again.
Trick one: Upload a log of changes
Instead of uploading the entire database, SRS records a log of changes, and uploads those.
Conveniently, SQLite itself already has a concept of a change log: the Write-Ahead Log, or WAL. SRS always configures SQLite to use WAL mode. In this mode, any changes made to the database are first written to a separate log file. From time to time, the database is “checkpointed”, merging the changes back into the main database file. The WAL format is well-documented and easy to understand: it’s just a sequence of “frames”, where each frame is an instruction to write some bytes to a particular offset in the database file.
SRS monitors changes to the WAL file (by hooking SQLite’s VFS to intercept file writes) to discover the changes being made to the database, and uploads those to object storage.
Unfortunately, SRS cannot simply upload every single change as a separate “object”, as this would result in too many objects, each of which would be inefficiently small. Instead, SRS batches changes over a period of up to 10 seconds, or up to 16 MB worth, whichever happens first, then uploads the whole batch as a single object.
When reconstructing a database from object storage, we must download the series of change batches and replay them in order. Of course, if the database has undergone many changes over a long period of time, this can get expensive. In order to limit how far back it needs to look, SRS also occasionally uploads a snapshot of the entire content of the database. SRS will decide to upload a snapshot any time that the total size of logs since the last snapshot exceeds the size of the database itself. This heuristic implies that the total amount of data that SRS must download to reconstruct a database is limited to no more than twice the size of the database. Since we can delete data from object storage that is older than the latest snapshot, this also means that our total stored data is capped to 2x the database size.
Credit where credit is due: This idea — uploading WAL batches and snapshots to object storage — was inspired by Litestream, although our implementation is different.
Trick two: Relay through other servers in our global network
Batches are only uploaded to object storage every 10 seconds. But obviously, we cannot make the application wait for 10 whole seconds just to confirm a write. So what happens if the application writes some data, returns a success message to the user, and then the machine fails 9 seconds later, losing the data?
To solve this problem, we take advantage of our global network. Every time SQLite commits a transaction, SRS will immediately forward the change log to five “follower” machines across our network. Once at least three of these followers respond that they have received the change, SRS informs the application that the write is confirmed. (As discussed earlier, the write confirmation opens the Durable Object’s “output gate”, unblocking network communications to the rest of the world.)
When a follower receives a change, it temporarily stores it in a buffer on local disk, and then awaits further instructions. Later on, once SRS has successfully uploaded the change to object storage as part of a batch, it informs each follower that the change has been persisted. At that point, the follower can simply delete the change from its buffer.
However, if the follower never receives the persisted notification, then, after some timeout, the follower itself will upload the change to object storage. Thus, if the machine running the database suddenly fails, as long as at least one follower is still running, it will ensure that all confirmed writes are safely persisted.
Each of a database’s five followers is located in a different physical data center. Cloudflare’s network consists of hundreds of data centers around the world, which means it is always easy for us to find four other data centers nearby any Durable Object (in addition to the one it is running in). In order for a confirmed write to be lost, then, at least four different machines in at least three different physical buildings would have to fail simultaneously (three of the five followers, plus the Durable Object’s host machine). Of course, anything can happen, but this is exceedingly unlikely.
Followers also come in handy when a Durable Object’s host machine is unresponsive. We may not know for sure if the machine has died completely, or if it is still running and responding to some clients but not others. We cannot start up a new instance of the DO until we know for sure that the previous instance is dead – or, at least, that it can no longer confirm writes, since the old and new instances could then confirm contradictory writes. To deal with this situation, if we can’t reach the DO’s host, we can instead try to contact its followers. If we can contact at least three of the five followers, and tell them to stop confirming writes for the unreachable DO instance, then we know that instance is unable to confirm any more writes going forward. We can then safely start up a new instance to replace the unreachable one.
Bonus feature: Point-in-Time Recovery
I mentioned earlier that SQLite-backed Durable Objects can be asked to revert their state to any time in the last 30 days. How does this work?
This was actually an accidental feature that fell out of SRS’s design. Since SRS stores a complete log of changes made to the database, we can restore to any point in time by replaying the change log from the last snapshot. The only thing we have to do is make sure we don’t delete those logs too soon.
Normally, whenever a snapshot is uploaded, all previous logs and snapshots can then be deleted. But instead of deleting them immediately, SRS merely marks them for deletion 30 days later. In the meantime, if a point-in-time recovery is requested, the data is still there to work from.
For a database with a high volume of writes, this may mean we store a lot of data for a lot longer than needed. As it turns out, though, once data has been written at all, keeping it around for an extra month is pretty cheap — typically cheaper, even, than writing it in the first place. It’s a small price to pay for always-on disaster recovery.
Get started with SQLite-in-DO
SQLite-backed DOs are available in beta starting today. You can start building with SQLite-in-DO by visiting developer documentation and provide beta feedback via the #durable-objects channel on our Developer Discord.
Do distributed systems like SRS excite you? Would you like to be part of building them at Cloudflare? We’re hiring!
During Birthday Week 2023, we launched Workers AI. Since then, we have been listening to your feedback, and one thing we’ve heard consistently is that our customers want Workers AI to be faster. In particular, we hear that large language model (LLM) generation needs to be faster. Users want their interactive chat and agents to go faster, developers want faster help, and users do not want to wait for applications and generated website content to load. Today, we’re announcing three upgrades we’ve made to Workers AI to bring faster and more efficient inference to our customers: upgraded hardware, KV cache compression, and speculative decoding.
Thanks to Cloudflare’s 12th generation compute servers, our network now supports a newer generation of GPUs capable of supporting larger models and faster inference. Customers can now use Meta Llama 3.2 11B, Meta’s newly released multi-modal model with vision support, as well as Meta Llama 3.1 70B on Workers AI. Depending on load and time of day, customers can expect to see two to three times the throughput for Llama 3.1 and 3.2 compared to our previous generation Workers AI hardware. More performance information for these models can be found in today’s post: Cloudflare’s Bigger, Better, Faster AI platform.
New KV cache compression methods, now open source
In our effort to deliver low-cost low-latency inference to the world, Workers AI has been developing novel methods to boost efficiency of LLM inference. Today, we’re excited to announce a technique for KV cache compression that can help increase throughput of an inference platform. And we’ve made it open source too, so that everyone can benefit from our research.
It’s all about memory
One of the main bottlenecks when running LLM inference is the amount of vRAM (memory) available. Every word that an LLM processes generates a set of vectors that encode the meaning of that word in the context of any earlier words in the input that are used to generate new tokens in the future. These vectors are stored in the KV cache, causing the memory required for inference to scale linearly with the total number of tokens of all sequences being processed. This makes memory a bottleneck for a lot of transformer-based models. Because of this, the amount of memory an instance has available limits the number of sequences it can generate concurrently, as well as the maximum token length of sequences it can generate.
So what is the KV cache anyway?
LLMs are made up of layers, with an attention operation occurring in each layer. Within each layer’s attention operation, information is collected from the representations of all previous tokens that are stored in cache. This means that vectors in the KV cache are organized into layers, so that the active layer’s attention operation can only query vectors from the corresponding layer of KV cache. Furthermore, since attention within each layer is parallelized across multiple attention “heads”, the KV cache vectors of a specific layer are further subdivided into groups corresponding to each attention head of that layer.
The diagram below shows the structure of an LLM’s KV cache for a single sequence being generated. Each cell represents a KV and the model’s representation for a token consists of all KV vectors for that token across all attention heads and layers. As you can see, the KV cache for a single layer is allocated as an M x N matrix of KV vectors where M is the number of attention heads and N is the sequence length. This will be important later!
Now that we know what the KV cache looks like, let’s dive into how we can shrink it!
The most common approach to compressing the KV cache involves identifying vectors within it that are unlikely to be queried by future attention operations and can therefore be removed without impacting the model’s outputs. This is commonly done by looking at the past attention weights for each pair of key and value vectors (a measure of the degree with which that KV’s representation has been queried during past attention operations) and selecting the KVs that have received the lowest total attention for eviction. This approach is conceptually similar to a LFU (least frequently used) cache management policy: the less a particular vector is queried, the more likely it is to be evicted in the future.
Different attention heads need different compression rates
As we saw earlier, the KV cache for each sequence in a particular layer is allocated on the GPU as a # attention heads X sequence length tensor. This means that the total memory allocation scales with the maximum sequence length for all attention heads of the KV cache. Usually this is not a problem, since each sequence generates the same number of KVs per attention head.
When we consider the problem of eviction-based KV cache compression, however, this forces us to remove an equal number of KVs from each attention head when doing the compression. If we remove more KVs from one attention head alone, those removed KVs won’t actually contribute to lowering the memory footprint of the KV cache on GPU, but will just add more empty “padding” to the corresponding rows of the tensor. You can see this in the diagram below (note the empty cells in the second row below):
The extra compression along the second head frees slots for two KVs, but the cache’s shape (and memory footprint) remains the same.
This forces us to use a fixed compression rate for all attention heads of KV cache, which is very limiting on the compression rates we can achieve before compromising performance.
Enter PagedAttention
The solution to this problem is to change how our KV cache is represented in physical memory. PagedAttention can represent N x M tensors with padding efficiently by using an N x M block table to index into a series of “blocks”.
This lets us retrieve the ith element of a row by taking the ith block number from that row in the block table and using the block number to lookup the corresponding block, so we avoid allocating space to padding elements in our physical memory representation. In our case, the elements in physical memory are the KV cache vectors, and the M and N that define the shape of our block table are the number of attention heads and sequence length, respectively. Since the block table is only storing integer indices (rather than high-dimensional KV vectors), its memory footprint is negligible in most cases.
Results
Using paged attention lets us apply different rates of compression to different heads in our KV cache, giving our compression strategy more flexibility than other methods. We tested our compression algorithm on LongBench (a collection of long-context LLM benchmarks) with Llama-3.1-8B and found that for most tasks we can retain over 95% task performance while reducing cache size by up to 8x (left figure below). Over 90% task performance can be retained while further compressing up to 64x. That means you have room in memory for 64 times as many tokens!
This lets us increase the number of requests we can process in parallel, increasing the total throughput (total tokens generated per second) by 3.44x and 5.18x for compression rates of 8x and 64x, respectively (right figure above).
Try it yourself!
If you’re interested in taking a deeper dive check out our vLLM fork and get compressing!!
Speculative decoding for faster throughput
A new inference strategy that we implemented is speculative decoding, which is a very popular way to get faster throughput (measured in tokens per second). LLMs work by predicting the next expected token (a token can be a word, word fragment or single character) in the sequence with each call to the model, based on everything that the model has seen before. For the first token generated, this means just the initial prompt, but after that each subsequent token is generated based on the prompt plus all other tokens that have been generated. Typically, this happens one token at a time, generating a single word, or even a single letter, depending on what comes next.
But what about this prompt:
Knock, knock!
If you are familiar with knock-knock jokes, you could very accurately predict more than one token ahead. For an English language speaker, what comes next is a very specific sequence that is four to five tokens long: “Who’s there?” or “Who is there?” Human language is full of these types of phrases where the next word has only one, or a few, high probability choices. Idioms, common expressions, and even basic grammar are all examples of this. So for each prediction the model makes, we can take it a step further with speculative decoding to predict the next n tokens. This allows us to speed up inference, as we’re not limited to predicting one token at a time.
There are several different implementations of speculative decoding, but each in some way uses a smaller, faster-to-run model to generate more than one token at a time. For Workers AI, we have applied prompt-lookup decoding to some of the LLMs we offer. This simple method matches the last n tokens of generated text against text in the prompt/output and predicts candidate tokens that continue these identified patterns as candidates for continuing the output. In the case of knock-knock jokes, it can predict all the tokens for “Who’s there” at once after seeing “Knock, knock!”, as long as this setup occurs somewhere in the prompt or previous dialogue already. Once these candidate tokens have been predicted, the model can verify them all with a single forward-pass and choose to either accept or reject them. This increases the generation speed of llama-3.1-8b-instruct by up to 40% and the 70B model by up to 70%.
Speculative decoding has tradeoffs, however. Typically, the results of a model using speculative decoding have a lower quality, both when measured using benchmarks like MMLU as well as when compared by humans. More aggressive speculation can speed up sequence generation, but generally comes with a greater impact to the quality of the result. Prompt lookup decoding offers one of the smallest overall quality impacts while still providing performance improvements, and we will be adding it to some language models on Workers AI including @cf/meta/llama-3.1-8b-instruct.
And, by the way, here is one of our favorite knock-knock jokes, can you guess the punchline?
Knock, knock!
Who’s there?
Figs!
Figs who?
Figs the doorbell, it’s broken!
Keep accelerating
As the AI industry continues to evolve, there will be new hardware and software that allows customers to get faster inference responses. Workers AI is committed to researching, implementing, and making upgrades to our services to help you get fast inference. As an Inference-as-a-Service platform, you’ll be able to benefit from all the optimizations we apply, without having to hire your own team of ML researchers and SREs to manage inference software and hardware deployments.
We’re excited for you to try out some of these new releases we have and let us know what you think! Check out our full-suite of AI announcements here and check out the developer docs to get started.
The collective thoughts of the interwebz
Manage Consent
To provide the best experiences, we use technologies like cookies to store and/or access device information. Consenting to these technologies will allow us to process data such as browsing behavior or unique IDs on this site. Not consenting or withdrawing consent, may adversely affect certain features and functions.
Functional
Always active
The technical storage or access is strictly necessary for the legitimate purpose of enabling the use of a specific service explicitly requested by the subscriber or user, or for the sole purpose of carrying out the transmission of a communication over an electronic communications network.
Preferences
The technical storage or access is necessary for the legitimate purpose of storing preferences that are not requested by the subscriber or user.
Statistics
The technical storage or access that is used exclusively for statistical purposes.The technical storage or access that is used exclusively for anonymous statistical purposes. Without a subpoena, voluntary compliance on the part of your Internet Service Provider, or additional records from a third party, information stored or retrieved for this purpose alone cannot usually be used to identify you.
Marketing
The technical storage or access is required to create user profiles to send advertising, or to track the user on a website or across several websites for similar marketing purposes.