Tag Archives: Developer Platform

Cloudflare’s bigger, better, faster AI platform

Post Syndicated from Michelle Chen original https://blog.cloudflare.com/workers-ai-bigger-better-faster

Birthday Week 2024 marks our first anniversary of Cloudflare’s AI developer products — Workers AI, AI Gateway, and Vectorize. For our first birthday this year, we’re excited to announce powerful new features to elevate the way you build with AI on Cloudflare.

Workers AI is getting a big upgrade, with more powerful GPUs that enable faster inference and bigger models. We’re also expanding our model catalog to be able to dynamically support models that you want to run on us. Finally, we’re saying goodbye to neurons and revamping our pricing model to be simpler and cheaper. On AI Gateway, we’re moving forward on our vision of becoming an ML Ops platform by introducing more powerful logs and human evaluations. Lastly, Vectorize is going GA, with expanded index sizes and faster queries.

Whether you want the fastest inference at the edge, optimized AI workflows, or vector database-powered RAG, we’re excited to help you harness the full potential of AI and get started on building with Cloudflare.

The fast, global AI platform

The first thing that you notice about an application is how fast, or in many cases, how slow it is. This is especially true of AI applications, where the standard today is to wait for a response to be generated.

At Cloudflare, we’re obsessed with improving the performance of applications, and have been doubling down on our commitment to make AI fast. To live up to that commitment, we’re excited to announce that we’ve added even more powerful GPUs across our network to accelerate LLM performance.

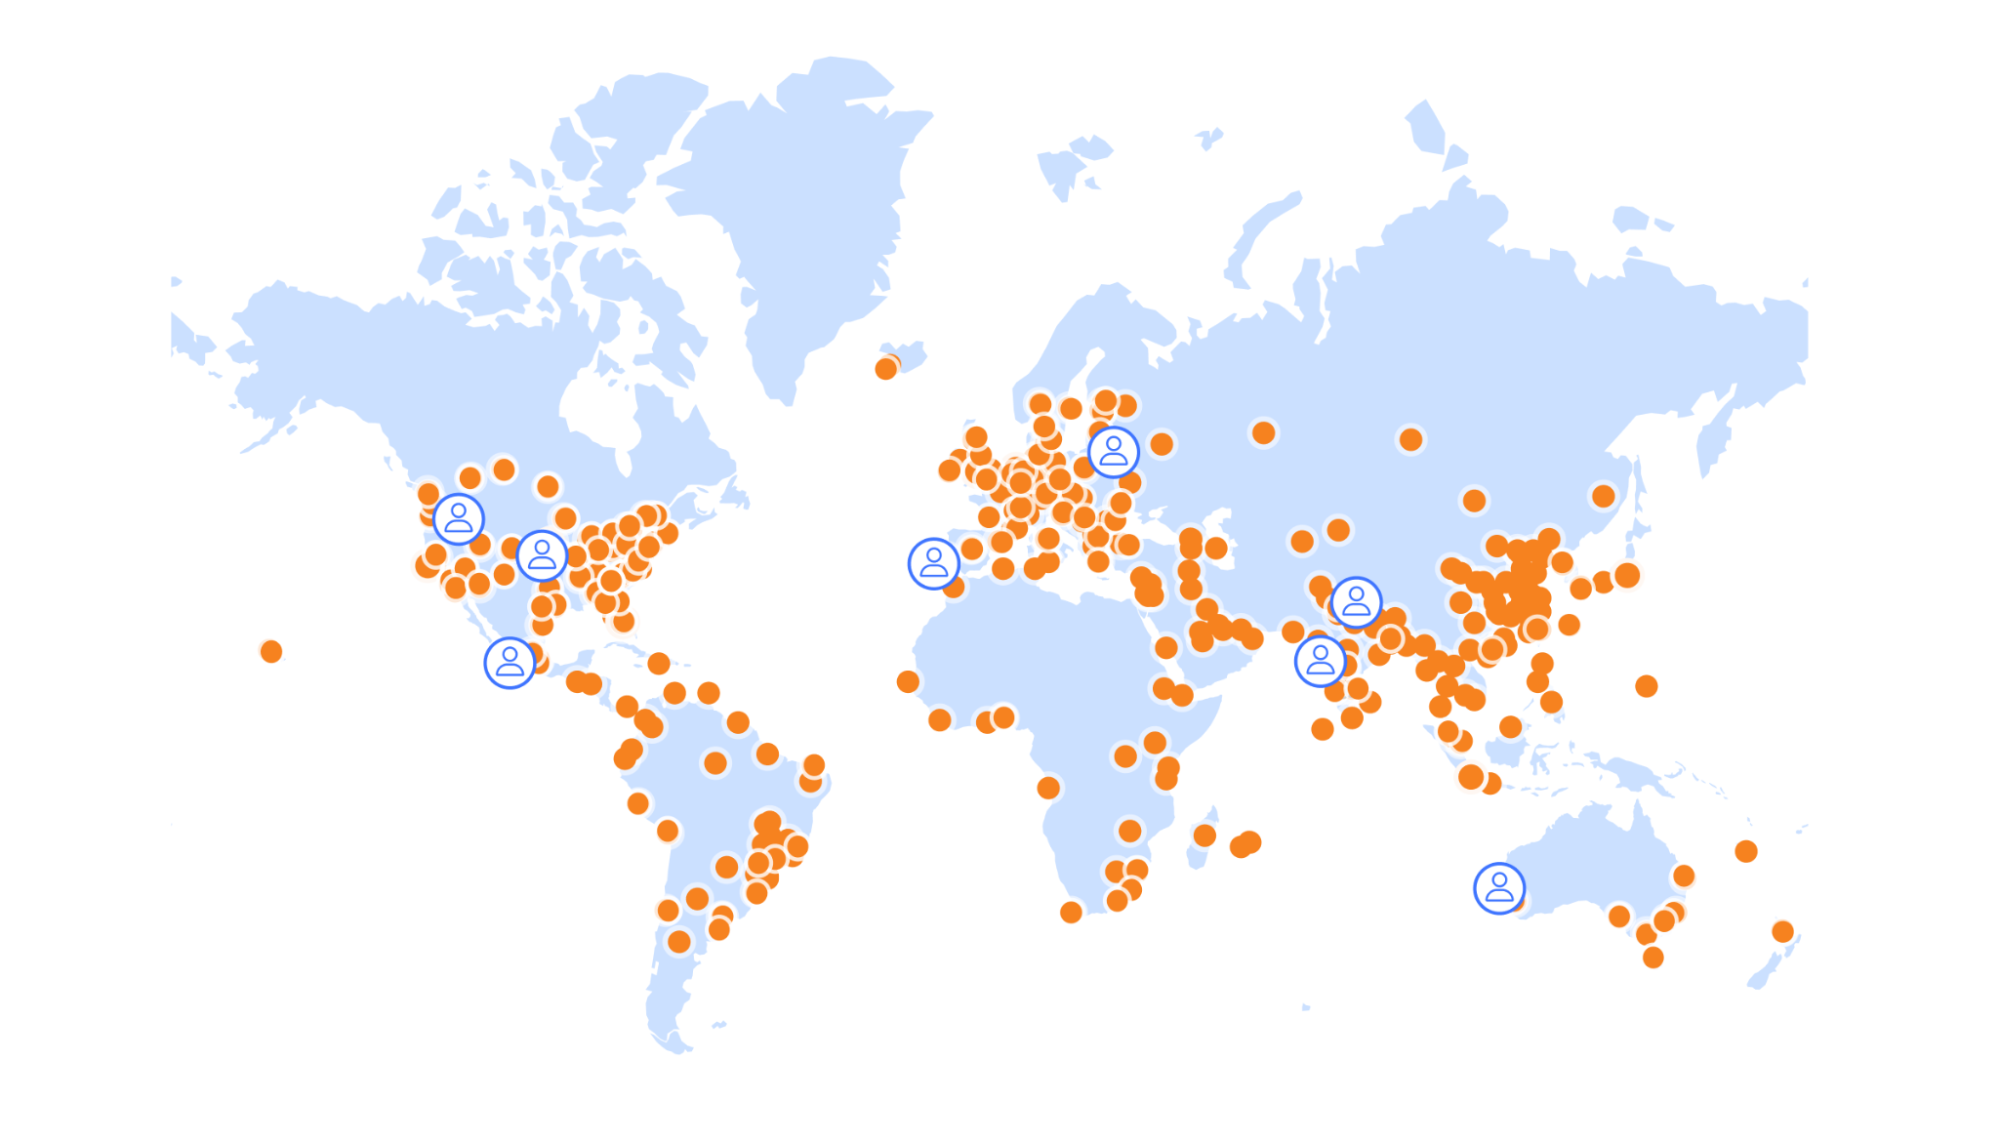
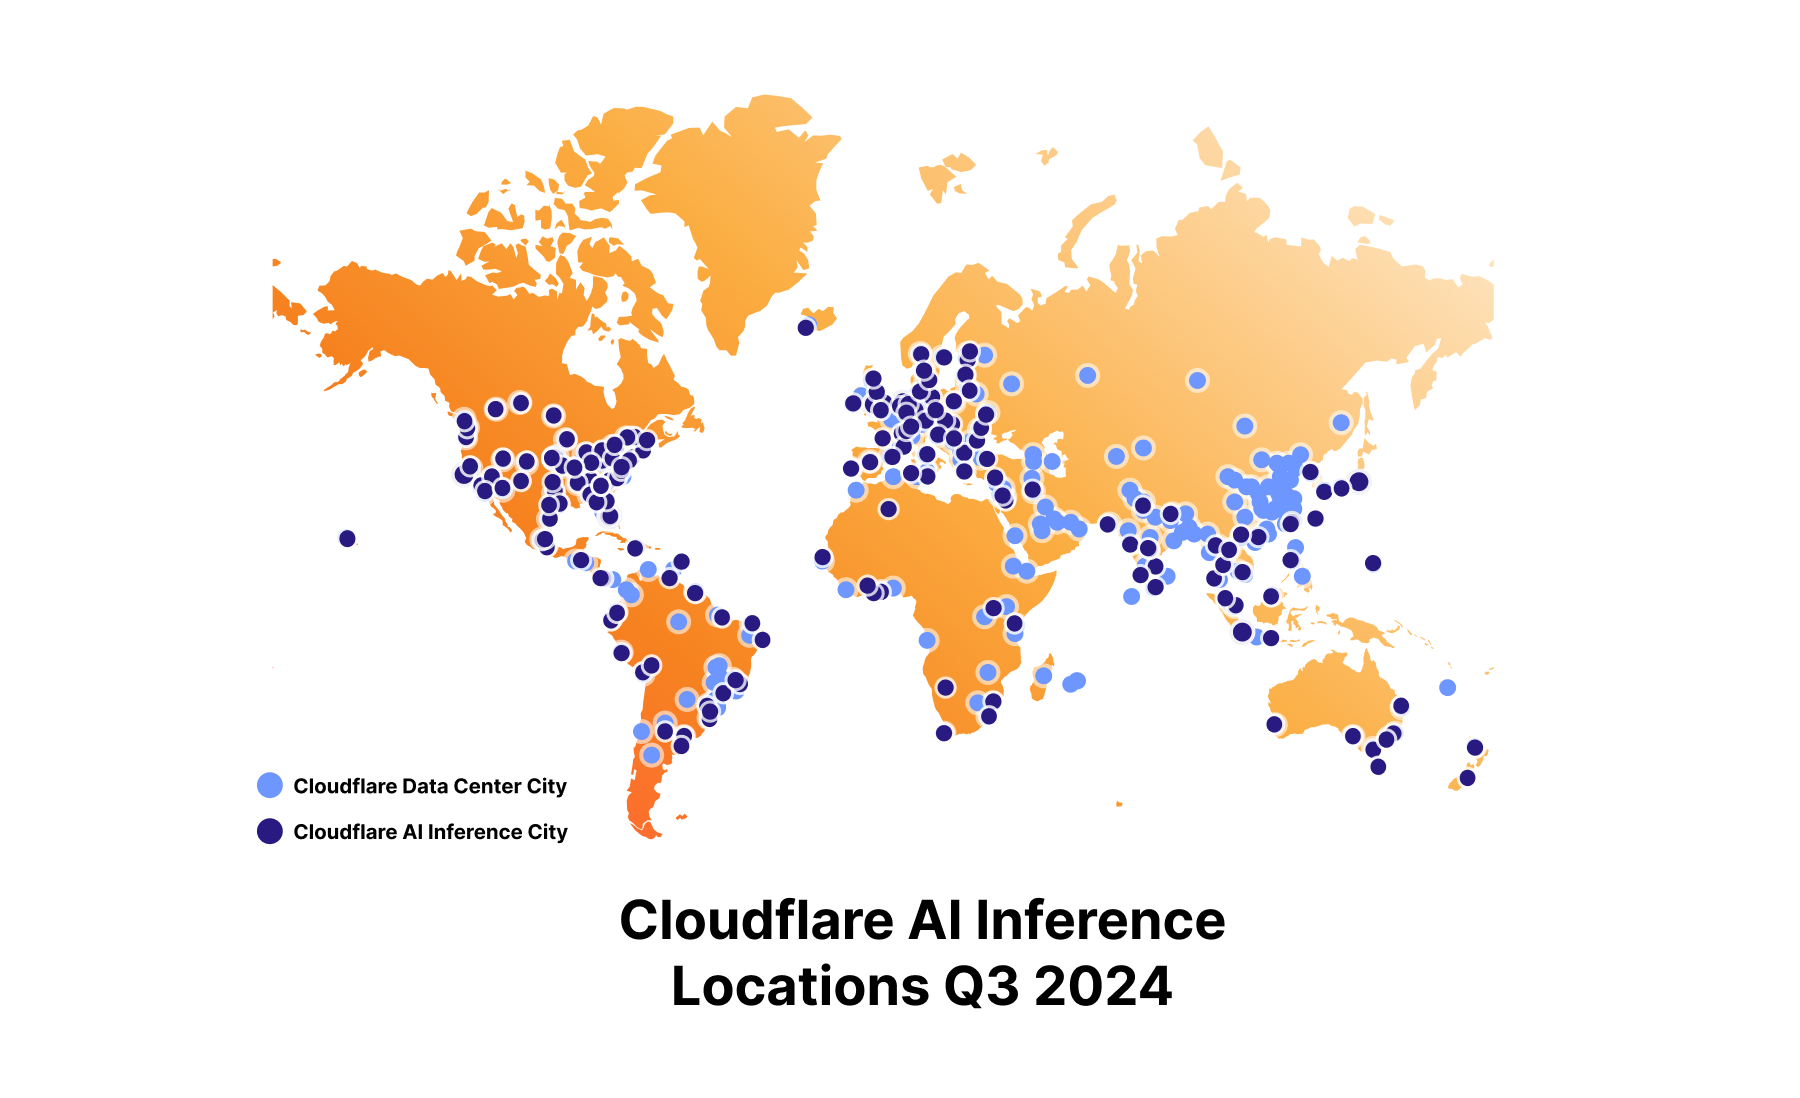
In addition to more powerful GPUs, we’ve continued to expand our GPU footprint to get as close to the user as possible, reducing latency even further. Today, we have GPUs in over 180 cities, having doubled our capacity in a year. 

Bigger, better, faster

With the introduction of our new, more powerful GPUs, you can now run inference on significantly larger models, including Meta Llama 3.1 70B. Previously, our model catalog was limited to 8B parameter LLMs, but we can now support larger models, faster response times, and larger context windows. This means your applications can handle more complex tasks with greater efficiency.

Model

@cf/meta/Llama-3.2-11B-Vision-Instruct

@cf/meta/Llama-3.2-1B-Instruct

@cf/meta/Llama-3.2-3B-Instruct

@cf/meta/Llama-3.1-8B-Instruct

@cf/meta/Llama-3.1-70B-Instruct

@cf/black-forest-labs/flux-1-schnell

The set of models above are available on our new GPUs at faster speeds. If you’re using Llama 3.1, we’ve already upgraded you to the faster inference – so your applications are automatically sped up! In general, you can expect throughput of 80+ Tokens per Second (TPS) for 8b models and a Time To First Token of 300 ms (depending on where you are in the world).

Our model instances now support larger context windows, like the full 128K context window for Llama 3.1 and 3.2. To give you full visibility into performance, we’ll also be publishing metrics like TTFT, TPS, Context Window, and pricing on models in our catalog, so you know exactly what to expect.

We’re committed to bringing the best of open-source models to our platform, and that includes Meta’s release of the new Llama 3.2 collection of models. As a Meta launch partner, we were excited to have Day 0 support for the 11B vision model, as well as the 1B and 3B text-only model on Workers AI.

For more details on how we made Workers AI fast, take a look at our technical blog post, where we share a novel method for KV cache compression (it’s open-source!), as well as details on speculative decoding, our new hardware design, and more.

Greater model flexibility

With our commitment to helping you run more powerful models faster, we are also expanding the breadth of models you can run on Workers AI with our Run Any* Model feature. Until now, we have manually curated and added only the most popular open source models to Workers AI. Now, we are opening up our catalog to the public, giving you the flexibility to choose from a broader selection of models. We will support models that are compatible with our GPUs and inference stack at the start (hence the asterisk on Run Any* Model). We’re launching this feature in closed beta and if you’d like to try it out, please fill out the form, so we can grant you access to this new feature.

The Workers AI model catalog will now be split into two parts: a static catalog and a dynamic catalog. Models in the static catalog will remain curated by Cloudflare and will include the most popular open source models with guarantees on availability and speed (the models listed above). These models will always be kept warm in our network, ensuring you don’t experience cold starts. The usage and pricing model remains serverless, where you will only be charged for the requests to the model and not the cold start times.

Models that are launched via Run Any* Model will make up the dynamic catalog. If the model is public, users can share an instance of that model. In the future, we will allow users to launch private instances of models as well.

This is just the first step towards running your own custom or private models on Workers AI. While we have already been supporting private models for select customers, we are working on making this capacity available to everyone in the near future.

New Workers AI pricing

We launched Workers AI during Birthday Week 2023 with the concept of “neurons” for pricing. Neurons were intended to simplify the unit of measure across various models on our platform, including text, image, audio, and more. However, over the past year, we have listened to your feedback and heard that neurons were difficult to grasp and challenging to compare with other providers. Additionally, the industry has matured, and new pricing standards have materialized. As such, we’re excited to announce that we will be moving towards unit-based pricing and saying goodbye to neurons.

Moving forward, Workers AI will be priced based on model task, size, and units. LLMs will be priced based on the model size (parameters) and input/output tokens. Image generation models will be priced based on the output image resolution and the number of steps. Embeddings models will be priced based on input tokens. Speech-to-text models will be priced on seconds of audio input. 

Model Task

Units

Model Size

Pricing

LLMs (incl. Vision models)

Tokens in/out (blended)

<= 3B parameters

$0.10 per Million Tokens

3.1B – 8B

$0.15 per Million Tokens

8.1B – 20B

$0.20 per Million Tokens

20.1B – 40B

$0.50 per Million Tokens

40.1B+

$0.75 per Million Tokens

Embeddings

Tokens in

<= 150M parameters

$0.008 per Million Tokens

151M+ parameters

$0.015 per Million Tokens

Speech-to-text

Audio seconds in

N/A

$0.0039 per minute of audio input

Image Size

Model Type

Steps

Price

<=256×256

Standard

25

$0.00125 per 25 steps

Fast

5

$0.00025 per 5 steps

<=512×512

Standard

25

$0.0025 per 25 steps

Fast

5

$0.0005 per 5 steps

<=1024×1024

Standard

25

$0.005 per 25 steps

Fast

5

$0.001 per 5 steps

<=2048×2048

Standard

25

$0.01 per 25 steps

Fast

5

$0.002 per 5 steps

We paused graduating models and announcing pricing for beta models over the past few months as we prepared for this new pricing change. We’ll be graduating all models to this new pricing, and billing will take effect on October 1, 2024.

Our free tier has been redone to fit these new metrics, and will include a monthly allotment of usage across all the task types.

Model

Free tier size

Text Generation – LLM

10,000 tokens a day across any model size

Embeddings

10,000 tokens a day across any model size

Images

Sum of 250 steps, up to 1024×1024 resolution

Whisper

10 minutes of audio a day

Optimizing AI workflows with AI Gateway


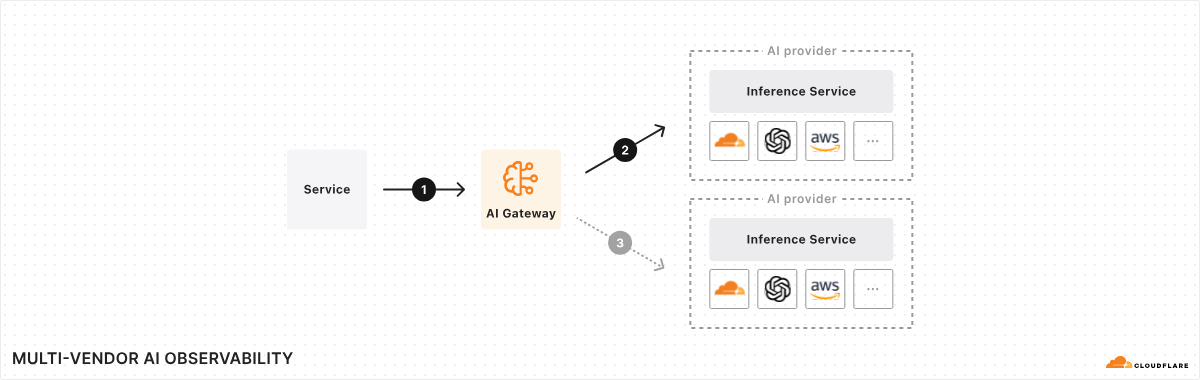
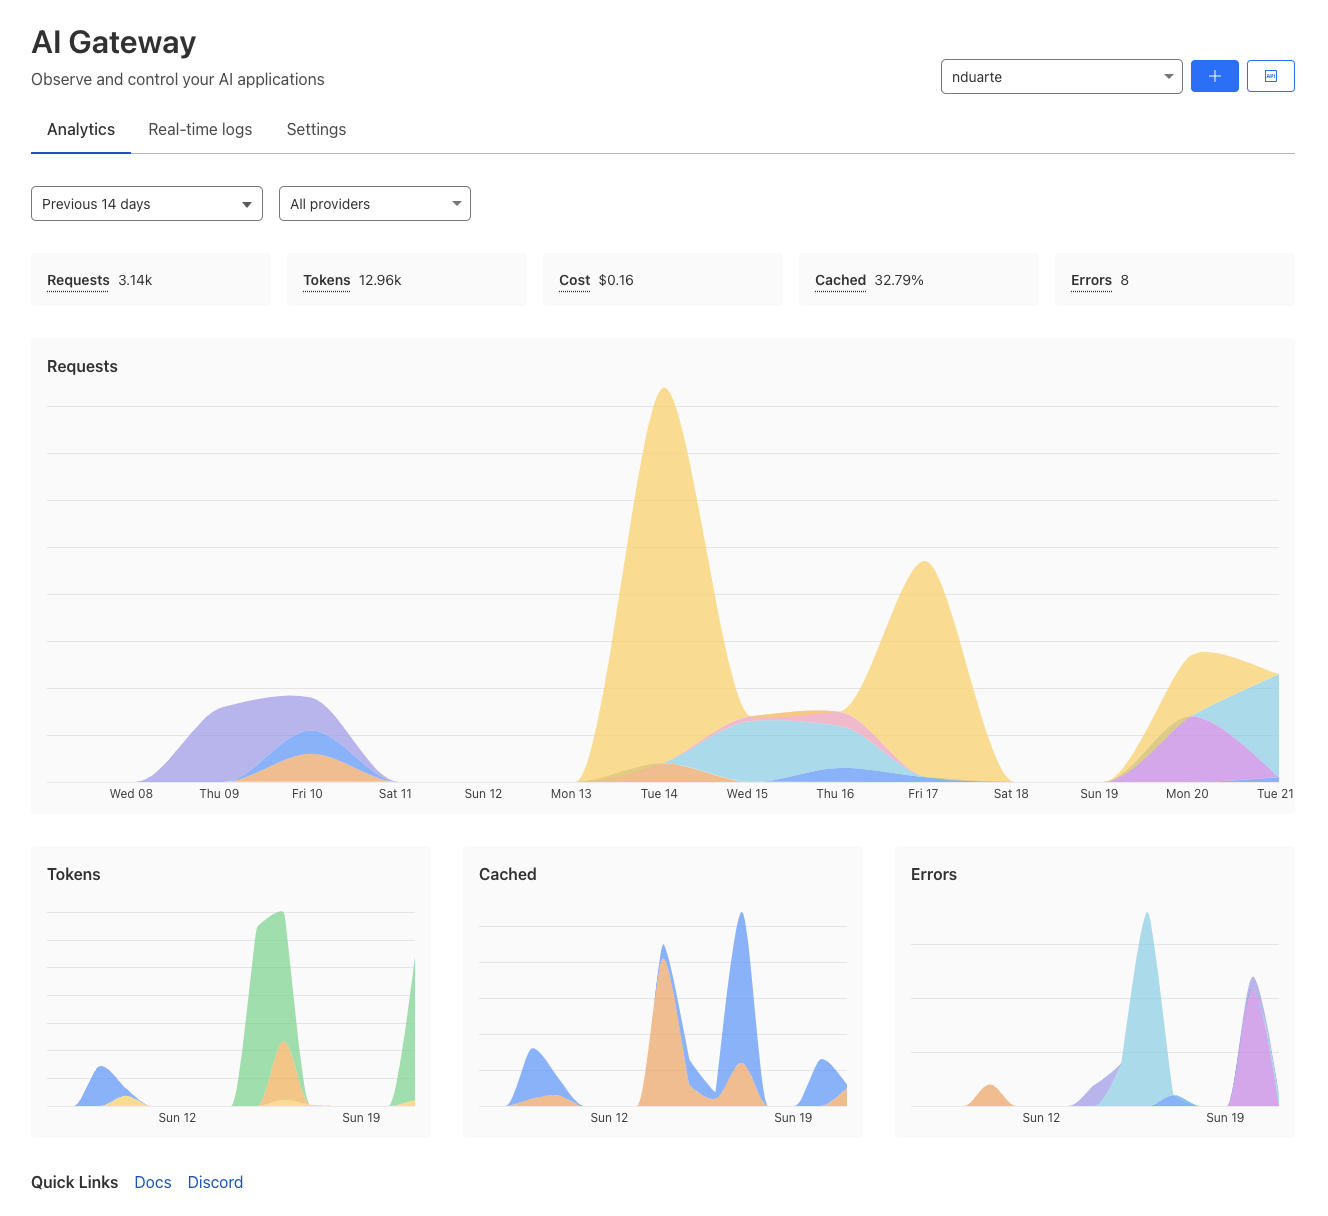
AI Gateway is designed to help developers and organizations building AI applications better monitor, control, and optimize their AI usage, and thanks to our users, AI Gateway has reached an incredible milestone — over 2 billion requests proxied by September 2024, less than a year after its inception. But we are not stopping there.

Persistent logs (open beta)

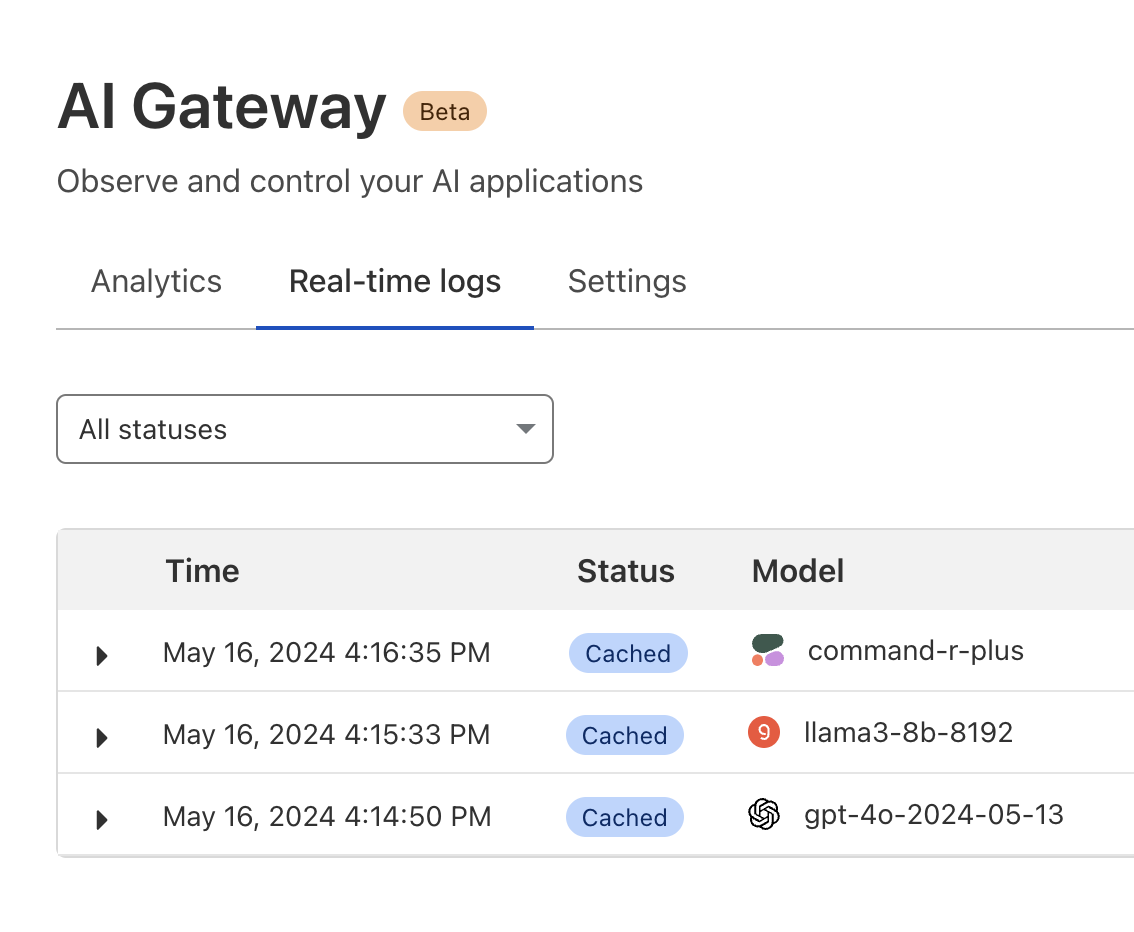
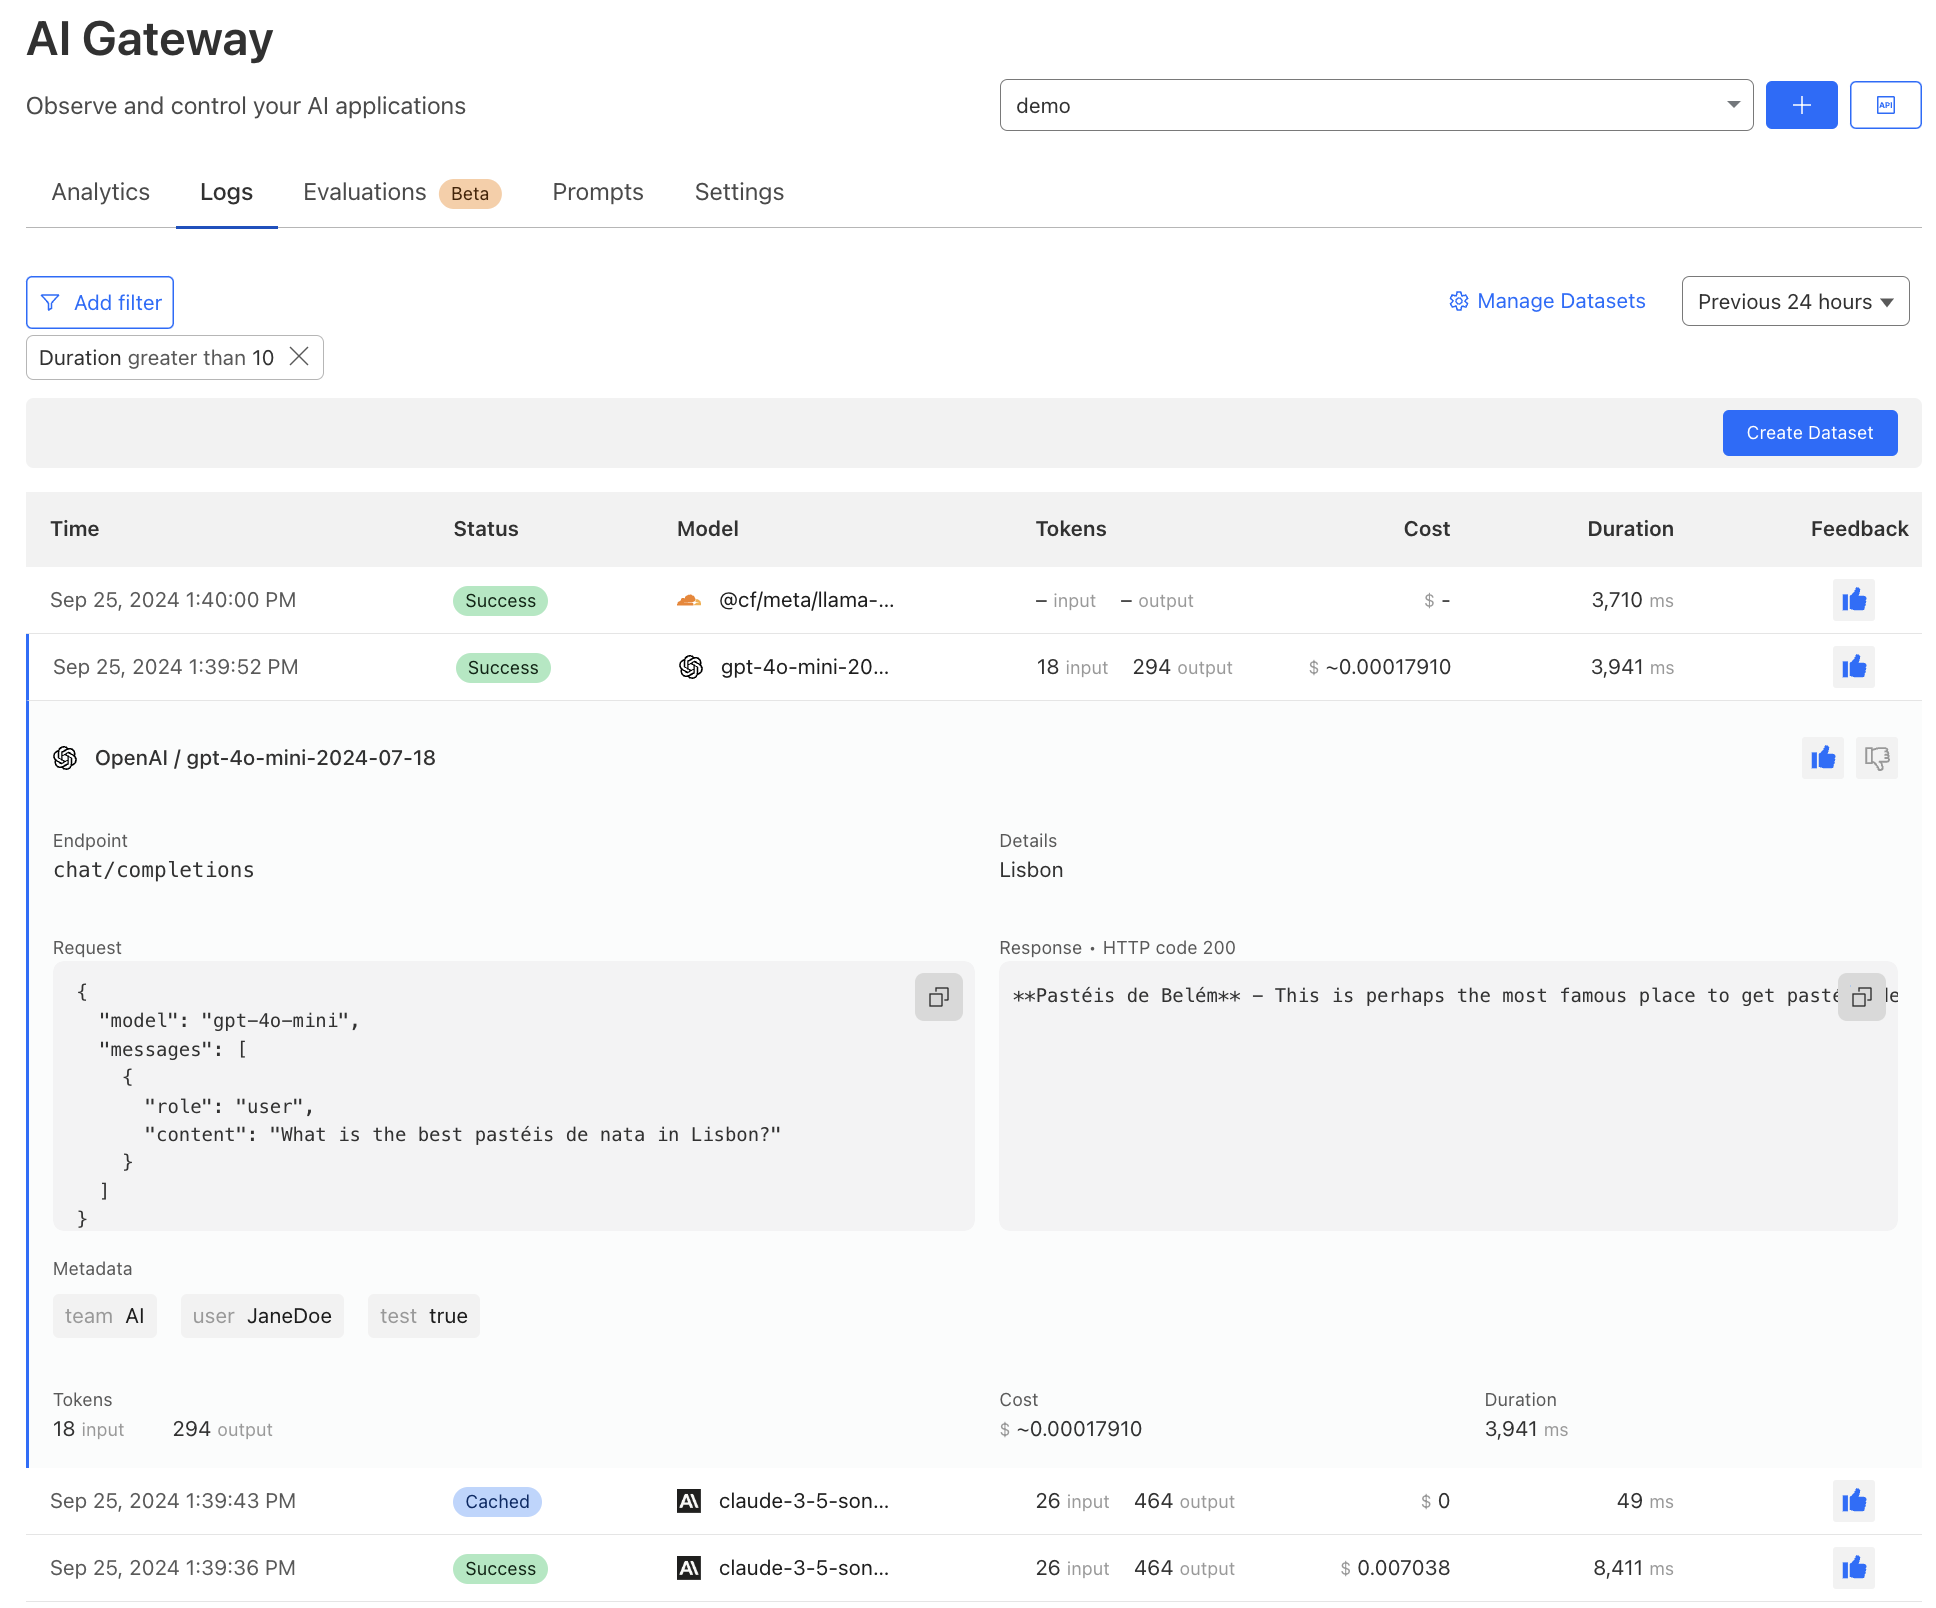
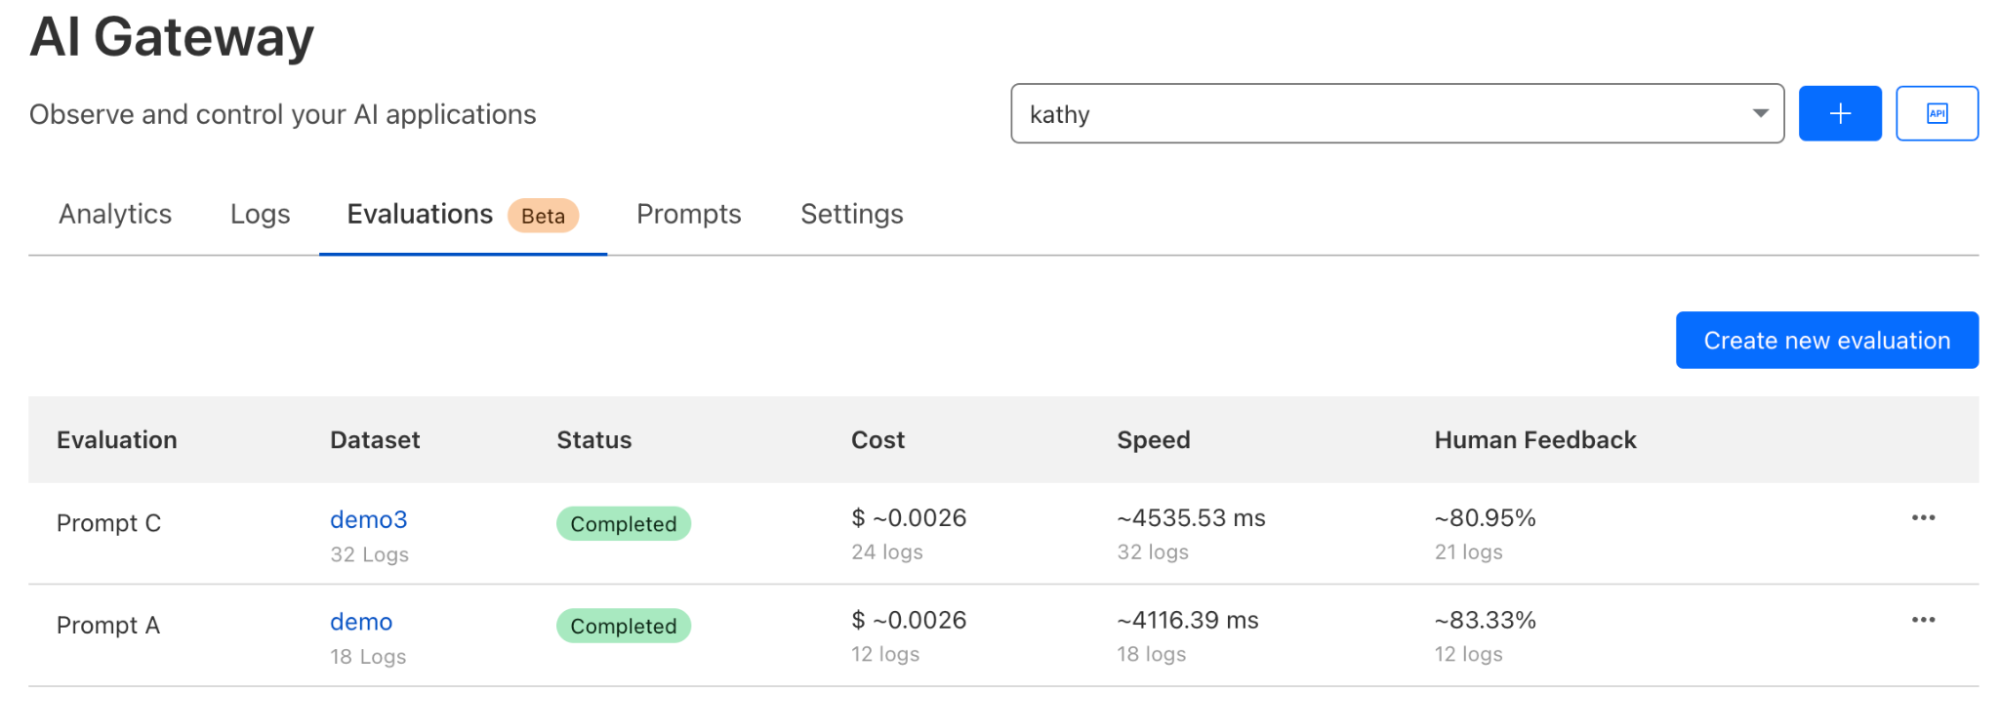
Persistent logs allow developers to store and analyze user prompts and model responses for extended periods, up to 10 million logs per gateway. Each request made through AI Gateway will create a log. With a log, you can see details of a request, including timestamp, request status, model, and provider.

We have revamped our logging interface to offer more detailed insights, including cost and duration. Users can now annotate logs with human feedback using thumbs up and thumbs down. Lastly, you can now filter, search, and tag logs with custom metadata to further streamline analysis directly within AI Gateway.

Persistent logs are available to use on all plans, with a free allocation for both free and paid plans. On the Workers Free plan, users can store up to 100,000 logs total across all gateways at no charge. For those needing more storage, upgrading to the Workers Paid plan will give you a higher free allocation — 200,000 logs stored total. Any additional logs beyond those limits will be available at $8 per 100,000 logs stored per month, giving you the flexibility to store logs for your preferred duration and do more with valuable data. Billing for this feature will be implemented when the feature reaches General Availability, and we’ll provide plenty of advance notice.


Workers Free

Workers Paid

Enterprise

Included Volume

100,000 logs stored (total)

200,000 logs stored (total)

Additional Logs

N/A

$8 per 100,000 logs stored per month

Export logs with Logpush

For users looking to export their logs, AI Gateway now supports log export via Logpush. With Logpush, you can automatically push logs out of AI Gateway into your preferred storage provider, including Cloudflare R2, Amazon S3, Google Cloud Storage, and more. This can be especially useful for compliance or advanced analysis outside the platform. Logpush follows its existing pricing model and will be available to all users on a paid plan.


AI evaluations

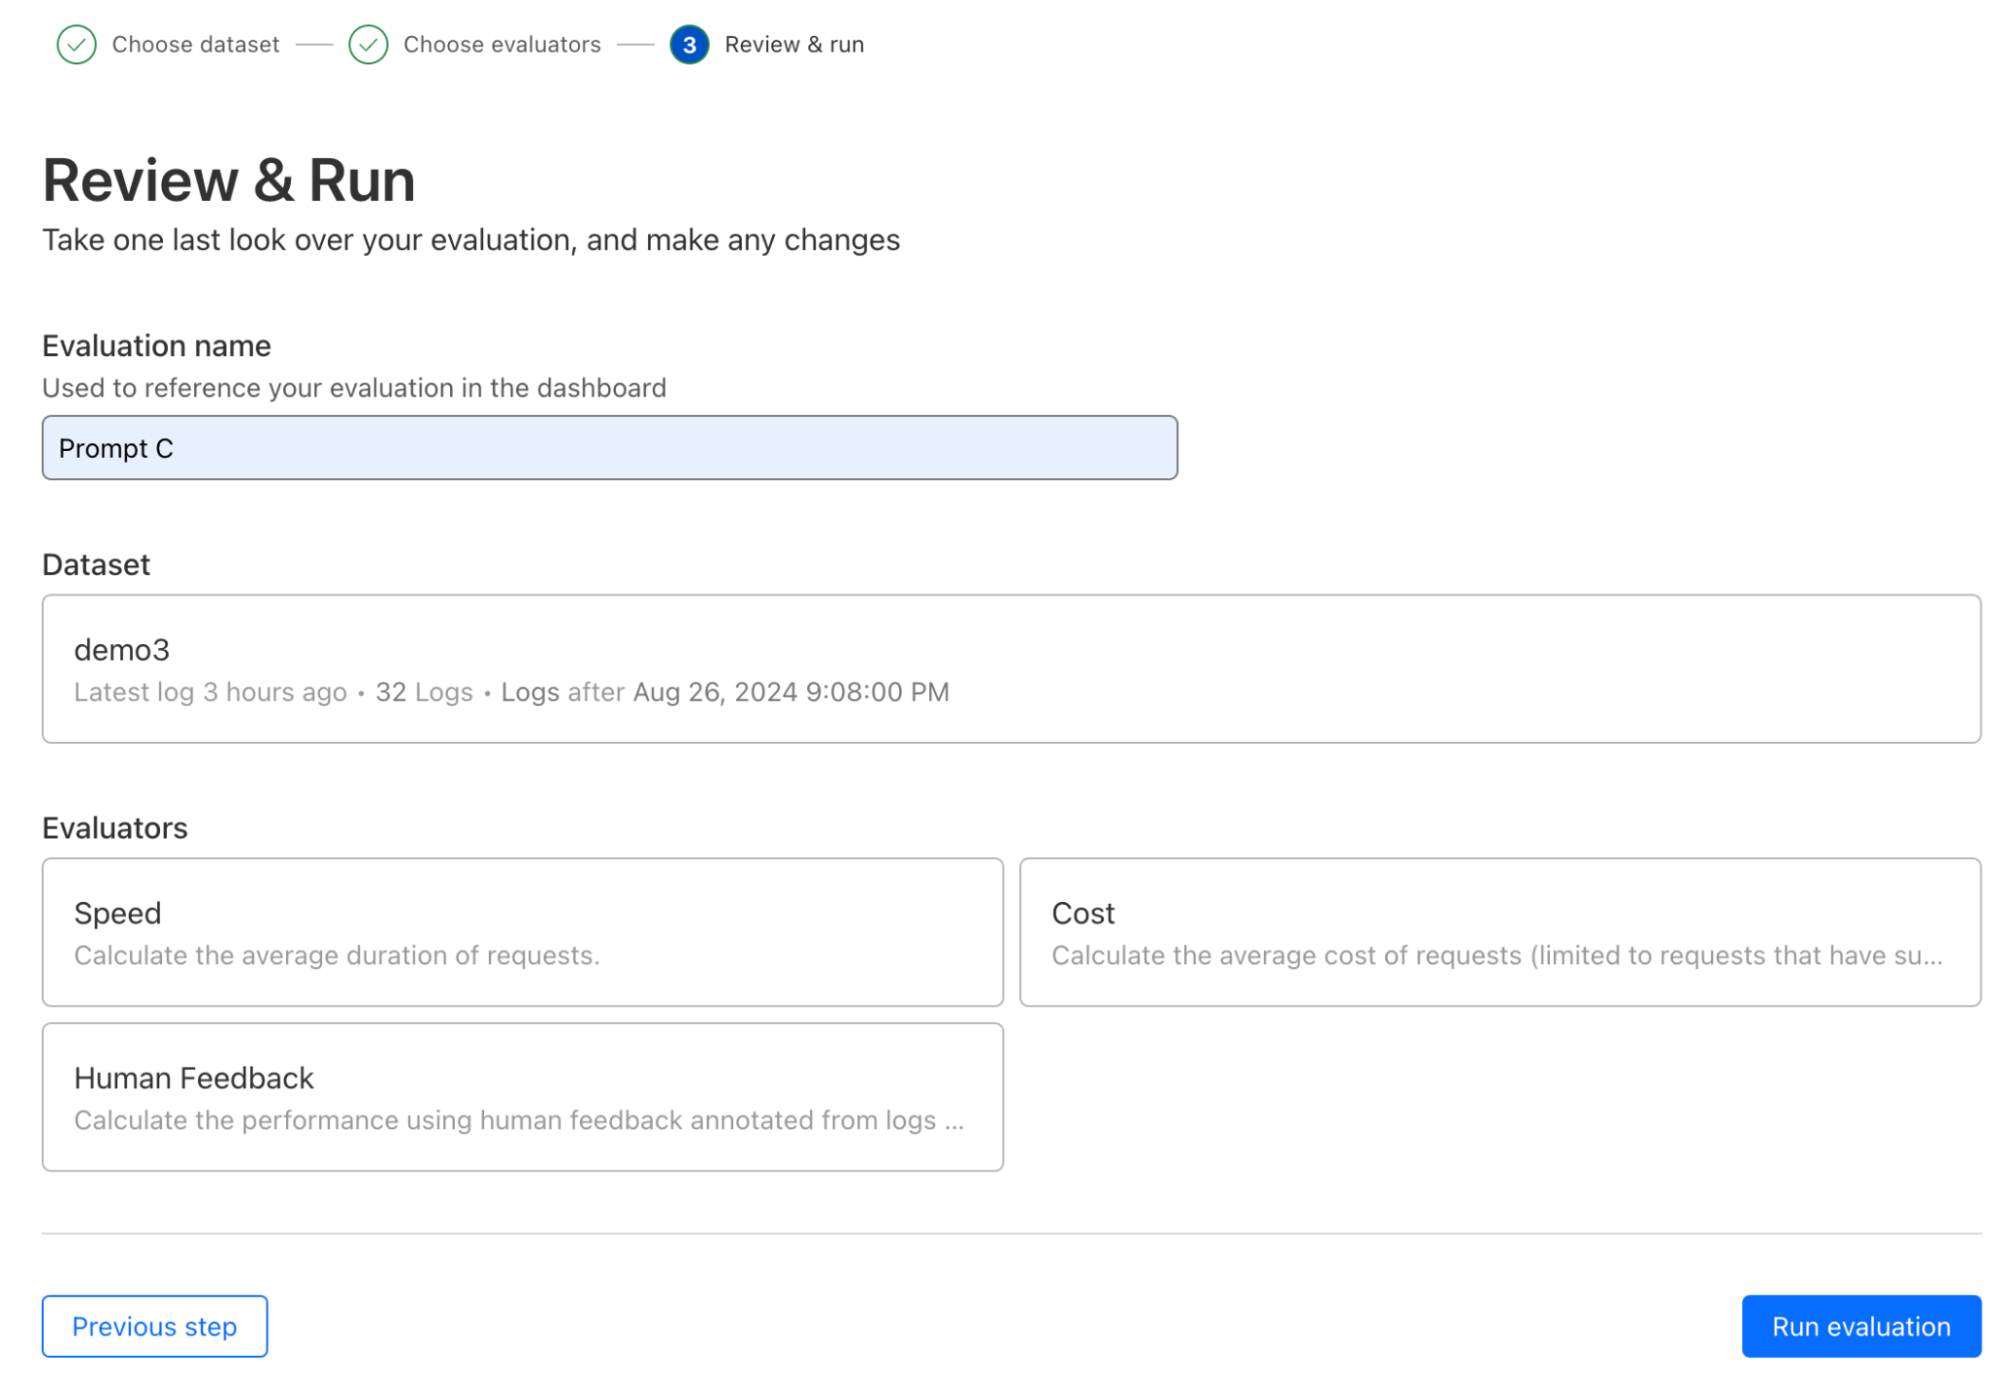
We are also taking our first step towards comprehensive AI evaluations, starting with evaluation using human in the loop feedback (this is now in open beta). Users can create datasets from logs to score and evaluate model performance, speed, and cost, initially focused on LLMs. Evaluations will allow developers to gain a better understanding of how their application is performing, ensuring better accuracy, reliability, and customer satisfaction. We’ve added support for cost analysis across many new models and providers to enable developers to make informed decisions, including the ability to add custom costs. Future enhancements will include automated scoring using LLMs, comparing performance of multiple models, and prompt evaluations, helping developers make decisions on what is best for their use case and ensuring their applications are both efficient and cost-effective.

Vectorize GA


We’ve completely redesigned Vectorize since our initial announcement in 2023 to better serve customer needs. Vectorize (v2) now supports indexes of up to 5 million vectors (up from 200,000), delivers faster queries (median latency is down 95% from 500 ms to 30 ms), and returns up to 100 results per query (increased from 20). These improvements significantly enhance Vectorize’s capacity, speed, and depth of results.

Note: if you got started on Vectorize before GA, to ease the move from v1 to v2, a migration solution will be available in early Q4 — stay tuned!

New Vectorize pricing

Not only have we improved performance and scalability, but we’ve also made Vectorize one of the most cost-effective options on the market. We’ve reduced query prices by 75% and storage costs by 98%.


New Vectorize pricing

Old Vectorize pricing

Price reduction

Writes

Free

Free

n/a

Query

$.01 per 1 million vector dimensions

$0.04 per 1 million vector dimensions

75%

Storage

$0.05 per 100 million vector dimensions

$4.00 per 100 million vector dimensions

98%

You can learn more about our pricing in the Vectorize docs.

Vectorize free tier

There’s more good news: we’re introducing a free tier to Vectorize to make it easy to experiment with our full AI stack.

The free tier includes:

  • 30 million queried vector dimensions / month

  • 5 million stored vector dimensions / month

How fast is Vectorize?

To measure performance, we conducted benchmarking tests by executing a large number of vector similarity queries as quickly as possible. We measured both request latency and result precision. In this context, precision refers to the proportion of query results that match the known true-closest results for all benchmarked queries. This approach allows us to assess both the speed and accuracy of our vector similarity search capabilities. Here are the following datasets we benchmarked on:

  • dbpedia-openai-1M-1536-angular: 1 million vectors, 1536 dimensions, queried with cosine similarity at a top K of 10

  • Laion-768-5m-ip: 5 million vectors, 768 dimensions, queried with cosine similarity at a top K of 10

    • We ran this again skipping the result-refinement pass to return approximate results faster

Benchmark dataset

P50 (ms)

P75 (ms)

P90 (ms)

P95 (ms)

Throughput (RPS)

Precision

dbpedia-openai-1M-1536-angular

31

56

159

380

343

95.4%

Laion-768-5m-ip 

81.5

91.7

105

123

623

95.5%

Laion-768-5m-ip w/o refinement

14.7

19.3

24.3

27.3

698

78.9%

These benchmarks were conducted using a standard Vectorize v2 index, queried with a concurrency of 300 via a Cloudflare Worker binding. The reported latencies reflect those observed by the Worker binding querying the Vectorize index on warm caches, simulating the performance of an existing application with sustained usage.

Beyond Vectorize’s fast query speeds, we believe the combination of Vectorize and Workers AI offers an unbeatable solution for delivering optimal AI application experiences. By running Vectorize close to the source of inference and user interaction, rather than combining AI and vector database solutions across providers, we can significantly minimize end-to-end latency.

With these improvements, we’re excited to announce the general availability of the new Vectorize, which is more powerful, faster, and more cost-effective than ever before.

Tying it all together: the AI platform for all your inference needs

Over the past year, we’ve been committed to building powerful AI products that enable users to build on us. While we are making advancements on each of these individual products, our larger vision is to provide a seamless, integrated experience across our portfolio.

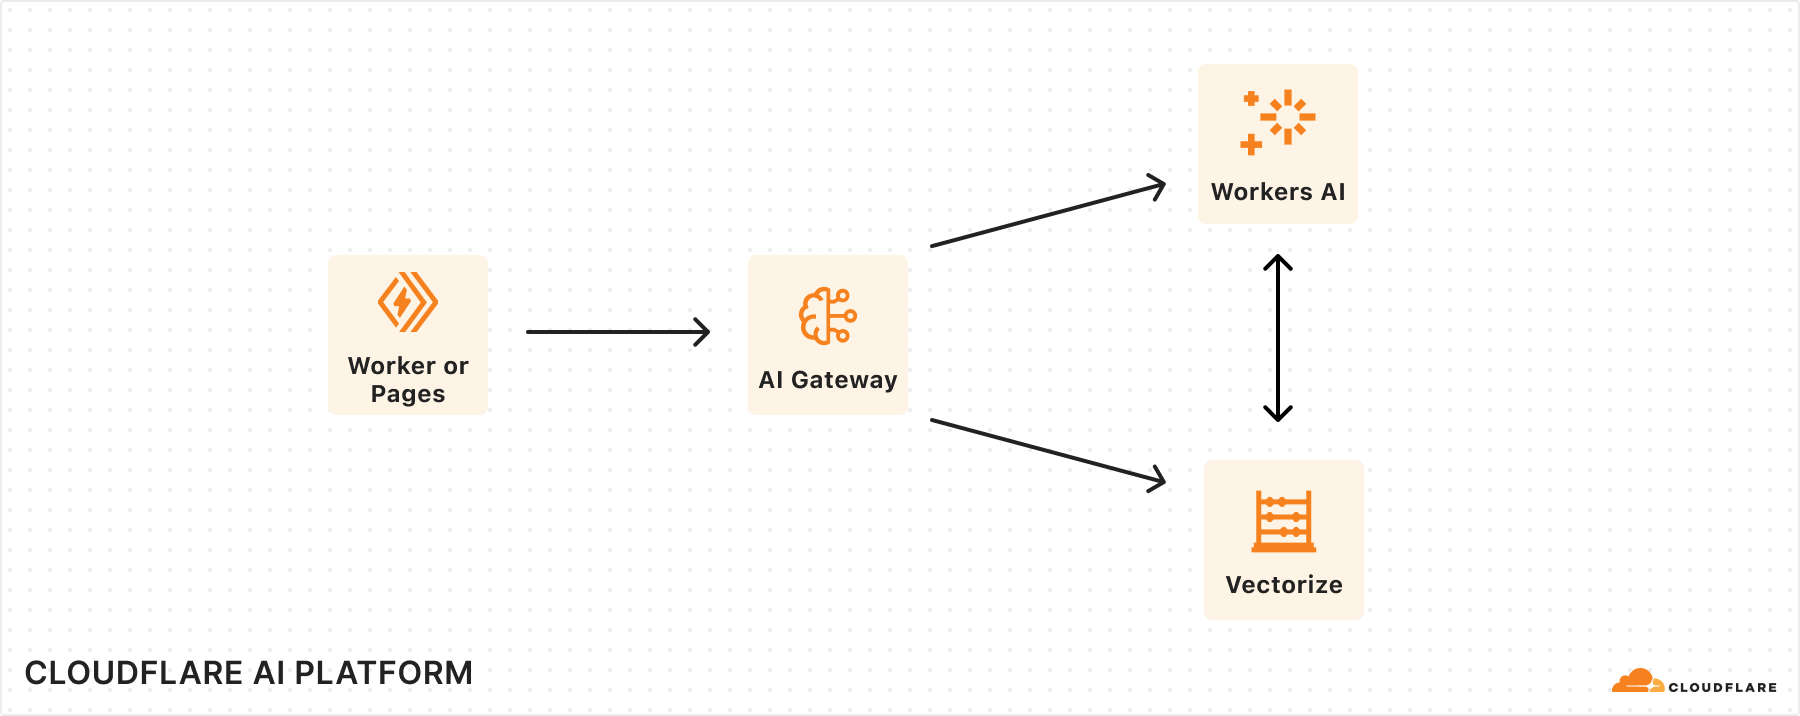
With Workers AI and AI Gateway, users can easily enable analytics, logging, caching, and rate limiting to their AI application by connecting to AI Gateway directly through a binding in the Workers AI request. We imagine a future where AI Gateway can not only help you create and save datasets to use for fine-tuning your own models with Workers AI, but also seamlessly redeploy them on the same platform. A great AI experience is not just about speed, but also accuracy. While Workers AI ensures fast performance, using it in combination with AI Gateway allows you to evaluate and optimize that performance by monitoring model accuracy and catching issues, like hallucinations or incorrect formats. With AI Gateway, users can test out whether switching to new models in the Workers AI model catalog will deliver more accurate performance and a better user experience.

In the future, we’ll also be working on tighter integrations between Vectorize and Workers AI, where you can automatically supply context or remember past conversations in an inference call. This cuts down on the orchestration needed to run a RAG application, where we can automatically help you make queries to vector databases.

If we put the three products together, we imagine a world where you can build AI apps with full observability (traces with AI Gateway) and see how the retrieval (Vectorize) and generation (Workers AI) components are working together, enabling you to diagnose issues and improve performance.

This Birthday Week, we’ve been focused on making sure our individual products are best-in-class, but we’re continuing to invest in building a holistic AI platform within our AI portfolio, but also with the larger Developer Platform Products. Our goal is to make sure that Cloudflare is the simplest, fastest, more powerful place for you to build full-stack AI experiences with all the batteries included.

We’re excited for you to try out all these new features! Take a look at our updated developer docs on how to get started and the Cloudflare dashboard to interact with your account.
Startup Program revamped: build and grow on Cloudflare with up to $250,000 in credits

Post Syndicated from Christopher Rotas original https://blog.cloudflare.com/startup-program-250k-credits

Today, we’re pleased to offer startups up to $250,000 in credits to use on Cloudflare’s Developer Platform. This new credits system will allow you to clearly see usage and associated fees to plan for a predictable future after the $250,000 in credits have been used up or after one year, whichever happens first.

You can see eligibility criteria and apply to the start-up program here. 

What can you use the credits for?

Credits can be applied to all Developer Platform products, as well as Argo and Cache Reserve. Moreover, we provide participants with up to three Enterprise-level domains, which includes CDN, DDoS, DNS, WAF, Zero Trust, and other security and performance products that a participant can enable for their website.

Developer tools and building on Cloudflare

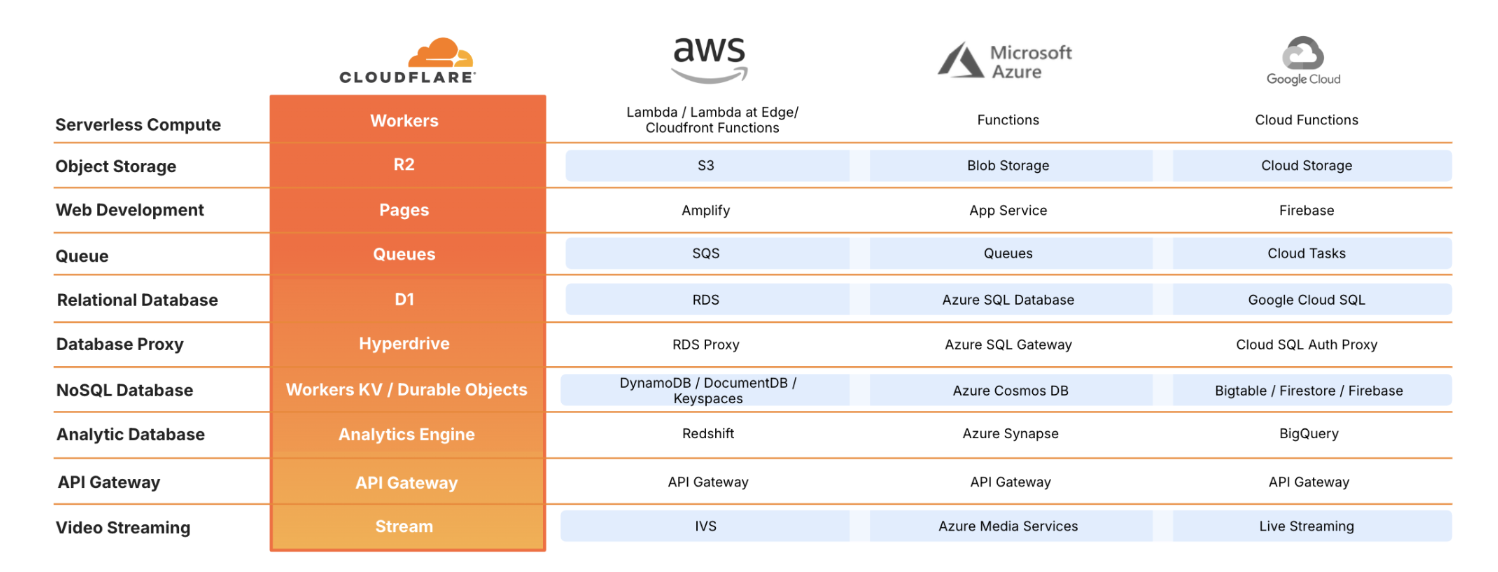
You can use credits for Cloudflare Developer Platform products, including those listed in the table below.

Note: credits for the Cloudflare Startup Program apply to Cloudflare products only, this table is illustrative of similar products in the market.

Speed and performance with Cloudflare

We know that founders need all the help they can get when starting their businesses. Beyond the Developer Platform, you can also use the Startup Program for our speed and performance products. Getting customers where they need to go within milliseconds on your website or application is the difference between closing a sale or not. You can test your speed here and learn how to optimize your speed and performance here with solutions like: Images, Argo, and Early Hints.

Security from Cloudflare

But, wait, there’s more: beyond the Developer Platform products and speed tools, you can also use Cloudflare’s many security features through the Startup Program as well. These include Web Application Firewall (WAF), DDoS Alerts, bundled protection plans, and more. The Startup Program also includes Zero Trust solutions. Learn how others are securing their technology and tools with Cloudflare Zero Trust.

For more inspiration, check out our Built with Cloudflare site, which highlights what other startups are building. 

Who can use the credits?

Eligibility criteria can be found here and include:

  • Companies building a software-based product or service

  • Founded within the last 5 years (2019-2024)

  • Have between $50,000 - $5,000,000 in funding

    • Note that for startups who have not yet raised at least $50,000, there may be other opportunities for lower credit amounts. Please apply with the promo code “BOOTSTRAPPED” if you haven’t raised $50,000 yet, but are interested in the Cloudflare Startup Program

  • Have a LinkedIn profile, valid website, and email address

  • Bonus criteria that adds to your application: being part of an approved accelerator

What will you build?

We’re excited to see what you will build. Please share what you’re up to with us so that we can help you however it makes sense. If you’re actively using Cloudflare’s Developer Platform, we’d love to hear more about what you’re building and share it on our Built with Cloudflare site.

Are you a startup looking for additional support, resources, or access to funding? Apply for our Workers Launchpad Program! The program runs for a few months, and in addition to the Startup Program, participants get access to hands-on bootcamp sessions, Solutions Architect office hours, introductions to VCs, and the opportunity to present at Demo Day.

Why does Cloudflare support founders and startups? 

Founders and developers face enough challenges without having to worry about incurring egregious costs to test technology and start building in the earliest days. You have the world at your fingertips and should be empowered to build and create without limitations. Invest money in your innovation, not in the infrastructure and technology that supports it.

The Startup Program understands this founder experience deeply, as the team is made up of former founders. Cloudflare is committed to programs like this to empower founders building the next big thing. Offering up to $250,000 in credits will allow folks to leverage even more of what we have to offer: a developer experience that removes friction, saves money, and gets applications spun up in hours, not days. 

We want to support founders from everywhere on earth.

Be bold and keep building! Follow @CloudflareDev and join our Developer Discord server.

Are you a startup building on Cloudflare? Apply here!

Automatically generating Cloudflare’s Terraform provider

Post Syndicated from Jacob Bednarz original https://blog.cloudflare.com/automatically-generating-cloudflares-terraform-provider

In November 2022, we announced the transition to OpenAPI Schemas for the Cloudflare API. Back then, we had an audacious goal to make the OpenAPI schemas the source of truth for our SDK ecosystem and reference documentation. During 2024’s Developer Week, we backed this up by announcing that our SDK libraries are now automatically generated from these OpenAPI schemas. Today, we’re excited to announce the latest pieces of the ecosystem to now be automatically generated — the Terraform provider and API reference documentation.

This means that the moment a new feature or attribute is added to our products and the team documents it, you’ll be able to see how it’s meant to be used across our SDK ecosystem and make use of it immediately. No more delays. No more lacking coverage of API endpoints.

You can find the new documentation site at https://developers.cloudflare.com/api-next/, and you can try the preview release candidate of the Terraform provider by installing 5.0.0-alpha1.

Why Terraform? 

For anyone who is unfamiliar with Terraform, it is a tool for managing your infrastructure as code, much like you would with your application code. Many of our customers (big and small) rely on Terraform to orchestrate their infrastructure in a technology-agnostic way. Under the hood, it is essentially an HTTP client with lifecycle management built in, which means it makes use of our publicly documented APIs in a way that understands how to create, read, update and delete for the life of the resource. 

Keeping Terraform updated — the old way

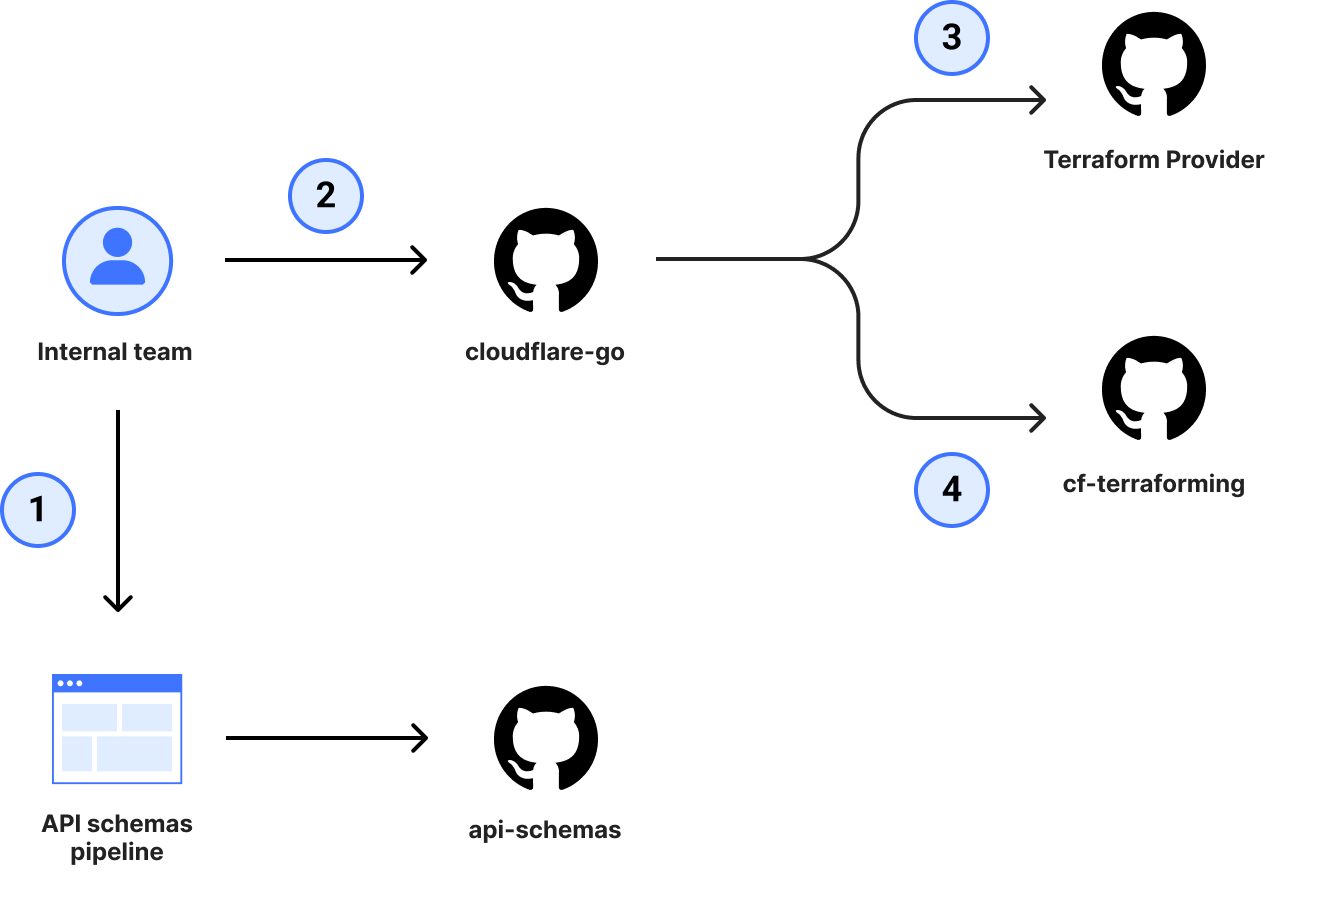
Historically, Cloudflare has manually maintained a Terraform provider, but since the provider internals require their own unique way of doing things, responsibility for maintenance and support has landed on the shoulders of a handful of individuals. The service teams always had difficulties keeping up with the number of changes, due to the amount of cognitive overhead required to ship a single change in the provider. In order for a team to get a change to the provider, it took a minimum of 3 pull requests (4 if you were adding support to cf-terraforming).


Even with the 4 pull requests completed, it didn’t offer guarantees on coverage of all available attributes, which meant small yet important details could be forgotten and not exposed to customers, causing frustration when trying to configure a resource.

To address this, our Terraform provider needed to be relying on the same OpenAPI schemas that the rest of our SDK ecosystem was already benefiting from.

Updating Terraform automatically

The thing that differentiates Terraform from our SDKs is that it manages the lifecycle of resources. With that comes a new range of problems related to known values and managing differences in the request and response payloads. Let’s compare the two different approaches of creating a new DNS record and fetching it back.

With our Go SDK:

// Create the new record
record, _ := client.DNS.Records.New(context.TODO(), dns.RecordNewParams{
	ZoneID: cloudflare.F("023e105f4ecef8ad9ca31a8372d0c353"),
	Record: dns.RecordParam{
		Name:    cloudflare.String("@"),
		Type:    cloudflare.String("CNAME"),
        Content: cloudflare.String("example.com"),
	},
})


// Wasteful fetch, but shows the point
client.DNS.Records.Get(
	context.Background(),
	record.ID,
	dns.RecordGetParams{
		ZoneID: cloudflare.String("023e105f4ecef8ad9ca31a8372d0c353"),
	},
)

And with Terraform:

resource "cloudflare_dns_record" "example" {
  zone_id = "023e105f4ecef8ad9ca31a8372d0c353"
  name    = "@"
  content = "example.com"
  type    = "CNAME"
}

On the surface, it looks like the Terraform approach is simpler, and you would be correct. The complexity of knowing how to create a new resource and maintain changes are handled for you. However, the problem is that for Terraform to offer this abstraction and data guarantee, all values must be known at apply time. That means that even if you’re not using the proxied value, Terraform needs to know what the value needs to be in order to save it in the state file and manage that attribute going forward. The error below is what Terraform operators commonly see from providers when the value isn’t known at apply time.

Error: Provider produced inconsistent result after apply

When applying changes to example_thing.foo, provider "provider[\"registry.terraform.io/example/example\"]"
produced an unexpected new value: .foo: was null, but now cty.StringVal("").

Whereas when using the SDKs, if you don’t need a field, you just omit it and never need to worry about maintaining known values.

Tackling this for our OpenAPI schemas was no small feat. Since introducing Terraform generation support, the quality of our schemas has improved by an order of magnitude. Now we are explicitly calling out all default values that are present, variable response properties based on the request payload, and any server-side computed attributes. All of this means a better experience for anyone that interacts with our APIs.

Making the jump from terraform-plugin-sdk to terraform-plugin-framework

To build a Terraform provider and expose resources or data sources to operators, you need two main things: a provider server and a provider.

The provider server takes care of exposing a gRPC server that Terraform core (via the CLI) uses to communicate when managing resources or reading data sources from the operator provided configuration.

The provider is responsible for wrapping the resources and data sources, communicating with the remote services, and managing the state file. To do this, you either rely on the terraform-plugin-sdk (commonly referred to as SDKv2) or terraform-plugin-framework, which includes all the interfaces and methods provided by Terraform in order to manage the internals correctly. The decision as to which plugin you use depends on the age of your provider. SDKv2 has been around longer and is what most Terraform providers use, but due to the age and complexity, it has many core unresolved issues that must remain in order to facilitate backwards compatibility for those who rely on it. terraform-plugin-framework is the new version that, while lacking the breadth of features SDKv2 has, provides a more Go-like approach to building providers and addresses many of the underlying bugs in SDKv2.

(For a deeper comparison between SDKv2 and the framework, you can check out a conversation between myself and John Bristowe from Octopus Deploy.)

The majority of the Cloudflare Terraform provider is built using SDKv2, but at the beginning of 2023, we took the plunge to multiplex and offer both in our provider. To understand why this was needed, we have to understand a little about SDKv2. The way SDKv2 is structured isn’t really conducive to representing null or “unset” values consistently and reliably. You can use the experimental ResourceData.GetRawConfig to check whether the value is set, null, or unknown in the config, but writing it back as null isn’t really supported.

This caveat first popped up for us when the Edge Rules Engine (Rulesets) started onboarding new services and those services needed to support API responses that contained booleans in an unset (or missing), true, or false state each with their own reasoning and purpose. While this isn’t a conventional API design at Cloudflare, it is a valid way to do things that we should be able to work with. However, as mentioned above, the SDKv2 provider couldn’t. This is because when a value isn’t present in the response or read into state, it gets a Go-compatible zero value for the default. This showed up as the inability to unset values after they had been written to state as false values (and vice versa).

The only solution we have here to reliably use the three states of those boolean values is to migrate to the terraform-plugin-framework, which has the correct implementation of writing back unset values.

Once we started adding more functionality using terraform-plugin-framework in the old provider, it was clear that it was a better developer experience, so we added a ratchet to prevent SDKv2 usage going forward to get ahead of anyone unknowingly setting themselves up to hit this issue.

When we decided that we would be automatically generating the Terraform provider, it was only fitting that we also brought all the resources over to be based on the terraform-plugin-framework and leave the issues from SDKv2 behind for good. This did complicate the migration as with the improved internals came changes to major components like the schema and CRUD operations that we needed to familiarize ourselves with. However, it has been a worthwhile investment because by doing so, we’ve future-proofed the foundations of the provider and are now making fewer compromises on a great Terraform experience due to buggy, legacy internals.

Iteratively finding bugs 

One of the common struggles with code generation pipelines is that unless you have existing tools that implement your new thing, it’s hard to know if it works or is reasonable to use. Sure, you can also generate your tests to exercise the new thing, but if there is a bug in the pipeline, you are very likely to not see it as a bug as you will be generating test assertions that show the bug is expected behavior.

One of the essential feedback loops we have had is the existing acceptance test suite. All resources within the existing provider had a mix of regression and functionality tests. Best of all, as the test suite is creating and managing real resources, it was very easy to know whether the outcome was a working implementation or not by looking at the HTTP traffic to see whether the API calls were accepted by the remote endpoints. Getting the test suite ported over was only a matter of copying over all the existing tests and checking for any type assertion differences (such as list to single nested list) before kicking off a test run to determine whether the resource was working correctly.

While the centralized schema pipeline was a huge quality of life improvement for having schema fixes propagate to the whole ecosystem almost instantly, it couldn’t help us solve the largest hurdle, which was surfacing bugs that hide other bugs. This was time-consuming because when fixing a problem in Terraform, you have three places where you can hit an error:

  1. Before any API calls are made, Terraform implements logical schema validation and when it encounters validation errors, it will immediately halt.

  2. If any API call fails, it will stop at the CRUD operation and return the diagnostics, immediately halting.

  3. After the CRUD operation has run, Terraform then has checks in place to ensure all values are known.

That means that if we hit the bug at step 1 and then fixed the bug, there was no guarantee or way to tell that we didn’t have two more waiting for us. Not to mention that if we found a bug in step 2 and shipped a fix, that it wouldn’t then identify a bug in the first step on the next round of testing.

There is no silver bullet here and our workaround was instead to notice patterns of problems in the schema behaviors and apply CI lint rules within the OpenAPI schemas before it got into the code generation pipeline. Taking this approach incrementally cut down the number of bugs in step 1 and 2 until we were largely only dealing with the type in step 3.

A more reusable approach to model and struct conversion 

Within Terraform provider CRUD operations, it is fairly common to see boilerplate like the following:

var plan ThingModel
diags := req.Plan.Get(ctx, &plan)
resp.Diagnostics.Append(diags...)
if resp.Diagnostics.HasError() {
	return
}

out, err := r.client.UpdateThingModel(ctx, client.ThingModelRequest{
	AttrA: plan.AttrA.ValueString(),
	AttrB: plan.AttrB.ValueString(),
	AttrC: plan.AttrC.ValueString(),
})
if err != nil {
	resp.Diagnostics.AddError(
		"Error updating project Thing",
		"Could not update Thing, unexpected error: "+err.Error(),
	)
	return
}

result := convertResponseToThingModel(out)
tflog.Info(ctx, "created thing", map[string]interface{}{
	"attr_a": result.AttrA.ValueString(),
	"attr_b": result.AttrB.ValueString(),
	"attr_c": result.AttrC.ValueString(),
})

diags = resp.State.Set(ctx, result)
resp.Diagnostics.Append(diags...)
if resp.Diagnostics.HasError() {
	return
}

At a high level:

  • We fetch the proposed updates (known as a plan) using req.Plan.Get()

  • Perform the update API call with the new values

  • Manipulate the data from a Go type into a Terraform model (convertResponseToThingModel)

  • Set the state by calling resp.State.Set()

Initially, this doesn’t seem too problematic. However, the third step where we manipulate the Go type into the Terraform model quickly becomes cumbersome, error-prone, and complex because all of your resources need to do this in order to swap between the type and associated Terraform models.

To avoid generating more complex code than needed, one of the improvements featured in our provider is that all CRUD methods use unified apijson.Marshal, apijson.Unmarshal, and apijson.UnmarshalComputed methods that solve this problem by centralizing the conversion and handling logic based on the struct tags.

var data *ThingModel

resp.Diagnostics.Append(req.Plan.Get(ctx, &data)...)
if resp.Diagnostics.HasError() {
	return
}

dataBytes, err := apijson.Marshal(data)
if err != nil {
	resp.Diagnostics.AddError("failed to serialize http request", err.Error())
	return
}
res := new(http.Response)
env := ThingResultEnvelope{*data}
_, err = r.client.Thing.Update(
	// ...
)
if err != nil {
	resp.Diagnostics.AddError("failed to make http request", err.Error())
	return
}

bytes, _ := io.ReadAll(res.Body)
err = apijson.UnmarshalComputed(bytes, &env)
if err != nil {
	resp.Diagnostics.AddError("failed to deserialize http request", err.Error())
	return
}
data = &env.Result

resp.Diagnostics.Append(resp.State.Set(ctx, &data)...)

Instead of needing to generate hundreds of instances of type-to-model converter methods, we can instead decorate the Terraform model with the correct tags and handle marshaling and unmarshaling of the data consistently. It’s a minor change to the code that in the long run makes the generation more reusable and readable. As an added benefit, this approach is great for bug fixing as once you identify a bug with a particular type of field, fixing that in the unified interface fixes it for other occurrences you may not yet have found.

But wait, there’s more (docs)!

To top off our OpenAPI schema usage, we’re tightening the SDK integration with our new API documentation site. It’s using the same pipeline we’ve invested in for the last two years while addressing some of the common usage issues.

SDK aware 

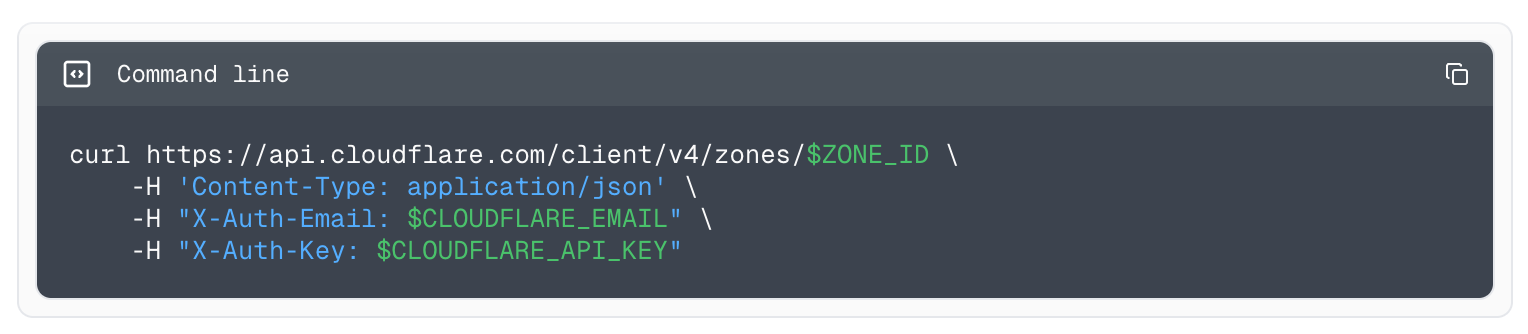
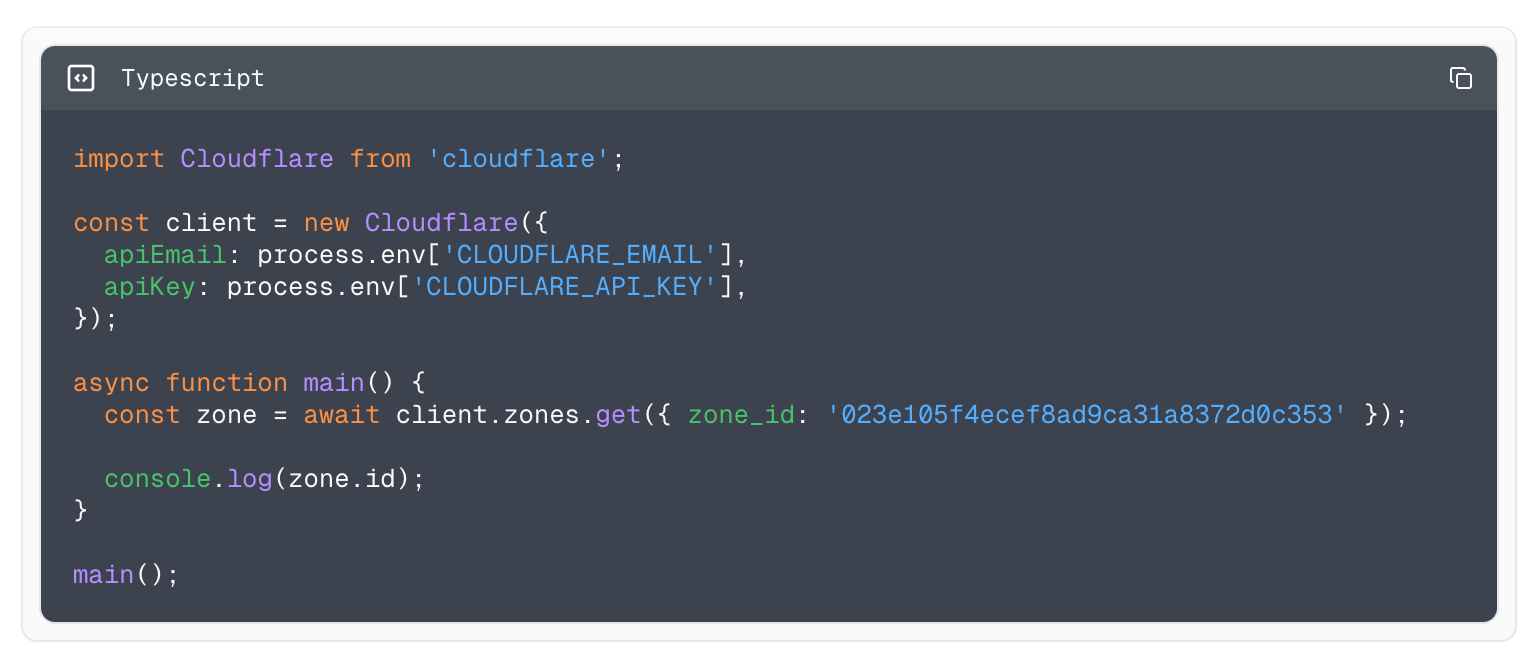
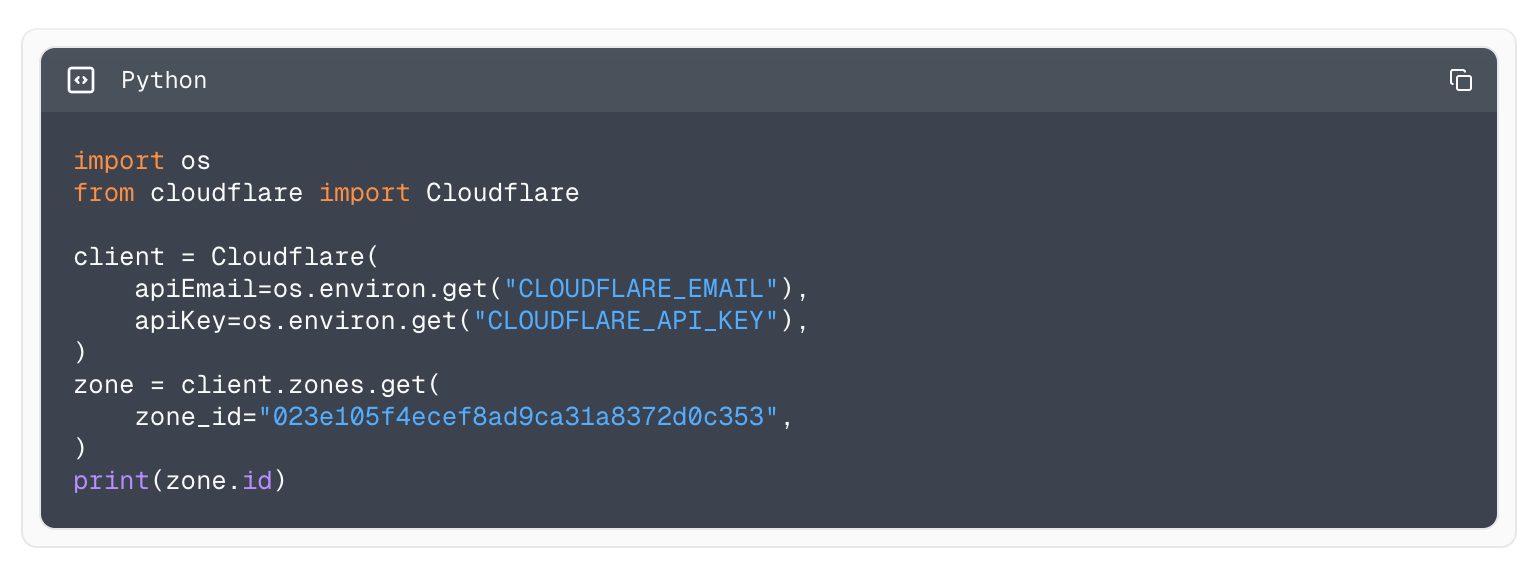
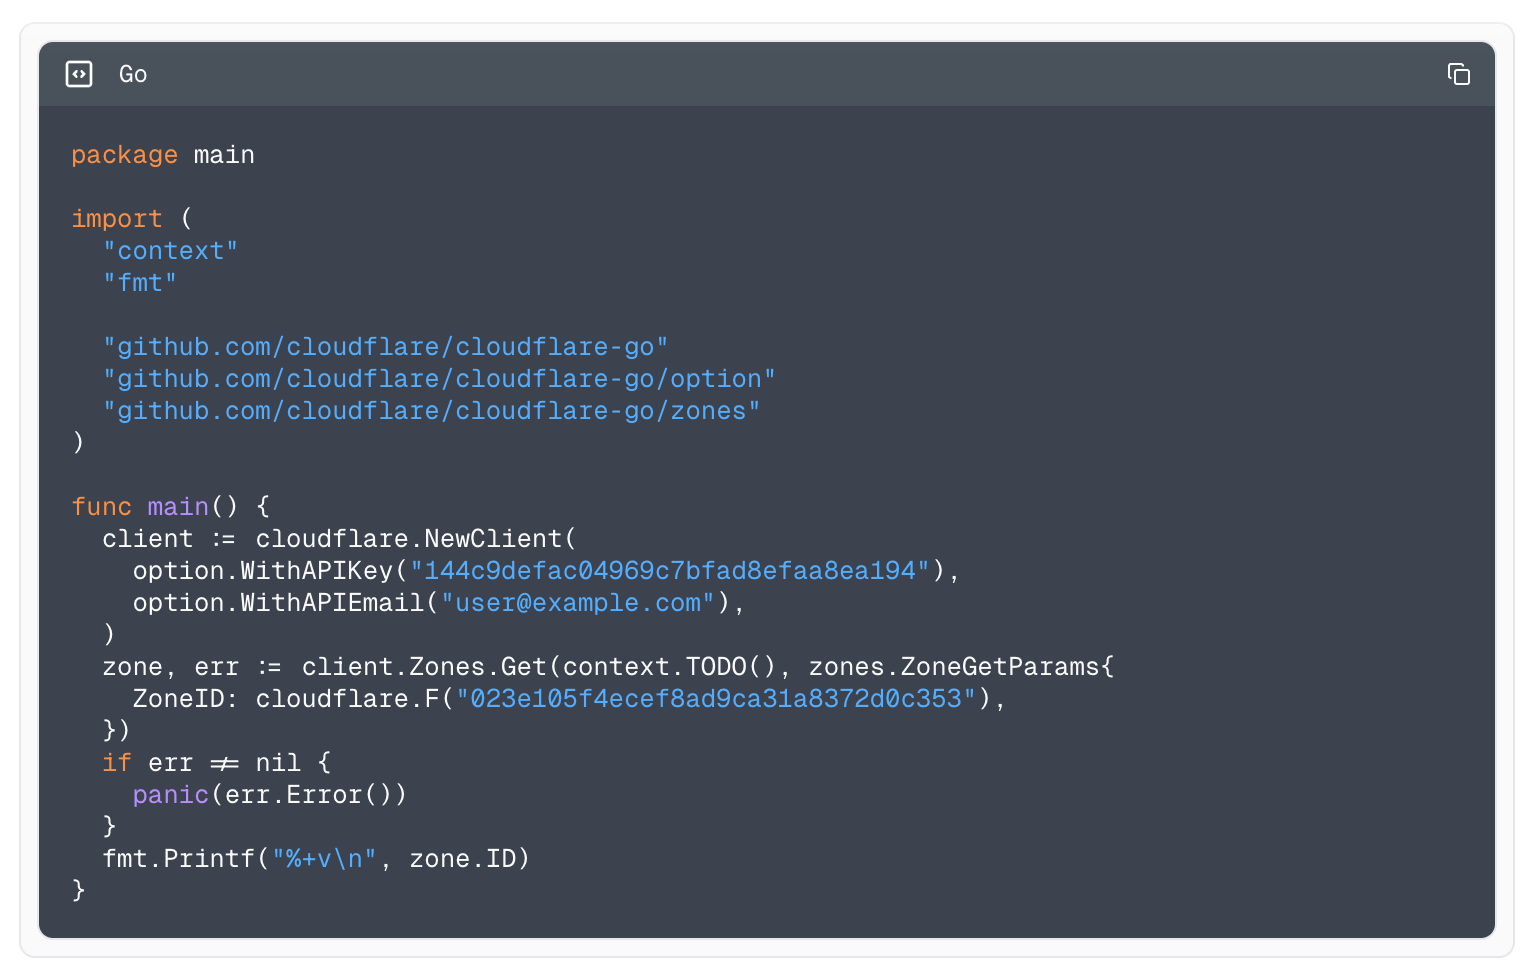
If you’ve used our API documentation site, you know we give you examples of interacting with the API using command line tools like curl. This is a great starting point, but if you’re using one of the SDK libraries, you need to do the mental gymnastics to convert it to the method or type definition you want to use. Now that we’re using the same pipeline to generate the SDKs and the documentation, we’re solving that by providing examples in all the libraries you could use — not just curl.

Example using cURL to fetch all zones.

Example using the Typescript library to fetch all zones.

Example using the Python library to fetch all zones.

Example using the Go library to fetch all zones.

With this improvement, we also remember the language selection so if you’ve selected to view the documentation using our Typescript library and keep clicking around, we keep showing you examples using Typescript until it is swapped out.

Best of all, when we introduce new attributes to existing endpoints or add SDK languages, this documentation site is automatically kept in sync with the pipeline. It is no longer a huge effort to keep it all up to date.

Faster and more efficient rendering

A problem we’ve always struggled with is the sheer number of API endpoints and how to represent them. As of this post, we have 1,330 endpoints, and for each of those endpoints, we have a request payload, a response payload, and multiple types associated with it. When it comes to rendering this much information, the solutions we’ve used in the past have had to make tradeoffs in order to make parts of the representation work.

This next iteration of the API documentation site addresses this is a couple of ways:

  • It’s implemented as a modern React application that pairs an interactive client-side experience with static pre-rendered content, resulting in a quick initial load and fast navigation. (Yes, it even works without JavaScript enabled!). 

  • It fetches the underlying data incrementally as you navigate.

By solving this foundational issue, we’ve unlocked other planned improvements to the documentation site and SDK ecosystem to improve the user experience without making tradeoffs like we’ve needed to in the past. 

Permissions

One of the most requested features to be re-implemented into the documentation site has been minimum required permissions for API endpoints. One of the previous iterations of the documentation site had this available. However, unknown to most who used it, the values were manually maintained and were regularly incorrect, causing support tickets to be raised and frustration for users.

Inside Cloudflare’s identity and access management system, answering the question “what do I need to access this endpoint” isn’t a simple one. The reason for this is that in the normal flow of a request to the control plane, we need two different systems to provide parts of the question, which can then be combined to give you the full answer. As we couldn’t initially automate this as part of the OpenAPI pipeline, we opted to leave it out instead of having it be incorrect with no way of verifying it.

Fast-forward to today, and we’re excited to say endpoint permissions are back! We built some new tooling that abstracts answering this question in a way that we can integrate into our code generation pipeline and have all endpoints automatically get this information. Much like the rest of the code generation platform, it is focused on having service teams own and maintain high quality schemas that can be reused with value adds introduced without any work on their behalf.

Stop waiting for updates

With these announcements, we’re putting an end to waiting for updates to land in the SDK ecosystem. These new improvements allow us to streamline the ability of new attributes and endpoints the moment teams document them. So what are you waiting for? Check out the Terraform provider and API documentation site today.

Introducing high-definition portrait video support for Cloudflare Stream

Post Syndicated from Alex Huang original https://blog.cloudflare.com/introducing-high-definition-portrait-video-support-for-cloudflare-stream


Cloudflare Stream is an end-to-end solution for video encoding, storage, delivery, and playback. Our focus has always been on simplifying all aspects of video for developers. This goal continues to motivate us as we introduce first-class portrait (vertical) video support today. Newly uploaded or ingested portrait videos will now automatically be processed in full HD quality.

Why portrait video

In the past few years, the popularity of portrait video has exploded, motivated by short-form video content applications such as TikTok or YouTube Shorts.  However, Cloudflare customers have been confused as to why their portrait videos appear to be lower quality when viewed on portrait-first devices such as smartphones. This is because our video encoding pipeline previously did not support high-quality portrait videos, leading them to be grainy and lower quality. This pain point has now been addressed with the introduction of high-definition portrait video.

The current stream pipeline

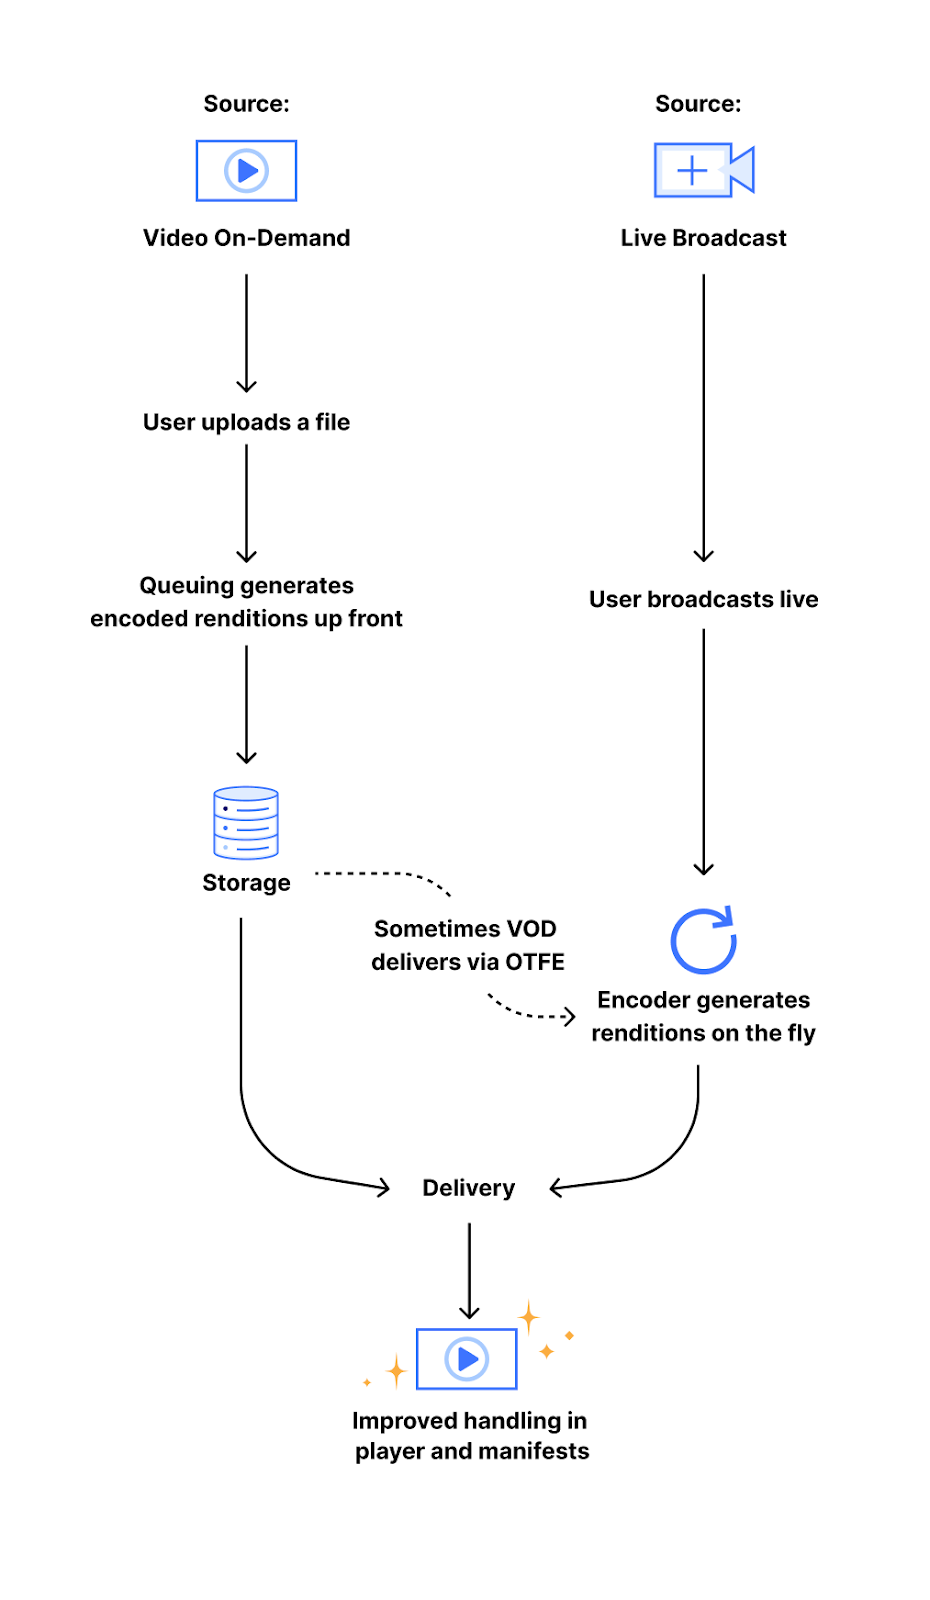
When you upload a video to Stream, it is first encoded into several different “renditions” (sizes or resolutions) before delivery. This is done in order to enable playback in a wide variety of network conditions, as well as to standardize the way a video is experienced. By using these adaptive bitrate renditions, we are able to offer viewers the highest quality streaming experience which fits their network bandwidth, meaning someone watching a video with a slow mobile connection would be served a 240p video (a resolution of 320×240 pixels) and receive the 1080p (a resolution of 1920×1080 pixels) version when they are watching at home on their fiber Internet connection. This encoding pipeline follows one of two different paths:

The first path is our video on-demand (VOD) encoding pipeline, which generates and stores a set of encoded video segments at each of our standard video resolutions. The other path is our on-the-fly encoding (OTFE) pipeline, which uses the same process as Stream Live to generate resolutions upon user request. Both pipelines work with the set of standard resolutions, which are identified through a constrained target (output) height. This means that we encode every rendition to heights of 240 pixels, 360 pixels, etc. up to 1080 pixels.

When originally conceived, this encoding pipeline was not designed with portrait video in mind because portrait video was less common. As a result, portrait videos were encoded with lower quality dimensions that were consistent with landscape video encoding. For example, a portrait HD video would have the dimensions 1920×1080 — scaling that down to the height of a landscape HD video would result in the much smaller output of 1080×606. However, current smartphones all have HD displays, making the discrepancy clear when a portrait video is viewed in portrait mode on a phone. With this new change to our encoding pipeline, all newly uploaded portrait videos will now be automatically encoded with constrained target width, using a new set of standard resolutions for portrait video. These resolutions are the same as the current set of landscape resolutions, but with the dimensions reversed: 240×426 up to 1080×1920.

Technical details

As the Stream intern this summer, I was tasked with this project, as well as the expectation of shipping a long-requested change, by the end of my internship. The first step in implementing this change was to familiarize myself with the complex architecture of Stream’s internal systems. After this, I began brainstorming a few different implementation decisions, like how to consistently track orientation through various stages of the pipeline. Following a group discussion to decide which choices would be the most scalable, least complex, and best for users, it was time to write the technical specification.

Due to the implementation method we chose, making this change involved tracing the life of a video from upload to delivery through both of our encoding pipelines and applying different logic for portrait videos. Previously, all video renditions were identified by their height at each stage of the pipeline, making certain parts of the pipeline completely agnostic to the orientation of a video. With the proposed changes, we would now be using the constraining dimension and orientation to identify a video rendition. Therefore, much of the work involved modifying the different portions of the pipeline to use these new parameters.

The first area of the pipeline to be modified was the Stream API service, which is the process which handles all Stream API calls. The API service enqueues the rendition encoding jobs for a video after it is uploaded, so it was necessary to introduce a new set of renditions designed for portrait videos, and enqueue the corresponding encoding jobs. The queuing system is handled by our in-house queue management system, which handles jobs generically and therefore did not require any changes.

Following this, I tackled the on-the-fly encoding pipeline. The area of interest here was the delivery portion of our pipeline, which generated the set of encoding resolutions to pass on to our on-the-fly encoder. Here I also introduced a new set of portrait renditions and the corresponding logic to encode them for portrait videos. This part of the backend is written and hosted on Cloudflare Workers, which made it very easy and quick to deploy and test changes.

Finally, we wanted to change how we presented these quality levels to users in the Stream built-in player and thought that using the new constrained dimension rather than always showing the height would feel more familiar. For portrait videos, we now display the size of the constraining dimension, which also means quality selection for portrait videos encoded under our old system now more accurately reflects their quality, too. As an example, a 9:16 portrait video would have been encoded to a maximum size of 608×1080 by the previous pipeline. Now, such a rendition will be marked as 608p rather than the full-quality 1080p, which would be a 1080×1920 rendition.

Stream as a whole is built on many of our own Developer Platform products, such as Workers for handling delivery, R2 for rendition storage, Workers AI for automatic captioning, and Durable Objects for bitrate observation, all of which enhance our ability to deploy and ship new updates quickly. Throughout my work on this project, I was able to see all of these pieces in action, as well as gain a new understanding of the powerful tools Cloudflare offers for developers.

Results and findings

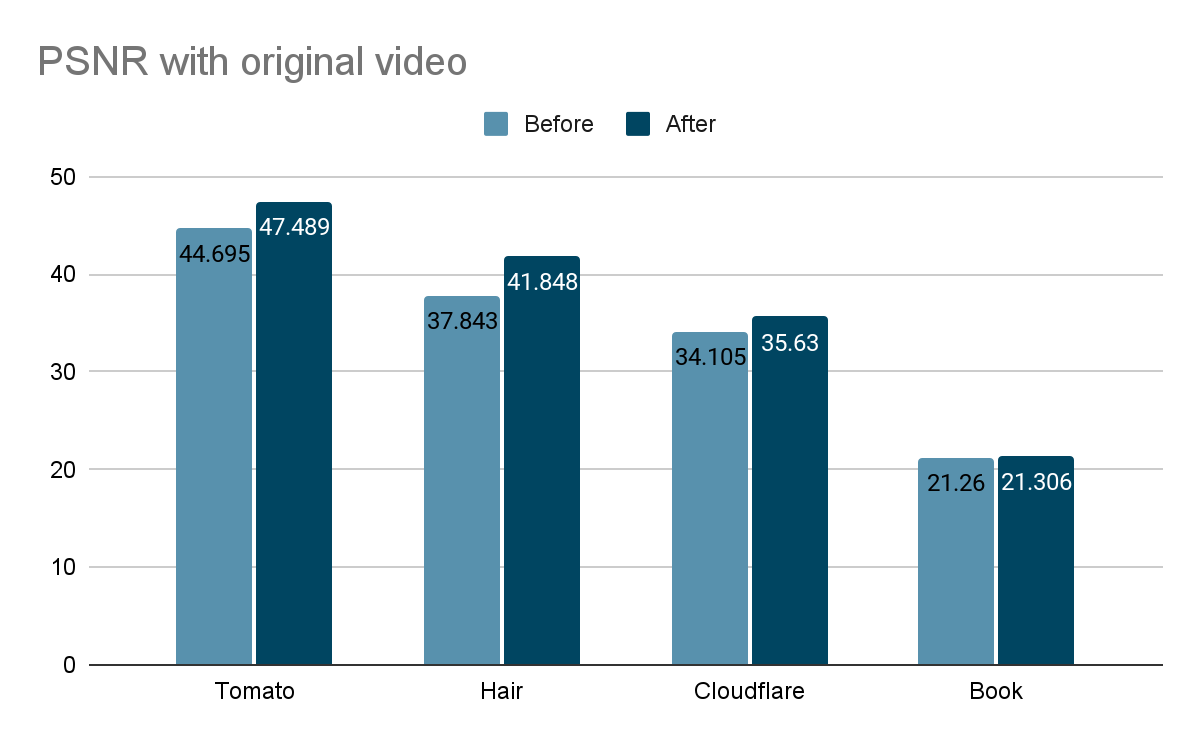
After the change, portrait videos are now encoded to higher resolutions and visibly appear to be higher quality. To confirm these differences, I analyzed the effect of the pipeline change on four different sample videos using the peak-signal-to-noise ratio (PSNR, a mathematical representation of image quality). Since the old pipeline produced lower resolution videos, the comparison here is between an upscaled version of the old pipeline rendition and the current pipeline rendition. In the graph below, higher values reflect higher quality relative to the unencoded original video.

According to this metric, we see an increase in quality from the pipeline changes as high as 8%. However, the quality increase is most noticeable to the human eye in videos that feature fine details or a high amount of movement, which is not always captured in the PSNR. For example, compare a side-by-side of a frame from the book sample video encoded both ways:

The difference between the old and new encodings is most clear when zoomed in:

Here’s another example (sourced from Mixkit):

Magnified:

Of course, watching these example clips is the clearest way to see:

Maximize the Stream player and look at the quality selector (in the gear menu) to see the new quality level labels – select the highest option to compare. Note the improved sharpness of the text in the book sample as well as the improved detail in the hair and eye shadow of the hair and makeup sample.

Implementation challenges

Due to the complex nature of our encoding pipelines, there were several technical challenges to making a large change like this. Aside from simply uploading videos, many of the features we offer, like downloads or clipping, require tweaking to produce the correct video renditions. This involved modifying many parts of the encoding pipeline to ensure that portrait video logic was handled.

There were also some edge cases which were not caught until after release. One release of this feature contained a bug in the on-the-fly encoding logic which caused a subset of new portrait livestream renditions to have negative bitrates, making them unusable. This was due to an internal representation of video renditions’ constraining dimensions being mistakenly used for bitrate observation. We remedied this by increasing the scope of our end-to-end testing to include more portrait video tests and live recording interaction tests.

Another small bug caused downloading very small videos to sometimes fail. This was because for videos under 240p, our smallest encoding resolution, the non-constraining dimension was not being properly scaled to match the aspect ratio of the video, causing some specific combinations of dimensions to be interpreted as portrait when they should have been landscape, and vice versa. This bug was fixed quickly, but was not initially caught after the release since it required a very specific set of conditions to activate. After this experience, I added a few more unit tests involving small videos.

That’s a wrap

As my internship comes to a close, reflecting on the experience makes me grateful for all the team members who have helped me throughout this time. I am very glad to have shipped this project which addresses a long-standing concern and will have real-world customer impact. Support for high-definition portrait video is now available, and we will continue to make improvements to our video solutions suite. You can see the difference yourself by uploading a portrait video to Stream! Or, perhaps you’d like to help build a better Internet, too — our internship and early talent programs are a great way to jumpstart your own journey.

Sample video acknowledgements: The sample video of the book was created by the Stream Product Manager and shows the opening page of The Strange Wonder of Roots by Evan Griffith (HarperCollins). The hair and makeup fashion video was sourced from Mixkit, a great source of free media for video projects.

Meta Llama 3.1 now available on Workers AI

Post Syndicated from Michelle Chen original https://blog.cloudflare.com/meta-llama-3-1-available-on-workers-ai


At Cloudflare, we’re big supporters of the open-source community – and that extends to our approach for Workers AI models as well. Our strategy for our Cloudflare AI products is to provide a top-notch developer experience and toolkit that can help people build applications with open-source models.

We’re excited to be one of Meta’s launch partners to make their newest Llama 3.1 8B model available to all Workers AI users on Day 1. You can run their latest model by simply swapping out your model ID to @cf/meta/llama-3.1-8b-instruct or test out the model on our Workers AI Playground. Llama 3.1 8B is free to use on Workers AI until the model graduates out of beta.

Meta’s Llama collection of models have consistently shown high-quality performance in areas like general knowledge, steerability, math, tool use, and multilingual translation. Workers AI is excited to continue to distribute and serve the Llama collection of models on our serverless inference platform, powered by our globally distributed GPUs.

The Llama 3.1 model is particularly exciting, as it is released in a higher precision (bfloat16), incorporates function calling, and adds support across 8 languages. Having multilingual support built-in means that you can use Llama 3.1 to write prompts and receive responses directly in languages like English, French, German, Hindi, Italian, Portuguese, Spanish, and Thai. Expanding model understanding to more languages means that your applications have a bigger reach across the world, and it’s all possible with just one model.

const answer = await env.AI.run('@cf/meta/llama-3.1-8b-instruct', {
    stream: true,
    messages: [{
        "role": "user",
        "content": "Qu'est-ce que ç'est verlan en français?"
    }],
});

Llama 3.1 also introduces native function calling (also known as tool calls) which allows LLMs to generate structured JSON outputs which can then be fed into different APIs. This means that function calling is supported out-of-the-box, without the need for a fine-tuned variant of Llama that specializes in tool use. Having this capability built-in means that you can use one model across various tasks.

Workers AI recently announced embedded function calling, which is now usable with Meta Llama 3.1 as well. Our embedded function calling gives developers a way to run their inference tasks far more efficiently than traditional architectures, leveraging Cloudflare Workers to reduce the number of requests that need to be made manually. It also makes use of our open-source ai-utils package, which helps you orchestrate the back-and-forth requests for function calling along with other helper methods that can automatically generate tool schemas. Below is an example function call to Llama 3.1 with embedded function calling that then stores key-values in Workers KV.

const response = await runWithTools(env.AI, "@cf/meta/llama-3.1-8b-instruct", {
    messages: [{ role: "user", content: "Greet the user and ask them a question" }],
    tools: [{
        name: "Store in memory",
        description: "Store everything that the user talks about in memory as a key-value pair.",
        parameters: {
            type: "object",
            properties: {
                key: {
                        type: "string",
                        description: "The key to store the value under.",
				},
                value: {
                        type: "string",
                        description: "The value to store.",
				},
            },
			required: ["key", "value"],
		},
        function: async ({ key, value }) => {
                await env.KV.put(key, value);

                return JSON.stringify({
                    success: true,
			});
		}
	}]
})

We’re excited to see what you build with these new capabilities. As always, use of the new model should be conducted with Meta’s Acceptable Use Policy and License in mind. Take a look at our developer documentation to get started!

Supporting Postgres Named Prepared Statements in Hyperdrive

Post Syndicated from Andrew Repp original https://blog.cloudflare.com/postgres-named-prepared-statements-supported-hyperdrive


Hyperdrive (Cloudflare’s globally distributed SQL connection pooler and cache) recently added support for Postgres protocol-level named prepared statements across pooled connections. Named prepared statements allow Postgres to cache query execution plans, providing potentially substantial performance improvements. Further, many popular drivers in the ecosystem use these by default, meaning that not having them is a bit of a footgun for developers. We are very excited that Hyperdrive’s users will now have access to better performance and a more seamless development experience, without needing to make any significant changes to their applications!

While we’re not the first connection pooler to add this support (PgBouncer got to it in October 2023 in version 1.21, for example), there were some unique challenges in how we implemented it. To that end, we wanted to do a deep dive on what it took for us to deliver this.

Hyper-what?

One of the classic problems of building on the web is that your users are everywhere, but your database tends to be in one spot.  Combine that with pesky limitations like network routing, or the speed of light, and you can often run into situations where your users feel the pain of having your database so far away. This can look like slower queries, slower startup times, and connection exhaustion as everything takes longer to accomplish.

Hyperdrive is designed to make the centralized databases you already have feel like they’re global. We use our global network to get faster routes to your database, keep connection pools primed, and cache your most frequently run queries as close to users as possible.

Postgres Message Protocol

To understand exactly what the challenge with prepared statements is, it’s first necessary to dig in a bit to the Postgres Message Protocol. Specifically, we are going to take a look at the protocol for an “extended” query, which uses different message types and is a bit more complex than a “simple” query, but which is more powerful and thus more widely used.

A query using Hyperdrive might be coded something like this, but a lot goes on under the hood in order for Postgres to reliably return your response.

import postgres from "postgres";

// with Hyperdrive, we don't have to disable prepared statements anymore!
// const sql = postgres(env.HYPERDRIVE.connectionString, {prepare: false});

// make a connection, with the default postgres.js settings (prepare is set to true)
const sql = postgres(env.HYPERDRIVE.connectionString);

// This sends the query, and while it looks like a single action it contains several 
// messages implied within it
let [{ a, b, c, id }] = await sql`SELECT a, b, c, id FROM hyper_test WHERE id = ${target_id}`;

To prepare a statement, a Postgres client begins by sending a Parse message. This includes the query string, the number of parameters to be interpolated, and the statement’s name. The name is a key piece of this puzzle. If it is empty, then Postgres uses a special “unnamed” prepared statement slot that gets overwritten on each new Parse. These are relatively easy to support, as most drivers will keep the entirety of a message sequence for unnamed statements together, and will not try to get too aggressive about reusing the prepared statement because it is overwritten so often.

If the statement has a name, however, then it is kept prepared for the remainder of the Postgres session (unless it is explicitly removed with DEALLOCATE). This is convenient because parsing a query string and preparing the statement costs bytes sent on the wire and CPU cycles to process, so reusing a statement is quite a nice optimization.

Once done with Parse, there are a few remaining steps to (the simplest form of) an extended query:

  • A Bind message, which provides the specific values to be passed for the parameters in the statement (if any).
  • An Execute message, which tells the Postgres server to actually perform the data retrieval and processing.
  • And finally a Sync message, which causes the server to close the implicit transaction, return results, and provides a synchronization point for error handling.

While that is the core pattern for accomplishing an extended protocol query, there are many more complexities possible (named Portal, ErrorResponse, etc.).

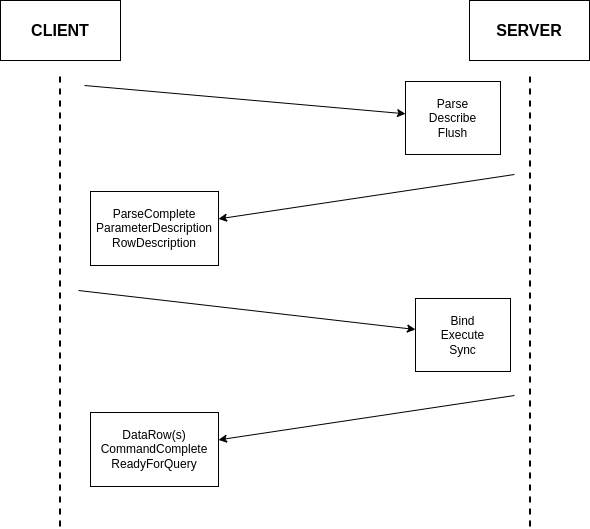
We will briefly mention one other complexity we often encounter in this protocol, which is Describe messages. Many drivers leverage Postgres’ built-in types to help with deserialization of the results into structs or classes. This is accomplished by sending a Parse-Describe-Flush/Sync sequence, which will send a statement to be prepared, and will expect back information about the types and data the query will return. This complicates bookkeeping around named prepared statements, as now there are two separate queries, with two separate kinds of responses, that must be kept track of. We won’t go into much depth on the tradeoffs of an additional round-trip in exchange for advanced information about the results’ format, but suffice it to say that it must be handled explicitly in order for the overall system to gracefully support prepared statements.

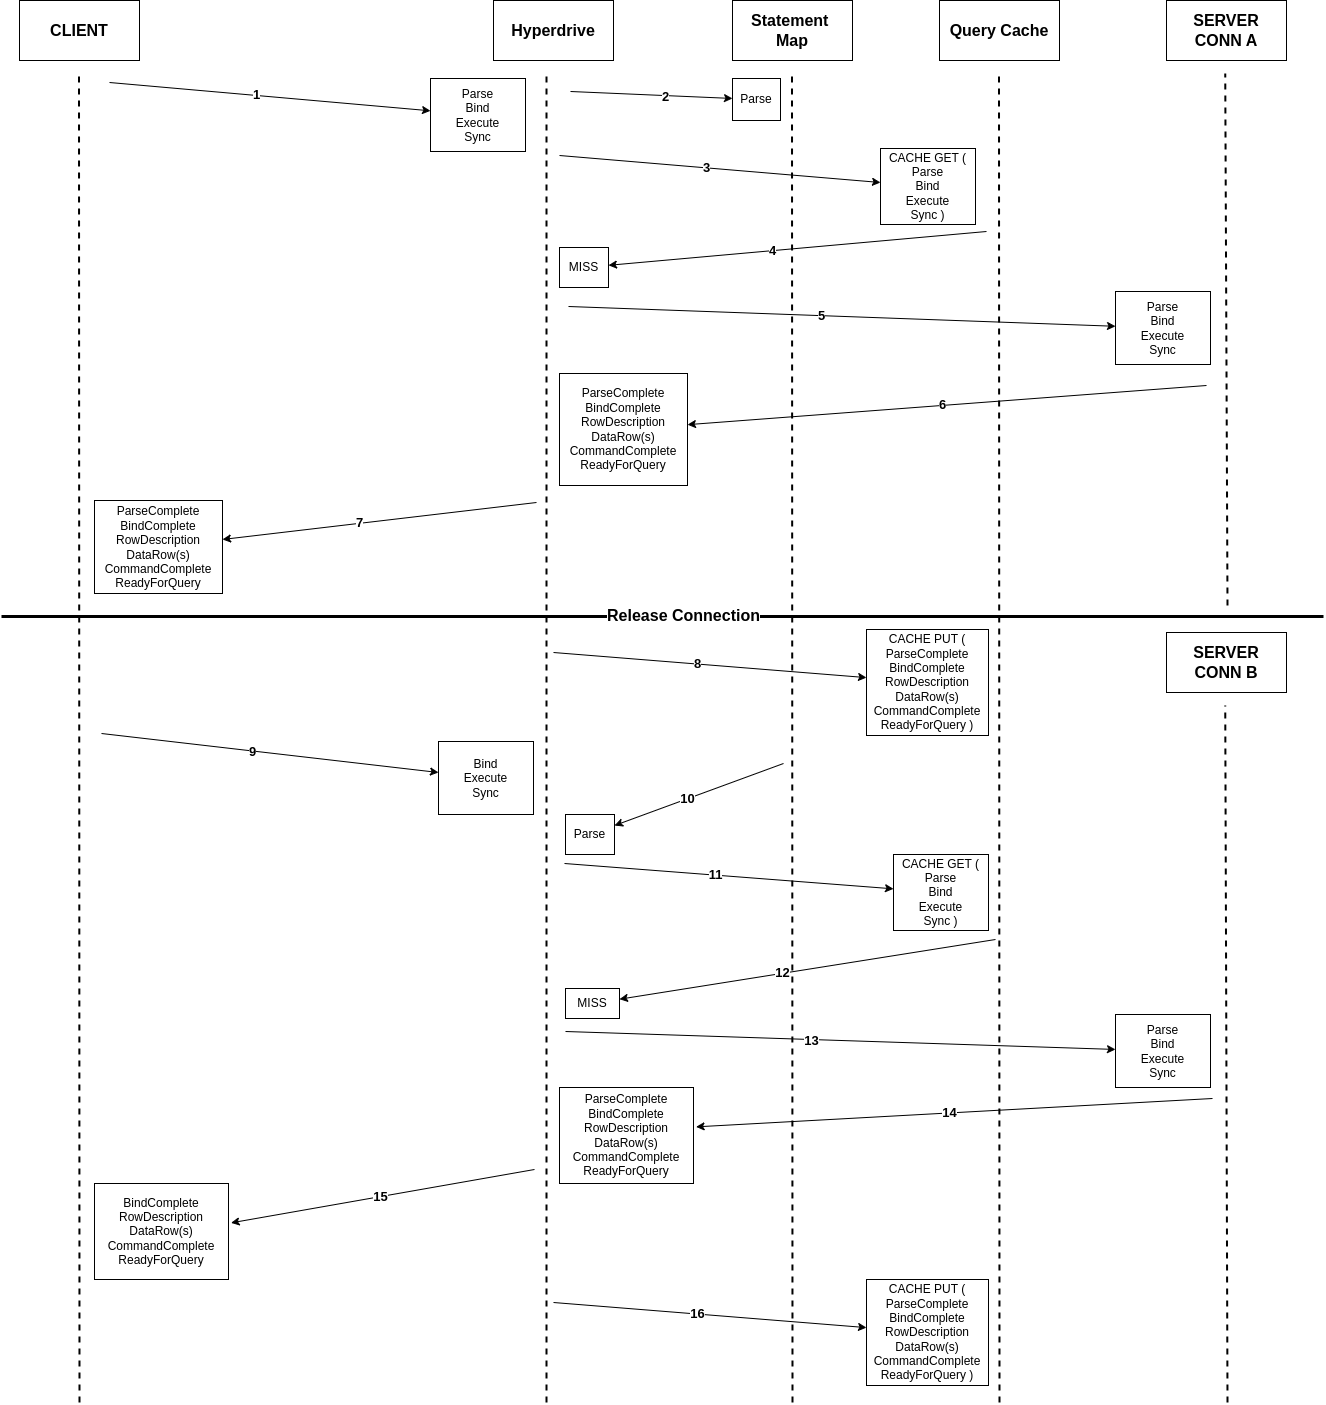
So the basic query from our code above looks like this from a message perspective:

A more complete description and the full structure of each message type are well described in the Postgres documentation.

So, what’s so hard about that?

Buffering Messages

The first challenge that Hyperdrive must solve (that many other connection poolers don’t have) is that it’s also a cache.

The happiest path for a query on Hyperdrive never travels far, and we are quite proud of the low latency of our cache hits. However, this presents a particular challenge in the case of an extended protocol query. A Parse by itself is insufficient as a cache key, both because the parameter values in the Bind messages can alter the expected results, and because it might be followed up with either a Describe or an Execute message which will invoke drastically different responses.

So Hyperdrive cannot simply pass each message to the origin database, as we must buffer them in a message log until we have enough information to reliably distinguish between cache keys. It turns out that receiving a Sync is quite a natural point at which to check whether you have enough information to serve a response. For most scenarios, we buffer until we receive a Sync, and then (assuming the scenario is cacheable) we determine whether we can serve the response from cache or we need to take a connection to the origin database.

Taking a Connection From the Pool

Assuming we aren’t serving a response from cache, for whatever reason, we’ll need to take an origin connection from our pool. One of the key advantages any connection pooler offers is in allowing many client connections to share few database connections, so minimizing how often and for how long these connections are held is crucial to making Hyperdrive performant.
To this end, Hyperdrive operates in what is traditionally called “transaction mode”. This means that a connection taken from the pool for any given transaction is returned once that transaction concludes. This is in contrast to what is often called “session mode”, where once a connection is taken from the pool it is held by the client until the client disconnects.

For Hyperdrive, allowing any client to take any database connection is vital. This is because if we “pin” a client to a given database connection then we have one fewer available for every other possible client. You can run yourself out of database connections very quickly once you start down that path, especially when your clients are many small Workers spread around the world.

The challenge prepared statements present to this scenario is that they exist at the “session” scope, which is to say, at the scope of one connection. If a client prepares a statement on connection A, but tries to reuse it and gets assigned connection B, Postgres will naturally throw an error claiming the statement doesn’t exist in the given session. No results will be returned, the client is unhappy, and all that’s left is to retry with a Parse message included. This causes extra round-trips between client and server, defeating the whole purpose of what is meant to be an optimization.

One of the goals of a connection pooler is to be as transparent to the client and server as possible. There are limitations, as Postgres will let you do some powerful things to session state that cannot be reasonably shared across arbitrary client connections, but to the extent possible the endpoints should not have to know or care about any multiplexing happening between them.

This means that when a client sends a Parse message on its connection, it should expect that the statement will be available for reuse when it wants to send a Bind-Execute-Sync sequence later on. It also means that the server should not get Bind messages for statements that only exist on some other session. Maintaining this illusion is the crux of providing support for this feature.

Putting it all together

So, what does the solution look like? If a client sends Parse-Bind-Execute-Sync with a named prepared statement, then later sends Bind-Execute-Sync to reuse it, how can we make sure that everything happens as expected? The solution, it turns out, needs just a few built-in Rust data structures for efficiently capturing what we need (a HashMap, some LruCaches and a VecDeque), and some straightforward business logic to keep track of when to intervene in the messages being passed back and forth.

Whenever a named Parse comes in, we store it in an in-memory HashMap on the server that handles message processing for that client’s connection. This persists until the client is disconnected. This means that whenever we see anything referencing the statement, we can go retrieve the complete message defining it. We’ll come back to this in a moment.

Once we’ve buffered all the messages we can and gotten to the point where it’s time to return results (let’s say because the client sent a Sync), we need to start applying some logic. For the sake of brevity we’re going to omit talking through error handling here, as it does add some significant complexity but is somewhat out of scope for this discussion.

There are two main questions that determine how we should proceed:

  1. Does our message sequence include a Parse, or are we trying to reuse a pre-existing statement?
  2. Do we have a cache hit or are we serving from the origin database?

This gives us four scenarios to consider:

  1. Parse with cache hit
  2. Parse with cache miss
  3. Reuse with cache hit
  4. Reuse with cache miss

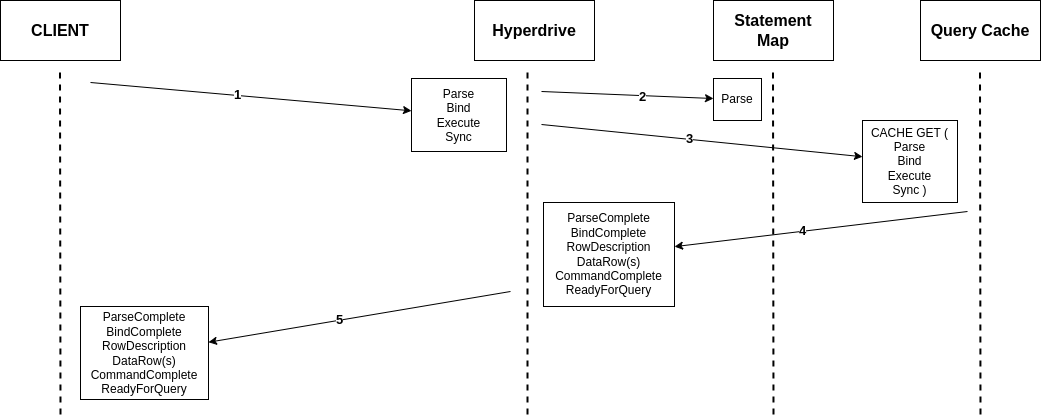
A Parse with a cache hit is the easiest path to address, as we don’t need to do anything special. We use the messages sent as a cache key, and serve the results back to the client. We will still keep the Parse in our HashMap in case we want it later (#2 below), but otherwise we’re good to go.

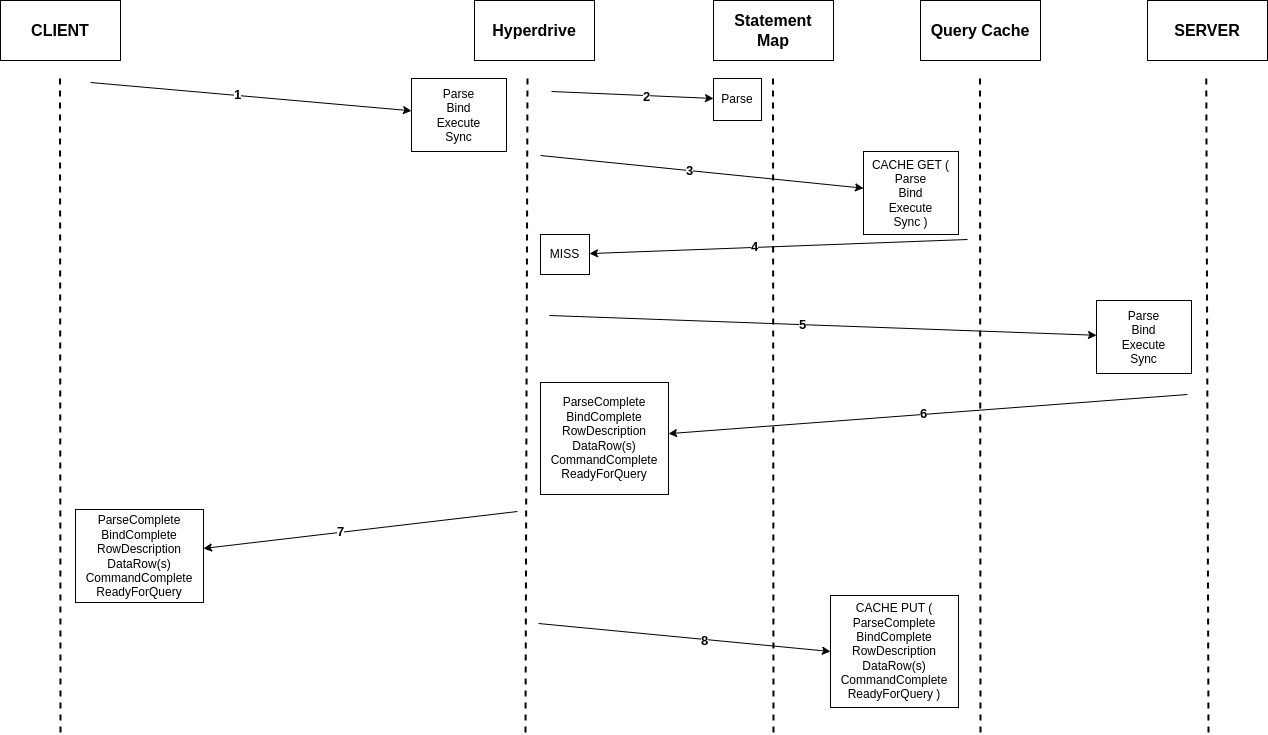
A Parse with a cache miss is a bit more complicated, as now we need to send these messages to the origin server. We take a connection at random from our pool and do so, passing the results back to the client. With that, we’ve begun to make changes to session state such that all our database connections are no longer identical to each other. To keep track of what we’ve done to muddy up our state, we keep a LruCache on each connection of which statements it already has prepared. In the case where we need to evict from such a cache, we will also DEALLOCATE the statement on the connection to keep things tracked correctly.

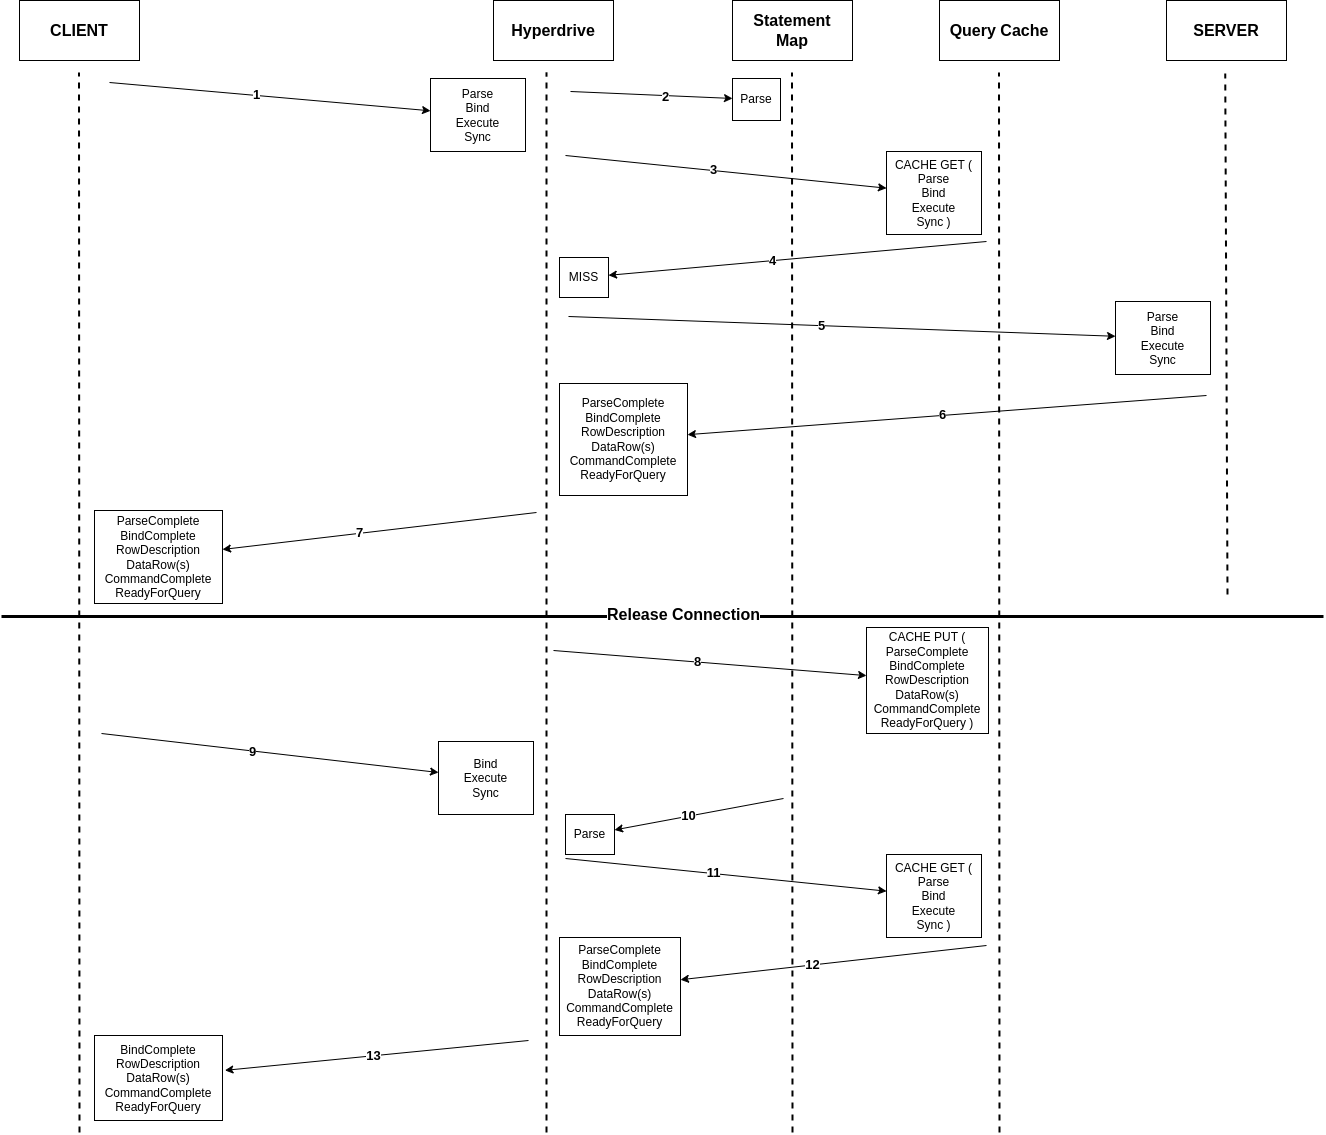
Reuse with a cache hit is yet more tricky, but still straightforward enough. In the example below, we are sent a Bind with the same parameters twice (#1 and #9). We must identify that we received a Bind without a preceding Parse, we must go retrieve that Parse (#10), and we must use the information from it to build our cache key. Once all that is accomplished, we can serve our results from cache, needing only to trim out the ParseComplete within the cached results before returning them to the client.

Reuse with a cache miss is the hardest scenario, as it may require us to lie in both directions. In the example below, we cache results for one set of parameters (#8), but are sent a Bind with different parameters (#9). As in the cache hit scenario, we must identify that we were not sent a Parse as part of the current message sequence, retrieve it from our HashMap (#10), and build our cache key to GET from cache and confirm the miss (#11). Once we take a connection from the pool, though, we then need to check if it already has the statement we want prepared. If not, we must take our saved Parse and prepend it to our message log to be sent along to the origin database (#13). Thus, what the server receives looks like a perfectly valid Parse-Bind-Execute-Sync sequence. This is where our VecDeque (mentioned above) comes in, as converting our message log to that structure allowed us to very ergonomically make such changes without needing to rebuild the whole byte sequence. Once we receive the response from the server, all that’s needed is to trim out the initial ParseComplete response from the server, as a well-made client would likely be very confused receiving such a response to a Parse it didn’t send. With that message trimmed out, however, the client is in the position of getting exactly what it asked for, and both sides of the conversation are happy.

Dénouement

Now that we’ve got a working solution, where all parties are functioning well, let’s review! Our solution lets us share database connections across arbitrary clients with no “pinning”, no custom handling on either client or server, and supports reuse of prepared statements to reduce CPU load on re-parsing queries and reduce network traffic on re-sending Parse messages. Engineering always involves tradeoffs, so the cost of this is that we will sometimes still need to sneak in a Parse because a client got assigned a different connection on reuse, and in those scenarios there is a small amount of additional memory overhead because the same statement is prepared on multiple connections.

And now, if you haven’t already, go give Hyperdrive a spin, and let us know what you think in the Hyperdrive Discord channel!

Embedded function calling in Workers AI: easier, smarter, faster

Post Syndicated from Harley Turan original https://blog.cloudflare.com/embedded-function-calling


Introducing embedded function calling and a new ai-utils package

Today, we’re excited to announce a novel way to do function calling that co-locates LLM inference with function execution, and a new ai-utils package that upgrades the developer experience for function calling.

This is a follow-up to our mid-June announcement for traditional function calling, which allows you to leverage a Large Language Model (LLM) to intelligently generate structured outputs and pass them to an API call. Function calling has been largely adopted and standardized in the industry as a way for AI models to help perform actions on behalf of a user.

Our goal is to make building with AI as easy as possible, which is why we’re introducing a new @cloudflare/ai-utils npm package that allows developers to get started quickly with embedded function calling. These helper tools drastically simplify your workflow by actually executing your function code and dynamically generating tools from OpenAPI specs. We’ve also open-sourced our ai-utils package, which you can find on GitHub. With both embedded function calling and our ai-utils, you’re one step closer to creating intelligent AI agents, and from there, the possibilities are endless.

Why Cloudflare’s AI platform?

OpenAI has been the gold standard when it comes to having performant model inference and a great developer experience. However, they mostly support their closed-source models, while we want to also promote the open-source ecosystem of models. One of our goals with Workers AI is to match the developer experience you might get from OpenAI, but with open-source models.

There are other open-source inference providers out there like Azure or Bedrock, but most of them are focused on serving inference and the underlying infrastructure, rather than being a developer toolkit. While there are external libraries and frameworks like AI SDK that help developers build quickly with simple abstractions, they rely on upstream providers to do the actual inference. With Workers AI, it’s the best of both worlds – we offer open-source model inference and a killer developer experience out of the box.

With the release of embedded function calling and ai-utils today, we’ve advanced how we do inference for function calling and improved the developer experience by making it dead simple for developers to start building AI experiences.

How does traditional function calling work?

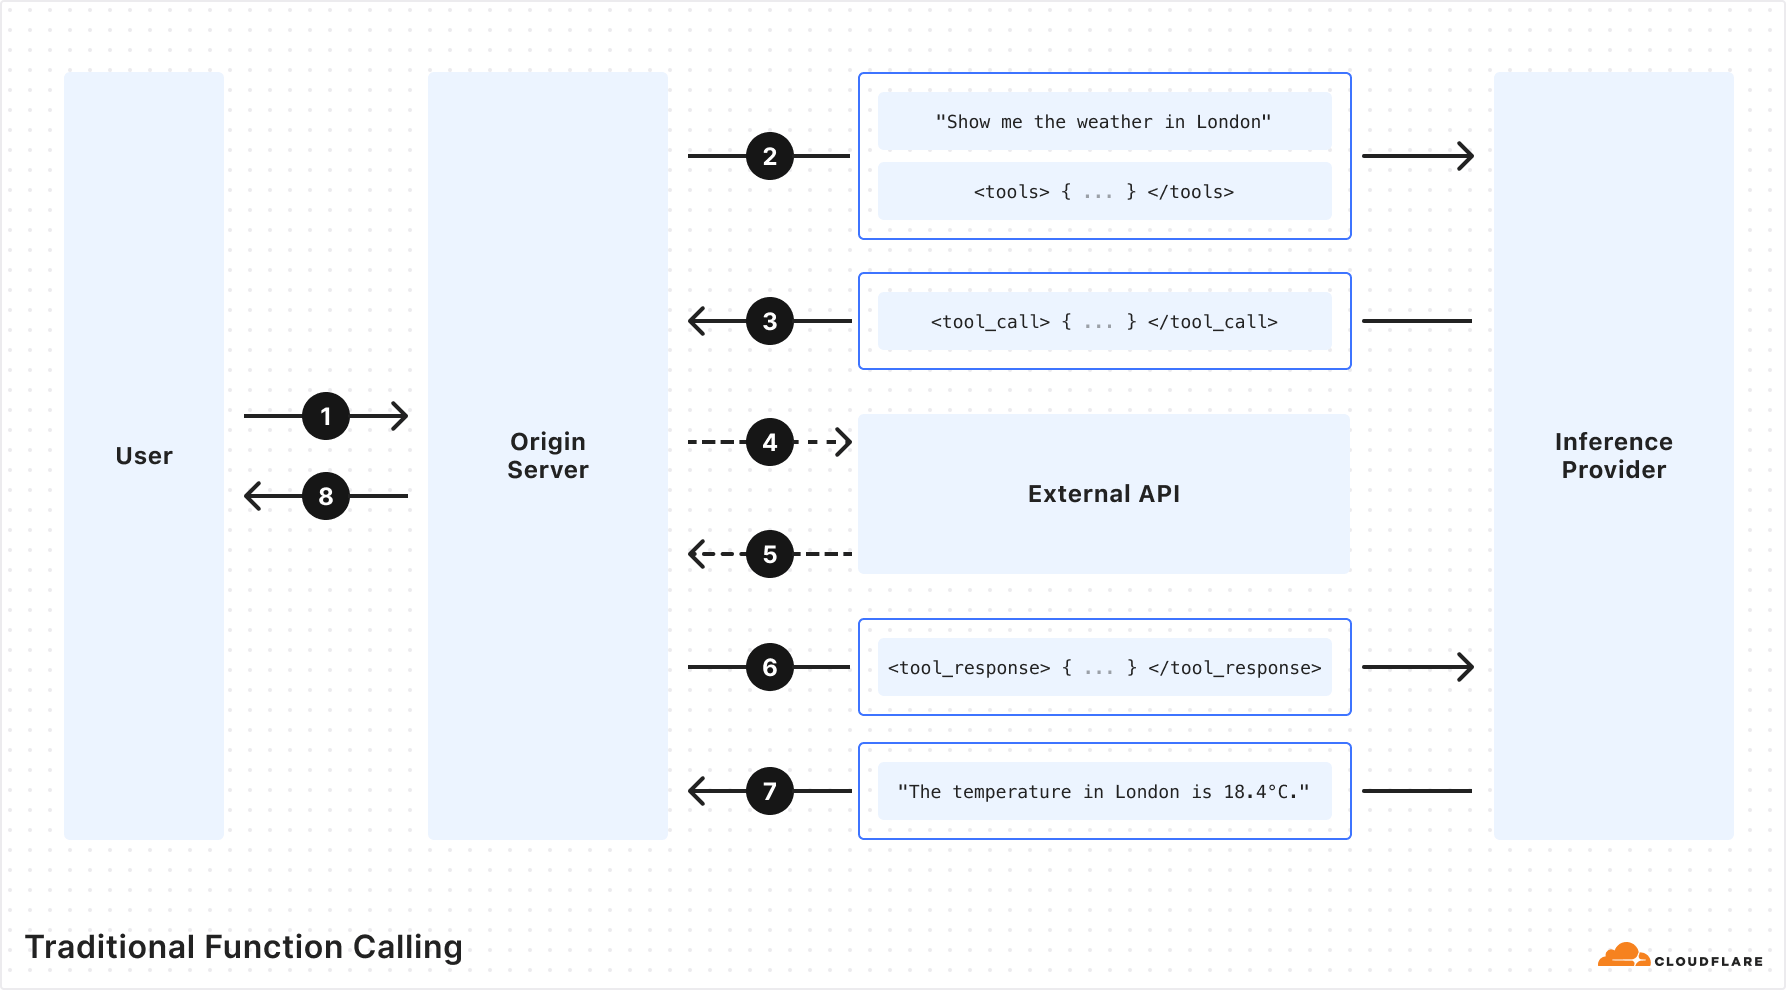
Traditional LLM function calling allows customers to specify a set of function names and required arguments along with a prompt when running inference on an LLM. The LLM returns the names and arguments for the functions that the customer can then make to perform actions. These actions give LLMs the ability to do things like fetch fresh data not present in the training dataset and “perform actions” based on user intent.

Traditional function calling requires multiple back-and-forth requests passing through the network in order to get to the final output. This includes requests to your origin server, an inference provider, and external APIs. As a developer, you have to orchestrate all the back-and-forths and handle all the requests and responses. If you were building complex agents with multi-tool calls or recursive tool calls, it gets infinitely harder. Fortunately, this doesn’t have to be the case, and we’ve solved it for you.

Embedded function calling

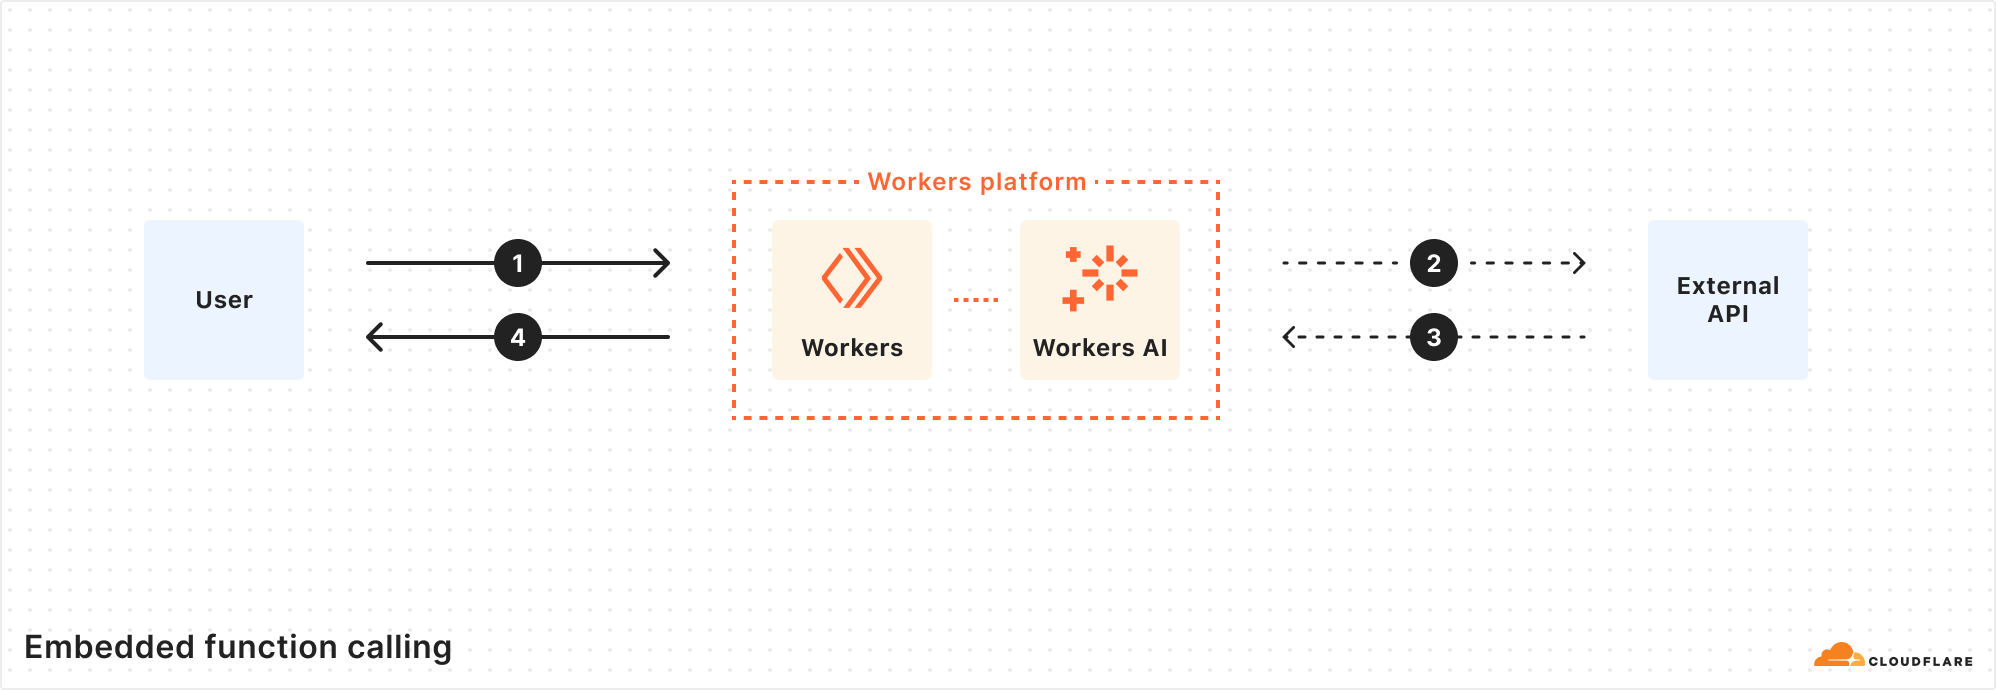
With Workers AI, our inference runtime is the Workers platform, and the Workers platform can be seen as a global compute network of distributed functions (RPCs). With this model, we can run inference using Workers AI, and supply not only the function names and arguments, but also the runtime function code to be executed. Rather than performing multiple round-trips across networks, the LLM inference and function can run in the same execution environment, cutting out all the unnecessary requests.

Cloudflare is one of the few inference providers that is able to do this because we offer more than just inference – our developer platform has compute, storage, inference, and more, all within the same Workers runtime.

We made it easy for you with a new ai-utils package

And to make it as simple as possible, we created a @cloudflare/ai-utils package that you can use to get started. These powerful abstractions cut down on the logic you have to implement to do function calling – it just works out of the box.

runWithTools

runWithTools is our method that you use to do embedded function calling. You pass in your AI binding (env.AI), model, prompt messages, and tools. The tools array includes the description of the function, similar to traditional function calling, but you also pass in the function code that needs to be executed. This method makes the inference calls and executes the function code in one single step. runWithTools is also able to handle multiple function calls, recursive tool calls, validation for model responses, streaming for the final response, and other features.

Another feature to call out is a helper method called autoTrimTools that automatically selects the relevant tools and trims the tools array based on the names and descriptions. We do this by adding an initial LLM inference call to intelligently trim the tools array before the actual function-calling inference call is made. We found that autoTrimTools helped decrease the number of total tokens used in the entire process (especially when there’s a large number of tools provided) because there’s significantly fewer input tokens used when generating the arguments list. You can choose to use autoTrimTools by setting it as a parameter in the runWithTools method.

const response = await runWithTools(env.AI,"@hf/nousresearch/hermes-2-pro-mistral-7b",
  {
    messages: [{ role: "user", content: "What's the weather in Austin, Texas?"}],
    tools: [
      {
        name: "getWeather",
        description: "Return the weather for a latitude and longitude",
        parameters: {
          type: "object",
          properties: {
            latitude: {
              type: "string",
              description: "The latitude for the given location"
            },
            longitude: {
              type: "string",
              description: "The longitude for the given location"
            }
          },
          required: ["latitude", "longitude"]
        },
	 // function code to be executed after tool call
        function: async ({ latitude, longitude }) => {
          const url = `https://api.weatherapi.com/v1/current.json?key=${env.WEATHERAPI_TOKEN}&q=${latitude},${longitude}`
          const res = await fetch(url).then((res) => res.json())

          return JSON.stringify(res)
        }
      }
    ]
  },
  {
    streamFinalResponse: true,
    maxRecursiveToolRuns: 5,
    trimFunction: autoTrimTools,
    verbose: true,
    strictValidation: true
  }
)

createToolsFromOpenAPISpec

For many use cases, users will need to make a request to an external API call during function calling to get the output needed. Instead of having to hardcode the exact API endpoints in your tools array, we made a helper function that takes in an OpenAPI spec and dynamically generates the corresponding tool schemas and API endpoints you’ll need for the function call. You call createToolsFromOpenAPISpec from within runWithTools and it’ll dynamically populate everything for you.

const response = await runWithTools(env.AI, "@hf/nousresearch/hermes-2-pro-mistral-7b", {
  messages: [{ role: "user",content: "Can you name me 5 repos created by Cloudflare"}],
  tools: [
    ...(await createToolsFromOpenAPISpec(  "https://raw.githubusercontent.com/github/rest-api-description/main/descriptions-next/api.github.com/api.github.com.json"
    ))
  ]
})

Putting it all together

When you make a function calling inference request with runWithTools and createToolsFromOpenAPISpec, the only thing you need is the prompts – the rest is automatically handled. The LLM will choose the correct tool based on the prompt, the runtime will execute the function needed, and you’ll get a fast, intelligent response from the model. By leveraging our Workers runtime’s bindings and RPC calls along with our global network, we can execute everything from a single location close to the user, enabling developers to easily write complex agentic chains with fewer lines of code.

We’re super excited to help people build intelligent AI systems with our new embedded function calling and powerful tools. Check out our developer docs on how to get started, and let us know what you think on Discord.

Introducing Stream Generated Captions, powered by Workers AI

Post Syndicated from Mickie Betz original https://blog.cloudflare.com/stream-automatic-captions-with-ai


With one click, customers can now generate video captions effortlessly using Stream’s newest feature: AI-generated captions for on-demand videos and recordings of live streams. As part of Cloudflare’s mission to help build a better Internet, this feature is available to all Stream customers at no additional cost.

This solution is designed for simplicity, eliminating the need for third-party transcription services and complex workflows. For videos lacking accessibility features like captions, manual transcription can be time-consuming and impractical, especially for large video libraries. Traditionally, it has involved specialized services, sometimes even dedicated teams, to transcribe audio and deliver the text along with video, so it can be displayed during playback. As captions become more widely expected for a variety of reasons, including ethical obligation, legal compliance, and changing audience preferences, we wanted to relieve this burden.

With Stream’s integrated solution, the caption generation process is seamlessly integrated into your existing video management workflow, saving time and resources. Regardless of when you uploaded a video, you can easily add automatic captions to enhance accessibility. Captions can now be generated within the Cloudflare Dashboard or via an API request, all within the familiar and unified Stream platform.

This feature is designed with utmost consideration for privacy and data protection. Unlike other third-party transcription services that may share content with external entities, your data remains securely within Cloudflare’s ecosystem throughout the caption generation process. Cloudflare does not utilize your content for model training purposes. For more information about data protection, review Your Data and Workers AI.

Getting Started

Starting June 20th, 2024, this beta is available for all Stream customers as well as subscribers of the Professional and Business plans, which include 100 minutes of video storage.

To get started, upload a video to Stream (from the Cloudflare Dashboard or via API).

Next, navigate to the “Captions” tab on the video, click “Add Captions,” then select the language and “Generate captions with AI.” Finally, click save and within a few minutes, the new captions will be visible in the captions manager and automatically available in the player, too. Captions can also be generated via the API.

Captions are usually generated in a few minutes. When captions are ready, the Stream player will automatically be updated to offer them to users. The HLS and DASH manifests are also updated so third party players that support text tracks can display them as well.

On-demand videos and recordings of live streams, regardless of when they were created, are supported. While in beta, only English captions can be generated, and videos must be shorter than 2 hours. The quality of the transcription is best on videos with clear speech and minimal background noise.

We’ve been pleased with how well the AI model transcribes different types of content during our tests. That said, there are times when the results aren’t perfect, and another method might work better for some use cases. It’s important to check if the accuracy of the generated captions are right for your needs.

Technical Details

Built using Workers AI

The Stream engineering team built this new feature using Workers AI, allowing us to access the Whisper model – an open source Automatic Speech Recognition model – with a single API call. Using Workers AI radically simplified the AI model deployment, integration, and scaling with an out-of-the-box solution. We eliminated the need for our team to handle infrastructure complexities, enabling us to focus solely on building the automated captions feature.

Writing software that utilizes an AI model can involve several challenges. First, there’s the difficulty of configuring the appropriate hardware infrastructure. AI models require substantial computational resources to run efficiently and require specialized hardware, like GPUs, which can be expensive and complex to manage. There’s also the daunting task of deploying AI models at scale, which involve the complexities of balancing workload distribution, minimizing latency, optimizing throughput, and maintaining high availability. Not only does Workers AI solve the pain of managing underlying infrastructure, it also automatically scales as needed.

Using Workers AI transformed a daunting task into a Worker that transcribes audio files with less than 30 lines of code.

import { Ai } from '@cloudflare/ai'


export interface Env {
 AI: any
}


export type AiVTTOutput = {
 vtt?: string
}


export default {
 async fetch(request: Request, env: Env) {
   const blob = await request.arrayBuffer()


   const ai = new Ai(env.AI)
   const input = {
     audio: [...new Uint8Array(blob)],
   }


   try {
     const response: AiVTTOutput = (await ai.run(
       '@cf/openai/whisper-tiny-en',
       input
     )) as any
     return Response.json({ vtt: response.vtt })
   } catch (e) {
     const errMsg =
       e instanceof Error
         ? `${e.name}\n${e.message}\n${e.stack}`
         : 'unknown error type'
     return new Response(`${errMsg}`, {
       status: 500,
       statusText: 'Internal error',
     })
   }
 },
}

Quickly captioning videos at scale

The Stream team wanted to ensure this feature is fast and performant at scale,   which required engineering work to process a high volume of videos regardless of duration.

First, our team needed to pre-process the audio prior to running AI inference to ensure the input is compatible with Whisper’s input format and requirements.

There is a wide spectrum of variability in video content, from a short grainy video filmed on a phone to a multi-hour high-quality Hollywood-produced movie. Videos may be silent or contain an action-driven cacophony. Also, Stream’s on-demand videos include recordings of live streams which are packaged differently from videos uploaded as whole files. With this variability, the audio inputs are stored in an array of different container formats, with different durations, and different file sizes. We ensured our audio files were properly formatted to be compatible with Whisper’s requirements.

One aspect for pre-processing is ensuring files are a sensible duration for optimized inference.  Whisper has an “sweet spot” of 30 seconds for the duration of audio files for transcription. As they note in this Github discussion: “Too short, and you’d lack surrounding context. You’d cut sentences more often. A lot of sentences would cease to make sense. Too long, and you’ll need larger and larger models to contain the complexity of the meaning you want the model to keep track of.” Fortunately, Stream already splits videos into smaller segments to ensure fast delivery during playback on the web. We wrote functionality to concatenate those small segments into 30-second batches prior to sending to Workers AI.

To optimize processing speed, our team parallelized as many operations as possible. By concurrently creating the 30-second audio batches and sending requests to Workers AI, we take full advantage of the scalability of the Workers AI platform. Doing this greatly reduces the time it takes to generate captions, but adds some additional complexity. Because we are sending requests to Workers AI in parallel, transcription responses may arrive out-of-order. For example, if a video is one minute in duration, the request to generate captions for the second 30 seconds of a video may complete before the request for the first 30 seconds of the video. The captions need to be sequential to align with the video, so our team had to maintain an understanding of the audio batch order to ensure our final combined WebVTT caption file is properly synced with the video. We sort the incoming Workers AI responses and re-order timestamps for a final accurate transcript.

The end result is the ability to generate captions for longer videos quickly and efficiently at scale.

Try it now

We are excited to bring this feature to open beta for all of our subscribers as well as Pro and Business plan customers today! Get started by uploading a video to Stream. Review our documentation for tutorials and current beta limitations. Up next, we will be focused on adding more languages and supporting longer videos.

AI Gateway is generally available: a unified interface for managing and scaling your generative AI workloads

Post Syndicated from Kathy Liao original https://blog.cloudflare.com/ai-gateway-is-generally-available


During Developer Week in April 2024, we announced General Availability of Workers AI, and today, we are excited to announce that AI Gateway is Generally Available as well. Since its launch to beta in September 2023 during Birthday Week, we’ve proxied over 500 million requests and are now prepared for you to use it in production.

AI Gateway is an AI ops platform that offers a unified interface for managing and scaling your generative AI workloads. At its core, it acts as a proxy between your service and your inference provider(s), regardless of where your model runs. With a single line of code, you can unlock a set of powerful features focused on performance, security, reliability, and observability – think of it as your control plane for your AI ops. And this is just the beginning – we have a roadmap full of exciting features planned for the near future, making AI Gateway the tool for any organization looking to get more out of their AI workloads.

Why add a proxy and why Cloudflare?

The AI space moves fast, and it seems like every day there is a new model, provider, or framework. Given this high rate of change, it’s hard to keep track, especially if you’re using more than one model or provider. And that’s one of the driving factors behind launching AI Gateway – we want to provide you with a single consistent control plane for all your models and tools, even if they change tomorrow, and then again the day after that.

We’ve talked to a lot of developers and organizations building AI applications, and one thing is clear: they want more observability, control, and tooling around their AI ops. This is something many of the AI providers are lacking as they are deeply focused on model development and less so on platform features.

Why choose Cloudflare for your AI Gateway? Well, in some ways, it feels like a natural fit. We’ve spent the last 10+ years helping build a better Internet by running one of the largest global networks, helping customers around the world with performance, reliability, and security – Cloudflare is used as a reverse proxy by nearly 20% of all websites. With our expertise, it felt like a natural progression – change one line of code, and we can help with observability, reliability, and control for your AI applications – all in one control plane – so that you can get back to building.

Here is that one line code change using the OpenAI JS SDK. And check out our docs to reference other providers, SDKs, and languages.

import OpenAI from 'openai';

const openai = new OpenAI({
apiKey: 'my api key', // defaults to process.env["OPENAI_API_KEY"]
	baseURL: "https://gateway.ai.cloudflare.com/v1/{account_id}/{gateway_slug}/openai"
});

What’s included today?

After talking to customers, it was clear that we needed to focus on some foundational features before moving onto some of the more advanced ones. While we’re really excited about what’s to come, here are the key features available in GA today:

Analytics: Aggregate metrics from across multiple providers. See traffic patterns and usage including the number of requests, tokens, and costs over time.

Real-time logs: Gain insight into requests and errors as you build.

Caching: Enable custom caching rules and use Cloudflare’s cache for repeat requests instead of hitting the original model provider API, helping you save on cost and latency.

Rate limiting: Control how your application scales by limiting the number of requests your application receives to control costs or prevent abuse.

Support for your favorite providers: AI Gateway now natively supports Workers AI plus 10 of the most popular providers, including Groq and Cohere as of mid-May 2024.

Universal endpoint: In case of errors, improve resilience by defining request fallbacks to another model or inference provider.

curl https://gateway.ai.cloudflare.com/v1/{account_id}/{gateway_slug} -X POST \
  --header 'Content-Type: application/json' \
  --data '[
  {
    "provider": "workers-ai",
    "endpoint": "@cf/meta/llama-2-7b-chat-int8",
    "headers": {
      "Authorization": "Bearer {cloudflare_token}",
      "Content-Type": "application/json"
    },
    "query": {
      "messages": [
        {
          "role": "system",
          "content": "You are a friendly assistant"
        },
        {
          "role": "user",
          "content": "What is Cloudflare?"
        }
      ]
    }
  },
  {
    "provider": "openai",
    "endpoint": "chat/completions",
    "headers": {
      "Authorization": "Bearer {open_ai_token}",
      "Content-Type": "application/json"
    },
    "query": {
      "model": "gpt-3.5-turbo",
      "stream": true,
      "messages": [
        {
          "role": "user",
          "content": "What is Cloudflare?"
        }
      ]
    }
  }
]'

What’s coming up?

We’ve gotten a lot of feedback from developers, and there are some obvious things on the horizon such as persistent logs and custom metadata – foundational features that will help unlock the real magic down the road.

But let’s take a step back for a moment and share our vision. At Cloudflare, we believe our platform is much more powerful as a unified whole than as a collection of individual parts. This mindset applied to our AI products means that they should be easy to use, combine, and run in harmony.

Let’s imagine the following journey. You initially onboard onto Workers AI to run inference with the latest open source models. Next, you enable AI Gateway to gain better visibility and control, and start storing persistent logs. Then you want to start tuning your inference results, so you leverage your persistent logs, our prompt management tools, and our built in eval functionality. Now you’re making analytical decisions to improve your inference results. With each data driven improvement, you want more. So you implement our feedback API which helps annotate inputs/outputs, in essence building a structured data set. At this point, you are one step away from a one-click fine tune that can be deployed instantly to our global network, and it doesn’t stop there. As you continue to collect logs and feedback, you can continuously rebuild your fine tune adapters in order to deliver the best results to your end users.

This is all just an aspirational story at this point, but this is how we envision the future of AI Gateway and our AI suite as a whole. You should be able to start with the most basic setup and gradually progress into more advanced workflows, all without leaving Cloudflare’s AI platform. In the end, it might not look exactly as described above, but you can be sure that we are committed to providing the best AI ops tools to help make Cloudflare the best place for AI.

How do I get started?

AI Gateway is available to use today on all plans. If you haven’t yet used AI Gateway, check out our developer documentation and get started now. AI Gateway’s core features available today are offered for free, and all it takes is a Cloudflare account and one line of code to get started. In the future, more premium features, such as persistent logging and secrets management will be available subject to fees. If you have any questions, reach out on our Discord channel.

New Consent and Bot Management features for Cloudflare Zaraz

Post Syndicated from Yo'av Moshe original https://blog.cloudflare.com/new-consent-and-bot-management-features-for-cloudflare-zaraz


Managing consent online can be challenging. After you’ve figured out the necessary regulations, you usually need to configure some Consent Management Platform (CMP) to load all third-party tools and scripts on your website in a way that respects these demands. Cloudflare Zaraz manages the loading of all of these third-party tools, so it was only natural that in April 2023 we announced the Cloudflare Zaraz CMP: the simplest way to manage consent in a way that seamlessly integrates with your third-party tools manager.

As more and more third-party tool vendors are required to handle consent properly, our CMP has evolved to integrate with these new technologies and standardization efforts. Today, we’re happy to announce that the Cloudflare Zaraz CMP is now compatible with the Interactive Advertising Bureau Transparency and Consent Framework (IAB TCF) requirements, and fully supports Google’s Consent Mode v2 signals. Separately, we’ve taken efforts to improve the way Cloudflare Zaraz handles traffic coming from online bots.

IAB TCF Compatibility

Earlier this year, Google announced that websites that would like to use AdSense and other advertising solutions in the European Economic Area (EEA), the UK, and Switzerland, will be required to use a CMP that is approved by IAB Europe, an association for digital marketing and advertising. Their Transparency and Consent Framework sets guidelines for how CMPs should operate. Since March 2024, the Cloudflare Zaraz CMP is compliant with these guidelines, and Zaraz users in Europe can use Google’s advertising products without any restrictions.

Since the IAB TCF requirements can make the consent modal a little complex for users, we have made this compliance mode an opt-in feature. See the official documentation for information on how to enable it.

Google Consent Mode v2

Another new requirement from Google was the need to send “Consent Signals”. These signals are part of what is also known as “Consent Mode”, and later, Consent Mode v2. Together with each event sent to Google Analytics and Google Ads, they tell the Google servers about the consent status of the current visitor – did they agree to have their data used for personalized advertising? Did they accept cookies? These and other questions are answered by Consent Mode v2, telling the Google servers how to treat the data it receives.

Consent Mode v2 usually requires setting two values for each consent category – a default value and an updated one. The default value represents the consent status (granted or denied) a certain category (e.g. using cookies) has before the user has submitted their personal preferences. Usually, and especially within the EU, the default value would be `denied`. Once the user submits their preferences, Consent Mode v2 sends an additional “updated” value that represents the choice the user made.

Implementing Consent Mode v2 is quick and easy with Cloudflare Zaraz, although the specific implementation depends on your CMP. Examples, including integration with the Cloudflare Zaraz CMP, are available in our official documentation.

We believe that better standardization around online consent benefits everyone, and we are glad to be working on tools that respect users’ privacy and improve online user experience.

Bot Management

We also recently integrated better Bot Management support within Cloudflare Zaraz. You often want crawlers to be able to access your website, but you don’t want them to trigger your analytics and conversion pixels. Using the Bot Management feature in the Cloudflare Zaraz Settings page allows you to fine tune which requests will make it to Cloudflare Zaraz and which ones will be skipped. Since Zaraz pricing is based on the total number of Zaraz Events, this can also be useful if you want more control over your Cloudflare Zaraz costs, ensuring you will not be paying for events triggered by bots. Like all other Cloudflare Zaraz features, these new features are also available to users on all plans, including the free plan. For us, it is part of making sure that everyone can benefit from a faster, safer, and more private way to manage third parties online. If you haven’t started using Cloudflare Zaraz already, now is a great time. Go to the Cloudflare dashboard and set it up in just a few clicks.

Using Fortran on Cloudflare Workers

Post Syndicated from John Graham-Cumming original https://blog.cloudflare.com/using-fortran-on-cloudflare-workers


In April 2020, we blogged about how to get COBOL running on Cloudflare Workers by compiling to WebAssembly. The ecosystem around WebAssembly has grown significantly since then, and it has become a solid foundation for all types of projects, be they client-side or server-side.

As WebAssembly support has grown, more and more languages are able to compile to WebAssembly for execution on servers and in browsers. As Cloudflare Workers uses the V8 engine and supports WebAssembly natively, we’re able to support languages that compile to WebAssembly on the platform.

Recently, work on LLVM has enabled Fortran to compile to WebAssembly. So, today, we’re writing about running Fortran code on Cloudflare Workers.

Before we dive into how to do this, here’s a little demonstration of number recognition in Fortran. Draw a number from 0 to 9 and Fortran code running somewhere on Cloudflare’s network will predict the number you drew.

Try yourself on handwritten-digit-classifier.fortran.demos.cloudflare.com.

This is taken from the wonderful Fortran on WebAssembly post but instead of running client-side, the Fortran code is running on Cloudflare Workers. Read on to find out how you can use Fortran on Cloudflare Workers and how that demonstration works.

Wait, Fortran? No one uses that!

Not so fast! Or rather, actually pretty darn fast if you’re doing a lot of numerical programming or have scientific data to work with. Fortran (originally FORmula TRANslator) is very well suited for scientific workloads because of its native functionality for things like arithmetic and handling large arrays and matrices.

If you look at the ranking of the fastest supercomputers in the world you’ll discover that the measurement of “fast” is based on these supercomputers running a piece of software called LINPACK that was originally written in Fortran. LINPACK is designed to help with problems solvable using linear algebra.

The LINPACK benchmarks use LINPACK to solve an n x n system of linear equations using matrix operations and, in doing so, determine how fast supercomputers are. The code is available in Fortran, C and Java.

A related Fortran package, BLAS, also does linear algebra and forms the basis of the number identifying code above. But other Fortran packages are still relevant. Back in 2017, NASA ran a competition to make FUN3D (used to perform calculations of airflow over simulated aircraft). FUN3D is written in Fortran.

So, although Fortran (or at the time FORTRAN) first came to life in 1957, it’s alive and well and being used widely for scientific applications (there’s even Fortran for CUDA). One particular application left Earth 20 years after Fortran was born: Voyager. The Voyager probes use a combination of assembly language and Fortran to keep chugging along.

But back in our solar system, and back on Region: Earth, you can now use Fortran on Cloudflare Workers. Here’s how.

How to get your Fortran code running on Cloudflare Workers

To make it easy to run your Fortran code on Cloudflare Workers, we created a tool called Fortiche (translates to smart in French). It uses Flang and Emscripten under the hood.

Flang is a frontend in LLVM and, if you read the Fortran on WebAssembly blog post, we currently have to patch LLVM to work around a few issues.

Emscripten is used to compile LLVM output and produce code that is compatible with Cloudflare Workers.

This is all packaged in the Fortiche Docker image. Let’s see a simple example.

add.f90:

SUBROUTINE add(a, b, res)
    INTEGER, INTENT(IN) :: a, b
    INTEGER, INTENT(OUT) :: res

    res = a + b
END

Here we defined a subroutine called add that takes a and b, sums them together and places the result in res.

Compile with Fortiche:

docker run -v $PWD:/input -v $PWD/output:/output xtuc/fortiche --export-func=add add.f90

Passing --export-func=add to Fortiche makes the Fortran add subroutine available to JavaScript.

The output folder contains the compiled WebAssembly module and JavaScript from Emscripten, and a JavaScript endpoint generated by Fortiche:

$ ls -lh ./output
total 84K
-rw-r--r-- 1 root root 392 avril 22 12:00 index.mjs
-rw-r--r-- 1 root root 27K avril 22 12:00 out.mjs
-rwxr-xr-x 1 root root 49K avril 22 12:00 out.wasm

And finally the Cloudflare Worker:

// Import what Fortiche generated
import {load} from "../output/index.mjs"

export default {
    async fetch(request: Request): Promise<Response> {
        // Load the Fortran program
        const program = await load();

        // Allocate space in memory for the arguments and result
        const aPtr = program.malloc(4);
        const bPtr = program.malloc(4);
        const outPtr = program.malloc(4);

        // Set argument values
        program.HEAP32[aPtr / 4] = 123;
        program.HEAP32[bPtr / 4] = 321;

        // Run the Fortran add subroutine
        program.add(aPtr, bPtr, outPtr);

        // Read the result
        const res = program.HEAP32[outPtr / 4];

        // Free everything
        program.free(aPtr);
        program.free(bPtr);
        program.free(outPtr);

        return Response.json({ res });
    },
};

Interestingly, the values we pass to Fortran are all pointers, therefore we have to allocate space for each argument and result (the Fortran integer type is four bytes wide), and pass the pointers to the `add` subroutine.

Running the Worker gives us the right answer:

$ curl https://fortran-add.cfdemos.workers.dev

{"res":444}

You can find the full example here.

Handwritten digit classifier

This example is taken from https://gws.phd/posts/fortran_wasm/#mnist. It relies on the BLAS library, which is available in Fortiche with the flag: --with-BLAS-3-12-0.

Note that the LAPACK library is also available in Fortiche with the flag: --with-LAPACK-3-12-0.

You can try on https://handwritten-digit-classifier.fortran.demos.cloudflare.com and find the source code here.

Let us know what you write using Fortran and Cloudflare Workers!

Meta Llama 3 available on Cloudflare Workers AI

Post Syndicated from Michelle Chen original https://blog.cloudflare.com/meta-llama-3-available-on-cloudflare-workers-ai


Workers AI

Workers AI’s initial launch in beta included support for Llama 2, as it was one of the most requested open source models from the developer community. Since that initial launch, we’ve seen developers build all kinds of innovative applications including knowledge sharing chatbots, creative content generation, and automation for various workflows.  

At Cloudflare, we know developers want simplicity and flexibility, with the ability to build with multiple AI models while optimizing for accuracy, performance, and cost, among other factors. Our goal is to make it as easy as possible for developers to use their models of choice without having to worry about the complexities of hosting or deploying models.

As soon as we learned about the development of Llama 3 from our partners at Meta, we knew developers would want to start building with it as quickly as possible. Workers AI’s serverless inference platform makes it extremely easy and cost effective to start using the latest large language models (LLMs). Meta’s commitment to developing and growing an open AI-ecosystem makes it possible for customers of all sizes to use AI at scale in production. All it takes is a few lines of code to run inference to Llama 3:

export interface Env {
  // If you set another name in wrangler.toml as the value for 'binding',
  // replace "AI" with the variable name you defined.
  AI: any;
}

export default {
  async fetch(request: Request, env: Env) {
    const response = await env.AI.run('@cf/meta/llama-3-8b-instruct', {
        messages: [
{role: "user", content: "What is the origin of the phrase Hello, World?"}
	 ]
      }
    );

    return new Response(JSON.stringify(response));
  },
};

Built with Meta Llama 3

Llama 3 offers leading performance on a wide range of industry benchmarks. You can learn more about the architecture and improvements on Meta’s blog post. Cloudflare Workers AI supports Llama 3 8B, including the instruction fine-tuned model.

Meta’s testing shows that Llama 3 is the most advanced open LLM today on evaluation benchmarks such as MMLU, GPQA, HumanEval, GSM-8K, and MATH. Llama 3 was trained on an increased number of training tokens (15T), allowing the model to have a better grasp on language intricacies. Larger context windows doubles the capacity of Llama 2, and allows the model to better understand lengthy passages with rich contextual data. Although the model supports a context window of 8k, we currently only support 2.8k but are looking to support 8k context windows through quantized models soon. As well, the new model introduces an efficient new tiktoken-based tokenizer with a vocabulary of 128k tokens, encoding more characters per token, and achieving better performance on English and multilingual benchmarks. This means that there are 4 times as many parameters in the embedding and output layers, making the model larger than the previous Llama 2 generation of models.

Under the hood, Llama 3 uses grouped-query attention (GQA), which improves inference efficiency for longer sequences and also renders their 8B model architecturally equivalent to Mistral-7B. For tokenization, it uses byte-level byte-pair encoding (BPE), similar to OpenAI’s GPT tokenizers. This allows tokens to represent any arbitrary byte sequence — even those without a valid utf-8 encoding. This makes the end-to-end model much more flexible in its representation of language, and leads to improved performance.

Along with the base Llama 3 models, Meta has released a suite of offerings with tools such as Llama Guard 2, Code Shield, and CyberSec Eval 2, which we are hoping to release on our Workers AI platform shortly.

Try it out now

Meta Llama 3 8B is available in the Workers AI Model Catalog today! Check out the documentation here and as always if you want to share your experiences or learn more, join us in the Developer Discord.

Cloudflare acquires Baselime to expand serverless application observability capabilities

Post Syndicated from Boris Tane original https://blog.cloudflare.com/cloudflare-acquires-baselime-expands-observability-capabilities


Today, we’re thrilled to announce that Cloudflare has acquired Baselime.

The cloud is changing. Just a few years ago, serverless functions were revolutionary. Today, entire applications are built on serverless architectures, from compute to databases, storage, queues, etc. — with Cloudflare leading the way in making it easier than ever for developers to build, without having to think about their architecture. And while the adoption of serverless has made it simple for developers to run fast, it has also made one of the most difficult problems in software even harder: how the heck do you unravel the behavior of distributed systems?

When I started Baselime 2 years ago, our goal was simple: enable every developer to build, ship, and learn from their serverless applications such that they can resolve issues before they become problems.

Since then, we built an observability platform that enables developers to understand the behaviour of their cloud applications. It’s designed for high cardinality and dimensionality data, from logs to distributed tracing with OpenTelemetry. With this data, we automatically surface insights from your applications, and enable you to quickly detect, troubleshoot, and resolve issues in production.

In parallel, Cloudflare has been busy the past few years building the next frontier of cloud computing: the connectivity cloud. The team is building primitives that enable developers to build applications with a completely new set of paradigms, from Workers to D1, R2, Queues, KV, Durable Objects, AI, and all the other services available on the Cloudflare Developers Platform.

This synergy makes Cloudflare the perfect home for Baselime. Our core mission has always been to simplify and innovate around observability for the future of the cloud, and Cloudflare’s ecosystem offers the ideal ground to further this cause. With Cloudflare, we’re positioned to deeply integrate into a platform that tens of thousands of developers trust and use daily, enabling them to quickly build, ship, and troubleshoot applications. We believe that every Worker, Queue, KV, Durable Object, AI call, etc. should have built-in observability by default.

That’s why we’re incredibly excited about the potential of what we can build together and the impact it will have on developers around the world.

To give you a preview into what’s ahead, I wanted to dive deeper into the 3 core concepts we followed while building Baselime.

High Cardinality and Dimensionality

Cardinality and dimensionality are best described using examples. Imagine you’re playing a board game with a deck of cards. High cardinality is like playing a game where every card is a unique character, making it hard to remember or match them. And high dimensionality is like each card has tons of details like strength, speed, magic, aura, etc., making the game’s strategy complex because there’s so much to consider.

This also applies to the data your application emits. For example, when you log an HTTP request that makes database calls.

  • High cardinality means that your logs can have a unique userId or requestId (which can take millions of distinct values). Those are high cardinality fields.
  • High dimensionality means that your logs can have thousands of possible fields. You can record each HTTP header of your request and the details of each database call. Any log can be a key-value object with thousands of individual keys.

The ability to query on high cardinality and dimensionality fields is key to modern observability. You can surface all errors or requests for a specific user, compute the duration of each of those requests, and group by location. You can answer all of those questions with a single tool.

OpenTelemetry

OpenTelemetry provides a common set of tools, APIs, SDKs, and standards for instrumenting applications. It is a game-changer for debugging and understanding cloud applications. You get to see the big picture: how fast your HTTP APIs are, which routes are experiencing the most errors, or which database queries are slowest. You can also get into the details by following the path of a single request or user across your entire application.

Baselime is OpenTelemetry native, and it is built from the ground up to leverage OpenTelemetry data. To support this, we built a set of OpenTelemetry SDKs compatible with several serverless runtimes.

Cloudflare is building the cloud of tomorrow and has developed workerd, a modern JavaScript runtime for Workers. With Cloudflare, we are considering embedding OpenTelemetry directly in the Workers’ runtime. That’s one more reason we’re excited to grow further at Cloudflare, enabling more developers to understand their applications, even in the most unconventional scenarios.

Developer Experience

Observability without action is just storage. I have seen too many developers pay for tools to store logs and metrics they never use, and the key reason is how opaque these tools are.

The crux of the issue in modern observability isn’t the technology itself, but rather the developer experience. Many tools are complex, with a significant learning curve. This friction reduces the speed at which developers can identify and resolve issues, ultimately affecting the reliability of their applications. Improving developer experience is key to unlocking the full potential of observability.

We built Baselime to be an exploratory solution that surfaces insights to you rather than requiring you to dig for them. For example, we notify you in real time when errors are discovered in your application, based on your logs and traces. You can quickly search through all of your data with full-text search, or using our powerful query engine, which makes it easy to correlate logs and traces for increased visibility, or ask our AI debugging assistant for insights on the issue you’re investigating.

It is always possible to go from one insight to another, asking questions about the state of your app iteratively until you get to the root cause of the issue you are troubleshooting.

Cloudflare has always prioritised the developer experience of its developer platform, especially with Wrangler, and we are convinced it’s the right place to solve the developer experience problem of observability.

What’s next?

Over the next few months, we’ll work to bring the core of Baselime into the Cloudflare ecosystem, starting with OpenTelemetry, real-time error tracking, and all the developer experience capabilities that make a great observability solution. We will keep building and improving observability for applications deployed outside Cloudflare because we understand that observability should work across providers.

But we don’t want to stop there. We want to push the boundaries of what modern observability looks like. For instance, directly connecting to your codebase and correlating insights from your logs and traces to functions and classes in your codebase. We also want to enable more AI capabilities beyond our debugging assistant. We want to deeply integrate with your repositories such that you can go from an error in your logs and traces to a Pull Request in your codebase within minutes.

We also want to enable everyone building on top of Large Language Models to do all your LLM observability directly within Cloudflare, such that you can optimise your prompts, improve latencies and reduce error rates directly within your cloud provider. These are just a handful of capabilities we can now build with the support of the Cloudflare platform.

Thanks

We are incredibly thankful to our community for its continued support, from day 0 to today. With your continuous feedback, you’ve helped us build something we’re incredibly proud of.

To all the developers currently using Baselime, you’ll be able to keep using the product and will receive ongoing support. Also, we are now making all the paid Baselime features completely free.

Baselime products remain available to sign up for while we work on integrating with the Cloudflare platform. We anticipate sunsetting the Baselime products towards the end of 2024 when you will be able to observe all of your applications within the Cloudflare dashboard. If you’re interested in staying up-to-date on our work with Cloudflare, we will release a signup link in the coming weeks!

We are looking forward to continuing to innovate with you.

Blazing fast development with full-stack frameworks and Cloudflare

Post Syndicated from Igor Minar original https://blog.cloudflare.com/blazing-fast-development-with-full-stack-frameworks-and-cloudflare


Hello web developers! Last year we released a slew of improvements that made deploying web applications on Cloudflare much easier, and in response we’ve seen a large growth of Astro, Next.js, Nuxt, Qwik, Remix, SolidStart, SvelteKit, and other web apps hosted on Cloudflare. Today we are announcing major improvements to our integration with these web frameworks that makes it easier to develop sophisticated applications that use our D1 SQL database, R2 object store, AI models, and other powerful features of Cloudflare’s developer platform.

In the past, if you wanted to develop a web framework-powered application with D1 and run it locally, you’d have to build a production build of your application, and then run it locally using `wrangler pages dev`. While this worked, each of your code iterations would take seconds, or tens of seconds for big applications. Iterating using production builds is simply too slow, pulls you out of the flow, and doesn’t allow you to take advantage of all the DX optimizations that framework authors have put a lot of hard work into. This is changing today!

Our goal is to integrate with web frameworks in the most natural way possible, without developers having to learn and adopt significant workflow changes or custom APIs when deploying their app to Cloudflare. Whether you are a Next.js developer, a Nuxt developer, or prefer another framework, you can now keep on using the blazing fast local development workflow familiar to you, and ship your application on Cloudflare.

All full-stack web frameworks come with a local development server (dev server) that is custom tailored to the framework and often provides an excellent development experience, with only one exception — they don’t natively support some important features of Cloudflare’s development platform, especially our storage solutions.

So up until recently, you had to make a tough choice. You could use the framework-specific dev server to develop your application, but forgo access to many of Cloudflare’s features. Alternatively, you could take full advantage of Cloudflare’s platform including various resources like D1 or R2, but you would have to give up using the framework specific developer tooling. In that case, your iteration cycle would slow down, and it would take seconds rather than milliseconds for you to see results of your code changes in the browser. But not anymore! Let’s take a look.

Let’s build an application

Let’s create a new application using C3 — our create-cloudflare CLI. We could use any npm client of our choice (pnpm anyone?!?), but to keep things simple in this post, we’ll stick with the default npm client. To get started, just run:

$ npm create cloudflare@latest

Provide a name for your app, or stick with the randomly generated one. Then select the “Website or web app” category, and pick a full-stack framework of your choice. We support many: Astro, Next.js, Nuxt, Qwik, Remix, SolidStart, and SvelteKit.

Since C3 delegates the application scaffolding to the latest version of the framework-specific CLI, you will scaffold the application exactly as the framework authors intended without missing out on any of the framework features or options. C3 then adds to your application everything necessary for integrating and deploying to Cloudflare so that you don’t have to configure it yourself.

With our application scaffolded, let’s get it to display a list of products stored in a database with just a few steps. First, we add the configuration for our database to our wrangler.toml config file:

[[d1_databases]]
binding = "DB"
database_name = "blog-products-db"
database_id = "XXXXXXXXXXXXXXXX"

Yes, that’s right! You can now configure your bound resources via the wrangler.toml file, even for full-stack apps deployed to Pages. We’ll share much more about configuration enhancements to Pages in a dedicated announcement.

Now let’s create a simple schema.sql file representing our database schema:

CREATE TABLE products(product_id INTEGER PRIMARY KEY, name TEXT, price INTEGER);
INSERT INTO products (product_id, name, price) VALUES (1, 'Apple', 250), (2, 'Banana', 100), (3, 'Cherry', 375);

And initialize our database:

$ npx wrangler d1 execute blog-products-db --local --file schema.sql

Notice that we used the –local flag of wrangler d1 execute to apply the changes to our local D1 database. This is the database that our dev server will connect to.

Next, if you use TypeScript, let TypeScript know about your database by running:

$ npm run build-cf-types

This command is preconfigured for all full-stack applications created via C3 and executes wrangler types to update the interface of Cloudflare’s environment containing all configured bindings.

We can now start the dev server provided by your framework via a handy shortcut:

$ npm run dev

This shortcut will start your framework’s dev server, whether it’s powered by next dev, nitro, or vite.

Now to access our database and list the products, we can now use a framework specific approach. For example, in a Next.js application that uses the App router, we could update app/api/hello/route.ts with the following:

const db = getRequestContext().env.DB;
 const productsResults = await db.prepare('SELECT * FROM products').all();
 return Response.json(productsResults.results);

Or in a Nuxt application, we can create a server/api/hello.ts file and populate it with:

export default defineEventHandler(async ({ context }) => {
   const db = context.cloudflare.env.DB;
   const productsResults = await db.prepare('SELECT * FROM products').all();
   return productsResults.results;
 });

Assuming that the framework dev server is running on port 3000, you can test the new API route in either framework by navigating to http://localhost:3000/api/hello. For simplicity, we picked API routes in these examples, but the same applies to any UI-generating routes as well.

Each web framework has its own way to define routes and pass contextual information about the request throughout the application, so how you access your databases, object stores, and other resources will depend on your framework. You can read our updated full-stack framework guides to learn more:

Now that you know how to access Cloudflare’s resources in the framework of your choice, everything else you know about your framework remains the same. You can now develop your application locally, using the development server optimized for your framework, which often includes support for hot module replacement (HMR), custom dev tools, enhanced debugging support and more, all while still benefiting from Cloudflare-specific APIs and features. Win-win!

What has actually changed to enable these development workflows?

To decrease the development latency and preserve the custom framework-specific experiences, we needed to enable web frameworks and their dev servers to integrate with wrangler and miniflare in a seamless, almost invisible way.

Miniflare is a key component in this puzzle. It is our local simulator for Cloudflare-specific resources, which is powered by workerd, our JavaScript (JS) runtime. By relying on workerd, we ensure that Cloudflare’s JavaScript APIs run locally in a way that faithfully simulates our production environment. The trouble is that framework dev servers already rely on Node.js to run the application, so bringing another JS runtime into the mix breaks many assumptions in how these dev servers have been architected.

Our team however came up with an interesting approach to bridging the gap between these two JS runtimes. We call it the getPlatformProxy() API, which is now part of wrangler and is super-powered by miniflare’s magic proxy. This API exposes a JS proxy object that behaves just like the usual Workers env object containing all bound resources. The proxy object enables code from Node.js to transparently invoke JavaScript code running in workerd, as well access Cloudflare-specific runtime APIs.

With this bridge between the Node.js and workerd runtimes, your application can now access Cloudflare simulators for D1, R2, KV and other storage solutions directly while running in a dev server powered by Node.js. Or you could even write an Node.js script to do the same:

 import {getPlatformProxy} from 'wrangler';


 const {env} = getPlatformProxy();
 console.dir(env);
 const db = env.DB;


 // Now let’s execute a DB query that runs in a local D1 db
 // powered by miniflare/workerd and access the result from Node.js
 const productsResults = await db.prepare('SELECT * FROM products').all();
 console.log(productsResults.results);

With the getPlatformProxy() API available, the remaining work was all about updating all framework adapters, plugins, and in some cases frameworks themselves to make use of this API. We are grateful for the support we received from framework teams on this journey, especially Alex from Astro, pi0 from Nuxt, Pedro from Remix, Ryan from Solid, Ben and Rich from Svelte, and our collaborator on the next-on-pages project, James Anderson.

Future improvements to development workflows with Vite

While the getPlatformProxy() API is a good solution for many scenarios, we can do better. If we could run the entire application in our JS runtime rather than Node.js, we could even more faithfully simulate the production environment and reduce developer friction and production surprises.

In the ideal world, we’d like you to develop against the same runtime that you deploy to in production, and this can only be achieved by integrating workerd directly into the dev servers of all frameworks, which is not a small feat considering the number of frameworks out there and the differences between them.

We however got a bit lucky. As we kicked off this effort, we quickly realized that Vite, a popular dev server used by many full-stack frameworks, was gaining increasingly greater adoption. In fact, Remix switched over to Vite just recently and confirmed the popularity of Vite as the common foundation for web development today.

If Vite had first-class support for running a full-stack application in an alternative JavaScript runtime, we could enable anyone using Vite to develop their applications locally with complete access to the Cloudflare developer platform. No more framework specific custom integrations and workarounds — all the features of a full-stack framework, Vite, and Cloudflare accessible to all developers.

Sounds too good to be true? Maybe. We are very stoked to be working with the Vite team on the Vite environments proposal, which could enable just that. This proposal is still evolving, so stay tuned for updates.

What will you build today?

We aim to make Cloudflare the best development platform for web developers. Making it quick and easy to develop your application with frameworks and tools you are already familiar with is a big part of our story. Start your journey with us by running a single command:

$ npm create cloudflare@latest

Browser Rendering API GA, rolling out Cloudflare Snippets, SWR, and bringing Workers for Platforms to all users

Post Syndicated from Tanushree Sharma original https://blog.cloudflare.com/browser-rendering-api-ga-rolling-out-cloudflare-snippets-swr-and-bringing-workers-for-platforms-to-our-paygo-plans


Browser Rendering API is now available to all paid Workers customers with improved session management

In May 2023, we announced the open beta program for the Browser Rendering API. Browser Rendering allows developers to programmatically control and interact with a headless browser instance and create automation flows for their applications and products.

At the same time, we launched a version of the Puppeteer library that works with Browser Rendering. With that, developers can use a familiar API on top of Cloudflare Workers to create all sorts of workflows, such as taking screenshots of pages or automatic software testing.

Today, we take Browser Rendering one step further, taking it out of beta and making it available to all paid Workers’ plans. Furthermore, we are enhancing our API and introducing a new feature that we’ve been discussing for a long time in the open beta community: session management.

Session Management

Session management allows developers to reuse previously opened browsers across Worker’s scripts. Reusing browser sessions has the advantage that you don’t need to instantiate a new browser for every request and every task, drastically increasing performance and lowering costs.

Before, to keep a browser instance alive and reuse it, you’d have to implement complex code using Durable Objects. Now, we’ve simplified that for you by keeping your browsers running in the background and extending the Puppeteer API with new session management methods that give you access to all of your running sessions, activity history, and active limits.

Here’s how you can list your active sessions:

const sessions = await puppeteer.sessions(env.RENDERING);
console.log(sessions);
[
   {
      "connectionId": "2a2246fa-e234-4dc1-8433-87e6cee80145",
      "connectionStartTime": 1711621704607,
      "sessionId": "478f4d7d-e943-40f6-a414-837d3736a1dc",
      "startTime": 1711621703708
   },
   {
      "sessionId": "565e05fb-4d2a-402b-869b-5b65b1381db7",
      "startTime": 1711621703808
   }
]

We have added a Worker script example on how to use session management to the Developer Documentation.

Analytics and logs

Observability is an essential part of any Cloudflare product. You can find detailed analytics and logs of your Browser Rendering usage in the dashboard under your account’s Worker & Pages section.

Browser Rendering is now available to all customers with a paid Workers plan. Each account is limited to running two new browsers per minute and two concurrent browsers at no cost during this period. Check our developers page to get started.

We are rolling out access to Cloudflare Snippets

Powerful, programmable, and free of charge, Snippets are the best way to perform complex HTTP request and response modifications on Cloudflare. What was once too advanced to achieve using Rules products is now possible with Snippets. Since the initial announcement during Developer Week 2022, the promise of extending out-of-the-box Rules functionality by writing simple JavaScript code is keeping the Cloudflare community excited.

During the first 3 months of 2024 alone, the amount of traffic going through Snippets increased over 7x, from an average of 2,200 requests per second in early January to more than 17,000 in March.

However, instead of opening the floodgates and letting millions of Cloudflare users in to test (and potentially break) Snippets in the most unexpected ways, we are going to pace ourselves and opt for a phased rollout, much like the newly released Gradual Rollouts for Workers.

In the next few weeks, 5% of Cloudflare users will start seeing “Snippets” under the Rules tab of the zone-level menu in their dashboard. If you happen to be part of the first 5%, snip into action and try out how fast and powerful Snippets are even for advanced use cases like dynamically changing the date in headers or A / B testing leveraging the `math.random` function. Whatever you use Snippets for, just keep one thing in mind: this is still an alpha, so please do not use Snippets for production traffic just yet.

Until then, keep your eyes out for the new Snippets tab in the Cloudflare dashboard and learn more how powerful and flexible Snippets are at the developer documentation in the meantime.

Coming soon: asynchronous revalidation with stale-while-revalidate

One of the features most requested by our customers is the asynchronous revalidation with stale-while-revalidate (SWR) cache directive, and we will be bringing this to you in the second half of 2024.  This functionality will be available by design as part of our new CDN architecture that is being built using Rust with performance and memory safety at top of mind.

Currently, when a client requests a resource, such as a web page or an image, Cloudflare checks to see if the asset is in cache and provides a cached copy if available. If the file is not in the cache or has expired and become stale, Cloudflare connects to the origin server to check for a fresh version of the file and forwards this fresh version to the end user. This wait time adds latency to these requests and impacts performance.

Stale-while-revalidate is a cache directive that allows the expired or stale version of the asset to be served to the end user while simultaneously allowing Cloudflare to check the origin to see if there’s a fresher version of the resource available. If an updated version exists, the origin forwards it to Cloudflare, updating the cache in the process. This mechanism allows the client to receive a response quickly from the cache while ensuring that it always has access to the most up-to-date content. Stale-while-revalidate strikes a balance between serving content efficiently and ensuring its freshness, resulting in improved performance and a smoother user experience.

Customers who want to be part of our beta testers and “cache” in on the fun can register here, and we will let you know when the feature is ready for testing!

Coming on April 16, 2024: Workers for Platforms for our pay-as-you-go plan

Today, we’re excited to share that on April 16th, Workers for Platforms will be available to all developers through our new $25 pay-as-you-go plan!

Workers for Platforms is changing the way we build software – it gives you the ability to embed personalization and customization directly into your product. With Workers for Platforms, you can deploy custom code on behalf of your users or let your users directly deploy their own code to your platform, without you or your users having to manage any infrastructure. You can use Workers for Platforms with all the exciting announcements that have come out this Developer Week – it supports all the bindings that come with Workers (including Workers AI, D1 and Durable Objects) as well as Python Workers.  

Here’s what some of our customers – ranging from enterprises to startups – are building on Workers for Platforms:

  • Shopify Oxygen is a hosting platform for their Remix-based eCommerce framework Hydrogen, and it’s built on Workers for Platforms! The Hydrogen/Oxygen combination gives Shopify merchants control over their buyer experience without the restrictions of generic storefront templates.
  • Grafbase is a data platform for developers to create a serverless GraphQL API that unifies data sources across a business under one endpoint. They use Workers for Platforms to give their developers the control and flexibility to deploy their own code written in JavaScript/TypeScript or WASM.
  • Triplit is an open-source database that syncs data between server and browser in real-time. It allows users to build low latency, real-time applications with features like relational querying, schema management and server-side storage built in. Their query and sync engine is built on top of Durable Objects, and they’re using Workers for Platforms to allow their customers to package custom Javascript alongside their Triplit DB instance.

Tools for observability and platform level controls

Workers for Platforms doesn’t just allow you to deploy Workers to your platform – we also know how important it is to have observability and control over your users’ Workers. We have a few solutions that help with this:

  • Custom Limits: Set CPU time or subrequest caps on your users’ Workers. Can be used to set limits in order to control your costs on Cloudflare and/or shape your own pricing and packaging model. For example, if you run a freemium model on your platform, you can lower the CPU time limit for customers on your free tier.
  • Tail Workers: Tail Worker events contain metadata about the Worker, console.log() messages, and capture any unhandled exceptions. They can be used to provide your developers with live logging in order to monitor for errors and troubleshoot in real time.
  • Outbound Workers: Get visibility into all outgoing requests from your users’ Workers. Outbound Workers sit between user Workers and the fetch() requests they make, so you get full visibility over the request before it’s sent out to the Internet.

Pricing

We wanted to make sure that Workers for Platforms was affordable for hobbyists, solo developers, and indie developers. Workers for Platforms is part of a new $25 pay-as-you-go plan, and it includes the following:

Included Amounts
Requests 20 million requests/month
+$0.30 per additional million
CPU time 60 million CPU milliseconds/month
+$0.02 per additional million CPU milliseconds
Scripts 1000 scripts
+0.02 per additional script/month

Workers for Platforms will be available to purchase on April 16, 2024!

The Workers for Platforms will be available to purchase under the Workers for Platforms tab on the Cloudflare Dashboard on April 16, 2024.

In the meantime, to learn more about Workers for Platforms, check out our starter project and developer documentation.

Improving Cloudflare Workers and D1 developer experience with Prisma ORM

Post Syndicated from Jon Harrell (Guest Author) original https://blog.cloudflare.com/prisma-orm-and-d1


Working with databases can be difficult. Developers face increasing data complexity and needs beyond simple create, read, update, and delete (CRUD) operations. Unfortunately, these issues also compound on themselves: developers have a harder time iterating in an increasingly complex environment. Cloudflare Workers and D1 help by reducing time spent managing infrastructure and deploying applications, and Prisma provides a great experience for your team to work and interact with data.  

Together, Cloudflare and Prisma make it easier than ever to deploy globally available apps with a focus on developer experience. To further that goal, Prisma Object Relational Mapper (ORM) now natively supports Cloudflare Workers and D1 in Preview. With version 5.12.0 of Prisma ORM you can now interact with your data stored in D1 from your Cloudflare Workers with the convenience of the Prisma Client API. Learn more and try it out now.

What is Prisma?

From writing to debugging, SQL queries take a long time and slow developer productivity. Even before writing queries, modeling tables can quickly become unwieldy, and migrating data is a nerve-wracking process. Prisma ORM looks to resolve all of these issues by providing an intuitive data modeling language, an automated migration workflow, and a developer-friendly and type-safe client for JavaScript and TypeScript, allowing developers to focus on what they enjoy: developing!

Prisma is focused on making working with data easy. Alongside an ORM, Prisma offers Accelerate and Pulse, products built on Cloudflare that cover needs from connection pooling, to query caching, to real-time type-safe database subscriptions.

How to get started with Prisma ORM, Cloudflare Workers, and D1

To get started with Prisma ORM and D1, first create a basic Cloudflare Workers app. This guide will start with the ”Hello World” Worker example app, but any Workers example app will work. If you don’t have a project yet, start by creating a new one. Name your project something memorable, like my-d1-prisma-app and select “Hello World” worker and TypeScript. For now, we will choose to not deploy and will wait until after we have set up D1 and Prisma ORM.

npm create cloudflare@latest

Next, move into your newly created project and make sure that dependencies are installed:

cd my-d1-prisma-app && npm install

After dependencies are installed, we can move on to the D1 setup.

First, create a new D1 database for your app.

npx wrangler d1 create prod-prisma-d1-app
.
.
.

[[d1_databases]]
binding = "DB" # i.e. available in your Worker on env.DB
database_name = "prod-prisma-d1-app"
database_id = "<unique-ID-for-your-database>"

The section starting with [[d1_databases]] is the binding configuration needed in your wrangler.toml for your Worker to communicate with D1. Add that now:

// wrangler.toml
name="my-d1-prisma-app"
main = "src/index.ts"
compatibility_date = "2024-03-20"
compatibility_flags = ["nodejs_compat"]

[[d1_databases]]
binding = "DB" # i.e. available in your Worker on env.DB
database_name = "prod-prisma-d1-app"
database_id = "<unique-ID-for-your-database>"

Your application now has D1 available! Next, add Prisma ORM to manage your queries, schema and migrations! To add Prisma ORM, first make sure the latest version is installed. Prisma ORM versions 5.12.0 and up support Cloudflare Workers and D1.

npm install prisma@latest @prisma/client@latest @prisma/adapter-d1

Now run npx prisma init in order to create the necessary files to start with. Since D1 uses SQLite’s SQL dialect, we set the provider to be sqlite.

npx prisma init --datasource-provider sqlite

This will create a few files, but the one to look at first is your Prisma schema file, available at prisma/schema.prisma

// schema.prisma
// This is your Prisma schema file,
// learn more about it in the docs: https://pris.ly/d/prisma-schema

generator client {
  provider = "prisma-client-js"
}

datasource db {
  provider = "sqlite"
  url  = env("DATABASE_URL")
}

Before you can create any models, first enable the driverAdapters Preview feature. This will allow the Prisma Client to use an adapter to communicate with D1.

// schema.prisma
// This is your Prisma schema file,
// learn more about it in the docs: https://pris.ly/d/prisma-schema

generator client {
  provider = "prisma-client-js"
+ previewFeatures = ["driverAdapters"]
}

datasource db {
  provider = "sqlite"
  url      = env("DATABASE_URL")
}

Now you are ready to create your first model! In this app, you will be creating a “ticker”, a mainstay of many classic Internet sites.

Add a new model to your schema, Visit, which will track that an individual visited your site. A Visit is a simple model that will have a unique ID and the time at which an individual visited your site.

// This is your Prisma schema file,
// learn more about it in the docs: https://pris.ly/d/prisma-schema

generator client {
  provider        = "prisma-client-js"
  previewFeatures = ["driverAdapters"]
}

datasource db {
  provider = "sqlite"
  url      = env("DATABASE_URL")
}

+ model Visit {
+   id        Int      @id @default(autoincrement())
+   visitTime DateTime @default(now())
+ }

Now that you have a schema and a model, let’s create a migration. First use wrangler to generate an empty migration file and prisma migrate to fill it. If prompted, select “yes” to create a migrations folder at the root of your project.

npx wrangler d1 migrations create prod-prisma-d1-app init
 ⛅️ wrangler 3.36.0
-------------------
✔ No migrations folder found. Set `migrations_dir` in wrangler.toml to choose a different path.
Ok to create /path/to/your/project/my-d1-prisma-app/migrations? … yes
✅ Successfully created Migration '0001_init.sql'!

The migration is available for editing here
/path/to/your/project/my-d1-prisma-app/migrations/0001_init.sql
npx prisma migrate diff --script --from-empty --to-schema-datamodel ./prisma/schema.prisma >> migrations/0001_init.sql

The npx prisma migrate diff command takes the difference between your database (which is currently empty) and the Prisma schema. It then saves this difference to a new file in the migrations directory.

// 0001_init.sql
-- Migration number: 0001 	 2024-03-21T22:15:50.184Z
-- CreateTable
CREATE TABLE "Visit" (
    "id" INTEGER NOT NULL PRIMARY KEY AUTOINCREMENT,
    "visitTime" DATETIME NOT NULL DEFAULT CURRENT_TIMESTAMP

Now you can migrate your local and remote D1 database instances using wrangler and re-generate your Prisma Client to begin making queries.

npx wrangler d1 migrations apply prod-prisma-d1-app --local
npx wrangler d1 migrations apply prod-prisma-d1-app --remote
npx prisma generate

Make sure to import PrismaClient and PrismaD1, define the binding for your D1 database, and you’re ready to use Prisma in your application.

// src/index.ts
import { PrismaClient } from "@prisma/client";
import { PrismaD1 } from "@prisma/adapter-d1";

export interface Env {
  DB: D1Database,
}

export default {
  async fetch(request: Request, env: Env, ctx: ExecutionContext): Promise<Response> {
    const adapter = new PrismaD1(env.DB);
    const prisma = new PrismaClient({ adapter });
    const { pathname } = new URL(request.url);

    if (pathname === '/') {
      const numVisitors = await prisma.visit.count();
      return new Response(
        `You have had ${numVisitors} visitors!`
      );
    }

    return new Response('');
  },
};

You may notice that there’s always 0 visitors. Add another route to create a new visitor whenever someone visits the /visit route

// src/index.ts
import { PrismaClient } from "@prisma/client";
import { PrismaD1 } from "@prisma/adapter-d1";

export interface Env {
  DB: D1Database,
}

export default {
  async fetch(request: Request, env: Env, ctx: ExecutionContext): Promise<Response> {
    const adapter = new PrismaD1(env.DB);
    const prisma = new PrismaClient({ adapter });
    const { pathname } = new URL(request.url);

    if (pathname === '/') {
      const numVisitors = await prisma.visit.count();
      return new Response(
        `You have had ${numVisitors} visitors!`
      );
    } else if (pathname === '/visit') {
      const newVisitor = await prisma.visit.create({ data: {} });
      return new Response(
        `You visited at ${newVisitor.visitTime}. Thanks!`
      );
    }

    return new Response('');
  },
};

Your app is now set up to record visits and report how many visitors you have had!

Summary and further reading

We were able to build a simple app easily with Cloudflare Workers, D1 and Prisma ORM, but the benefits don’t stop there! Check the official documentation for information on using Prisma ORM with D1 along with workflows for migrating your data, and even extending the Prisma Client for your specific needs.

Data Anywhere with Pipelines, Event Notifications, and Workflows

Post Syndicated from Matt Silverlock original https://blog.cloudflare.com/data-anywhere-events-pipelines-durable-execution-workflows


Data is fundamental to any real-world application: the database storing your user data and inventory, the analytics tracking sales events and/or error rates, the object storage with your web assets and/or the Parquet files driving your data science team, and the vector database enabling semantic search or AI-powered recommendations for your users.

When we first announced Workers back in 2017, and then Workers KV, Cloudflare R2, and D1, it was obvious that the next big challenge to solve for developers would be in making it easier to ingest, store, and query the data needed to build scalable, full-stack applications.

To that end, as part of our quest to make building stateful, distributed-by-default applications even easier, we’re launching our new Event Notifications service; a preview of our upcoming streaming ingestion product, Pipelines; and a sneak peek into our take on durable execution, Workflows.

Event-based architectures

When you’re writing data — whether that’s new data, changing existing data, or deleting old data — you often want to trigger other, asynchronous work to run in response. That could be processing user-driven uploads, updating search indexes as the underlying data changes, or removing associated rows in your SQL database when content is removed.

In order to make these event-driven workflows far easier to build across Cloudflare, we’re launching the first step towards a wider Event Notifications platform across Cloudflare, starting with notifications support in R2.

You can read more in the deep-dive on Event Notifications for R2, but in a nutshell: you can configure changes to content in any R2 bucket to write directly to a Queue, allowing you to reliably consume those events in a Worker or to pull from compute in a legacy cloud.

Event Notifications for R2 are just the beginning, though. There are many kinds of events you might want to trigger as a developer — these are just some of the event types we’re planning to support:

  • Changes (writes) to key-value pairs in your Workers KV namespaces.
  • Updates to your D1 databases, including changed rows or triggers.
  • Deployments to your Cloudflare Workers

Consuming event notifications from a single Worker is just one approach, though. As you start to consume events, you may want to trigger multi-step workflows that execute reliably, resume from errors or exceptions, and ensure that previous steps aren’t duplicated or repeated unnecessarily. An event notification framework turns out to be just the thing needed to drive a workflow engine that executes durably…

Making it even easier to ingest data

When we launched Cloudflare R2, our object storage service, we knew that supporting the de facto-standard S3 API was critical in order to allow developers to bring the tooling and services they already had over to R2. But the S3 API is designed to be simple: at its core, it provides APIs for upload, download, multipart and metadata operations, and many tools don’t support the S3 API.

What if you want to batch clickstream data from your web services so that it’s efficient (and cost-effective) to query by your analytics team? Or partition data by customer ID, merchant ID, or locale within a structured data format like JSON?

Well, we want to help solve this problem too, and so we’re announcing Pipelines, an upcoming streaming ingestion service designed to ingest data at scale, aggregate it, and write it directly to R2, without you having to manage infrastructure, partitions, runners, or worry about durability.

With Pipelines, creating a globally scalable ingestion endpoint that can ingest tens-of-thousands of events per second doesn’t require any code:

$ wrangler pipelines create clickstream-ingest-prod --batch-size="1MB" --batch-timeout-secs=120 --batch-on-json-key=".merchantId" --destination-bucket="prod-cs-data"

✅ Successfully created new pipeline "clickstream-ingest-prod"
📥 Created endpoints:
➡ HTTPS: https://d458dbe698b8eef41837f941d73bc5b3.pipelines.cloudflarestorage.com/clickstream-ingest-prod
➡ WebSocket: wss://d458dbe698b8eef41837f941d73bc5b3.pipelines.cloudflarestorage.com:8443/clickstream-ingest-prod
➡ Kafka: d458dbe698b8eef41837f941d73bc5b3.pipelines.cloudflarestorage.com:9092 (topic: clickstream-ingest-prod)

As you can see here, we’re already thinking about how to make Pipelines protocol-agnostic: write from a HTTP client, stream events over a WebSocket, and/or redirect your existing Kafka producer (and stop having to manage and scale Kafka) directly to Pipelines.

But that’s just the beginning of our vision here. Scalable ingestion and simple batching is one thing, but what about if you have more complex needs? Well, we have a massively scalable compute platform (Cloudflare Workers) that can help address this too.

The code below is just an initial exploration for how we’re thinking about an API for running transforms over streaming data. If you’re aware of projects like Apache Beam or Flink, this programming model might even look familiar:

export default {    
   // Pipeline handler is invoked when batch criteria are met
   async pipeline(stream: StreamPipeline, env: Env, ctx: ExecutionContext): Promise<StreamingPipeline> {
      // ...
      return stream
         // Type: transform(label: string, transformFunc: TransformFunction): Promise<StreamPipeline>
         // Each transform has a label that is used in metrics to provide
    // per-transform observability and debugging
         .transform("human readable label", (events: Array<StreamEvent>) => {
            return events.map((e) => ...)
         })
         .transform("another transform", (events: Array<StreamEvent>) => {
            return events.map((e) => ...)
         })
         .writeToR2({
            format: "json",
            bucket: "MY_BUCKET_NAME",
            prefix: somePrefix,
            batchSize: "10MB"
         })
   }
}

Specifically:

  • The Worker describes a pipeline of transformations (mapping, reducing, filtering) that operates over each subset of events (records)
  • You can call out to other services — including D1 or KV — in order to synchronously or asynchronously hydrate data or lookup values during your stream processing
  • We take care of scaling horizontally based on records-per-second and/or any concurrency settings you configure based on processing latency requirements.

We’ll be bringing Pipelines into open beta later in 2024, and it will initially launch with support for HTTP ingestion and R2 as a destination (sink), but we’re already thinking bigger.

We’ll be sharing more as Pipelines gets closer to release. In the meantime, you can register your interest and share your use-case, and we’ll reach out when Pipelines reaches open beta.

Durable Execution

If the term “Durable Execution” is new to you, don’t worry: the term comes from the desire to run applications that can resume execution from where they left off, even if the underlying host or compute fails (where the “durable” part comes from).

As we’ve continued to build out our data and AI platforms, we’ve been acutely aware that developers need ways to create reliable, repeatable workflows that operate over that data, turn unstructured data into structured data, trigger on fresh data (or periodically), and automatically retry, restart, and export metrics for each step along the way. The industry calls this Durable Execution: we’re just calling it Workflows.

What makes Workflows different from other takes on Durable Execution is that we provide the underlying compute as part of the platform. You don’t have to bring-your-own compute, or worry about scaling it or provisioning it in the right locations. Workflows runs on top of Cloudflare Workers – you write the workflow, and we take care of the rest.

Here’s an early example of writing a Workflow that generates text embeddings using Workers AI and stores them (ready to query) in Vectorize as new content is written to (or updated within) R2.

  • Each Workflow run is triggered by an Event Notification consumed from a Queue, but could also be triggered by a HTTP request, another Worker, or even scheduled on a timer.
  • Individual steps within the Workflow allow us to define individually retriable units of work: in this case, we’re reading the new objects from R2, creating text embeddings using Workers AI, and then inserting.
  • State is durably persisted between steps: each step can emit state, and Workflows will automatically persist that so that any underlying failures, uncaught exceptions or network retries can resume execution from the last successful step.
  • Every call to step() automatically emits metrics associated with the unique Workflow run, making it easier to debug within each step and/or break down your application into its smallest units of execution, without having to worry about observability.

Step-by-step, it looks like this:

Transforming this series of steps into real code, here’s what this would look like with Workflows:

import { Ai } from "@cloudflare/ai";
import { Workflow } from "cloudflare:workers";

export interface Env {
  R2: R2Bucket;
  AI: any;
  VECTOR_INDEX: VectorizeIndex;
}

export default class extends Workflow {
  async run(event: Event) {
    const ai = new Ai(this.env.AI);

    // List of keys to fetch from our incoming event notification
    const keysToFetch = event.messages.map((val) => {
      return val.object.key;
    });

    // The return value of each step is stored (the "durable" part
    // of "durable execution")
    // This ensures that state can be persisted between steps, reducing
    // the need to recompute results ($$, time) should subsequent
    // steps fail.
    const inputs = await this.ctx.run(
      // Each step has a user-defined label
      // Metrics are emitted as each step runs (to success or failure)
// with this label attached and available within per-Workflow
// analytics in near-real-time.
"read objects from R2", async () => {
      const objects = [];

      for (const key of keysToFetch) {
        const object = await this.env.R2.get(key);
        objects.push(await object.text());
      }

      return objects;
    });


    // Persist the output of this step.
    const embeddings = await this.ctx.run(
      "generate embeddings",
      async () => {
        const { data } = await ai.run("@cf/baai/bge-small-en-v1.5", {
          text: inputs,
        });

        if (data.length) {
          return data;
        } else {
          // Uncaught exceptions trigger an automatic retry of the step
          // Retries and timeouts have sane defaults and can be overridden
    // per step
          throw new Error("Failed to generate embeddings");
        }
      },
      {
        retries: {
          limit: 5,
          delayMs: 1000,
          backoff: "exponential",
        },
      }
    );

    await this.ctx.run("insert vectors", async () => {
      const vectors = [];

      keysToFetch.forEach((key, index) => {
        vectors.push({
          id: crypto.randomUUID(),
          // Our embeddings from the previous step
          values: embeddings[index].values, 
          // The path to each R2 object to map back to during
 	    // vector search
          metadata: { r2Path: key },
        });
      });

      return this.env.VECTOR_INDEX.upsert();
    });
  }
}

This is just one example of what a Workflow can do. The ability to durably execute an application, modeled as a series of steps, applies to a wide number of domains. You can apply this model of execution to a number of use-cases, including:

  • Deploying software: each step can define a build step and subsequent health check, gating further progress until your deployment meets your criteria for “healthy”.
  • Post-processing user data: triggering a workflow based on user uploads (e.g. to Cloudflare R2) that then subsequently parses that data asynchronously, redacts PII or sensitive data, writes the sanitized output, and triggers a notification via email, webhook, or mobile push.
  • Payment and batch workflows: aggregating raw customer usage data on a periodic schedule by querying your data warehouse (or Workers Analytics Engine), triggering usage or spend alerts, and/or generating PDF invoices.

Each of these use cases model tasks that you want to run to completion, minimize redundant retries by persisting intermediate state, and (importantly) easily observe success and failure.

We’ll be sharing more about Workflows during the second quarter of 2024 as we work towards an open (public!) beta. This includes how we’re thinking about idempotency and interactions with our storage, per-instance observability and metrics, local development, and templates to bootstrap common workflows.

Putting it together

We’ve often thought of Cloudflare’s own network as one massively scalable parallel data processing cluster: data centers in 310+ cities, with the ability to run compute close to users and/or close to data, keep it within the bounds of regulatory or compliance requirements, and most importantly, use our massive scale to enable our customers to scale as well.

Recapping, a fully-fledged data platform needs to enable three things:

  1. Ingesting data: getting data into the platform (in the right format, from the right sources)
  2. Storing data: securely, reliably, and durably.
  3. Querying data: understanding and extracting insights from the data, and/or transforming it for use by other tools.

When we launched R2 we tackled the second part, but knew that we’d need to follow up with the first and third parts in order to make it easier for developers to get data in and make use of it.

If we look at how we can build a system that helps us solve each of these three parts together with Pipelines, Event Notifications, R2, and Workflows, we end up with an architecture that resembles this:

Specifically, we have Pipelines (1) scaling out to ingest data, batch it, filter it, and then durably store it in R2 (2) in a format that’s ready and optimized for querying. Workflows, ClickHouse, Databricks, or the query engine of your choice can then query (3) that data as soon as it’s ready — with “ready” being automatically triggered by an Event Notification as soon as the data is ingested and written to R2.

There’s no need to poll, no need to batch after the fact, no need to have your query engine slow down on data that wasn’t pre-aggregated or filtered, and no need to manage and scale infrastructure in order to keep up with load or data jurisdiction requirements. Create a Pipeline, write your data directly to R2, and query directly from it.

If you’re also looking at this and wondering about the costs of moving this data around, then we’re holding to one important principle: zero egress fees across all of our data products. Just as we set the stage for this with our R2 object storage, we intend to apply this to every data product we’re building, Pipelines included.

Start Building

We’ve shared a lot of what we’re building so that developers have an opportunity to provide feedback (including via our Developer Discord), share use-cases, and think about how to build their next application on Cloudflare.

R2 adds event notifications, support for migrations from Google Cloud Storage, and an infrequent access storage tier

Post Syndicated from Matt DeBoard original https://blog.cloudflare.com/r2-events-gcs-migration-infrequent-access


We’re excited to announce three new features for Cloudflare R2, our zero egress fee object storage platform:

Event Notifications Open Beta

The lifecycle of data often doesn’t stop immediately after upload to an R2 bucket – event data may need to be transformed and loaded into a data warehouse, media files may need to go through a post-processing step, etc. We’re releasing event notifications for R2 in open beta to enable building applications and workflows driven by your changing data.

Event notifications work by sending messages to your queue each time there is a change to your data. These messages are then received by a consumer Worker where you can then define any subsequent action that needs to be taken.

To get started enabling event notifications on your R2 bucket, you can run the following Wrangler command (replacing bucket_name and queue_name with your bucket and queue names respectively):

wrangler r2 bucket notification create <bucket_name> --event-type object-create --queue <queue_name>

For more information on how to set up event notifications on your R2 buckets today and limitations during beta, please refer to the documentation.

Super Slurper for Google Cloud Storage

Super Slurper can now migrate data from Google Cloud Storage (GCS) to Cloudflare R2. We released Super Slurper last year with the goal of making one-time comprehensive data migrations fast, reliable, and easy: there’s no need to spin up migration VMs and implement complicated retry logic. Since then, thousands of developers have used Super Slurper to migrate petabytes of data from AWS S3 to R2. Now Google Cloud Storage customers can migrate data to Cloudflare R2 to benefit from Cloudflare’s zero egress fees, whether you are permanently moving data to another provider or not.

To get started migrating data from GCS:

  1. From the Cloudflare dashboard, select R2 > Data Migration.
  2. Select Migrate files.
  3. Select Google Cloud Storage for the source bucket provider.
  4. Enter your bucket name and associated credentials and select Next.
  5. Enter your R2 bucket name and associated credentials and select Next.
  6. After you finish reviewing the details of your migration, select Migrate files.

You can view the status of your migration job at any time on the dashboard. For more information on how to use Super Slurper, please refer to the documentation here.

Infrequent Access Private Beta

We’re excited to introduce the private beta of our new Infrequent Access storage class. For use cases that involve data that isn’t frequently accessed (long tail user-generated content, logs, etc), Infrequent Access gives you the ability to pay less for storage while maintaining performance and durability.

Here’s an example of how you can upload an object to your R2 bucket with the new Infrequent Access storage class using Workers:

# wrangler.toml
[[r2_buckets]]
binding = 'MY_BUCKET'
bucket_name = '<YOUR_BUCKET_NAME>'

# index.ts
export default {
   async fetch(request: Request, env: Env): Promise<Response> {
      if (request.method === "PUT") {
         await env.MY_BUCKET.put("myobject", request.body, storageClass: "InfrequentAccess");
         return new Response("Put object successfully!");
      }
      return new Response("Not a PUT!");
   }
}

In addition to uploading objects directly to Infrequent Access, you can define an object lifecycle policy to move data to Infrequent Access after a period of time goes by and you no longer need to access your data as often. In the future, we plan to automatically optimize storage classes for data so you can avoid manually creating rules and better adapt to changing data access patterns.

For data stored in the Infrequent Access storage class, the pricing components will be similar to what you’re used to with R2: storage, Class A operations (writes, lists), Class B operations (reads), and data retrieval (processing). Data retrieval is charged per GB when data in the Infrequent Access storage class is retrieved and is what allows us to provide storage at a lower price. It reflects the additional computational resources required to fetch data from underlying storage optimized for less frequent access. And when the time comes, and you do need to use your data, there are still no egress fees.

Component Price
Storage $0.01 / GB-month
Class A Operations $9.00 / million requests
Class B Operations $0.90 / million requests
Data Retrieval (Processing) $0.01 / GB
Egress (or Data Transfer) $0 – No Charge

Are you interested in participating in the private beta for Infrequent Access?

Join the private beta waitlist to get access.

Have any feedback?

We would love to hear from you! To share your feedback about R2 and our data migration services, please join the Cloudflare Developer Discord. If you’re interested in learning more about R2, get started by visiting R2’s developer documentation or see how much you could save with our pricing calculator.

How Picsart leverages Cloudflare’s Developer Platform to build globally performant services

Post Syndicated from Mark Dembo original https://blog.cloudflare.com/picsart-move-to-workers-huge-performance-gains


Delivering great user experiences with a global user base can be challenging. While serving requests quickly when you start out in a local market is straightforward, doing so for a global audience is much more difficult. Why? Even under optimal conditions, you cannot be faster than the speed of light, which brings single data center solutions to their performance limits.

In this post, we will cover how Picsart improved the performance of one of its most critical services by moving from a centralized architecture to a globally distributed service built on Cloudflare. Our serverless compute platform, Workers, distributed throughout 310+ cities around the world, and our globally distributed Workers KV storage allowed them to improve their performance significantly and drive real business impact.

Success driven by data-driven insights

Picsart is one of the world’s largest digital creation platforms and a long-standing Cloudflare partner. At its core, an advanced tech stack powers its comprehensive features, including AI-driven photo and video editing tools and community-driven content sharing. With its infrastructure spanning across multiple cloud environments and on-prem deployments, Picsart is engineered to handle billions of daily requests from its huge mobile and web user base and API integrations. For over a decade, Cloudflare has been integral to Picsart, providing support for performant content delivery and securing its digital ecosystem.  

Similar to many other tech giants, Picsart approaches product development in a data-driven way. At the core of the innovation is Picsart’s remote configuration and experimentation platform, which enables product managers, UX researchers, and others to segment their user base into different test groups. These test groups might get to see slightly different implementations of features or designs of the Picsart app. Users might also get early access to experimental features or see different in-app promotions. In combination with constant monitoring of relevant KPIs, this allows for informed product decisions based on user preference and business impact.

On each app start, the client device sends a request to the remote configuration service for the latest setup tailored to the user’s session. The assignment of experiments relies on factors like the operating system and previous sessions, making each request unique and uncachable. Picsart’s app showcases extensive remote configuration capabilities, enabling adjustments to nearly every element. This results in a response containing a 1.5 MB configuration file for mobile clients. While the long-term solution is to reduce the file size, which has grown over time as more teams adopted the powerful service, this is not possible in the near or mid-term as it requires a major rewrite of all clients.

This setup request is blocking in the “hot path” during app start, as the results of this request will decide how the app itself looks and behaves. Hence, performance is critical. To ensure users are not waiting for too long, Picsart apps will wait for 1500ms on mobile for the request to complete – if it does not, the user will not be assigned a test group and the app will fallback to default settings.

The clock is ticking

While a 1500ms round trip time seems like a sufficiently large time budget, the data suggested otherwise. Before the improvements were implemented, a staggering 50% of devices could not complete the requests in time. How come? In these 1.5 seconds the following steps need to complete:

  1. The request must travel from the users’ devices to the centralized backend servers
  2. The server processes the request based on dozens of user attributes provided in the request and thousands of defined remote configuration variations, running experiments, and segments metadata. Using all the info, the server selects the right variation of each remote setting entry and builds the response payload.
  3. The response must travel from the centralized backend servers to the user devices.

Looking at the data, it was clear to the Picsart team that their backend service was already well-optimized, taking only 30 milliseconds, a tiny fraction of the available time budget, to process each of the billions of monthly requests. The bulk of the request time came from network latency. Especially with mobile devices, last mile performance can be very volatile, eating away a significant amount of the available time budget. Not only that, but the data was clear: users closer to the origin server had a much higher chance of making the round trip in time versus users out of region. It quickly became obvious that Picsart, fueled by its global success, had outgrown a single-region setup.

To the drawing board

A solution that comes to mind would be to replicate the existing cloud infrastructure in multiple regions and use global load balancing to minimize the distance a request needs to travel. However, this introduces significant overhead and cost. On the infrastructure side, it is not only the additional compute instances and database clusters that incur cost, but also cross-region data transfer to keep data in sync. Moreover, technical teams would need to operate and monitor infrastructure in multiple regions, which can add a lot to the complexity and cognitive load, leading to decreased development velocity and productivity loss.

Picsart instead looked to Cloudflare – we already had a long-lasting relationship for Application Performance and Security, and they aimed to use our Developer Platform to tackle the problem.

Workers and Workers KV seemed like the ideal solution. Both compute and data are globally distributed in 310+ locations around the world, resulting in a shorter distance between end users and the experimentation service. Not only that, but Cloudflare’s global-by-default approach allows for deployment with minimal overhead, and in contrast to other considered solutions, no additional fees to distribute the data around the globe.

No race without a clock

The objective for the refactor of the experimentation service was to increase the share of devices that successfully receive experimentation configuration within the set time budget.

But how to measure success? While synthetic testing can be useful in many situations, Picsart opted to come up with another clever solution:

During development, the Picsart engineers had already added a testing endpoint to the web and mobile versions of their app that sends a duplicate request to the new endpoint, discarding the response and swallowing all potential errors. This allows them to collect timing data based on real-user metrics without impacting the app’s performance and reliability.

A simplified version of this pattern for a web client could look like this:

// API endpoint URLs
const prodUrl = 'https://prod.example.com/';
const devUrl = 'https://new.example.com/';

// Function to collect metrics
const collectMetrics = (duration) => {
    console.log('Request duration:', duration);
    // …
};

// Function to fetch data from an endpoint and call collectMetrics
const fetchData = async (url, options) => {
    const startTime = performance.now();
    
    try {
        const response = await fetch(url, options);
        const endTime = performance.now();
        const duration = endTime - startTime;
        collectMetrics(duration);
        return await response.json();
    } catch (error) {
        console.error('Error fetching data:', error);
    }
};

// Fetching data from both endpoints
async function fetchDataFromBothEndpoints() {
    try {
        const result1 = await fetchData(prodUrl, { method: 'POST', ... });
        console.log('Result from endpoint 1:', result1);

        // Fetching data from the second endpoint without awaiting its completion
        fetchData(devUrl, { method: 'POST', ... });
    } catch (error) {
        console.error('Error fetching data from both endpoints:', error);
    }
}

fetchDataFromBothEndpoints();

Using existing data analytics tools, Picsart was able to analyze the performance of the new services from day one, starting with a dummy endpoint and a ‘hello world’ response. And with that a v0 was created that did not have the correct logic just yet, but simulated reading multiple values from KV and returning a response of a realistic size back to the end user.

The need for a do-over

In the initial phase, outcomes fell short of expectations. Surprisingly, requests were slower despite the service’s proximity to end users. What caused this setback?  Subsequent investigation unveiled multiple culprits and design patterns in need for optimization.

Data segmentation

The previous, stateful solution operated on a single massive “blob” of data exceeding 100MB in value. Loading this into memory incurred a few seconds of initial startup time, but once the VM completed the task, request handling was fast, benefiting from the readily available data in memory.

However, this approach doesn’t seamlessly transition to the serverless realm. Unlike long-running VMs, Worker isolates have short lifespans. Repeatedly parsing large JSON objects led to prolonged compute durations. Simply parsing four KV entries of 25MB each (KV maximum value size is 25MB) on each request was not a feasible option.

The Picsart team went back to solution design and embarked on a journey to optimize their system’s execution time, resulting in a series of impactful improvements.

The fundamental insight that guided the solution was the unnecessary overhead that was involved in loading and parsing data irrelevant to the user’s specific context. The 100MB configuration file contained configurations for all platforms and locations worldwide – a setup that was far from efficient in a globally distributed, serverless compute environment. For instance, when processing requests from users in the United States, there was no need to fetch configurations targeted for users in other countries, or for different platforms.

To address this inefficiency, the Picsart team stored the configuration of each platform and country in separate KV records. This targeted strategy meant that for a request originating from a US user on an Android device, our system would only fetch and parse the KV record specific to Android users in the US, thereby excluding all irrelevant data. This resulted in approximately 600 KV records, each with a maximum size of 10MB. While this leads to data duplication on the KV storage side, it decreases the amount of data that needs to be parsed upon request. As Cloudflare operates in over 120 countries around the world, only a subset of records were needed in each location. Hence, the increase in cardinality had minimal impact on KV cache performance, as demonstrated by more than 99.5% of KV reads being served from local cache.

Key Size
settings_part1.json 25MB
settings_part2.json 25MB
… ….

Before (simplified)

Key Size
com.picsart.studio_apple_us.json 6.1MB
com.picsart.studio_apple_de.json 6.1MB
com.picsart.studio_android_us.json 5.9MB
… …

After (simplified)

This approach was a significant move for Picsart as they transitioned from a regional cloud setup to Cloudflare’s globally distributed connectivity cloud. By serving data from close proximity to end user locations, they were able to combat the high network latency from their previous setup. This strategy radically transformed the data-handling process. which unlocked two major benefits:

  • Performance Gains: By ensuring that only the relevant subset of data is fetched and parsed based on the user’s platform and geographical location, wall time and compute resources required for these operations could be significantly reduced.
  • Scalability and Flexibility: the granular segmentation of data enables effortless scaling of the service for new features or regional content. Adding support for new applications now only requires inserting new, standalone KV records in contrast to the previous solution where this would require increasing the size of the single record.

Immutable updates

Now that changes to the configuration were segmented by app, country, and platform, this also allowed for individual updates of the configuration in KV. KV storage showcases its best performance when records are updated infrequently but read very often. This pattern leverages KV’s fundamental design to cache values at edge locations upon reads, ensuring that subsequent queries for the same record are swiftly served by local caches rather than requiring a trip back to KV’s centralized data centers. This architecture is fundamental for minimizing latency and maximizing the speed of data retrieval across a globally distributed platform.

A crucial requirement for Picsart’s experimentation system was the ability to propagate updates of remote configuration values immediately. Updating existing records would require very short cache TTLs and even the minimum KV cache TTL of 60 seconds was considered unacceptable for the dynamic nature of the feature flagging. Moreover, setting short TTLs also impacts the cache hit ratio and the overall KV performance, specifically in regions with low traffic.

To reconcile the need for both rapid updates and efficient caching, Picsart adopted an innovative approach: making KV records immutable. Instead of modifying existing records, they opted to create new records with each configuration change. By appending the content hash to the KV key and writing new records after each update, Picsart ensured that each record was unique and immutable. This allowed them to leverage higher cache TTLs, as these records would never be updated.

Key Size
com.picsart.studio_apple_us.json 60s
… ….

Before (simplified)

Key Size
com.picsart.studio_apple_us_b58b59.json 86400s
com.picsart.studio_apple_us_273678.json 86400s
– …

After (simplified)

There was a catch, though. The service must now keep track of the correct KV keys to use. The Picsart team addressed this challenge by storing references to the latest KV keys in the environment variables of the Worker.

Each configuration change triggers a new KV pair to be written and the services’ environment variables to be updated. As global Workers deployments take mere seconds, changes to the experimentation and configuration data are near-instantaneously globally available.

JSON serialization & alternatives

Following the previous improvements, the Picsart team made another significant discovery: only a small fraction of configuration data is needed to assign the experiments, while the remaining majority of the data comprises JSON values for the remote configuration payloads. While the service must deliver the latter in the response, the data is not required during the initial processing phase.

The initial implementation used KV’s get() method to retrieve the configuration data with the parameter type=json, which converts the KV value to an object. This process is very compute-intensive compared to using the get() method with parameter type= text, which simply returns the value as a string. In the context of Picsart’s data, the bulk of the CPU cycles were wasted on serializing JSON data that is not needed to perform the required business logic.

What if the data structure and code could be changed in such a way that only the data needed to assign experiments was parsed as JSON, while the configuration values were treated as text? Picsart went ahead with a new approach: splitting the KV records into two, creating a small 300KB record for the metadata, which can be quickly parsed to an object, and a 9.7MB record of configuration values. The extracted configuration values are delimited by newline characters. The respective line number is used as reference in the metadata entry, so that the respective configuration value for an experiment can be merged back into the payload response later.


{
  "name": "shape_replace_items",
  "default_value": "<large json object>",
  "segments": [
    {
      "id": "f1244",
      "value": "<Another json object
json object>"
    },
    {
      "id": "a2lfd",
      "value": "<Yet another large json
object>"
    }
  ]
}
Before: Metadata and Values in one JSON object (simplified)

// com.picsart.studio_apple_am_metadata

1 {
2   "name": "shape_replace_items",
3   "default_value": 1,
4   "segments": [
5     {
6       "id": "f1244",
7       "value": 2
8     },
9     {
10       "id": "a2lfd",
11      "value": 3
12     }
13   ]
14 }


// com.picsart.studio_apple_am_values

1 "<large json object>"
2 "<Another json object>"
3 "<Yet another json object>"

After: Metadata and Values are split (simplified)

After calculating the experiments and selecting the correct variants based solely on the small metadata entry, the service constructs a JSON string for the response containing placeholders for the actual values that reference the corresponding line numbers in the separate text file. To finalize the response, the server replaces the placeholders with the corresponding serialized JSON strings from the text file. This approach circumvents the need for parsing and re-serializing large JSON objects and helps to avoid a significant computational overhead.

Note that the process of parsing the metadata JSON and determining the correct experiments as well as the loading of the large file with configuration values are executed in parallel, saving additional milliseconds.

By minimizing the size of the JSON data that needed to be parsed and leveraging a more efficient method for constructing the final response, the Picsart team managed to not only reduce the response times but also optimize the compute resource usage. This approach reflects a broader principle applicable across the tech industry: that efficiency, particularly in serverless architectures, can often be dramatically improved by rethinking data structure and utilization.

Getting a head start

The changes on the server-side, moving from a single region setup to Cloudflare’s global architecture, paid off massively. Median response times globally dropped by more than 1 second, which was already a huge improvement for the team. However, in looking at the new data, two more paths for client-side optimizations were found.

As the web and mobile app would call the service at startup, most of the time no active connections to the servers were alive and establishing that connection at request time costs valuable milliseconds.

For the web version, setting a pre-connect header on initial page load showed a positive impact. For the mobile app version, the Picsart team took it a step further. Investigation showed that before the connection could be established, three modules had to complete initialization: the error tracker, the HTTP client, and the SDK. Reordering of the modules to initialize the HTTP client first allowed for connection establishment in parallel to the initialization of the SDK and error tracker, again saving time. This resulted in another 200ms improvement for end users.

Setting a new personal best

The day had come and it was time for the phased rollout, web first and the mobile apps second. With suspense, the team looked at the dashboards, and were pleasantly surprised. The rollout was successful and billions of requests were handled with ease.

Share of successfully delivered experiments

The result? The Picsart apps are loading faster than ever for millions of users worldwide, while the share of successfully delivered experiments increased from 50% to 85%. Median response time dropped from 1500 ms to 280 ms. The response time dropped to 70 ms on the web since the response size is smaller compared to mobile. This translates to a real business impact for Picsart as they can now deliver more personalized and data-driven experiences to even more of their users.

A bright future ahead

Picsart is already thinking of the next generation of experimentation. To integrate with Cloudflare even further, the plan is to use Durable Objects to store hundreds of millions of user data records in a decentralized fashion, enabling even more powerful experiments without impacting performance. This is possible thanks to Durable Objects’ underlying architecture that stores the user data in-region, close to the respective end user device.

Beyond that, Picsart’s experimentation team is also planning to onboard external B2B customers to their experimentation platform as Cloudflare’s developer platform provides them with the scale and global network to handle more traffic and data with ease.

Get started yourself

If you’re also working on or with an application that would benefit from Cloudflare’s speed and scale, check out our developer documentation and tutorials, and join our developer Discord to get community support and inspiration.

Running fine-tuned models on Workers AI with LoRAs

Post Syndicated from Michelle Chen original https://blog.cloudflare.com/fine-tuned-inference-with-loras


Inference from fine-tuned LLMs with LoRAs is now in open beta

Today, we’re excited to announce that you can now run fine-tuned inference with LoRAs on Workers AI. This feature is in open beta and available for pre-trained LoRA adapters to be used with Mistral, Gemma, or Llama 2, with some limitations. Take a look at our product announcements blog post to get a high-level overview of our Bring Your Own (BYO) LoRAs feature.

In this post, we’ll do a deep dive into what fine-tuning and LoRAs are, show you how to use it on our Workers AI platform, and then delve into the technical details of how we implemented it on our platform.

What is fine-tuning?

Fine-tuning is a general term for modifying an AI model by continuing to train it with additional data. The goal of fine-tuning is to increase the probability that a generation is similar to your dataset. Training a model from scratch is not practical for many use cases given how expensive and time consuming they can be to train. By fine-tuning an existing pre-trained model, you benefit from its capabilities while also accomplishing your desired task. Low-Rank Adaptation (LoRA) is a specific fine-tuning method that can be applied to various model architectures, not just LLMs. It is common that the pre-trained model weights are directly modified or fused with additional fine-tune weights in traditional fine-tuning methods. LoRA, on the other hand, allows for the fine-tune weights and pre-trained model to remain separate, and for the pre-trained model to remain unchanged. The end result is that you can train models to be more accurate  at specific tasks, such as generating code, having a specific personality, or generating images in a specific style. You can even fine-tune an existing LLM to understand additional information about a specific topic.

The approach of maintaining the original base model weights means that you can create new fine-tune weights with relatively little compute. You can take advantage of existing foundational models (such as Llama, Mistral, and Gemma), and adapt them for your needs.

How does fine-tuning work?

To better understand fine-tuning and why LoRA is so effective, we have to take a step back to understand how AI models work. AI models (like LLMs) are neural networks that are trained through deep learning techniques. In neural networks, there are a set of parameters that act as a mathematical representation of the model’s domain knowledge, made up of weights and biases – in simple terms, numbers. These parameters are usually represented as large matrices of numbers. The more parameters a model has, the larger the model is, so when you see models like llama-2-7b, you can read “7b” and know that the model has 7 billion parameters.

A model’s parameters define its behavior. When you train a model from scratch, these parameters usually start off as random numbers. As you train the model on a dataset, these parameters get adjusted bit-by-bit until the model reflects the dataset and exhibits the right behavior. Some parameters will be more important than others, so we apply a weight and use it to show more or less importance. Weights play a crucial role in the model’s ability to capture patterns and relationships in the data it is trained on.

Traditional fine-tuning will adjust all the parameters in the trained model with a new set of weights. As such, a fine-tuned model requires us to serve the same amount of parameters as the original model, which means it can take a lot of time and compute to train and run inference for a fully fine-tuned model. On top of that, new state-of-the-art models, or versions of existing models, are regularly released, meaning that fully fine-tuned models can become costly to train, maintain, and store.

LoRA is an efficient method of fine-tuning

In the simplest terms, LoRA avoids adjusting parameters in a pre-trained model and instead allows us to apply a small number of additional parameters. These additional parameters are applied temporarily to the base model to effectively control model behavior. Relative to traditional fine-tuning methods it takes a lot less time and compute to train these additional parameters, which are referred to as a LoRA adapter. After training, we package up the LoRA adapter as a separate model file that can then plug in to the base model it was trained from. A fully fine-tuned model can be tens of gigabytes in size, while these adapters are usually just a few megabytes. This makes it a lot easier to distribute, and serving fine-tuned inference with LoRA only adds ms of latency to total inference time.

If you’re curious to understand why LoRA is so effective, buckle up — we first have to go through a brief lesson on linear algebra. If that’s not a term you’ve thought about since university, don’t worry, we’ll walk you through it.

Show me the math

With traditional fine-tuning, we can take the weights of a model (W0) and tweak them to output a new set of weights — so the difference between the original model weights and the new weights is ΔW, representing the change in weights. Therefore, a tuned model will have a new set of weights which can be represented as the original model weights plus the change in weights, W0 + ΔW.

Remember, all of these model weights are actually represented as large matrices of numbers. In math, every matrix has a property called rank (r), which describes the number of linearly independent columns or rows in a matrix. When matrices are low-rank, they have only a few columns or rows that are “important”, so we can actually decompose or split them into two smaller matrices with the most important parameters  (think of it like factoring in algebra). This technique is called rank decomposition, which allows us to greatly reduce and simplify matrices while keeping the most important bits. In the context of fine-tuning, rank determines how many parameters get changed from the original model – the higher the rank, the stronger the fine-tune, giving you more granularity over the output.

According to the original LoRA paper, researchers have found that when a model is low-rank, the matrix representing the change in weights is also low-rank. Therefore, we can apply rank decomposition to our matrix representing the change in weights ΔW to create two smaller matrices A, B, where ΔW = BA. Now, the change in the model can be represented by two smaller low-rank matrices. This is why this method of fine-tuning is called Low-Rank Adaptation.

When we run inference, we only need the smaller matrices A, B to change the behavior of the model. The model weights in A, B constitute our LoRA adapter (along with a config file). At runtime, we add the model weights together, combining the original model (W0) and the LoRA adapter (A, B). Adding and subtracting are simple mathematical operations, meaning that we can quickly swap out different LoRA adapters by adding and subtracting A, B from W0.. By temporarily adjusting the weights of the original model, we modify the model’s behavior and output and as a result, we get fine-tuned inference with minimal added latency.

According to the original LoRA paper, “LoRA can reduce the number of trainable parameters by 10,000 times and the GPU memory requirement by 3 times”. Because of this, LoRA is one of the most popular methods of fine-tuning since it’s a lot less computationally expensive than a fully fine-tuned model, doesn’t add any material inference time, and is much smaller and portable.

How can you use LoRAs with Workers AI?

Workers AI is very well-suited to run LoRAs because of the way we run serverless inference. The models in our catalog are always pre-loaded on our GPUs, meaning that we keep them warm so that your requests never encounter a cold start. This means that the base model is always available, and we can dynamically load and swap out LoRA adapters as needed. We can actually plug in multiple LoRA adapters to one base model, so we can serve multiple different fine-tuned inference requests at once.

When you fine-tune with LoRA, your output will be two files: your custom model weights (in safetensors format) and an adapter config file (in json format). To create these weights yourself, you can train a LoRA on your own data using the Hugging Face PEFT (Parameter-Efficient Fine-Tuning) library combined with the Hugging Face AutoTrain LLM library. You can also run your training tasks on services such as Auto Train and Google Colab. Alternatively, there are many open-source LoRA adapters available on Hugging Face today that cover a variety of use cases.

Eventually, we want to support the LoRA training workloads on our platform, but we’ll need you to bring your trained LoRA adapters to Workers AI today, which is why we’re calling this feature Bring Your Own (BYO) LoRAs.

For the initial open beta release, we are allowing people to use LoRAs with our Mistral, Llama, and Gemma models. We have set aside versions of these models which accept LoRAs, which you can access by appending -lora to the end of the model name. Your adapter must have been fine-tuned from one of our supported base models listed below:

  • @cf/meta-llama/llama-2-7b-chat-hf-lora
  • @cf/mistral/mistral-7b-instruct-v0.2-lora
  • @cf/google/gemma-2b-it-lora
  • @cf/google/gemma-7b-it-lora

As we are launching this feature in open beta, we have some limitations today to take note of: quantized LoRA models are not yet supported, LoRA adapters must be smaller than 100MB and have up to a max rank of 8, and you can try up to 30 LoRAs per account during our initial open beta. To get started with LoRAs on Workers AI, read the Developer Docs.

As always, we expect people to use Workers AI and our new BYO LoRA feature with our Terms of Service in mind, including any model-specific restrictions on use contained in the models’ license terms.

How did we build multi-tenant LoRA serving?

Serving multiple LoRA models simultaneously poses a challenge in terms of GPU resource utilization. While it is possible to batch inference requests to a base model, it is much more challenging to batch requests with the added complexity of serving unique LoRA adapters. To tackle this problem, we leverage the Punica CUDA kernel design in combination with global cache optimizations in order to handle the memory intensive workload of multi-tenant LoRA serving while offering low inference latency.

The Punica CUDA kernel was introduced in the paper Punica: Multi-Tenant LoRA Serving as a method to serve multiple, significantly different LoRA models applied to the same base model. In comparison to previous inference techniques, the method offers substantial throughput and latency improvements. This optimization is achieved in part through enabling request batching even across requests serving different LoRA adapters.

The core of the Punica kernel system is a new CUDA kernel called Segmented Gather Matrix-Vector Multiplication (SGMV). SGMV allows a GPU to store only a single copy of the pre-trained model while serving different LoRA models. The Punica kernel design system consolidates the batching of requests for unique LoRA models to improve performance by parallelizing the feature-weight multiplication of different requests in a batch. Requests for the same LoRA model are then grouped to increase operational intensity. Initially, the GPU loads the base model while reserving most of its GPU memory for KV Cache. The LoRA components (A and B matrices) are then loaded on demand from remote storage (Cloudflare’s cache or R2) when required by an incoming request. This on demand loading introduces only milliseconds of latency, which means that multiple LoRA adapters can be seamlessly fetched and served with minimal impact on inference performance. Frequently requested LoRA adapters are cached for the fastest possible inference.

Once a requested LoRA has been cached locally, the speed it can be made available for inference is constrained only by PCIe bandwidth. Regardless, given that each request may require its own LoRA, it becomes critical that LoRA downloads and memory copy operations are performed asynchronously. The Punica scheduler tackles this exact challenge, batching only requests which currently have required LoRA weights available in GPU memory, and queueing requests that do not until the required weights are available and the request can efficiently join a batch.

By effectively managing KV cache and batching these requests, it is possible to handle significant multi-tenant LoRA-serving workloads. A further and important optimization is the use of continuous batching. Common batching methods require all requests to the same adapter to reach their stopping condition before being released. Continuous batching allows a request in a batch to be released early so that it does not need to wait for the longest running request.

Given that LLMs deployed to Cloudflare’s network are available globally, it is important that LoRA adapter models are as well. Very soon, we will implement remote model files that are cached at Cloudflare’s edge to further reduce inference latency.

A roadmap for fine-tuning on Workers AI

Launching support for LoRA adapters is an important step towards unlocking fine-tunes on our platform. In addition to the LLM fine-tunes available today, we look forward to supporting more models and a variety of task types, including image generation.

Our vision for Workers AI is to be the best place for developers to run their AI workloads — and this includes the process of fine-tuning itself. Eventually, we want to be able to run the fine-tuning training job as well as fully fine-tuned models directly on Workers AI. This unlocks many use cases for AI to be more relevant in organizations by empowering models to have more granularity and detail for specific tasks.

With AI Gateway, we will be able to help developers log their prompts and responses, which they can then use to fine-tune models with production data. Our vision is to have a one-click fine-tuning service, where log data from AI Gateway can be used to retrain a model (on Cloudflare) and then the fine-tuned model can be redeployed on Workers AI for inference. This will allow developers to personalize their AI models to fit their applications, allowing for granularity as low as a per-user level. The fine-tuned model can then be smaller and more optimized, helping users save time and money on AI inference – and the magic is that all of this can all happen within our very own Developer Platform.

We’re excited for you to try the open beta for BYO LoRAs! Read our Developer Docs for more details, and tell us what you think on Discord.