Tag Archives: multi-region

Top Architecture Blog Posts of 2024

Post Syndicated from Andrea Courtright original https://aws.amazon.com/blogs/architecture/top-architecture-blog-posts-of-2024/

Well, it’s been another historic year! We’ve watched in awe as the use of real-world generative AI has changed the tech landscape, and while we at the Architecture Blog happily participated, we also made every effort to stay true to our channel’s original scope, and your readership this last year has proven that decision was the right one.

AI/ML carries itself in the top posts this year, but we’re also happy to see that foundational topics like resiliency and cost optimization are still of great interest to our audience.

(By the way, if you were hoping for more AI/ML content, head on over to our sister channel, the AWS Machine Learning Blog!).

Without further ado, here are our top posts from 2024!

#10 Deploy Stable Diffusion ComfyUI on AWS elastically and efficiently

This post helps you get started using ComfyUI, and was so successful that we followed it up later in the year with How to build custom nodes workflow with ComfyUI on EKS!

Architecture for deploying stable diffusion on ComfyUI

Figure 1. Architecture for deploying stable diffusion on ComfyUI

#9 Let’s Architect! Designing Well-Architected systems

In keeping with Let’s Architect! series, we have our first of three favorites for the year. This set of resources helps you apply Well-Architected standards in practice.

Let's Architect

Figure 2. Let’s Architect

#8 Let’s Architect! Learn About Machine Learning on AWS

As I said, Let’s Architect! has a winning series, and they’ve got a finger on the pulse of the tech world. This post about machine learning showcases some of the most exciting things happening at AWS.

Let's Architect

Figure 3. Let’s Architect

If you’re more interested in generative AI, you can also take a look at another post from 2024: Let’s Architect! GenAI

#7 Creating an organizational multi-Region failover strategy

Preparedness is another common theme in this year’s favorites. Michael, John, and Saurabh are well-versed in multi-Region architecture, and they’re here to share some strategies to contain failure impact.

When the application experiences an impairment using S3 resources in the primary Region, it fails over to use an S3 bucket in the secondary Region.

Figure 4. When the application experiences an impairment using S3 resources in the primary Region, it fails over to use an S3 bucket in the secondary Region.

#6 Building a three-tier architecture on a budget

Let’s talk cost optimization. This post about a three-tier architecture that relies on the AWS Free Tier is a must-read for anyone looking for tips to help them avoid unnecessary costs (and that’s everyone).

Example of a three-tier architecture on AWS

Figure 5. Example of a three-tier architecture on AWS

#5 Announcing updates to the AWS Well-Architected Framework guidance

As usual, Haleh & team are pros at making sure the Well-Architected Framework is current and relevant. Take a look at the enhanced and expanded guidance in all six pillars.

Well-Architected logo

Figure 6. Well-Architected logo

#4 Let’s Architect! Serverless developer experience in AWS

One more winning post from Luca, Federica, Vittorio, and Zamira! This collection of developer resources includes new ideas in AWS Lambda, Amazon Q Developer, and Amazon DynamoDB.

Let's Architect

Figure 7. Let’s Architect

#3 London Stock Exchange Group uses chaos engineering on AWS to improve resilience

This post from April 1 was not an April Fool’s joke! See how LSEG designed failure scenarios to test their resilience and observability.

Chaos engineering pattern for hybrid architecture (3-tier application)

Figure 8. Chaos engineering pattern for hybrid architecture (3-tier application)

#2 Achieving Frugal Architecture using the AWS Well-Architected Framework Guidance

Frugality AND Well-Architected? What a winning combo! This post, inspired by the 2023 re:Invent keynote, outlines the seven laws of Frugal Architecture.

Well-Architected logo

Figure 9. Well-Architected logo

#1 How an insurance company implements disaster recovery of 3-tier applications

And finally, our number one post of the year! Amit and Luiz showcase a customer solution with real-world applications that builds on the guidelines of other posts in this list! Well done!

The Pilot Light scenario for a 3-tier application that has application servers and a database deployed in two Regions

Figure 10. The Pilot Light scenario for a 3-tier application that has application servers and a database deployed in two Regions

Thank you!

As always, thanks to our contributors for their dedication and desire to share, and to you, our readers! We would be nothing with you. Literally.

For other top post lists, see our Top 10 and Top 5 posts from previous years.

Creating an organizational multi-Region failover strategy

Post Syndicated from Michael Haken original https://aws.amazon.com/blogs/architecture/creating-an-organizational-multi-region-failover-strategy/

AWS Regions provide fault isolation boundaries that prevent correlated failure and contain the impact from AWS service impairments to a single Region when they occur. You can use these fault boundaries to build multi-Region applications that consist of independent, fault-isolated replicas in each Region that limit shared fate scenarios. This allows you to build multi-Region applications and leverage a spectrum of approaches from backup and restore to pilot light to active/active to implement your multi-Region architecture. However, applications typically don’t operate in isolation; consider both the components you will use and their dependencies as part of your failover strategy. Generally, multiple applications make up what we refer to as a user story, a specific capability offered to an end user, like “posting a picture and caption on a social media app” or “checking out on an e-commerce site”. Because of this, you should develop an organizational multi-Region failover strategy that provides the necessary coordination and consistency to make your approach successful.

Overview

There are four high-level strategies that organizations can pick from to guide a multi-Region approach:

  • Component-level failover
  • Individual application failover
  • Dependency graph failover
  • Entire application portfolio failover

These strategies move from the most granular to the coarsest approach. Each strategy has tradeoffs and addresses different challenges, including flexibility of failover decision making, testability of the failover combinations, presence of modal behavior, and organizational investment in planning and implementation. By the end of this post, you will be able to identify the pros and cons of each strategy so you can make intentional choices about which you select for your multi-Region failover solution.

Component-level failover

Applications are made up of multiple components, including their infrastructure, code and config, data stores, and dependencies. The component-level failover strategy helps you recover from individual component impairments. This means that when a single component is impaired, the application will fail over to a component hosted in a different Region. Consider the application in Figure 1. When the Amazon Simple Storage Service (Amazon S3) resources used by the application experience elevated error rates or higher latency, the application fails over to use data from an S3 bucket in its secondary Region.

When the application experiences an impairment using S3 resources in the primary Region, it fails over to use an S3 bucket in the secondary Region.

Figure 1. When the application experiences an impairment using S3 resources in the primary Region, it fails over to use an S3 bucket in the secondary Region.

This strategy gives the most autonomy and flexibility to individual applications, but has four main tradeoffs:

  • It adds latency by using resources in a second Region because they are physically further away. This gives the application multiple modes of behavior, lower latency when all components are in one Region, and higher latency when the components are split between Regions. Modal behavior can produce unexpected and undesirable results.
  • It introduces the possibility for inconsistent data if asynchronous replication is used in the data store.
  • It typically requires a runtime update of the application’s configuration to switch a component to a different Region, which can be unreliable during a failure scenario.
  • There are 2N-1 possible configurations (where N is the number of components in the application) of the application, which can make every possible combination in an application difficult to test.

Individual application failover

The next strategy allows individual applications to make an autonomous decision to fail over all of its components together, shown in Figure 2. This removes the latency tradeoff from the previous strategy by keeping all of the application components in the same Region. It also significantly reduces the complexity by only having two possible configurations per application. Additionally, applications can be failed over to another Region without updating their configuration by using approaches like Amazon Route 53 DNS failover, removing the unreliability of runtime configuration updates.

Application 3 experiences an impairment and fails over to the secondary Region.

Figure 2. Application 3 experiences an impairment and fails over to the secondary Region

However, allowing individual applications to make their own failover decision can introduce the same modal behavior we saw with component-level failover, just in a different dimension. In the worst case, 50% of the applications in a user story could fail over while 50% don’t, meaning every application interaction could be a cross-Region request, shown in Figure 3.

The worst-case scenario of allowing applications to make failover decisions independently.

Figure 3. The worst-case scenario of allowing applications to make failover decisions independently

Additionally, while this approach removes the complexity of the component failover approach, it still exhibits a level of similar complexity, albeit smaller, by having 2N-1 combinations of application locations across Regions, also making this approach difficult to test and coordinate.

Dependency graph failover

To solve the complexity of the previous strategy, you might decide to coordinate failover of all applications that support a user story as a single unit. We call this a dependency graph and it ensures that all applications that interact with each other will always be in the same Region, as shown in Figure 4.

A dependency graph of applications that all support user story "A".

Figure 4. A dependency graph of applications that all support user story “A”

While this solves the previous latency, modal behavior, and complexity tradeoffs, it comes with its own challenges. In a portfolio with multiple user stories and applications, this graph can be very large and discovering each dependency, especially infrequently used ones, can be difficult. In fact, seemingly unrelated dependency graphs can be connected by a single vertex that is shared between them, as shown in Figure 5.

Two unrelated user stories share a dependency on Application 4, requiring both dependency graphs to failover if either experience an impairment.

Figure 5. Two unrelated user stories share a dependency on Application 4, requiring both dependency graphs to failover if either experience an impairment

For example, if every user story you provide depends on a single authentication and authorization system, when one graph of applications needs to failover, then so does the entire authorization system. In turn, every other user story that depends on that authorization system needs to fail over as well. To mitigate this, you might implement independent replicas of these types of applications in each Region, if possible, to remove edges from the dependency graph.

Entire portfolio failover

The final strategy is failing over an entire application portfolio, whether or not applications are impacted or have any interaction with those that are, as shown in Figure 6. This strategy helps remove the operational burden of creating and maintaining dependency graphs for every user story your business supports.

Every user story fails over together regardless of observed impact from a failure.

Figure 6. Every user story fails over together regardless of observed impact from a failure

The major tradeoff is the organizational investment to create multi-Region capabilities for every application – you might not have made that broad investment in the other strategies. You can make this strategy slightly more granular by implementing it for specific application tiers, for example, failing over all tier-1 applications together, as long as you know there aren’t dependencies across applications of different criticality.

You can also combine this approach with the second strategy. Let individual applications make failover decisions until you see broad enough impact, or impact from the modal behavior, that you decide to make all applications failover to your secondary Region to mitigate the effects.

Conclusion

This blog post has looked at four different high-level approaches for creating an organizational multi-Region failover strategy.

Each strategy optimizes for different outcomes. Component-level failover gives you the highest degree of flexibility without organizational capabilities or coordination, but introduces the most complexity and bimodal behavior. Individual application failover optimizes for less complexity in failover combinations than component-level while still maintaining decentralized flexibility in failover decision making. Dependency graph failover optimizes for only needing to failover the minimum set of applications to support a capability, which removes the presence of modal behavior while requiring more organizational investment to do so. Finally, portfolio failover optimizes for not needing to maintain dependency graphs, but requires significant additional investment to build a multi-Region capability for every application.

Creating the strategy can be an iterative journey. You might start with allowing individual applications to make failover decisions while you build toward a future state of managing failover of independent dependency graphs. For more information on creating multi-Region architectures, see AWS Multi-Region Fundamentals and Disaster Recovery of Workloads on AWS.

How Vanguard made their technology platform resilient and efficient by building cross-Region replication for Amazon Kinesis Data Streams

Post Syndicated from Raghu Boppanna original https://aws.amazon.com/blogs/big-data/how-vanguard-made-their-technology-platform-resilient-and-efficient-by-building-cross-region-replication-for-amazon-kinesis-data-streams/

This is a guest post co-written with Raghu Boppanna from Vanguard. 

At Vanguard, the Enterprise Advice line of business improves investor outcomes through digital access to superior, personalized, and affordable financial advice. They made it possible, in part, by driving economies of scale across the globe for investors with a highly resilient and efficient technical platform. Vanguard opted for a multi-Region architecture for this workload to help protect against impairments of Regional services. For high availability purposes, there is a need to make the data used by the workload available not just in the primary Region, but also in the secondary Region with minimal replication lag. In the event of a service impairment in the primary Region, the solution should be able to fail over to the secondary Region with as little data loss as possible and the ability to resume data ingestion.

Vanguard Cloud Technology Office and AWS partnered to build an infrastructure solution on AWS that met their resilience requirements. The multi-Region solution enables a robust fail-over mechanism, with built-in observability and recovery. The solution also supports streaming data from multiple sources to different Kinesis data streams. The solution is currently being rolled out to the different lines of business teams to improve the resilience posture of their workloads.

The use case discussed here requires Change Data Capture (CDC) to stream data from a remote data source (mainframe DB2) to Amazon Kinesis Data Streams, because the business capability depends on this data. Kinesis Data Streams is a fully managed, massively scalable, durable, and low-cost streaming service that can continuously capture and stream large amounts of data from multiple sources, and makes the data available for consumption within milliseconds. The service is built to be highly resilient and uses multiple Availability Zones to process and store data.

The solution discussed in this post explains how AWS and Vanguard innovated to build a resilient architecture to meet their high availability goals.

Solution overview

The solution uses AWS Lambda to replicate data from Kinesis data streams in the primary Region to a secondary Region. In the event of any service impairment impacting the CDC pipeline, the failover process promotes the secondary Region to primary for the producers and consumers. We use Amazon DynamoDB global tables for replication checkpoints that allows to resume data streaming from the checkpoint and also maintains a primary Region configuration flag that prevents an infinite replication loop of the same data back and forth.

The solution also provides the flexibility for Kinesis Data Streams consumers to use the primary or any secondary Region within the same AWS account.

The following diagram illustrates the reference architecture.

Let’s look at each component in detail:

  1. CDC processor (producer) – In this reference architecture, the producer is deployed on Amazon Elastic Compute Cloud (Amazon EC2) in both the primary and secondary Regions, and is active in the primary Region and on standby mode in the secondary Region. It captures CDC data from the external data source (like a DB2 database as shown in the architecture above), and streams to Kinesis Data Streams in the primary Region. Vanguard uses a 3rd party tool Qlik Replicate as their CDC Processor. It produces a well-formed payload including the DB2 commit timestamp to the Kinesis data stream, in addition to the actual row data from the remote data source. (example-stream-1 in this example). The following code is a sample payload containing only the primary key of the record that changed and the commit timestamp (for simplicity, the rest of the table row data is not shown below):
    {
        "eventSource": "aws:kinesis",
        "kinesis": 
        {
             "ApproximateArrivalTimestamp": "Mon July 18 20:00:00 UTC 2022",
             "SequenceNumber": "49544985256907370027570885864065577703022652638596431874",
             "PartitionKey": "12349999",
             "KinesisSchemaVersion": "1.0",
             "Data": "eyJLZXkiOiAxMjM0OTk5OSwiQ29tbWl0VGltZXN0YW1wIjogIjIwMjItMDctMThUMjA6MDA6MDAifQ=="
        },
        "eventId": "shardId-000000000000:49629136582982516722891309362785181370337771525377097730",
        "invokeIdentityArn": "arn:aws:iam::6243876582:role/kds-crr-LambdaRole-1GZWP67437SD",
        "eventName": "aws:kinesis:record",
        "eventVersion": "1.0",
        "eventSourceARN": "arn:aws:kinesis:us-east-1:6243876582:stream/kds-stream-1/consumer/kds-crr:6243876582",
        "awsRegion": "us-east-1"
    }

    The Base64 decoded value of Data is as follows. The actual Kinesis record would contain the entire row data of the table row that changed, in addition to the primary key and the commit timestamp.

    {"Key": 12349999,"CommitTimestamp": "2022-07-18T20:00:00"}

    The CommitTimestamp in the Data field is used in the replication checkpoint and is critical to accurately track how much of the stream data has been replicated to the secondary Region. The checkpoint can then be used to facilitate a CDC processor (producer) failover and accurately resume producing data from the replication checkpoint timestamp onwards.

    The alternative to using a remote data source CommitTimestamp (if unavailable) is to use the ApproximateArrivalTimestamp (which is the timestamp when the record is actually written to the data stream).

  2. Cross-Region replication Lambda function – The function is deployed to both primary and secondary Regions. It’s set up with an event source mapping to the data stream containing CDC data. The same function can be used to replicate data of multiple streams. It’s invoked with a batch of records from Kinesis Data Streams and replicates the batch to a target replication Region (which is provided via the Lambda configuration environment). For cost considerations, if the CDC data is actively produced into the primary Region only, the reserved concurrency of the function in the secondary Region can be set to zero, and modified during regional failover. The function has AWS Identity and Access Management (IAM) role permissions to do the following:
    • Read and write to the DynamoDB global tables used in this solution, within the same account.
    • Read and write to Kinesis Data Streams in both Regions within the same account.
    • Publish custom metrics to Amazon CloudWatch in both Regions within the same account.
  3. Replication checkpoint – The replication checkpoint uses the DynamoDB global table in both the primary and secondary Regions. It’s used by the cross-Region replication Lambda function to persist the commit timestamp of the last replication record as the replication checkpoint for every stream that is configured for replication. For this post, we create and use a global table called kdsReplicationCheckpoint.
  4. Active Region config – The active Region uses the DynamoDB global table in both primary and secondary Regions. It uses the native cross-Region replication capability of the global table to replicate the configuration. It’s pre-populated with data about which is the primary Region for a stream, to prevent replication back to the primary Region by the Lambda function in the standby Region. This configuration may not be required if the Lambda function in the standby Region has a reserved concurrency set to zero, but can serve as a safety check to avoid infinite replication loop of the data. For this post, we create a global table called kdsActiveRegionConfig and put an item with the following data:
    {
     "stream-name": "example-stream-1",
     "active-region" : "us-east-1"
    }
    
  5. Kinesis Data Streams – The stream to which the CDC processor produces the data. For this post, we use a stream called example-stream-1 in both the Regions, with the same shard configuration and access policies.

Sequence of steps in cross-Region replication

Let’s briefly look at how the architecture is exercised using the following sequence diagram.

The sequence consists of the following steps:

  1. The CDC processor (in us-east-1) reads the CDC data from the remote data source.
  2. The CDC processor (in us-east-1) streams the CDC data to Kinesis Data Streams (in us-east-1).
  3. The cross-Region replication Lambda function (in us-east-1) consumes the data from the data stream (in us-east-1). The enhanced fan-out pattern is recommended for dedicated and increased throughput for cross-Region replication.
  4. The replicator Lambda function (in us-east-1) validates its current Region with the active Region configuration for the stream being consumed, with the help of the kdsActiveRegionConfig DynamoDB global tableThe following sample code (in Java) can help illustrate the condition being evaluated:
    // Fetch the current AWS Region from the Lambda function’s environment
    String currentAWSRegion = System.getenv(“AWS_REGION”);
    // Read the stream name from the first Kinesis Record once for the entire batch being processed. This is done because we are reusing the same Lambda function for replicating multiple streams.
    String currentStreamNameConsumed = kinesisRecord.getEventSourceARN().split(“:”)[5].split(“/”)[1];
    // Build the DynamoDB query condition using the stream name
    Map<String, Condition> keyConditions = singletonMap(“streamName”, Condition.builder().comparisonOperator(EQ).attributeValueList(AttributeValue.builder().s(currentStreamNameConsumed).build()).build());
    // Query the DynamoDB Global Table
    QueryResponse queryResponse = ddbClient.query(QueryRequest.builder().tableName("kdsActiveRegionConfig").keyConditions(keyConditions).attributesToGet(“ActiveRegion”).build());
  5. The function evaluates the response from DynamoDB with the following code:
    // Evaluate the response
    if (queryResponse.hasItems()) {
           AttributeValue activeRegionForStream = queryResponse.items().get(0).get(“ActiveRegion”);
           return currentAWSRegion.equalsIgnoreCase(activeRegionForStream.s());
    }
  6. Depending on the response, the function takes the following actions:
    1. If the response is true, the replicator function produces the records to Kinesis Data Streams in us-east-2 in a sequential manner.
      • If there is a failure, the sequence number of the record is tracked and the iteration is broken. The function returns the list of failed sequence numbers. By returning the failed sequence number, the solution uses the feature of Lambda checkpointing to be able to resume processing of a batch of records with partial failures. This is useful when handling any service impairments, where the function tries to replicate the data across Regions to ensure stream parity and no data loss.
      • If there are no failures, an empty list is returned, which indicates the batch was successful.
    2. If the response is false, the replicator function returns without performing any replication. To reduce the cost of the Lambda invocations, you can set the reserved concurrency of the function in the DR Region (us-east-2) to zero. This will prevent the function from being invoked. When you failover, you can update this value to an appropriate number based on the CDC throughput and set the reserved concurrency of the function in us-east-1 to zero to prevent it from executing unnecessarily.
  7. After all the records are produced to Kinesis Data Streams in us-east-2, the replicator function checkpoints to the kdsReplicationCheckpoint DynamoDB global table (in us-east-1) with the following data:
    { "streamName": "example-stream-1", "lastReplicatedTimestamp": "2022-07-18T20:00:00" }
    
  8. The function returns after successfully processing the batch of records.

Performance considerations

The performance expectations of the solution should be understood with respect to the following factors:

  • Region selection – The replication latency is directly proportional to the distance being traveled by the data, so understand your Region selection
  • Velocity – The incoming velocity of the data or the volume of data being replicated
  • Payload size – The size of the payload being replicated

Monitor the Cross-Region replication

It’s recommended to track and observe the replication as it happens. You can tailor the Lambda function to publish custom metrics to CloudWatch with the following metrics at the end of every invocation. Publishing these metrics to both the primary and secondary Regions helps protect yourself from impairments affecting observability in the primary Region.

  • Throughput – The current Lambda invocation batch size
  • ReplicationLagSeconds – The difference between the current timestamp (after processing all the records) and the ApproximateArrivalTimestamp of the last record that was replicated

The following example CloudWatch metric graph shows the average replication lag was 2 seconds with a throughput of 100 records replicated from us-east-1 to us-east-2.

Common failover strategy

During any impairments impacting the CDC pipeline in the primary Region, business continuity or disaster recovery needs may dictate a pipeline failover to the secondary (standby) Region. This means a couple of things need to be done as part of this failover process:

  • If possible, stop all the CDC tasks in the CDC processor tool in us-east-1.
  • The CDC processor must be failed over to the secondary Region, so that it can read the CDC data from the remote data source while operating out of the standby Region.
  • The kdsActiveRegionConfig DynamoDB global table needs to be updated. For instance, for the stream example-stream-1 used in our example, the active Region is changed to us-east-2:
{
"stream-name": "example-stream-1",
"active-Region" : "us-east-2"
}
  • All the stream checkpoints need to be read from the kdsReplicationCheckpoint DynamoDB global table (in us-east-2), and the timestamps from each of the checkpoints are used to start the CDC tasks in the producer tool in us-east-2 Region. This minimizes the chances of data loss and accurately resumes streaming the CDC data from the remote data source from the checkpoint timestamp onwards.
  • If using reserved concurrency to control Lambda invocations, set the value to zero in the primary Region(us-east-1) and to a suitable non-zero value in the secondary Region(us-east-2).

Vanguard’s multi-step failover strategy

Some of the third-party tools that Vanguard uses have a two-step CDC process of streaming data from a remote data source to a destination. Vanguard’s tool of choice for their CDC processor follows this two-step approach:

  1. The first step involves setting up a log stream task that reads the data from the remote data source and persists in a staging location.
  2. The second step involves setting up individual consumer tasks that read data from the staging location—which could be on Amazon Elastic File System (Amazon EFS) or Amazon FSx, for example—and stream it to the destination. The flexibility here is that each of these consumer tasks can be triggered to stream from different commit timestamps. The log stream task usually starts reading data from the minimum of all the commit timestamps used by the consumer tasks.

Let’s look at an example to explain the scenario:

  • Consumer task A is streaming data from a commit timestamp 2022-07-19T20:00:00 onwards to example-stream-1.
  • Consumer task B is streaming data from a commit timestamp 2022-07-19T21:00:00 onwards to example-stream-2.
  • In this situation, the log stream should read data from the remote data source from the minimum of the timestamps used by the consumer tasks, which is 2022-07-19T20:00:00.

The following sequence diagram demonstrates the exact steps to run during a failover to us-east-2 (the standby Region).

The steps are as follows:

  1. The failover process is triggered in the standby Region (us-east-2 in this example) when required. Note that the trigger can be automated using comprehensive health checks of the pipeline in the primary Region.
  2. The failover process updates the kdsActiveRegionConfig DynamoDB global table with the new value for the Region as us-east-2 for all the stream names.
  3. The next step is to fetch all the stream checkpoints from the kdsReplicationCheckpoint DynamoDB global table (in us-east-2).
  4. After the checkpoint information is read, the failover process finds the minimum of all the lastReplicatedTimestamp.
  5. The log stream task in the CDC processor tool is started in us-east-2 with the timestamp found in Step 4. It begins reading CDC data from the remote data source from this timestamp onwards and persists them in the staging location on AWS.
  6. The next step is to start all the consumer tasks to read data from the staging location and stream to the destination data stream. This is where each consumer task is supplied with the appropriate timestamp from the kdsReplicationCheckpoint table according to the streamName to which the task streams the data.

After all the consumer tasks are started, data is produced to the Kinesis data streams in us-east-2. From there on, the process of cross-Region replication is the same as described earlier – the replication Lambda function in us-east-2 starts replicating data to the data stream in us-east-1.

The consumer applications reading data from the streams are expected to be idempotent to be able to handle duplicates. Duplicates can be introduced in the stream due to many reasons, some of which are called out below.

  • The Producer or the CDC Processor introduces duplicates into the stream while replaying the CDC data during a failover
  • DynamoDB Global Table uses asynchronous replication of data across Regions and if the kdsReplicationCheckpoint table data has a replication lag, the failover process may potentially use an older checkpoint timestamp to replay the CDC data.

Also, consumer applications should checkpoint the CommitTimestamp of the last record that was consumed. This is to facilitate better monitoring and recovery.

Path to maturity: Automated recovery

The ideal state is to fully automate the failover process, reducing time to recover and meeting the resilience Service Level Objective (SLO). However, in most organizations, the decision to fail over, fail back, and trigger the failover requires manual intervention in assessing the situation and deciding the outcome. Creating scripted automation to perform the failover that can be run by a human is a good place to start.

Vanguard has automated all of the steps of failover, but still have humans make the decision on when to invoke it. You can customize the solution to meet your needs and depending on the CDC processor tool you use in your environment.

Conclusion

In this post, we described how Vanguard innovated and built a solution for replicating data across Regions in Kinesis Data Streams to make the data highly available. We also demonstrated a robust checkpoint strategy to facilitate a Regional failover of the replication process when needed. The solution also illustrated how to use DynamoDB global tables for tracking the replication checkpoints and configuration. With this architecture, Vanguard was able to deploy workloads depending on the CDC data to multiple Regions to meet business needs of high availability in the face of service impairments impacting CDC pipelines in the primary Region.

If you have any feedback please leave a comment in the Comments section below.


About the authors

Raghu Boppanna works as an Enterprise Architect at Vanguard’s Chief Technology Office. Raghu specializes in Data Analytics, Data Migration/Replication including CDC Pipelines, Disaster Recovery and Databases. He has earned several AWS Certifications including AWS Certified Security – Specialty & AWS Certified Data Analytics – Specialty.

Parameswaran V Vaidyanathan is a Senior Cloud Resilience Architect with Amazon Web Services. He helps large enterprises achieve the business goals by architecting and building scalable and resilient solutions on the AWS Cloud.

Richa Kaul is a Senior Leader in Customer Solutions serving Financial Services customers. She is based out of New York. She has extensive experience in large scale cloud transformation, employee excellence, and next generation digital solutions. She and her team focus on optimizing value of cloud by building performant, resilient and agile solutions. Richa enjoys multi sports like triathlons, music, and learning about new technologies.

Mithil Prasad is a Principal Customer Solutions Manager with Amazon Web Services. In his role, Mithil works with Customers to drive cloud value realization, provide thought leadership to help businesses achieve speed, agility, and innovation.

Let’s Architect! Architecting with Amazon DynamoDB

Post Syndicated from Luca Mezzalira original https://aws.amazon.com/blogs/architecture/lets-architect-architecting-with-amazon-dynamodb/

NoSQL databases are an essential part of the technology industry in today’s world. Why are we talking about NoSQL databases? NoSQL databases often allow developers to be in control of the structure of the data, and they are a good fit for big data scenarios and offer fast performance.

In this issue of Let’s Architect!, we explore Amazon DynamoDB capabilities and potential solutions to apply in your architectures. A key strength of DynamoDB is the capability of operating at scale globally; for instance, multiple products built by Amazon are powered by DynamoDB. During Prime Day 2022, the service also maintained high availability while delivering single-digit millisecond responses, peaking at 105.2 million requests-per-second. Let’s start!

Data modeling with DynamoDB

Working with a new database technology means understanding exactly how it works and the best design practices for taking full advantage of its features.

In this video, the key principles for modeling DynamoDB tables are discussed, plus practical patterns to use while defining your data models are explored and how data modeling for NoSQL databases (like DynamoDB) is different from modeling for traditional relational databases.

With this video, you can learn about the main components of DynamoDB, some design considerations that led to its creation, and all the best practices for efficiently using primary keys, secondary keys, and indexes. Peruse the original paper to learn more about DyanamoDB in Dynamo: Amazon’s Highly Available Key-value Store.

Amazon DynamoDB uses partitioning to provide horizontal scalability

Amazon DynamoDB uses partitioning to provide horizontal scalability

Single-table vs. multi-table in Amazon DynamoDB

When considering single-table versus multi-table in DynamoDB, it is all about your application’s needs. It is possible to avoid naïve lifting-and-shifting your relational data model into DynamoDB tables. In this post, you will discover different use cases on when to use single-table compared with multi-table designs, plus understand certain data-modeling principles for DynamoDB.

Use a single-table design to provide materialized joins in Amazon DynamoDB

Use a single-table design to provide materialized joins in Amazon DynamoDB

Optimizing costs on DynamoDB tables

Infrastructure cost is an important dimension for every customer. Despite your role inside an organization, you should monitor opportunities for optimizing costs, when possible.
For this reason, we have created a guide on DynamoDB tables cost-optimization that provides several suggestions for reducing your bill at the end of the month.

Build resilient applications with Amazon DynamoDB global tables: Part 1

When you operate global systems that are spread across multiple AWS regions, dealing with data replication and writes across regions can be a challenge. DynamoDB global tables help by providing the performance of DynamoDB across multiple regions with data synchronization and multi-active database where each replica can be used for both writing and reading data.

Another use case for global tables are resilient applications with the lowest possible recovery time objective (RTO) and recovery point objective (RPO). In this blog series, we show you how to approach such a scenario.

Amazon DynamoDB active-active architecture

Amazon DynamoDB active-active architecture

See you next time!

Thanks for joining our discussion on DynamoDB. See you in a few weeks, when we explore cost optimization!

Other posts in this series

Looking for more architecture content?

AWS Architecture Center provides reference architecture diagrams, vetted architecture solutions, Well-Architected best practices, patterns, icons, and more!

Multi-Region Terraform Deployments with AWS CodePipeline using Terraform Built CI/CD

Post Syndicated from Lerna Ekmekcioglu original https://aws.amazon.com/blogs/devops/multi-region-terraform-deployments-with-aws-codepipeline-using-terraform-built-ci-cd/

As of February 2022, the AWS Cloud spans 84 Availability Zones within 26 geographic Regions, with announced plans for more Availability Zones and Regions. Customers can leverage this global infrastructure to expand their presence to their primary target of users, satisfying data residency requirements, and implementing disaster recovery strategy to make sure of business continuity. Although leveraging multi-Region architecture would address these requirements, deploying and configuring consistent infrastructure stacks across multi-Regions could be challenging, as AWS Regions are designed to be autonomous in nature. Multi-region deployments with Terraform and AWS CodePipeline can help customers with these challenges.

In this post, we’ll demonstrate the best practice for multi-Region deployments using HashiCorp Terraform as infrastructure as code (IaC), and AWS CodeBuild , CodePipeline as continuous integration and continuous delivery (CI/CD) for consistency and repeatability of deployments into multiple AWS Regions and AWS Accounts. We’ll dive deep on the IaC deployment pipeline architecture and the best practices for structuring the Terraform project and configuration for multi-Region deployment of multiple AWS target accounts.

You can find the sample code for this solution here

Solutions Overview

Architecture

The following architecture diagram illustrates the main components of the multi-Region Terraform deployment pipeline with all of the resources built using IaC.

DevOps engineer initially works against the infrastructure repo in a short-lived branch. Once changes in the short-lived branch are ready, DevOps engineer gets them reviewed and merged into the main branch. Then, DevOps engineer git tags the repo. For any future changes in the infra repo, DevOps engineer repeats this same process.

Git tags named “dev_us-east-1/research/1.0”, “dev_eu-central-1/research/1.0”, “dev_ap-southeast-1/research/1.0”, “dev_us-east-1/risk/1.0”, “dev_eu-central-1/risk/1.0”, “dev_ap-southeast-1/risk/1.0” corresponding to the version 1.0 of the code to release from the main branch using git tagging. Short-lived branch in between each version of the code, followed by git tags corresponding to each subsequent version of the code such as version 1.1 and version 2.0.”

Fig 1. Tagging to release from the main branch.

  1. The deployment is triggered from DevOps engineer git tagging the repo, which contains the Terraform code to be deployed. This action starts the deployment pipeline execution.
    Tagging with ‘dev_us-east-1/research/1.0’ triggers a pipeline to deploy the research dev account to us-east-1. In our example git tag ‘dev_us-east-1/research/1.0’ contains the target environment (i.e., dev), AWS Region (i.e. us-east-1), team (i.e., research), and a version number (i.e., 1.0) that maps to an annotated tag on a commit ID. The target workload account aliases (i.e., research dev, risk qa) are mapped to AWS account numbers in the environment configuration files of the infra repo in AWS CodeCommit.
The central tooling account contains the CodeCommit Terraform infra repo, where DevOps engineer has git access, along with the pipeline trigger, the CodePipeline dev pipeline consisting of the S3 bucket with Terraform infra repo and git tag, CodeBuild terraform tflint scan, checkov scan, plan and apply. Terraform apply points using the cross account role to VPC containing an Application Load Balancer (ALB) in eu-central-1 in the dev target workload account. A qa pipeline, a staging pipeline, a prod pipeline are included along with a qa target workload account, a staging target workload account, a prod target workload account. EventBridge, Key Management Service, CloudTrail, CloudWatch in us-east-1 Region are in the central tooling account along with Identity Access Management service. In addition, the dev target workload account contains us-east-1 and ap-southeast-1 VPC’s each with an ALB as well as Identity Access Management.

Fig 2. Multi-Region AWS deployment with IaC and CI/CD pipelines.

  1. To capture the exact git tag that starts a pipeline, we use an Amazon EventBridge rule. The rule is triggered when the tag is created with an environment prefix for deploying to a respective environment (i.e., dev). The rule kicks off an AWS CodeBuild project that takes the git tag from the AWS CodeCommit event and stores it with a full clone of the repo into a versioned Amazon Simple Storage Service (Amazon S3) bucket for the corresponding environment.
  2. We have a continuous delivery pipeline defined in AWS CodePipeline. To make sure that the pipelines for each environment run independent of each other, we use a separate pipeline per environment. Each pipeline consists of three stages in addition to the Source stage:
    1. IaC linting stage – A stage for linting Terraform code. For illustration purposes, we’ll use the open source tool tflint.
    2. IaC security scanning stage – A stage for static security scanning of Terraform code. There are many tooling choices when it comes to the security scanning of Terraform code. Checkov, TFSec, and Terrascan are the commonly used tools. For illustration purposes, we’ll use the open source tool Checkov.
    3. IaC build stage – A stage for Terraform build. This includes an action for the Terraform execution plan followed by an action to apply the plan to deploy the stack to a specific Region in the target workload account.
  1. Once the Terraform apply is triggered, it deploys the infrastructure components in the target workload account to the AWS Region based on the git tag. In turn, you have the flexibility to point the deployment to any AWS Region or account configured in the repo.
  2. The sample infrastructure in the target workload account consists of an AWS Identity and Access Management (IAM) role, an external facing Application Load Balancer (ALB), as well as all of the required resources down to the Amazon Virtual Private Cloud (Amazon VPC). Upon successful deployment, browsing to the external facing ALB DNS Name URL displays a very simple message including the location of the Region.

Architectural considerations

Multi-account strategy

Leveraging well-architected multi-account strategy, we have a separate central tooling account for housing the code repository and infrastructure pipeline, and a separate target workload account to house our sample workload infra-architecture. The clean account separation lets us easily control the IAM permission for granular access and have different guardrails and security controls applied. Ultimately, this enforces the separation of concerns as well as minimizes the blast radius.

A dev pipeline, a qa pipeline, a staging pipeline and, a prod pipeline in the central tooling account, each targeting the workload account for the respective environment pointing to the Regional resources containing a VPC and an ALB.

Fig 3. A separate pipeline per environment.

The sample architecture shown above contained a pipeline per environment (DEV, QA, STAGING, PROD) in the tooling account deploying to the target workload account for the respective environment. At scale, you can consider having multiple infrastructure deployment pipelines for multiple business units in the central tooling account, thereby targeting workload accounts per environment and business unit. If your organization has a complex business unit structure and is bound to have different levels of compliance and security controls, then the central tooling account can be further divided into the central tooling accounts per business unit.

Pipeline considerations

The infrastructure deployment pipeline is hosted in a central tooling account and targets workload accounts. The pipeline is the authoritative source managing the full lifecycle of resources. The goal is to decrease the risk of ad hoc changes (e.g., manual changes made directly via the console) that can’t be easily reproduced at a future date. The pipeline and the build step each run as their own IAM role that adheres to the principle of least privilege. The pipeline is configured with a stage to lint the Terraform code, as well as a static security scan of the Terraform resources following the principle of shifting security left in the SDLC.

As a further improvement for resiliency and applying the cell architecture principle to the CI/CD deployment, we can consider having multi-Region deployment of the AWS CodePipeline pipeline and AWS CodeBuild build resources, in addition to a clone of the AWS CodeCommit repository. We can use the approach detailed in this post to sync the repo across multiple regions. This means that both the workload architecture and the deployment infrastructure are multi-Region. However, it’s important to note that the business continuity requirements of the infrastructure deployment pipeline are most likely different than the requirements of the workloads themselves.

A dev pipeline in us-east-1, a dev pipeline in eu-central-1, a dev pipeline in ap-southeast-1, all in the central tooling account, each pointing respectively to the regional resources containing a VPC and an ALB for the respective Region in the dev target workload account.

Fig 4. Multi-Region CI/CD dev pipelines targeting the dev workload account resources in the respective Region.

Deeper dive into Terraform code

Backend configuration and state

As a prerequisite, we created Amazon S3 buckets to store the Terraform state files and Amazon DynamoDB tables for the state file locks. The latter is a best practice to prevent concurrent operations on the same state file. For naming the buckets and tables, our code expects the use of the same prefix (i.e., <tf_backend_config_prefix>-<env> for buckets and <tf_backend_config_prefix>-lock-<env> for tables). The value of this prefix must be passed in as an input param (i.e., “tf_backend_config_prefix”). Then, it’s fed into AWS CodeBuild actions for Terraform as an environment variable. Separation of remote state management resources (Amazon S3 bucket and Amazon DynamoDB table) across environments makes sure that we’re minimizing the blast radius.


-backend-config="bucket=${TF_BACKEND_CONFIG_PREFIX}-${ENV}" 
-backend-config="dynamodb_table=${TF_BACKEND_CONFIG_PREFIX}-lock-${ENV}"
A dev Terraform state files bucket named 

<prefix>-dev, a dev Terraform state locks DynamoDB table named <prefix>-lock-dev, a qa Terraform state files bucket named <prefix>-qa, a qa Terraform state locks DynamoDB table named <prefix>-lock-qa, a staging Terraform state files bucket named <prefix>-staging, a staging Terraform state locks DynamoDB table named <prefix>-lock-staging, a prod Terraform state files bucket named <prefix>-prod, a prod Terraform state locks DynamoDB table named <prefix>-lock-prod, in us-east-1 in the central tooling account” width=”600″ height=”456″>
 <p id=Fig 5. Terraform state file buckets and state lock tables per environment in the central tooling account.

The git tag that kicks off the pipeline is named with the following convention of “<env>_<region>/<team>/<version>” for regional deployments and “<env>_global/<team>/<version>” for global resource deployments. The stage following the source stage in our pipeline, tflint stage, is where we parse the git tag. From the tag, we derive the values of environment, deployment scope (i.e., Region or global), and team to determine the Terraform state Amazon S3 object key uniquely identifying the Terraform state file for the deployment. The values of environment, deployment scope, and team are passed as environment variables to the subsequent AWS CodeBuild Terraform plan and apply actions.

-backend-config="key=${TEAM}/${ENV}-${TARGET_DEPLOYMENT_SCOPE}/terraform.tfstate"

We set the Region to the value of AWS_REGION env variable that is made available by AWS CodeBuild, and it’s the Region in which our build is running.

-backend-config="region=$AWS_REGION"

The following is how the Terraform backend config initialization looks in our AWS CodeBuild buildspec files for Terraform actions, such as tflint, plan, and apply.

terraform init -backend-config="key=${TEAM}/${ENV}-
${TARGET_DEPLOYMENT_SCOPE}/terraform.tfstate" -backend-config="region=$AWS_REGION"
-backend-config="bucket=${TF_BACKEND_CONFIG_PREFIX}-${ENV}" 
-backend-config="dynamodb_table=${TF_BACKEND_CONFIG_PREFIX}-lock-${ENV}"
-backend-config="encrypt=true"

Using this approach, the Terraform states for each combination of account and Region are kept in their own distinct state file. This means that if there is an issue with one Terraform state file, then the rest of the state files aren’t impacted.

In the central tooling account us-east-1 Region, Terraform state files named “research/dev-us-east-1/terraform.tfstate”, “risk/dev-ap-southeast-1/terraform.tfstate”, “research/dev-eu-central-1/terraform.tfstate”, “research/dev-global/terraform.tfstate” are in S3 bucket named 

<prefix>-dev along with DynamoDB table for Terraform state locks named <prefix>-lock-dev. The Terraform state files named “research/qa-us-east-1/terraform.tfstate”, “risk/qa-ap-southeast-1/terraform.tfstate”, “research/qa-eu-central-1/terraform.tfstate” are in S3 bucket named <prefix>-qa along with DynamoDB table for Terraform state locks named <prefix>-lock-qa. Similarly for staging and prod.” width=”600″ height=”677″>
 <p id=Fig 6. Terraform state files per account and Region for each environment in the central tooling account

Following the example, a git tag of the form “dev_us-east-1/research/1.0” that kicks off the dev pipeline works against the research team’s dev account’s state file containing us-east-1 Regional resources (i.e., Amazon S3 object key “research/dev-us-east-1/terraform.tfstate” in the S3 bucket <tf_backend_config_prefix>-dev), and a git tag of the form “dev_ap-southeast-1/risk/1.0” that kicks off the dev pipeline works against the risk team’s dev account’s Terraform state file containing ap-southeast-1 Regional resources (i.e., Amazon S3 object key “risk/dev-ap-southeast-1/terraform.tfstate”). For global resources, we use a git tag of the form “dev_global/research/1.0” that kicks off a dev pipeline and works against the research team’s dev account’s global resources as they are at account level (i.e., “research/dev-global/terraform.tfstate).

Git tag “dev_us-east-1/research/1.0” pointing to the Terraform state file named “research/dev-us-east-1/terraform.tfstate”, git tag “dev_ap-southeast-1/risk/1.0 pointing to “risk/dev-ap-southeast-1/terraform.tfstate”, git tag “dev_eu-central-1/research/1.0” pointing to ”research/dev-eu-central-1/terraform.tfstate”, git tag “dev_global/research/1.0” pointing to “research/dev-global/terraform.tfstate”, in dev Terraform state files S3 bucket named <prefix>-dev along with <prefix>-lock-dev DynamoDB dev Terraform state locks table.” width=”600″ height=”318″>
 <p id=Fig 7. Git tags and the respective Terraform state files.

This backend configuration makes sure that the state file for one account and Region is independent of the state file for the same account but different Region. Adding or expanding the workload to additional Regions would have no impact on the state files of existing Regions.

If we look at the further improvement where we make our deployment infrastructure also multi-Region, then we can consider each Region’s CI/CD deployment to be the authoritative source for its local Region’s deployments and Terraform state files. In this case, tagging against the repo triggers a pipeline within the local CI/CD Region to deploy resources in the Region. The Terraform state files in the local Region are used for keeping track of state for the account’s deployment within the Region. This further decreases cross-regional dependencies.

A dev pipeline in the central tooling account in us-east-1, pointing to the VPC containing ALB in us-east-1 in dev target workload account, along with a dev Terraform state files S3 bucket named <prefix>-use1-dev containing us-east-1 Regional resources “research/dev/terraform.tfstate” and “risk/dev/terraform.tfstate” Terraform state files along with DynamoDB dev Terraform state locks table named <prefix>-use1-lock-dev. A dev pipeline in the central tooling account in eu-central-1, pointing to the VPC containing ALB in eu-central-1 in dev target workload account, along with a dev Terraform state files S3 bucket named <prefix>-euc1-dev containing eu-central-1 Regional resources “research/dev/terraform.tfstate” and “risk/dev/terraform.tfstate” Terraform state files along with DynamoDB dev Terraform state locks table named <prefix>-euc1-lock-dev. A dev pipeline in the central tooling account in ap-southeast-1, pointing to the VPC containing ALB in ap-southeast-1 in dev target workload account, along with a dev Terraform state files S3 bucket named <prefix>-apse1-dev containing ap-southeast-1 Regional resources “research/dev/terraform.tfstate” and “risk/dev/terraform.tfstate” Terraform state files along with DynamoDB dev Terraform state locks table named <prefix>-apse1-lock-dev” width=”700″ height=”603″>
 <p id=Fig 8. Multi-Region CI/CD with Terraform state resources stored in the same Region as the workload account resources for the respective Region

Provider

For deployments, we use the default Terraform AWS provider. The provider is parametrized with the value of the region passed in as an input parameter.

provider "aws" {
  region = var.region
   ...
}

Once the provider knows which Region to target, we can refer to the current AWS Region in the rest of the code.

# The value of the current AWS region is the name of the AWS region configured on the provider
# https://registry.terraform.io/providers/hashicorp/aws/latest/docs/data-sources/region
data "aws_region" "current" {} 

locals {
    region = data.aws_region.current.name # then use local.region where region is needed
}

Provider is configured to assume a cross account IAM role defined in the workload account. The value of the account ID is fed as an input parameter.

provider "aws" {
  region = var.region
  assume_role {
    role_arn     = "arn:aws:iam::${var.account}:role/InfraBuildRole"
    session_name = "INFRA_BUILD"
  }
}

This InfraBuildRole IAM role could be created as part of the account creation process. The AWS Control Tower Terraform Account Factory could be used to automate this.

Code

Minimize cross-regional dependencies

We keep the Regional resources and the global resources (e.g., IAM role or policy) in distinct namespaces following the cell architecture principle. We treat each Region as one cell, with the goal of decreasing cross-regional dependencies. Regional resources are created once in each Region. On the other hand, global resources are created once globally and may have cross-regional dependencies (e.g., DynamoDB global table with a replica table in multiple Regions). There’s no “global” Terraform AWS provider since the AWS provider requires a Region. This means that we pick a specific Region from which to deploy our global resources (i.e., global_resource_deploy_from_region input param). By creating a distinct Terraform namespace for Regional resources (e.g., module.regional) and a distinct namespace for global resources (e.g., module.global), we can target a deployment for each using pipelines scoped to the respective namespace (e.g., module.global or module.regional).

Deploying Regional resources: A dev pipeline in the central tooling account triggered via git tag “dev_eu-central-1/research/1.0” pointing to the eu-central-1 VPC containing ALB in the research dev target workload account corresponding to the module.regional Terraform namespace. Deploying global resources: a dev pipeline in the central tooling account triggered via git tag “dev_global/research/1.0” pointing to the IAM resource corresponding to the module.global Terraform namespace.

Fig 9. Deploying regional and global resources scoped to the Terraform namespace

As global resources have a scope of the whole account regardless of Region while Regional resources are scoped for the respective Region in the account, one point of consideration and a trade-off with having to pick a Region to deploy global resources is that this introduces a dependency on that region for the deployment of the global resources. In addition, in the case of a misconfiguration of a global resource, there may be an impact to each Region in which we deployed our workloads. Let’s consider a scenario where an IAM role has access to an S3 bucket. If the IAM role is misconfigured as a result of one of the deployments, then this may impact access to the S3 bucket in each Region.

There are alternate approaches, such as creating an IAM role per Region (myrole-use1 with access to the S3 bucket in us-east-1, myrole-apse1 with access to the S3 bucket in ap-southeast-1, etc.). This would make sure that if the respective IAM role is misconfigured, then the impact is scoped to the Region. Another approach is versioning our global resources (e.g., myrole-v1, myrole-v2) with the ability to move to a new version and roll back to a previous version if needed. Each of these approaches has different drawbacks, such as the duplication of global resources that may make auditing more cumbersome with the tradeoff of minimizing cross Regional dependencies.

We recommend looking at the pros and cons of each approach and selecting the approach that best suits the requirements for your workloads regarding the flexibility to deploy to multiple Regions.

Consistency

We keep one copy of the infrastructure code and deploy the resources targeted for each Region using this same copy. Our code is built using versioned module composition as the “lego blocks”. This follows the DRY (Don’t Repeat Yourself) principle and decreases the risk of code drift per Region. We may deploy to any Region independently, including any Regions added at a future date with zero code changes and minimal additional configuration for that Region. We can see three advantages with this approach.

  1. The total deployment time per Region remains the same regardless of the addition of Regions. This helps for restrictions, such as tight release windows due to business requirements.
  2. If there’s an issue with one of the regional deployments, then the remaining Regions and their deployment pipelines aren’t affected.
  3. It allows the ability to stagger deployments or the possibility of not deploying to every region in non-critical environments (e.g., dev) to minimize costs and remain in line with the Well Architected Sustainability pillar.

Conclusion

In this post, we demonstrated a multi-account, multi-region deployment approach, along with sample code, with a focus on architecture using IaC tool Terraform and CI/CD services AWS CodeBuild and AWS CodePipeline to help customers in their journey through multi-Region deployments.

Thanks to Welly Siauw, Kenneth Jackson, Andy Taylor, Rodney Bozo, Craig Edwards and Curtis Rissi for their contributions reviewing this post and its artifacts.

Author:

Lerna Ekmekcioglu

Lerna Ekmekcioglu is a Senior Solutions Architect with AWS where she helps Global Financial Services customers build secure, scalable and highly available workloads.
She brings over 17 years of platform engineering experience including authentication systems, distributed caching, and multi region deployments using IaC and CI/CD to name a few.
In her spare time, she enjoys hiking, sight seeing and backyard astronomy.

Jack Iu

Jack is a Global Solutions Architect at AWS Financial Services. Jack is based in New York City, where he works with Financial Services customers to help them design, deploy, and scale applications to achieve their business goals. In his spare time, he enjoys badminton and loves to spend time with his wife and Shiba Inu.

Best practices for cross-Region aggregation of security findings

Post Syndicated from Marshall Jones original https://aws.amazon.com/blogs/security/best-practices-for-cross-region-aggregation-of-security-findings/

AWS Security Hub enables customers to have a centralized view into the security posture across their AWS environment by aggregating your security alerts from various AWS services and partner products in a standardized format so that you can more easily take action on them. To facilitate that central view, Security Hub allows you to designate an aggregation Region, which links some or all Regions to a single aggregated Region in a delegated administrator AWS account. All your findings across all of your accounts and all of your linked Regions will be processed by Security Hub in this one Region. With this feature, you can take advantage of many configurations when ingesting findings into Security Hub, that will benefit you operationally and provide cost savings.

This blog post provides you with a set of best practices when using Security Hub across multiple Regions. After implementing the recommendations in this blog post, you’ll have an optimized and centralized view of Security Hub findings from all integrated AWS services and partner products across all Regions in a single AWS account and Region.

Enable cross-Region aggregation

To enable cross-Region aggregation in Security Hub, you must first enable finding aggregation in Security Hub from the Region that will become the aggregation Region. You cannot use a Region that is disabled by default as your aggregation Region. For a list of Regions that are disabled by default, see Enabling a Region in the AWS General Reference.

You can enable AWS Security Hub finding aggregation using either the console or CLI. You must enable finding aggregation from the Region that will be the aggregation Region.

To enable Security Hub finding aggregation from the console

To enable AWS Security Hub finding aggregation using the AWS console:

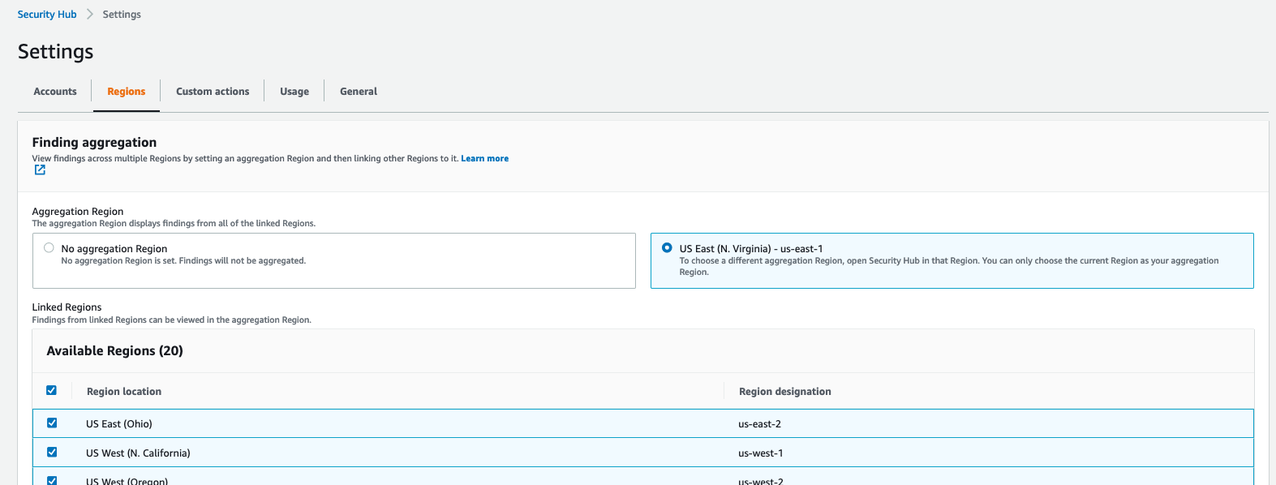
  1. Start by navigating to the AWS Security Hub console and select Settings on the left side of the screen. Once on the settings page, choose the Regions tab.
Figure 1. Enabling finding aggregation

Figure 1. Enabling finding aggregation

  1. Check the checkbox to Link future Regions. As AWS releases new Regions, their results will automatically be aggregated into your designated Region. If this checkbox is not checked, any new Region that is released will not aggregate Security Hub findings to the aggregation Region.

To enable Security Hub finding aggregation using the CLI

Alternatively, you can enable AWS Security Hub finding aggregation using the CLI by using the following command:

aws securityhub create-finding-aggregator –region <aggregation Region> –region-linking-mode ALL_REGIONS | ALL_REGIONS_EXCEPT_SPECIFIED | SPECIFIED_REGIONS –regions <Region list>

Here’s a sample CLI command to enable AWS Security Hub finding aggregation:

aws securityhub create-finding-aggregator –region us-east-1 –region-linking-mode SPECIFIED_REGIONS –regions us-west-1,us-west-2

For more details around AWS Security Hub cross-region aggregation, see Aggregating findings across regions.

Consolidating downstream SIEM and ticketing integrations

Security Hub findings for all AWS accounts in your environment should be integrated into a Security Information and Event Management (SIEM) solution, such as Amazon OpenSearch Service or an APN partner SIEM, or a standardized ticketing system such as JIRA or ServiceNow.

You should send all Security Hub findings to a SIEM or ticketing solution from a single aggregation point to simplify operational overhead. Although integration architectures vary, as an example, this might mean configuring an Amazon EventBridge rule to parse and send findings to AWS Lambda or Amazon Kinesis for a custom integration point with the SIEM or ticketing solution.

You should to configure this integration point in a single delegated administrator account across all member AWS accounts and aggregated Regions. You should avoid having multiple integration points between each Security Hub Region and your SIEM or ticketing solution to avoid unnecessary operational overhead and costs of managing multiple integration points and resources required to stream findings to your SIEM.

Collecting Security Hub findings in a SIEM or ticketing solution can help you correlate findings across many other logs sources. For example, you might use a SIEM solution to analyze operating system logs from an Amazon Elastic Compute Cloud (Amazon EC2) instance to correlate with GuardDuty findings collected by Security Hub to investigate suspicious activity. You could also use ServiceNow or JIRA to create an automated, bidirectional integration between these ticketing solutions that keeps your Security Hub findings and issues in sync.

Auto-archive GuardDuty findings associated with global resources

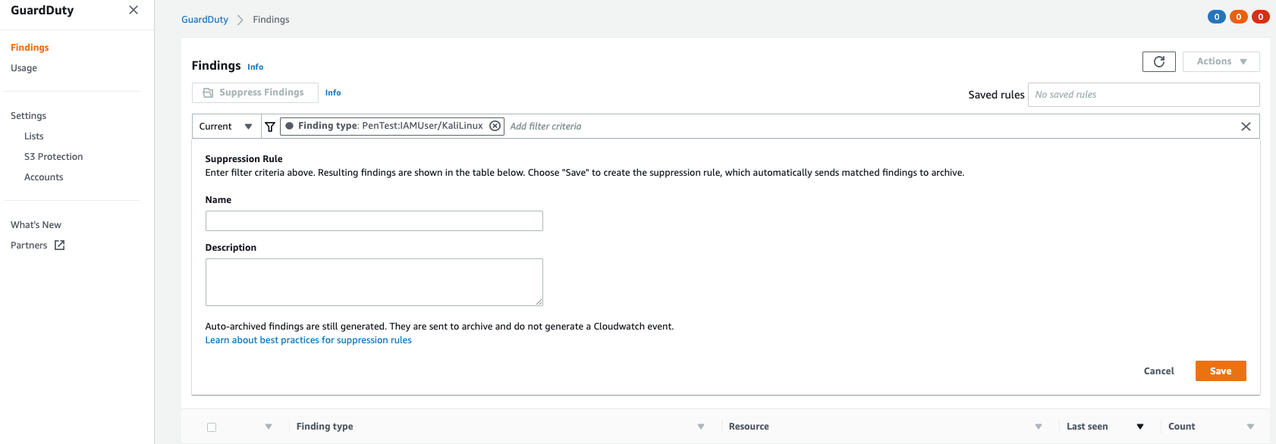
Amazon GuardDuty creates findings associated with AWS IAM resources. IAM resources are global resources, which means that they are not Region-specific. If GuardDuty generates a finding for an IAM API call that is not Region-specific, such as ListGroups (for example, PenTest:IAMUser/KaliLinux) that finding is created in all GuardDuty Regions and ingested into Security Hub in every Region. You want to implement suppression rules in GuardDuty so that you don’t have multiple copies of this finding in your Security Hub delegated administrator account finding aggregation Region.

To implement AWS GuardDuty suppression rules (Console)

To reduce the duplication of findings in Security Hub, suppress global GuardDuty findings in all Regions except the Security Hub aggregation Region. For example, if you are aggregating Security Hub findings in us-east-1 and your environment uses all commercial AWS Regions in the United States, you would add a suppression rule in GuardDuty in us-east-2, us-west-1, and us-west-2.

To create AWS GuardDuty suppression rules using the AWS console:

  1. Navigate to the GuardDuty console and select the Findings link on the left side of the screen.
Figure 2. Creating GuardDuty suppression rules

Figure 2. Creating GuardDuty suppression rules

  1. Filter to search for the findings you want to suppress, and click Save / edit in the search bar.
  2. Enter a name and description for the suppression rule and save it.

To implement AWS GuardDuty suppression rules (CLI)

Alternatively, you can create AWS GuardDuty suppression rules using the CreateFilter API via CLI.

  1. Create a JSON file with your desired suppression filter criteria for the suppression rule.
  2. The following CLI command will test your filter criteria for AWS GuardDuty findings that will be suppressed:
  3. aws guardduty list-findings –detector-id 12abc34d567e8fa901bc2d34e56789f0 –finding-criteria file://criteria.json

  4. The following CLI command will create a filter for AWS GuardDuty findings that will be suppressed:
  5. aws guardduty create-filter –action ARCHIVE –detector-id 12abc34d567e8fa901bc2d34e56789f0 –name yourfiltername –finding-criteria file://criteria.json

For more details for creating AWS GuardDuty suppression rules, see Creating AWS GuardDuty suppression rules.

Reduce AWS Config cost by recording global resources in one Region

Like GuardDuty, AWS Config also records supported types of global resources, which are not tied to a specific Region and can be used in all Regions. The global resource types that AWS Config supports are IAM users, groups, roles, and customer managed policies. The configuration details for a specific global resource are the same in all Regions. If you have AWS Security Hub AWS Foundational Best Practices enabled, the feature has certain checks for global resources in AWS Config that you need to disable in all Regions except the aggregated Region.

Customize AWS Config for global resources

If you customize AWS Config in multiple Regions to record global resources, AWS Config creates multiple configuration items each time a global resource changes, one configuration item for each Region. Costs for each configuration item can be found on AWS Config pricing. These configuration items will contain identical data. To prevent duplicate configuration items, consider customizing AWS Config in only one Region to record global resources, unless you want those configuration items to be available in multiple Regions. See this blog post for a comprehensive list of additional AWS Config best practices.

To customize AWS Config for global resources (Console)

Follow the steps below to change the AWS Config global resource configuration in the AWS Console.

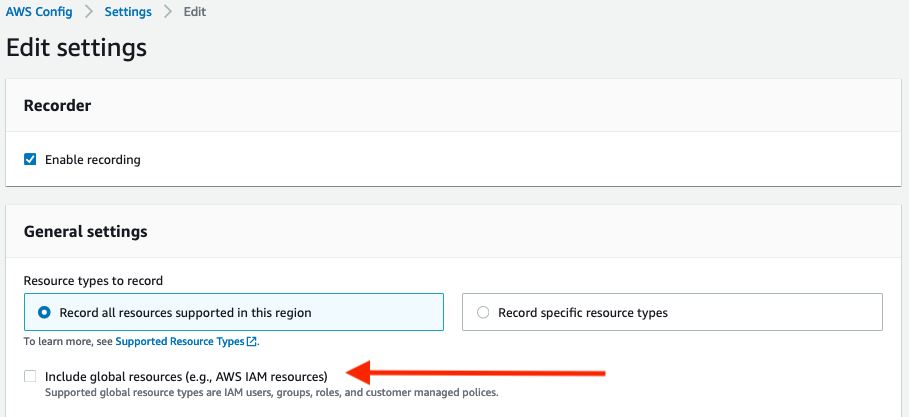
  1. Navigate to the AWS Config console and select Settings on the left side of the screen
  2. Click Edit in the top right corner
  3. Uncheck the Include global resources checkbox.
  4. Repeat these steps for each Region AWS Config is enabled, except the Region where you would like to track global resources.
Figure 3. AWS Config global resource setting

Figure 3. AWS Config global resource setting

To customize AWS Config for global resources (CLI)

Alternatively, you can disable the global resource tracking in AWS Config using the CLI.

aws configservice put-configuration-recorder –configuration-recorder name=default,roleARN=arn:aws:iam::123456789012:role/config-role –recording-group allSupported=true,includeGlobalResourceTypes=false

If you have deployed AWS Config using these CloudFormation templates, you would set the IncludeGlobalResourceTypes to False under the AWS::Config::ConfigurationRecorder for the Regions you do not want to track global resources, and set the value to True in the aggregated Region where you would like to use to track global resources. You can use the CloudFormation StackSets multiple AWS Region deployment feature to deploy the CloudFormation template in all AWS Regions where AWS Config is enabled.

For more details for AWS Config global resources, see Selecting AWS Config resources to record.

Disable AWS Security Hub AWS Foundational Best Practices periodic controls associated with global resources

AWS Security Hub AWS Foundational Best Practices perform checks against the resources in your AWS environment utilizing AWS Config rules. After you have disabled the AWS Config global resources in all Regions except for the Region that runs global recording, disable the Security Hub controls that deal with global resources as shown in Figure 5 below.

You can disable AWS Security Hub controls relating to global resources using the console or CLI.

To disable AWS Security Hub controls (Console)

Follow the steps below to disable Security Hub controls that deal with global resources in the AWS Console.

  1. Navigate to the Security Hub console and select Security Standards on the left side of the screen.
  2. Click on the AWS Foundation Security Best Practices v.1.0.0 security standard.
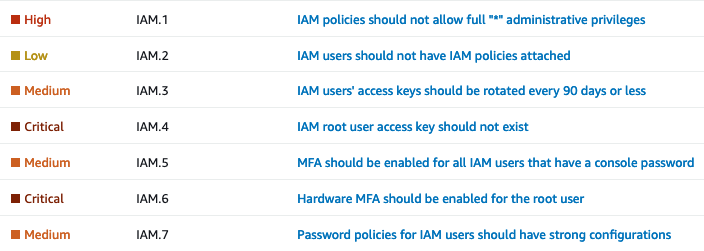
  3. Then use the filter box to search for IAM. Now you should be able to see security controls IAM.1-IAM.7, which are Security Hub global controls.
  4. Figure 4. Security Hub global controls

    Figure 4. Security Hub global controls

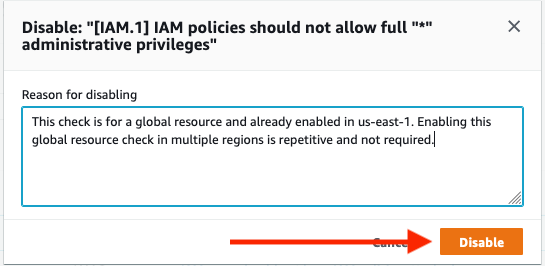
  5. Click on each control and select Disable in the top right corner
  6. After you have disabled resources, add a reason for disabling and choose Disable.
Figure 5. Disabling Security Hub control

Figure 5. Disabling Security Hub control

To disable AWS Security Hub controls (CLI)

Alternatively, you can disable Security Hub controls that deal with global resources using the CLI.

aws securityhub update-standards-control –standards-control-arn <control ARN> –control-status “DISABLED” –disabled-reason <description of reason to disable>

This sample CLI command disables Security Hub controls that deal with global resources:

aws securityhub update-standards-control –standards-control-arn “arn:aws:securityhub:us-east-1:123456789012:control/aws-foundational-security-best-practices/v/1.0.0/ACM.1” –control-status “DISABLED” –disabled-reason “Not applicable for my service”

You can also follow instructions to implement a solution to disable specific Security Hub controls for multiple AWS accounts.

Be sure to only disable the Security Hub controls in the Regions where global recording is also disabled. Verify the Security Hub controls associated with global resources are enabled in the same Region where AWS Config global resources are enabled.

After you have completed disabling these controls and recording of global resources, proceed to disable the [Config.1] AWS Config should be enabled control. This specific control requires recording of global resources in order to pass, which is not required to have enabled in multiple Regions.

For more details for AWS Security Hub controls, see Disabling and enabling individual AWS Security Hub controls .

Implement automatic remediation from a central Region

Once findings are consolidated and ingested into Security Hub across all your organization’s AWS accounts, you should implement auto-remediation where possible, including everything from resource misconfigurations to automated quarantine of infected EC2 instances. Security Hub provides multiple ways to achieve this through end-to-end automation with EventBridge or through human-triggered automation with Security Hub Custom Actions. You can deploy automatic remediation solutions in a single Region to perform cross-Region remediation. This helps you deploy fewer resources, saving money and operational overhead. For more information on how to enable the solution for Security Hub Automated Response and Remediation, see this blog post.

If you have automation currently in place, it’s important to understand how findings from multiple Regions triggering your automation might be affected. For example, you might have a Lambda function that remediates problems with S3 buckets, where it assumes it is being invoked in the same Region as the S3 bucket it needs to remediate. With cross-Region aggregation, your Lambda might need to make a cross-Region AWS SDK call. The Lambda function will run in the Region where the aggregation occurs, but the bucket could be in another Region, so you might have to adjust your function to handle that situation. Also, the role associated with the Lambda function could have its privileges limited to a single Region. If you intend the same function to work in all Regions, you might need change the IAM policy for the IAM role used by the Lambda. Make sure to check Service Control Policies in AWS Organizations, if you use them, because they can also deny actions in one Region while allowing them in another Region.

When enabling cross-Region finding aggregation, you’ll need to understand how any automatic remediation that might be in place today could be affected. Be sure to test your remediation functions on resources in various Regions, to be sure remediation works in all Regions you monitor.

Conclusion

This blog post highlights configurations you can take advantage of to reduce operational overhead and provide cost savings by using cross-Region finding aggregation in Security Hub. The examples given apply to the majority of AWS environments, and are meant to be action items you can use to improve the overall security and operational effectiveness of your AWS environment.

If you have feedback about this post, submit comments in the Comments section below. If you have any questions about this post, start a thread on the re:Post forum.

Want more AWS Security news? Follow us on Twitter.

Author

Marshall Jones

Marshall is a Worldwide Security Specialist Solutions Architect at AWS. His background is in AWS consulting and security architecture, focused on a variety of security domains including edge, threat detection, and compliance. Today, he is focused on helping enterprise AWS customers adopt and operationalize AWS security services to increase security effectiveness and reduce risk.

Author

Jonathan Nguyen

Jonathan is a Shared Delivery Team Senior Security Consultant at AWS. His background is in AWS Security with a focus on Threat Detection and Incident Response. Today, he helps enterprise customers develop a comprehensive AWS Security strategy, deploy security solutions at scale, and train customers on AWS Security best practices.

Improved client-side encryption: Explicit KeyIds and key commitment

Post Syndicated from Alex Tribble original https://aws.amazon.com/blogs/security/improved-client-side-encryption-explicit-keyids-and-key-commitment/

I’m excited to announce the launch of two new features in the AWS Encryption SDK (ESDK): local KeyId filtering and key commitment. These features each enhance security for our customers, acting as additional layers of protection for your most critical data. In this post I’ll tell you how they work. Let’s dig in.

The ESDK is a client-side encryption library designed to make it easy for you to implement client-side encryption in your application using industry standards and best practices. Since the security of your encryption is only as strong as the security of your key management, the ESDK integrates with the AWS Key Management Service (AWS KMS), though the ESDK doesn’t require you to use any particular source of keys. When using AWS KMS, the ESDK wraps data keys to one or more customer master keys (CMKs) stored in AWS KMS on encrypt, and calls AWS KMS again on decrypt to unwrap the keys.

It’s important to use only CMKs you trust. If you encrypt to an untrusted CMK, someone with access to the message and that CMK could decrypt your message. It’s equally important to only use trusted CMKs on decrypt! Decrypting with an untrusted CMK could expose you to ciphertext substitution, where you could decrypt a message that was valid, but written by an untrusted actor. There are several controls you can use to prevent this. I recommend a belt-and-suspenders approach. (Technically, this post’s approach is more like a belt, suspenders, and an extra pair of pants.)

The first two controls aren’t new, but they’re important to consider. First, you should configure your application with an AWS Identity and Access Management (IAM) policy that only allows it to use specific CMKs. An IAM policy allowing Decrypt on “Resource”:”*” might be appropriate for a development or testing account, but production accounts should list out CMKs explicitly. Take a look at our best practices for IAM policies for use with AWS KMS for more detailed guidance. Using IAM policy to control access to specific CMKs is a powerful control, because you can programmatically audit that the policy is being used across all of your accounts. To help with this, AWS Config has added new rules and AWS Security Hub added new controls to detect existing IAM policies that might allow broader use of CMKs than you intended. We recommend that you enable Security Hub’s Foundational Security Best Practices standard in all of your accounts and regions. This standard includes a set of vetted automated security checks that can help you assess your security posture across your AWS environment. To help you when writing new policies, the IAM policy visual editor in the AWS Management Console warns you if you are about to create a new policy that would add the “Resource”:”*” condition in any policy.

The second control to consider is to make sure you’re passing the KeyId parameter to AWS KMS on Decrypt and ReEncrypt requests. KeyId is optional for symmetric CMKs on these requests, since the ciphertext blob that the Encrypt request returns includes the KeyId as metadata embedded in the blob. That’s quite useful—it’s easier to use, and means you can’t (permanently) lose track of the KeyId without also losing the ciphertext. That’s an important concern for data that you need to access over long periods of time. Data stores that would otherwise include the ciphertext and KeyId as separate objects get re-architected over time and the mapping between the two objects might be lost. If you explicitly pass the KeyId in a decrypt operation, AWS KMS will only use that KeyId to decrypt, and you won’t be surprised by using an untrusted CMK. As a best practice, pass KeyId whenever you know it. ESDK messages always include the KeyId; as part of this release, the ESDK will now always pass KeyId when making AWS KMS Decrypt requests.

A third control to protect you from using an unexpected CMK is called local KeyId filtering. If you explicitly pass the KeyId of an untrusted CMK, you would still be open to ciphertext substitution—so you need to be sure you’re only passing KeyIds that you trust. The ESDK will now filter KeyIds locally by using a list of trusted CMKs or AWS account IDs you configure. This enforcement happens client-side, before calling AWS KMS. Let’s walk through a code sample. I’ll use Java here, but this feature is available in all of the supported languages of the ESDK.

Let’s say your app is decrypting ESDK messages read out of an Amazon Simple Queue Service (Amazon SQS) queue. Somewhere you’ll likely have a function like this:

public byte[] decryptMessage(final byte[] messageBytes,
                             final Map<String, String> encryptionContext) {
    // The Amazon Resource Name (ARN) of your CMK.
    final String keyArn = "arn:aws:kms:us-west-2:111122223333:key/1234abcd-12ab-34cd-56ef-1234567890ab";

    // 1. Instantiate the SDK
    AwsCrypto crypto = AwsCrypto.builder().build();

Now, when you create a KmsMasterKeyProvider, you’ll configure it with one or more KeyIds you expect to use. I’m passing a single element here for simplicity.

	// 2. Instantiate a KMS master key provider in Strict Mode using buildStrict()
    final KmsMasterKeyProvider keyProvider = KmsMasterKeyProvider.builder().buildStrict(keyArn); 

Decrypt the message as normal. The ESDK will check each encrypted data key against the list of KeyIds configured at creation: in the preceeding example, the single CMK in keyArn. The ESDK will only call AWS KMS for matching encrypted data keys; if none match, it will throw a CannotUnwrapDataKeyException.

	// 3. Decrypt the message.
    final CryptoResult<byte[], KmsMasterKey> decryptResult = crypto.decryptData(keyProvider, messageBytes);

    // 4. Validate the encryption context.
    //

(See our documentation for more information on how encryption context provides additional authentication features!)

	checkEncryptionContext(decryptResult, encryptionContext);

    // 5. Return the decrypted bytes.
    return decryptResult.getResult();
}

We recommend that everyone using the ESDK with AWS KMS adopt local KeyId filtering. How you do this varies by language—the ESDK Developer Guide provides detailed instructions and example code.

I’m especially excited to announce the second new feature of the ESDK, key commitment, which addresses a non-obvious property of modern symmetric ciphers used in the industry (including the Advanced Encryption Standard (AES)). These ciphers have the property that decrypting a single ciphertext with two different keys could give different plaintexts! Picking a pair of keys that decrypt to two specific messages involves trying random keys until you get the message you want, making it too expensive for most messages. However, if you’re encrypting messages of a few bytes, it might be feasible. Most authenticated encryption schemes, such as AES-GCM, don’t solve for this issue. Instead, they prevent someone who doesn’t control the keys from tampering with the ciphertext. But someone who controls both keys can craft a ciphertext that will properly authenticate under each key by using AES-GCM.

All of this means that if a sender can get two parties to use different keys, those two parties could decrypt the exact same ciphertext and get different results. That could be problematic if the message reads, for example, as “sell 1000 shares” to one party, and “buy 1000 shares” to another.

The ESDK solves this problem for you with key commitment. Key commitment means that only a single data key can decrypt a given message, and that trying to use any other data key will result in a failed authentication check and a failure to decrypt. This property allows for senders and recipients of encrypted messages to know that everyone will see the same plaintext message after decryption.

Key commitment is on by default in version 2.0 of the ESDK. This is a breaking change from earlier versions. Existing customers should follow the ESDK migration guide for their language to upgrade from 1.x versions of the ESDK currently in their environment. I recommend a thoughtful and careful migration.

AWS is always looking for feedback on ways to improve our services and tools. Security-related concerns can be reported to AWS Security at [email protected]. We’re deeply grateful for security research, and we’d like to thank Thai Duong from Google’s security team for reaching out to us. I’d also like to thank my colleagues on the AWS Crypto Tools team for their collaboration, dedication, and commitment (pun intended) to continuously improving our libraries.

If you have feedback about this post, submit comments in the Comments section below. If you have questions about this post, start a new thread on the AWS Crypto Tools forum or contact AWS Support.

Want more AWS Security how-to content, news, and feature announcements? Follow us on Twitter.

Author

Alex Tribble

Alex is a Principal Software Development Engineer in AWS Crypto Tools. She joined Amazon in 2008 and has spent her time building security platforms, protecting availability, and generally making things faster and cheaper. Outside of work, she, her wife, and children love to pack as much stuff into as few bikes as possible.