Post Syndicated from Explosm.net original https://explosm.net/comics/31742
New Cyanide and Happiness Comic
Post Syndicated from Explosm.net original https://explosm.net/comics/31742
New Cyanide and Happiness Comic
Post Syndicated from Akash Kumar original https://aws.amazon.com/blogs/security/how-to-build-a-unified-authorization-layer-for-identity-providers-with-amazon-verified-permissions/
Enterprises often have an identity provider (IdP) for their employees and another for their customers. Using multiple IdPs allows you to apply different access controls and policies for employees and for customers. However, managing multiple identity systems can be complex. A unified authorization layer can ease administration by centralizing access policies for APIs regardless of the user’s IdP. The authorization layer evaluates access tokens from any authorized IdP before allowing API access. This removes authorization logic from the APIs and simplifies specifying organization-wide policies. Potential drawbacks include additional complexity in the authorization layer. However, simplifying the management of policies reduces cost of ownership and the likelihood of errors.
Consider a veterinary clinic that has an IdP for their employees. Their clients, the pet owners, would have a separate IdP. Employees might have different sign-in requirements than the clients. These requirements could include features such as multi-factor authentication (MFA) or additional auditing functionality. Applying identical access controls for clients may not be desirable. The clinic’s scheduling application would manage access from both the clinic employees and pet owners. By implementing a unified authorization layer, the scheduling app doesn’t need to be aware of the different IdPs or tokens. The authorization layer handles evaluating tokens and applying policies, such as allowing the clinic employees full access to appointment data while limiting pet owners to just their pet’s records. In this post, we show you an architecture for this situation that demonstrates how to build a unified authorization layer using multiple Amazon Cognito user pools, Amazon Verified Permissions, and an AWS Lambda authorizer for Amazon API Gateway-backed APIs.
In the architecture, API Gateway exposes APIs to provide access to backend resources. API Gateway is a fully-managed service that allows developers to build APIs that act as an entry point for applications. To integrate API Gateway with multiple IdPs, you can use a Lambda authorizer to control access to the API. The IdP in this architecture is Amazon Cognito, which provides the authentication function for users before they’re authorized by Verified Permissions, which implements fine-grained authorization on resources in an application. Keep in mind that Verified Permissions has limits on policy sizes and requests per second. Large deployments might require a different policy store or a caching layer. The four services work together to combine multiple IdPs into a unified authorization layer. The architecture isn’t limited to the Cognito IdP — third-party IdPs that generate JSON Web Tokens (JWTs) can be used, including combinations of different IdPs.
This sample architecture relies on user-pool multi-tenancy for user authentication. It uses Cognito user pools to assign authenticated users a set of temporary and least-privilege credentials for application access. Once users are authenticated, they are authorized to access backend functions via a Lambda Authorizer function. This function interfaces with Verified Permissions to apply the appropriate access policy based on user attributes.
This sample architecture is based on the scenario of an application that has two sets of users: an internal set of users, veterinarians, as well as an external set of users, clients, with each group having specific access to the API. Figure 1 shows the user request flow.

Figure 1: User request flow
Let’s go through the request flow to understand what happens at each step, as shown in Figure 1:
Note: If Cognito is the IdP, then Verified Permissions can authorize the user from their JWT directly with the IsAuthorizedWithToken API.
Note: To further optimize the Lambda authorizer, the authorization decision can be cached or disabled, depending on your needs. By enabling caching, you can improve the performance, because the authorization policy will be returned from the cache whenever there is a cache key match. To learn more, see Configure a Lambda authorizer using the API Gateway console.
This walkthrough demonstrates the preceding scenario for an authorization layer supporting veterinarians and clients. Each set of users will have their own distinct Amazon Cognito user pool.
Verified Permissions policies associated with each Cognito pool enforce access controls. In the veterinarian pool, veterinarians are only allowed to access data for their own patients. Similarly, in the client pool, clients are only able to view and access their own data. This keeps data properly segmented and secured between veterinarians and clients.
The example internal and external policies, along with Cognito serving as an IdP, allow the veterinarian users to federate in to the application through one IdP, while the external clients must use another IdP. This, coupled with the associated authorization policies, allows you to create and customize fine-grained access policies for each user group.
To validate the access request with the policy store, the Lambda authorizer execution role also requires the verifiedpermissions:IsAuthorized action.
Although our example Verified Permissions policies are relatively simple, Cedar policy language is extensive and allows you to define custom rules for your business needs. For example, you could develop a policy that allows veterinarians to access client records only during the day of the client’s appointment.
The architecture is based on a user-pool multi-tenancy for user authentication. It uses Amazon Cognito user pools to assign authenticated users a set of temporary and least privilege credentials for application access. After users are authenticated, they are authorized to access APIs through a Lambda function. This function interfaces with Verified Permissions to apply the appropriate access policy based on user attributes.
You need the following prerequisites:
Note: We recommend that you use a virtual environment or virtualenvwrapper to isolate the sample from the rest of your Python environment.
To install on Ubuntu/Debian, use the following command:
To install on Mac with Homebrew, using the following command:
Note: This sample code should be used to test the solution and is not intended to be used in a production account.
To implement this reference architecture, you will use the following services:
Note: We tested this architecture in the us-east-1 AWS Region. Before you select a Region, verify that the necessary services — Amazon Verified Permissions, Amazon Cognito, API Gateway, and Lambda — are available in those Regions.
From within the directory where you downloaded the sample code from GitHub, first run the following command to package the Lambda functions. Then run the next command to generate a random Cognito user password and create the resources described in the previous section.
Note: In this case, you’re generating a random user password for demonstration purposes. Follow best practices for user passwords in production implementations.
Run the following commands to open the Cognito UI in your browser and then sign in with your credentials. This validates that the previous commands created Cognito users successfully.
Note: When you run the commands, they return the username and password that you should use to sign in.
Because you haven’t installed a web application that would respond to the redirect request, Cognito will redirect to localhost, which might look like an error. The key aspect is that after a successful sign-in, there is a URL similar to the following in the navigation bar of your browser.
Before you protect the API with Cognito so that only authorized users can access it, let’s verify that the configuration is correct and API Gateway serves the API. The following command makes a curl request to API Gateway to retrieve data from the API service.
In the next step, you deploy a Verified Permissions policy store and a Lambda authorizer. The policy store contains the policies for user authorization. The Lambda authorizer verifies users’ access tokens and authorizes the users through Verified Permissions.
Run the following command to update existing resources and create a Lambda authorizer and Verified Permissions policy store.
Begin your testing with the following request, which doesn’t include an access token.
Note: Wait for a few minutes to allow API Gateway to deploy before you run the following commands.
The architecture denied the request with the message “Unauthorized.” At this point, API Gateway expects a header named Authorization (case sensitive) in the request. If there’s no authorization header, API Gateway denies the request before it reaches the Lambda authorizer. This is a way to filter out requests that don’t include required information.
Use the following command for the next test. In this test, you pass the required header, but the token is invalid because it wasn’t issued by Cognito and is instead a simple JWT-format token stored in ./helper.sh. To learn more about how to decode and validate a JWT, see Decode and verify a Cognito JSON token.
This time the message is different. The Lambda authorizer received the request and identified the token as invalid and responded with the message “User is not authorized to access this resource.”
To make a successful request to the protected API, your code must perform the following steps:
To finish testing, programmatically sign in to the Cognito UI, acquire a valid access token, and make a request to API Gateway. Run the following commands to call the protected internal and external APIs.
Now calling external userpool users for accessing request
This time, you receive a response with data from the API service. Let’s recap the steps that the example code performed:
In each of the tests, internal and external, the architecture denied the request because the Verified Permissions policies denied access to the user. In the internal user pool, the policies only allow veterinarians to see their own patients’ data. Similarly, in the external user pool, the policies only allow clients to see their own data.
Run the following command to delete the deployed resources and clean up.
Verified Permissions is integrated with AWS CloudTrail, a service that provides a record of actions taken by a user, role, or AWS service in Verified Permissions. CloudTrail captures API calls for Verified Permissions as events. You can choose to capture actions performed on a Verified Permissions policy store by the Lambda authorizer. Verified Permissions logs can also be injected into your security information and event management (SEIM) solution for security analysis and compliance. For information about API call quotas, see Quotas for Amazon Verified Permission.
In this post, we demonstrated how you can use multiple Amazon Cognito user pools alongside Amazon Verified Permissions to build a single access layer to APIs. We used Cognito in this example, but you could implement the solution with another third-party IdP instead. As a next step, explore the Cedar playground to test policies that can be used with Verified Permissions, or expand this solution by integrating a third-party IdP.
If you have feedback about this post, submit comments in the Comments section below. If you have questions about this post, contact AWS Support.
Want more AWS Security news? Follow us on Twitter.
Post Syndicated from Patrick Kennedy original https://www.servethehome.com/ikoolcore-r2-review-huge-leap-for-the-small-system-intel/
We take a look at the iKoolCore R2. This is perhaps the smallest 8 core, 4x 2.5GbE, WiFi, NVMe SSD, system you can get
The post iKoolCore R2 Review Huge Leap for the Small System appeared first on ServeTheHome.
Post Syndicated from Gwen Davis original https://github.blog/2024-01-22-how-to-get-in-the-flow-while-coding-and-why-its-important/
It’s the dream: your ideas are flowing, time and space fade away, the path ahead of you is clear, you’re moving at the speed of thought, and every click you make is gold.
This is called being in the flow or flow state. When you’re in the flow, you block out the world, are fully immersed in what you’re doing, and enjoy increased creativity, innovation, and happiness.
“Being in the flow is magical,” says Jonathan Carter, technical advisor of the CEO at GitHub. “You tell your teammates they can go to lunch and you’ll catch them later—not because you’re a workaholic, but because there’s truly nothing else you’d rather be doing right now.”
In this blog, we’ll explore what flow state entails, its benefits, and three tips for reaching it the next time you sit down to code. Let’s go.
The concept of flow state came from positive psychologist Mihaly Csikszentmihalyi and his 1990 book, Flow: The Psychology of Optimal Experience. In it, Csikszentmihalyi describes nine dimensions of flow:
Csikszentmihalyi discovered these dimensions by conducting research to understand how people achieve productivity and happiness. He found that in people’s favorite, most absorbed moments, their thoughts and actions “flowed,” and brought unrivaled motivation, meaning, and creativity.
“Software has historically been viewed as mathematical or scientific in nature, but I would argue that writing code has more in common with other creative acts,” says Idan Gazit, senior director of research at GitHub. “Whether you’re writing an essay or writing a program, the challenge is getting into the headspace where you can untangle the thing you want to express.”
When developers reach that coveted frame of mind, their productivity soars. According to our recent developer productivity research, developers produce higher quality work when they can easily collaborate—a hallmark of flow state—through comments, pull requests, issues, etc. According to the study, developers reported that effective collaboration provides a host of benefits:
On the flip side, when developers can’t freely collaborate, their work suffers (it takes 23 minutes, on average, to get back into the task at hand after an interruption, according to a study from the University of California, Irvine).
And flow state isn’t important just for individual developers—it helps businesses, too.
“When it comes to business success, flow state is everything,” says Chris Reddington, senior manager of developer advocacy at GitHub. This is because today’s environments use dozens of languages and often leverage multiple cloud providers, creating pressure, complexity, and distractions. He adds, “The more we can help engineering teams stay in the flow, where they are just focused on solving those bigger problems, the better.”
So, how can you achieve flow state during your day-to-day tasks? The following tips should help you reach the flow state and stay there—regardless of industry or where you are in your developer career.
Creating a distraction-free environment that’s conducive to work can pay huge dividends. Here are some ideas:
Of course, even with our best attempts, distractions happen. If you need to step away from the task at hand, that’s okay. Gazit also suggests pair programming or solution design to help overcome mental hurdles.
“It’s a great magic trick,” he says. “Stepping back and talking through the problem with a teammate is often the fastest route to getting unstuck.”
He also adds that GitHub Copilot can be helpful for this.
“GitHub Copilot is never busy,” he says. “I’m not distracting it when I put it to work. Debugging with a rubber duck is fantastic, but GitHub Copilot is the rubber duck that talks back. It helps me reason about the solution space and suggests approaches I wouldn’t have considered.”

You can also achieve flow state by ensuring you have a clear path for accomplishing your goal.
Gazit describes how he can get into the flow state when he correctly nails the balance of architectural work. This is especially important when it comes to complex tasks like designing an API, where you first have to build an architecture while considering how it will be used and what kind of load it’ll put on your database.
“If I do the architectural work well, I can then do the bricklaying with a feeling that I’m super clear on what I’m doing,” he says. “I know exactly where I’m going.”
Reddington notes that mapping your work and the practice of blocking time, as mentioned above, often go hand in hand.
“When I block out chunks of time, I can figure out how I’m going to solve the problems I’m tackling appropriately,” he says.
However, he warns that you’re not always going to fix the things you’re trying to do in the allotted blocked time. But at least you can start mentally organizing.
Finding the optimal mix of challenge and skill is also important to achieve flow. If something is too easy, you’ll be bored and unsatisfied. If it’s too challenging on the other hand, you’ll be stressed about not not getting it done, which will also keep flow elusive.
“A good mix can make all the difference,” Reddington says.
You won’t be able to hit flow state if you’re not enjoying yourself.
“It’s only when you’re not worrying about meetings, or your email, or what you’re going to have for dinner, that you can hit the flow state,” Carter says.
It’s a similar experience to being entertained.
“It’s like when you’re reading a book and you just have to finish the next chapter or you’re binging Netflix and you need to see the next episode,” he says. “It’s that same energy.”
Enjoyable work pertains to teams, too.
Carter notes that office work enjoyment can be increased by clearly articulating the outcomes you’re trying to accomplish. When a product manager writes a well-articulated issue that clarifies the end result, there’s a higher likelihood that the team will be more motivated to take that work on and do it quickly.
“They’re not focused on the complexity anymore but on the desire to get there,” he says.
Similarly, if you’re involved in a project you don’t enjoy, it can be useful to rethink why you’re doing that work in the first place.
“I find that if I can recreate the mindset of why we should solve the problem, I can bootstrap curiosity and get back into the flow state,” he says.
Achieving flow state can significantly enhance norepinephrine, dopamine, anandamide, serotonin, and endorphins—increasing feelings of motivation and intrinsic reward, as well as pattern recognition and lateral thinking ability. It’s a win for productivity, well-being, and keeping the intrinsic developer fire strong.
“With flow state, you’re never at a point where you’re performing the same mechanics twice,” Carter says. “You’re learning in response to what you’re doing. You’re naturally interested, building up an unconscious muscle of curiosity. The learning potential is endless.”
To learn more about how businesses are incorporating flow state into their processes, read Developer experience: What is it and why should you care? and explore how GitHub can help.
The post How to get in the flow while coding (and why it’s important) appeared first on The GitHub Blog.
Post Syndicated from Antje Barth original https://aws.amazon.com/blogs/aws/aws-weekly-roundup-amazon-ecs-rds-for-mysql-emr-studio-aws-community-and-more-january-22-2024/
As usual, a lot has happened in the Amazon Web Services (AWS) universe this past week. I’m also excited about all the AWS Community events and initiatives that are happening around the world. Let’s take a look together!
Last week’s launches
Here are some launches that got my attention:
Amazon Elastic Container Service (Amazon ECS) now supports managed instance draining – Managed instance draining allows you to gracefully shutdown workloads deployed on Amazon Elastic Compute Cloud (Amazon EC2) instances by safely stopping and rescheduling them to other, non-terminating instances. This new capability streamlines infrastructure maintenance, such as deploying a new AMI version, eliminating the need for custom solutions to shutdown instances without disrupting their workloads. To learn more, check out Nathan’s post on the AWS Containers Blog.
Amazon Relational Database Service (Amazon RDS) for MySQL now supports multi-source replication – Using multi-source replication, you can configure multiple RDS for MySQL database instances as sources for a single target database instance. This feature facilitates tasks such as merging shards into a single target, consolidating data for analytics, or creating long-term backups within a single RDS for MySQL instance. The Amazon RDS for MySQL User Guide has all the details.
Amazon EMR Studio now comes with simplified create experience and improved start times – With the simplified console experience for creating EMR Studio, you can launch interactive and batch workloads with default settings more easily. The improved start times let you launch EMR Studio Workspaces for performing interactive analysis in notebooks in seconds. Have a look at the Amazon EMR User Guide to learn more.
For a full list of AWS announcements, be sure to keep an eye on the What’s New at AWS page.
Other AWS news
Here are some additional projects, programs, and news items that you might find interesting:
 Summarize news using Amazon Bedrock – My colleague Danilo built this application to summarize the most recent news from an RSS or Atom feed using Amazon Bedrock. The application is deployed as an AWS Lambda function. The function downloads the most recent entries from an RSS or Atom feed, downloads the linked content, extracts text, and makes a summary.
 AWS Community Builders program – Interested in joining our AWS Community Builders program? The 2024 application is open until January 28. The AWS Community Builders program offers technical resources, education, and networking opportunities to AWS technical enthusiasts who are passionate about sharing knowledge and connecting with the technical community.
 AWS User Groups – The AWS User Group Yaounde Cameroon embarked on a 12-week workshop challenge. Over 12 weeks, participants explored various aspects of AWS and cloud computing, including architecture, security, storage, and more, to develop skills and share knowledge. You can read more about this amazing initiative in this LinkedIn post.
AWS open-source news and updates – My colleague Ricardo writes this weekly open source newsletter in which he highlights new open source projects, tools, and demos from the AWS Community.
Upcoming AWS events
Check your calendars and sign up for these AWS events:
 AWS Innovate: AI/ML and Data Edition – Register now for the Asia Pacific & Japan AWS Innovate online conference on February 22, 2024, to explore, discover, and learn how to innovate with artificial intelligence (AI) and machine learning (ML). Choose from over 50 sessions in three languages and get hands-on with technical demos aimed at generative AI builders.
 AWS Community re:Invent re:Caps – Join a Community re:Cap event organized by volunteers from AWS User Groups and AWS Cloud Clubs around the world to learn about the latest announcements from AWS re:Invent.
You can browse all upcoming in-person and virtual events.
That’s all for this week. Check back next Monday for another Weekly Roundup!
— Antje
This post is part of our Weekly Roundup series. Check back each week for a quick roundup of interesting news and announcements from AWS!
Post Syndicated from Kedasha Kerr original https://github.blog/2024-01-22-10-unexpected-ways-to-use-github-copilot/
Writing code is more than just writing code. There’s commit messages to write, CLI commands to execute, and obscure syntax to try to remember. While you’ve probably used GitHub Copilot to support your coding, did you know it can also support your other workloads?
GitHub Copilot is widely known for its ability to help developers write code in their IDE. Today, I want to show you how the AI assistant’s abilities can extend beyond just code generation. In this post, we’ll explore 10 use cases where GitHub Copilot can help reduce friction during your developer workflow. This includes pull requests, working from the command line, debugging CI/CD workflows, and much more!
Let’s get into it.
If you ever forget how to run a particular command when you’re working in your VS Code, GitHub Copilot Chat is here to help! With the new @terminal agent in VS Code, you can ask GitHub Copilot how to run a particular command. Once it generates a response, you can then click the “Insert into Terminal” button to run the suggested command.
Let me show you what I mean:
The @terminal agent in VS Code also has context about the integrated shell terminal, so it can help you even further.
We’ve all been there where we made a sizable pull request with tons of files and hundreds of changes. But, sometimes, it can be hard to remember every little detail that we’ve implemented or changed.
Yet it’s an important part of collaborating with other engineers/developers on my team. After all, if I don’t give them a summary of my proposed changes, I’m not giving them the full context they need to provide an effective review. Thankfully, GitHub Copilot is now integrated into pull requests! This means, with the assistance of AI, you can generate a detailed pull request summary of the changes you made in your files.
Let’s look at how you can generate these summaries:
Now, isn’t that grand! All you have to do is go in and edit what was generated and you have a great, detailed explanation of all the changes you’ve made—with links to changed files!
Note: You will need a Copilot Enterprise plan (which requires GitHub Enterprise Cloud) to use PR summaries. Learn more about this enterprise feature by reading our documentation.
I came across this one recently while making changes in VS Code. GitHub Copilot can help you generate commit messages right in your IDE. If you click on the source control button, you’ll notice a sparkle in the message input box.
Click on those sparkles and voilà, commit messages are generated on your behalf:
I thought this was a pretty nifty feature of GitHub Copilot in VS Code and Visual Studio.
Another way to get help with terminal commands is to use GitHub Copilot in the CLI. This is an extension to GitHub CLI that helps you with general shell commands, Git commands, and gh cli commands.
GitHub Copilot in the CLI is a game-changer that is super useful for reminding you of commands, teaching you new commands or explaining random commands you come across online.
Learn how to get started with GitHub Copilot in the CLI by reading this post!
If you’ve ever gone to a new repository and have no idea what’s happening even though the README is there, you can now use GitHub Copilot Chat to explain the repository to you, right in GitHub.com. Just click on the Copilot icon in the top right corner of the repository and ask whatever you want to know about that repository.
On GitHub.com you can ask Copilot general software related questions, questions about the context of your project, questions about a specific file, or specified lines of code within a file.
Note: You will need a Copilot Enterprise plan (which requires GitHub Enterprise Cloud) to use GitHub Copilot Chat in repositories on GitHub.com. Learn more about this enterprise feature by reading our documentation.
Did you know that in addition to asking for suggestions with comments, you can get help with your code inline? Just highlight the code you want to fix, right click, and select “Fix using Copilot.” Copilot will then provide you with a suggested fix for your code.
This is great to have for those small little fixes we sometimes need right in our current files.
My team and I had a use case where we needed to close over 1,600 invalid GitHub Issues submitted to one of our repositories. I created a custom GitHub Action that automatically closed all 1,600+ issues and implemented the solution with GitHub Copilot.
GitHub Copilot Chat helped me to create the GitHub Action, and also helped me implement the closeIssue() function very quickly by leveraging Octokit to grab all the issues that needed to be closed.
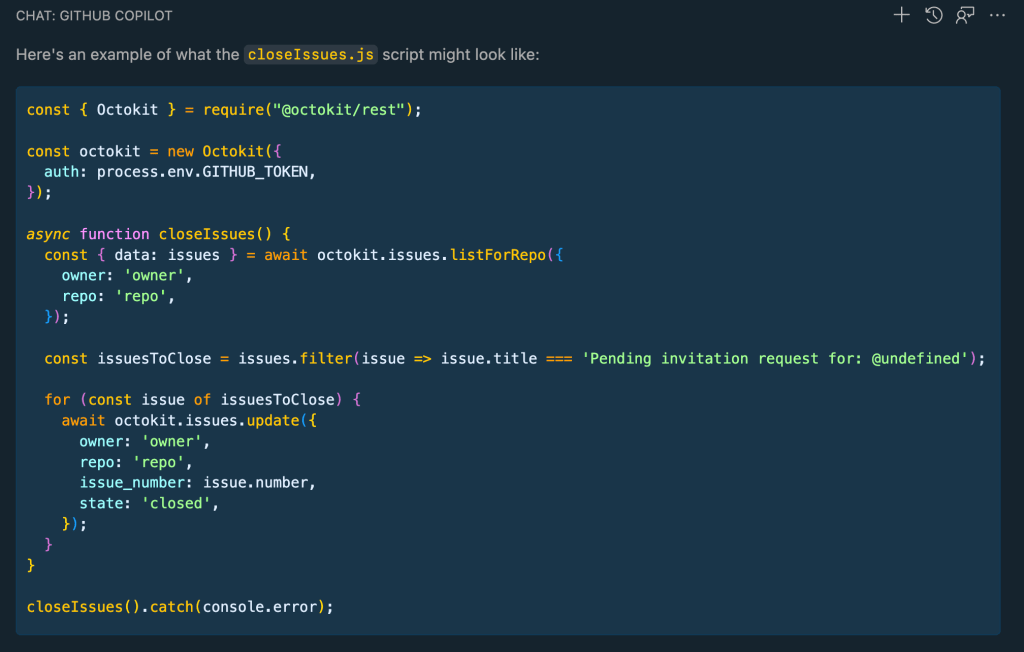
You can read all about how I bulk closed 1000+ GitHub issues in this blog post, but just know that with GitHub Copilot Chat, we went from having 1,600+ open issues, to a measly 64 in a matter of minutes.
We all love documenting our code, but just in case some of us need a little help writing documentation, GitHub Copilot is here to help!
Regardless of your language, you can quickly generate documentation following language specific formats—Docstring for Python, JSDoc for Javascript or Javadoc for Java.
Error messages can often be confusing. With GitHub Copilot in your IDE, you can now get help with error messages right in the terminal. Just highlight the error message, right click, and select “Explain with Copilot.” GitHub Copilot will then provide you with a description of the error and a suggested fix.
You can also bring error messages from your browser console into Copilot Chat so it can explain those messages to you as well with the /explain slash command.
Whenever I have a speaking engagement, I like to create my slides using Slidev, an open source presentation slide builder for developers. I enjoy using it because I can create my slides in Markdown and still make them look splashy! Take a look at this one for example!
Anyway, there was a point in time where I had an issue with deploying my slides to GitHub Pages and I just couldn’t figure out what the issue was. So, of course, I turned to my trusty assistant—GitHub Copilot Chat that helped me debug my way through deploying my slides.
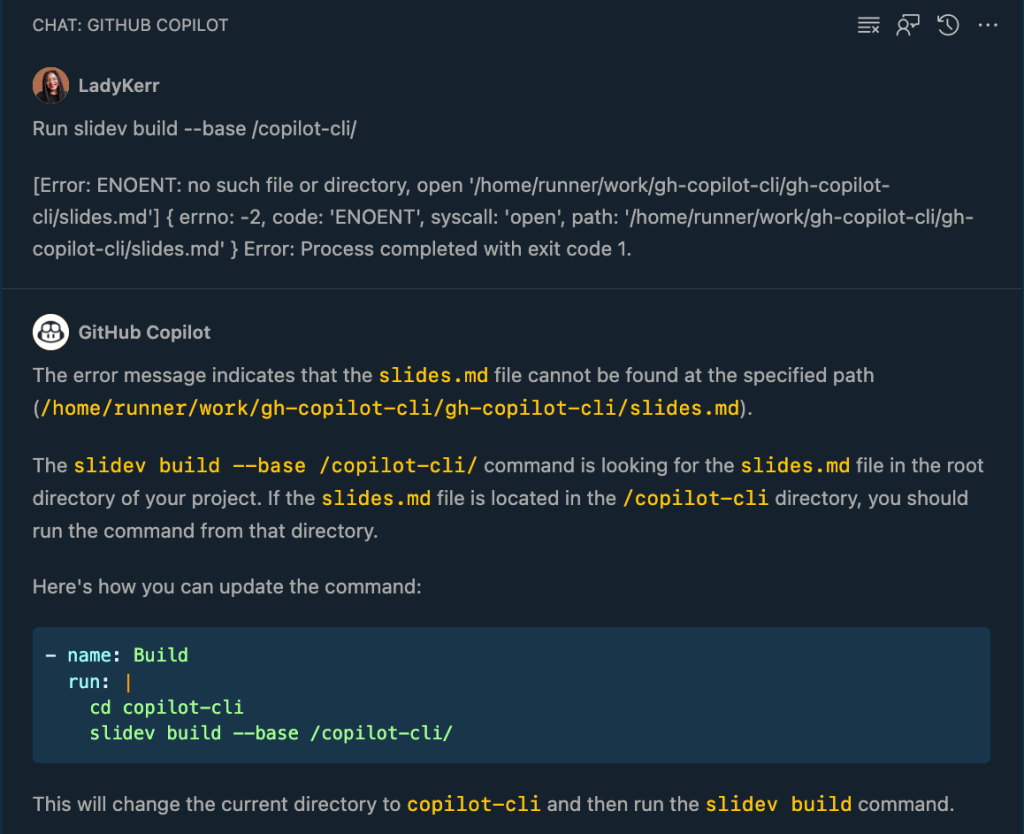
Read more about how I debugged my deployment workflow with GitHub Copilot Chat here.
As you see above, GitHub Copilot extends far beyond your editor and code completion. It is truly evolving to be one of the best tools you can have in your developer toolkit. I’m still learning and discovering new ways to integrate GitHub Copilot into my daily workflow and I hope you give some of the above a chance!
Be sure to sign up for Github Copilot if you haven’t tried it out yet and stay up to date with all that’s happening by subscribing to our developer newsletter for more tips, technical guides, and best practices! You can also drop me a note on X if you have any questions, @itsthatladydev.
Until next time, happy coding!
The post 10 unexpected ways to use GitHub Copilot appeared first on The GitHub Blog.
Post Syndicated from corbet original https://lwn.net/Articles/958178/
Linus Torvalds was able to release 6.8-rc1
and close the 6.8 merge window on time despite losing power to his home for
most of a week. He noted that this merge window is “maybe a bit smaller
“, but 12,239 non-merge changesets found their way into the
than usual
mainline, so it’s not that small. About 8,000 of those changes were
merged since the first-half summary was
written; the second half saw a lot of device-driver updates, but there
were other interesting changes as well.
Post Syndicated from Claudia Chitu original https://aws.amazon.com/blogs/big-data/design-a-data-mesh-on-aws-that-reflects-the-envisioned-organization/
This post is written in collaboration with Claudia Chitu and Spyridon Dosis from ACAST.
Founded in 2014, Acast is the world’s leading independent podcast company, elevating podcast creators and podcast advertisers for the ultimate listening experience. By championing an independent and open ecosystem for podcasting, Acast aims to fuel podcasting with the tools and monetization needed to thrive.
The company uses AWS Cloud services to build data-driven products and scale engineering best practices. To ensure a sustainable data platform amid growth and profitability phases, their tech teams adopted a decentralized data mesh architecture.
In this post, we discuss how Acast overcame the challenge of coupled dependencies between teams working with data at scale by employing the concept of a data mesh.
With an accelerated growth and expansion, Acast encountered a challenge that resonates globally. Acast found itself with diverse business units and a vast amount of data generated across the organization. The existing monolith and centralized architecture was struggling to meet the growing demands of data consumers. Data engineers were finding it increasingly challenging to maintain and scale the data infrastructure, resulting in data access, data silos, and inefficiencies in data management. A key objective was to enhance the end-to-end user experience, starting from the business needs.
Acast needed to address these challenges in order to get to an operational scale, meaning a global maximum of the number of people that can independently operate and deliver value. In this case, Acast tried to tackle the challenge of this monolith structure and the high time to value for product teams, tech teams, end consumers. It’s worth mentioning that they also have other product and tech teams, including operational or business teams, without AWS accounts.
Acast has a variable number of product teams, continuously evolving by merging existing ones, splitting them, adding new people, or simply creating new teams. In the last 2 years, they have had between 10–20 teams, consisting of 4–10 people each. Each team owns at least two AWS accounts, up to 10 accounts, depending on the ownership. The majority of data produced by these accounts is used downstream for business intelligence (BI) purposes and in Amazon Athena, by hundreds of business users every day.
The solution Acast implemented is a data mesh, architected on AWS. The solution mirrors the organizational structure rather than an explicit architectural decision. As per the Inverse Conway Maneuver, Acast’s technology architecture displays isomorphism with the business architecture. In this case, the business users are enabled through the data mesh architecture to get faster time to insights and know directly who the domain specific owners are, speeding up collaboration. This will be further detailed when we discuss the AWS Identity and Access Management (IAM) roles used, because one of the roles is dedicated to the business group.
Acast succeeded in bootstrapping and scaling a new team- and domain-oriented data product and its corresponding infrastructure and setup, resulting in less friction in gathering insights and happier users and consumers.
The success of the implementation meant assessing various aspects of the data infrastructure, data management, and business outcomes. They classified the metrics and indicators in the following categories:
A data mesh is a sociotechnical approach to build a decentralized data architecture by using a domain-oriented, self-serve design (in a software development perspective), and borrows Eric Evans’ theory of domain-driven design and Manuel Pais’ and Matthew Skelton’s theory of team topologies. It’s important to establish the context to understand what data mesh is because it sets the stage for the technical details that follow and can help you understand how the concepts discussed in this post fit into the broader framework of a data mesh.
To recap before diving deeper into Acast’s implementation, the data mesh concept is based on the following principles:
In Acast’s approach of owning the operational and analytical datasets, teams are structured with ownership based on domain, reading directly from the producer of the data, via an API or programmatically from Amazon S3 storage or using Athena as a SQL query engine. Some examples of Acast’s domains are presented in the following figure.

As illustrated in the preceding figure, some domains are loosely coupled to other domains’ operational or analytical endpoints, with a different ownership. Others might have stronger dependency, which is expected, for business (some podcasters can be also advertisers, creating sponsorship creatives and running campaigns for their own shows, or transacting ads using Acast’s software as a service).
Treating data as a product entails three key components: the data itself, the metadata, and the associated code and infrastructure. In this approach, teams responsible for generating data are referred to as producers. These producer teams possess in-depth knowledge about their consumers, understanding how their data product is utilized. Any changes planned by the data producers are communicated in advance to all consumers. This proactive notification ensures that downstream processes are not disrupted. By providing consumers with advance notice, they have sufficient time to prepare for and adapt to the upcoming changes, maintaining a smooth and uninterrupted workflow. The producers run a new version of the initial dataset in parallel, notify the consumers individually, and discuss with them their necessary timeframe to start consuming the new version. When all consumers are using the new version, the producers make the initial version unavailable.
Data schemas are inferred from the common agreed-upon format to share files between teams, which is Parquet in the case of Acast. Data can be shared in files, batched or stream events, and more. Each team has its own AWS account acting as an independent and autonomous entity with its own infrastructure. For orchestration, they use the AWS Cloud Development Kit (AWS CDK) for infrastructure as code (IaC) and AWS Glue Data Catalogs for metadata management. Users can also raise requests to producers to improve the way the data is presented or to enrich the data with new data points for generating a higher business value.
With each team owning an AWS account and a data catalog ID from Athena, it’s straightforward to see this through the lenses of a distributed data lake on top of Amazon S3, with a common catalog mapping all the catalogs from all the accounts.
At the same time, each team can also map other catalogs to their own account and use their own data, which they produce along with the data from other accounts. Unless it is sensitive data, the data can be accessed programmatically or from the AWS Management Console in a self-service manner without being dependent on the data infrastructure engineers. This is a domain-agnostic, shared way to self-serve data. The product discovery happens through the catalog registration. Using only a few standards commonly agreed upon and adopted across the company, for the purpose of interoperability, Acast addressed the fragmented silos and friction to exchange data or consume domain-agnostic data.
With this principle, teams get assurance that the data is secure, trustworthy, and accurate, and appropriate access controls are managed at each domain level. Moreover, on the central account, roles are defined for different types of permissions and access, using AWS IAM Identity Center permissions. All datasets are discoverable from a single central account. The following figure illustrates how it’s instrumented, where two IAM roles are assumed by two types of user (consumer) groups: one that has access to a limited dataset, which is restricted data, and one that has access to non-restricted data. There is also a way to assume any of these roles, for service accounts, such as those used by data processing jobs in Amazon Managed Workflows for Apache Airflow (Amazon MWAA), for example.

The following diagram shows a conceptual architecture of how Acast’s teams are organizing data and collaborating with each other.

Acast used the Well-Architected Framework for the central account to improve its practice running analytical workloads in the cloud. Through the lenses of the tool, Acast was able to address better monitoring, cost optimization, performance, and security. It helped them understand the areas where they could improve their workloads and how to address common issues, with automated solutions, as well as how to measure the success, defining KPIs. It saved them time to get the learnings that otherwise would have been taking longer to find. Spyridon Dosis, Acast’s Information Security Officer, shares, “We are happy AWS is always ahead with releasing tools that enable the configuration, assessment, and review of multi-account setup. This is a big plus for us, working in a decentralized organization.” Spyridon also adds, “A very important concept we value is the AWS security defaults (e.g. default encryption for S3 buckets).”
In the architecture diagram, we can see that each team can be a data producer, except the team owning the central account, which serves as the central data platform, modeling the logic from multiple domains to paint the full business picture. All other teams can be data producers or data consumers. They can connect to the central account and discover datasets via the cross-account AWS Glue Data Catalog, analyze them in the Athena query editor or with Athena notebooks, or map the catalog to their own AWS account. Access to the central Athena catalog is implemented with IAM Identity Center, with roles for open data and restricted data access.
For non-sensitive data (open data), Acast uses a template where the datasets are by default open to the entire organization to read from, using a condition to provide the organization-assigned ID parameter, as shown in the following code snippet:
When handling sensitive data like financials, the teams use a collaborative data steward model. The data steward works with the requester to evaluate access justification for the intended use case. Together, they determine appropriate access methods to meet the need while maintaining security. This could include IAM roles, service accounts, or specific AWS services. This approach enables business users outside the tech organization (which means they don’t have an AWS account) to independently access and analyze the information they need. By granting access through IAM policies on AWS Glue resources and S3 buckets, Acast provides self-serve capabilities while still governing delicate data through human review. The data steward role has been valuable for understanding use cases, assessing security risks, and ultimately facilitating access that accelerates the business through analytical insights.
For Acast’s use case, granular row- or column-level access controls weren’t needed, so the approach sufficed. However, other organizations may require more fine-grained governance over sensitive data fields. In those cases, solutions like AWS Lake Formation could implement permissions needed, while still providing a self-serve data access model. For more information, refer to Design a data mesh architecture using AWS Lake Formation and AWS Glue.
At the same time, teams can read from other producers directly, from Amazon S3 or via an API, keeping the dependency at minimum, which enhances the velocity of development and delivery. Therefore, an account can be a producer and a consumer in parallel. Each team is autonomous, and is accountable for their own tech stack.
What did Acast learn? So far, we’ve discussed that the architectural design is an effect of the organizational structure. Because the tech organization consists of multiple cross-functional teams, and it’s straightforward to bootstrap a new team, following the common principles of data mesh, Acast learned this doesn’t go seamlessly every time. To set up a fully new account in AWS, teams go through the same journey, but slightly different, considering their own set of particularities.
This can create certain frictions, and it’s difficult to get all data producing teams to reach a high maturity of being data producers. This can be explained by the different data competencies in those cross-functional teams and not being dedicated data teams.
By implementing the decentralized solution, Acast effectively tackled the scalability challenge by adapting their teams to align with evolving business needs. This approach ensures high decoupling and alignment. Furthermore, they strengthened ownership, significantly reducing the time needed to identify and resolve issues because the upstream source is readily known and easily accessible with specified SLAs. The volume of data support inquiries has seen a reduction of over 50%, because business users are empowered to gain faster insights. Notably, they successfully eliminated tens of terabytes of redundant storage that were previously copied solely to fulfill downstream requests. This achievement was made possible through the implementation of cross-account reading, leading to the removal of associated development and maintenance costs for these pipelines.
Acast used the Inverse Conway Maneuver law and employed AWS services where each cross-functional product team has its own AWS account to build a data mesh architecture that allows scalability, high ownership, and self-service data consumption. This has been working well for the company, regarding how data ownership and operations were approached, to meet their engineering principles, resulting in having the data mesh as an effect rather than a deliberate intent. For other organizations, the desired data mesh might look different and the approach might have other learnings.
To conclude, a modern data architecture on AWS allows you to efficiently construct data products and data mesh infrastructure at a low cost without compromising on performance.
The following are some examples of AWS services you can use to design your desired data mesh on AWS:
 Claudia Chitu is a Data strategist and an influential leader in the Analytics space. Focused on aligning data initiatives with the overall strategic goals of the organization, she employs data as a guiding force for long-term planning and sustainable growth.
 Spyridon Dosis is an Information Security Professional in Acast. Spyridon supports the organization in designing, implementing and operating its services in a secure manner protecting the company and users’ data.
 Srikant Das is an Acceleration Lab Solutions Architect at Amazon Web Services. He has over 13 years of experience in Big Data analytics and Data Engineering, where he enjoys building reliable, scalable, and efficient solutions. Outside of work, he enjoys traveling and blogging his experiences in social media.
Post Syndicated from Janice Leung original https://aws.amazon.com/blogs/security/aws-completes-the-first-cloud-audit-by-the-ingelheim-kreis-initiative-joint-audits-group-for-the-pharmaceutical-and-life-sciences-sector/
We’re excited to announce that Amazon Web Services (AWS) has completed the first cloud service provider (CSP) audit by the Ingelheim Kreis (IK) Initiative Joint Audits group. The audit group represents quality and compliance professionals from some of our largest pharmaceutical and life sciences customers who collectively perform audits on their key suppliers.
As customers embrace the scalability and flexibility of AWS, we’re helping them evolve security, identity, and compliance into key business enablers. At AWS, we’re obsessed with earning and maintaining customer trust. We work hard to provide our pharmaceutical and life sciences customers and their regulatory bodies with the assurance that AWS has the necessary controls in place to help protect their most sensitive data and regulated workloads.
Our collaboration with the IK Joint Audits Group to complete the first CSP audit is a good example of how we support your risk management and regulatory efforts. Regulated pharmaceutical and life sciences customers are required by GxP to employ a risk-based approach to design, develop, and maintain computerized systems. GxP is a collection of quality guidelines and regulations that are designed to ensure safe development and manufacturing of medical devices, pharmaceuticals, biologic, and other food and medical products. Currently, no specific certifications for GxP compliance exist for CSPs. Pharmaceutical companies must do their own supplier assessment to determine the adequacy of their development and support processes.
The joint audit thoroughly assessed the AWS controls that are designed to protect your data and material workloads and help satisfy your regulatory requirements. As more pharmaceutical and life sciences companies use cloud technology for their operations, the industry is experiencing greater regulatory oversight. Because the joint audit of independent auditors represented a group of companies, both AWS and our customers were able to streamline common controls and increase transparency, and use audit resources more efficiently to help decrease the organizational burden on both the companies and the supplier (in this case, AWS).
The IK audit results provide IK members with assurance regarding the AWS controls environment, enabling members to work to remove compliance blockers, accelerate their adoption of AWS services, and obtain confidence and trust in the security controls of AWS.
As stated by the IK auditors, “…in the course of the Audit it became obvious that AWS within their service development, their data center operation and with their employees acts highly professional with a clear customer focus. The amount of control that AWS implemented and continuously extends exceeds our expectations of a qualified CSP”.
The report is confidential and only available to IK members who signed the NDA with AWS prior to the start of the audit in 2023. Members can access the report and assess their own residual risk. To participate in a future audit cycle, contact [email protected].
To learn more about our commitment to safeguard customer data, see AWS Cloud Security. For more information about the robust controls that are in place at AWS, see the AWS Compliance Program page. By integrating governance-focused, audit-friendly service features with applicable compliance or audit standards, AWS Compliance helps you set up and operate in an AWS control environment. Customers can also access AWS Artifact to download other compliance reports that independent auditors have evaluated.
If you have feedback about this post, submit comments in the Comments section below. If you have questions about this post, contact AWS Support.
Want more AWS Security news? Follow us on Twitter.
Post Syndicated from Explosm.net original https://explosm.net/comics/dating-profile
New Cyanide and Happiness Comic
Post Syndicated from digiblurDIY original https://www.youtube.com/watch?v=2HY2kdVMdT0
Post Syndicated from jake original https://lwn.net/Articles/959006/
Security updates have been issued by Debian (keystone and subunit), Fedora (dotnet6.0, golang, kernel, sos, and tigervnc), Mageia (erlang), Red Hat (openssl), SUSE (bluez, python-aiohttp, and seamonkey), and Ubuntu (postfix and xorg-server).
Post Syndicated from David Belson http://blog.cloudflare.com/author/david-belson/ original https://blog.cloudflare.com/q4-2023-internet-disruption-summary

Cloudflare’s network spans more than 310 cities in over 120 countries, where we interconnect with over 13,000 network providers in order to provide a broad range of services to millions of customers. The breadth of both our network and our customer base provides us with a unique perspective on Internet resilience, enabling us to observe the impact of Internet disruptions.
During previous quarters, we tracked a number of government directed Internet shutdowns in Iraq, intended to prevent cheating on academic exams. We expected to do so again during the fourth quarter, but there turned out to be no need to, as discussed below. While we didn’t see that set of expected shutdowns, we did observe a number of other Internet outages and disruptions due to a number of commonly seen causes, including fiber/cable issues, power outages, extreme weather, infrastructure maintenance, general technical problems, cyberattacks, and unfortunately, military action. As we have noted in the past, this post is intended as a summary overview of observed disruptions, and is not an exhaustive or complete list of issues that have occurred during the quarter.
In a slight departure from the usual subject of this blog post, this time we lead off with coverage of government directed Internet shutdowns that didn’t happen. Iraq has been a frequent subject of this series of posts, as they have historically implemented daily multi-hour Internet shutdowns during exam periods, intended to prevent cheating. Earlier this year, there was some hope that this practice might be ending, and in our Q2 2023 Internet disruption summary post, we noted “In the weeks prior to the start of this year’s shutdowns, it was reported that the Iraqi Ministry of Communications had announced it had refused a request from the Ministry of Education to impose an Internet shutdown during the exams as part of efforts to prevent cheating. Unfortunately, this refusal was short-lived, with shutdowns ultimately starting two weeks later.” In addition to these second quarter shutdowns, they also occurred during the third quarter across multiple weeks in July, August, and September.
During the fourth quarter, the third round of 12th grade high school final exams was scheduled to begin on November 13 and end on November 21, taking place at 13:00 local time, as shown in the schedule below, which was published on the Iraqi Ministry of Education’s Facebook page.

However, in looking at Internet traffic for Iraq during that period, it appears that the nationwide Internet shutdowns that would have normally taken place did not occur, as the graph shows a very consistent diurnal pattern with no evidence of disruptions to Internet connectivity like we have seen in the past. Additionally, other civil society groups, academic researchers, and Internet analysts that also monitor these shutdowns did not report seeing any related drops in traffic. It is unclear whether a request for shutdowns was submitted by the Ministry of Education and again refused by the Ministry of Communications, or if no request was ever submitted for this round of exams. Regardless, we hope that Iraq continues to keep the Internet connected during future rounds of exams.
On Saturday, October 7, 2023, attacks from the Palestinian group Hamas launched from the Gaza Strip against the south of Israel started a new conflict in the region, with Israel officially declaring the next day that it was at war. This had an almost immediate impact on Internet traffic in both Israel and Palestine, with traffic in the former showing ~170% growth as compared to the prior week, and ~100% growth in the latter as compared to the previous week. These trends are discussed in our October 9 blog post, Internet traffic patterns in Israel and Palestine following the October 2023 attacks.
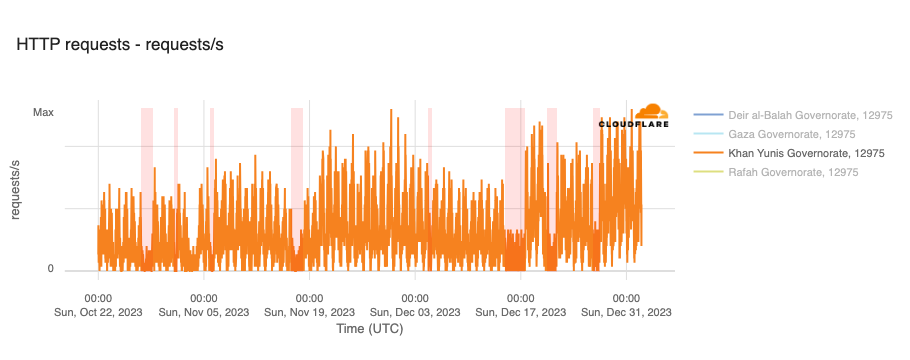
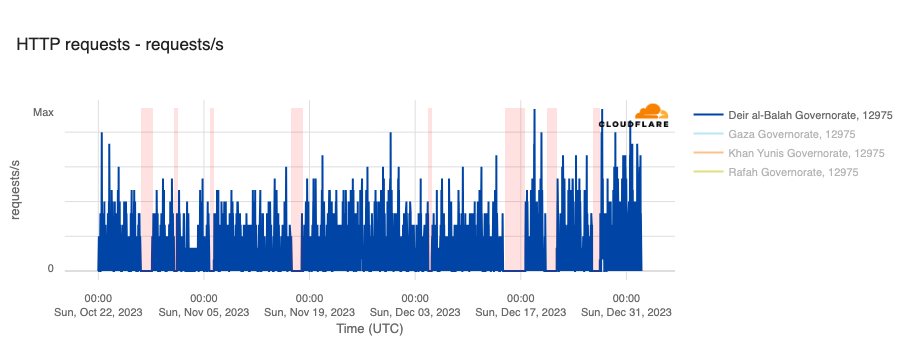
However, in the hours and days following the initial attacks, a number of Palestinian Internet providers saw traffic fall significantly, with many winding up largely or totally offline, potentially as a result of power outages caused by retaliatory Israeli airstrikes. Impacted networks included AS42314 (fusion), AS203905 (DCC_North_ASN), AS210974 (AjyalFI), AS60268 (DIGITAL-COMMUNICATION-PALESTINE-ASN), AS60353 (DCC_RAFAH_ASN), AS62027 (DCC_Khanyouns_ASN), AS57704 (SPEED-CLICK-LTD), AS199046 (JETNET), and AS213207 (TechHub-HiNet), as shown in the graphs below.
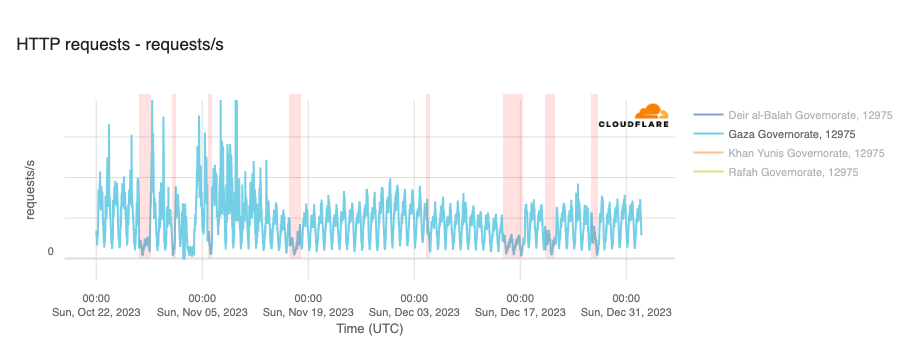
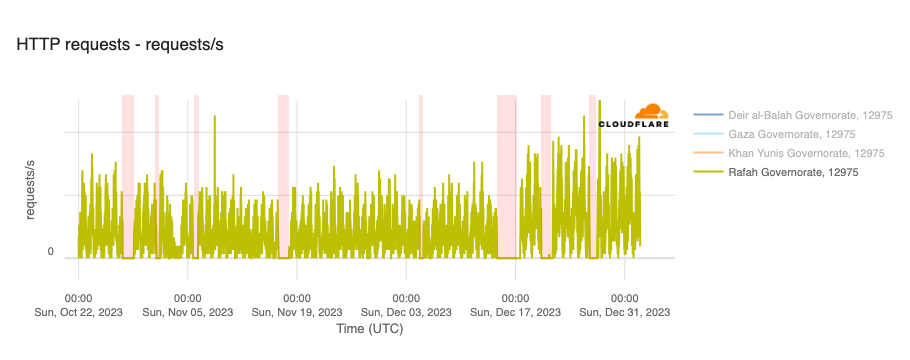
In addition to the outages illustrated above, throughout October, November, and December, Paltel (Palestine Telecommunications Company) posted a number of times on its official X account about disruptions to its landline, mobile, and Internet services, citing causes including fiber damage due to bombardment and fuel depletion. Posts were made on October 27, October 31, November 16, December 4, December 14, December 20, and December 26. The associated outages varied in length, some lasting for hours, while others lasted for multiple days — each outage is shaded in the graphs below, which show Paltel traffic within four Palestinian governorates in the Gaza Strip region.
On November 13, Telecom Namibia (AS36996) reported that it was experiencing interruptions to its fixed voice and data services in several areas, resulting from cable theft. The impact of these interruptions is shown in the figure below, with Internet traffic disrupted between 13:45 local time (11:45 UTC) on November 13 and 08:30 local time (06:30 UTC) on November 14. The disruption to connectivity due to cable theft was not an isolated incident, as the provider posted several additional notices on its social media accounts in November and December about similar occurrences.
A day later, on November 14, ETECSA (AS27725) posted a notice about a terrestrial fiber cut that disrupted Internet services. As the state-owned telecommunications provider in Cuba, the cut impacted Internet traffic nationwide, as well as at a network level, as seen in the graphs below. The disruption was relatively short-lived, occurring between 06:30 – 08:15 local time (11:30 – 13:15 UTC), with a follow-up post announcing the re-establishment of Internet service.
On December 7 & 8, a near-complete outage observed in Chad was reportedly due to fiber optic cable cuts in neighboring countries. A published article cited SudaChad as claiming that the outage seen in the graphs below was due to an issue with CAMTEL, a Cameroonian partner. It also cites Moov Africa’s (formerly known as Millicom Chad) apology to customers, which points at “the fiber-optic cut in Cameroon and Sudan” as the root cause. Since simultaneous cuts in fiber optic cables in Chad’s two neighboring countries would certainly be an unusual occurrence, it isn’t clear if such an event happened, though routing data for SudaChad shows that the network’s two upstream providers are AS15706 (Sudatel) in Sudan and AS15964 (CAMNET) in Cameroon. The three providers are also partners on the WE-AFRICA-NA terrestrial cable, which stretches from Port-Sudan on the Red Sea in Sudan to Kribi on the Atlantic Ocean in Cameroon via Chad, but it isn’t known whether that cable system was involved in this outage.
The disruption lasted approximately fourteen hours, from 20:00 local time on December 7 until 10:15 local time on December 8 (19:00 UTC on December 7 until 09:15 UTC on December 8), with the impact visible country-wide, as well as at SudaChad and several downstream network providers.
Ukrainian Internet provider Kyivstar announced on the morning of December 12 that they were the “target of a powerful hacker attack”. They noted that the attack caused a “technical failure” that resulted in mobile communication and Internet access becoming temporarily unavailable. Although Kyivstar has been targeted by around 500 cyberattacks since Russia launched its invasion of Ukraine in February 2022, this was reportedly the largest attack to date. A subsequent report referenced an interview with Illia Vitiuk, the head of the cybersecurity department at Ukraine’s security service (SBU), in which he claimed that “the hackers attempted to penetrate Kyivstar in March 2023 or earlier, managed to get into the system at least as early as May, and likely gained full access to the network in November.”
Recovery took several days, with Kyivstar posting on December 15 that “the Internet is everywhere” but warning that connection speeds might be slightly reduced. These posts align with the traffic disruption shown in the figure below, which lasted from 06:30 local time (04:30 UTC) on December 12 until 14:00 local time (12:00 UTC) on December 15.
A major power outage in Brunei on October 17 disrupted key services including mobile and fixed Internet connectivity. Starting around 11:30 local time (03:30 UTC), traffic was disrupted for approximately 13 hours, recovering to expected levels around just after midnight local time on October 18 (16:45 UTC). Two Unified National Networks autonomous systems (AS10094 and AS131467) saw lower traffic volumes during the power outage.
A widespread power outage in Kenya on November 11 disrupted Internet connectivity across the county for approximately seven hours. An X post from Kenya Power at 20:30 local time (17:30 UTC) reported a partial power outage, stating “We have lost power supply to parts of the country. Our engineers are working to restore supply to the affected areas.” Kenya Power kept customers informed of progress, posting updates at 22:00, 23:57, and the morning of November 12, with the final update reporting “We have successfully restored normal power supply in all the areas that were affected by the partial outage.”
On November 14, a Facebook post from Aqualectra, the water and power company in Curaçao, stated in part, “Around 14:00 this afternoon, a blackout occurred. Preliminary investigation indicates that one of the main cables responsible for transporting electricity between the substations at Nijlweg and Weis experienced a short circuit. It is important to emphasize that this is not due to a lack of production capacity.” The power outage resulted in a near complete loss of traffic at Flow Curaçao (AS52233), with significant disruptions also visible at United Telecommunication Services (AS11081) and at a country level, as seen in the graphs below. The disruption lasted eight hours, from 14:00 until 22:00 local time (18:00 UTC on November 14 until 02:00 UTC on November 15).
After stabilizing its electrical infrastructure in the wake of 2022’s problems with its electrical power grid, the failure of a main transmission line caused an island-wide power outage in Sri Lanka on December 9, in turn disrupting Internet connectivity. Traffic from the island nation initially dropped by around 50% starting around 16:45 local time (11:15 UTC). Repairs took several hours, with the country’s Internet traffic returning to expected levels around 01:00 local time on December 10 (19:30 UTC).
On the morning of December 24, Panamanian electric distribution company ENSA initially reported an event that affected electrical services to their customers. A subsequent report posted just 30 minutes later provided additional details, pointing to an incident in the “National Interconnected System” that affected the electrical supply in a number of areas, but within an hour, it had spread nationally. Although the initial regional power issues did not have a noticeable impact on Panama’s Internet traffic, the loss of traffic in the graph below aligns with the national growth of the power outage, occurring at 11:45 local time (16:45 UTC). Traffic returned to expected levels at around 15:00 local time (20:00 UTC), aligning with an X post from ENSA stating that “At 3:12pm the supply of electrical energy to all our clients has been normalized after an event at the Transmission level originating in the Panama 1 Substation of ETESA.”
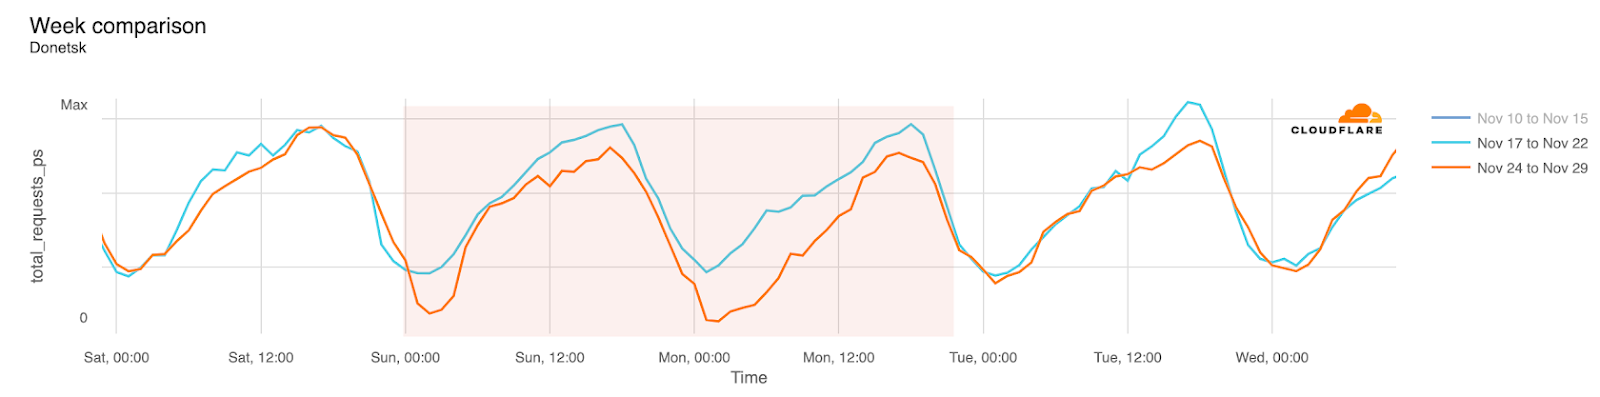
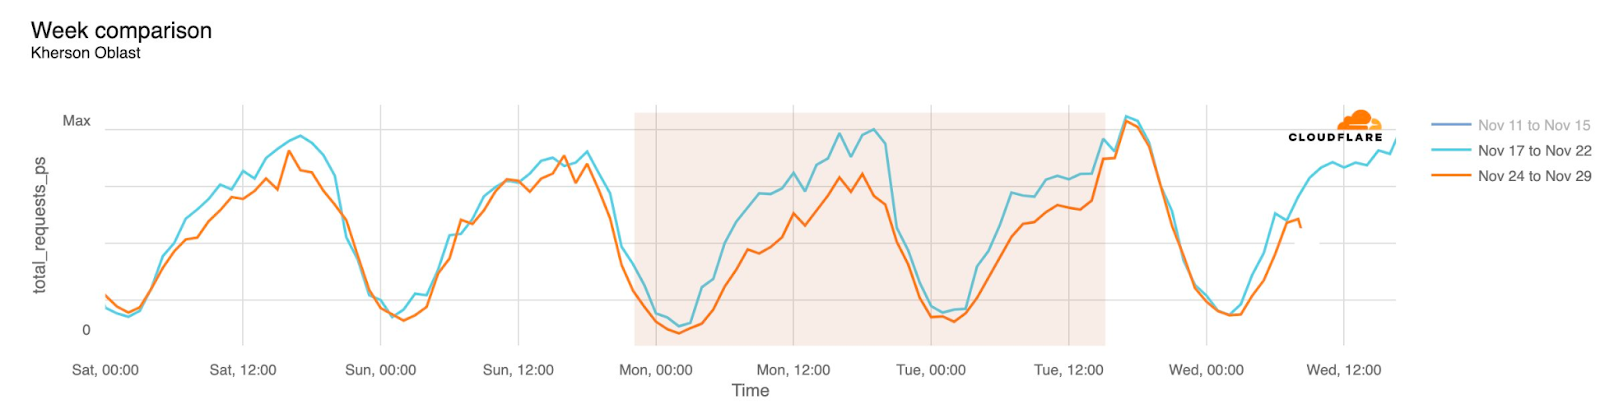
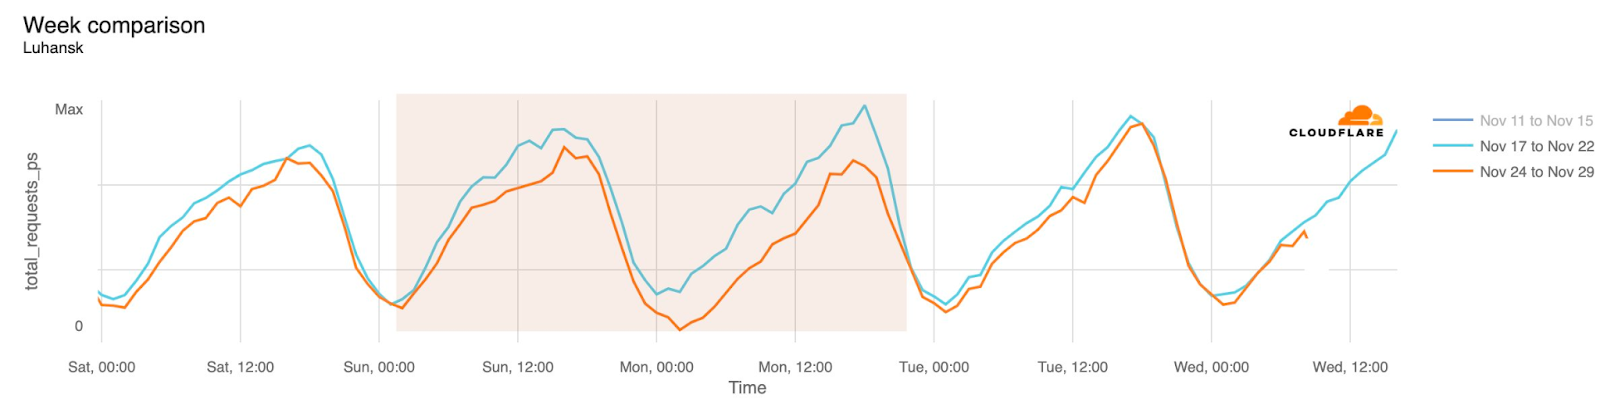
Internet disruptions in Ukraine due to the conflict there have been covered in multiple quarterly Internet disruption summary blog posts over the last two years. However, in November, connectivity in multiple areas of the country was disrupted by power outages caused by a major winter storm. Snow and high winds knocked out power to hundreds of towns and villages, damaging electrical power infrastructure. The impact is visible in the graphs below as a drop in traffic occurring around 01:00 local time on November 27 (23:00 UTC on November 26), observed in regions including Donetsk, Kherson Oblast, and Luhansk. Traffic appeared to return to expected levels early in the morning local time on November 28.
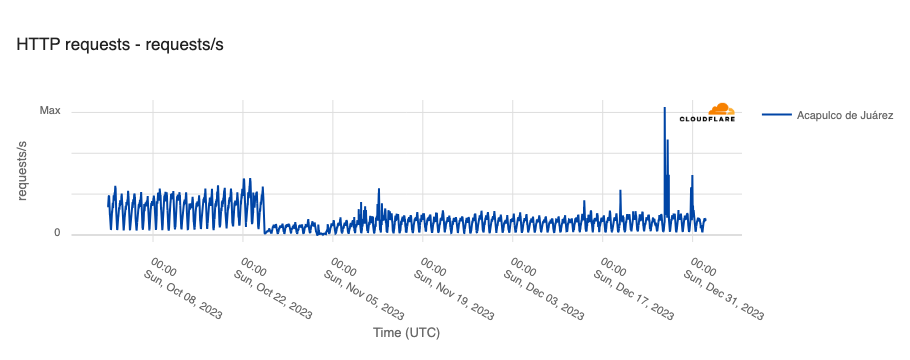
On October 25, Hurricane Otis made landfall near Acapulco, a popular tourist destination in Mexico. In addition to catastrophic structural damage, it was reported that “more than 10,000 utility poles were destroyed, knocking out power and internet/communications across the region, while numerous transmission lines, electrical substations, and a power plant were also heavily damaged.” This damage to electrical and communications infrastructure in the area resulted in significant disruption to Internet connectivity. As shown in the graph below, Internet traffic from Acapulco dropped by around 80% as Otis made landfall. Traffic started to show some growth in early November, but peak volumes remained relatively consistent, and well below pre-hurricane levels, through the end of the year. (Several large spikes are visible on December 26 & 30, but it isn’t clear what those are associated with.) Although Acapulco’s tourism industry experienced a notable recovery heading into the end of the year, it appears that infrastructure recovery has not been quite as swift.
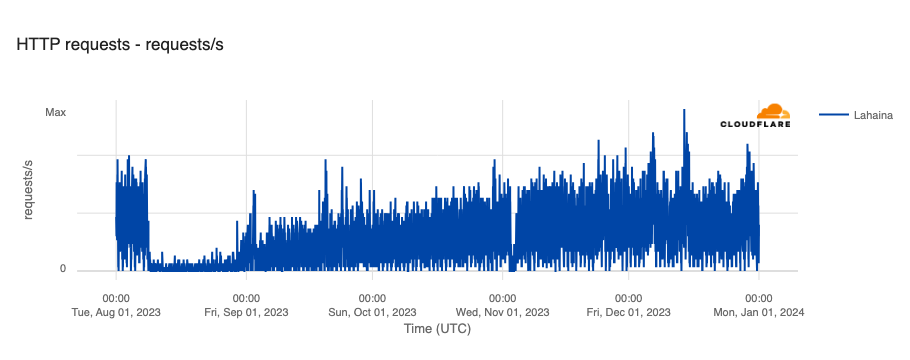
Last quarter, we reported on the impact of wildfires that started on August 7 in Hawaii, including killing nearly 100 people, as well as destroying homes, businesses, and infrastructure, causing power outages and disrupting Internet connectivity. One of the most impacted areas was the town of Lahaina, where Internet connectivity remained sparse for weeks after the fires began. Repair and restoration efforts continued throughout the fourth quarter, with traffic clearly growing throughout October, with peak levels in November and December approaching pre-fire levels.
Two maintenance-related Internet disruptions impacted Internet connectivity in Yemen in the fourth quarter. The first lasted over four hours during the morning of November 10, from 03:10 – 07:45 local time (00:10 – 04:45 UTC), and followed two other disruptions the prior day. The impact was visible at a country level, as well as at a network level on PTC-YemenNet (AS30873).
An Associated Press article noted that in a statement to the state news agency, Yemen’s Public Telecom Corp. (PTC-YemenNet) blamed the outage on maintenance, apparently of the FALCON submarine cable. The article also cited a statement from GCX, the operator of the FALCON cable, regarding scheduled maintenance to the cable system that had been in planning for the previous three months.
The second maintenance-related disruption occurred on December 15 just before 23:00 local time (20:00 UTC). An X post from Mosfer Alnomeir, the Minister of Telecommunication and Information Technology in Yemen, explained what happened: “We note that half an hour ago there was an interruption in the Internet service that lasted approximately 30 minutes. This is while engineers carry out emergency replacement and upgrade work on some service equipment. Service was restored immediately. On behalf of the team, I say thank you for your understanding.” Once again, the impact was visible at both a country and network level.
“Changes to routing information” after a “routine software upgrade” were reportedly responsible for a multi-hour Internet outage at Australian telecommunications provider Optus (AS4804) on November 8 local time. Connectivity began to drop just after 04:00 Sydney time, with the outage lasting from 04:30 – 10:00 Sydney time (17:30 – 23:00 UTC on November 7). Traffic didn’t fully recover to expected levels until around 23:00 Sydney time (12:00 UTC).
The network issue impacted more than 10 million customers, as well as hospitals and payment and transport systems, and drew comparisons to July 2023’s outage at Canadian provider Rogers Communications. Optus submitted a report to the Australian Senate Standing Committee on Environment and Communications that detailed the cause of the outage, noting “It is now understood that the outage occurred due to approximately 90 PE routers automatically self-isolating in order to protect themselves from an overload of IP routing information. … This unexpected overload of IP routing information occurred after a software upgrade at one of the Singtel internet exchanges (known as STiX) in North America, one of Optus’ international networks. During the upgrade, the Optus network received changes in routing information from an alternate Singtel peering router. These routing changes were propagated through multiple layers of our IP Core network. As a result, at around 4:05am (AEDT), the pre-set safety limits on a significant number of Optus network routers were exceeded.” The report also detailed the recovery efforts and timelines for consumer Internet, DNS, and mobile services.
Failure of international links caused a brief Internet disruption at Telecom Armenia (AS12297) on November 11, similar to a disruption that occurred almost exactly a year earlier. As shown in the graph below, the disruption began just around 15:15 local time (11:15 UTC), with short periods where traffic dropped to zero. Traffic recovered to expected levels by 21:00 local time (17:00 UTC). As one of the largest telecommunications providers in the country, the service disruption was visible at a country level as well.
A sizable drop in traffic was observed between 15:00 and 21:30 local time (15:00 – 21:30 UTC) on mobile and broadband Internet provider Three UK (AS206067) on December 1, as seen in the graph below. Although the provider acknowledged that customers were experiencing issues and provided several updates (1, 2, 3, 4) on service restoration over the next day, it never disclosed any additional information on the cause of the disruption. However, a published report stated that Three UK blamed technical issues at one of its data centers as the cause of the problem, which impacted more than 20,000 users.
On December 5, Telecom Egypt (AS8452) posted on X that a technical malfunction affecting one of their main network devices was responsible for an Internet disruption that occurred on their network, which also impacted connectivity on several other network providers, including LINKdotNET (AS24863), Vodadfone Egypt (AS24835), and Etisalat (AS36992), as well as traffic at a national level, as seen in the graphs below. Although one news report claimed that the disruption, which occurred between 14:15 – 00:00 local time (12:15 – 22:00 UTC), was due to damage to the FLAG and SeaMeWe-4 submarine cables, a subsequent post from Telecom Egypt about service restoration dispelled that claim, noting “The company also confirms that there is no truth to what has been circulated on some social media sites about the presence of a break in one of the submarine cables.”
A reported DNS server outage (albeit unconfirmed) at Tunisian Internet provider Topnet (AS37705) caused a brief Internet disruption for the provider’s customers on December 17, also impacting traffic volumes at a national level. The incident lasted less than two hours, from 13:00 – 14:45 local time (12:00 – 13:45 UTC).
An unspecified incident on the Orange Guinée (AS37461) network impacted Internet connectivity, as well as telephone calls and text messages during the morning of December 22. The graph below shows a near-complete outage on the network between 09:15 – 11:30 local time (09:15 – 11:30 UTC). The provider posted a subsequent update regarding the restoration of calls, text messages, and Internet connectivity.
Within the Cloudflare Radar 2023 Year in Review, we highlighted over 180 major Internet disruptions that were observed year-to-date through the end of November, though the actual number was likely closer to 200 by the end of the year. While that may seem like a lot, it is worth nothing that the actual number is even higher, as these posts are not exhaustive in their coverage of such events. For example, while we covered the Internet shutdown in Manipur, India that took place across multiple months in 2023, internetshutdowns.in shows that over 90 more smaller localized shutdowns were put into place across the country.
In addition, 2024 is shaping up to be an important year for elections, with voting taking place in more than 50 countries around the world. Unfortunately, some countries have taken to implementing Internet shutdowns or otherwise disrupting Internet connectivity during elections. The Freedom Online Coalition’s Joint Statement on Internet Shutdowns and Elections details the detrimental effects of such actions. The Cloudflare Radar team will be monitoring for election-related Internet shutdowns, sharing our observations on the Cloudflare Radar Outage Center, via social media, and in posts on blog.cloudflare.com.
Follow us on social media at @CloudflareRadar (X), cloudflare.social/@radar (Mastodon), and radar.cloudflare.com (Bluesky), or contact us via email.
Post Syndicated from The History Guy: History Deserves to Be Remembered original https://www.youtube.com/watch?v=TjXQ7rk7nas
Post Syndicated from Bruce Schneier original https://www.schneier.com/blog/archives/2024/01/ai-bots-on-x-twitter.html
You can find them by searching for OpenAI chatbot warning messages, like: “I’m sorry, I cannot provide a response as it goes against OpenAI’s use case policy.”
I hadn’t thought about this before: identifying bots by searching for distinctive bot phrases.
Post Syndicated from Patrick Kennedy original https://www.servethehome.com/aic-j4078-02-04x-78-bay-jbod-review-toshiba/
The AIC J4078-02-04X is a 4U 78-bay JBOD using the newer SAS4 interface. We take a look at the JBOD and a few of its neat features
The post AIC J4078-02-04X 78-bay JBOD Review appeared first on ServeTheHome.
Post Syndicated from corbet original https://lwn.net/Articles/958945/
The 6.8-rc1 kernel prepatch is out for
testing.
So this wasn’t the most pleasant merge window, but most of the
unpleasantness was entirely unrelated to the code base and almost
entirely related to nasty weather. Just a few technical
hiccups. And after a very big 6.7 release, 6.8 looks to actually be
smaller than average, although not really all that significantly
so.
Post Syndicated from xkcd.com original https://xkcd.com/2884/

Post Syndicated from NTPsec Project Blog original https://blog.ntpsec.org/2024/01/21/remembering-mills.html
We were sad to learn that the creator of the NTP protocol, Dr David
L. Mills PhD has passed away.
Dr Mills designed the NTP distributed algorithm, while also writing
and maintaining the reference implementation on the very first
experimental inter-networking packet switches that were the creation
of the internet.
In that work he was supported by the other founders of the internet,
and by skilled developers and maintainers who assisted him, and by a
growing collection of skilled developers and maintainers who continued
maintaining the work that he started. The maintainers of the NTPsec
project count ourselves lucky to be amoung the people who followed in
his work.
The more we discovered reading the sources of his NTP implemention,
the more we became aware of his insight, technical ability, and his
hope and his dream that this little “inter-network experiment” could
grow to be literally world spanning. He was right, we we all owe him
much.
Thank you, Dr, Mills. The clocks of the world tick together in time
in large part due to you.
Post Syndicated from Боян Юруков original https://yurukov.net/blog/2024/dosa-realizam-migracia/
Многократно съм казвал, че всичко свързано с Германия в българската версия на DW трябва да се чете с едно наум. Особено преводите на немски статии, които изначално да тенденциозни.
В този смисъл и в подкрепа на това, имам няколко бележки по скорошния им текст, че 1.2 млн. души са напуснали Германия само през 2022. Повечето – чужденци живеещи там, някои с паспорти, а българите са на четвърто място сред тях. Това е добавка и към мой коментар под изказване на Асен Василев в подобна посока, където коментирах източника и надеждността на данните.
Първо, цитираните данни от няколко института разпознаваемо са или директно цитират службата по миграция и бежанци. Писах преди години, че данните им не са верни и статистическата служба го признава. Нищо не се е променило от тогава. След (псевдо) пребояването според неофициален отговор на последните се опитат да консолидират информацията без да прекъснат серията и да генерират странни изводи, но не е направено още.
Тази липса на информация колко са чужденците важи особено за мигрантите от ЕС и засяга особено българите. Все пак, дори с разминаващите се данни виждаме поне 400 хиляди българи в Германия преди пандемията. Също, че стотици хиляди ще имат вече право на немски паспорт в следващите години. Сигналите след 2020 обаче са разнопосочни. Истината е, че много хора не се отрегистрат в Германия и не ги „лови“ статистиката, също както концепцията за „постоянен адрес“ в България обърква местната статистика.
Анекдотни наблюдения сочат наистина към много млади хора и цели семейства с деца, които се прибират в България. Особено такива родени в чужбина. Аз съм сред тях. Тук обаче човек не може да разчита на балона си, тъй както и българската общност в Германия не е хомогенна а грубо може да се раздели на поне 6 части. Има много социално-икономически фактори (социални, пенсии), очаквания към страната и работата, а кризите от последните години и сегашната стагнация засяга всеки сектор по различен начин.
Макар преведеното от DW въпреки увъртанията им да звучи оптимистично за България, трябва и това да приемаме с щипка сол. Преди години когато започна драстичния скок на българите в Германия, имаше възгласи, че стотици хиляди се изнасят. Особено покрай демографската криза това е една от честите камбани, на която се бие. В действителност огромна част от ръстът беше от българи мигриращи от други страни в тежко положение – Италия, Испания, Гърция и Великобритания. Сега има голяма вероятност това да се случва в обратна посока. Фактите са, че въпреки гръмките имена на демографски институти и агенции, всички работят с извадки и изначално грешни данни и никой не може да каже със сигурност.
Важно е да се говори за тези неща с разбиране и да знаем какво се случва. Най-малкото, защото трябва да можем да измерим ефектът от различни мерки в продължителен период от време. В горния случай говорим за вътрешна и външна миграция и важността на децентрализацията, но аналогичен проблем има и със смъртността и раждаемостта. Има явно объркване сред редица политици дори колко българи има зад граница.
На първо време обаче имаме нужда от най-важният елемент – драстични и смели реформи в образованието, здравеопазването, социалната сфера и районите извън големите градове и то с постоянство и продължителност. Отпорът срещу последните е значителен, къде заради инертност в системата, къде заради его на ключови хора. До сега сме били свидетели само на козметични промени, кампании като за пред медиите и еднократни мерки с увеличаване на надбавки.
Има шанс да го направим и не бива да го изпускаме. Много хора предупреждават, че „демографският влак“ вече е заминал и в известен смисъл са прави. Това не означава, че сме в пагубна ситуация, а че колкото повече отлагаме, толкова по-тежко ще е решението. Българите в чужбина не се връщат заради една или друга инициатива и медийна кампания, а въпреки тях. Особено една конкретна организация по-скоро показва защо много от сънародниците ни сме заминали от България на първо време. Обръщането на тенденцията, доколкото я има, не е заради мерките на едно или друго правителство, а заради обстановката около нас. Имаме шанс да се възползваме от тази ситуация и да я задържим като посока и има предостатъчно хора, които се борят това да стане.
The post Доза реализъм към добрите новини за имиграцията first appeared on Блогът на Юруков.