For the COBOL users out there, James K. Lowden has posted
an update on the current status of the GNU COBOL compiler.
When in November we turn back our clocks, then naturally do
programmers’ thoughts turn to Cobol, its promise, and future.
At last post, nine months ago, we were working our way through the
NIST CCVS/85 test suite. I am pleased to report that process is
complete. As far as NIST is concerned, gcobol is a Cobol compiler.
This post is written by Pascal Vogel, Solutions Architect, and Philipp Klose, Global Solutions Architect.
Event streaming with Apache Kafka has become an important element of modern data-oriented and event-driven architectures (EDAs), unlocking use cases such as real-time analytics of user behavior, anomaly and fraud detection, and Internet of Things event processing. Stream producers and consumers in Kafka often use schema registries to ensure that all components follow agreed-upon event structures when sending (serializing) and processing (deserializing) events to avoid application bugs and crashes.
A common schema format in Kafka is Apache Avro, which supports rich data structures in a compact binary format. To integrate Kafka with other AWS and third-party services more easily, AWS offers Amazon EventBridge Pipes, a serverless point-to-point integration service. However, many downstream services expect JSON-encoded events, requiring custom, and repetitive schema validation and conversion logic from Avro to JSON in each downstream service.
This blog post shows how to reliably consume, validate, convert, and send Avro events from Kafka to AWS and third-party services using EventBridge Pipes, allowing you to reduce custom deserialization logic in downstream services. You can also use EventBridge event buses as targets in Pipes to filter and distribute events from Pipes to multiple targets, including cross-account and cross-Region delivery.
To avoid common issues in event streaming and event-driven architectures, such as data inconsistencies and incompatibilities, it is a recommended practice to define and share event schemas between event producers and consumers. In Kafka, schema registries are used to manage, evolve, and enforce schemas for event producers and consumers. The AWS Glue Schema Registry provides a central location to discover, manage, and evolve schemas. In the case of Confluent Cloud, the Confluent Schema Registry serves the same role. Both the Glue Schema Registry and the Confluent Schema Registry support common schema formats such as Avro, Protobuf, and JSON.
To integrate Kafka with AWS services, third-party services, and your own applications, you can use EventBridge Pipes. EventBridge Pipes helps you create point-to-point integrations between event sources and targets with optional filtering, transformation, and enrichment. EventBridge Pipes reduces the amount of integration code that you have to write and maintain when building EDAs.
Many AWS and third-party services expect JSON-encoded payloads (events) as input, meaning they cannot directly consume Avro or Protobuf payloads. To replace repetitive Avro-to-JSON validation and conversion logic in each consumer, you can use the EventBridge Pipes enrichment step. This solution uses an AWS Lambda function in the enrichment step to deserialize and validate Kafka events with a schema registry, including error handling with dead-letter queues, and convert events to JSON before passing them to downstream services.
Solution overview
The solution presented in this blog post consists of the following key elements:
The source of the pipe is a Kafka cluster deployed using MSK or Confluent Cloud. EventBridge Pipes reads events from the Kafka stream in batches and sends them to the enrichment function (see here for an example event).
The enrichment step (Lambda function) deserializes and validates the events against the configured schema registry (Glue or Confluent), converts events from Avro to JSON with integrated error handling, and returns them to the pipe.
The target of this example solution is an EventBridge custom event bus that is invoked by EventBridge Pipes with JSON-encoded events returned by the enrichment Lambda function. EventBridge Pipes supports a variety of other targets, including Lambda, AWS Step Functions, Amazon API Gateway, API destinations, and more, enabling you to build EDAs without writing integration code.
Optionally, you can add OpenAPI 3 or JSONSchema Draft 4 schemas for your events in the EventBridge schema registry by either manually generating it from the Avro schema or using EventBridge schema discovery. This allows you to download code bindings for the JSON-converted events for various programming languages, such as JavaScript, Python, and Java, to correctly use them in your EventBridge targets.
The remainder of this blog post describes this solution for the Glue and Confluent schema registries with code examples.
EventBridge Pipes with the Glue Schema Registry
This section describes how to implement event schema validation and conversion from Avro to JSON using EventBridge Pipes and the Glue Schema Registry. You can find the source code and detailed deployment instructions on GitHub.
An EventBridge custom event bus as the pipe target. An EventBridge rule sends all incoming events into a CloudWatch Logs log group.
For MSK-based sources, EventBridge supports configuration parameters, such as batch window, batch size, and starting position, which you can set using the parameters of the CfnPipe class in the example CDK stack.
The example EventBridge pipe consumes events from Kafka in batches of 10 because it is targeting an EventBridge event bus, which has a max batch size of 10. See batching and concurrency in the EventBridge Pipes User Guide to choose an optimal configuration for other targets.
EventBridge Pipes with the Confluent Schema Registry
This section describes how to implement event schema validation and conversion from Avro to JSON using EventBridge Pipes and the Confluent Schema Registry. You can find the source code and detailed deployment instructions on GitHub.
Prerequisites
To set up this solution, you need a Kafka stream running on Confluent Cloud as well as the Confluent Schema Registry set up. See the corresponding Schema Registry tutorial for Confluent Cloud to set up a schema registry for your Confluent Kafka stream.
To connect to your Confluent Cloud Kafka cluster, you need an API key for Confluent Cloud and Confluent Schema Registry. AWS Secrets Manager is used to securely store your Confluent secrets.
EventBridge Pipes configuration
Use the AWS CDK template provided in the GitHub repository to deploy:
An EventBridge pipe that connects to your existing Confluent Kafka topic as the source via an API secret stored in Secrets Manager.
An enrichment Lambda function in Python to perform event deserialization, validation, and conversion from Avro to JSON.
An SQS dead letter queue to hold events for which deserialization failed.
An EventBridge custom event bus as the pipe target. An EventBridge rule writes all incoming events into a CloudWatch Logs log group.
For self-managed Kafka sources, EventBridge supports configuration parameters, such as batch window, batch size, and starting position, which you can set using the parameters of the CfnPipe class in the example CDK stack.
The example EventBridge pipe consumes events from Kafka in batches of 10 because it is targeting an EventBridge event bus, which has a max batch size of 10. See batching and concurrency in the EventBridge Pipes User Guide to choose an optimal configuration for other targets.
Enrichment Lambda functions
Both of the solutions described previously include an enrichment Lambda function for schema validation and conversion from Avro to JSON.
The Java Lambda function integrates with the Glue Schema Registry using the AWS Glue Schema Registry Library. The Python Lambda function integrates with the Confluent Schema Registry using the confluent-kafka library and uses Powertools for AWS Lambda (Python) to implement Serverless best practices such as logging and tracing.
The enrichment Lambda functions perform the following tasks:
In the events polled from the Kafka stream by the EventBridge pipe, the key and value of the event are base64 encoded. Therefore, for each event in the batch passed to the function, the key and the value are decoded.
The event key is assumed to be serialized by the producer as a string type.
The function then returns the successfully converted JSON events to the EventBridge pipe, which then invokes the target for each of them.
Events for which Avro deserialization failed are sent to the SQS dead letter queue.
Conclusion
This blog post shows how to implement event consumption, Avro schema validation, and conversion to JSON using Amazon EventBridge Pipes, Glue Schema Registry, and Confluent Schema Registry.
Много е странно как нещата тръгват на зле, когато концентрираш много власт.
На миналите избори старото ръководство на Община Родопи спечели със смазващи резултати още на първи тур. Старият кмет г-н Михайлов събра над 67% от гласовете, а кметовете които го подкрерпят спечелиха 12 от 14 избираеми населени места. Впечатляваща победа з акоято трябва да ги поздравим.
Наред с това трябва да се позамислим върху първите сигнали, които получаваме от новото-старо управление.
ПРОЗРАЧНОСТТА СТАВА ПРОБЛЕМ No1 за Община Родопи. Най-лесната подкрепа та тази теза се състоя в отговорите на няколко въпроса:
Разбрахте ли за спешната извънредна сесия на общинския съвет днес 15.11.2023г.?
Предполагам не сте, но не защото не искате. То дори и да искате няма как да разберете. Свикана е за по малко от 24 часа и забележете – НЕ Е ОБЯВЕНА НА СТРАНИЦАТА НА ОБЩИНАТА.
По принцип спешните сесии се занимават със спешни въпроси. Да видим сега кой са тези спешни въпоси.
– Приемане на отчета за изпълнението на бюдета за 2022г. Онзи изпълнения на 55%. Говорим за приходната му част. Затова се тегли кредит 7 млн., защото иначе капиталовата програма отиваше по дяволите. А с кредит лесно се правят улици нали?
Един показател обаче беше преизпълнен на 666%, сещате ли се кой? МАКСИМАЛЕН РАЗМЕР НА НОВИТЕ ЗАДЪЛЖЕНИЯ ЗА РАЗХОДИ.
Не знаехте за това нали?
Нищо де, общинската администрация взима мерки да не Ви безпокои излишно. Да видим какво още ще се гласува
– Гласуване на бюджет 2023г. Днес сме 15.11.2023г. До края на годината има месец и половина (с празниците) и ние гласуваме бюджет на спешно заседание. Колко да е спешно ако 10,5 месеца си бил без бюджет и сега видиш ли в рамките на 24 часа е много спешно да го приемеш? И то тайно без да обявиш сесиата на сайта.
Да ви кажа какво според мен се случва искате ли? Поне тези които имат глави на раменете си ще разберат. Останалите дори и да имат коментари не ме интересуват много. Бързането е заради държавните субсидии в бюджета!
Всеки бюджет има 2 вида основни приходи – държавни субсидии и собствени приходи. Видяхме, че собствените приходи в нашата община се изпълняват на едва 55%. Явно е, че бюджет гласуван средата на Ноември няма как да бъде изпълнен и ще се търсят отново извинения. Обаче субсидията от дъравата е по сметките на общината и ако не се усвои ще се връща. За разлика от нашата общинска администрация, държавата си изпълнява приходите и разходите, защото имаче Монетарния съюз ще ни приеме, ама друг път. Тоест държавата е превела парите за нейните субсидирани дейности. Те обаче не могат да се харчат защото не са гласувани с приет бюджет.
Казано на прост език, бързаме а харчим. Или по-скоро да се разплатим за кампанията, която ни избра. Имате ли съмнение за кого са гласували общинската аминистрация? Ами за тези които са ги назначили. Затова сега те (най=вероятно) със задна дата ще получат някой и друг бонус, а вие „лапайте мухите”. За вас – МУЗИКА, както се казваше в един стар анекдот. Ето и анекдота:
В Румъия по времето на диктатора Чаушеско, всяка сутрин по радиото правили обръщеия към населението, за да им тръгне деня както трябва. От радиото мъжки глас съобщавай дейностите, които Чаушеску извършвал и подканяли населението да ги следва
„- Другарят Чаущеско стана, ставайте и вие! През това време – музика” минава една песен и отново гласът казва „-Другарят Чаушеско си изми очите, мийте ги и вие! През това време – музика” Минава още една песен „-Другарят Чаушеску сяда да закусва, а за вас – музика!”
Та и в нашия случай така. За общинските служители по спешност бонуси от бюджета, а за вас – музика. Може и улици, ама на кредит. Ние ги строим, а после 3 мандата ще ги плащате! С този темп на нарастване на новите задължения, може и да не можете да ги изплатите, но така или иначе е рано за новия кредит. Той ще дойде последната година от мандата, че с 55% изпълнение нама откъде другаде да се харчи за пътища. А Белащица да си дишат прахта от кариерата, Брестовица да си пият мангана във вводата, Марково да си мрънкат за липсата на транспорт, Ягодово да си заобикалят през Първомай за Пловдив. Важното е улици да има.
– Третото изключително важно решение е смяната на Изпълнителния директор на общинското предприятие в с. Първенец за депониране на строителни отпадъци. Помня как го назначиха, отново на извънредно и спешно заседание, когато г-н Михайлов и г-н Цанков се скараха. Бях там и ахнах. Само не разбрах какво точно му е различното на това управление с новия общински съвет? Е разбрах и какво толкова е спешното в тази смяна, че чак на извънредна сесия.
Нищо добро не ни чака да знаете, просто защото няма разлика. Манталитета е същия с малко захаросване, капацитета е същия, възията същата – послушковци и тарикати в общинския съвет и администацията.
„А за вас – музика”
Разлика обаче има. Сега правим пдписка за въвеждане на оналайн излъчвания и извесяване по e-mail на заинтересованите от подобни заседания. Нещата вървят добре и най-вероятно ще успеем. Поне няма да се откажем. Така че ако искате промяна – създайте я. Разбирам всеки който не е гласувал на тези избори, но поне ударете по един подпис да сте информирани когато някой тегли кредити, които вие ще плащате. Поне това можете да направите.
Пишете ми на лични, ще се оргнизираме. https://www.facebook.com/vassil.kendov
Васил Кендов – финансист
Моля използвайте приложената форма за записване на час за среща [contact-form-7]
I am delighted to announce that the Raspberry Pi Foundation and Google DeepMind are building a global network of educational organisations to bring AI literacy to teachers and students all over the world, starting with Canada, Kenya, and Romania.
Learners around the world will gain AI literacy skills through Experience AI.
Experience AI
We launched Experience AI in September 2022 to help teachers and students learn about AI technologies and how they are changing the world.
Developed by the Raspberry Pi Foundation and Google DeepMind, Experience AI provides everything that teachers need to confidently deliver engaging lessons that will inspire and educate young people about AI and the role that it could play in their lives.
Experience AI is designed to inspire learners about AI through real-world contexts.
We provide lesson plans, classroom resources, worksheets, hands-on activities, and videos that introduce a wide range of AI applications and the underlying technologies that make them work. The materials are designed to be relatable to young people and can be taught by any teacher, whether or not they have a technical background. Alongside the classroom resources, we provide teacher professional development, including an online course that provides an introduction to machine learning and AI.
Part of Experience AI are video interviews with AI developers at Google DeepMind.
The materials are grounded in real-world contexts and emphasise the potential for young people to positively change the world through a mastery of AI technologies.
Since launching the first resources, we have seen significant demand from teachers and students all over the world, with over 200,000 students already learning with Experience AI.
Experience AI network
Building on that initial success and in response to huge demand, we are now building a global network of educational organisations to expand the reach and impact of Experience AI by translating and localising the materials, promoting them to schools, and supporting teacher professional development.
Obum Ekeke OBE, Head of Education Partnerships at Google DeepMind, says:
“We have been blown away by the interest we have seen in Experience AI since its launch and are thrilled to be working with the Raspberry Pi Foundation and local partners to expand the reach of the programme. AI literacy is a critical skill in today’s world, but not every young person currently has access to relevant education and resources. By making AI education more inclusive, we can help young people make more informed decisions about using AI applications in their daily lives, and encourage safe and responsible use of the technology.”
Experience AI helps learners understand how they might use AI to positively change the world.
Today we are announcing the first three organisations that we are working with, each of which is already doing fantastic work to democratise digital skills in their part of the world. All three are already working in partnership with the Raspberry Pi Foundation and we are excited to be deepening and expanding our collaboration to include AI literacy.
Digital Moment, Canada
Digital Moment is a Montreal-based nonprofit focused on empowering young changemakers through digital skills. Founded in 2013, Digital Moment has a track record of supporting teachers and students across Canada to learn about computing, coding, and AI literacy, including through supporting one of the world’s largest networks of Code Clubs.
“We’re excited to be working with the Raspberry Pi Foundation and Google DeepMind to bring Experience AI to teachers across Canada. Since 2018, Digital Moment has been introducing rich training experiences and educational resources to make sure that Canadian teachers have the support to navigate the impacts of AI in education for their students. Through this partnership, we will be able to reach more teachers and with more resources, to keep up with the incredible pace and disruption of AI.”
Indra Kubicek, President, Digital Moment
Tech Kidz Africa, Kenya
Tech Kidz Africa is a Mobasa-based social enterprise that nurtures creativity in young people across Kenya through digital skills including coding, robotics, app and web development, and creative design thinking.
“With the retooling of teachers as a key objective of Tech Kidz Africa, working with Google DeepMind and the Raspberry Pi Foundation will enable us to build the capacity of educators to empower the 21st century learner, enhancing the teaching and learning experience to encourage innovation and prepare the next generation for the future of work.”
Grace Irungu, CEO, Tech Kidz Africa
Asociația Techsoup, Romania
Asociația Techsoup works with teachers and students across Romania and Moldova, training Computer Science, ICT, and primary school teachers to build their competencies around coding and technology. A longstanding partner of the Raspberry Pi Foundation, they foster a vibrant community of CoderDojos and support young people to participate in Coolest Projects and the European Astro Pi Challenge.
“We are enthusiastic about participating in this global partnership to bring high-quality AI education to all students, regardless of their background. Given the current exponential growth of AI tools and instruments in our daily lives, it is crucial to ensure that students and teachers everywhere comprehend and effectively utilise these tools to enhance their human, civic, and professional potential. Experience AI is the best available method for AI education for middle school students. We couldn’t be more thrilled to work with the Raspberry Pi Foundation and Google DeepMind to make it accessible in Romanian for teachers in Romania and the Republic of Moldova, and to assist teachers in fully integrating it into their classes.”
Elena Coman, Director of Development, Asociația Techsoup
Get involved
These are the first of what will become a global network of organisations supporting tens of thousands of teachers to equip millions of students with a foundational understanding of AI technologies through Experience AI. If you want to get involved in inspiring the next generation of AI leaders, we would love to hear from you.
„Не искаме убийците сред нас.“ „Един човешки живот не струва 5000 лв.“ Тези лозунги можеше да се видят на протеста срещу освобождаването на Пламен Владимиров под гаранция от 5000 лв. Едва 20 дни по-рано освободеният беше осъден на доживотен затвор на първа инстанция, защото заедно със сина си Орлин е планирал убийството на снаха си Евгения. После лично е превозил и изхвърлил трупа ѝ. След това и двамата в продължение на цял месец хладнокръвно са поддържали лъжата, че жената е излязла и не се е прибрала.
Основанието за освобождаването под гаранция е тежкото здравословно състояние на Пламен Владимиров. Освен сериозните си хронични заболявания той е и с оперативно отстранен анус. Българските затвори не са места, където хората със сериозни здравни проблеми могат да получават адекватна терапия. От правозащитна гледна точка, макар и съучастник в убийството на снаха си, Владимиров-старши заслужава хуманно отношение – само защото е човек. Концепцията за правата на човека обаче ерозира поради двойните стандарти в правосъдието.
Сред най-важните условия една правосъдна система да бъде справедлива е тя да действа еднакво в аналогични случаи. А българското правораздаване е твърде избирателно – както спрямо подсъдимите и осъдените със здравословни проблеми, така и по отношение на размера на гаранцията. Ето само няколко от безбройните примери, които показват как правосъдието може за едни да играе ролята на инквизиция, а към други да е толкова толерантно, че чак липсващо.
Правосъдието като инквизиция
Помните ли унизителния арест на бившата кметица на „Младост“ Десислава Иванчева и заместничката ѝ Биляна Петрова по обвинение, че са взели подкуп? Те останаха в ареста 8 месеца въпреки влошеното здравословно състояние на Петрова и на майка ѝ, за която тя полага грижи. Гаранцията за Петрова беше 8000 лв., а за Иванчева – 10 000. Двете бяха ту зад решетките, ту под домашен арест в продължение на три години, след което бяха осъдени на затвор. Междувременно Иванчева роди и беше отделена от детето си, за да изтърпи присъдата си. Тя заведе дело срещу Сливенския затвор заради липсата на животоспасяващи лекарства и стоматологична помощ, което моментално се оказа прекратено.
Певицата Лиляна Деянова (известна като ЛиЛана) пък остана в ареста четири месеца въпреки непоносимите болки в гърба си, претърпял три операции. Тя беше арестувана заедно с брат си и техен съдружник по подозрения, че са злоупотребявали с евросредства и в контекста на обвиненията срещу хазартния бос Васил Божков, на когото се смята, че е била приближена. Гаранцията на ЛиЛана беше цели 40 000 лв.
Иванчева, Петрова и Деянова никого не са убили, нито са причинили телесна повреда. Обвиненията срещу певицата досега не са доказани, а въпреки присъдата за бившата кметица и сътрудничката ѝ общественото мнение така и не се убеди във вината им.
Правосъдието като отсъствие
Само срещу подписка обаче се отърва от ареста Начо Пантелеев, и то едва 24 часа след задържането си. Той е обвинен, че е причинил смъртта на футболния треньор Ферарио Спасов с автомобила си, който е карал със 150 км/ч. Пантелеев, който е шофьор от малко повече от година, но има скъпа кола, се е хвалил в социалните мрежи как развива скорост от… 268 км/ч. В първите часове след инцидента дори не му беше отнета книжката и не му беше забранено да напуска страната.
Печално известен е случаят с Васил Михайлов, син на пернишкия прокурор Бисер Михайлов – все е освобождаван от ареста, независимо колко хора е пребил и колко е заплашил. А когато Михайлов-баща беше задържан заради сигнал за насилие над жена си, която отрече той да ѝ е посегнал, не се намери прокурор, който да оспори освобождаването му. Въпреки че според Наказателния кодекс средната телесна повреда, каквато според медицинската експертиза е нанесена на жената, трябва да се разследва дори ако жертвата не настоява за това.
Списъкът може да продължава още дълго и назад във времето. Да си припомним само т.нар. братя Маргини, които бяха обвиняеми в подготовка на три убийства. Преди да бъдат окончателно оправдани през 2012 г., различни здравословни причини ставаха основание я за отлагане на делата, я за излизането на някого от тях под гаранция.
Неусетният път към дехуманизацията
Тези двойни стандарти засилват у обществото – и особено у близките на жертвите – чувството за несправедливост на правосъдието. То от своя страна допълнително подкопава и без това крехкото доверие в съдебната система. Честите протести срещу тази или онази присъда, мярка или срещу липса на наказание допринасят за една все по-устойчива нагласа, че общественото мнение знае по-добре от съда как да отсъжда той.
Когато общественото мнение е на страната на жертвите на престъпление, справедливостта обикновено изглежда като възможно най-строгото наказание. Щом няма смъртна присъда, то нищо по-малко от доживотен затвор без право на замяна. Извършителите на престъпления се приравняват с онова, което са извършили. Личността на причинилите нечия смърт се свежда до „убийци“, все едно дали са отнели човешки живот планирано, спонтанно, или пък по непредпазливост. А редуцирането на група хора само до една тяхна (негативна или смятана за негативна) характеристика е един от признаците на дехуманизацията.
„С какво този човек може да бъде полезен на обществото? С кое? Не знам. Ако може някой от вас да ми отговори. И двамата с какво могат да бъдат полезни? С нищо.“ Думите са по адрес на Орлин и Пламен Владимирови и принадлежат на Иво Найденов, който е адвокат на семейството на убитата Евгения.
С работата си като компютърен специалист Орлин Владимиров е можело да продължи да бъде полезен на обществото, ако не беше заловен. Баща му също вероятно притежава някакви качества, с които би могъл да има принос. Но това не означава, че те не следва да понесат своята отговорност. Смисълът на присъдата не е, че те са безполезни, а че са извършили престъпление.
Престъпление и изкупление
Съдбата на баща, син и внук Владимирови е история за токсичната мъжественост. Баща, за когото е толкова в реда на нещата една жена да бъде следена и убита, ако е „излязла от правия път“, че помага на сина си и в следенето, и в убийството. Малко момче, което цял живот ще трябва да се справя с травмата, че баща му е убил майка му с помощта на дядо му.
Токсичната мъжественост е тема и на филма на Марк Фостър от 2001 г. „Балът на чудовищата“. Баща, син и внук – потомствени палачи, възпитани в презрение към жените. Внукът не преживява бащиния натиск да бъде „корав мъж“. Бащата се опитва да изкупи вината си, като прекъсва веригата на токсичната мъжественост и се влюбва във вдовица на затворник, когото е екзекутирал. Започва да се учи на емпатия. Жената разбира, че той е изпълнил смъртната присъда на мъжа ѝ, и намира сили да му прости. Справедливостта е постигната – не с наказание, а с катарзис, изкупление и тръгване по нов път.
Да си представим възможен свят, в който Орлин Владимиров действително се разкайва за стореното и решава да направи нещо полезно. Той започва да записва в затвора лекции за вредата от токсичната мъжественост, предназначени за ученици и младежи с проблемно поведение, като се позовава на собствения си опит. След време получава възможност и лично да се среща с младите хора, за да ги убеждава да не станат като него.
Да си представим и че Начо Пантелеев или някой като него постъпва по аналогичен начин – убеждава младите шофьори да карат внимателно и да не се държат като бабаити, разказвайки им за последствията от своята фатална грешка.
Всъщност има такива случаи, макар и не в България. Германецът Хенри Оливер Якобс например е лежал 19 години в затвора за убийство, но днес се е посветил на превенцията на насилието и престъпността. И споделя собствения си опит в интервюта.
Трудно представимото възстановително правосъдие
Идеята за възстановителното правосъдие отива дори още по-напред. То се основава на схващането, че традиционното правосъдие не прави обществата по-добри, нито лежането в затвора намалява престъпността. Ала ако извършителите на престъпления и техните жертви (или близките на жертвите) успеят да се видят едни други като човешки същества и пострадалите дадат шанс на извършителя, той би могъл да направи нещо полезно за тях, вместо да стои зад решетките.
Така пострадалите ще са получили някаква смислена компенсация, а не само удовлетворение от факта на наказанието. Извършителят ще е получил втори шанс, а обществото ще е станало една идея по-хуманно.
В България е трудно да си представим това като разпространена практика именно поради дехуманизиращото отношение към престъпниците. Действително, за някои от тях е трудно да предположим, че преживяват катарзис. Например Орлин Владимиров и баща му с цялото им хладнокръвие, с което лъжеха и променяха версии – не изглежда много реалистично те от днес за утре да съжалят и да станат нови хора. И все пак не можем да знаем със сигурност какви предстои да бъдат.
Възстановителното правосъдие може да бъде възприето от едно общество, ако то е способно да направи базисното допускане, че човекът е повече от това, което е извършил или което му е причинено. Ето защо най-голямата пречка пред наличието на реално възстановително правосъдие е дехуманизиращото отношение. А в България хуманността като че ли става все по-дефицитна.
This blog post will cover how Psyberg helps automate the end-to-end catchup of different pipelines, including dimension tables.
In the previous installments of this series, we introduced Psyberg and delved into its core operational modes: Stateless and Stateful Data Processing. Now, let’s explore the state of our pipelines after incorporating Psyberg.
Pipelines After Psyberg
Let’s explore how different modes of Psyberg could help with a multistep data pipeline. We’ll return to the sample customer lifecycle:
Processing Requirement: Keep track of the end-of-hour state of accounts, e.g., Active/Upgraded/Downgraded/Canceled.
Solution: One potential approach here would be as follows
Create two statelessfact tables : a. Signups b. Account Plans
Create one statefulfact table: a. Cancels
Create a stateful dimension that reads the above fact tables every hour and derives the latest account state.
Let’s look at how this can be integrated with Psyberg to auto-handle late-arriving data and corresponding end-to-end data catchup.
Navigating the Workflow: How Psyberg Handles Late-Arriving Data
We follow a generic workflow structure for both stateful and stateless processing with Psyberg; this helps maintain consistency and makes debugging and understanding these pipelines easier. The following is a concise overview of the various stages involved; for a more detailed exploration of the workflow specifics, please turn to the second installment of this series.
1. Psyberg Initialization
The workflow starts with the Psyberg initialization (init) step.
Input: List of source tables and required processing mode
Output: Psyberg identifies new events that have occurred since the last high watermark (HWM) and records them in the session metadata table.
The session metadata table can then be read to determine the pipeline input.
2. Write-Audit-Publish (WAP) Process
This is the general pattern we use in our ETL pipelines.
a. Write Apply the ETL business logic to the input data identified in Step 1 and write to an unpublished iceberg snapshot based on the Psyberg mode
b. Audit Run various quality checks on the staged data. Psyberg’s metadata session table is used to identify the partitions included in a batch run. Several audits, such as verifying source and target counts, are performed on this batch of data.
c. Publish If the audits are successful, cherry-pick the staging snapshot to publish the data to production.
3. Psyberg Commit
Now that the data pipeline has been executed successfully, the new high watermark identified in the initialization step is committed to Psyberg’s high watermark metadata table. This ensures that the next instance of the workflow will pick up newer updates.
Callouts
Having the Psyberg step isolated from the core data pipeline allows us to maintain a consistent pattern that can be applied across stateless and stateful processing pipelines with varying requirements.
This also enables us to update the Psyberg layer without touching the workflows.
This is compatible with both Python and Scala Spark.
Debugging/figuring out what was loaded in every run is made easy with the help of workflow parameters and Psyberg Metadata.
The Setup: Automated end-to-end catchup
Let’s go back to our customer lifecycle example. Once we integrate all four components with Psyberg, here’s how we would set it up for automated catchup.
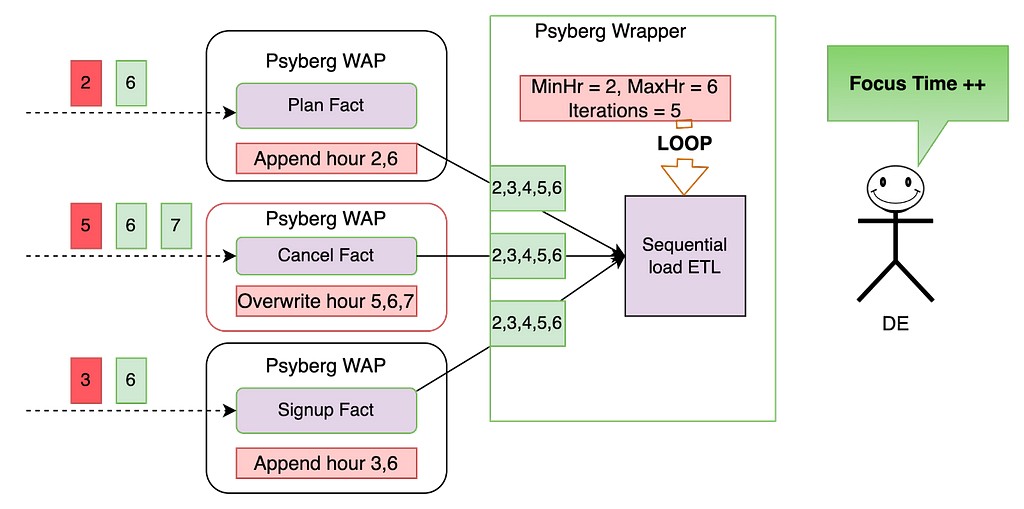
The three fact tables, comprising the signup and plan facts encapsulated in Psyberg’s stateless mode, along with the cancel fact in stateful mode, serve as inputs for the stateful sequential load ETL pipeline. This data pipeline monitors the various stages in the customer lifecycle.
In the sequential load ETL, we have the following features:
Catchup Threshold: This defines the lookback period for the data being read. For instance, only consider the last 12 hours of data.
Data Load Type: The ETL can either load the missed/new data specifically or reload the entire specified range.
Metadata Recording: Metadata is persisted for traceability.
Here is a walkthrough on how this system would automatically catch up in the event of late-arriving data:
Premise: All the tables were last loaded up to hour 5, meaning that any data from hour 6 onwards is considered new, and anything before that is classified as late data (as indicated in red above)
Fact level catchup:
During the Psyberg initialization phase, the signup and plan facts identify the late data from hours 2 and 3, as well as the most recent data from hour 6. The ETL then appends this data to the corresponding partitions within the fact tables.
The Psyberg initialization for the cancel fact identifies late data from hour 5 and additional data from hours 6 and 7. Since this ETL operates in stateful mode, the data in the target table from hours 5 to 7 will be overwritten with the new data.
By focusing solely on updates and avoiding reprocessing of data based on a fixed lookback window, both Stateless and Stateful Data Processing maintain a minimal change footprint. This approach ensures data processing is both efficient and accurate.
Dimension level catchup:
The Psyberg wrapper for this stateful ETL looks at the updates to the upstream Psyberg powered fact tables to determine the date-hour range to reprocess. Here’s how it would calculate the above range: MinHr = least(min processing hour from each source table) This ensures that we don’t miss out on any data, including late-arriving data. In this case, the minimum hour to process the data is hour 2. MaxHr = least(max processing hour from each source table) This ensures we do not process partial data, i.e., hours for which data has not been loaded into all source tables. In this case, the maximum hour to process the data is hour 6.
The ETL process uses this time range to compute the state in the changed partitions and overwrite them in the target table. This helps overwrite data only when required and minimizes unnecessary reprocessing.
As seen above, by chaining these Psyberg workflows, we could automate the catchup for late-arriving data from hours 2 and 6. The Data Engineer does not need to perform any manual intervention in this case and can thus focus on more important things!
The Impact: How Psyberg Transformed Our Workflows
The introduction of Psyberg into our workflows has served as a valuable tool in enhancing accuracy and performance. The following are key areas that have seen improvements from using Psyberg:
Computational Resources Used: In certain instances, we’ve noticed a significant reduction in resource utilization, with the number of Spark cores used dropping by 90% following the implementation of Psyberg, compared to using fixed lookback windows
Workflow and Table Onboarding: We have onboarded 30 tables and 13 workflows into incremental processing since implementing Psyberg
Reliability and Accuracy: Since onboarding workflows to Psyberg, we have experienced zero manual catchups or missing data incidents
Bootstrap template: The process of integrating new tables into incremental processing has been made more accessible and now requires minimal effort using Psyberg
These performance metrics suggest that adopting Psyberg has been beneficial to the efficiency of our data processing workflows.
Next Steps and Conclusion
Integrating Psyberg into our operations has improved our data workflows and opened up exciting possibilities for the future. As we continue to innovate, Netflix’s data platform team is focused on creating a comprehensive solution for incremental processing use cases. This platform-level solution is intended to enhance our data processing capabilities across the organization. Stay tuned for a new post on this!
In conclusion, Psyberg has proven to be a reliable and effective solution for our data processing needs. As we look to the future, we’re excited about the potential for further advancements in our data platform capabilities.
In the inaugural blog post of this series, we introduced you to the state of our pipelines before Psyberg and the challenges with incremental processing that led us to create the Psyberg framework within Netflix’s Membership and Finance data engineering team. In this post, we will delve into a more detailed exploration of Psyberg’s two primary operational modes: stateless and stateful.
Modes of Operation of Psyberg
Psyberg has two main modes of operation or patterns, as we call them. Understanding the nature of the late-arriving data and processing requirements will help decide which pattern is most appropriate for a use case.
Stateless Data Processing: As the name suggests, one should use this pattern in scenarios where the columns in the target table solely depend on the content of the incoming events, irrespective of their order of occurrence. For instance, consider a scenario where we need to keep track of all the customer signups over time. In this case, the order of signups wouldn’t matter, and individual signup records are independent of each other. This information has only one source, and we can append new/late records to the fact table as and when the events are received.
Stateful Data Processing: This pattern is useful when the output depends on a sequence of events across one or more input streams. For example, the customer account lifecycle in a business might involve multiple stages, such as account creation, plan upgrades, downgrades, and cancellation. To derive attributes like the lifetime of an account or the latest plan the account is on, we need to track the sequence of these events across different input streams. A missed event in such a scenario would result in incorrect analysis due to a wrong derived state. Late-arriving data in such cases requires overwriting data that was previously processed to ensure all events are accounted for.
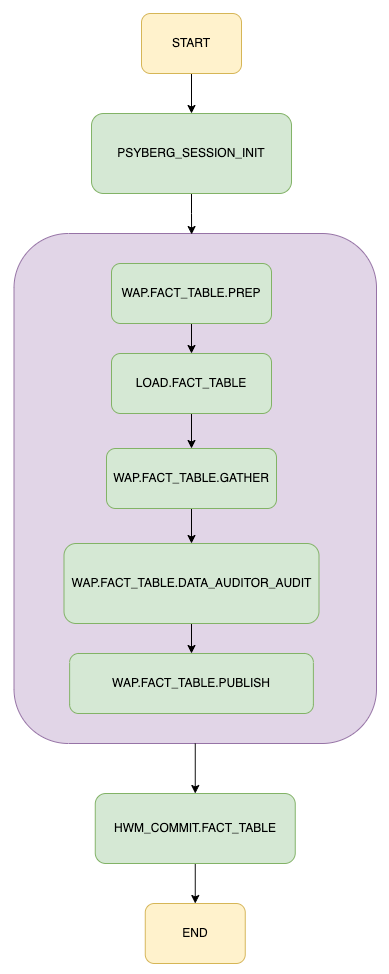
Let’s visualize how these two modes work within our data processing pipeline using a general workflow for loading a fact table. If you would like to learn more about how the workflows are orchestrated in Netflix Maestro scheduler, please check out this blog post from our data platform team.
With this illustration as our guide, let’s explore each mode in more detail.
The Psyberg Initialization Phase
This step invokes Psyberg with the required parameters. Based on these parameters, Psyberg then computes the correct data range for the pipeline processing needs.
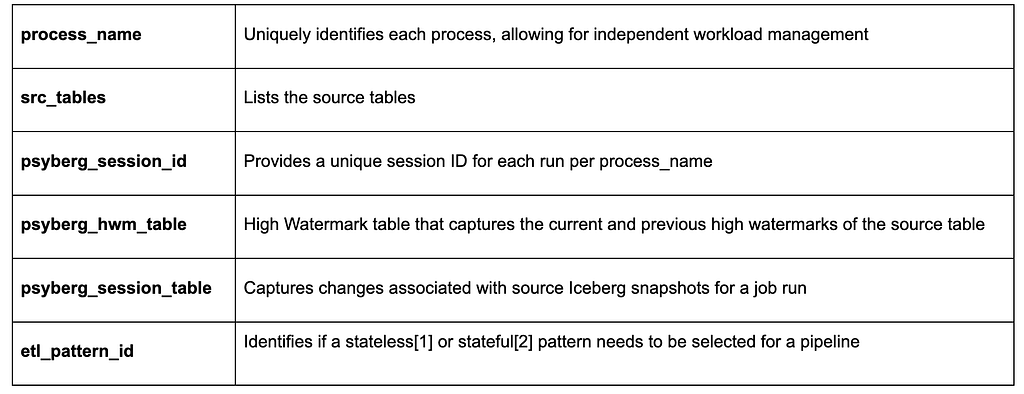
Input parameters in this step include the following:
Initialization for Stateless Data Processing
Let’s use the signup fact table as an example here. This table’s workflow runs hourly, with the main input source being an Iceberg table storing all raw signup events partitioned by landing date, hour, and batch id.
Here’s a YAML snippet outlining the configuration for this during the Psyberg initialization step:
Behind the scenes, Psyberg identifies that this pipeline is configured for a stateless pattern since etl_pattern_id=1.
Psyberg also uses the provided inputs to detect the Iceberg snapshots that persisted after the latest high watermark available in the watermark table. Using the summary column in snapshot metadata [see the Iceberg Metadata section in post 1 for more details], we parse out the partition information for each Iceberg snapshot of the source table.
Psyberg then retains these processing URIs (an array of JSON strings containing combinations of landing date, hour, and batch IDs) as determined by the snapshot changes. This information and other calculated metadata are stored in the psyberg_session_f table. This stored data is then available for the subsequent LOAD.FACT_TABLE job in the workflow to utilize and for analysis and debugging purposes.
Initialization for Stateful Data Processing
Stateful Data Processing is used when the output depends on a sequence of events across one or more input streams.
Let’s consider the example of creating a cancel fact table, which takes the following as input:
Raw cancellation events indicating when the customer account was canceled
A fact table that stores incoming customer requests to cancel their subscription at the end of the billing period
These inputs help derive additional stateful analytical attributes like the type of churn i.e. voluntary or involuntary, etc.
The initialization step for Stateful Data Processing differs slightly from Stateless. Psyberg offers additional configurations according to the pipeline needs. Here’s a YAML snippet outlining the configuration for the cancel fact table during the Psyberg initialization step:
Behind the scenes, Psyberg identifies that this pipeline is configured for a stateful pattern since etl_pattern_id is 2.
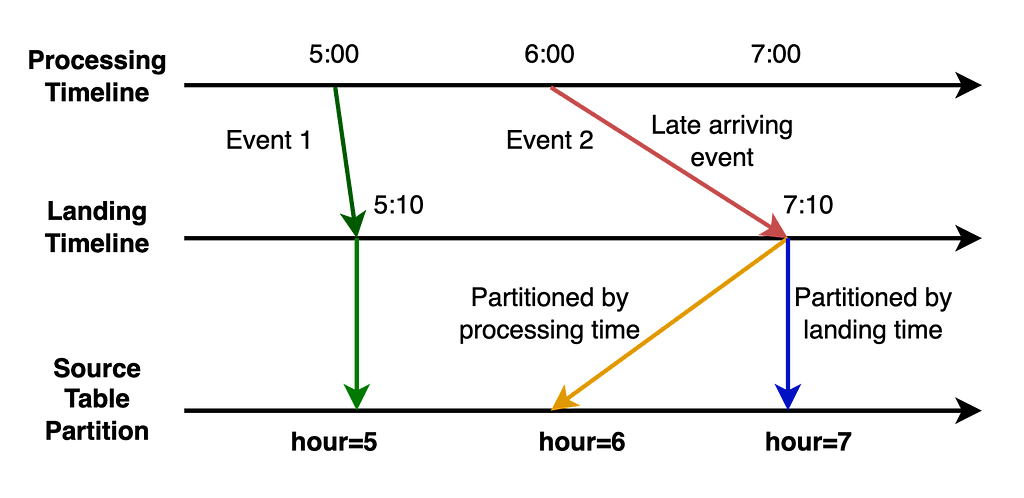
Notice the additional detail in the src_tables list corresponding to raw_cancels above. The processing_ts here represents the event processing timestamp which is different from the regular Iceberg snapshot commit timestamp i.e. event_landing_ts as described in part 1 of this series.
It is important to capture the range of a consolidated batch of events from all the sources i.e. both raw_cancels and cancel_request_fact, while factoring in late-arriving events. Changes to the source table snapshots can be tracked using different timestamp fields. Knowing which timestamp field to use i.e. event_landing_ts or something like processing_ts helps avoid missing events.
Similar to the approach in stateless data processing, Psyberg uses the provided inputs to parse out the partition information for each Iceberg snapshot of the source table.
Sample parsed input for target snapshot_date 20230914 and snapshot_hour 9
This is then used to query the partitions metadata table which has the min and max range for each column in the source table. In this case, we look at the min and max range of the processing_ts column to determine actual partitions for any late-arriving events. The minimum value here helps determine the lower limit of the data to be processed i.e. the derived minimum date and hour based on the input epoch timestamp.
Lower Limit to be processed = least ( “min” event_processing_ts)
It also tracks the VTTS (Valid To TimeStamp) of all the input streams and determines the minimum VTTS of all the streams together. This helps determine the upper limit of data to be processed, thus restricting the data load based on data completeness of all the streams combined.
Upper Limit to be processed = least (vtts date-hour)
Using this metadata from different streams, Psyberg calculates several parameters like minimum/maximum processing date and hour and event landing date hour. These parameters, along with other metadata, discussed in the previous post, are persisted in the psyberg_session_f table for analysis and debugging purposes.
Write Audit Publish (WAP) process
The Write Audit Publish (WAP) process is a general pattern we use in our ETLs to validate writes to the uncommitted Iceberg snapshot before publishing to the target table. The LOAD.FACT_TABLE step takes psyberg_session_id and process_name as input arguments.
For stateless pattern, the processing URIs to be processed as part of the load step are identified by reading the psyberg_session_f table. This information is then used to filter the source table and apply the business logic to create the signup fact table. Any late-arriving signup events data is appended to the target table partitions as part of this. All these writes go into the uncommitted Iceberg snapshot managed by the WAP pattern.
Similarly, in the stateful pattern, the ETL step reads the psyberg_session_f table to identify the derived minimum and maximum date hour range to be processed, which acts as a filter for different input tables involved in the ETL. After applying the corresponding business logic for cancellation events, we create the cancel fact table along with columns like cancellation type (i.e., voluntary vs involuntary churn) representing the state of the canceled account. If there are any late-arriving events, Psyberg handles them automatically by providing the correct range to the data process to derive the state changes correctly.
Audits
We run different audits on the uncommitted Iceberg snapshot created as part of the job run. Leveraging Psyberg metadata, we can identify the cohort of data involved as part of the job run. This helps in pinpointing changes and applying blocking audits efficiently. Audits like source-to-target count comparison and checking for no missing events in the target Iceberg snapshot ensure data integrity and completeness. Once the audits pass successfully, the data is published to the target table.
HWM Commit
Leveraging Psyberg metadata tables, we determine the latest timestamp associated with the Iceberg snapshot seen as part of the job run. This timestamp is used to update the high watermark table with the new high watermark so that the subsequent pipeline instance can pick up the next set of changes.
Conclusion
This exploration shows how Psyberg brings efficiency, accuracy, and timeliness to Stateless and Stateful Data Processing within the Membership and Finance data engineering team. Join us in the next part of our blog series, where we’ll discuss how it also helps automate the end-to-end catchup of different pipelines.
At Netflix, our Membership and Finance Data Engineering team harnesses diverse data related to plans, pricing, membership life cycle, and revenue to fuel analytics, power various dashboards, and make data-informed decisions. Many metrics inNetflix’s financial reports are powered and reconciled with efforts from our team! Given our role on this critical path, accuracy is paramount. In this context, managing the data, especially when it arrives late, can present a substantial challenge!
In this three-part blog post series, we introduce you to Psyberg, our incremental data processing framework designed to tackle such challenges! We’ll discuss batch data processing, the limitations we faced, and how Psyberg emerged as a solution. Furthermore, we’ll delve into the inner workings of Psyberg, its unique features, and how it integrates into our data pipelining workflows. By the end of this series, we hope you will gain an understanding of how Psyberg transformed our data processing, making our pipelines more efficient, accurate, and timely. Let’s dive in!
The Challenge: Incremental Data Processing with Late Arriving Data
Our teams’ data processing model mainly comprises batch pipelines, which run at different intervals ranging from hourly to multiple times a day (also known as intraday) and even daily. We expect complete and accurate data at the end of each run. To meet such expectations, we generally run our pipelines with a lag of a few hours to leave room for late-arriving data.
What is late-arriving data?
Late-arriving data is essentially delayed data due to system retries, network delays, batch processing schedules, system outages, delayed upstream workflows, or reconciliation in source systems.
How does late-arriving data impact us?
You could think of our data as a puzzle. With each new piece of data, we must fit it into the larger picture and ensure it’s accurate and complete. Thus, we must reprocess the missed data to ensure data completeness and accuracy.
Types of late-arriving data
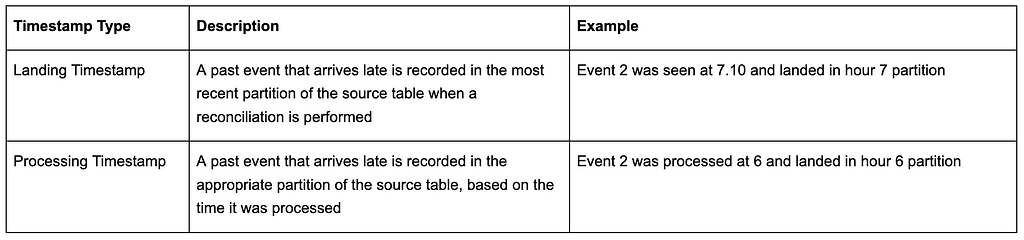
Based on the structure of our upstream systems, we’ve classified late-arriving data into two categories, each named after the timestamps of the updated partition:
Ways to process such data
Our team previously employed some strategies to manage these scenarios, which often led to unnecessarily reprocessing unchanged data. Some techniques we used were:
1. Using fixed lookback windows to always reprocess data, assuming that most late-arriving events will occur within that window. However, this approach usually leads to redundant data reprocessing, thereby increasing ETL processing time and compute costs. It also becomes inefficient as the data scale increases. Imagine reprocessing the past 6 hours of data every hour!
2. Add alerts to flag when late arriving data appears, block the pipelines, and perform a manual intervention where we triggered backfill pipelines to handle the missed events. This approach was a simple solution with minimal extra processing for the most part and, hence, was our preferred solution. However, when the late events occurred, the pain of reprocessing data and catching up on all the dependent pipelines was not worth it! We will talk about this shortly.
At a high level, both these approaches were inefficient for intraday pipelines and impacted cost, performance, accuracy, and time. We developed Psyberg, an incremental processing framework using Iceberg to handle these challenges more effectively.
The state of our pipelines before Psyberg
Before diving into the world of Psyberg, it’s crucial to take a step back and reflect on the state of the data pipelines in our team before its implementation. The complexities involved in these processes and the difficulties they posed led to the development of Psyberg.
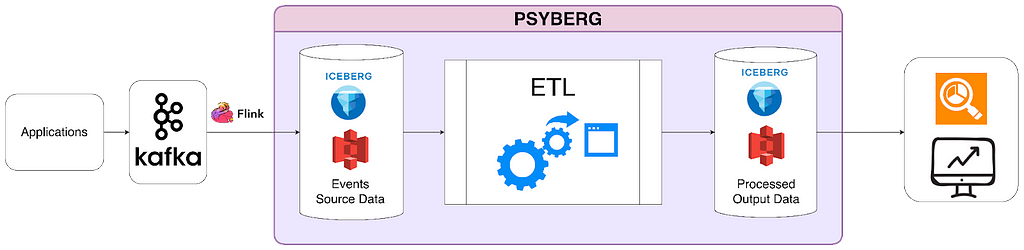
At Netflix, our backend microservices continuously generate real-time event data that gets streamed into Kafka. These raw events are the source of various data processing workflows within our team. We ingest this diverse event data and transform it into standardized fact tables. The fact tables then feed downstream intraday pipelines that process the data hourly. The sequential load ETL shown in the diagram below depicts one such pipeline that calculates an account's state every hour.
Raw data for hours 3 and 6 arrive. Hour 6 data flows through the various workflows, while hour 3 triggers a late data audit alert.
Let’s walk through an example to understand the complexity of this pre-Psyberg world.
Consider a simplified version of our pipelines where we process three events: signups, plan changes, and cancels. Now imagine that some signup events from hour 3 were delayed and sent in at hour 6 instead. Our audits would detect this and alert the on-call data engineer (DE). The on-call DE would then face the daunting task of making things right!
Step 1: Dive into the audit logs to identify the late-arriving data and the impacted workflows. In this case, they would discover that the late-arriving data for hour 3 must be included in the signup facts.
Step 2: Stop all impacted workflows and downstream jobs (such as the sequential load ETL) and patch the missed data in the fact tables. Now, the data in the signup fact is patched.
Step 3: Identify the number of partitions to be rerun for the sequential stateful load jobs to account for the delayed data and rerun them from the impacted date-hour. The DE would note that the data for hours 3–6 needs to be reprocessed and will retrigger four instances to be run sequentially. This step is crucial because missing signup events from hour 3 would result in us missing subsequent events for those affected accounts (e.g., a cancel event for a missed signup would have had no effect). As we capture the state of an account based on the sequence of different types of events, rerunning the sequential load ETL from hours 3 to 6 ensures the accurate representation of account states.
Step 4: Now that we’ve spent significant time triaging and resolving the alert, the sequential ETL workflow likely experienced a delay. As a result, we need to catch up to schedule. To compensate for the lost time, the DE must trigger a few additional instances until the latest hour that would have run if the data hadn’t arrived late.
This entire process was challenging and required significant manual intervention from the on-call DE perspective. Note that these are hourly jobs, so the alert could be triggered at any time of the day (or night!). Yes, they were infrequent, but a big pain point when they occurred! Also, the on-call DE was usually not the SME for these pipelines, as the late data could have arrived in any of our upstream pipelines. To solve these problems, we came up with Psyberg!
Psyberg: The Game Changer!
Psyberg automates our data loads, making it suitable for various data processing needs, including intraday pipeline use cases. It leverages Iceberg metadata to facilitate processing incremental and batch-based data pipelines.
One of the critical features of Psyberg is its ability to detect and manage late-arriving data, no matter the partition it lands in. This feature allows data pipelines to handle late-arriving data effectively without manual intervention, ensuring higher data accuracy in our systems. Iceberg metadata and Psyberg’s own metadata form the backbone of its efficient data processing capabilities.
ETL Process High Watermark
This is the last recorded update timestamp for any data pipeline process. This is mainly used to identify new changes since the last update.
Iceberg Metadata
Psyberg primarily harnesses two key iceberg metadata tables — snapshots and partitions — to manage the workload. All Iceberg tables have associated metadata that provide insight into changes or updates within the data tables.
The snapshots metadata table records essential metadata such as:
The creation time of a snapshot
The type of operation performed (append, overwrite, etc.)
A summary of partitions created/updated during the generation of the Iceberg snapshot
These details enable Psyberg to track different operations and identify changes made to a source table since the previous high watermark. For example:
The partitions metadata table is particularly interesting as it stores:
Information about partition keys used in the data table
Column names and the range of values for each column within a specific partition
One unique aspect of Netflix’s internal implementation is that it provides the range of values for each column within a partition in a deserialized format. This information helps Psyberg comprehend the timestamp ranges for both types of late-arriving data (event and processing time) without querying the actual data.
Psyberg Metadata
In addition to Iceberg metadata, Psyberg maintains its own metadata tables — the session table and the high watermark table. Both these tables are partitioned by the pipeline process name to maintain information related to each data pipeline independently.
The session table captures metadata specific to each pipeline run, including:
Process name partition to track all the runs associated with the data pipeline process
Session ID to track unique runs within the process
Processing URIs to identify the input partitions involved in the load
“from date”, “from hour”, “to date” and “to hour” for both event and processing times
The high watermark table stores relevant values from the session table at the end of each pipeline run:
Latest and previous high water mark timestamp
Metadata related to the latest run
This information is vital for each pipeline run instance as it helps determine the data to be loaded, updates the high water mark after processing, and finally generates output signals to inform downstream workflows about the date-hour up to which data is complete and available. It also serves as an essential resource for debugging and creating audits on the pipeline jobs.
Conclusion
In this post, we described our data architecture at a high level, along with the pain points that led to the development of Psyberg. We also went into details related to the metadata that powers Psyberg. If you understand the challenges faced by the on-call DE and would like to learn more about our solution, please check out the next iteration of this three-part series, where we delve deeper into different modes of Psyberg.
Today, AWS is announcing support for logging with EventBridge Pipes.Amazon EventBridge Pipes is a point to point integration solution that connects event producers and consumers with optional filter, transform, and enrichment steps. EventBridge Pipes reduces the amount of integration code builders must write and maintain when building event-driven applications. Popular integrations include connecting Amazon Kinesis streams together with filtering, Amazon DynamoDB direct integrations with Amazon EventBridge, and Amazon SQS integrations with AWS Step Functions.
Amazon EventBridge Pipes
EventBridge Pipes logging introduces insights into different stages of the pipe execution. It expands on the Amazon CloudWatch metrics support, and provides you with additional methods for troubleshooting and debugging.
You can now gain insights into various successful and failure scenarios within the pipe execution steps. When event transformation or enrichment succeeds or fails, you can use logs to delve deeper and initiate troubleshooting for any issues with their configured pipes.
EventBridge Pipes execution steps
Understanding pipes execution steps can assist you in selecting the appropriate log level, which determines how much information is logged.
A pipe execution consists of two main stages: the enrichment and target. Both of these stages encompass transformation and invocation steps.
You can use input transformers, enabling modification to the payload of the event before the events undergo enrichment or get dispatched to the downstream target. This gives you fine-grained control over the manipulation of event data during the execution of their configured pipes.
When the pipe execution starts, the execution enters the enrichment stage. If you don’t configure an enrichment stage, the execution proceeds to the target stage.
At the pipe execution, transformation, enrichment, and target phases EventBridge can log information to help debug or troubleshoot. Pipes logs can include payloads, errors, transformations, AWS requests, and AWS responses.
When logging is enabled for your pipe, EventBridge produces a log entry for every execution step and sends these logs to the specified log destinations.
EventBridge Pipes supports three log destinations: Amazon CloudWatch Logs, Amazon Kinesis Data Firehose stream, and Amazon S3. The records sent can be customized by configuring the log level of the pipe (OFF, ERROR, INFO, TRACE).
OFF – EventBridge does not send any records.
ERROR – EventBridge sends records related to errors generated during the pipe execution. Examples include Execution Failed, Execution Timeout and Enrichment Failures.
INFO – EventBridge sends records related to errors and selected information performed during pipe execution. Examples include Execution Started, Execution Succeeded and Enrichment Stage Succeeded.
TRACE – EventBridge sends any record generated during any step in the pipe execution.
The ERROR log level proves beneficial in gaining insights into the reasons behind a failed pipe execution. Pipe executions may encounter failure due to various reasons, such as timeouts, enrichment failure, transformation failure, or target invocation failure. Enabling ERROR logging allows you to learn more about the specific cause of the pipe error, facilitating the resolution of the issue.
The INFO log level supplements ERROR information with additional details. It not only informs about errors but also provides insights into the commencement of the pipe execution, entry into the enrichment phase, progression into the transformation phase, and the initiation and successful completion of the target stage.
For a more in-depth analysis, you can use the TRACE log level to obtain comprehensive insights into a pipe execution. This encompasses all supported pipe logs, offering a detailed view beyond the INFO and ERROR logs. The TRACE log level reveals crucial information, such as skipped pipe execution stages and the initiation of transformation and enrichment processes.
Including execution data with EventBridge Pipes logging
To help with further debugging, you can choose to include execution data within the pipe logs. This data comprises event payloads, AWS requests, and responses sent to and received from configured enrichment and target components.
You can also use the execution data to gain further insights into the payloads, requests, and responses sent to AWS services during the execution of the pipe.
Incorporating execution data can enhance understanding of the pipe execution, providing deeper insights and aiding in the debugging of any encountered issues.
Execution data within a log contains three parts:
payload: The content of the event itself. The payload of the event may contain sensitive information and EventBridge makes no attempt to redact the contents. Including execution data is optional and can be turned off.
awsRequest: The request sent to the enrichment or target in serialized JSON format. For API destinations this includes the HTTP request sent to that endpoint.
awsResponse: The response returned by the enrichment or target in JSON format. For API Destinations, this is the response returned from the configured endpoint.
The payload of the event is populated when the event itself can be updated. These stages include the initial pipe execution, enrichment phase, and target phase. The awsRequest and awsResponse are both generated at the final steps of enrichment and targeting.
This example creates a pipe with logging enabled and includes execution data. The pipe connects two Amazon SQS queues using an input transformer on the target with no enrichment step. The input transformer customizes the payload of the event before reaching the target.
Creating the source and target queues
# Create a queue for the source
aws sqs create-queue --queue-name pipe-source

# Create a queue for the target
aws sqs create-queue --queue-name pipe-target
2. Navigate to EventBridge Pipes and choose Create pipe.
3. Select SQS as the Source and select pipe-source as the SQS Queue.
4. Skip the filter and enrichment phase and add a new Target. Select SQS as the Target service and pipe-target as the Queue.
5. Open Target Input Transformer section and enter the transformer code into the Transformer field.
{

  "body": "Favorite food is <$.body>"

}
6. Choose Pipe settings to configure the log group for the new pipe.
7. Verify that CloudWatch Logs is set as the log destination, and select Trace as the log level. Check the “Include execution data” check box. This logs all traces to the new CloudWatch log group and includes the SQS messages that are sent on the pipe.
8. Choose Create Pipe.
9. Send an SQS message to the source queue.
# Get the Queue URL

aws sqs get-queue-url --queue-name pipe-source

# Send a message to the queue using the URL

aws sqs send-message --queue-url {QUEUE_URL} --message-body "pizza"
10. All trace logs are shown in the monitoring tab, use CloudWatch Logs section for more information.
Conclusion
EventBridge Pipes enables point-to-point integration between event producers and consumers. With logging support for EventBridge Pipes, you can now gain insights into various stages of the pipe execution. Pipe log destinations can be configured to CloudWatch Logs, Kinesis Data Firehose, and Amazon S3.
EventBridge Pipes supports three log levels. The ERROR log level configures EventBridge to send records related to errors to the log destination. The INFO log level configures EventBridge to send records related to errors and selected information during the pipe execution. The TRACE log level sends any record generated to the log destination, useful for debugging and gaining further insights.
You can include execution data in the logs, which includes the event itself, and AWS requests and responses made to AWS services configured in the pipe. This can help you gain further insights into the pipe execution. Read the documentation to learn more about EventBridge Pipes Logs.
For more serverless learning resources, visit Serverless Land.
It takes just a few minutes to turn on and configure Resource Explorer for an entire organization or a specific organizational unit (OU) and use simple free-form text and filtered searches to find relevant AWS resources across accounts and Regions.
When operating in a well-architected manner, multiple AWS accounts are used to help isolate and manage business applications and data. You can now use Resource Explorer to simplify how you explore your resources across accounts and act on them at scale. For example, Resource Explorer can help you locate impacted resources across your entire organization when investigating increased operational costs, troubleshooting a performance issue, or remediating a security alert.
Let’s see how this works in practice.
Setting up multi-account search You can set up multi-account search for your organization in four steps:
Configure Resource Explorer in every account in the organization or in the OU you want to search through. You can do that in just a few clicks using AWS Systems Manager Quick Setup. Optionally, you can use AWS CloudFormation, or other management tools you are comfortable with.
It is not mandatory, but we suggest creating a delegated admin account for AWS Account Management. Then, to centralize all the required permissions for multi-account creation, we recommend using the delegated admin account to create Resource Explorer multi-account views.
Finally, you can create a multi-account view to start searching across the organization.
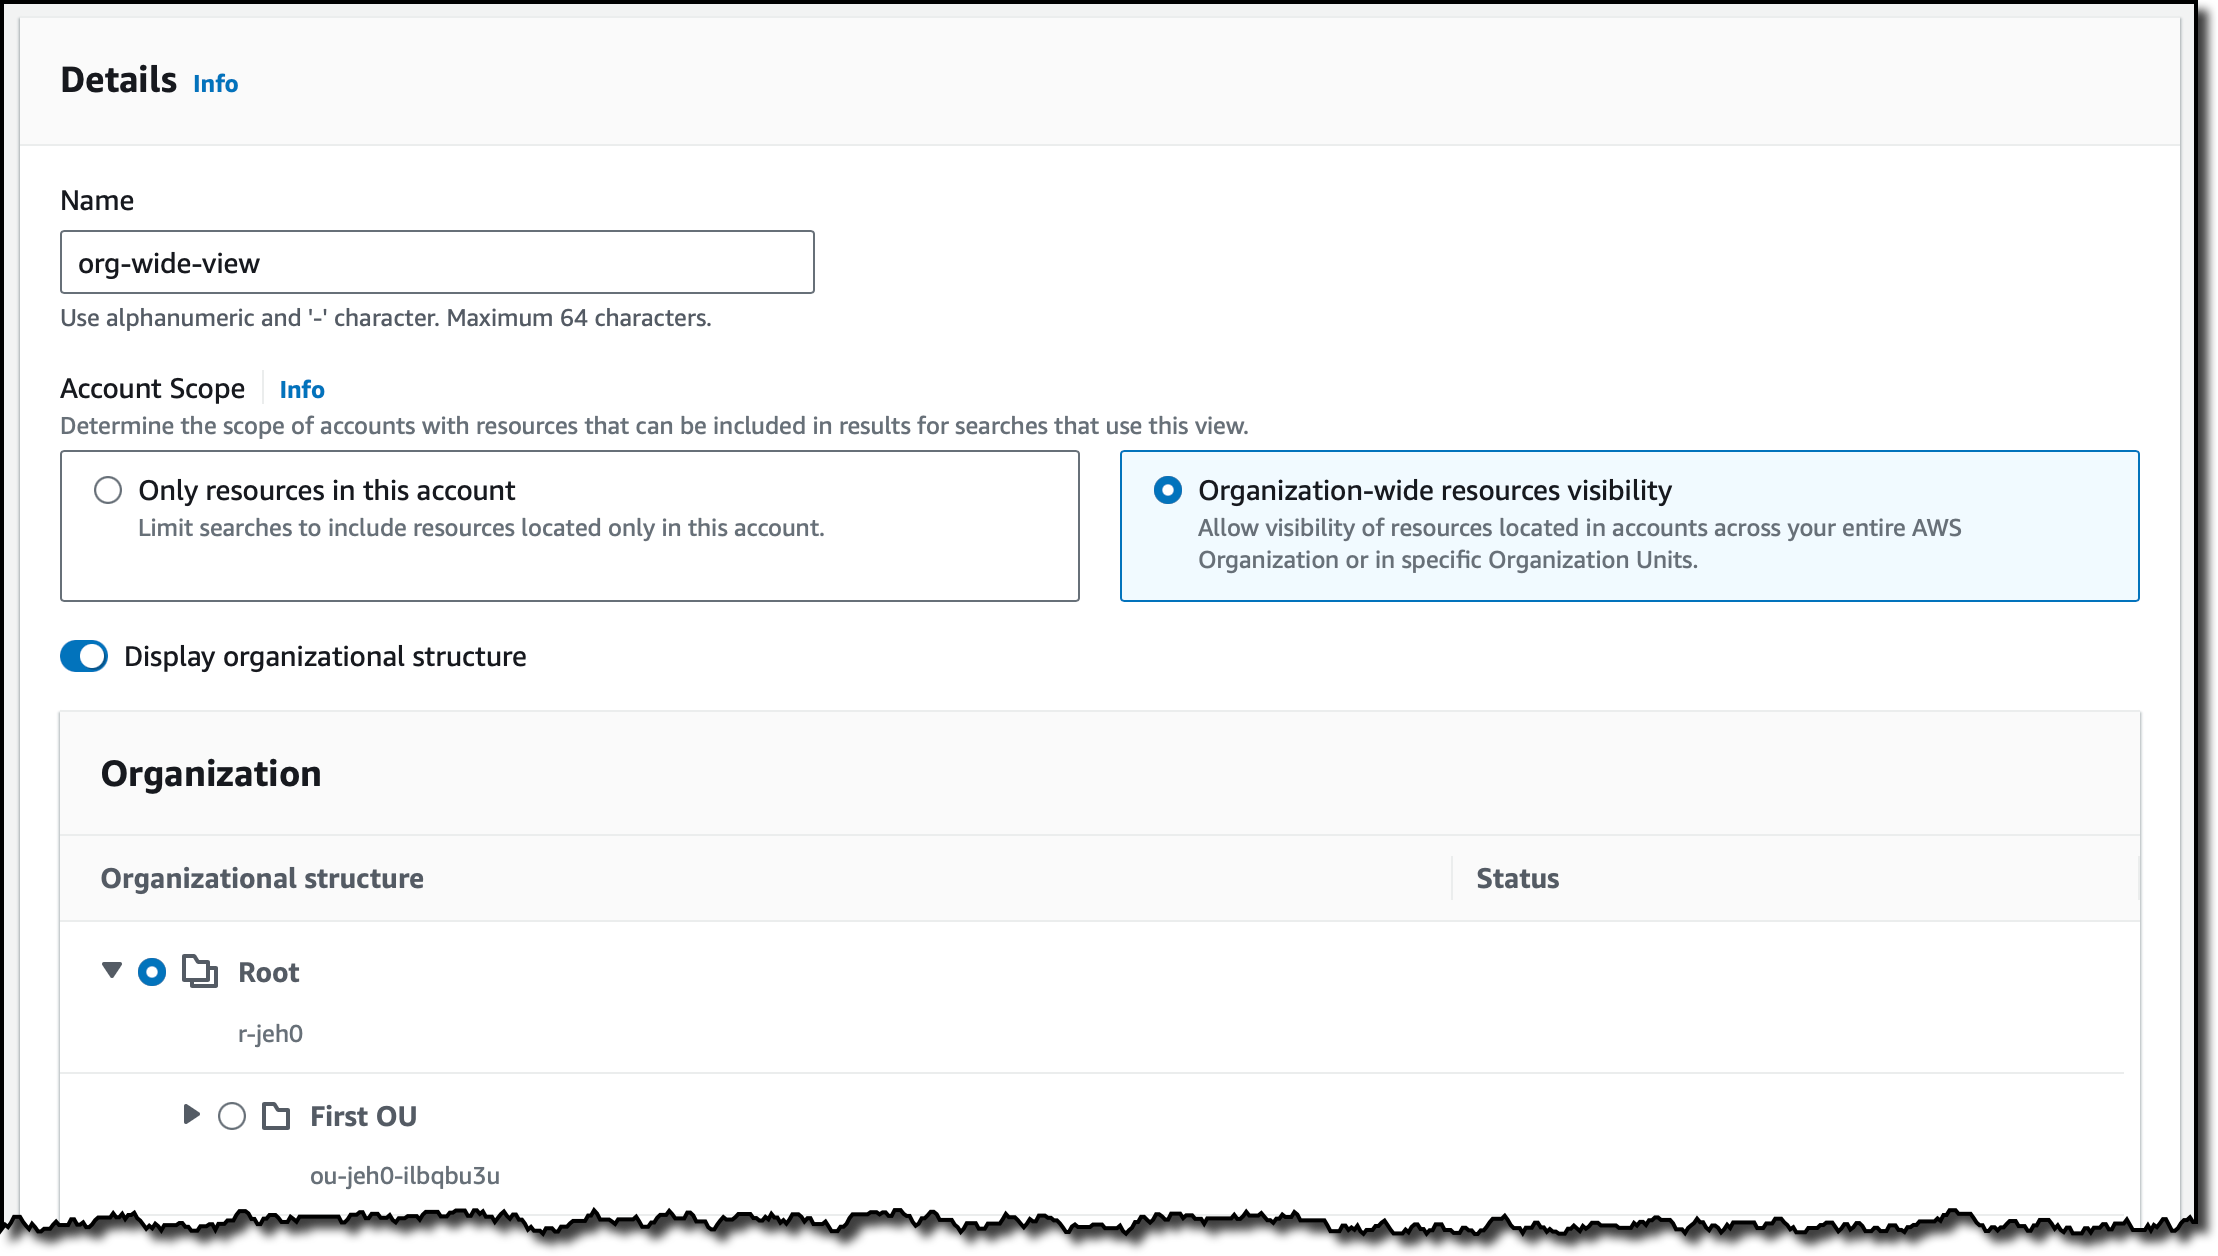
Create a multi-account view I already implemented the first three steps in the previous list. Using the delegated admin account, I go to the Resource Explorer console. There, I choose Views in the Explore resources section and create a view.
I enter a name for the view and select Organization-wide resources visibility. In this way, I can allow visibility of resources located in accounts across my entire organization or in specific OUs. For this view, I select the whole organization.
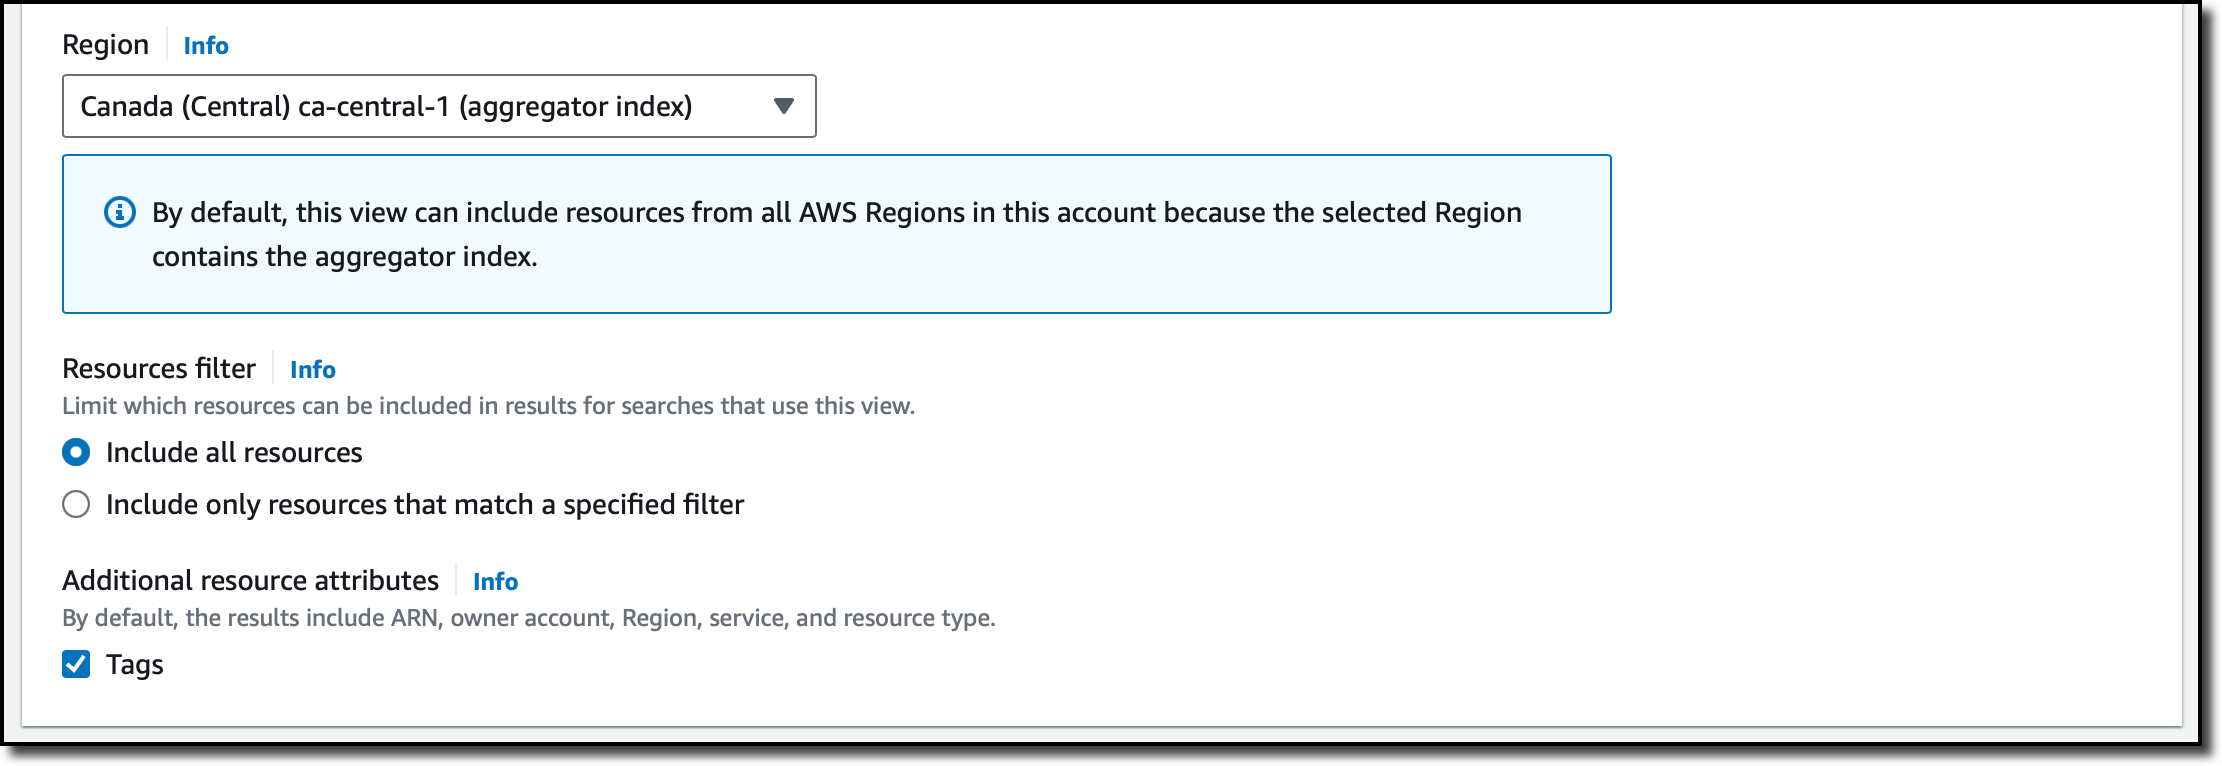
For the Region, I select the one where I have the aggregator index. The aggregator index contains a replicated copy of the local index in every other Region where Resource Explorer has been turned on. Optionally, I can use a filter to limit which resources should be included in this view. I choose to include all resources and additional resource attributes such as tags.
Then, I complete the creation of the view. Now, by granting access to the view, I can control who can access what resource information in Resource Explorer.
Using multi-account search To try the new multi-account view, I choose Resource search from the Explore resources section of the navigation pane. In my query, I want to see if there are Amazon ElastiCache resources for an old version of Redis. I type elasticache:* redis3.2 in the Query field.
In the results, I see the different AWS accounts and Regions where these resources are based. For resources in my account, there is a link in the first column that opens that resource in the console. For resources in other accounts, I can use the console with the appropriate account and service to get more information or take action.
Things to know Multi-account search is available in the following AWS Regions: [[ Regions ]].
There is no additional charge for using AWS Resource Explorer, including for multi-account searches.
To share views with other accounts in an organization, we suggest you use the delegated admin account to create the view with the necessary visibility in terms of resources, Regions, and accounts within the organization and then use AWS Resource Access Manager to share access to the view. For example, you can create a view for a specific OU and then share the view with an account in that OU.
Auditing is a continuous and ongoing process, and every audit includes the collection of evidence. The evidence gathered helps confirm the state of resources and it’s used to demonstrate that the customer’s policies, procedures, and activities (controls), are in place, and that the control has been operational for a specified period of time. AWS Audit Manager already automates this evidence collection for AWS usage. However, large enterprise organizations who deploy their workloads across a range of locations such as cloud, on-premises, or a combination of both, manage this evidence data using a combination of third-party or homegrown tools, spreadsheets, and emails.
Today we’re excited to announce the integration of AWS Audit Manager with third party Governance, Risk, and Compliance (GRC) provider, MetricStream CyberGRC, an AWS Partner with GRC capabilities. This integration allows enterprises to manage compliance across AWS, on-premises, and other cloud environments in a centralized GRC environment.
Before this announcement, Audit Manager operated only in the AWS context, allowing customers to collect compliance evidence for resources in AWS. They would then relay that information to their GRC systems external to AWS for additional aggregation and analysis. This process left customers without an automated way to monitor and evaluate all compliance data in one centralized location, resulting in delays to compliance outcomes.
The GRC integration with Audit Manager allows you to use audit evidence collected by Audit Manager directly in MetricStream CyberGRC. Audit Manager now receives the controls in scope from MetricStream CyberGRC, collects evidence around these controls, and exports the data related to the audit into MetricStream CyberGRC for aggregation and analysis. You will now have aggregated compliance, real-time monitoring and centralized reporting. This will reduce compliance fatigue and improve stakeholder collaboration.
How It Works Using Amazon Cognito User Pools, you’ll be onboarded into the multi-tenant instance of MetricStream CyberGRC.
Amazon Cognito User Pools
Once onboarded, you’ll be able to view AWS assets and frameworks inside MetricStream CyberGRC. You can then begin by choosing the suitable Audit Manager framework to define the relationships between your existing enterprise controls and AWS controls. After creating this one-time control mapping, you can define the accounts in scope to create an assessment that MetricStream CyberGRC will manage in AWS Audit Manager on your behalf. This assessment triggers AWS Audit Manager to collect evidence in context of the mapped controls. As a result, you get a unified view of compliance evidence inside your GRC application. Any standard controls that you have in Audit Manager will be provided to MetricStream CyberGRC by using the GetControl API to facilitate manual mapping process wherever automated mapping fails or does not suffice. The EvidenceFinderAPI will send bulk evidence from Audit Manager to MetricStream CyberGRC.
Available Now This feature is available today where Audit Manager (AWS Regions) and MetricStream CyberGRC are both available. There are no additional AWS Audit Manager charges for using this integration. To use this integration, please reach out to MetricStream for information about access and purchase of MetricStream CyberGRC software.
As part of the AWS Free Tier, AWS Audit Manager offers a free tier for first-time customers. The free tier will expire in two calendar months after the first subscription. For more information, see AWS Audit Manager pricing. To learn more about AWS Audit Manager integration with MetricStream CyberGRC, see Audit Manager documentation.
In the AWS Security Profile series, we feature the people who work in Amazon Web Services (AWS) Security and help keep our customers safe and secure. This interview is with Tom Scholl, VP and Distinguished Engineer for AWS.
What do you do in your current role and how long have you been at AWS?
I’m currently a vice president and distinguished engineer in the infrastructure organization at AWS. My role includes working on the AWS global network backbone, as well as focusing on denial-of-service detection and mitigation systems. I’ve been with AWS for over 12 years.
What initially got you interested in networking and how did that lead you to the anti-abuse and distributed denial of service (DDoS) space?
My interest in large global network infrastructure started when I was a teenager in the 1990s. I remember reading a magazine at the time that cataloged all the large IP transit providers on the internet, complete with network topology maps and sizes of links. It inspired me to want to work on the engineering teams that supported that. Over time, I was fortunate enough to move from working at a small ISP to a telecom carrier where I was able to work on their POP and backbone designs. It was there that I learned about the internet peering ecosystem and started collaborating with network operators from around the globe.
For the last 20-plus years, DDoS was always something I had to deal with to some extent. Namely, from the networking lens of preventing network congestion through traffic-engineering and capacity planning, as well as supporting the integration of DDoS traffic scrubbers into network infrastructure.
About three years ago, I became especially intrigued by the network abuse and DDoS space after using AWS network telemetry to observe the size of malicious events in the wild. I started to be interested in how mitigation could be improved, and how to break down the problem into smaller pieces to better understand the true sources of attack traffic. Instead of merely being an observer, I wanted to be a part of the solution and make it better. This required me to immerse myself into the domain, both from the perspective of learning the technical details and by getting hands-on and understanding the DDoS industry and environment as a whole. Part of how I did this was by engaging with my peers in the industry at other companies and absorbing years of knowledge from them.
How do you explain your job to your non-technical friends and family?
I try to explain both areas that I work on. First, that I help build the global network infrastructure that connects AWS and its customers to the rest of the world. I explain that for a home user to reach popular destinations hosted on AWS, data has to traverse a series of networks and physical cables that are interconnected so that the user’s home computer or mobile phone can send packets to another part of the world in less than a second. All that requires coordination with external networks, which have their own practices and policies on how they handle traffic. AWS has to navigate that complexity and build and operate our infrastructure with customer availability and security in mind. Second, when it comes to DDoS and network abuse, I explain that there are bad actors on the internet that use DDoS to cause impairment for a variety of reasons. It could be someone wanting to disrupt online gaming, video conferencing, or regular business operations for any given website or company. I work to prevent those events from causing any sort of impairment and trace back the source to disrupt that infrastructure launching them to prevent it from being effective in the future.
Recently, you were awarded the J.D. Falk Award by the Messaging Malware Mobile Anti-Abuse Working Group (M3AAWG) for IP Spoofing Mitigation. Congratulations! Please tell us more about the efforts that led to this.
Basically, there are three main types of DDoS attacks we observe: botnet-based unicast floods, spoofed amplification/reflection attacks, and proxy-driven HTTP request floods. The amplification/reflection aspect is interesting because it requires DDoS infrastructure providers to acquire compute resources behind providers that permit IP spoofing. IP spoofing itself has a long history on the internet, with a request for comment/best current practice (RFC/BCP) first written back in 2000 recommending that providers prevent this from occurring. However, adoption of this practice is still spotty on the internet.
At NANOG76, there was a proposal that these sorts of spoofed attacks could be traced by network operators in the path of the pre-amplification/reflection traffic (before it bounced off the reflectors). I personally started getting involved in this effort about two years ago. AWS operates a large global network and has network telemetry data that would help me identify pre-amplification/reflection traffic entering our network. This would allow me to triangulate the source network generating this. I then started engaging various networks directly that we connect to and provided them timestamps, spoofed source IP addresses, and specific protocols and ports involved with the traffic, hoping they could use their network telemetry to identify the customer generating it. From there, they’d engage with their customer to get the source shutdown or, failing that, implement packet filters on their customer to prevent spoofing.
Initially, only a few networks were capable of doing this well. This meant I had to spend a fair amount of energy in educating various networks around the globe on what spoofed traffic is, how to use their network telemetry to find it, and how to handle it. This was the most complicated and challenging part because this wasn’t on the radar of many networks out there. Up to this time, frontline network operations and abuse teams at various networks, including some very large ones, were not proficient in dealing with this.
The education I did included a variety of engagements, including sharing drawings with the day-in-the-life of a spoofed packet in a reflection attack, providing instructions on how to use their network telemetry tools, connecting them with their network telemetry vendors to help them, and even going so far as using other more exotic methods to identify which of their customers were spoofing and pointing out who they needed to analyze more deeply. In the end, it’s about getting other networks to be responsive and take action and, in the best cases, find spoofing on their own and act upon it.
Incredible! How did it feel accepting the award at the M3AAWG General Meeting in Brooklyn?
It was an honor to accept it and see some acknowledgement for the behind-the-scenes work that goes on to make the internet a better place.
What’s next for you in your work to suppress IP spoofing?
Continue tracing exercises and engaging with external providers. In particular, some of the network providers that experience challenges in dealing with spoofing and how we can improve their operations. Also, determining more effective ways to educate the hosting providers where IP spoofing is a common issue and making them implement proper default controls to not allow this behavior. Another aspect is being a force multiplier to enable others to spread the word and be part of the education process.
Looking ahead, what are some of your other goals for improving users’ online experiences and security?
Continually focusing on improving our DDoS defense strategies and working with customers to build tailored solutions that address some of their unique requirements. Across AWS, we have many services that are architected in different ways, so a key part of this is how do we raise the bar from a DDoS defense perspective across each of them. AWS customers also have their own unique architecture and protocols that can require developing new solutions to address their specific needs. On the disruption front, we will continue to focus on disrupting DDoS-as-a-service provider infrastructure beyond disrupting spoofing to disrupting botnets and the infrastructure associated with HTTP request floods.
With HTTP request floods being much more popular than byte-heavy and packet-heavy threat methods, it’s important to highlight the risks open proxies on the internet pose. Some of this emphasizes why there need to be some defaults in software packages to prevent misuse, in addition to network operators proactively identifying open proxies and taking appropriate action. Hosting providers should also recognize when their customer resources are communicating with large fleets of proxies and consider taking appropriate mitigations.
What are the most critical skills you would advise people need to be successful in network security?
I’m a huge proponent of being hands-on and diving into problems to truly understand how things are operating. Putting yourself outside your comfort zone, diving deep into the data to understand something, and translating that into outcomes and actions is something I highly encourage. After you immerse yourself in a particular domain, you can be much more effective at developing strategies and rapid prototyping to move forward. You can make incremental progress with small actions. You don’t have to wait for the perfect and complete solution to make some progress. I also encourage collaboration with others because there is incredible value in seeking out diverse opinions. There are resources out there to engage with, provided you’re willing to put in the work to learn and determine how you want to give back. The best people I’ve worked with don’t do it for public attention, blog posts, or social media status. They work in the background and don’t expect anything in return. They do it because of their desire to protect their customers and, where possible, the internet at large.
Lastly, if you had to pick an industry outside of security for your career, what would you be doing?
I’m over the maximum age allowed to start as an air traffic controller, so I suppose an air transport pilot or a locomotive engineer would be pretty neat.
If you have feedback about this post, submit comments in the Comments section below. If you have questions about this post, contact AWS Support.
Want more AWS Security news? Follow us on Twitter.
Microsoft is addressing 64 vulnerabilities this November Patch Tuesday, including five zero-day vulnerabilities as well as one critical remote code execution (RCE) vulnerability. Overall, this month sees significantly fewer vulnerabilities addressed across a smaller number of products than has been typical of Patch Tuesday over the past year or two. Browser vulnerabilities account for 20 of the 64 vulnerabilities patched, and 14 of those are republished third-party vulnerabilities in Chromium.
CVE-2023-36025 describes a Windows SmartScreen security feature bypass. An attacker who convinces a user to open a specially crafted malicious Internet Shortcut file could bypass the anti-phishing and anti-malware protection provided by Windows SmartScreen. This could be abused as an early stage in a more complex attack chain.
Windows DWM: zero-day EoP
Originally introduced in Windows Vista, the Windows Dynamic Window Manager (DWM) enables many of the modern UI features which users have come to expect from a Windows OS. This month, the DWM Core Library receives a patch for CVE-2023-36033, an elevation of privilege (EoP) vulnerability which Microsoft notes is both publicly disclosed and exploited in the wild. Exploitation leads to SYSTEM privileges, but Microsoft does not provide any further guidance on the attack mechanism.
Windows Cloud Files mini driver: zero-day EoP
Microsoft is patching CVE-2023-36036, an EoP vulnerability in the Windows Cloud Files Mini Filter Driver. No details of the attack mechanism are provided in the advisory, but exploitation leads to SYSTEM privileges.
Office Protected View: zero-day bypass
CVE-2023-36413 describes a publicly disclosed Microsoft Office security feature bypass. A user who opens a specially crafted malicious file would find themselves in Editing mode, rather than Protected View, and would thus lose out on warning banners and other defenses designed to detect and quarantine malicious code in Office documents.
ASP.NET Core: zero-day DoS
CVE-2023-36038 describes an ASP.NET Core denial of service (DoS) attack, which affects only .NET 8 RC 1 running on the IIS InProcess hosting model. The mechanism of the attack is resource exhaustion on the web server via cancellation of requests; this sounds very similar to last month’s CVE-2023-44487, dubbed “Rapid Reset”. However, there’s no mention of HTTP/2 in the advisory for CVE-2023-36038.
Fewer critical vulns this month
Only three vulnerabilities patched this month qualify as Critical under Microsoft’s proprietary severity ranking scale: one each in Windows Pragmatic General Multicast (PGM), the Azure CLI, and Windows HMAC Key Derivation.
Windows PGM: critical RCE via MSMQ
CVE-2023-36397 describes an RCE vulnerability in Windows PGM. As with other similar previous vulnerabilities, an attacker can send a specially-crafted file over the network to attempt malicious code execution on the target asset. Only systems where Windows Message Queueing Service (MSMQ) is enabled are exploitable, and it isn’t added to a default Windows installation. However, as Rapid7 has noted previously, administrators should be aware that a number of applications — including Microsoft Exchange — quietly introduce MSMQ as part of their own installation routine.
Hyper-V: critical VM escape
Attackers looking to escape from a low privilege Hyper-V guest OS and execute code as SYSTEM on the Hyper-V host system will take note of CVE-2023-36400. Successful exploitation requires running a specially crafted application in the context of the guest OS to exploit a weakness in Windows HMAC Key Derivation, so some prior access is required.
Azure CLI: critical credential leak via log files
The Azure CLI tool prior to version 2.53.1 does not sufficiently redact information published to log files in certain contexts, allowing recovery of plaintext(!) usernames and passwords. The advisory for CVE-2023-36052 notes that log files stored in open-source repositories are a potential avenue for credential leaks in this context. Although Microsoft understandably hasn’t provided any specific examples, it’s unlikely that they would mention this if they weren’t aware of one or more real world examples.
Exchange: RCE, spoofing, and ZDI disclosures
Patch Tuesday typically sees at least one Exchange remote code execution vulnerability fixed, and this month is no exception. Exploitation of CVE-2023-36439 requires that the attacker have valid credentials for an Exchange user, and be present on the local network, but grants execution as NT AUTHORITY\SYSTEM on Exchange server host; this is a built-in account with extensive privileges, including the ability to act as the computer on the network.
A trio of Exchange server spoofing vulnerabilities — CVE-2023-36035CVE-2023-36039 and CVE-2023-36050 — are also patched today. Successful exploitation requires that an attacker be present on the local network with valid Exchange credentials, but can lead to exposure of credentials or an NTLM hash for other users. Two of these vulnerabilities are exploited via PowerShell remoting.
Somewhat conspicuous by their absence: four flaws in Exchange published by Trend Micro’s Zero Day Initiative (ZDI) on 2023-11-02 do not appear to have received patches today. Microsoft had previously told ZDI that these vulnerabilities did not require immediate servicing. Since Microsoft is the CVE Numbering Authority (CNA) for its own products, there are no publicly available CVE numbers for these vulnerabilities yet.
cURL: patch for much-anticipated vuln
Microsoft admins who have been waiting for a patch for last month’s cURL SOCKS5 vulnerability CVE-2023-38545 will be pleased to see that Microsoft has included curl.exe 8.4.0 as part of the November updates for current versions of Windows. Many observers ultimately concluded that this vulnerability was perhaps of more limited scope and attacker value than the pre-publication buzz may have suggested, but a patch is always appreciated.
Is it 23H2 already?
A new arrival: Windows 11 23H2 was released on 2023-10-31 across all editions, and receives its first patches today.
Summary Charts
All those Edge vulns make the Exchange bar look smaller.A big month for Elevation of Privilege!Very few Critical vulns this month, but more Moderate than we often see.A cluster of Microsoft Dynamics spoofing and XSS vulns.
2023-11-14: Shortly after initial publication, some Microsoft advisory web pages were not listing any patches, although patches did exist. Microsoft appears to have remediated the issue with the advisory web pages. Removed a paragraph from the blog which mentioned this.
Today, we’re making available a new capability of AWS GlueData Catalog to allow automatic compaction of transactional tables in the Apache Iceberg format. This allows you to keep your transactional data lake tables always performant.
Data lakes were initially designed primarily for storing vast amounts of raw, unstructured, or semi structured data at a low cost, and they were commonly associated with big data and analytics use cases. Over time, the number of possible use cases for data lakes has evolved as organizations have recognized the potential to use data lakes for more than just reporting, requiring the inclusion of transactional capabilities to ensure data consistency.
Data lakes also play a pivotal role in data quality, governance, and compliance, particularly as data lakes store increasing volumes of critical business data, which often requires updates or deletion. Data-driven organizations also need to keep their back end analytics systems in near real-time sync with customer applications. This scenario requires transactional capabilities on your data lake to support concurrent writes and reads without data integrity compromise. Finally, data lakes now serve as integration points, necessitating transactions for safe and reliable data movement between various sources.
To support transactional semantics on data lake tables, organizations adopted an open table format (OTF), such as Apache Iceberg. Adopting OTF formats comes with its own set of challenges: transforming existing data lake tables from Parquet or Avro formats to an OTF format, managing a large number of small files as each transaction generates a new file on Amazon Simple Storage Service (Amazon S3), or managing object and meta-data versioning at scale, just to name a few. Organizations are typically building and managing their own data pipelines to address these challenges, leading to additional undifferentiated work on infrastructure. You need to write code, deploy Spark clusters to run your code, scale the cluster, manage errors, and so on.
When talking with our customers, we learned that the most challenging aspect is the compaction of individual small files produced by each transactional write on tables into a few large files. Large files are faster to read and scan, making your analytics jobs and queries faster to execute. Compaction optimizes the table storage with larger-sized files. It changes the storage for the table from a large number of small files to a small number of larger files. It reduces metadata overhead, lowers network round trips to S3, and improves performance. When you use engines that charge for the compute, the performance improvement is also beneficial to the cost of usage as the queries require less compute capacity to run.
But building custom pipelines to compact and optimize Iceberg tables is time-consuming and expensive. You have to manage the planning, provision infrastructure, and schedule and monitor the compaction jobs. This is why we launch automatic compaction today.
Let’s see how it works To show you how to enable and monitor automatic compaction on Iceberg tables, I start from the AWS Lake Formation page or the AWS Glue page of the AWS Management Console. I have an existing database with tables in the Iceberg format. I execute transactions on this table over the course of a couple of days, and the table starts to fragment into small files on the underlying S3 bucket.
I select the table on which I want to enable compaction, and then I select Enable compaction.
An IAM role is required to pass permissions to the Lake Formation service to access my AWS Glue tables, S3 buckets, and CloudWatch log streams. Either I choose to create a new IAM role, or I select an existing one. Your existing role must have lakeformation:GetDataAccess and glue:UpdateTable permissions on the table. The role also needs logs:CreateLogGroup, logs:CreateLogStream, logs:PutLogEvents, to “arn:aws:logs:*:your_account_id:log-group:/aws-lakeformation-acceleration/compaction/logs:*“. The role trusted permission service name must be set to glue.amazonaws.com.
Then, I select Turn on compaction. Et voilà! Compaction is automatic; there is nothing to manage on your side.
The service starts to measure the table’s rate of change. As Iceberg tables can have multiple partitions, the service calculates this change rate for each partition and schedules managed jobs to compact the partitions where this rate of change breaches a threshold value.
When the table accumulates a high number of changes, you will be able to view the Compaction history under the Optimization tab in the console.
You can also monitor the whole process either by observing the number of files on your S3 bucket (use the NumberOfObjects metric) or one of the two new Lake Formation metrics: numberOfBytesCompacted or numberOfFilesCompacted.
In addition to the AWS console, there are six new APIs that expose this new capability:CreateTableOptimizer, BatchGetTableOptimizer , UpdateTableOptimizer, DeleteTableOptimizer, GetTableOptimizer, and ListTableOptimizerRuns. These APIs are available in the AWS SDKs and AWS Command Line Interface (AWS CLI). As usual, don’t forget to update the SDK or the CLI to their latest versions to get access to these new APIs.
Things to know As we launched this new capability today, there are a couple of additional points I’d like to share with you:
Compaction will not merge delete files. Tables with deleted data will be compacted, but data files that have delete files associated with them will be skipped.
S3 buckets configured for exclusive access from a VPC through VPC endpoints are not supported.
Apache Iceberg tables using Apache Parquet to store the data can be compacted.
Availability This new capability is available starting today in all AWS Regions where AWS Glue Data Catalog is available.
The pricing metric is the data processing unit (DPU), a relative measure of processing power that consists of 4 vCPUs of compute capacity and 16 GB of memory. There is a charge per DPU/hours metered by second, with a minimum of one minute.
Now it’s time to decommission your existing compaction data pipeline and switch to this new, entirely managed capability today.
As 2023 comes to an end, we’re celebrating our final Heroes cohort launch of the year! These technical experts are passionate about helping their local communities build faster on AWS—they’re focused on sharing best practices, solving problems, and even more. We’re thrilled to have them join the AWS Heroes program, and recognizing them for their contributions to the greater AWS community.
Please meet our newest Heroes!
Emin Alemdar – Izmir, Turkey
Container Hero Emin Alemdar is a Solutions Architect at Spacelift where he produces solutions related to Kubernetes, Cloud technologies, and Cloud Native Transformation. In general, his work focuses on these services and technologies, and he shares best practices with the AWS community. Additionally, Emin is a CNCF Ambassador and is part of the HashiCorp Ambassador Program within the open source community.
Richard Fan – Hong Kong
Security Hero Richard Fan is a Security Engineer at ExpressVPN. He is dedicated to helping builders easily adopt AWS, and shares best practices around streamlines for cloud governance. Richard has also developed different tools to simplify the experience with AWS security services, such as his nitro-enclave-python-demo project, which helps builders get started on AWS Nitro Enclaves and has been adopted by some AWS workshops. Furthermore, Richard promotes the concept and use cases of enclave technology by partnering with multiple companies to review their AWS Nitro Enclaves offering.
Takuya Tachibana – Misawa, Japan
Community Hero Takuya Tachibana is the CEO of Heptagon inc. and Director of DigitalCube Co. Ltd. Since 2012, he has been contributing to the Japan AWS User Group (JAWS-UG), and he was the leader from 2016-2017 for all of the JAWS-UGs, representing and overseeing every chapter in Japan. Tachibana has been a speaker at over 100 community and cloud events throughout all of Japan, including AWS Summit Seoul, AWS Summit Beijing, and AWS Community Day APAC.
Learn More
To learn more about the AWS Heroes program or to connect with a Hero near you, please visit the AWS Heroes website.
November 14, 2023: We’ve updated this post to use IAM Identity Center and follow updated IAM best practices.
In this post, we discuss the concept of folders in Amazon Simple Storage Service (Amazon S3) and how to use policies to restrict access to these folders. The idea is that by properly managing permissions, you can allow federated users to have full access to their respective folders and no access to the rest of the folders.
Overview
Imagine you have a team of developers named Adele, Bob, and David. Each of them has a dedicated folder in a shared S3 bucket, and they should only have access to their respective folders. These users are authenticated through AWS IAM Identity Center (successor to AWS Single Sign-On).
In this post, you’ll focus on David. You’ll walk through the process of setting up these permissions for David using IAM Identity Center and Amazon S3. Before you get started, let’s first discuss what is meant by folders in Amazon S3, because it’s not as straightforward as it might seem. To learn how to create a policy with folder-level permissions, you’ll walk through a scenario similar to what many people have done on existing files shares, where every IAM Identity Center user has access to only their own home folder. With folder-level permissions, you can granularly control who has access to which objects in a specific bucket.
You’ll be shown a policy that grants IAM Identity Center users access to the same Amazon S3 bucket so that they can use the AWS Management Console to store their information. The policy allows users in the company to upload or download files from their department’s folder, but not to access any other department’s folder in the bucket.
After the policy is explained, you’ll see how to create an individual policy for each IAM Identity Center user.
Throughout the rest of this post, you will use a policy, which will be associated with an IAM Identity Center user named David. Also, you must have already created an S3 bucket.
Note: S3 buckets have a global namespace and you must change the bucket name to a unique name.
For this blog post, you will need an S3 bucket with the following structure (the example bucket name for the rest of the blog is “my-new-company-123456789”):
Figure 1: Screenshot of the root of the my-new-company-123456789 bucket
Your S3 bucket structure should have two folders, home and confidential, with a file root-file.txt in the main bucket directory. Inside confidential you will have no items or folders. Inside home there should be three sub-folders: Adele, Bob, and David.
Figure 2: Screenshot of the home/ directory of the my-new-company-123456789 bucket
A brief lesson about Amazon S3 objects
Before explaining the policy, it’s important to review how Amazon S3 objects are named. This brief description isn’t comprehensive, but will help you understand how the policy works. If you already know about Amazon S3 objects and prefixes, skip ahead to Creating David in Identity Center.
Amazon S3 stores data in a flat structure; you create a bucket, and the bucket stores objects. S3 doesn’t have a hierarchy of sub-buckets or folders; however, tools like the console can emulate a folder hierarchy to present folders in a bucket by using the names of objects (also known as keys). When you create a folder in S3, S3 creates a 0-byte object with a key that references the folder name that you provided. For example, if you create a folder named photos in your bucket, the S3 console creates a 0-byte object with the key photos/. The console creates this object to support the idea of folders. The S3 console treats all objects that have a forward slash (/) character as the last (trailing) character in the key name as a folder (for example, examplekeyname/)
To give you an example, for an object that’s named home/common/shared.txt, the console will show the shared.txt file in the common folder in the home folder. The names of these folders (such as home/ or home/common/) are called prefixes, and prefixes like these are what you use to specify David’s department folder in his policy. By the way, the slash (/) in a prefix like home/ isn’t a reserved character — you could name an object (using the Amazon S3 API) with prefixes such as home:common:shared.txt or home-common-shared.txt. However, the convention is to use a slash as the delimiter, and the Amazon S3 console (but not S3 itself) treats the slash as a special character for showing objects in folders. For more information on organizing objects in the S3 console using folders, see Organizing objects in the Amazon S3 console by using folders.
Creating David in Identity Center
IAM Identity Center helps you securely create or connect your workforce identities and manage their access centrally across AWS accounts and applications. Identity Center is the recommended approach for workforce authentication and authorization on AWS for organizations of any size and type. Using Identity Center, you can create and manage user identities in AWS, or connect your existing identity source, including Microsoft Active Directory, Okta, Ping Identity, JumpCloud, Google Workspace, and Azure Active Directory (Azure AD). For further reading on IAM Identity Center, see the Identity Center getting started page.
Begin by setting up David as an IAM Identity Center user. To start, open the AWS Management Console and go to IAM Identity Center and create a user.
Note: The following steps are for Identity Center without System for Cross-domain Identity Management (SCIM) turned on, the add user option won’t be available if SCIM is turned on.
From the left pane of the Identity Center console, select Users, and then choose Add user.
Figure 3: Screenshot of IAM Identity Center Users page.
Enter David as the Username, enter an email address that you have access to as you will need this later to confirm your user, and then enter a First name, Last name, and Display name.
Leave the rest as default and choose Add user.
Select Users from the left navigation pane and verify you’ve created the user David.
Figure 4: Screenshot of adding users to group in Identity Center.
Now that you’re verified the user David has been created, use the left pane to navigate to Permission sets, then choose Create permission set.
Figure 5: Screenshot of permission sets in Identity Center.
Select Custom permission set as your Permission set type, then choose Next.
Figure 6: Screenshot of permission set types in Identity Center.
David’s policy
This is David’s complete policy, which will be associated with an IAM Identity Center federated user named David by using the console. This policy grants David full console access to only his folder (/home/David) and no one else’s. While you could grant each user access to their own bucket, keep in mind that an AWS account can have up to 100 buckets by default. By creating home folders and granting the appropriate permissions, you can instead allow thousands of users to share a single bucket.
Now, copy and paste the preceding IAM Policy into the inline policy editor. In this case, you use the JSON editor. For information on creating policies, see Creating IAM policies.
Figure 7: Screenshot of the inline policy inside the permissions set in Identity Center.
Give your permission set a name and a description, then leave the rest at the default settings and choose Next.
Verify that you modify the policies to have the bucket name you created earlier.
After your permission set has been created, navigate to AWS accounts on the left navigation pane, then select Assign users or groups.
Figure 8: Screenshot of the AWS accounts in Identity Center.
Select the user David and choose Next.
Figure 9: Screenshot of the AWS accounts in Identity Center.
Select the permission set you created earlier, choose Next, leave the rest at the default settings and choose Submit.
Figure 10: Screenshot of the permission sets in Identity Center.
You’ve now created and attached the permissions required for David to view his S3 bucket folder, but not to view the objects in other users’ folders. You can verify this by signing in as David through the AWS access portal.
Figure 11: Screenshot of the settings summary in Identity Center.
Navigate to the dashboard in IAM Identity Center and go to the Settings summary, then choose the AWS access portal URL.
Figure 12: Screenshot of David signing into the console via the Identity Center dashboard URL.
Sign in as the user David with the one-time password you received earlier when creating David.
Figure 13: Second screenshot of David signing into the console through the Identity Center dashboard URL.
Open the Amazon S3 console.
Search for the bucket you created earlier.
Figure 14: Screenshot of my-new-company-123456789 bucket in the AWS console.
Navigate to David’s folder and verify that you have read and write access to the folder. If you navigate to other users’ folders, you’ll find that you don’t have access to the objects inside their folders.
David’s policy consists of four blocks; let’s look at each individually.
Before you begin identifying the specific folders David can have access to, you must give him two permissions that are required for Amazon S3 console access: ListAllMyBuckets and GetBucketLocation.
The ListAllMyBuckets action grants David permission to list all the buckets in the AWS account, which is required for navigating to buckets in the Amazon S3 console (and as an aside, you currently can’t selectively filter out certain buckets, so users must have permission to list all buckets for console access). The console also does a GetBucketLocation call when users initially navigate to the Amazon S3 console, which is why David also requires permission for that action. Without these two actions, David will get an access denied error in the console.
Block 2: Allow listing objects in root and home folders
Although David should have access to only his home folder, he requires additional permissions so that he can navigate to his folder in the Amazon S3 console. David needs permission to list objects at the root level of the my-new-company-123456789 bucket and to the home/ folder. The following policy grants these permissions to David:
Without the ListBucket permission, David can’t navigate to his folder because he won’t have permissions to view the contents of the root and home folders. When David tries to use the console to view the contents of the my-new-company-123456789 bucket, the console will return an access denied error. Although this policy grants David permission to list all objects in the root and home folders, he won’t be able to view the contents of any files or folders except his own (you specify these permissions in the next block).
This block includes conditions, which let you limit under what conditions a request to AWS is valid. In this case, David can list objects in the my-new-company-123456789 bucket only when he requests objects without a prefix (objects at the root level) and objects with the home/ prefix (objects in the home folder). If David tries to navigate to other folders, such as confidential/, David is denied access. Additionally, David needs permissions to list prefix home/David to be able to use the search functionality of the console instead of scrolling down the list of users’ folders.
To set these root and home folder permissions, I used two conditions: s3:prefix and s3:delimiter. The s3:prefix condition specifies the folders that David has ListBucket permissions for. For example, David can list the following files and folders in the my-new-company-123456789 bucket:
But David cannot list files or subfolders in the confidential/, home/Adele, or home/Bob folders.
Although the s3:delimiter condition isn’t required for console access, it’s still a good practice to include it in case David makes requests by using the API. As previously noted, the delimiter is a character—such as a slash (/)—that identifies the folder that an object is in. The delimiter is useful when you want to list objects as if they were in a file system. For example, let’s assume the my-new-company-123456789 bucket stored thousands of objects. If David includes the delimiter in his requests, he can limit the number of returned objects to just the names of files and subfolders in the folder he specified. Without the delimiter, in addition to every file in the folder he specified, David would get a list of all files in any subfolders.
Block 3: Allow listing objects in David’s folder
In addition to the root and home folders, David requires access to all objects in the home/David/ folder and any subfolders that he might create. Here’s a policy that allows this:
In the condition above, you use a StringLike expression in combination with the asterisk (*) to represent an object in David’s folder, where the asterisk acts as a wildcard. That way, David can list files and folders in his folder (home/David/). You couldn’t include this condition in the previous block (AllowRootAndHomeListingOfCompanyBucket) because it used the StringEquals expression, which would interpret the asterisk (*) as an asterisk, not as a wildcard.
In the next section, the AllowAllS3ActionsInUserFolder block, you’ll see that the Resource element specifies my-new-company/home/David/*, which looks like the condition that I specified in this section. You might think that you can similarly use the Resource element to specify David’s folder in this block. However, the ListBucket action is a bucket-level operation, meaning the Resource element for the ListBucket action applies only to bucket names and doesn’t take folder names into account. So, to limit actions at the object level (files and folders), you must use conditions.
Block 4: Allow all Amazon S3 actions in David’s folder
Finally, you specify David’s actions (such as read, write, and delete permissions) and limit them to just his home folder, as shown in the following policy:
For the Action element, you specified s3:*, which means David has permission to do all Amazon S3 actions. In the Resource element, you specified David’s folder with an asterisk (*) (a wildcard) so that David can perform actions on the folder and inside the folder. For example, David has permission to change his folder’s storage class. David also has permission to upload files, delete files, and create subfolders in his folder (perform actions in the folder).
An easier way to manage policies with policy variables
In David’s folder-level policy you specified David’s home folder. If you wanted a similar policy for users like Bob and Adele, you’d have to create separate policies that specify their home folders. Instead of creating individual policies for each IAM Identity Center user, you can use policy variables and create a single policy that applies to multiple users (a group policy). Policy variables act as placeholders. When you make a request to a service in AWS, the placeholder is replaced by a value from the request when the policy is evaluated.
For example, you can use the previous policy and replace David’s user name with a variable that uses the requester’s user name through attributes and PrincipalTag as shown in the following policy (copy this policy to use in the procedure that follows):
To implement this policy with variables, begin by opening the IAM Identity Center console using the main AWS admin account (ensuring you’re not signed in as David).
Select Settings on the left-hand side, then select the Attributes for access control tab.
Figure 15: Screenshot of Settings inside Identity Center.
Create a new attribute for access control, entering userName as the Key and ${path:userName} as the Value, then choose Save changes. This will add a session tag to your Identity Center user and allow you to use that tag in an IAM policy.
Figure 16: Screenshot of managing attributes inside Identity Center settings.
To edit David’s permissions, go back to the IAM Identity Center console and select Permission sets.
Figure 17: Screenshot of permission sets inside Identity Center with Davids-Permissions selected.
Select David’s permission set that you created previously.
Select Inline policy and then choose Edit to update David’s policy by replacing it with the modified policy that you copied at the beginning of this section, which will resolve to David’s username.
Figure 18: Screenshot of David’s policy inside his permission set inside Identity Center.
You can validate that this is set up correctly by signing in to David’s user through the Identity Center dashboard as you did before and verifying you have access to the David folder and not the Bob or Adele folder.
Figure 19: Screenshot of David’s S3 folder with access to a .jpg file inside.
Whenever a user makes a request to AWS, the variable is replaced by the user name of whoever made the request. For example, when David makes a request, ${aws:PrincipalTag/userName} resolves to David; when Adele makes the request, ${aws:PrincipalTag/userName} resolves to Adele.
It’s important to note that, if this is the route you use to grant access, you must control and limit who can set this username tag on an IAM principal. Anyone who can set this tag can effectively read/write to any of these bucket prefixes. It’s important that you limit access and protect the bucket prefixes and who can set the tags. For more information, see What is ABAC for AWS, and the Attribute-based access control User Guide.
Conclusion
By using Amazon S3 folders, you can follow the principle of least privilege and verify that the right users have access to what they need, and only to what they need.
See the following example policy that only allows API access to the buckets, and only allows for adding, deleting, restoring, and listing objects inside the folders:
If you have feedback about this post, submit comments in the Comments section below. If you have questions about this post, contact AWS Support.
Want more AWS Security news? Follow us on Twitter.
The collective thoughts of the interwebz
Manage Consent
To provide the best experiences, we use technologies like cookies to store and/or access device information. Consenting to these technologies will allow us to process data such as browsing behavior or unique IDs on this site. Not consenting or withdrawing consent, may adversely affect certain features and functions.
Functional
Always active
The technical storage or access is strictly necessary for the legitimate purpose of enabling the use of a specific service explicitly requested by the subscriber or user, or for the sole purpose of carrying out the transmission of a communication over an electronic communications network.
Preferences
The technical storage or access is necessary for the legitimate purpose of storing preferences that are not requested by the subscriber or user.
Statistics
The technical storage or access that is used exclusively for statistical purposes.The technical storage or access that is used exclusively for anonymous statistical purposes. Without a subpoena, voluntary compliance on the part of your Internet Service Provider, or additional records from a third party, information stored or retrieved for this purpose alone cannot usually be used to identify you.
Marketing
The technical storage or access is required to create user profiles to send advertising, or to track the user on a website or across several websites for similar marketing purposes.