How to automate the review and validation of permissions for users and groups in AWS IAM Identity Center

Post Syndicated from Yee Fei Ooi original https://aws.amazon.com/blogs/security/how-to-automate-the-review-and-validation-of-permissions-for-users-and-groups-in-aws-iam-identity-center/

AWS IAM Identity Center (successor to AWS Single Sign-On) is widely used by organizations to centrally manage federated access to their Amazon Web Services (AWS) environment. As organizations grow, it’s crucial that they maintain control of access to their environment and conduct regular reviews of existing granted permissions to maintain a good security posture. With continuous movement of users among projects and teams within an organization, there are constant updates in groups and permission sets. Given the frequency of updates, it’s important for organizations to maintain the integrity of the identity entities and promote visibility into their associated permissions within IAM Identity Center.

Performing an audit of permissions assignment through the IAM Identity Center Management Console can be an arduous and time-consuming task, especially for customers managing a significant number of AWS accounts. This blog post addresses the following concerns faced by security administrators:

  • How to maintain control over permissions and efficiently conduct thorough audits.
  • How to regularly review granted permissions to uphold the principle of least privilege.

In this blog post, we show you how to automate your IAM Identity Center users and groups permission review process with AWS SDK and AWS serverless services. The solution also includes how to schedule the review process based on preferred frequency and generating a business-specific access and permission review report.

By using AWS serverless services and AWS SDK, you can create an automated workflow to retrieve the latest permission sets of your identities in IAM Identity Center and extract them as a report. Amazon EventBridge scheduling allows you to set customized schedules to launch the automation process. AWS Lambda functions are used in data retrieval, data transformation, and report generation, and Amazon DynamoDB tables are used for storing raw unstructured data.

We show you how to build an automated solution using AWS SDK, AWS Step Functions, Lambda, DynamoDB, EventBridge, Amazon Simple Storage Service (Amazon S3), and Amazon Simple Notification Service (Amazon SNS) to review the IAM Identity Center instance that you specify. The review includes retrieving attached permission policies (inline, AWS managed, and customer managed) based on the assigned identity.

Note: This solution will incur costs based on the AWS services used.

Prerequisites

In your own AWS environment, make sure that you have the following:

  • An IAM Identity Center instance set up in the account
  • IAM Identity Center instance metadata that you want to perform the analysis on:
    • The IAM Identity Center instance identityStoreId – example: d-xxxxxxxxxx
    • The IAM Identity Center instance instanceArn – example: arn:aws:sso:::instance/ssoins-xxxxxxxxxx
  • Access and permission to deploy the related AWS services mentioned previously in AWS CloudFormation.

    Note: This solution is expected to deploy in the account where your IAM Identity Center instance is being set up. If you want to deploy in other accounts, you need to establish cross-account access for the IAM roles of the relevant services mentioned previously.

  • AWS SAM CLI installed. You will deploy the solution using AWS Serverless Application Model (AWS SAM). To learn more about how AWS SAM works, see the AWS Serverless Application Model (AWS SAM) specification.

Solution overview

In this section, we discuss the steps to set up solution. We provide a CloudFormation template that you can use to set up the required services and Lambda functions. Figure 1 illustrates the architecture of the solution.

Figure 1: Architecture of the solution

Figure 1: Architecture of the solution

The solution is deployed using AWS SAM, which is an open-sourced framework for building serverless applications. AWS SAM helps to organize related components and operate on a single stack. When used together with the SAM CLI, it’s a useful tool for developing, testing, and building serverless applications on AWS.

To generate the report, the solution uses the following steps:

  • The EventBridge Scheduler is configured to launch the Step Functions based on the frequency of the cron job stated. The user can also manually launch the review as needed.
  • After the Step Functions are launched, the dataExtractionFunction Lambda function retrieves data from IAM Identity Center and stores it in two separate DynamoDB tables, fullPermissionSetsWithGroupTable and userWithGroupTable.
  • Step Functions will then launch the dataTransformLoadFunction Lambda function, which retrieves the data from both DynamoDB tables to perform data transformation for report generation.
  • The permission review report is stored in an S3 bucket and notification of completion is sent to the stakeholders.

Deploy the solution

  1. Make sure that you have AWS SAM CLI installed.
  2. Clone the GitHub repository. Open a CLI window and run
    git clone https://github.com/aws-samples/aws-iam-identity-center-permission-policies-analyzer.git
  3. Navigate to root directory of the GitHub repository by running cd aws-iam-identity-center-permission-policies-analyzer
  4. Run sam deploy ‐‐guided and follow the step-by-step instructions to indicate the deployment details such as the desired CloudFormation stack name, AWS Region and other details as shown in Figure 2.
     
    Figure 2: Configure SAM deploy

    Figure 2: Configure SAM deploy

  5. As shown in Figure 2, you receive confirmation that the required resources have been created. AWS SAM creates a default S3 bucket to store the necessary resources and then proceeds to the deployment prompt. Enter y to deploy and wait for deployment to complete.
  6. After deployment is complete, you should see the following output: Successfully created/updated stack – {StackName} in {AWSRegion}. You can review the resources and stack in your CloudFormation console as shown in Figure 3.
     
    Figure 3: CloudFormation console view of deployed stack

    Figure 3: CloudFormation console view of deployed stack

    The CloudFormation template specifies the cron schedule on the first day of each month at 0800 UTC +8 by default. You can update the schedule based on your preference by following steps 7 and 8.

  7. Open the EventBridge console. In the navigation pane, under Scheduler, choose Schedules. Check the box next to {StackName}-monthlySchedule-{RandomID} and choose Edit.
     
    Figure 4: EventBridge schedule console

    Figure 4: EventBridge schedule console

  8. At Step 1, under the Schedule pattern segment, enter your preferred scheduling. To learn about the different types of EventBridge scheduling, see Schedule types on EventBridge Scheduler. For this example, you use a recurring type of schedule using cron expression. Update to your preferred schedule and time zone and choose Next.
     
    Figure 5: EventBridge Schedule edit console Step 1 – Specify schedule detail

    Figure 5: EventBridge Schedule edit console Step 1 – Specify schedule detail

  9. Check the email address you entered during the deployment stage of this solution for an email sent by [email protected], similar to what you see in Figure 6. Follow the steps in the email to confirm the Amazon SNS topic subscription.
     
    Figure 6: Example email from Amazon SNS for subscription confirmation

    Figure 6: Example email from Amazon SNS for subscription confirmation

Manually launch the review

After you’ve updated the schedule, the review process runs on the specified timing and frequency. You can manually launch the review immediately after you’ve deployed the solution, or at a time outside of the schedule on an as-needed basis.

  1. To manually launch the review, open the Step Functions console,
  2. Select the state machine monthlyUserPermissionAssessment-{randomID} and choose Start execution.
     
    Figure 7: Start execution for monthlyUserPermissionAssessment state machine

    Figure 7: Start execution for monthlyUserPermissionAssessment state machine

  3. Enter the following event pattern and choose Start execution.
    {
      "identityStoreId": "d-xxxxxxxxxx",
      "instanceArn": "arn:aws:sso:::instance/ssoins-xxxxxxxxxx",
      "ssoDeployedRegion": "YOUR_SSO_DEPLOYED_REGION" 
    }

    Note: The format and keyword format are important to run the Step Functions successfully.

Figure 8: Example input to start state machine execution

Figure 8: Example input to start state machine execution

When the process starts, the execution page opens and you can follow the process. The flow turns green when each step has been completed successfully. You can also review Events and check the Lambda functions or logs if you need to troubleshoot or refer to the details.

Figure 9: State machine successful execution example

Figure 9: State machine successful execution example

Notification from each successful review

After each successful execution, you should receive an email notification at the email you specified in the Amazon SNS topic. You can then retrieve the report from the S3 bucket with the bucket name {StackName}-monthlyre-{AccountID}. Your report is stored according to the object key name specified in the email. An example of the email notification is shown in Figure 10.

Figure 10: Example email notification

Figure 10: Example email notification

You can download the report in CSV format from the S3 bucket. The headers of the report are:

User: Username
PrincipalId: An identifier for an object in IAM Identity Center, such as a user or group
PrincipalType: USER or GROUP
GroupName: Group’s display name value (if PrincipalType is GROUP)
AccountIdAssignment: Identifier of the AWS account assigned with the specified permission set
PermissionSetARN: ARN of the permission set
PermissionSetName: Name of the permission set
Inline Policy: Inline policy that is attached to the permission set
Customer Managed Policy: Specifies the names and paths of the customer managed policies that you have attached to your permission set
AWS Managed Policy: Details of the AWS managed policy
Permission Boundary: Permission boundary details (Customer Managed Policy Reference and/or AWS managed policy ARN)

From the report, you can determine whether a user is assigned to an account individually or as part of a group, along with the corresponding permission sets. The report also includes details on inline policy, AWS managed policy, customer managed policy, and the permission boundaries attached to the permission set. Inline policies and AWS managed policies are presented in JSON format. However, for customer managed policies and permission boundaries, to keep the solution simple, the generated report provides only basic information on the policies that you’ve attached to the permission set. You can log in to the respective accounts to view the policies in full JSON format through the AWS IAM console.

[Optional] Customize the user notification email

If you want to customize the email notification subject and content, you can do so by editing the Lambda function {StackName}-dataTransformLoadFunction-{RandomID}. Scroll down to the bottom of the source code and edit the sns_message and Subject accordingly.

Figure 11: Customizing the notification email in dataTransformLoadFunction source code

Figure 11: Customizing the notification email in dataTransformLoadFunction source code

Clean up the resources

To clean up the resources that you created for this example:

  1. Empty your S3 bucket. Open the Amazon S3 console, search for the bucket name and choose Empty. Follow the instructions on screen to empty it.
  2. Delete the CloudFormation stack by either:
    1. Using the CloudFormation console to delete the stack, or
    2. Using the AWS SAM CLI to run sam delete in your terminal. Follow the instructions and enter y when prompted to delete the stack.

Conclusion

In this post, you learned how to deploy a solution that simplifies the review and analysis of IAM permissions granted to IAM Identity Center with an automated flow. You also learned about customization that you can set up to fit your team’s needs and preferences.

If you have feedback about this post, submit comments in the Comments section. If you have questions about this post, start a new thread on the AWS Security, Identity, & Compliance re:Post or contact AWS Support.

Want more AWS Security news? Follow us on Twitter.
Yee Fei Ooi

Yee Fei Ooi

Yee Fei is a Solutions Architect supporting independent software vendor (ISV) customers in Singapore and is part of the Containers TFC. She enjoys helping her customers to grow their businesses and build solutions that automate, innovate, and improve efficiency.

ZhiWei Huang

Edmund Yeo

Edmund is a Security Solutions Architect who helps customers build confidently and securely on AWS. He shares with customers his expertise in AWS security and advocates to build with security best practices in mind. He brings a combination of perspective and experience to help small and medium businesses in ASEAN to improve their security posture.

ZhiWei Huang

ZhiWei Huang

ZhiWei is a Financial Services Solutions Architect at AWS. He works with FSI customers across the ASEAN region, providing guidance for establishing robust security controls and networking foundations as customers build on and scale with AWS. Outside of work, he finds joy in travelling the world and spending quality time with his family.

Curbing Connection Churn in Zuul

Post Syndicated from Netflix Technology Blog original https://netflixtechblog.com/curbing-connection-churn-in-zuul-2feb273a3598

By Arthur Gonigberg, Argha C

Plaintext Past

When Zuul was designed and developed, there was an inherent assumption that connections were effectively free, given we weren’t using mutual TLS (mTLS). It’s built on top of Netty, using event loops for non-blocking execution of requests, one loop per core. To reduce contention among event loops, we created connection pools for each, keeping them completely independent. The result is that the entire request-response cycle happens on the same thread, significantly reducing context switching.

There is also a significant downside. It means that if each event loop has a connection pool that connects to every origin (our name for backend) server, there would be a multiplication of event loops by servers by Zuul instances. For example, a 16-core box connecting to an 800-server origin would have 12,800 connections. If the Zuul cluster has 100 instances, that’s 1,280,000 connections. That’s a significant amount and certainly more than is necessary relative to the traffic on most clusters.

As streaming has grown over the years, these numbers multiplied with bigger Zuul and origin clusters. More acutely, if a traffic spike occurs and Zuul instances scale up, it exponentially increases connections open to origins. Although this has been a known issue for a long time, it has never been a critical pain point until we moved large streaming applications to mTLS and our Envoy-based service mesh.

Fixing the Flows

The first step in improving connection overhead was implementing HTTP/2 (H2) multiplexing to the origins. Multiplexing allows the reuse of existing connections by creating multiple streams per connection, each able to send a request. Rather than requiring a connection for every request, we could reuse the same connection for many simultaneous requests. The more we reuse connections, the less overhead we have in establishing mTLS sessions with roundtrips, handshaking, and so on.

Although Zuul has had H2 proxying for some time, it never supported multiplexing. It effectively treated H2 connections as HTTP/1 (H1). For backward compatibility with existing H1 functionality, we modified the H2 connection bootstrap to create a stream and immediately release the connection back into the pool. Future requests will then be able to reuse the existing connection without creating a new one. Ideally, the connections to each origin server should converge towards 1 per event loop. It seems like a minor change, but it had to be seamlessly integrated into our existing metrics and connection bookkeeping.

The standard way to initiate H2 connections is, over TLS, via an upgrade with ALPN (Application-Layer Protocol Negotiation). ALPN allows us to gracefully downgrade back to H1 if the origin doesn’t support H2, so we can broadly enable it without impacting customers. Service mesh being available on many services made testing and rolling out this feature very easy because it enables ALPN by default. It meant that no work was required by service owners who were already on service mesh and mTLS.

Sadly, our plan hit a snag when we rolled out multiplexing. Although the feature was stable and functionally there was no impact, we didn’t get a reduction in overall connections. Because some origin clusters were so large, and we were connecting to them from all event loops, there wasn’t enough re-use of existing connections to trigger multiplexing. Even though we were now capable of multiplexing, we weren’t utilizing it.

Divide and Conquer

H2 multiplexing will improve connection spikes under load when there is a large demand for all the existing connections, but it didn’t help in steady-state. Partitioning the whole origin into subsets would allow us to reduce total connection counts while leveraging multiplexing to maintain existing throughput and headroom.

We had discussed subsetting many times over the years, but there was concern about disrupting load balancing with the algorithms available. An even distribution of traffic to origins is critical for accurate canary analysis and preventing hot-spotting of traffic on origin instances.

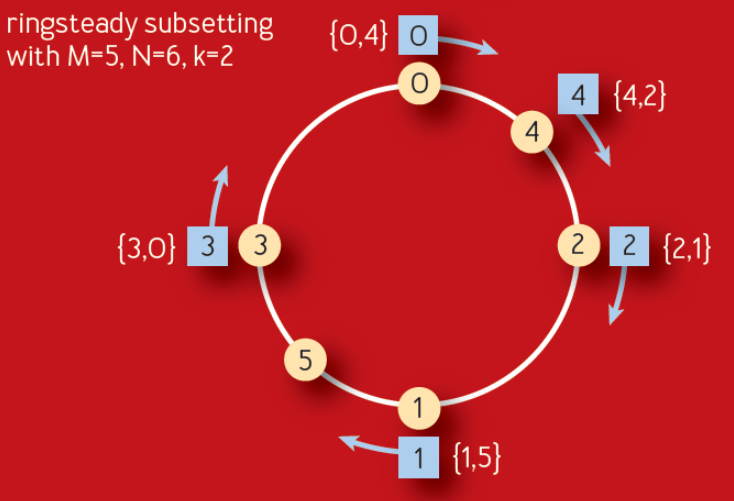
Subsetting was also top of mind after reading a recent ACM paper published by Google. It describes an improvement on their long-standing Deterministic Subsetting algorithm that they’ve used for many years. The Ringsteady algorithm (figure below) creates an evenly distributed ring of servers (yellow nodes) and then walks the ring to allocate them to each front-end task (blue nodes).

The figure above is from Google’s ACM paper

The algorithm relies on the idea of low-discrepancy numeric sequences to create a naturally balanced distribution ring that is more consistent than one built on a randomness-based consistent hash. The particular sequence used is a binary variant of the Van der Corput sequence. As long as the sequence of added servers is monotonically incrementing, for each additional server, the distribution will be evenly balanced between 0–1. Below is an example of what the binary Van der Corput sequence looks like.

Another big benefit of this distribution is that it provides a consistent expansion of the ring as servers are removed and added over time, evenly spreading new nodes among the subsets. This results in the stability of subsets and no cascading churn based on origin changes over time. Each node added or removed will only affect one subset, and new nodes will be added to a different subset every time.

Here’s a more concrete demonstration of the sequence above, in decimal form, with each number between 0–1 assigned to 4 subsets. In this example, each subset has 0.25 of that range depicted with its own color.

You can see that each new node added is balanced across subsets extremely well. If 50 nodes are added quickly, they will get distributed just as evenly. Similarly, if a large number of nodes are removed, it will affect all subsets equally.

The real killer feature, though, is that if a node is removed or added, it doesn’t require all the subsets to be shuffled and recomputed. Every single change will generally only create or remove one connection. This will hold for bigger changes, too, reducing almost all churn in the subsets.

Zuul’s Take

Our approach to implement this in Zuul was to integrate with Eureka service discovery changes and feed them into a distribution ring, based on the ideas discussed above. When new origins register in Zuul, we load their instances and create a new ring, and from then on, manage it with incremental deltas. We also take the additional step of shuffling the order of nodes before adding them to the ring. This helps prevent accidental hot spotting or overlap among Zuul instances.

The quirk in any load balancing algorithm from Google is that they do their load balancing centrally. Their centralized service creates subsets and load balances across their entire fleet, with a global view of the world. To use this algorithm, the key insight was to apply it to the event loops rather than the instances themselves. This allows us to continue having decentralized, client-side load balancing while also having the benefits of accurate subsetting. Although Zuul continues connecting to all origin servers, each event loop’s connection pool only gets a small subset of the whole. We end up with a singular, global view of the distribution that we can control on each instance — and a single sequence number that we can increment for each origin’s ring.

When a request comes in, Netty assigns it to an event loop, and it remains there for the duration of the request-response lifecycle. After running the inbound filters, we determine the destination and load the connection pool for this event loop. This will pull from a mapping of loop-to-subset, giving us the limited set of nodes we’re looking for. We then load balance using a modified choice-of-2, as discussed before. If this sounds familiar, it’s because there are no fundamental changes to how Zuul works. The only difference is that we provide a loop-bound subset of nodes to the load balancer as a starting point for its decision.

Another insight we had was that we needed to replicate the number of subsets among the event loops. This allows us to maintain low connection counts for large and small origins. At the same time, having a reasonable subset size ensures we can continue providing good balance and resiliency features for the origin. Most origins require this because they are not big enough to create enough instances in each subset.

However, we also don’t want to change this replication factor too often because it would cause a reshuffling of the entire ring and introduce a lot of churn. After a lot of iteration, we ended up implementing this by starting with an “ideal” subset size. We achieve this by computing the subset size that would achieve the ideal replication factor for a given cardinality of origin nodes. We can scale the replication factor across origins by growing our subsets until the desired subset size is achieved, especially as they scale up or down based on traffic patterns. Finally, we work backward to divide the ring into even slices based on the computed subset size.

Our ideal subset side is roughly 25–50 nodes, so an origin with 400 nodes will have 8 subsets of 50 nodes. On a 32-core instance, we’ll have a replication factor of 4. However, that also means that between 200 and 400 nodes, we’re not shuffling the subsets at all. An example of this subset recomputation is in the rollout graphs below.

An interesting challenge here was to satisfy the dual constraints of origin nodes with a range of cardinality, and the number of event loops that hold the subsets. Our goal is to scale the subsets as we run on instances with higher event loops, with a sub-linear increase in overall connections, and sufficient replication for availability guarantees. Scaling the replication factor elastically described above helped us achieve this successfully.

Subsetting Success

The results were outstanding. We saw improvements across all key metrics on Zuul, but most importantly, there was a significant reduction in total connection counts and churn.

Total Connections

This graph (as well as the ones below) shows a week’s worth of data, with the typical diurnal cycle of Netflix usage. Each of the 3 colors represents our deployment regions in AWS, and the blue vertical line shows when we turned on the feature.

Total connections at peak were significantly reduced in all 3 regions by a factor of 10x. This is a huge improvement, and it makes sense if you dig into how subsetting works. For example, a machine running 16 event loops could have 8 subsets — each subset is on 2 event loops. That means we’re dividing an origin by 8, hence an 8x improvement. As to why peak improvement goes up to 10x, it’s probably related to reduced churn (below).

Churn

This graph is a good proxy for churn. It shows how many TCP connections Zuul is opening per second. You can see the before and after very clearly. Looking at the peak-to-peak improvement, there is roughly an 8x improvement.

The decrease in churn is a testament to the stability of the subsets, even as origins scale up, down, and redeploy over time.

Looking specifically at connections created in the pool, the reduction is even more impressive:

The peak-to-peak reduction is massive and clearly shows how stable this distribution is. Although hard to see on the graph, the reduction went from thousands per second at peak down to about 60. There is effectively no churn of connections, even at peak traffic.

Load Balancing

The key constraint to subsetting is ensuring that the load balance on the backends is still consistent and evenly distributed. You’ll notice all the RPS on origin nodes grouped tightly, as expected. The thicker lines represent the subset size and the total origin size.

Balance at deploy
Balance 12 hours after deploy

In the second graph, you’ll note that we recompute the subset size (blue line) because the origin (purple line) became large enough that we could get away with less replication in the subsets. In this case, we went from a subset size of 100 for 400 servers (a division of 4) to 50 (a division of 8).

System Metrics

Given the significant reduction in connections, we saw reduced CPU utilization (~4%), heap usage (~15%), and latency (~3%) on Zuul, as well.

Zuul canary metrics

Rolling it Out

As we rolled this feature out to our largest origins — streaming playback APIs — we saw the pattern above continue, but with scale, it became more impressive. On some Zuul shards, we saw a reduction of as much as 13 million connections at peak, with almost no churn.

Today the feature is rolled out widely. We’re serving the same amount of traffic but with tens of millions fewer connections. Despite the reduction of connections, there is no decrease in resiliency or load balancing. H2 multiplexing allows us to scale up requests separately from connections, and our subsetting algorithm ensures an even traffic balance.

Although challenging to get right, subsetting is a worthwhile investment.

Acknowledgments

We would also like to thank Peter Ward, Paul Wankadia, and Kavita Guliani at Google for developing this algorithm and publishing their work for the benefit of the industry.


Curbing Connection Churn in Zuul was originally published in Netflix TechBlog on Medium, where people are continuing the conversation by highlighting and responding to this story.

Join AWS Hybrid Cloud & Edge Day to Learn How to Deploy Your Applications in the Everywhere Cloud

Post Syndicated from Channy Yun original https://aws.amazon.com/blogs/aws/join-aws-hybrid-cloud-edge-day-to-learn-how-to-deploy-your-applications-in-the-everywhere-cloud/

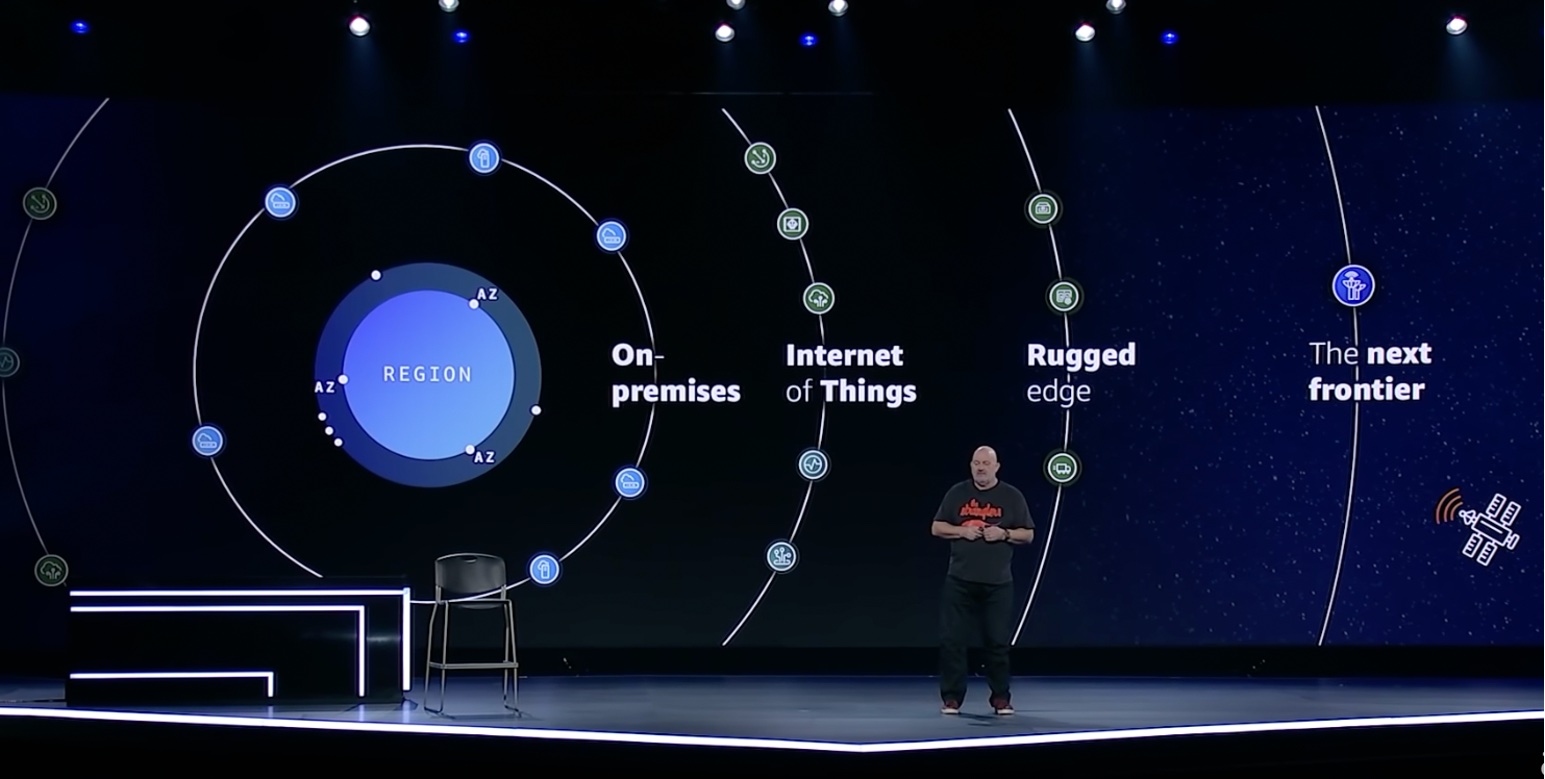
In his keynote of AWS re:Invent 2021, Dr. Werner Vogels shared the insight of how “the everywhere cloud” is bringing AWS to new locales through AWS hardware and services and spotlighted it as one of his tech predictions for 2022 and beyond in his blog post.

“What we will see in 2022, and even more so in the years to come, is the cloud accelerating beyond the traditional centralized infrastructure model and into unexpected environments where specialized technology is needed. The cloud will be in your car, your tea kettle, and your TV. The cloud will be in everything from trucks driving down the road, to the ships and planes that transport goods. The cloud will be globally distributed, and connected to almost any digital device or system on Earth, and even in space.”

AWS provides a truly consistent and secure experience to build and run applications across the continuum of environments where customers operate—from the cloud to large metro areas, 5G networks, on-premises locations, and to mobile and Internet of Things (IoT) devices.

To learn more, join us for AWS Hybrid Cloud & Edge Day, a free-to-attend one-day virtual event on August 30, 2023, starting at 10:00 AM PDT (1:00 PM ET). We will stream the event simultaneously across multiple platforms, including LinkedIn Live, Twitter, YouTube, and Twitch.

You can hear from AWS leaders and industry analysts on the latest hybrid cloud and edge computing trends and emerging technologies and learn best practices for using AWS hybrid cloud and edge services across the cloud continuum. Also, learn from our customers on data strategies and key use cases and gain a deeper understanding of AWS hybrid cloud and edge services and new features and benefits.

Here are some of the highlights you can expect from this event:

Leadership session – To kick off the day, we have a leadership session featuring Jan Hofmeyr, vice president of EC2 Edge, sharing insights into how customers are building high-performance, intelligent applications with recently announced AWS hybrid cloud, edge, and IoT capabilities. Elias Khnaser, chief of research at EK Media Group, will join Jan to discuss the global, business, and economic trends impacting hybrid cloud and edge computing and discuss the customer requirements and use cases.

Cloud-closer sessions – We’ll discuss how AWS is bringing the cloud closer to metro areas and telco networks. Services such as AWS Local Zones, AWS Outposts family, and AWS Wavelength bring the power of cloud compute and storage to the edge of 5G networks, unlocking more performant mobile experiences. We’ll highlight new and innovative use cases, including Norton LifeLock, Electronic Arts, and Epic Games, who have taken advantage of the operational consistency between AWS Regions and the edge. Also you can learn how to deploy in hybrid cloud scenarios in on-premises locations, such as examples from MindBody and ElToro through Onica, and more customer cases.

On-premises sessions – Learn about our options to bring AWS Cloud to your data centers and on-premises locations for a truly consistent experience across your environments. We will review real-world examples of how AWS hybrid and edge services enable local processing of data for faster response time and faster decision-making. Also, we will share how Toyota takes advantage of hybrid options from Amazon ECS and Amazon EKS to use familiar management tools across your environments to successfully modernize your applications. You can learn how to meet your on-premises regulatory requirements and real-world scenarios effectively in critical aspects of digital sovereignty and data residency.

Rugged edge sessions – You will learn about AWS services to support rugged, mobile, and disconnected edge, such as AWS Snow Family to enable organizations to deploy compute workloads in locations with denied, disrupted, intermittent, and limited (DDIL) connectivity. Learn how DDR.Live deployed their own 4G/LTE or 5G private network using AWS Private 5G for live events in the place with limited wireless connection. We will discuss the top use cases, such as deploying a pre-trained object detection model and architecting applications at the edge. Finally, we will discuss the benefits and requirements of operating at the edge with Holger Mueller, vice president and principal analyst, Constellation Research, Inc.

IoT panel discussion – We will discuss from panelist of AWS IoT customers and industry experts on their innovation journey. Join us to see how EuroTech brought to market a set of devices and services that improve operational efficiencies with connectivity at the edge. You’ll also hear how Wallbox, an Electric Vehicle charging company, reduced their operational costs and scaled efficiently with AWS IoT services.

Multicloud sessions – AWS has the tools to help you run and support your multicloud operations in the areas of governance, ops management, observability, and more. We will discuss common challenges in hybrid and multicloud environments and how AWS helps you manage, operate, and automate your processes. We’ll also talk about how Rackspace used AWS Systems Manager for instance patching across hybrid and multicloud environments, automating their infrastructure management across cloud providers.

This event is for any customer and builder who is eager to learn more about hybrid cloud, edge computing, IoT, networking, content delivery, and 5G. We’ll cover how you can support applications that need to remain on premises or at the edge due to low latency, local data processing, or data residency requirements.

To learn more details, see the event schedule, and register for AWS Hybrid Cloud & Edge Day, go to the event page.

— Channy

Implement a serverless CDC process with Apache Iceberg using Amazon DynamoDB and Amazon Athena

Post Syndicated from Vijay Velpula original https://aws.amazon.com/blogs/big-data/implement-a-serverless-cdc-process-with-apache-iceberg-using-amazon-dynamodb-and-amazon-athena/

Apache Iceberg is an open table format for very large analytic datasets. Iceberg manages large collections of files as tables, and it supports modern analytical data lake operations such as record-level insert, update, delete, and time travel queries. The Iceberg specification allows seamless table evolution such as schema and partition evolution, and its design is optimized for usage on Amazon Simple Storage Service (Amazon S3). Iceberg also helps guarantee data correctness under concurrent write scenarios.

Most businesses store their critical data in a data lake, where you can bring data from various sources to a centralized storage. Change Data Capture (CDC) in the context of a data lake refers to the process of capturing and propagating changes made to source data. Source systems often lack the capability to publish data that is modified or changed. This requires data pipelines to consume full load datasets every day, increasing the data processing duration and also the storage cost. If the source is tabular format, then there are mechanisms to identify the data changes easily. However, the complexity increases if the data is in semi-structured format and propagating changes made to source data into the data lake in near-real-time.

This post presents a solution to handle incoming semi-structured datasets from source systems and effectively determine changed records and load them into Iceberg tables. With this approach, we will not only use Athena to query data source files in Amazon S3, but also achieve ACID compliance.

Solution overview

We demonstrate this solution with an end-to-end serverless CDC process. We use a sample JSON file as input to Amazon DynamoDB. We identify changed records by utilizing Amazon DynamoDB Streams and AWS Lambda to update the data lake with changed records. We then utilize an Iceberg table to demonstrate CDC functionality for a sample employee dataset. This data represents employee details such as name, address, date joined, and other fields.

The architecture is implemented as follows:

  1. Source systems ingest a semi-structured (JSON) dataset into a DynamoDB table.
  2. The DynamoDB table stores the semi-structured dataset, and these tables have DynamoDB Streams enabled. DynamoDB Streams helps identify if the incoming data is new, modified, or deleted based on the keys defined and delivers the ordered messages to a Lambda function.
  3. For every stream, the Lambda function parses the stream and builds the dynamic DML SQL statements.
  4. The constructed DML SQL statements are run on the corresponding Iceberg tables to reflect the changes.

The following diagram illustrates this workflow.

Prerequisites

Before you get started, make sure you have the following prerequisites:

Deploy the solution

For this solution, we provide a CloudFormation template that sets up the services included in the architecture, to enable repeatable deployments.

Note : – Deploying the CloudFormation stack in your account incurs AWS usage charges.

To deploy the solution, complete the following steps:

  1. Choose Launch Stack to launch the CloudFormation stack.
  2. Enter a stack name.
  3. Select I acknowledge that AWS CloudFormation might create IAM resources with custom names.
  4. Choose Create stack.

After the CloudFormation stack deployment is complete, navigate to AWS CloudFormation console to note the following resources on the Outputs tab:

  • Data lake S3 bucket – iceberg-cdc-xxxxx-us-east-1-xxxxx
  • AthenaWorkGroupName – AthenaWorkgroup-xxxxxx
  • DataGeneratorLambdaFunction – UserRecordsFunction-xxxxxx
  • DynamoDBTableName – users_xxxxxx
  • LambdaDMLFunction – IcebergUpsertFunction-xxxxxx
  • AthenaIcebergTableName – users_xxxxxx

Generate sample employee data and load into the DynamoDB table using Lambda

To test the solution, trigger the UserRecordsFunction-XXXXX function by creating a test event which loads sample data into DynamoDB table.

  1. On the Lambda console, open the Lambda function with the name UserRecordsFunction-XXXXX.
  2. On the Code tab, choose Test, then Configure test event.
  3. Configure a test event with the default hello-world template event JSON.
  4. Provide an event name without any changes to the template and save the test event.
  5. On the Test tab, choose Test to trigger the SampleEvent test event. This will invoke the data generator Lambda function to load data into the users_xxxxxx DynamoDB table. When the test event is complete, you should notice a success notification as shown in the following screenshot.
  6. On the DynamoDB console, navigate to the users_XXXXXX table and choose Explore table items to verify the data loaded into the table.

The data loads performed on the DynamoDB table will be cascaded to the Athena table with the help of the IcebergUpsertFunction-xxxxx Lambda function deployed by CloudFormation template.

In the following sections, we simulate and validate various scenarios to demonstrate Iceberg capabilities, including DML operations, time travel, and optimizations.

Simulate the scenarios and validate CDC functionality in Athena

After the first run of the data generator Lambda function, navigate to the Athena query editor, choose the AthenaWorkgroup-XXXXX workgroup, and preview the user_XXXXXX Iceberg table to query the records.

With the data inserted into the DynamoDB table, all the data change activities such as inserts, updates, and deletes are captured in DynamoDB Streams. DynamoDB Streams triggers IcebergUpsertFunction-xxxxx Lambda function which processes the events in the order they are received. IcebergUpsertFunction-xxxxx function, performs the following steps:

  • Receives the stream event
  • Parses the stream event based on the  DynamdoDB eventType (insert, update, or delete) and eventually generates an Athena DML SQL statement
  • Runs the SQL statement in Athena

Let’s deep dive in to the IcebergUpsertFunction-XXXX function code and how it handles various scenarios.

IcebergUpsertFunction-xxxxx function code

As indicated in the following Lambda function code block, the DynamoDB Streams event received by the function, categorizes events based on eventType—INSERT, MODIFY, or DELETE. Any other event raises InvalidEventException. MODIFY is considered an UPDATE event.

All the DML operations are run on the user_XXXXXX table in Athena. We fetch the metadata of the users_xxxxxx table from Athena. The following are a few important considerations regarding how the Lambda function handles Iceberg table metadata changes:

  • In this approach, target metadata takes precedence during DML operations.
  • Any columns that are missing in the target will be excluded in the DML command.
  • It’s imperative that the source and target metadata match. Incase new columns and attributes are added to source table than the current solution is configured to skip the new columns and attributes.
  • This solution can be enhanced further to cascade source system metadata changes to the target table in Athena.

The following is the Lambda function code:

def iceberg_upsert(event, database, tablename):
    response ={}
    logger.info(f'Started iceberg_upsert executing.')
    logger.info(f'Started parsing received event.')
    
    # Determine type of event
    resp=event
    eventName=resp['eventName']
    
    # call for athena function 
    athresp=retrieve_athena_table_metadata(database,tablename) 
    try:
        AthenTblMd=athresp['TableMetadata']['Columns']
    except Exception as e:
        logger.error(f"Athena Metadata does not have column information. Please check table {tablename} and database {database} ")
        raise(e)
    else: # else block for try/except
        logger.info(f"{AthenTblMd}")
        
    try:
        if eventName == "INSERT":
            sqlstmt=insert_stmt(resp,AthenTblMd,database,tablename)
            logger.info(sqlstmt)
            response=run_query(sqlstmt, database_name, athena_workgroup, output_location,wait_time)
        elif eventName == "MODIFY":
            sqlstmt=update_stmt(resp,AthenTblMd,database,tablename)
            logger.info(sqlstmt)
            response=run_query(sqlstmt, database_name, athena_workgroup, output_location,wait_time)
        elif eventName == "REMOVE":
            sqlstmt=del_stmt(resp,database,tablename)
            logger.info(sqlstmt)
            response=run_query(sqlstmt, database_name, athena_workgroup, output_location,wait_time)
        else:
            raise InvalidEventTypeException
        
    except InvalidEventTypeException:
        logger.warning(f'Event type should be INSERT/MODIFY/REMOVE. Received event type is : {eventName}.')
        logger.warning(f'Skipping applying grant/revoke permissions.')
    except Exception as e:
        logger.error("iceberg_upsert function failed with error")
        raise(e)
    else : # else block for try/except
        return response

The following code uses the Athena Boto3 client to fetch the table metadata:

def retrieve_athena_table_metadata(databaseName, tableName, catalogName=None):
    if catalogName is None:
        catalogName='AWSDATACATALOG' # default value 
    try:
        athenaTblMd=client.get_table_metadata(CatalogName=catalogName,DatabaseName=databaseName,TableName=tableName)
    except Exception as e:
        logger.error("Athena Table Metadata retrieval function Failed.Please check exception", e)
        raise(e) 
    else: # else block for try except
        return athenaTblMd

Insert operations

Now let’s see how insert operations are handled with the sample data generated in the DynamoDB table.

  1. On the DynamoDB console, navigate to the users_XXXXX table.
  2. Choose Create item.
  3. Enter a sample record with the following code:
    {
      "emp_no": {
         "N": "11"
      },
      "country": {
         "S": "USA"
      },
      "dateOfBirth": {
         "S": "1991-10-23"
      },
      "first_name": {
         "S": "Tom"
      },
      "isContractAthlete": {
         "BOOL": false
      },
      "job": {
         "S": "Sr Manager"
      },
      "last_name": {
         "S": "Carter"
      },
      "phone_number": {
         "S": "+1-226-333-789"
      },
      "sex": {
         "S": "male"
      },
      "ssn": {
         "S": "434-98-2345"
      }
    }
    

  4. Choose Create item to insert the new record into the DynamoDB table.

After the item is created in the DynamoDB table, a stream event is generated in DynamoDB Streams, which triggers the Lambda function. The function processes the event and generates an equivalent INSERT SQL statement to run on the Athena table. The following screenshot shows the INSERT SQL that was generated by the Lambda function on the Athena console in the Recent queries section.

The IcebergUpsertFunction-xxxxx Lambda code has modularized functions for each eventType. The following code highlights the function, which processes insert eventType streams:

def insert_stmt(insert_event_resp,AthenTblMd,database,tablename):
    resp=insert_event_resp
    
    Tablevalues=resp['dynamodb']['NewImage']
    Tblvalues={ k.lower():v for k,v in Tablevalues.items()} # converting key names to lowercase to prevent case-sensitive mismatches
    
    val_list=unpack_dict(Tblvalues,AthenTblMd)
    col_nm,val_for_col=[],[]
 
    for item in val_list:
        
        if item.get('data') is not None:
            col_nm.append(item['Name'])
            if item['Type'] != 'string':
                val_for_col.append(f"CAST ({(item['data'])} AS {item['Type']})" )
            else:
                val_for_col.append(str((item['data'])))
 
    colnames_with_doublequotes=",".join([f'"{i}"' for i in col_nm])
    values_formatted=",".join([f"{i}" if i.startswith('CAST') else f"'{i}'" for i in val_for_col] )
 
    return f"insert into {database}.{tablename} ({colnames_with_doublequotes}) values ({values_formatted})"

This function parses the create item stream event and constructs an INSERT SQL statement in the following format:

INSERT into <tablename> values (val1, val2....)

The function returns a string, which is an ANSI SQL compliant statement that can be run directly in Athena.

Update operations

For our update operation, let’s identify the current state of a record in the Athena table. We see emp_no=5 and its column values in Athena and compare them to the DynamoDB table. If there are no changes, the records should be the same, as shown in the following screenshots.

Let’s initiate an edit item operation in the DynamoDB table. We modify the following values:

  • IsContractAthlete – True
  • Phone_number – 123-456-789

After the item is edited in the DynamoDB table, a MODIFY stream event is generated in DynamoDB Streams, which triggers the Lambda function. The function processes the event and generates the equivalent UPDATE SQL statement to run on the Athena table.

MODIFY DynamoDB Streams events have two components: the old image and the new image. Here we parse only the new image data section to construct an UPDATE ANSI SQL statement and run it on the Athena tables.

The following update_stmt code block parses the modify item stream event and constructs the corresponding UPDATE SQL statement with new image data. The code block performs the following steps:

  • Finds the key columns for the WHERE clause
  • Finds columns for the SET clause
  • Ensures key columns are not part of the SET command

The function returns a string that is a SQL ANSI compliant statement that can be run directly in Athena. For example:

UPDATE <TABLENAME> SET col = value where key = value

See the following code:

def update_stmt(update_event_resp,AthenTblMd,database,tablename):
    resp=update_event_resp
    
    Tablevalues=resp['dynamodb']['NewImage']
    primary_key_col_names=resp['dynamodb']['Keys']     
    
    Tblvalues={ k.lower():v for k,v in Tablevalues.items()} # converting key names to lowercase to prevent case-sensitive mismatches
    
    new_upd_AthenaTblMd=AthenTblMd.copy()
    where_nm,set_nm=[],[]
    forUpdate=Tblvalues.copy()
 
    # removing primary keys from the stream dictionary so that SET command for Update can be constructed.
    for col_pkey in primary_key_col_names.keys():
        forUpdate.pop(col_pkey,None)
    
 
    for position,item in enumerate(AthenTblMd):
        if forUpdate.get(item.get('Name')) is not None:
            datafromsource=(list(forUpdate.get(item.get('Name')).values())[0])
            new_upd_AthenaTblMd[position]['data']=datafromsource
 
    # For set clause
    for item in new_upd_AthenaTblMd:
        if item.get('data') is not None:
            if item['Type'] != 'string':
                set_nm.append(f"{item['Name']} = CAST ('{(item['data'])}' AS {item['Type']})")
            else:
                set_nm.append(f" {item['Name']} = '{item['data']}' ")
    
    set_cmd=f" set {','.join(set_nm)}"
    
    # for where clause
    for key, val in primary_key_col_names.items():
        where_nm.append(f" {key} = {list(val.values())[0]}")
 
    where_cmd=f" where {' and '.join(where_nm)}"
 
    return (f" UPDATE {database}.{tablename} {set_cmd}  {where_cmd}")

In the Athena table, we can see the columns IsContractAthlete and Phone_number have been updated to the recent values. The other column values remain the same because they weren’t modified.

Delete operations

For delete operations, let’s identify the current state of a record in Athena table. We choose emp_no=6 for this activity.

  1. On the DynamoDB console, navigate to the user table.
  2. Select the record for emp_no=6.
  3. On the Actions menu, choose Delete items.

After the delete item operation is performed on the DynamoDB table, it generates a DELETE eventType in the DynamoDB stream, which triggers the Iceberg-Upsert Lambda function.

The DELETE function removes the data based on key columns in the stream. The following function parses the stream to identify key columns of the deleted item. We construct a DELETE DML SQL statement with a WHERE clause of emp_no=6:

DELETE &lt;TABLENAME&gt; WHERE key = value

See the following code:

def del_stmt(del_event_resp,database,tablename):
    
    resp=del_event_resp
    
    primary_key_col_names=resp['dynamodb']['Keys'] 
    del_where_nm=[]
    
    for key, val in primary_key_col_names.items():
        del_where_nm.append(f" {key} = {list(val.values())[0]}")
 
    del_where_cmd=f" where {' and '.join(del_where_nm)}"
    return f" DELETE FROM {database}.{tablename} {del_where_cmd} "   

The function returns a string, which is an ANSI SQL compliant statement that can be run directly in Athena. The following screenshot shows the DELETE statement that was run in Athena.

As you can see from the following screenshot, emp_no=6 record no longer exists in the Iceberg table when queried with Athena.

Time travel

Time travel queries in Athena query Amazon S3 for historical data from a consistent snapshot as of a specified date and time. Iceberg tables provide the capability of time travel. Each Iceberg table maintains a versioned manifest of the S3 objects that it contains. Previous versions of the manifest can be used for time travel and version travel queries. Version travel queries in Athena query Amazon S3 for historical data as of a specified snapshot ID. Iceberg format tracks every change that happened to the table in the tablename$iceberg_history table. When you query them, it will show timestamps when the changes occurred in the table.

Let’s find the timestamp when a DELETE statement was applied to the Athena table. In our query, it corresponds to the time 2023-04-18 21:34:13.970. With this timestamp, let’s query the main table to see if the emp_no=6 exists in it.

As shown in the following screenshot, the query result shows that the deleted record exists, and this can be used to reinsert data if required.

Optimize Iceberg tables

Every insert and update operation on an Iceberg table creates a separate data and metadata file. If there are multiple such update and insert operations, it might lead to multiple small fragmented files. Having these small files can cause an unnecessary number of metadata and less efficient queries. Utilize Athena OPTIMIZE command to compact these small files.

OPTIMIZE

The OPTIMIZE table REWRITE DATA compaction action rewrites data files into a more optimized layout based on their size and number of associated delete files.

The following query shows the number of data files that exist before the compaction process:

SELECT * FROM "users_73591300$iceberg_files"

The following query performs compaction on the Iceberg table:

OPTIMIZE "users_73591300$iceberg_files" REWRITE DATA USING BIN_PACK

We can observe that the compaction process merged multiple data files into a larger file.

VACUUM

The VACUUM statement on Iceberg tables removes data files that are no longer relevant, which reduces metadata size and storage consumption. VACUUM removes unwanted files older than the amount of time that is specified by the vacuum_max_snapshot_age_seconds table property (default 432000), as shown in the following code:

ALTER TABLE users_73591300 SET TBLPROPERTIES ('vacuum_max_snapshot_age_seconds'='259200')

The following query performs a vacuum operation on the Iceberg table:

VACUUM users_73591300

Clean up

When you have finished experimenting with this solution, clean up your resources to prevent AWS charges from being incurred:

  1. Empty the S3 buckets.
  2. Delete the stack from the AWS CloudFormation console.

Conclusion

In this post, we introduced a serverless CDC solution for semi-structured data using DynamoDB Streams and processing them in Iceberg tables. We demonstrated how to ingest semi-structured data in DynamoDB, identify changed data using DynamoDB Streams, and process them in Iceberg tables. We can expand the solution to build SCD type-2 functionality in data lakes to track historical data changes. This solution is appropriate for low frequency of updates, but for high frequency and larger volumes of data, we can aggregate the changes in a separate intermediate table using DynamoDB Streams and Amazon Kinesis Data Firehose, and then run periodic MERGE operations into the main Iceberg table.

We hope this post provided insights on how to process semi-structured data in a data lake when sources systems lack CDC capability.


About the authors

Vijay Velpula is a Data Lake Architect with AWS Professional Services. He helps customers building  modern data platforms through implementing Big Data & Analytics solutions. Outside of work, he enjoys spending time with family, traveling, hiking and biking.

Karthikeyan Ramachandran is a Data Architect with AWS Professional Services. He specializes in MPP systems helping Customers build and maintain Data warehouse environments. Outside of work, he likes to binge-watch tv shows and loves playing cricket and volleyball.

Sriharsh Adari is a Senior Solutions Architect at Amazon Web Services (AWS), where he helps customers work backwards from business outcomes to develop innovative solutions on AWS. Over the years, he has helped multiple customers on data platform transformations across industry verticals. His core area of expertise include Technology Strategy, Data Analytics, and Data Science. In his spare time, he enjoys playing sports, binge-watching TV shows, and playing Tabla.

Derive operational insights from application logs using Automated Data Analytics on AWS

Post Syndicated from Aparajithan Vaidyanathan original https://aws.amazon.com/blogs/big-data/derive-operational-insights-from-application-logs-using-automated-data-analytics-on-aws/

Automated Data Analytics (ADA) on AWS is an AWS solution that enables you to derive meaningful insights from data in a matter of minutes through a simple and intuitive user interface. ADA offers an AWS-native data analytics platform that is ready to use out of the box by data analysts for a variety of use cases. With ADA, teams can ingest, transform, govern, and query diverse datasets from a range of data sources without requiring specialist technical skills. ADA provides a set of pre-built connectors to ingest data from a wide range of sources including Amazon Simple Storage Service (Amazon S3), Amazon Kinesis Data Streams, Amazon CloudWatch, Amazon CloudTrail, and Amazon DynamoDB as well as many others.

ADA provides a foundational platform that can be used by data analysts in a diverse set of use cases including IT, finance, marketing, sales, and security. ADA’s out-of-the-box CloudWatch data connector allows data ingestion from CloudWatch logs in the same AWS account in which ADA has been deployed, or from a different AWS account.

In this post, we demonstrate how an application developer or application tester is able to use ADA to derive operational insights of applications running in AWS. We also demonstrate how you can use the ADA solution to connect to different data sources in AWS. We first deploy the ADA solution into an AWS account and set up the ADA solution by creating data products using data connectors. We then use the ADA Query Workbench to join the separate datasets and query the correlated data, using familiar Structured Query Language (SQL), to gain insights. We also demonstrate how ADA can be integrated with business intelligence (BI) tools such as Tableau to visualize the data and to build reports.

Solution overview

In this section, we present the solution architecture for the demo and explain the workflow. For the purposes of demonstration, the bespoke application is simulated using an AWS Lambda function that emits logs in Apache Log Format at a preset interval using Amazon EventBridge. This standard format can be produced by many different web servers and be read by many log analysis programs. The application (Lambda function) logs are sent to a CloudWatch log group. The historical application logs are stored in an S3 bucket for reference and for querying purposes. A lookup table with a list of HTTP status codes along with the descriptions is stored in a DynamoDB table. These three serve as sources from which data is ingested into ADA for correlation, query, and analysis. We deploy the ADA solution into an AWS account and set up ADA. We then create the data products within ADA for the CloudWatch log group, S3 bucket, and DynamoDB. As the data products are configured, ADA provisions data pipelines to ingest the data from the sources. With the ADA Query Workbench, you can query the ingested data using plain SQL for application troubleshooting or issue diagnosis.

The following diagram provides an overview of the architecture and workflow of using ADA to gain insights into application logs.

The workflow includes the following steps:

  1. A Lambda function is scheduled to be triggered at 2-minute intervals using EventBridge.
  2. The Lambda function emits logs that are stored at a specified CloudWatch log group under /aws/lambda/CdkStack-AdaLogGenLambdaFunction. The application logs are generated using the Apache Log Format schema but stored in the CloudWatch log group in JSON format.
  3. The data products for CloudWatch, Amazon S3, and DynamoDB are created in ADA. The CloudWatch data product connects to the CloudWatch log group where the application (Lambda function) logs are stored. The Amazon S3 connector connects to an S3 bucket folder where the historical logs are stored. The DynamoDB connector connects to a DynamoDB table where the status codes that are referred by the application and historical logs are stored.
  4. For each of the data products, ADA deploys the data pipeline infrastructure to ingest data from the sources. When the data ingestion is complete, you can write queries using SQL via the ADA Query Workbench.
  5. You can log in to the ADA portal and compose SQL queries from the Query Workbench to gain insights in to the application logs. You can optionally save the query and share the query with other ADA users in the same domain. The ADA query feature is powered by Amazon Athena, which is a serverless, interactive analytics service that provides a simplified, flexible way to analyze petabytes of data.
  6. Tableau is configured to access the ADA data products via ADA egress endpoints. You then create a dashboard with two charts. The first chart is a heat map that shows the prevalence of HTTP error codes correlated with the application API endpoints. The second chart is a bar chart that shows the top 10 application APIs with a total count of HTTP error codes from the historical data.

Prerequisites

For this post, you need to complete the following prerequisites:

  1. Install the AWS Command Line Interface (AWS CLI), AWS Cloud Development Kit (AWS CDK) prerequisites, TypeScript-specific prerequisites, and git.
  2. Deploy the ADA solution in your AWS account in the us-east-1 Region.
    1. Provide an admin email while launching the ADA AWS CloudFormation stack. This is needed for ADA to send the root user password. An admin phone number is required to receive a one-time password message if multi-factor authentication (MFA) is enabled. For this demo, MFA is not enabled.
  3. Build and deploy the sample application (available on the GitHub repo) solution so that the following resources can be provisioned in your account in the us-east-1 Region:
    1. A Lambda function that simulates the logging application and an EventBridge rule that invokes the application function at 2-minute intervals.
    2. An S3 bucket with the relevant bucket policies and a CSV file that contains the historical application logs.
    3. A DynamoDB table with the lookup data.
    4. Relevant AWS Identity and Access Management (IAM) roles and permissions required for the services.
  4. Optionally, install Tableau Desktop, a third-party BI provider. For this post, we use Tableau Desktop version 2021.2. There is a cost involved in using a licensed version of the Tableau Desktop application. For additional details, refer to the Tableau licensing information.

Deploy and set up ADA

After ADA is deployed successfully, you can log in using the admin email provided during the installation. You then create a domain named CW_Domain. A domain is a user-defined collection of data products. For example, a domain might be a team or a project. Domains provide a structured way for users to organize their data products and manage access permissions.

  1. On the ADA console, choose Domains in the navigation pane.
  2. Choose Create domain.
  3. Enter a name (CW_Domain) and description, then choose Submit.

Set up the sample application infrastructure using AWS CDK

The AWS CDK solution that deploys the demo application is hosted on GitHub. The steps to clone the repo and to set up the AWS CDK project are detailed in this section. Before you run these commands, be sure to configure your AWS credentials. Create a folder, open the terminal, and navigate to the folder where the AWS CDK solution needs to be installed. Run the following code:

gh repo clone aws-samples/operational-insights-with-automated-data-analytics-on-aws
cd operational-insights-with-automated-data-analytics-on-aws
npm install
npm run build
cdk synth
cdk deploy

These steps perform the following actions:

  • Install the library dependencies
  • Build the project
  • Generate a valid CloudFormation template
  • Deploy the stack using AWS CloudFormation in your AWS account

The deployment takes about 1–2 minutes and creates the DynamoDB lookup table, Lambda function, and S3 bucket containing the historical log files as outputs. Copy these values to a text editing application, such as Notepad.

Create ADA data products

We create three different data products for this demo, one for each data source that you’ll be querying to gain operational insights. A data product is a dataset (a collection of data such as a table or a CSV file) that has been successfully imported into ADA and that can be queried.

Create a CloudWatch data product

First, we create a data product for the application logs by setting up ADA to ingest the CloudWatch log group for the sample application (Lambda function). Use the CdkStack.LambdaFunction output to get the Lambda function ARN and locate the corresponding CloudWatch log group ARN on the CloudWatch console.

Then complete the following steps:

  1. On the ADA console, navigate to the ADA domain and create a CloudWatch data product.
  2. For Name¸ enter a name.
  3. For Source type, choose Amazon CloudWatch.
  4. Disable Automatic PII.

ADA has a feature that automatically detects personally identifiable information (PII) data during import that is enabled by default. For this demo, we disable this option for the data product because the discovery of PII data is not in the scope of this demo.

  1. Choose Next.
  2. Search for and choose the CloudWatch log group ARN copied from the previous step.
  3. Copy the log group ARN.
  4. On the data product page, enter the log group ARN.
  5. For CloudWatch Query, enter a query that you want ADA to get from the log group.

In this demo, we query the @message field because we’re interested in getting the application logs from the log group.

  1. Select how the data updates are triggered after initial import.

ADA can be configured to ingest the data from the source at flexible intervals (up to 15 minutes or later) or on demand. For the demo, we set the data updates to run hourly.

  1. Choose Next.

Next, ADA will connect to the log group and query the schema. Because the logs are in Apache Log Format, we transform the logs into separate fields so that we can run queries on the specific log fields. ADA provides four default transformations and supports custom transformation through a Python script. In this demo, we run a custom Python script to transform the JSON message field into Apache Log Format fields.

  1. Choose Transform schema.
  2. Choose Create new transform.
  3. Upload the apache-log-extractor-transform.py script from the /asset/transform_logs/ folder.
  4. Choose Submit.

ADA will transform the CloudWatch logs using the script and present the processed schema.

  1. Choose Next.
  2. In the last step, review the steps and choose Submit.

ADA will start the data processing, create the data pipelines, and prepare the CloudWatch log groups to be queried from the Query Workbench. This process will take a few minutes to complete and will be shown on the ADA console under Data Products.

Create an Amazon S3 data product

We repeat the steps to add the historical logs from the Amazon S3 data source and look up reference data from the DynamoDB table. For these two data sources, we don’t create custom transforms because the data formats are in CSV (for historical logs) and key attributes (for reference lookup data).

  1. On the ADA console, create a new data product.
  2. Enter a name (hist_logs) and choose Amazon S3.
  3. Copy the Amazon S3 URI (the text after arn:aws:s3:::) from the CdkStack.S3 output variable and navigate to the Amazon S3 console.
  4. In the search box, enter the copied text, open the S3 bucket, select the /logs folder, and choose Copy S3 URI.

The historical logs are stored in this path.

  1. Navigate back to the ADA console and enter the copied S3 URI for S3 location.
  2. For Update Trigger, select On Demand because the historical logs are updated at an unspecified frequency.
  3. For Update Policy, select Append to append newly imported data to the existing data.
  4. Choose Next.

ADA processes the schema for the files in the selected folder path. Because the logs are in CSV format, ADA is able to read the column names without requiring additional transformations. However, the columns status_code and request_size are inferred as long type by ADA. We want to keep the column data types consistent among the data products so that we can join the data tables and query the data. The column status_code will be used to create joins across the data tables.

  1. Choose Transform schema to change the data types of the two columns to string data type.

Note the highlighted column names in the Schema preview pane prior to applying the data type transformations.

  1. In the Transform plan pane, under Built-in transforms, choose Apply Mapping.

This option allows you to change the data type from one type to another.

  1. In the Apply Mapping section, deselect Drop other fields.

If this option is not disabled, only the transformed columns will be preserved and all other columns will be dropped. Because we want to retain all the columns, we disable this option.

  1. Under Field Mappings¸ for Old name and New name, enter status_code and for New type, enter string.
  2. Choose Add Item.
  3. For Old name and New name¸ enter request_size and for New data type, enter string.
  4. Choose Submit.

ADA will apply the mapping transformation on the Amazon S3 data source. Note the column types in the Schema preview pane.

  1. Choose View sample to preview the data with the transformation applied.

ADA will display the PII data acknowledgement to ensure that either only authorized users can view the data or that the dataset doesn’t contain any PII data.

  1. Choose Agree to continue to view the sample data.

Note that the schema is identical to the CloudWatch log group schema because both the current application and historical application logs are in Apache Log Format.

  1. In the final step, review the configuration and choose Submit.

ADA starts processing the data from the Amazon S3 source, creates the backend infrastructure, and prepares the data product. This process takes a few minutes depending upon the size of the data.

Create a DynamoDB data product

Lastly, we create a DynamoDB data product. Complete the following steps:

  1. On the ADA console, create a new data product.
  2. Enter a name (lookup) and choose Amazon DynamoDB.
  3. Enter the Cdk.DynamoDBTable output variable for DynamoDB Table ARN.

This table contains key attributes that will be used as a lookup table in this demo. For the lookup data, we are using the HTTP codes and long and short descriptions of the codes. You can also use PostgreSQL, MySQL, or a CSV file source as an alternative.

  1. For Update Trigger, select On-Demand.

The updates will be on demand because the lookup is mostly for reference purpose while querying and any updates to the lookup data can be updated in ADA using on-demand triggers.

  1. Choose Next.

ADA reads the schema from the underlying DynamoDB schema and presents the column name and type for optional transformation. We will proceed with the default schema selection because the column types are consistent with the types from the CloudWatch log group and Amazon S3 CSV data source. Having data types that are consistent across the data sources allows us to write queries to fetch records by joining the tables using the column fields. For example, the column key in the DynamoDB schema corresponds to the status_code in the Amazon S3 and CloudWatch data products. We can write queries that can join the three tables using the column name key. An example is shown in the next section.

  1. Choose Continue with current schema.
  2. Review the configuration and choose Submit.

ADA will process the data from the DynamoDB table data source and prepare the data product. Depending upon the size of the data, this process takes a few minutes.

Now we have all the three data products processed by ADA and available for you to run queries.

Use the Query Workbench to query the data

ADA allows you to run queries against the data products while abstracting the data source and making it accessible using SQL (Structured Query Language). You can write queries and join the tables just as you would query against tables in a relational database. We demonstrate ADA’s querying capability via two user scenarios. In both the scenarios, we join an application log dataset to the error codes lookup table. In the first use case, we query the current application logs to identify the top 10 most accessed application endpoints along with the corresponding HTTP status codes:

--Query the top 10 Application endpoints along with the corresponding HTTP request type and HTTP status code.

SELECT logs.endpoint AS Application_EndPoint, logs.http_request AS REQUEST, count(logs.endpoint) as Endpoint_Count, ref.key as HTTP_Status_Code, ref.short as Description
FROM cw_domain.cloud_watch_application_logs logs
INNER JOIN cw_domain.lookup ref ON logs.status_code = ref.key
where logs.status_code LIKE '4%%' OR logs.status_code LIKE '5%%' -- = '/v1/server'
GROUP BY logs.endpoint, logs.http_request, ref.key, ref.short
ORDER BY Endpoint_Count DESC
LIMIT 10

In the second example, we query the historical logs table to get the top 10 application endpoints with the most errors to understand the endpoint call pattern:

-- Query Historical Logs to get the top 10 Application Endpoints with most number of errors along with an explanation of the error code.

SELECT endpoint as Application_EndPoint, count(status_code) as Error_Count, ref.long as Description FROM cw_domain.hist_logs hist
INNER JOIN cw_domain.lookup ref ON hist.status_code = ref.key
WHERE hist.status_code LIKE '4%%' OR hist.status_code LIKE '5%%'
GROUP BY endpoint, status_code, ref.long
ORDER BY Error_Count desc
LIMIT 10

In addition to querying, you can optionally save the query and share the saved query with other users in the same domain. The shared queries are accessible directly from the Query Workbench. The query results can also be exported to CSV format.

Visualize ADA data products in Tableau

ADA offers the ability to connect to third-party BI tools to visualize data and create reports from the ADA data products. In this demo, we use ADA’s native integration with Tableau to visualize the data from the three data products we configured earlier. Using Tableau’s Athena connector and following the steps in Tableau configuration, you can configure ADA as a data source in Tableau. After a successful connection has been established between Tableau and ADA, Tableau will populate the three data products under the Tableau catalog cw_domain.

We then establish a relationship across the three databases using the HTTP status code as the joining column, as shown in the following screenshot. Tableau allows us to work in online and offline mode with the data sources. In online mode, Tableau will connect to ADA and query the data products live. In offline mode, we can use the Extract option to extract the data from ADA and import the data in to Tableau. In this demo, we import the data in to Tableau to make the querying more responsive. We then save the Tableau workbook. We can inspect the data from the data sources by choosing the database and Update Now.

With the data source configurations in place in Tableau, we can create custom reports, charts, and visualizations on the ADA data products. Let’s consider two use cases for visualizations.

As shown in the following figure, we visualized the frequency of the HTTP errors by application endpoints using Tableau’s built-in heat map chart. We filtered out the HTTP status codes to only include error codes in the 4xx and 5xx range.

We also created a bar chart to depict the application endpoints from the historical logs ordered by the count of HTTP error codes. In this chart, we can see that the /v1/server/admin endpoint has generated the most HTTP error status codes.

Clean up

Cleaning up the sample application infrastructure is a two-step process. First, to remove the infrastructure provisioned for the purposes of this demo, run the following command in the terminal:

cdk destroy

For the following question, enter y and AWS CDK will delete the resources deployed for the demo:

Are you sure you want to delete: CdkStack (y/n)? y

Alternatively, you can remove the resources via the AWS CloudFormation console by navigating to the CdkStack stack and choosing Delete.

The second step is to uninstall ADA. For instructions, refer to Uninstall the solution.

Conclusion

In this post, we demonstrated how to use the ADA solution to derive insights from application logs stored across two different data sources. We demonstrated how to install ADA on an AWS account and deploy the demo components using AWS CDK. We created data products in ADA and configured the data products with the respective data sources using the ADA’s built-in data connectors. We demonstrated how to query the data products using standard SQL queries and generate insights on the log data. We also connected the Tableau Desktop client, a third-party BI product, to ADA and demonstrated how to build visualizations against the data products.

ADA automates the process of ingesting, transforming, governing, and querying diverse datasets and simplifying the lifecycle management of data. ADA’s pre-built connectors allow you to ingest data from diverse data sources. Software teams with basic knowledge of AWS products and services will be able to set up an operational data analytics platform in a few hours and provide secure access to the data. The data can then be easily and quickly queried using an intuitive and standalone web user interface.

Try out ADA today to easily manage and gain insights from data.


About the authors

Aparajithan Vaidyanathan is a Principal Enterprise Solutions Architect at AWS. He supports enterprise customers migrate and modernize their workloads on AWS cloud. He is a Cloud Architect with 23+ years of experience designing and developing enterprise, large-scale and distributed software systems. He specializes in Machine Learning & Data Analytics with focus on Data and Feature Engineering domain. He is an aspiring marathon runner and his hobbies include hiking, bike riding and spending time with his wife and two boys.

Rashim Rahman is a Software Developer based out of Sydney, Australia with 10+ years of experience in software development and architecture. He works primarily on building large scale open-source AWS solutions for common customer use cases and business problems. In his spare time, he enjoys sports and spending time with friends and family.

Hafiz Saadullah is a Principal Technical Product Manager at Amazon Web Services. Hafiz focuses on AWS Solutions, designed to help customers by addressing common business problems and use cases.

Debian turns 30

Post Syndicated from corbet original https://lwn.net/Articles/941744/

On August 16, 1993, Ian Murdock announced
a new distribution to the comp.os.linux.development Usenet newsgroup:

This is just to announce the imminent completion of a brand-new
Linux release, which I’m calling the Debian Linux Release. This is
a release that I have put together basically from scratch; in other
words, I didn’t simply make some changes to SLS and call it a new
release. I was inspired to put together this release after running
SLS and generally being dissatisfied with much of it, and after
much altering of SLS I decided that it would be easier to start
from scratch. The base system is now virtually complete (though I’m
still looking around to make sure that I grabbed the most recent
sources for everything), and I’d like to get some feedback before I
add the “fancy” stuff.

After 30 years, Debian is still going strong.

Implementing the transactional outbox pattern with Amazon EventBridge Pipes

Post Syndicated from James Beswick original https://aws.amazon.com/blogs/compute/implementing-the-transactional-outbox-pattern-with-amazon-eventbridge-pipes/

This post is written by Sayan Moitra, Associate Solutions Architect, and Sangram Sonawane, Senior Solutions Architect.

Microservice architecture is an architectural style that structures an application as a collection of loosely coupled and independently deployable services. Services must communicate with each other to exchange messages and perform business operations. Ensuring message reliability while maintaining loose coupling between services is crucial for building robust and scalable systems.

This blog demonstrates how to use Amazon DynamoDB, a fully managed serverless key-value NoSQL database, and Amazon EventBridge, a managed serverless event bus, to implement reliable messaging for microservices using the transactional outbox pattern.

Business operations can span across multiple systems or databases to maintain consistency and synchronization between them. One approach often used in distributed systems or architectures where data must be replicated across multiple locations or components is dual writes. In a dual write scenario, when a write operation is performed on one system or database, the same data or event also triggers another system in real-time or near real-time. This ensures that both systems always have the same data, minimizing data inconsistencies.

Dual writes can also introduce data integrity challenges in distributed systems. Failure to update the database or to send events to other downstream systems after an initial system update can lead to data loss and leave the application in an inconsistent state. One design approach to overcome this challenge is to combine dual writes with the transactional outbox pattern.

Challenges with dual writes

Consider an online food ordering application to illustrate the challenges with dual writes. Once the user submits the order, the order service updates the order status in a persistent data store. The order status update should also be sent to notify_restaurant and order_tracking services using a message bus for asynchronous communication. After successfully updating the order status in the database, the order service writes the event to the message bus. The order_service performs a dual write operation of updating the database and publishing the event details on the message bus for other services to read.

This approach works until there are issues encountered in publishing the event to the message bus. Publishing events can fail for multiple reasons like a network error or a message bus outage. When failure occurs, the notify_restaurant and order_tracking service will not be notified of the order update event, leaving the system in an inconsistent state. Implementing the transactional outbox pattern with dual writes can help ensure reliable messaging between systems after a database update.

This illustration shows a sequence diagram for an online food ordering application and the challenges with dual writes:

Sequence diagram

Overview of the transactional outbox pattern

In the transactional outbox pattern, a second persistent data store is introduced to store the outgoing messages. In the online food order example, updating the database with order details and storing the event information in the outbox table becomes a single atomic transaction.

The transaction is only successful when writing to both the database and the outbox table. Any failures to write to the outbox table rolls back the transaction. A separate process then reads the event from the outbox table and publishes the event on the message bus. Once the message is available on the message bus, it can be read by the notify_restaurant and order_tracking services. Combining transactional outbox pattern with dual writes allows for data consistency across systems and reliable message delivery with the transactional context.

The following illustration shows a sequence diagram for an online food ordering application with transactional outbox pattern for reliable message delivery.

Sequence diagram 2

Implementing the transaction outbox pattern

DynamoDB includes a feature called DynamoDB Streams to capture a time-ordered sequence of item-level modifications in the DynamoDB table and stores this information in a log for up to 24 hours. Applications can access this log and view the data items as they appeared before and after they were modified, in near real time.

Whenever an application creates, updates, or deletes items in the table, DynamoDB Streams writes a stream record with the primary key attributes of the items that were modified. A stream record contains information about a data modification to a single item in a DynamoDB table. DynamoDB Streams writes stream records in near real time and these can be consumed for processing based on the contents. Enabling this feature removes the need to maintain a separate outbox table and lowers the management and operational overhead.

EventBridge Pipes connects event producers to consumers with options to transform, filter, and enrich messages. EventBridge Pipes can integrate with DynamoDB Streams to capture table events without writing any code. There is no need to write and maintain a separate process to read from the stream. EventBridge Pipes also supports retries, and any failed events can be routed to a dead-letter queue (DLQ) for further analysis and reprocessing.

EventBridge polls shards in DynamoDB stream for records and invokes pipes as soon as records are available. You can configure this to read records from DynamoDB only when it has gathered a specified batch size or the batch window expires. Pipes maintains the order of records from the data stream when sending that data to the destination. You can optionally filter or enhance these records before sending them to a target for processing.

Example overview

The following diagram illustrates the implementation of transactional outbox pattern with DynamoDB Streams and EventBridge Pipe. Amazon API Gateway is used to trigger a DynamoDB operation via a POST request. The change in the DynamoDB triggers an EventBridge event bus via Amazon EventBridge Pipes. This event bus invokes the Lambda functions through an SQS Queue, depending on the filters applied.

Architecture overview

  1. In this sample implementation, Amazon API Gateway makes a POST call to the DynamoDB table for database updates. Amazon API Gateway supports CRUD operations for Amazon DynamoDB without the need of a compute layer for database calls.
  2. DynamoDB Streams is enabled on the table, which captures a time-ordered sequence of item-level modifications in the DynamoDB table in near real time.
  3. EventBridge Pipes integrates with DynamoDB Streams to capture the events and can optionally filter and enrich the data before it is sent to a supported target. In this example, events are sent to Amazon EventBridge, which acts as a message bus. This can be replaced with any of the supported targets as detailed in Amazon EventBridge Pipes targets. DLQ can be configured to handle any failed events, which can be analyzed and retried.
  4. Consumers listening to the event bus receive messages. You can optionally fan out and deliver the events to multiple consumers and apply filters. You can configure a DLQ to handle any failures and retries.

Prerequisites

  1. AWS SAM CLI, version 1.85.0 or higher
  2. Python 3.10

Deploying the example application

  1. Clone the repository:
    git clone https://github.com/aws-samples/amazon-eventbridge-pipes-dynamodb-stream-transactional-outbox.git
  2. Change to the root directory of the project and run the following AWS SAM CLI commands:
    cd amazon-eventbridge-pipes-dynamodb-stream-transactional-outbox               
    sam build
    sam deploy --guided
    
  3. Enter the name for your stack during guided deployment. During the deploy process, select the default option for all the additional steps.
    SAM deployment
  4. The resources are deployed.
    Testing the application

Testing the application

Once the deployment is complete, it provides the API Gateway URL in the output. You can test using that URL. To test the application, use Postman to make a POST call to API Gateway prod URL:

Postman

You can also test using the curl command:

curl -s --header "Content-Type: application/json" \
  --request POST \
  --data '{"Status":"Created"}' \
  <API_ENDPOINT>

This produces the following output:

Expected output

To verify if the order details are updated in the DynamoDB table, run this command for performing a scan operation on the table.

aws dynamodb scan \
    --table-name <DynamoDB Table Name>

Handling failures

DynamoDB Streams captures a time-ordered sequence of item-level modifications in the DynamoDB table and stores this information in a log for up to 24 hours. If EventBridge is unavailable to read from DynamoDB Stream due to misconfiguration, for example, the records are available in the log for 24 hours. Once EventBridge is reintegrated, it retrieves all undelivered records from the last 24 hours. For integration issues between EventBridge Pipes and the target application, all failed messages can be sent to the DLQ for reprocessing at a later time.

Cleaning up

To clean up your AWS based resources, run following AWS SAM CLI command, answering “y” to all questions:

sam delete --stack-name <stack_name>

Conclusion

Reliable interservice communication is an important consideration in microservice design, especially when faced with dual writes. Combining the transactional outbox pattern with dual writes provides a robust way of improving message reliability.

This blog demonstrates an architecture pattern to tackle the challenge of dual writes by combining it with the transactional outbox pattern using DynamoDB and EventBridge Pipes. This solution provides a no-code approach with AWS Managed Services, reducing management and operational overhead.

For more serverless learning resources, visit Serverless Land.

Debian adds LoongArch support

Post Syndicated from corbet original https://lwn.net/Articles/941743/

The Debian project has added
the LoongArch architecture
to its ports collection.

After an initial manual bootstrap of roughly 200 packages, two
buildds are now building packages for the newly added “loong64”
port with the help of qemu-user. After enough packages have been
built for the port to be self-hosting, we’re planning to replace
these two buildds with real hardware hosted at Loongson.

Security updates for Wednesday

Post Syndicated from corbet original https://lwn.net/Articles/941722/

Security updates have been issued by Debian (datatables.js and openssl), Fedora (ghostscript, java-11-openjdk, java-latest-openjdk, microcode_ctl, and xen), Red Hat (redhat-ds:11), SUSE (java-1_8_0-openj9, kernel, krb5, pcre2, and perl-HTTP-Tiny), and Ubuntu (gstreamer1.0, mysql-8.0, tiff, and webkit2gtk).

Let’s Architect! Security in software architectures

Post Syndicated from Luca Mezzalira original https://aws.amazon.com/blogs/architecture/lets-architect-security-in-software-architectures/

Security is fundamental for each product and service you are building with. Whether you are working on the back-end or the data and machine learning components of a system, the solution should be securely built.

In 2022, we discussed security in our post Let’s Architect! Architecting for Security. Today, we take a closer look at general security practices for your cloud workloads to secure both networks and applications, with a mix of resources to show you how to architect for security using the services offered by Amazon Web Services (AWS).

In this edition of Let’s Architect!, we share some practices for protecting your workloads from the most common attacks, introduce the Zero Trust principle (you can learn how AWS itself is implementing it!), plus how to move to containers and/or alternative approaches for managing your secrets.

A deep dive on the current security threat landscape with AWS

This session from AWS re:Invent, security engineers guide you through the most common threat vectors and vulnerabilities that AWS customers faced in 2022. For each possible threat, you can learn how it’s implemented by attackers, the weaknesses attackers tend to leverage, and the solutions offered by AWS to avert these security issues. We describe this as fundamental architecting for security: this implies adopting suitable services to protect your workloads, as well as follow architectural practices for security.

Take me to this re:Invent 2022 session!

Statistics about common attacks and how they can be launched

Statistics about common attacks and how they can be launched

Zero Trust: Enough talk, let’s build better security

What is Zero Trust? It is a security model that produces higher security outcomes compared with the traditional network perimeter model.

How does Zero Trust work in practice, and how can you start adopting it? This AWS re:Invent 2022 session defines the Zero Trust models and explains how to implement one. You can learn how it is used within AWS, as well as how any architecture can be built with these pillars in mind. Furthermore, there is a practical use case to show you how Delphix put Zero Trust into production.

Take me to this re:Invent 2022 session!

AWS implements the Zero Trust principle for managing interactions across different services

AWS implements the Zero Trust principle for managing interactions across different services

A deep dive into container security on AWS

Nowadays, it’s vital to have a thorough understanding of a container’s underlying security layers. AWS services, like Amazon Elastic Kubernetes Service and Amazon Elastic Container Service, have harnessed these Linux security-layer protections, keeping a sharp focus on the principle of least privilege. This approach significantly minimizes the potential attack surface by limiting the permissions and privileges of processes, thus upholding the integrity of the system.

This re:Inforce 2023 session discusses best practices for securing containers for your distributed systems.

Take me to this re:Inforce 2023 session!

Fundamentals and best practices to secure containers

Fundamentals and best practices to secure containers

Migrating your secrets to AWS Secrets Manager

Secrets play a critical role in providing access to confidential systems and resources. Ensuring the secure and consistent management of these secrets, however, presents a challenge for many organizations.

Anti-patterns observed in numerous organizational secrets management systems include sharing plaintext secrets via unsecured means, such as emails or messaging apps, which can allow application developers to view these secrets in plaintext or even neglect to rotate secrets regularly. This detailed guidance walks you through the steps of discovering and classifying secrets, plus explains the implementation and migration processes involved in transferring secrets to AWS Secrets Manager.

Take me to this AWS Security Blog post!

An organization's perspectives and responsibilities when building a secrets management solution

An organization’s perspectives and responsibilities when building a secrets management solution

Conclusion

We’re glad you joined our conversation on building secure architectures! Join us in a couple of weeks when we’ll talk about cost optimization on AWS.

To find all the blogs from this series, visit the Let’s Architect! list of content on the AWS Architecture Blog.

UK Electoral Commission Hacked

Post Syndicated from Bruce Schneier original https://www.schneier.com/blog/archives/2023/08/uk-electoral-commission-hacked.html

The UK Electoral Commission discovered last year that it was hacked the year before. That’s fourteen months between the hack and the discovery. It doesn’t know who was behind the hack.

We worked with external security experts and the National Cyber Security Centre to investigate and secure our systems.

If the hack was by a major government, the odds are really low that it has resecured its systems—unless it burned the network to the ground and rebuilt it from scratch (which seems unlikely).

Introducing Cloudflare’s 2023 phishing threats report

Post Syndicated from Elaine Dzuba original http://blog.cloudflare.com/2023-phishing-report/

Introducing Cloudflare's 2023 phishing threats report

Introducing Cloudflare's 2023 phishing threats report

After shutting down a ‘phishing-as-a-service’ operation that impacted thousands of victims in 43 countries, INTERPOL recently noted, “Cyberattacks such as phishing may be borderless and virtual in nature, but their impact on victims is real and devastating.” Business email compromise (BEC), a type of malware-less attack that tricks recipients into transferring funds — for example — has cost victims worldwide more than $50 billion, according to the FBI.

It is estimated that 90% of successful cyber attacks start with email phishing, which continues to be very lucrative for attackers. There is not much today that can be done to stop phishing attempts. However, to prevent successful attacks, it is important to understand (and proactively address) evolving phishing trends — including the ways attackers cleverly exploit intended victims’ trust in “known” email senders. To that end, this week Cloudflare published its first Phishing Threats Report.

This report explores key phishing trends and related recommendations, based on email security data from May 2022 to May 2023. During that time, Cloudflare processed approximately 13 billion emails, which included blocking approximately 250 million malicious messages from reaching customers’ inboxes. The report is also informed by a Cloudflare-commissioned survey of 316 security decision-makers across North America, EMEA, and APAC (you can download that separate study here).

Check out the full report to understand our three key takeaways:

  • Attackers using deceptive links as the #1 phishing tactic — and how they are evolving how they get you to click and when they weaponize the link;
  • Identity deception takes multiple forms (including business email compromise (BEC) and brand impersonation), and can easily bypass email authentication standards;
  • Attackers pretend to be hundreds of different organizations, but they primarily impersonate the entities we trust and need to get work done.

Here are a few other things to keep in mind as you read the 2023 Phishing Threats report.

Email threat categorization

Attackers typically use a combination of social engineering and technical obfuscation techniques to make their messages seem legitimate. Therefore, Cloudflare uses a number of advanced detection techniques to analyze “fuzzy” signals (not just content that’s visible to the naked eye) to identify unwanted emails. Those signals include:

  • Structural analysis of headers, body copy, images, links, attachments, payloads, and more, using heuristics and machine learning models specifically designed for phishing signals;
  • Sentiment analysis to detect changes in patterns and behaviors (e.g., writing patterns and expressions);
  • Trust graphs that evaluate partner social graphs, email sending history, and potential partner impersonations

Our email security service also incorporates threat intelligence from Cloudflare’s global network, which blocks an average of 140 billion cyber threats each day.

Those and many other signals lead to email dispositions of malicious, BEC, spoof, or spam; our dashboard tells customers the specific reasons (i.e., the threat indicator ‘categories’) for a particular email disposition.

Below is a snapshot of the top email threat indicators we observed between May 2, 2022, to May 2, 2023. We categorize threat indicators into more than 30 different categories; over that period, the top threat indicators included deceptive links, domain age (newly registered domains), identity deception, credential harvesting, and brand impersonation.

Introducing Cloudflare's 2023 phishing threats report

Below are brief descriptions of each of the top categories (detailed in more depth in the report’s appendix).

If clicked, a deceptive link will open the user’s default web browser and render the data referenced in the link, or open an application directly (e.g. a PDF). Since the display text for a link (i.e., hypertext) in HTML can be arbitrarily set, attackers can make a URL appear as if it links to a benign site when, in fact, it is actually malicious.

Domain age is related to domain reputation, which is the overall score assigned to a domain.  For example, domains that send out numerous new emails immediately after domain registration will tend to have a poorer reputation, and thus a lower score.

Identity deception occurs when an attacker or someone with malicious intent sends an email claiming to be someone else. The mechanisms and tactics of this vary widely. Some tactics include registering domains that look similar (aka domain impersonation), are spoofed, or use display name tricks to appear to be sourced from a trusted domain. Other variations include sending email using domain fronting and high-reputation web services platforms.

Credential harvesters are set up by an attacker to deceive users into providing their login credentials. Unwitting users may enter their credentials, ultimately providing attackers with access to their accounts.

Brand impersonation is a form of identity deception where an attacker sends a phishing message that impersonates a recognizable company or brand. Brand impersonation is conducted using a wide range of techniques.

An attachment to an email that, when opened or executed in the context of an attack, includes a call-to-action (e.g. lures target to click a link) or performs a series of actions set by an attacker.

Cloudflare regularly observes multiple threat indicators in one phishing email. For example, one Silicon Valley Bank-themed phishing campaign (detailed in this March 2023 blog) combined brand impersonation with a deceptive link and malicious attachment.

Introducing Cloudflare's 2023 phishing threats report

The attackers leveraged the SVB brand in a DocuSign-themed template. The email included HTML code that contains an initial link and a complex redirect chain that is four deep. The included HTML file in the attack would have sent the recipient to a WordPress instance that has recursive redirection capability.

(Speaking of links, deceptive links were the #1 threat category, appearing in 35.6% of our detections. And attackers aren’t just using links in email channels; the rise of multi-channel phishing threats — which exploit other applications such as SMS/text, chat, and social media — are also covered in the report).

Trusted (and most impersonated) brands

Silicon Valley Bank was just one of approximately 1,000 different brands we observed being impersonated in emails targeting Cloudflare customers between May 2022 and May 2023. (Cloudflare employees were directly targeted via brand impersonation in the “Oktapus” phishing attack that the Cloudflare One suite of products thwarted in July 2022).

However, as detailed in the Phishing Threats Report, we observed that email attackers most often (51.7% of the time) impersonated one of 20 well-known global brands, with Microsoft being #1 on their list.

Rank Impersonated brand
1 Microsoft
2 World Health Organization
3 Google
4 SpaceX
5 Salesforce
6 Apple
7 Amazon
8 T-Mobile
9 YouTube
10 MasterCard
11 Notion.so
12 Comcast
13 Line Pay
14 MasterClass
15 Box
16 Truist Financial Corp
17 Facebook
18 Instagram
19 AT&T
20 Louis Vuitton

Example of a Microsoft credential harvesting attempt

Earlier this year, Cloudflare detected and blocked a phishing campaign leveraging the Microsoft brand in an attempt to harvest credentials through a legitimate — but compromised — site.

In the email example below, there is no text in the body of the email despite its appearance. The entire body is a hyperlinked JPEG image. Thus, if the recipient clicks anywhere in the body (even if they don’t intend to click the link), they are effectively clicking the link.

Introducing Cloudflare's 2023 phishing threats report

Initially, the hyperlink for this image appears to be a benign Baidu URL – hxxp://www.baidu[.]com/link?url=-yee3T9X9U41UHUa3VV6lx1j5eX2EoI6XpZqfDgDcf-2NYQ8RVpOn5OYkDTuk8Wg#<recipient’s email address base64 encoded>.  However, if this link is clicked, the target’s browser would be redirected to a site that had been compromised and used to host a credential harvester.

The attacker used Microsoft Office 365 branding, but attempted to circumvent any brand detection techniques by including the brand information within the image (i.e., there was no plaintext or HTML text that could be inspected to identify the brand).

However, using optical character recognition (OCR), Cloudflare successfully identified “Office 365” and “Microsoft” in the image. Using OCR, we also identified the use of suspicious account lures related to passwords.

In this example, attackers’ techniques included:

  • Inclusion of only a JPEG image (impossible to detect words without OCR)
  • Embedding a hyperlink in that image (clicking anywhere in the body would result in clicking the link)
  • Hyperlinking to a Baidu URL (used to bypass reputation-based URL detection techniques)
  • The Baidu URL redirecting the recipient’s browser to a credential harvesting site (i.e., would circumvent other email security defenses that are not capable of deep link inspection)
  • Hosting the credential harvester on a legitimate site that had been compromised by the attacker (even with deep link inspection, will again attempt to bypass URL detection techniques based on reputation)

This attack vector leverages the high reputation and authenticity of Baidu to bypass the reputation of the true host/IP where the credential harvester is hosted.

While this specific campaign focused on harvesting Microsoft credentials, we often see attackers using similar methods to bypass brand detection techniques and trick victims into downloading malware and other malicious payloads.

URL redirection techniques are often seen in phishing campaigns, but threat actors are continuing to refine their approach by abusing more and more legitimate domains like baidu.com, bing.com, goo.gl, etc. Our numerous detection capabilities allow us to conduct deep link inspection of URLs using redirection techniques of all kinds, including those that abuse legitimate domains.

What about SPF, DKIM, and DMARC?

Email authentication (specifically the SPF, DKIM, and DMARC standards) are often mentioned as useful against brand impersonation: these standards help validate server and tenant origins, protect message integrity, provide policy enforcement, and more.

However, attackers can still find ways to bypass authentication to trick email suites; and we actually observed that 89% of unwanted messages “passed” SPF, DKIM, and/or DMARC checks.

Some limitations of email authentication include:

SPF
(Sender Policy Framework)
Key benefits:
Validating server origin (i.e., validates where a message originates from)
Defining which email servers and services are allowed to send messages on a domain owner’s behalf
Limitations:
Does not prevent lookalike email, domain, or display name spoofing
Does not validate the “From” header; uses envelope “From” to determine sending domain
Validation ineffective when emails are forwarded or when messages sent to a mailing list are sent to each subscriber
SPF evaluation process can be limited to a certain number of DNS lookups
Does not protect against attacks using “validated” emails with embedded URLs, malicious payloads, or attachments
DKIM
(Domain Keys Identified Mail)
Key benefits:
Providing tenant origin validation (i.e., checks that an email was sent/authorized by the owner of the domain via a digital signature)
Ensuring email is not altered while transferred from server to server; protecting message integrity
Limitations:
Does not prevent lookalike email, domain, or display name spoofing
Does not protect against replay attacks (DKIM only signs specific parts of a message. Attackers can add other header fields to emails passing DKIM then forward them.)
Does not protect against attacks using “validated” emails with embedded URLs, malicious payloads or attachments
DMARC (Domain-based Message Authentication, Reporting and Conformance) Key benefits:
Providing policy enforcement and reporting for SPF and DKIM
Stipulating what policy to follow if an email doesn’t pass SPF or DKIM authentication (e.g. reject/delete, quarantine, no policy/send)
Reporting function allows domain owners to see who is sending email on their behalf (i.e., protecting against spoofing of your own domain and brand abuse)
Limitations:
Does not prevent spoofing of another brand’s domain
Does not prevent lookalike email, domain, or display name spoofing
Domain owners specify what percentage of mail DMARC policies it applies to; application percentages of less than 100% are less effective
Does not protect against attacks using “validated” emails with embedded URLs, malicious payloads or attachments

Conclusions

Attackers are constantly evolving their tactics. Multiple protection layers must be enacted before, during, and after messages reach the inbox. Cloudflare never inherently “trusts” any type of email communication (whether it appears to be internal, external, or from a ‘known’ business partner).

Likewise, we recommend that — first and foremost — all organizations extend the Zero Trust security model of “never trust, always verify” not just to the network and applications, but also to the email inbox.

In addition to securing email with a Zero Trust approach, we also recommend:

  • Augmenting cloud email with multiple anti-phishing controls. As noted in this Forrester blog from June, “The use of messaging, collaboration, file sharing, and enterprise software-as-a-service applications across multiple devices all contribute to employee productivity and experience. Many of these environments are considered ‘closed,’ but one successful phish of a supply chain partner’s credentials opens your organization up to data loss, credential theft, fraud, and ransomware attacks. Protections developed for the email inbox must extend to these environments and throughout the day-to-day workflows of your employees.”
  • Adopting phishing-resistant multifactor authentication (MFA). While not all MFA provides the same layer of security, hardware security keys are among the most secure authentication methods for preventing successful phishing attacks. They can protect networks even if attackers gain access to usernames and passwords.
  • Make it harder for humans to make mistakes.  Meet employees and teams where they are by making the tools they already use more secure, and preventing them from making mistakes. For example, remote browser isolation (RBI) technology, when integrated with cloud email security, can automatically isolate suspicious email links to prevent users from being exposed to potentially malicious web content. Keyboard inputs can also be disabled on untrusted websites, protecting users from accidentally entering sensitive information within a form fill or credential harvesting. This provides a layer of defense against multi-channel phishing attacks by effectively allowing users to safely open links without disrupting their workflow.

If you’re interested in the full findings, you can download the 2023 Phishing Threats Report here, as well as our recommendations for preventing successful phishing attacks. And if you’d like to see Cloudflare’s email security in action, you can request a free phishing risk assessment here.

The collective thoughts of the interwebz