Post Syndicated from Matt Granger original https://www.youtube.com/watch?v=AvZUfJ5Igdg
Hall: IBM, Red Hat and Free Software: An old maddog’s view
Post Syndicated from corbet original https://lwn.net/Articles/939922/
Here is a
long reminiscence from Jon “maddog” Hall leading up to some thoughts on
Red Hat’s source-release policy changes.
Recently I have been seeing some cracks in the dike. As more and
more users of FOSS come on board, they put more and more demands on
developers whose numbers are not growing sufficiently fast enough
to keep all the software working.I hear from FOSS developers that too few, and sometimes no,
developers are working on blocks of code. Of course this can also
happen to closed-source code, but this shortness hits mostly in
areas that are not considered “sexy”, such as quality assurance,
release engineering, documentation and translations.
GNU C Library 2.38 released
Post Syndicated from corbet original https://lwn.net/Articles/939919/
Version 2.38 of
the GNU C Library has been released. This release consists mostly of
relatively small changes, including improved support for working with
binary integer constants, some new printf() formatting options,
libmvec support for 64-bit Arm systems, the strlcpy() and
strlcat() string functions, and more. See the release notes
for the details.
Security updates for Tuesday
Post Syndicated from corbet original https://lwn.net/Articles/939917/
Security updates have been issued by Debian (tiff), Fedora (curl), Red Hat (bind, ghostscript, iperf3, java-1.8.0-ibm, nodejs, nodejs:18, openssh, postgresql:15, and samba), Scientific Linux (iperf3), Slackware (mozilla and seamonkey), SUSE (compat-openssl098, gnuplot, guava, openssl-1_0_0, pipewire, python-requests, qemu, samba, and xmltooling), and Ubuntu (librsvg, openjdk-8, openjdk-lts, openjdk-17, openssh, rabbitmq-server, and webkit2gtk).
How To Present SecOps Metrics (The Right Way)
Post Syndicated from Rapid7 original https://blog.rapid7.com/2023/08/01/how-to-present-secops-metrics-the-right-way/

SecOps metrics can be a gold mine of potential for informing better business decisions, but 78% of CEOs say they don’t have adequate data on risk exposure to make good decisions. Even when they do see the right data, 82% are inclined to “trust their gut” anyway.
Here lies the disconnect between data and decisions for C-level executives: a lack of effective presentation. Ultimately, the responsibility of communicating that SecOps metrics matter falls on today’s security teams. They must transform numbers into narratives that illustrate the challenges in today’s attack landscape to decision-makers — and, most importantly, make stakeholders care about those challenges.
But metrics presentations can get boring. So, how can security professionals present SecOps metrics in an engaging way?
Stories inspire empathy and action
While facts and figures play a role in communication, humans respond differently to stories. With narratives, we understand meaning more deeply, remember events longer, and factor what each story taught us into future decisions. Storytelling is also an effective way for security teams to inspire empathy — and therefore, action — in today’s decision-makers.
It’s critical for security professionals to identify the narrative thread in the metrics they’re analyzing. Here’s what we mean by that, step by step and metric by metric.
Establish how hungry the bad guys are
Hone in on the frequency of security incidents. This metric directly correlates to the power and reach threat actors have. Dive into the causes behind incidents, how much impact incidents had, and what can be done to stop them.
This information gives executives direct insight into the potential risks your organization faces and the negative outcomes associated with them. When executives can see the cold hard number of times their organizations have suffered from a breach, attack, or leak, it can highlight where security strategies are still lacking — and where they’re losing out to malicious actors.
Show how the villains keep winning
MTTD (mean time to detection) is a measure of how fast security teams can detect incidents. While it might not be a flashy metric in and of itself, it can pack a powerful punch when illustrating the damage bad actors can do before they’re suspected of even breaking in.
MTTD provides insight into the efficacy of an organization’s current cybersecurity tools and data coverage. It can also be a helpful indicator of how well current security processes are working — and how overworked or resource-strained a security team might be.
Tell the underdog’s story
Here’s where you leverage MTTR (mean time to respond). This metric shows how quickly the security team can spring into action. More often than not, security teams have a litany of other important tasks at hand that can make MTTR less than ideal. This demonstrates why resource-strained and overworked security professionals are set up to fail if they don’t have the right tools, strategies, and support.
With MTTR, security teams can add an extra layer of context to the data shown by MTTD. This metric highlights how quickly security teams respond to incidents — which can be another indicator of how well tools and processes match up to current threats.
Describe the loot you stand to lose
Finally, communicate the potential cost per incident. Money speaks volumes when you’re crafting a narrative out of SecOps metrics — so it’s best to close out your stories with this powerful data point. This metric provides insight into the efficiency of a cybersecurity program’s processes, tools, and resource allocation.
This is perhaps the most effective metric security professionals can use with executives because it speaks directly to one of their critical concerns: the bottom line.
Putting it all together
While many additional SecOps metrics matter, those four data points can come together most effectively to weave a story that speaks to C-level execs.
However, executives will have their own set of questions and concerns at SecOps briefs. So, it’s important to supplement even the strongest SecOps stories with additional answers, such as:
- How efficiently your organization is addressing risks compared to other similar companies.
- Where budget spend works and where it doesn’t in terms of ROI.
- Where opportunities for increased efficiencies (namely, breaking down disparate silos and cutting costs with consolidation) can come into play.
It all comes down to communication
By focusing on crafting data narratives, security teams can turn SecOps metrics into actionable decisions for stakeholders. Telling the right story to the right people can help procure backing from the top — which means getting the resources, people, and budget security leaders need to stay ahead of threats.
Effectively communicating with C-levels helps build a rapport between stakeholders and boots-on-the-ground security professionals. By presenting metrics as parts of a larger story, organizations can unlock better collaboration, better relationships, and better business outcomes.
All while keeping threat actors in check.
Want to learn more about creating SecOps narratives that pack a punch? Download Presenting Upward: How to Showcase SecOps Metrics That Matter now.
Zabbix in: exploratory data analysis rehearsal – Part 3
Post Syndicated from Paulo R. Deolindo Jr. original https://blog.zabbix.com/zabbix-in-exploratory-data-analysis-rehearsal-part-2-2/26266/
Abstract
This will be the last blog post of the “Zabbix in… exploratory data analysis rehearsal” series. To continue our initial proposal, we’ll close the third and fourth data distribution moments concept. This time, we’ll talk about Skewness and Kurtosis.
Remember the first and second articles of the series to be aware of what we are discussing here.
The four moments for a data distribution
While the first moment helps us with the location estimate for some data distribution, the second moment works with its variance. The third moment, called asymmetry, allows us to understand the value trends and the degree of the asymmetry. The fourth moment is called kurtosis and is about the probability of the peak’s existence (outliers).
These four moments are not the final study about the data distribution. There is so much to learn and apply to data science when considering statistical concepts, but for now we must finish the initial proposal and bring forward some insights for decision makers.
Let’s get started!
Asymmetry
Based on our web application scenario, we can see a certain asymmetry in response time in most cases. This is normal and expected – so far, no problems. But it is also true that some symmetry is also possible in certain cases. Again, no problems here.
So, where is the problem? When does it happen?
Sometimes, the web application response time can be too different from the previous one, and we have no control over it. In these cases, the outliers must be found, and the correct interpretation must be applied. At that point, we must consider anomalies in the environment. Sometimes, the outliers are just a deviation. In all cases, we must pay attention and monitor the metrics that can make the difference.
Speaking of asymmetry – why is this topic so special? One of the possible answers is that we need to understand the degree of the asymmetry – whether it is high or moderated and whether the values were in most cases smaller than or bigger than the mean or median. In other words, what does the asymmetry say about the web application performance?
Let’s check some implementations.
The key skewness
From version 6.0, Zabbix introduced the item key skewness.
For example, it can be used like this:
skewness(/host/key,1h) # the skewness for the last hour until now
Now, let’s see how this formula could be applied to our scenario:
skewness(//net.tcp.service.perf[http,”{HOST.CONN}”,”{$NGINX.STUB_STATUS.PORT}”],1h:now/h)
Using skewness and time shift “1h:now/h”, we are looking for some web application response time asymmetry at the previous hour.
The asymmetry can be negative (left skew), zero, positive (right skew) or undefined.

Definition: a left-skewed distribution is longer on the left side of its peak than on its right. In other words, a left-skewed distribution has a long tail on its left side.
Considering a left skew, it is possible to state that at the previous hour, the web application had more higher values than smaller values. This means that our web application does not perform as well as it should.

Look at the graph above. You can see some bars on the left side of the mean and other bars on the right side of the mean, with the same size as a mirror. We can consider this a normal distribution for web application response time, but it does not mean that the response times were good or bad – it only means that they had some balance and suggests more investigation.

Definition: a right-skewed distribution is longer on the right side of its peak than on its left. In other words, a right-skewed distribution has a long tail on its right side.
Considering a right skew, it is possible to state that at the previous hour, the web application had more smaller values than higher values. This means our web application performs as expected.
Value Map for Skewness
You must create in your template the following value map:

If you wish, the value map can also be as below:
“is greater than or equals” 0.1 à Mais tempos bons, se comparados à média
“equals” 0 à Tempos de resposta simétricos ou bem distribuídos em bons e ruins
“is less than or equals” 0 à Mais tempos ruins, se comparados à média
Pearson Skewness Coefficient
The Pearson’s Coefficient is a very interesting indicator. Considering some skewness for a data distribution, it tells us if the asymmetry is strong or only moderate.
We can create a calculated item for the Pearson’s Coefficient:
(3*(avg-median))/stddevpop
In Zabbix, we need:
- One item for the response time average considering the previous hour:
- Key: resp.time.previous.hour
- Formula: trendavg(//net.tcp.service.perf[http,”{HOST.CONN}”,”{$NGINX.STUB_STATUS.PORT}”],1h:now/h)
- One item for calculating the median (for percentile, see the previous blog post):
- Key: response.time.previous.hour
- Formula: (last(//p51.previous.hour)+last(//p50.previous.hour))/2
- One item for the standard deviation calculation:
- Key:
- Formula: response.time.previous.hour stddevpop(//net.tcp.service.perf[http,”{HOST.CONN}”,”{$NGINX.STUB_STATUS.PORT}”],1h:now/h)
- Key:
- Key: response.time.previous.hour
- Key: resp.time.previous.hour
Finally, a calculated item for a Pearson’s Coefficient:
- Key: coefficient.requests.previous.hour
- Formula:
((last(//trendavg.requests.per.minute)-
last(//median.access.previous.hour))*3)
/
last(//stddevpop.requests.previous.hour)
- Formula:
To finish the exercise, create a value map:

Curtose
Kurtosis is the fourth data distribution and can indicate if the values are prone to peaks.
In Zabbix, you can implement or calculate kurtosis with other calculated items:
kurtosis(/host/key,1h)
Um valor negativo de curtose nos diz que a distribuição não está propensa ou produziu poucos outliers. Já um valor positivo de curtose nos diz que a distribuição está propensa ou produziu muitos outliers. Tudo gira em torno da média da distribuição de dados. Já um valor neutro, ou zero, nos diz que a distribuição é considerada simétrica.
Para nosso cenário web, temos:
kurtosis(//net.tcp.service.perf[http,”{HOST.CONN}”,”{$NGINX.STUB_STATUS.PORT}”],1h:now/h)
Explanatory Dashboard

Considering the image above, the data distribution for the web application response time at the previous hour has a left skew. This suggests that, when considering the response time mean at the previous hour, there were more higher values than smallest values. That’s sad – our web application performed poorly. Why?
However, because the skewness was moderated (considering the Pearson’s Coefficient), it means that the response time values were not so different from the others at the same hour.
As for kurtosis, we can say that the data distribution is prone to peaks because we have positive kurtosis. In basic statistics, the values are near the mean and there is a high probability of producing outliers.
This is a point to pay attention to if you are looking at a critical service.
Looking at other metrics
To check and validate our interpretation, let’s visualize the collected values on a simple Zabbix graph, using a graph widget.
Please consider using the following “time period” configuration:

The graph will show only the data collected at the previous hour – in this case, from 11:00 to 11:59.

The graph in Zabbix allows us to visualize the 50th percentile as well. We do not display the mean on the graph because it wouldn’t be well represented visually as it was collected only once, thus lacking an interesting visual trend line like the 50th percentile. However, notice that the mean and the 50th percentile values are very close, which will give us an idea of the data distribution around this measure.
Partial Conclusion
Skewness and Kurtosis, respectively, are the third and fourth moments of a data distribution. They help us understand the environment’s behavior and allow us to gain insight into a lot of things (in this case, we simply applied these concepts to IT infrastructure monitoring and focused on our web application to analyze its performance).
In most cases, the asymmetry will exist – it’s normal and expected. However, knowing some properties of the skewness can help us understand the response times, indicating good or poor performance. The skewness coefficient allows us to know if the asymmetry was strong or just moderated. Meanwhile, kurtosis helps us to understand if the data distribution produced some peaks considering an observation period or whether it is prone to produce peaks. We can then create some triggers for that and avoid some undesirable behaviors in the future, based on our data distribution observation. This is applied data science at its best.
Conclusion
Data science can be easily applied to (and bring up insights about) Zabbix and its Aggregate functions. It’s true that there are some special functions such as skewness, kurtosis, stddevpop, stddevsamp, mad, and so on, but there are old functions to help us too, such as percentile, forecast, timeleft, etc. All these functions must be used in calculated item formulas.
One of the interesting advantages of using Zabbix in data science and performing an exploratory data analysis is the fact that Zabbix can monitor everything. This means that the database already exists with the relevant date to analyze, in real time.
In the blog posts in this series, we took as a basis some data referring to the previous hour, the previous day, and so on, but we did nothing regarding the current hour. If we applied the concepts studied in real time data, we would have other “live” results, including support for decision-making. This is because we will not only study historical data, but instead will have the opportunity to change the course of events.
Zabbix is improving dashboards significantly. From Zabbix 6.4, we have many new out-of-the-box widgets and the possibility to create our own. However, there is a concern – Zabbix administrators sometimes show unnecessary data in dashboards, which can cloud the decision-making process. Zabbix administrators, in general, might want to learn storytelling techniques to rectify this situation. Maybe in a perfect world!
I hope you have enjoyed this blog post series.
Keep studying!
The post Zabbix in: exploratory data analysis rehearsal – Part 3 appeared first on Zabbix Blog.
Hacking AI Resume Screening with Text in a White Font
Post Syndicated from Bruce Schneier original https://www.schneier.com/blog/archives/2023/08/hacking-ai-resume-screening-with-text-in-a-white-font.html
The Washington Post is reporting on a hack to fool automatic resume sorting programs: putting text in a white font. The idea is that the programs rely primarily on simple pattern matching, and the trick is to copy a list of relevant keywords—or the published job description—into the resume in a white font. The computer will process the text, but humans won’t see it.
Clever. I’m not sure it’s actually useful in getting a job, though. Eventually the humans will figure out that the applicant doesn’t actually have the required skills. But…maybe.
We need a new FTZ Adapter Nikon!
Post Syndicated from Matt Granger original https://www.youtube.com/watch?v=ELE90Sw3u3g
Now Open – AWS Israel (Tel Aviv ) Region
Post Syndicated from Channy Yun original https://aws.amazon.com/blogs/aws/now-open-aws-israel-tel-aviv-region/
In June 2021, Jeff Barr announced the upcoming AWS Israel (Tel Aviv) Region. Today we’re announcing the general availability of the AWS Israel (Tel Aviv) Region, with three Availability Zones and the il-central-1 API name.

The new Tel Aviv Region gives customers an additional option for running their applications and serving users from data centers located in Israel. Customers can securely store data in Israel while serving users in the vicinity with even lower latency.
AWS Services in the AWS Israel (Tel Aviv) Region
In the new Tel Aviv Region, you can use C5, C5d, C6g, C6gn, C6i, C6id, D3, G5, I3, I3en, I4i, M5, M5d, M6g, M6gd, M6i, M6id, P4de (public preview only), R5, R5d, R6g, R6i, R6id, T3, T3a, T4g instances, and a long list of AWS services including: Amazon API Gateway, AWS AppConfig, AWS Application Auto Scaling, Amazon Aurora, Aurora PostgreSQL, AWS Budgets, AWS Certificate Manager, AWS CloudFormation, Amazon Cloudfront, AWS Cloud Map, AWS CloudTrail, Amazon CloudWatch, Amazon CloudWatch Events, Amazon CloudWatch Logs, AWS CodeBuild, AWS CodeDeploy, AWS Config, AWS Cost Explorer, AWS Database Migration Service, AWS Direct Connect, AWS Directory Service, Amazon DynamoDB, Amazon Elastic Block Store (Amazon EBS), Amazon Elastic Compute Cloud (Amazon EC2), Amazon EC2 Auto Scaling, EC2 Image Builder, Amazon Elastic Container Registry (Amazon ECR), Amazon Elastic Container Service (Amazon ECS), Amazon Elastic Kubernetes Service, Amazon ElastiCache, AWS Elastic Beanstalk, Elastic Load Balancing, Elastic Load Balancing – Network (NLB), Amazon EMR, Amazon EventBridge, AWS Fargate, Glacier, AWS Health Dashboard, AWS Identity and Access Management (IAM), Amazon Kinesis Data Streams, Amazon Kinesis Data Firehose, AWS Key Management Service (AWS KMS), AWS Lambda, AWS Marketplace, AWS Mobile SDK for iOS and Android, Amazon OpenSearch Service, AWS Organizations, Amazon Redshift, AWS Resource Access Manager, Amazon Relational Database Service (Amazon RDS), Resource Groups, Amazon Route 53, Amazon Virtual Private Cloud (Amazon VPC), AWS Secrets Manager, AWS Shield Standard, AWS Shield Advanced, Amazon Simple Notification Service (Amazon SNS), Amazon Simple Queue Service (Amazon SQS), Amazon Simple Storage Service (Amazon S3), Amazon Simple Workflow Service (Amazon SWF), AWS Step Functions, AWS Support API, AWS Systems Manager, AWS Trusted Advisor, VM Import/Export, AWS VPN, AWS WAF, and AWS X-Ray.
AWS in Israel
According to the Israel Ministry of Economic Industry, Israel is in the front line of the cloud computing era and “is known to be the ‘start-up nation’ of the number of global start-ups being produced. Over the past decade, Israel has produced over 2,000 start-ups, the majority of these start-ups are driven by software as a service (SaaS). Israeli cloud technology remains a strong promise in the market as new start-ups are continuously penetrating the market.”
AWS began supporting startups in Israel in 2013 through its AWS Activate program. In Israel, AWS works with accelerator organizations such as 8200 EISP, F2 Venture Capital – thejunction, and TechStars as well as venture capital firms like Entrée Capital, Bessemer Venture Partners, Pitango, Vertex Ventures Israel, and Viola Group to support the rapid growth of their portfolio companies.
Back in 2014, we opened an AWS office and a research and development (R&D) center in Israel. Since then, Amazon has expanded its R&D presence in the country, which now includes Prime Air and Alexa Shopping.
In 2015, AWS acquired Annapurna Labs, an Israeli microelectronics company, which has developed advanced compute, networking, security, and storage technologies for AWS—such as AWS-designed Graviton processors, AWS Inferentia, AWS Trainium chips, and the AWS Nitro System.
In 2018, we expanded to new offices in Tel Aviv, including AWS Experience Tel Aviv on Floor28 to support the growth of Israeli startups, enterprises, and government customers through technology-focused events and educational activities. Now, AWS Experience Tel Aviv on Floor28 is an education hub where anyone interested in AWS can attend industry events, workshops, and meetups, and receive free, in-person technical and business guidance from AWS experts.
In 2019, we launched the first AWS infrastructure in Israel, opening an Amazon CloudFront edge location. In 2020, we brought AWS Outposts and AWS Direct Connect to Israel, providing Israeli organizations with the ability to run AWS technology in their own data centers and establish dedicated connections back to the AWS Cloud.
In April 2021, the government of Israel announced that it had selected AWS as its primary cloud provider as part of the Nimbus contract. The Nimbus framework will enable government departments—including the ministries, education, healthcare, and municipalities—to accelerate their digital transformation by using AWS technologies.
AWS continues to invest in upskilling local developers, students, and the next generation of IT leaders in Israel through programs such as AWS Educate, AWS Academy, AWS re/Start, and other Training and Certification programs.
AWS Educate and Academy programs are providing free resources to accelerate cloud-related learning and preparing today’s students in Israel for the jobs of the future. Israel colleges already participating in the AWS Academy program include the Bar Ilan University, Ben-Gurion University of the Negev, Holon Institute of Technology, Jerusalem College of Technology, and University of Haifa. We also launched AWS re/Start to focus on helping unemployed or underemployed individuals to launch a new cloud career. You can now apply to AWS re/Start programs through Appleseeds, Sigma Labs Jerusalem, and Analiza Cyber Intelligence in Israel.
AWS Customers in Israel
We have many amazing customers in Israel who are doing incredible things with AWS, for example:
AI21 Labs – AI21 Labs offers access to its state-of-the-art proprietary language models through AI21 Studio for businesses to build their own generative artificial intelligence applications, as well as its consumer product, Wordtune, the first AI-based writing assistant to understand context and meaning. AI21 Labs scaled to hundreds of GPUs efficiently and cost effectively to build the Jurassic-2 family of language models. These models were trained with distributed and parallelized infrastructure based on Amazon EC2 P4d instances 400 Gbps high-performance networking supported by Elastic Fabric Adaptor (EFA).
Bank Leumi – Leumi is one of the leading banks in Israel and has over 200 branches across the country and dedicated teams using AWS to build an advanced banking services marketplace. In just 5 months, Leumi migrated 16 on-premises applications from its former Kubernetes solution to Amazon EKS Anywhere with no service interruptions. The bank’s new environment facilitates a consistent, scalable approach to deployments, saving time and money and increasing innovation velocity.
CyberArk – CyberArk is an AWS partner in the identity security industry. Centered on privileged access management, CyberArk provides the most comprehensive security SaaS offering on AWS for any identity—human or machine—across business applications, distributed workforces, hybrid cloud workloads, and throughout the DevOps lifecycle. CyberArk Identity Security Intelligence has integrated with AWS CloudTrail Lake to increase visibility and responsiveness associated with targeted threats. CyberArk Audit also delivers security event information to Amazon Security Lake.
Ichilov Hospital – The I-Medata Innovation Center of Ichilov Hospital uses AWS Control Tower to facilitate the fast, consistent, and secure creation of AWS accounts while protecting sensitive medical data. The center also relies on Amazon SageMaker to enable its scientists to build, train, and deploy advanced machine learning models for early detection of deterioration in COVID-19 patients. They had full protection of sensitive medical data on AWS while continuing to enable the productivity of researchers.
You can find more customer stories from Israel.
Available Now
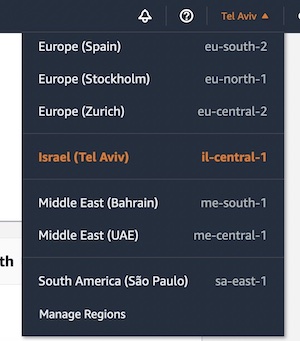 The new Tel Aviv Region is ready to support your business. You can find a detailed list of the services available in this Region on the AWS Regional Services List.
With this launch, AWS now spans 102 Availability Zones in 32 geographic Regions around the world. We have also announced plans for 12 more Availability Zones and four more Regions in Canada, Malaysia, New Zealand, and Thailand.
To learn more, see the Global Infrastructure page, give it a try, and send feedback through your usual AWS support contacts in Israel.
— Channy
P.S. We’re focused on improving our content to provide a better customer experience, and we need your feedback to do so. Please take this quick survey to share insights on your experience with the AWS Blog. Note that this survey is hosted by an external company, so the link does not lead to our website. AWS handles your information as described in the AWS Privacy Notice.
Nikon Zf Preview
Post Syndicated from Matt Granger original https://www.youtube.com/watch?v=LVjQQ3IJrjk
Comic for 2023.08.01 – One Millionth Customer
Post Syndicated from Explosm.net original https://explosm.net/comics/one-millionth-customer
New Cyanide and Happiness Comic
AWS Week in Review – Agents for Amazon Bedrock, Amazon SageMaker Canvas New Capabilities, and More – July 31, 2023
Post Syndicated from Donnie Prakoso original https://aws.amazon.com/blogs/aws/aws-week-in-review-agents-for-amazon-bedrock-amazon-sagemaker-canvas-new-capabilities-and-more-july-31-2023/
This July, AWS communities in ASEAN wrote a new history. First, the AWS User Group Malaysia recently held the first AWS Community Day in Malaysia.

Another significant milestone has been achieved by the AWS User Group Philippines. They just celebrated their tenth anniversary by running 2 days of AWS Community Day Philippines. Here are a few photos from the event, including Jeff Barr sharing his experiences attending AWS User Group meetup, in Manila, Philippines 10 years ago.

Big congratulations to AWS Community Heroes, AWS Community Builders, AWS User Group leaders and all volunteers who organized and delivered AWS Community Days! Also, thank you to everyone who attended and help support our AWS communities.
Last Week’s Launches
We had interesting launches last week, including from AWS Summit, New York. Here are some of my personal highlights:
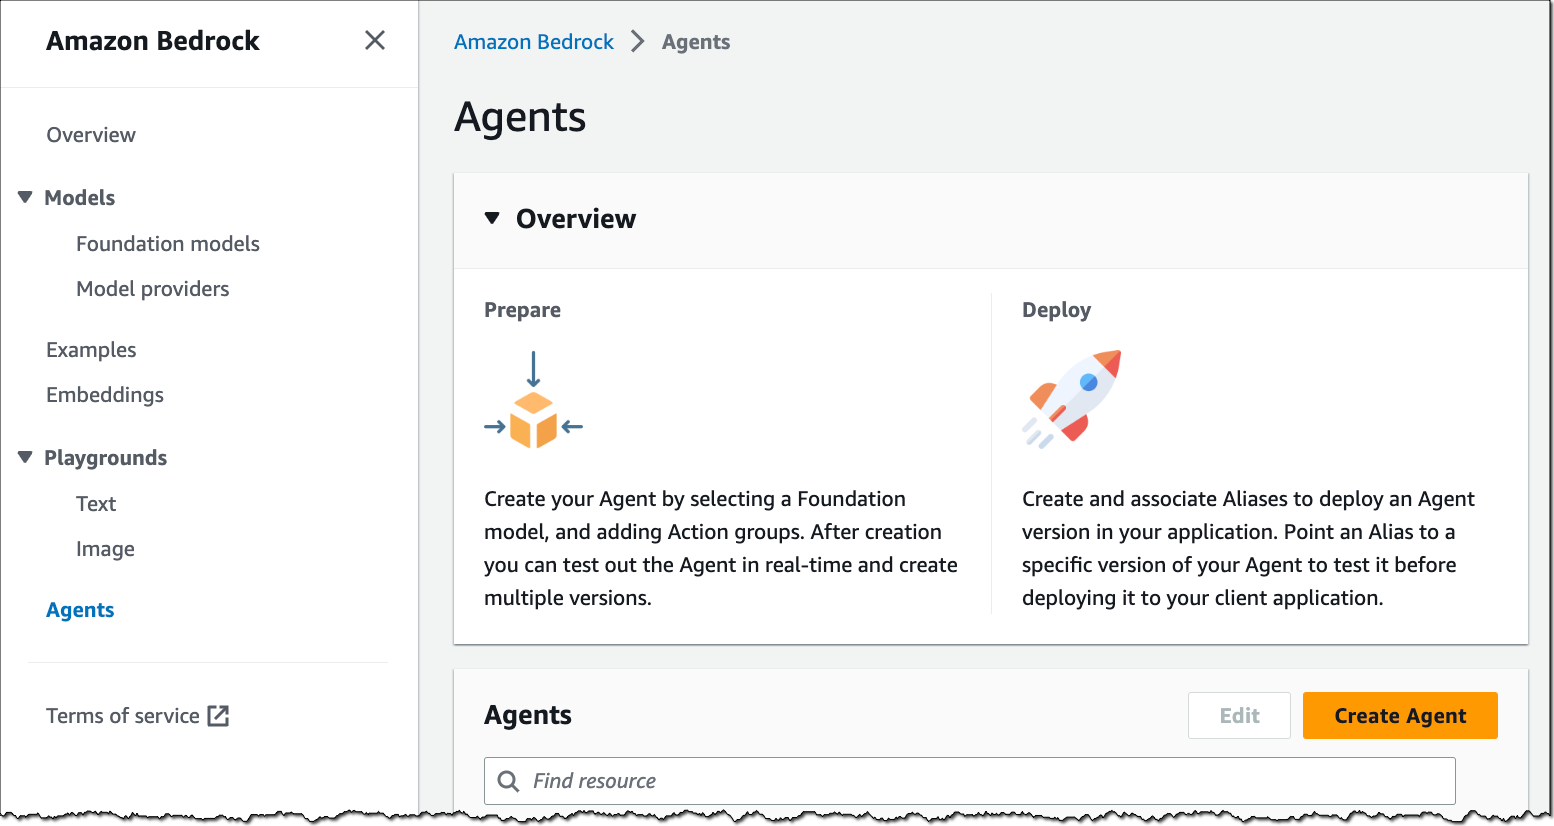
(Preview) Agents for Amazon Bedrock – You can now create managed agents for Amazon Bedrock to handle tasks using API calls to company systems, understand user requests, break down complex tasks into steps, hold conversations to gather more information, and take actions to fulfill requests.
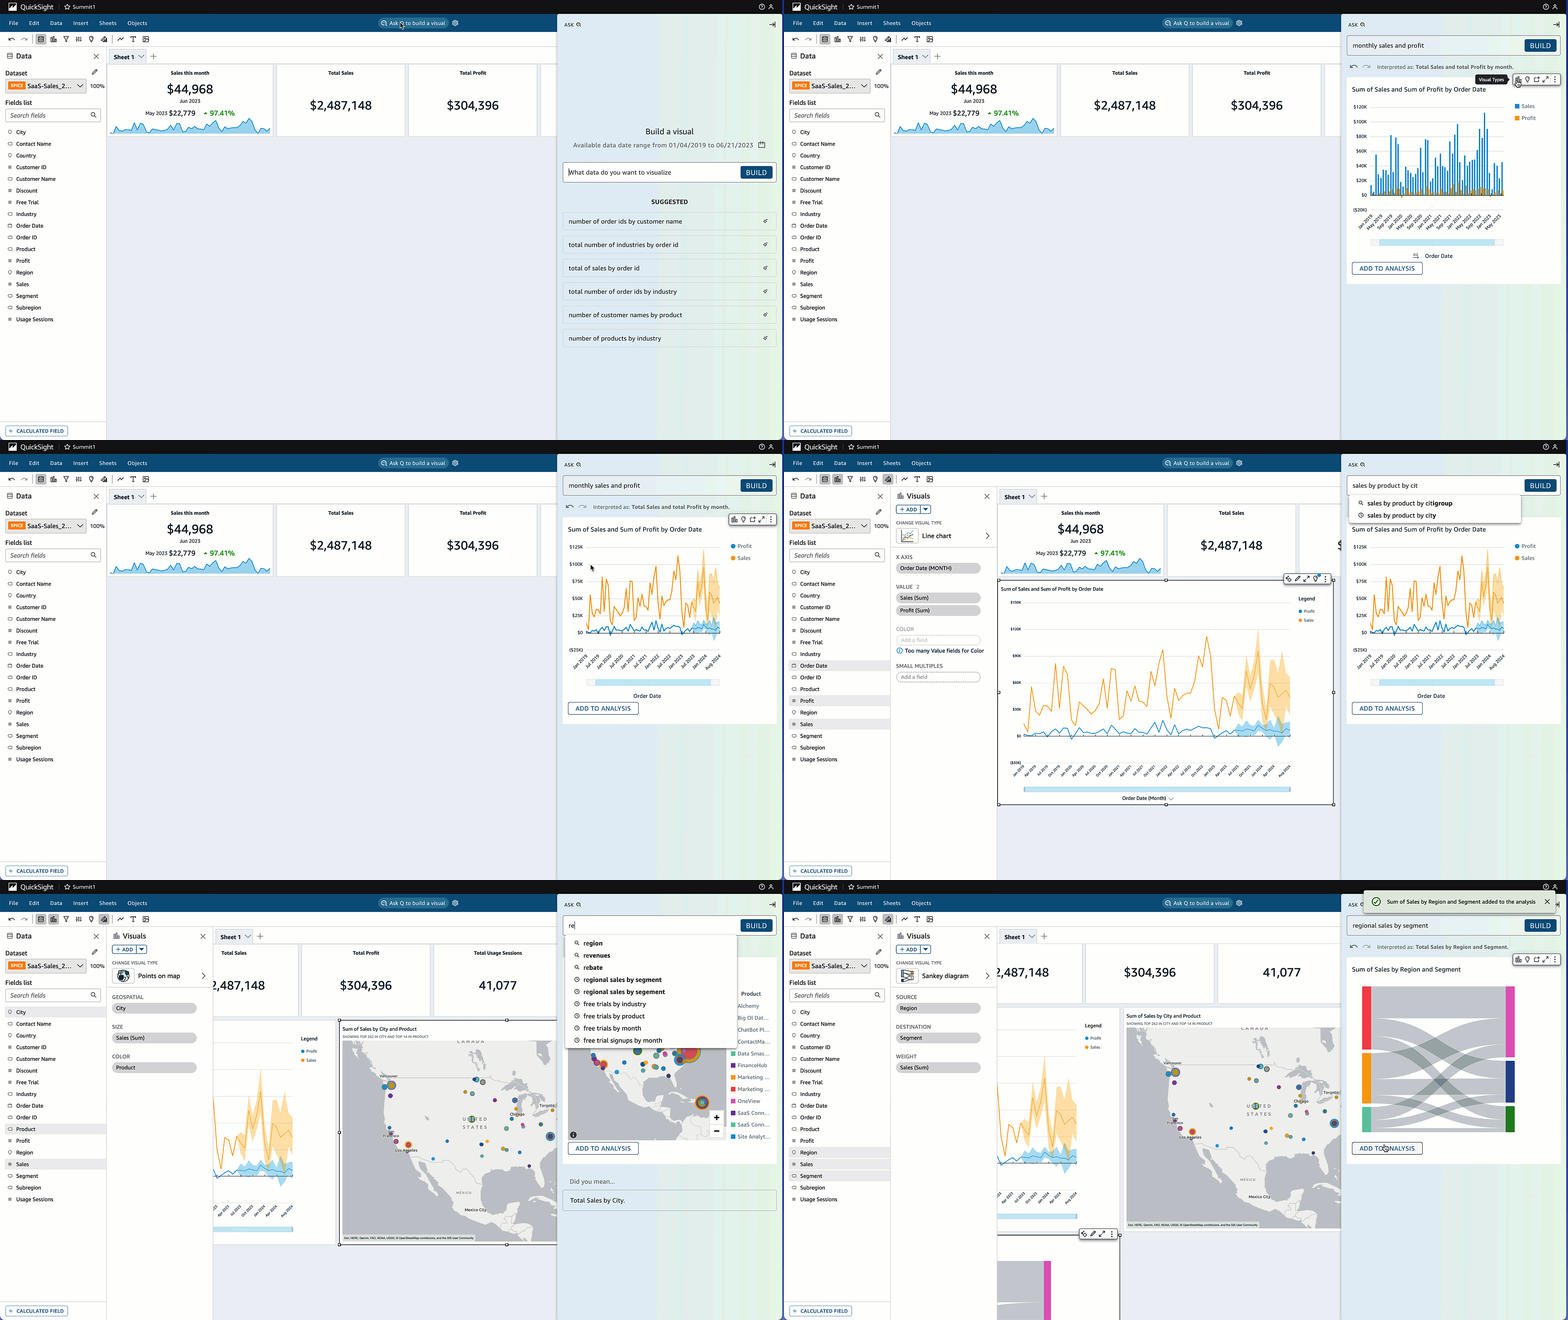
(Coming Soon) New LLM Capabilities in Amazon QuickSight Q – We are expanding the innovation in QuickSight Q by introducing new LLM capabilities through Amazon Bedrock. These Generative BI capabilities will allow organizations to easily explore data, uncover insights, and facilitate sharing of insights.
AWS Glue Studio support for Amazon CodeWhisperer – You can now write specific tasks in natural language (English) as comments in the Glue Studio notebook, and Amazon CodeWhisperer provides code recommendations for you.

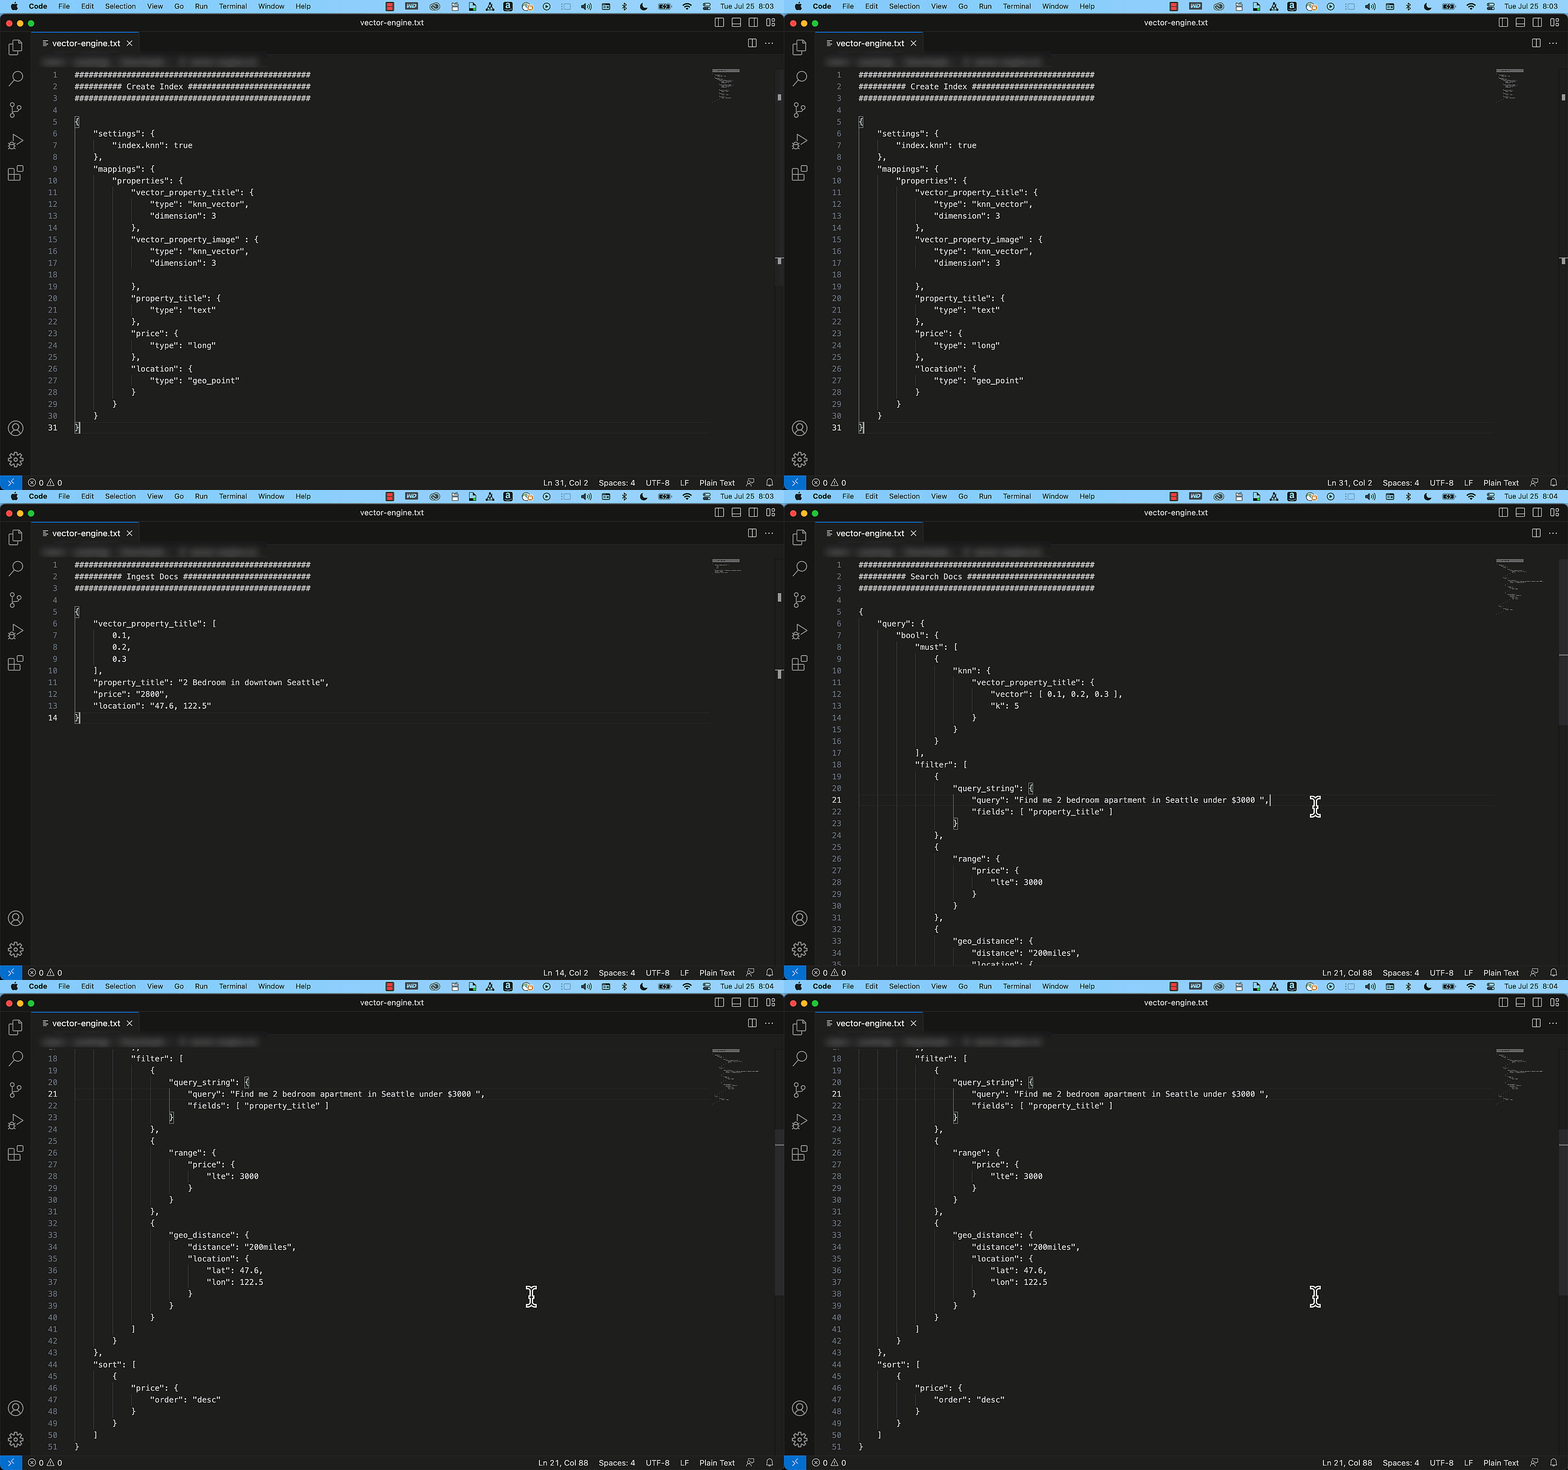
(Preview) Vector Engine for Amazon OpenSearch Serverless – This capability empowers you to create modern ML-augmented search experiences and generative AI applications without the need to handle the complexities of managing the underlying vector database infrastructure.
Last week, Amazon SageMaker Canvas also released a set of new capabilities:
- Training ML models with different objective metrics
- Sharing ML models with Amazon QuickSight
- Custom Amazon S3 output location for ML artifacts
- Document queries powered by Amazon Textract
AWS Open-Source Updates
As always, my colleague Ricardo has curated the latest updates for open-source news at AWS. Here are some of the highlights.
cdk-aws-observability-accelerator is a set of opinionated modules to help you set up observability for your AWS environments with AWS native services and AWS-managed observability services such as Amazon Managed Service for Prometheus, Amazon Managed Grafana, AWS Distro for OpenTelemetry (ADOT) and Amazon CloudWatch.
iac-devtools-cli-for-cdk is a command line interface tool that automates many of the tedious tasks of building, adding to, documenting, and extending AWS CDK applications.
Upcoming AWS Events
There are upcoming events that you can join to learn. Let’s start with AWS events:
- AWS Storage Day (August 9)
- AWS Summit Taiwan (August 2-3)
- AWS Summit São Paulo (August 3)
- AWS Summit Mexico City (August 30)
And let’s learn from our fellow builders and join AWS Community Days:
- AWS Community Day Colombia (August 12)
- AWS Community Day West Africa (August 19)
Open for Registration for AWS re:Invent
We want to be sure you know that AWS re:Invent registration is now open!
This learning conference hosted by AWS for the global cloud computing community will be held from November 27 to December 1, 2023, in Las Vegas.
Pro-tip: You can use information on the Justify Your Trip page to prove the value of your trip to AWS re:Invent trip.
Give Us Your Feedback
We’re focused on improving our content to provide a better customer experience, and we need your feedback to do so. Please take this quick survey to share insights on your experience with the AWS Blog. Note that this survey is hosted by an external company, so the link does not lead to our website. AWS handles your information as described in the AWS Privacy Notice.
That’s all for this week. Check back next Monday for another Week in Review.
Happy building!
— Donnie
P.S. We’re focused on improving our content to provide a better customer experience, and we need your feedback to do so. Please take this quick survey to share insights on your experience with the AWS Blog. Note that this survey is hosted by an external company, so the link does not lead to our website. AWS handles your information as described in the AWS Privacy Notice.
Perform continuous vulnerability scanning of AWS Lambda functions with Amazon Inspector
Post Syndicated from Manjunath Arakere original https://aws.amazon.com/blogs/security/perform-continuous-vulnerability-scanning-of-aws-lambda-functions-with-amazon-inspector/
This blog post demonstrates how you can activate Amazon Inspector within one or more AWS accounts and be notified when a vulnerability is detected in an AWS Lambda function.
Amazon Inspector is an automated vulnerability management service that continually scans workloads for software vulnerabilities and unintended network exposure. Amazon Inspector scans mixed workloads like Amazon Elastic Compute Cloud (Amazon EC2) instances and container images located in Amazon Elastic Container Registry (Amazon ECR). At re:Invent 2022, we announced Amazon Inspector support for Lambda functions and Lambda layers to provide a consolidated solution for compute types.
Only scanning your functions for vulnerabilities before deployment might not be enough since vulnerabilities can appear at any time, like the widespread Apache Log4j vulnerability. So it’s essential that workloads are continuously monitored and rescanned in near real time as new vulnerabilities are published or workloads are changed.
Amazon Inspector scans are intelligently initiated based on the updates to Lambda functions or when new Common Vulnerabilities and Exposures (CVEs) are published that are relevant to your function. No agents are needed for Amazon Inspector to work, which means you don’t need to install a library or agent in your Lambda functions or layers. When Amazon Inspector discovers a software vulnerability or network configuration issue, it creates a finding which describes the vulnerability, identifies the affected resource, rates the severity of the vulnerability, and provides remediation guidance.
In addition, Amazon Inspector integrates with several AWS services, such as Amazon EventBridge and AWS Security Hub. You can use EventBridge to build automation workflows like getting notified for a specific vulnerability finding or performing an automatic remediation with the help of Lambda or AWS Systems Manager.
In this blog post, you will learn how to do the following:
- Activate Amazon Inspector in a single AWS account and AWS Region.
- See how Amazon Inspector automated discovery and continuous vulnerability scanning works by deploying a new Lambda function with a vulnerable package dependency.
- Receive a near real-time notification when a vulnerability with a specific severity is detected in a Lambda function with the help of EventBridge and Amazon Simple Notification Service (Amazon SNS).
- Remediate the vulnerability by using the recommendation provided in the Amazon Inspector dashboard.
- Activate Amazon Inspector in multiple accounts or Regions through AWS Organizations.
Solution architecture
Figure 1 shows the AWS services used in the solution and how they are integrated.
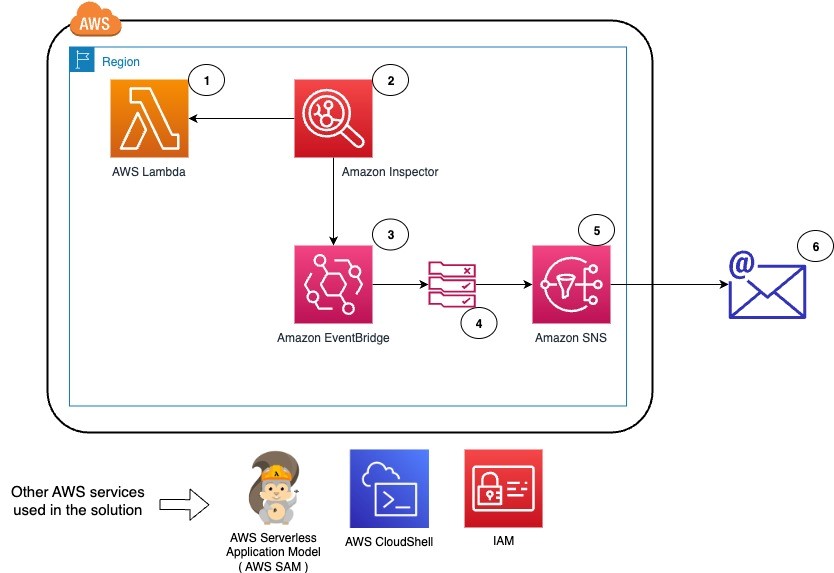
Figure 1: Solution architecture overview
The workflow for the solution is as follows:
- Deploy a new Lambda function by using the AWS Serverless Application Model (AWS SAM).
- Amazon Inspector scans when a new vulnerability is published or when an update to an existing Lambda function or a new Lambda function is deployed. Vulnerabilities are identified in the deployed Lambda function.
- Amazon EventBridge receives the events from Amazon Inspector and checks against the rules for specific events or filter conditions.
- In this case, an EventBridge rule exists for the Amazon Inspector findings, and the target is defined as an SNS topic to send an email to the system operations team.
- The EventBridge rule invokes the target SNS topic with the event data, and an email is sent to the confirmed subscribers in the SNS topic.
- The system operations team receives an email with detailed information on the vulnerability, the fixed package versions, the Amazon Inspector score to prioritize, and the impacted Lambda functions. By using the remediation information from Amazon Inspector, the team can now prioritize actions and remediate.
Prerequisites
To follow along with this demo, we recommend that you have the following in place:
- An AWS account.
- A command line interface: AWS CloudShell or AWS CLI. In this post, we recommend the use of CloudShell because it already has Python and AWS SAM. However, you can also use your CLI with AWS CLI, SAM, and Python.
- An AWS Region where Amazon Inspector Lambda code scanning is available.
- An IAM role in that account with administrator privileges.
The solution in this post includes the following AWS services: Amazon Inspector, AWS Lambda, Amazon EventBridge, AWS Identity and Access Management (IAM), Amazon SNS, AWS CloudShell and AWS Organizations for activating Amazon Inspector at scale (multi-accounts).
Step 1: Activate Amazon Inspector in a single account in the Region
The first step is to activate Amazon Inspector in your account in the Region you are using.
To activate Amazon Inspector
- Sign in to the AWS Management Console.
- Open AWS CloudShell. CloudShell inherits the credentials and permissions of the IAM principal who is signed in to the AWS Management Console. CloudShell comes with the CLIs and runtimes that are needed for this demo (AWS CLI, AWS SAM, and Python).
- Use the following command in CloudShell to get the status of the Amazon Inspector activation.
- Use the following command to activate Inspector in the default Region for resource type LAMBDA. Other allowed values for resource types are EC2, ECR and LAMDA_CODE.
- Use the following command to verify the status of the Amazon Inspector activation.
You should see a response that shows that Amazon Inspector is enabled for Lambda resources, as shown in Figure 2.
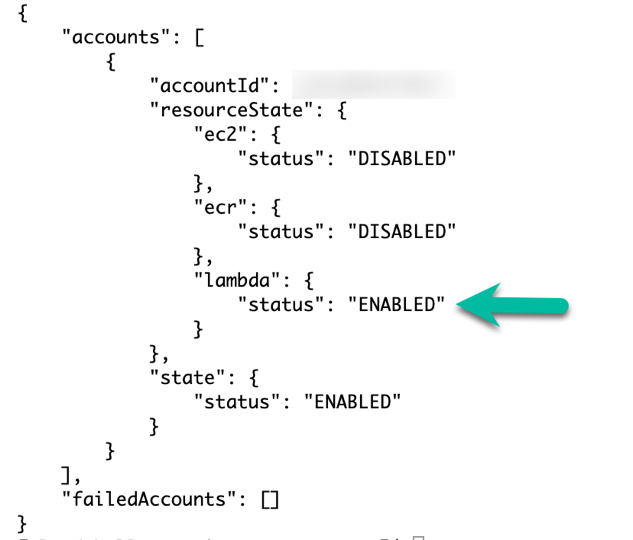
Figure 2: Amazon Inspector status after you enable Lambda scanning
Step 2: Create an SNS topic and subscription for notification
Next, create the SNS topic and the subscription so that you will be notified of each new Amazon Inspector finding.
To create the SNS topic and subscription
- Use the following command in CloudShell to create the SNS topic and its subscription and replace <REGION_NAME>, <AWS_ACCOUNTID> and <[email protected]> by the relevant values.
- Check the email inbox you entered for <[email protected]>, and in the email from Amazon SNS, choose Confirm subscription.
- In the CloudShell console, use the following command to list the subscriptions, to verify the topic and email subscription.
You should see a response that shows subscription details like the email address and ARN, as shown in Figure 3.

Figure 3: Subscribed email address and SNS topic
- Use the following command to send a test message to your subscribed email and verify that you receive the message by replacing <REGION_NAME> and <AWS_ACCOUNTID>.

Step 3: Set up Amazon EventBridge with a custom rule and the SNS topic as target
Create an EventBridge rule that will invoke your previously created SNS topic whenever Amazon Inspector finds a new vulnerability with a critical severity.
To set up the EventBridge custom rule
- In the CloudShell console, use the following command to create an EventBridge rule named amazon-inspector-findings with filters InspectorScore greater than 8 and severity state set to CRITICAL.
Refer to the topic Amazon EventBridge event schema for Amazon Inspector events to customize the event pattern for your application needs.
- To verify the rule creation, go to the EventBridge console and in the left navigation bar, choose Rules.
- Choose the rule with the name amazon-inspector-findings. You should see the event pattern as shown in Figure 4.
Figure 4: Event pattern for the EventBridge rule to filter on CRITICAL vulnerabilities.
- Add the SNS topic you previously created as the target to the EventBridge rule. Replace <REGION_NAME>, <AWS_ACCOUNTID>, and <RANDOM-UNIQUE-IDENTIFIER-VALUE> with the relevant values. For RANDOM-UNIQUE-IDENTIFIER-VALUE, create a memorable and unique string.
Important: Save the target ID. You will need this in order to delete the target in the last step.
- Provide permission to enable Amazon EventBridge to publish to SNS topic amazon-inspector-findings-notifier

Step 4: Deploy the Lambda function to the AWS account by using AWS SAM
In this step, you will use Serverless Application Manager (SAM) quick state templates to build and deploy a Lambda function with a vulnerable library, in order to generate findings. Learn more about AWS SAM.
To deploy the Lambda function with a vulnerable library
- In the CloudShell console, use a prebuilt “hello-world” AWS SAM template to deploy the Lambda function.
- Use the following command to add the vulnerable package python-jwt==3.3.3 to the Lambda function.
- Use the following command to build the application.
- Use the following command to deploy the application with the guided option.
This command packages and deploys the application to your AWS account. It provides a series of prompts. You may respond to the prompts with the:
- Stack name you want
- Set the default options, except for the
- HelloWorldFunction may not have authorization defined, Is this okay? [y/N]: prompt. Here, input y and press Enter and
- Deploy this changeset? [y/N]: prompt. Here, input y and press Enter.
Step 5: View Amazon Inspector findings
Amazon Inspector will automatically generate findings when scanning the Lambda function previously deployed. To view those findings, follow the steps below.
To view Amazon Inspector findings for the vulnerability
- Navigate to the Amazon Inspector console.
- In the left navigation menu, choose All findings to see all of the Active findings, as shown in Figure 5.
Due to the custom event pattern rule in Amazon EventBridge, even though there are multiple findings for the vulnerable package python-jwt==3.3.3, you will be notified only for the finding that has InspectorScore greater than 8 and severity CRITICAL.
- Choose the title of each finding to see detailed information about the vulnerability.
Figure 5: Example of findings from the Amazon Inspector console

Step 6: Remediate the vulnerability by applying the fixed package version
Now you can remediate the vulnerability by updating the package version as suggested by Amazon Inspector.
To remediate the vulnerability
- In the Amazon Inspector console, in the left navigation menu, choose All Findings.
- Choose the title of the vulnerability to see the finding details and the remediation recommendations.
Figure 6: Amazon Inspector finding for python-jwt, with the associated remediation
- To remediate, use the following command to update the package version to the fixed version as suggested by Amazon Inspector.
- Use the following command to build the application.
- Use the following command to deploy the application with the guided option.
This command packages and deploys the application to your AWS account. It provides a series of prompts. You may respond to the prompts with the
- Stack name you want
- Set the default options, except for the
- HelloWorldFunction may not have authorization defined, Is this okay? [y/N]: prompt. Here, input y and press Enter and
- Deploy this changeset? [y/N]: prompt. Here, input y and press Enter.
- Amazon Inspector automatically rescans the function after its deployment and reevaluates the findings. At this point, you can navigate back to the Amazon Inspector console, and in the left navigation menu, choose All findings. In the Findings area, you can see that the vulnerabilities are moved from Active to Closed status.
Due to the custom event pattern rule in Amazon EventBridge, you will be notified by email with finding status as CLOSED.
Figure 7: Inspector rescan results, showing no open findings after remediation


(Optional) Step 7: Activate Amazon Inspector in multiple accounts and Regions
To benefit from Amazon Inspector scanning capabilities across the accounts that you have in AWS Organizations and in your selected Regions, use the following steps:
To activate Amazon Inspector in multiple accounts and Regions
- In the CloudShell console, use the following command to clone the code from the aws-samples inspector2-enablement-with-cli GitHub repo.
- Follow the instructions from the README.md file.
- Configure the file param_inspector2.json with the relevant values, as follows:
- inspector2_da: The delegated administrator account ID for Amazon Inspector to manage member accounts.
- scanning_type: The resource types (EC2, ECR, LAMBDA) to be enabled by Amazon Inspector.
- auto_enable: The resource types to be enabled on every account that is newly attached to the delegated administrator.
- regions: Because Amazon Inspector is a regional service, provide the list of AWS Regions to enable.
- Select the AWS account that would be used as the delegated administrator account (<DA_ACCOUNT_ID>).
- Delegate an account as the admin for Amazon Inspector by using the following command.
- Activate the delegated admin by using the following command:
- Associate the member accounts by using the following command:
- Wait five minutes.
- Enable the resource types (EC2, ECR, LAMBDA) on your member accounts by using the following command:
- Enable Amazon Inspector on the new member accounts that are associated with the organization by using the following command:
- Check the Amazon Inspector status in your accounts and in multiple selected Regions by using the following command:
There are other options you can use to enable Amazon Inspector in multiple accounts, like AWS Control Tower and Terraform. For the reference architecture for Control Tower, see the AWS Security Reference Architecture Examples on GitHub. For more information on the Terraform option, see the Terraform aws_inspector2_enabler resource page.
Step 8: Delete the resources created in the previous steps
AWS offers a 15-day free trial for Amazon Inspector so that you can evaluate the service and estimate its cost.
To avoid potential charges, delete the AWS resources that you created in the previous steps of this solution (Lambda function, EventBridge target, EventBridge rule, and SNS topic), and deactivate Amazon Inspector.
To delete resources
- In the CloudShell console, enter the sam-app folder.
- Delete the Lambda function and confirm by typing “y” when prompted for confirmation.
- Remove the SNS target from the Amazon EventBridge rule.
Note: If you don’t remember the target ID, navigate to the Amazon EventBridge console, and in the left navigation menu, choose Rules. Select the rule that you want to delete. Choose CloudFormation, and copy the ID.
- Delete the EventBridge rule.
- Delete the SNS topic.
- Disable Amazon Inspector.
Follow the new few steps to roll back changes only if you have performed the activities listed in Step 7: Activate Amazon Inspector in multiple accounts and Regions.
- In the CloudShell console, enter the folder inspector2-enablement-with-cli.
- Deactivate the resource types (EC2, ECR, LAMBDA) on your member accounts.
- Disassociate the member accounts.
- Deactivate the delegated admin account.
- Remove the delegated account as the admin for Amazon Inspector.
Conclusion
In this blog post, we discussed how you can use Amazon Inspector to continuously scan your Lambda functions, and how to configure an Amazon EventBridge rule and SNS to send out notification of Lambda function vulnerabilities in near real time. You can then perform remediation activities by using AWS Lambda or AWS Systems Manager. We also showed how to enable Amazon Inspector at scale, activating in both single and multiple accounts, in default and multiple Regions.
As of the writing this post, a new feature to perform code scans for Lambda functions is available. Amazon Inspector can now also scan the custom application code within a Lambda function for code security vulnerabilities such as injection flaws, data leaks, weak cryptography, or missing encryption, based on AWS security best practices. You can use this additional scanning functionality to further protect your workloads.
If you have feedback about this blog post, submit comments in the Comments section below. If you have question about this blog post, start a new thread on the Amazon Inspector forum or contact AWS Support.
Want more AWS Security news? Follow us on Twitter.
Migrate your existing SQL-based ETL workload to an AWS serverless ETL infrastructure using AWS Glue
Post Syndicated from Mitesh Patel original https://aws.amazon.com/blogs/big-data/migrate-your-existing-sql-based-etl-workload-to-an-aws-serverless-etl-infrastructure-using-aws-glue/
Data has become an integral part of most companies, and the complexity of data processing is increasing rapidly with the exponential growth in the amount and variety of data. Data engineering teams are faced with the following challenges:
- Manipulating data to make it consumable by business users
- Building and improving extract, transform, and load (ETL) pipelines
- Scaling their ETL infrastructure
Many customers migrating data to the cloud are looking for ways to modernize by using native AWS services to further scale and efficiently handle ETL tasks. In the early stages of their cloud journey, customers may need guidance on modernizing their ETL workload with minimal effort and time. Customers often use many SQL scripts to select and transform the data in relational databases hosted either in an on-premises environment or on AWS and use custom workflows to manage their ETL.
AWS Glue is a serverless data integration and ETL service with the ability to scale on demand. In this post, we show how you can migrate your existing SQL-based ETL workload to AWS Glue using Spark SQL, which minimizes the refactoring effort.
Solution overview
The following diagram describes the high-level architecture for our solution. This solution decouples the ETL and analytics workloads from our transactional data source Amazon Aurora, and uses Amazon Redshift as the data warehouse solution to build a data mart. In this solution, we employ AWS Database Migration Service (AWS DMS) for both full load and continuous replication of changes from Aurora. AWS DMS enables us to capture deltas, including deletes from the source database, through the use of Change Data Capture (CDC) configuration. CDC in DMS enables us to capture deltas without writing code and without missing any changes, which is critical for the integrity of the data. Please refer CDC support in DMS to extend the solutions for ongoing CDC.
The workflow includes the following steps:
- AWS Database Migration Service (AWS DMS) connects to the Aurora data source.
- AWS DMS replicates data from Aurora and migrates to the target destination Amazon Simple Storage Service (Amazon S3) bucket.
- AWS Glue crawlers automatically infer schema information of the S3 data and integrate into the AWS Glue Data Catalog.
- AWS Glue jobs run ETL code to transform and load the data to Amazon Redshift.

For this post, we use the TPCH dataset for sample transactional data. The components of TPCH consist of eight tables. The relationships between columns in these tables are illustrated in the following diagram.

We use Amazon Redshift as the data warehouse to implement the data mart solution. The data mart fact and dimension tables are created in the Amazon Redshift database. The following diagram illustrates the relationships between the fact (ORDER) and dimension tables (DATE, PARTS, and REGION).

Set up the environment
To get started, we set up the environment using AWS CloudFormation. Complete the following steps:
- Sign in to the AWS Management Console with your AWS Identity and Access Management (IAM) user name and password.
- Choose Launch Stack and open the page on a new tab:

- Choose Next.
- For Stack name, enter a name.
- In the Parameters section, enter the required parameters.
- Choose Next.


- On the Configure stack options page, leave all values as default and choose Next.
- On the Review stack page, select the check boxes to acknowledge the creation of IAM resources.
- Choose Submit.
Wait for the stack creation to complete. You can examine various events from the stack creation process on the Events tab. When the stack creation is complete, you will see the status CREATE_COMPLETE. The stack takes approximately 25–30 minutes to complete.
This template configures the following resources:
- The Aurora MySQL instance
sales-db. - The AWS DMS task
dmsreplicationtask-*for full load of data and replicating changes from Aurora (source) to Amazon S3 (destination). - AWS Glue crawlers
s3-crawlerandredshift_crawler. - The AWS Glue database
salesdb. - AWS Glue jobs
insert_region_dim_tbl,insert_parts_dim_tbl, andinsert_date_dim_tbl. We use these jobs for the use cases covered in this post. We create theinsert_orders_fact_tblAWS Glue job manually using AWS Glue Visual Studio. - The Redshift cluster
blog_clusterwith database sales and fact and dimension tables. - An S3 bucket to store the output of the AWS Glue job runs.
- IAM roles and policies with appropriate permissions.
Replicate data from Aurora to Amazon S3
Now let’s look at the steps to replicate data from Aurora to Amazon S3 using AWS DMS:
- On the AWS DMS console, choose Database migration tasks in the navigation pane.
- Select the task
dmsreplicationtask-*and on the Action menu, choose Restart/Resume.
This will start the replication task to replicate the data from Aurora to the S3 bucket. Wait for the task status to change to Full Load Complete. The data from the Aurora tables is now copied to the S3 bucket under a new folder, sales.
Create AWS Glue Data Catalog tables
Now let’s create AWS Glue Data Catalog tables for the S3 data and Amazon Redshift tables:
- On the AWS Glue console, under Data Catalog in the navigation pane, choose Connections.
- Select
RedshiftConnectionand on the Actions menu, choose Edit. - Choose Save changes.
- Select the connection again and on the Actions menu, choose Test connection.
- For IAM role¸ choose
GlueBlogRole. - Choose Confirm.
Testing the connection can take approximately 1 minute. You will see the message “Successfully connected to the data store with connection blog-redshift-connection.” If you have trouble connecting successfully, refer to Troubleshooting connection issues in AWS Glue.
- Under Data Catalog in the navigation pane, choose Crawlers.
- Select
s3_crawlerand choose Run.
This will generate eight tables in the AWS Glue Data Catalog. To view the tables created, in the navigation pane, choose Databases under Data Catalog, then choose salesdb.
- Repeat the steps to run
redshift_crawlerand generate four additional tables.
If the crawler fails, refer to Error: Running crawler failed.

Create SQL-based AWS Glue jobs
Now let’s look at how the SQL statements are used to create ETL jobs using AWS Glue. AWS Glue runs your ETL jobs in an Apache Spark serverless environment. AWS Glue runs these jobs on virtual resources that it provisions and manages in its own service account. AWS Glue Studio is a graphical interface that makes it simple to create, run, and monitor ETL jobs in AWS Glue. You can use AWS Glue Studio to create jobs that extract structured or semi-structured data from a data source, perform a transformation of that data, and save the result set in a data target.
Let’s go through the steps of creating an AWS Glue job for loading the orders fact table using AWS Glue Studio.
- On the AWS Glue console, choose Jobs in the navigation pane.
- Choose Create job.
- Select Visual with a blank canvas, then choose Create.

- Navigate to the Job details tab.
- For Name, enter
insert_orders_fact_tbl. - For IAM Role, choose
GlueBlogRole. - For Job bookmark, choose Enable.
- Leave all other parameters as default and choose Save.

- Navigate to the Visual tab.
- Choose the plus sign.
- Under Add nodes, enter Glue in the search bar and choose AWS Glue Data Catalog (Source) to add the Data Catalog as the source.

- In the right pane, on the Data source properties – Data Catalog tab, choose
salesdbfor Database and customer for Table.

- On the Node properties tab, for Name, enter
Customers.

- Repeat these steps for the
OrdersandLineItemtables.

This concludes creating data sources on the AWS Glue job canvas. Next, we add transformations by combining data from these different tables.
Transform the data
Complete the following steps to add data transformations:
- On the AWS Glue job canvas, choose the plus sign.
- Under Transforms, choose SQL Query.
- On the Transform tab, for Node parents, select all the three data sources.
- On the Transform tab, under SQL query, enter the following query:
- Update the SQL aliases values as shown in the following screenshot.

- On the Data preview tab, choose Start data preview session.
- When prompted, choose
GlueBlogRolefor IAM role and choose Confirm.
The data preview process will take a minute to complete.
- On the Output schema tab, choose Use data preview schema.
You will see the output schema similar to the following screenshot.

Now that we have previewed the data, we change a few data types.
- On the AWS Glue job canvas, choose the plus sign.
- Under Transforms, choose Change Schema.
- Select the node.
- On the Transform tab, update the Data type values as shown in the following screenshot.

Now let’s add the target node.
- Choose the Change Schema node and choose the plus sign.
- In the search bar, enter target.
- Choose Amazon Redshift as the target.

- Choose the Amazon Redshift node, and on the Data target properties – Amazon Redshift tab, for Redshift access type, select Direct data connection.
- Choose
RedshiftConnectionfor Redshift Connection, public for Schema, andorder_tablefor Table. - Select Merge data into target table under Handling of data and target table.
- Choose
orderkeyfor Matching keys.

- Choose Save.
AWS Glue Studio automatically generates the Spark code for you. You can view it on the Script tab. If you would like to do any out-of-the-box transformations, you can modify the Spark code. The AWS Glue job uses the Apache SparkSQL query for SQL query transformation. To find the available SparkSQL transformations, refer to the Spark SQL documentation.

- Choose Run to run the job.
As part of the CloudFormation stack, three other jobs are created to load the dimension tables.
- Navigate back to the Jobs page on the AWS Glue console, select the job
insert_parts_dim_tbl, and choose Run.
This job uses the following SQL to populate the parts dimension table:
- Select the job
insert_region_dim_tbland choose Run.
This job uses the following SQL to populate the region dimension table:
- Select the job
insert_date_dim_tbland choose Run.
This job uses the following SQL to populate the date dimension table:
You can view the status of the running jobs by navigating to the Job run monitoring section on the Jobs page. Wait for all the jobs to complete. These jobs will load the data into the facts and dimension tables in Amazon Redshift.
To help optimize the resources and cost, you can use the AWS Glue Auto Scaling feature.
Verify the Amazon Redshift data load
To verify the data load, complete the following steps:
- On the Amazon Redshift console, select the cluster blog-cluster and on the Query Data menu, choose Query in query editor 2.
- For Authentication, select Temporary credentials.
- For Database, enter
sales. - For User name, enter
admin. - Choose Save.

- Run the following commands in the query editor to verify that the data is loaded into the Amazon Redshift tables:
The following screenshot shows the results from one of the SELECT queries.

Now for the CDC, update the quantity of a line item for order number 1 in Aurora database using the below query. (To connect to your Aurora cluster use Cloud9 or any SQL client tools like MySQL command-line client).
DMS will replicate the changes into the S3 bucket as shown in the below screenshot.

Re-running the Glue job insert_orders_fact_tbl will update the changes to the ORDER fact table as shown in the below screenshot

Clean up
To avoid incurring future charges, delete the resources created for the solution:
- On the Amazon S3 console, select the S3 bucket created as part of the CloudFormation stack, then choose Empty.
- On the AWS CloudFormation console, select the stack that you created initially and choose Delete to delete all the resources created by the stack.
Conclusion
In this post, we showed how you can migrate existing SQL-based ETL to an AWS serverless ETL infrastructure using AWS Glue jobs. We used AWS DMS to migrate data from Aurora to an S3 bucket, then SQL-based AWS Glue jobs to move the data to fact and dimension tables in Amazon Redshift.
This solution demonstrates a one-time data load from Aurora to Amazon Redshift using AWS Glue jobs. You can extend this solution for moving the data on a scheduled basis by orchestrating and scheduling jobs using AWS Glue workflows. To learn more about the capabilities of AWS Glue, refer to AWS Glue.
About the Authors
 Mitesh Patel is a Principal Solutions Architect at AWS with specialization in data analytics and machine learning. He is passionate about helping customers building scalable, secure and cost effective cloud native solutions in AWS to drive the business growth. He lives in DC Metro area with his wife and two kids.
 Sumitha AP is a Sr. Solutions Architect at AWS. She works with customers and help them attain their business objectives by designing secure, scalable, reliable, and cost-effective solutions in the AWS Cloud. She has a focus on data and analytics and provides guidance on building analytics solutions on AWS.
 Deepti Venuturumilli is a Sr. Solutions Architect in AWS. She works with commercial segment customers and AWS partners to accelerate customers’ business outcomes by providing expertise in AWS services and modernize their workloads. She focuses on data analytics workloads and setting up modern data strategy on AWS.
 Deepthi Paruchuri is an AWS Solutions Architect based in NYC. She works closely with customers to build cloud adoption strategy and solve their business needs by designing secure, scalable, and cost-effective solutions in the AWS cloud.
Comic for 2023.07.31 – Armor
Post Syndicated from Explosm.net original https://explosm.net/comics/armor
New Cyanide and Happiness Comic
Improving medical imaging workflows with AWS HealthImaging and SageMaker
Post Syndicated from Sukhomoy Basak original https://aws.amazon.com/blogs/architecture/improving-medical-imaging-workflows-with-aws-healthimaging-and-sagemaker/
Medical imaging plays a critical role in patient diagnosis and treatment planning in healthcare. However, healthcare providers face several challenges when it comes to managing, storing, and analyzing medical images. The process can be time-consuming, error-prone, and costly.
There’s also a radiologist shortage across regions and healthcare systems, making the demand for this specialty increases due to an aging population, advances in imaging technology, and the growing importance of diagnostic imaging in healthcare.
As the demand for imaging studies continues to rise, the limited number of available radiologists results in delays in available appointments and timely diagnoses. And while technology enables healthcare delivery improvements for clinicians and patients, hospitals seek additional tools to solve their most pressing challenges, including:
- Professional burnout due to an increasing demand for imaging and diagnostic services
- Labor-intensive tasks, such as volume measurement or structural segmentation of images
- Increasing expectations from patients expecting high-quality healthcare experiences that match retail and technology in terms of convenience, ease, and personalization
To improve clinician and patient experiences, run your picture archiving and communication system (PACS) with an artificial intelligence (AI)-enabled diagnostic imaging cloud solution to securely gain critical insights and improve access to care.
AI helps reduce the radiologist burndown rate through automation. For example, AI saves radiologist chest x-ray interpretation time. It is also a powerful tool to identify areas that need closer inspection, and helps capture secondary findings that weren’t initially identified. The advancement of interoperability and analytics gives radiologist a 360-degree, longitudinal view of patient health records to provide better healthcare at potentially lower costs.
AWS offers services to address these challenges. This blog post discusses AWS HealthImaging (AWS AHI) and Amazon SageMaker, and how they are used together to improve healthcare providers’ medical imaging workflows. This ultimately accelerates imaging diagnostics and increases radiology productivity. AWS AHI enables developers to deliver performance, security, and scale to cloud-native medical imaging applications. It allows ingestion of Digital Imaging and Communication in Medicine (DICOM) images. Amazon SageMaker provides end-to-end solution for AI and machine learning.
Let’s explore an example use case involving X-rays after an auto accident. In this diagnostic medical imaging workflow, a patient is in the emergency room. From there:
- The patient undergoes an X-ray to check for fractures.
- The scanned acquisition device images flow to the PACS system.
- The radiologist reviews the information gathered from this procedure and authors the report.
- The patient workflow continues as the reports are made available to the referring physician.
Next-generation imaging solutions and workflows
Healthcare providers can use AWS AHI and Amazon SageMaker together to enable next-generation imaging solutions and improve medical imaging workflows. The following architecture illustrates this example.

Figure 1: X-ray images are sent to AWS HealthImaging and an Amazon SageMaker endpoint extracts insights.
Let’s review the architecture and the key components:
1. Imaging Scanner: Captures the images from a patient’s body. Depending on the modality, this can be an X-ray detector; a series of detectors in a CT scanner; a magnetic field and radio frequency coils in an MRI scanner; or an ultrasound transducer. This example uses an X-ray device.
- AWS IoT Greengrass: Edge runtime and cloud service configured with DICOM C-Store SCP that receives the images and sends it to Amazon Simple Storage Service (Amazon S3). The images along with the related metadata are sent to Amazon S3 and Amazon Simple Queue Service (Amazon SQS) respectively, that triggers the workflow.
2. Amazon SQS message queue: Consumes event from S3 bucket and triggers an AWS Step Functions workflow orchestration.
3. AWS Step Functions runs the transform and import jobs to further process and import the images into AWS AHI data store instance.
4. The final diagnostic image—along with any relevant patient information and metadata—is stored in the AWS AHI datastore. This allows for efficient imaging date retrieval and management. It also enables medical imaging data access with sub-second image retrieval latencies at scale, powered by cloud-native APIs and applications from AWS partners.
5. Radiologists responsible for ground truth for ML images perform medical image annotations using Amazon SageMaker Ground Truth. They visualize and label DICOM images using a custom data labeling workflow—a fully managed data labeling service that supports built-in or custom data labeling workflows. They also leverage tools like 3D Slicer for interactive medical image annotations.
6. Data scientists build or leverage built-in deep learning models using the annotated images on Amazon SageMaker. SageMaker offers a range of deployment options that vary from low latency and high throughput to long-running inference jobs. These options include considerations for batch, real-time, or near real-time inference.
7. Healthcare providers use AWS AHI and Amazon SageMaker to run AI-assisted detection and interpretation workflow. This workflow is used to identify hard-to-see fractures, dislocations, or soft tissue injuries to allow surgeons and radiologist to be more confident in their treatment choices.
8. Finally, the image stored in AWS AHI is displayed on a monitor or other visual output device where it can be analyzed and interpreted by a radiologist or other medical professional.
- The Open Health Imaging Foundation (OHIF) Viewer is an open source, web-based, medical imaging platform. It provides a core framework for building complex imaging applications.
- Radical Imaging or Arterys are AWS partners that provide OHIF-based medical imaging viewer.
Each of these components plays a critical role in the overall performance and accuracy of the medical imaging system as well as ongoing research and development focused on improving diagnostic outcomes and patient care. AWS AHI uses efficient metadata encoding, lossless compression, and progressive resolution data access to provide industry leading performance for loading images. Efficient metadata encoding enables image viewers and AI algorithms to understand the contents of a DICOM study without having to load the image data.
Security
The AWS shared responsibility model applies to data protection in AWS AHI and Amazon SageMaker.
Amazon SageMaker is HIPAA-eligible and can operate with data containing Protected Health Information (PHI). Encryption of data in transit is provided by SSL/TLS and is used when communicating both with the front-end interface of Amazon SageMaker (to the Notebook) and whenever Amazon SageMaker interacts with any other AWS services.
AWS AHI is also HIPAA-eligible service and provides access control at the metadata level, ensuring that each user and application can only see the images and metadata fields that are required based upon their role. This prevents the proliferation of Patient PHI. All access to AWS AHI APIs is logged in detail in AWS CloudTrail.
Both of these services leverage AWS Key Management service (AWS KMS) to satisfy the requirement that PHI data is encrypted at rest.
Conclusion
In this post, we reviewed a common use case for early detection and treatment of conditions, resulting in better patient outcomes. We also covered an architecture that can transform the radiology field by leveraging the power of technology to improve accuracy, efficiency, and accessibility of medical imaging.
Further reading
How to Receive Alerts When Your IAM Configuration Changes
Post Syndicated from Dylan Souvage original https://aws.amazon.com/blogs/security/how-to-receive-alerts-when-your-iam-configuration-changes/
July 27, 2023: This post was originally published February 5, 2015, and received a major update July 31, 2023.
As an Amazon Web Services (AWS) administrator, it’s crucial for you to implement robust protective controls to maintain your security configuration. Employing a detective control mechanism to monitor changes to the configuration serves as an additional safeguard in case the primary protective controls fail. Although some changes are expected, you might want to review unexpected changes or changes made by a privileged user. AWS Identity and Access Management (IAM) is a service that primarily helps manage access to AWS services and resources securely. It does provide detailed logs of its activity, but it doesn’t inherently provide real-time alerts or notifications. Fortunately, you can use a combination of AWS CloudTrail, Amazon EventBridge, and Amazon Simple Notification Service (Amazon SNS) to alert you when changes are made to your IAM configuration. In this blog post, we walk you through how to set up EventBridge to initiate SNS notifications for IAM configuration changes. You can also have SNS push messages directly to ticketing or tracking services, such as Jira, Service Now, or your preferred method of receiving notifications, but that is not discussed here.
In any AWS environment, many activities can take place at every moment. CloudTrail records IAM activities, EventBridge filters and routes event data, and Amazon SNS provides notification functionality. This post will guide you through identifying and setting alerts for IAM changes, modifications in authentication and authorization configurations, and more. The power is in your hands to make sure you’re notified of the events you deem most critical to your environment. Here’s a quick overview of how you can invoke a response, shown in Figure 1.

Figure 1: Simple architecture diagram of actors and resources in your account and the process for sending notifications through IAM, CloudTrail, EventBridge, and SNS.
Log IAM changes with CloudTrail
Before we dive into implementation, let’s briefly understand the function of AWS CloudTrail. It records and logs activity within your AWS environment, tracking actions such as IAM role creation, deletion, or modification, thereby offering an audit trail of changes.
With this in mind, we’ll discuss the first step in tracking IAM changes: establishing a log for each modification. In this section, we’ll guide you through using CloudTrail to create these pivotal logs.
For an in-depth understanding of CloudTrail, refer to the AWS CloudTrail User Guide.
In this post, you’re going to start by creating a CloudTrail trail with the Management events type selected, and read and write API activity selected. If you already have a CloudTrail trail set up with those attributes, you can use that CloudTrail trail instead.
To create a CloudTrail log
- Open the AWS Management Console and select CloudTrail, and then choose Dashboard.
- In the CloudTrail dashboard, choose Create Trail.
Figure 2: Use the CloudTrail dashboard to create a trail
- In the Trail name field, enter a display name for your trail and then select Create a new S3 bucket. Leave the default settings for the remaining trail attributes.
Figure 3: Set the trail name and storage location
- Under Event type, select Management events. Under API activity, select Read and Write.
- Choose Next.
Figure 4: Choose which events to log


Set up notifications with Amazon SNS
Amazon SNS is a managed service that provides message delivery from publishers to subscribers. It works by allowing publishers to communicate asynchronously with subscribers by sending messages to a topic, a logical access point, and a communication channel. Subscribers can receive these messages using supported endpoint types, including email, which you will use in the blog example today.
For further reading on Amazon SNS, refer to the Amazon SNS Developer Guide.
Now that you’ve set up CloudTrail to log IAM changes, the next step is to establish a mechanism to notify you about these changes in real time.
To set up notifications
- Open the Amazon SNS console and choose Topics.
- Create a new topic. Under Type, select Standard and enter a name for your topic. Keep the defaults for the rest of the options, and then choose Create topic.
Figure 5: Select Standard as the topic type
- Navigate to your topic in the topic dashboard, choose the Subscriptions tab, and then choose Create subscription.

Figure 6: Choose Create subscription
- For Topic ARN, select the topic you created previously, then under Protocol, select Email and enter the email address you want the alerts to be sent to.
Figure 7: Select the topic ARN and add an endpoint to send notifications to
- After your subscription is created, go to the mailbox you designated to receive notifications and check for a verification email from the service. Open the email and select Confirm subscription to verify the email address and complete setup.


Initiate events with EventBridge
Amazon EventBridge is a serverless service that uses events to connect application components. EventBridge receives an event (an indicator of a change in environment) and applies a rule to route the event to a target. Rules match events to targets based on either the structure of the event, called an event pattern, or on a schedule.
Events that come to EventBridge are associated with an event bus. Rules are tied to a single event bus, so they can only be applied to events on that event bus. Your account has a default event bus that receives events from AWS services, and you can create custom event buses to send or receive events from a different account or AWS Region.
For a more comprehensive understanding of EventBridge, refer to the Amazon EventBridge User Guide.
In this part of our post, you’ll use EventBridge to devise a rule for initiating SNS notifications based on IAM configuration changes.
To create an EventBridge rule
- Go to the EventBridge console and select EventBridge Rule, and then choose Create rule.
Figure 8: Use the EventBridge console to create a rule
- Enter a name for your rule, keep the defaults for the rest of rule details, and then choose Next.
Figure 9: Rule detail screen
- Under Target 1, select AWS service.
- In the dropdown list for Select a target, select SNS topic, select the topic you created previously, and then choose Next.
Figure 10: Target with target type of AWS service and target topic of SNS topic selected
- Under Event source, select AWS events or EventBridge partner events.

Figure 11: Event pattern with AWS events or EventBridge partner events selected
- Under Event pattern, verify that you have the following selected.
- For Event source, select AWS services.
- For AWS service, select IAM.
- For Event type, select AWS API Call via CloudTrail.
- Select the radio button for Any operation.
Figure 12: Event pattern details selected


Now that you’ve set up EventBridge to monitor IAM changes, test it by creating a new user or adding a new policy to an IAM role and see if you receive an email notification.
Centralize EventBridge alerts by using cross-account alerts
If you have multiple accounts, you should be evaluating using AWS Organizations. (For a deep dive into best practices for using AWS Organizations, we recommend reading this AWS blog post.)
By standardizing the implementation to channel alerts from across accounts to a primary AWS notification account, you can use a multi-account EventBridge architecture. This allows aggregation of notifications across your accounts through sender and receiver accounts. Figure 13 shows how this works. Separate member accounts within an AWS organizational unit (OU) have the same mechanism for monitoring changes and sending notifications as discussed earlier, but send notifications through an EventBridge instance in another account.
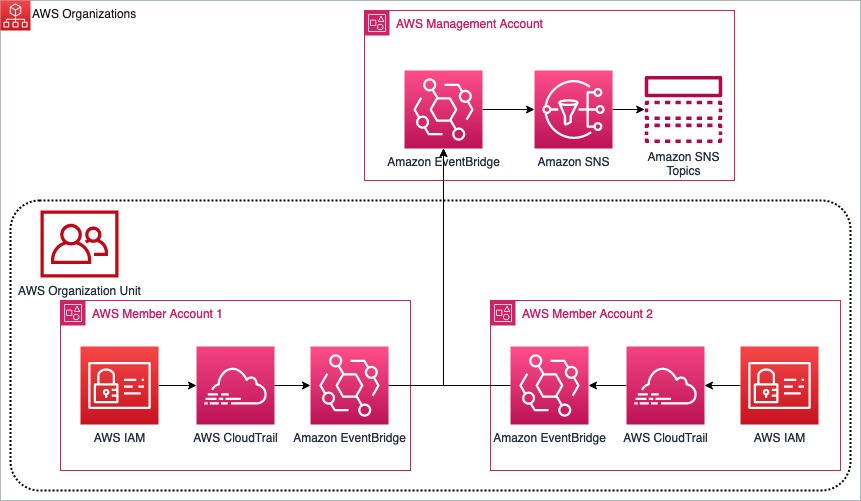
Figure 13: Multi-account EventBridge architecture aggregating notifications between two AWS member accounts to a primary management account
You can read more and see the implementation and deep dive of the multi-account EventBridge solution on the AWS samples GitHub, and you can also read more about sending and receiving Amazon EventBridge notifications between accounts.
Monitor calls to IAM
In this blog post example, you monitor calls to IAM.
The filter pattern you selected while setting up EventBridge matches CloudTrail events for calls to the IAM service. Calls to IAM have a CloudTrail eventSource of iam.amazonaws.com, so IAM API calls will match this pattern. You will find this simple default filter pattern useful if you have minimal IAM activity in your account or to test this example. However, as your account activity grows, you’ll likely receive more notifications than you need. This is when filtering only the relevant events becomes essential to prioritize your responses. Effectively managing your filter preferences allows you to focus on events of significance and maintain control as your AWS environment grows.
Monitor changes to IAM
If you’re interested only in changes to your IAM account, you can modify the event pattern inside EventBridge, the one you used to set up IAM notifications, with an eventName filter pattern, shown following.
This filter pattern will only match events from the IAM service that begin with Add, Change, Create, Deactivate, Delete, Enable, Put, Remove, Update, or Upload. For more information about APIs matching these patterns, see the IAM API Reference.
To edit the filter pattern to monitor only changes to IAM
- Open the EventBridge console, navigate to the Event pattern, and choose Edit pattern.
Figure 14: Modifying the event pattern
- Add the eventName filter pattern from above to your event pattern.
Figure 15: Use the JSON editor to add the eventName filter pattern


Monitor changes to authentication and authorization configuration
Monitoring changes to authentication (security credentials) and authorization (policy) configurations is critical, because it can alert you to potential security vulnerabilities or breaches. For instance, unauthorized changes to security credentials or policies could indicate malicious activity, such as an attempt to gain unauthorized access to your AWS resources. If you’re only interested in these types of changes, use the preceding steps to implement the following filter pattern.
This filter pattern matches calls to IAM that modify policy or create, update, upload, and delete IAM elements.
Conclusion
Monitoring IAM security configuration changes allows you another layer of defense against the unexpected. Balancing productivity and security, you might grant a user broad permissions in order to facilitate their work, such as exploring new AWS services. Although preventive measures are crucial, they can potentially restrict necessary actions. For example, a developer may need to modify an IAM role for their task, an alteration that could pose a security risk. This change, while essential for their work, may be undesirable from a security standpoint. Thus, it’s critical to have monitoring systems alongside preventive measures, allowing necessary actions while maintaining security.
Create an event rule for IAM events that are important to you and have a response plan ready. You can refer to Security best practices in IAM for further reading on this topic.
If you have questions or feedback about this or any other IAM topic, please visit the IAM re:Post forum. You can also read about the multi-account EventBridge solution on the AWS samples GitHub and learn more about sending and receiving Amazon EventBridge notifications between accounts.
If you have feedback about this post, submit comments in the Comments section below. If you have questions about this post, contact AWS Support.
Want more AWS Security news? Follow us on Twitter.
Building 3x Intel Xeon W-3400 Workstation and Servers with the ASUS Pro WS W790E SAGE SE
Post Syndicated from Patrick Kennedy original https://www.servethehome.com/building-3x-intel-xeon-w-3400-workstation-servers-asus-pro-ws-w790e-sage-se-kioxia-kingston-pny-nvidia-noctua-micron-crucial-falcon-northwest/
We build three Intel Xeon W-3400 workstation/ server platforms ranging from high-connectivity to and overclocked but quiet rackmount
The post Building 3x Intel Xeon W-3400 Workstation and Servers with the ASUS Pro WS W790E SAGE SE appeared first on ServeTheHome.
Emacs 29.1 released
Post Syndicated from corbet original https://lwn.net/Articles/939808/
Version 29.1 of the Emacs editor has been released. There is a long list
of changes, including integration with the Tree-sitter
incremental parsing library, the ability to access SQLite databases,
“pure GTK” display support (which enables Wayland support), and a lot more; see the
NEWS file for all the details.
GnuCOBOL 3.2 released
Post Syndicated from corbet original https://lwn.net/Articles/939807/
Version 3.2 of the GNU COBOL compiler is out. “The amount of features
.” These new features include improved support for
are too much to note, but you can skip over the attached NEWS file to
investigate them
COBOL dialects, performance improvements, better GDB debugging support, and
more.