Amazon Athena is an interactive query service that makes it easy to analyze data in Amazon Simple Storage Service (Amazon S3) and data sources residing in AWS, on-premises, or other cloud systems using SQL or Python. Athena is built on open-source Trino and Presto engines, and Apache Spark frameworks, with no provisioning or configuration effort required. Athena is serverless, so there is no infrastructure to manage, and you pay only for the queries that you run.
Apache Iceberg is an open table format for very large analytic datasets. It manages large collections of files as tables, and it supports modern analytical data lake operations such as record-level insert, update, delete, and time travel queries. Athena supports read, time travel, write, and DDL queries for Apache Iceberg tables that use the Apache Parquet format for data and the AWS Glue Data Catalog for their metastore.
Feature engineering is a process of identifying and transforming raw data (images, text files, videos, and so on), backfilling missing data, and adding one or more meaningful data elements to provide context so a machine learning (ML) model can learn from it. Data labeling is required for various use cases, including forecasting, computer vision, natural language processing, and speech recognition.
Combined with the capabilities of Athena, Apache Iceberg delivers a simplified workflow for data scientists to create new data features without needing to copy or recreate the entire dataset. You can create features using standard SQL on Athena without using any other service for feature engineering. Data scientists can reduce the time spent preparing and copying datasets, and instead focus on data feature engineering, experimentation, and analyzing data at scale.
In this post, we review the benefits of using Athena with the Apache Iceberg open table format and how it simplifies common feature engineering tasks for data scientists. We demonstrate how Athena can convert an existing table in Apache Iceberg format, then add columns, delete columns, and modify the data in the table without recreating or copying the dataset, and use these capabilities to create new features on Apache Iceberg tables.
Solution overview
Data scientists are generally accustomed to working with large datasets. Datasets are usually stored in either JSON, CSV, ORC, or Apache Parquet format, or similar read-optimized formats for fast read performance. Data scientists often create new data features, and backfill such data features with aggregated and ancillary data. Historically, this task was accomplished by creating a view on top of the table with the underlying data in Apache Parquet format, where such columns and data were added at runtime or by creating a new table with additional columns. Although this workflow is well-suited for many use cases, it’s inefficient for large datasets, because data would need to be generated at runtime or datasets would need to be copied and transformed.
Athena has introduced ACID (Atomicity, Consistency, Isolation, Durability) transaction capabilities that add INSERT, UPDATE, DELETE, MERGE, and time travel operations built on Apache Iceberg tables. These capabilities enable data scientists to create new data features and drop existing data features on existing datasets without worrying about copying or transforming the dataset or abstracting it with a view. Data scientists can focus on feature engineering work and avoid copying and transforming the datasets.
The Athena Iceberg UPDATE operation writes Apache Iceberg position delete files and newly updated rows as data files in the same transaction. You can make record corrections via a single UPDATE statement.
With the release of Athena engine version 3, the capabilities for Apache Iceberg tables are enhanced with the support for operations such as CREATE TABLE AS SELECT (CTAS) and MERGE commands that streamline the lifecycle management of your Iceberg data. CTAS makes it fast and efficient to create tables from other formats such as Apache Paquet, and MERGE INTO conditional updates, deletes, or inserts rows into an Iceberg table. A single statement can combine update, delete, and insert actions.
For demonstration, we use an Apache Parquet table that contains several million records of randomly distributed fictitious sales data from the last several years stored in an S3 bucket. Download the dataset, unzip it to your local computer, and upload it to your S3 bucket. In this post, we uploaded our dataset to s3://sample-iceberg-datasets-xxxxxxxxxxx/sampledb/orders_and_customers/.
The following table shows the layout for the table customer_orders.
Column Name
Data Type
Description
orderkey
string
Order number for the order
custkey
string
Customer identification number
orderstatus
string
Status of the order
totalprice
string
Total price of the order
orderdate
string
Date of the order
orderpriority
string
Priority of the order
clerk
string
Name of the clerk who processed the order
shippriority
string
Priority on the shipping
name
string
Customer name
address
string
Customer address
nationkey
string
Customer nation key
phone
string
Customer phone number
acctbal
string
Customer account balance
mktsegment
string
Customer market segment
Perform feature engineering
As a data scientist, we want to perform feature engineering on the customer orders data by adding calculated one year total purchases and one year average purchases for each customer in the existing dataset. For demonstration purposes, we created the customer_orders table in the sampledb database using Athena as shown in the following DDL command. (You can use any of your existing datasets and follow the steps mentioned in this post.) The customer_orders dataset was generated and stored in the S3 bucket location s3://sample-iceberg-datasets-xxxxxxxxxxx/sampledb/orders_and_customers/ in Parquet format. This table is not an Apache Iceberg table.
Validate the data in the table by running a query:
SELECT *
from sampledb.customer_orders
limit 10;
We want to add new features to this table to get a deeper understanding of customer sales, which can result in faster model training and more valuable insights. To add new features to the dataset, convert the customer_orders Athena table to Apache Iceberg table on Athena. Issue a CTAS query statement to create a new table with Apache Iceberg format from the customer_orders table. While doing so, a new feature is added to get the total purchase amount in the past year (max year of the dataset) by each customer.
In the following CTAS query, a new column named one_year_sales_aggregate with the default value as 0.0 of data type double is added and table_type is set to ICEBERG:
CREATE TABLE  sampledb.customers_orders_aggregate
WITH (table_type = 'ICEBERG',
   format = 'PARQUET',
   location = 's3://sample-iceberg-datasets-xxxxxxxxxxxx/sampledb/customer_orders_aggregate',
   is_external = false
   )
AS
SELECT
orderkey,
custkey,
orderstatus,
totalprice,
orderdate,
orderpriority,
clerk,
shippriority,
name,
address,
nationkey,
phone,
acctbal,
mktsegment,
0.0 as one_year_sales_aggregate
from sampledb.customer_orders;
Issue the following query to verify the data in the Apache Iceberg table with the new column one_year_sales_aggregate values as 0.0:
SELECT custkey, totalprice, one_year_sales_aggregate
from sampledb.customers_orders_aggregate
limit 10;
We want to populate the values for the new feature one_year_sales_aggregate in the dataset to get the total purchase amount for each customer based on their purchases in the past year (max year of the dataset). Issue a MERGE query statement to the Apache Iceberg table using Athena to populate values for the one_year_sales_aggregate feature:
MERGE INTO sampledb.customers_orders_aggregate coa USING
    (select custkey,
            date_format(CAST(orderdate as date), '%Y ') as    orderdate,
            sum(CAST(totalprice as double)) as one_year_sales_aggregate
    FROM sampledb.customers_orders_aggregate o
    where date_format(CAST(o.orderdate as date), '%Y ') = (select date_format(max(CAST(orderdate as date)), '%Y ') from sampledb.customers_orders_aggregate)
    group by custkey, date_format(CAST(orderdate as date), '%Y ')) sales_one_year_agg
    ON (coa.custkey = sales_one_year_agg.custkey)
    WHEN MATCHED
        THEN UPDATE SET one_year_sales_aggregate = sales_one_year_agg.one_year_sales_aggregate;
Issue the following query to validate the updated value for total spend by each customer in the past year:
SELECT custkey, totalprice, one_year_sales_aggregate
from sampledb.customers_orders_aggregate limit 10;
We decide to add another feature onto an existing Apache Iceberg table to compute and store the average purchase amount in the past year by each customer. Issue an ALTER query statement to add a new column to an existing table for feature one_year_sales_average:
ALTER TABLE sampledb.customers_orders_aggregate
ADD COLUMNS (one_year_sales_average double);
Before populating the values to this new feature, you can set the default value for the feature one_year_sales_average to 0.0. Using the same Apache Iceberg table on Athena, issue an UPDATE query statement to populate the value for the new feature as 0.0:
UPDATE sampledb.customers_orders_aggregate
SET one_year_sales_average = 0.0;
Issue the following query to verify the updated value for average spend by each customer in the past year is set to 0.0:
SELECT custkey, orderdate, totalprice, one_year_sales_aggregate, one_year_sales_average
from sampledb.customers_orders_aggregate
limit 10;
Now we want to populate the values for the new feature one_year_sales_average in the dataset to get the average purchase amount for each customer based on their purchases in the past year (max year of the dataset). Issue a MERGE query statement to the existing Apache Iceberg table on Athena using the Athena engine to populate values for the feature one_year_sales_average:
MERGE INTO sampledb.customers_orders_aggregate coa USING
    (select custkey,
            date_format(CAST(orderdate as date), '%Y') as orderdate,
            avg(CAST(totalprice as double)) as one_year_sales_average
    FROM sampledb.customers_orders_aggregate o
    where date_format(CAST(o.orderdate as date), '%Y') = (select date_format(max(CAST(orderdate as date)), '%Y') from sampledb.customers_orders_aggregate)
    group by custkey, date_format(CAST(orderdate as date), '%Y')) sales_one_year_avg
    ON (coa.custkey = sales_one_year_avg.custkey)
    WHEN MATCHED
        THEN UPDATE SET one_year_sales_average = sales_one_year_avg.one_year_sales_average;
Issue the following query to verify the updated values for average spend by each customer:
SELECT custkey, orderdate, totalprice, one_year_sales_aggregate, one_year_sales_average
from sampledb.customers_orders_aggregate
limit 10;
Once additional data features have been added to the dataset, data scientists generally proceed to train ML models and make inferences using Amazon Sagemaker or equivalent toolset.
Conclusion
In this post, we demonstrated how to perform feature engineering using Athena with Apache Iceberg. We also demonstrated using the CTAS query to create an Apache Iceberg table on Athena from an existing dataset in Apache Parquet format, adding new features in an existing Apache Iceberg table on Athena using the ALTER query, and using UPDATE and MERGE query statements to update the feature values of existing columns.
We encourage you to use CTAS queries to create tables quickly and efficiently, and use the MERGE query statement to synchronize tables in one step to simplify data preparations and update tasks when transforming the features using Athena with Apache Iceberg. If you have comments or feedback, please leave them in the comments section.
About the Authors
Vivek Gautam is a Data Architect with specialization in data lakes at AWS Professional Services. He works with enterprise customers building data products, analytics platforms, and solutions on AWS. When not building and designing modern data platforms, Vivek is a food enthusiast who also likes to explore new travel destinations and go on hikes.
Mikhail Vaynshteyn is a Solutions Architect with Amazon Web Services. Mikhail works with healthcare and life sciences customers to build solutions that help improve patients’ outcomes. Mikhail specializes in data analytics services.
Naresh Gautam is a Data Analytics and AI/ML leader at AWS with 20 years of experience, who enjoys helping customers architect highly available, high-performance, and cost-effective data analytics and AI/ML solutions to empower customers with data-driven decision-making. In his free time, he enjoys meditation and cooking.
Harsha Tadiparthi is a specialist Principal Solutions Architect, Analytics at AWS. He enjoys solving complex customer problems in databases and analytics and delivering successful outcomes. Outside of work, he loves to spend time with his family, watch movies, and travel whenever possible.
When watching a movie or an episode of a TV show, we experience a cohesive narrative that unfolds before us, often without giving much thought to the underlying structure that makes it all possible. However, movies and episodes are not atomic units, but rather composed of smaller elements such as frames, shots, scenes, sequences, and acts. Understanding these elements and how they relate to each other is crucial for tasks such as video summarization and highlights detection, content-based video retrieval, dubbing quality assessment, and video editing. At Netflix, such workflows are performed hundreds of times a day by many teams around the world, so investing in algorithmically-assisted tooling around content understanding can reap outsized rewards.
While segmentation of more granular units like frames and shot boundaries is either trivial or can primarily rely on pixel-based information, higher order segmentation¹ requires a more nuanced understanding of the content, such as the narrative or emotional arcs. Furthermore, some cues can be better inferred from modalities other than the video, e.g. the screenplay or the audio and dialogue track. Scene boundary detection, in particular, is the task of identifying the transitions between scenes, where a scene is defined as a continuous sequence of shots that take place in the same time and location (often with a relatively static set of characters) and share a common action or theme.
In this blog post, we present two complementary approaches to scene boundary detection in audiovisual content. The first method, which can be seen as a form of weak supervision, leverages auxiliary data in the form of a screenplay by aligning screenplay text with timed text (closed captions, audio descriptions) and assigning timestamps to the screenplay’s scene headers (a.k.a. sluglines). In the second approach, we show that a relatively simple, supervised sequential model (bidirectional LSTM or GRU) that uses rich, pretrained shot-level embeddings can outperform the current state-of-the-art baselines on our internal benchmarks.
Figure 1: a scene consists of a sequence of shots.
Leveraging Aligned Screenplay Information
Screenplays are the blueprints of a movie or show. They are formatted in a specific way, with each scene beginning with a scene header, indicating attributes such as the location and time of day. This consistent formatting makes it possible to parse screenplays into a structured format. At the same time, a) changes made on the fly (directorial or actor discretion) or b) in post production and editing are rarely reflected in the screenplay, i.e. it isn’t rewritten to reflect the changes.
Figure 2: screenplay elements, from The Witcher S1E1.
In order to leverage this noisily aligned data source, we need to align time-stamped text (e.g. closed captions and audio descriptions) with screenplay text (dialogue and action² lines), bearing in mind a) the on-the-fly changes that might result in semantically similar but not identical line pairs and b) the possible post-shoot changes that are more significant (reordering, removing, or inserting entire scenes). To address the first challenge, we use pre trained sentence-level embeddings, e.g. from an embedding model optimized for paraphrase identification, to represent text in both sources. For the second challenge, we use dynamic time warping (DTW), a method for measuring the similarity between two sequences that may vary in time or speed. While DTW assumes a monotonicity condition on the alignments³ which is frequently violated in practice, it is robust enough to recover from local misalignments and the vast majority of salient events (like scene boundaries) are well-aligned.
As a result of DTW, the scene headers have timestamps that can indicate possible scene boundaries in the video. The alignments can also be used to e.g., augment audiovisual ML models with screenplay information like scene-level embeddings, or transfer labels assigned to audiovisual content to train screenplay prediction models.
Figure 3: alignments between screenplay and video via time stamped text for The Witcher S1E1.
A Multimodal Sequential Model
The alignment method above is a great way to get up and running with the scene change task since it combines easy-to-use pretrained embeddings with a well-known dynamic programming technique. However, it presupposes the availability of high-quality screenplays. A complementary approach (which in fact, can use the above alignments as a feature) that we present next is to train a sequence model on annotated scene change data. Certain workflows in Netflix capture this information, and that is our primary data source; publicly-released datasets are also available.
From an architectural perspective, the model is relatively simple — a bidirectional GRU (biGRU) that ingests shot representations at each step and predicts if a shot is at the end of a scene.⁴ The richness in the model comes from these pretrained, multimodal shot embeddings, a preferable design choice in our setting given the difficulty in obtaining labeled scene change data and the relatively larger scale at which we can pretrain various embedding models for shots.
For video embeddings, we leverage an in-house model pretrained on aligned video clips paired with text (the aforementioned “timestamped text”). For audio embeddings, we first perform source separation to try and separate foreground (speech) from background (music, sound effects, noise), embed each separated waveform separately using wav2vec2, and then concatenate the results. Both early and late-stage fusion approaches are explored; in the former (Figure 4a), the audio and video embeddings are concatenated and fed into a single biGRU, and in the latter (Figure 4b) each input modality is encoded with its own biGRU, after which the hidden states are concatenated prior to the output layer.
Figure 4a: Early Fusion (concatenate embeddings at the input).Figure 4b: Late Fusion (concatenate prior to prediction output).
We find:
Our results match and sometimes even outperform the state-of-the-art (benchmarked using the video modality only and on our evaluation data). We evaluate the outputs using F-1 score for the positive label, and also relax this evaluation to consider “off-by-n” F-1 i.e., if the model predicts scene changes within n shots of the ground truth. This is a more realistic measure for our use cases due to the human-in-the-loop setting that these models are deployed in.
As with previous work, adding audio features improves results by 10–15%. A primary driver of variation in performance is late vs. early fusion.
Late fusion is consistently 3–7% better than early fusion. Intuitively, this result makes sense — the temporal dependencies between shots is likely modality-specific and should be encoded separately.
Conclusion
We have presented two complementary approaches to scene boundary detection that leverage a variety of available modalities — screenplay, audio, and video. Logically, the next steps are to a) combine these approaches and use screenplay features in a unified model and b) generalize the outputs across multiple shot-level inference tasks, e.g. shot type classification and memorable moments identification, as we hypothesize that this path would be useful for training general purpose video understanding models of longer-form content. Longer-form content also contains more complex narrative structure, and we envision this work as the first in a series of projects that aim to better integrate narrative understanding in our multimodal machine learning models.
Sometimes referred to as boundary detection to avoid confusion with image segmentation techniques.
Descriptive (non-dialogue) lines that describe the salient aspects of a scene.
For two sources X and Y, if a) shot a in source X is aligned to shot b in source Y, b) shot c in source X is aligned to shot d in source Y, and c) shot c comes after shot a in X, then d) shot d has to come after shot b in Y.
We experiment with adding a Conditional Random Field (CRF) layer on top to enforce some notion of global consistency, but found it did not improve the results noticeably.
For enterprises of all sizes, email is a critical piece of infrastructure that supports large volumes of communication from an organization. One of the benefits of using an email service or email platform like Amazon Simple Email Service (Amazon SES) is that these managed email services allow you to send emails to your users using popular authentication methods such as DMARC. In this blog post we’ll explore the reasons DMARC may be failing in your emails and best practices to ensure your DMARC does not fail.
What is DMARC?
Domain-based Message Authentication, Reporting and Conformance, is an email authentication protocol that uses Sender Policy Framework (SPF) and DomainKeys Identified Mail (DKIM) to detect email spoofing. Email DMARC, or Domain-based Message Authentication, Reporting, and Conformance, is a technology that helps protect against email fraud and phishing attacks. When you send an email, it contains information about the sender, recipient, and the content. However, cybercriminals can forge or “spoof” the sender’s address, making it appear as if the email is coming from a trusted source when it’s not. DMARC helps address this problem by allowing email recipients to check if the incoming email is legitimate or not. It works by using cryptographic techniques to verify the authenticity of the sender’s domain.
Here’s how it simplifies the process:
The sender’s domain owner adds a special DMARC record to its DNS (Domain Name System) settings. This record includes information about how to handle incoming emails.
When an email recipient’s server receives a message, it checks the sender’s domain for the DMARC record.
The recipient’s server then verifies the email’s alignment with the DMARC record.
If the DMARC compliance fails, the recipient’s server can take different actions specified in the DMARC record- it may reject or quarantine the email or allow it to pass through.
By implementing DMARC, legitimate email senders can protect their domains from being used for malicious purposes. It helps organizations and individuals combat phishing attacks, protect their reputation, and enhance email security. Overall, DMARC acts as a security measure to ensure that the emails you receive are genuinely from the claimed sender, minimizing the risk of falling victim to email-based scams.
Solution Overview
DMARC failures may happen if the sender domain of the email is not enabled for DKIM or SPF to comply via DMARC. This blog contains information that will help you troubleshoot DMARC failures and fix them so that the emails you send comply with DMARC via both SPF and DKIM. There are two ways to achieve DMARC validation: Complying with DMARC through SPF and Complying with DMARC through DKIM.
To comply DMARC via SPF:
For an email to comply with DMARC based on SPF, both of the following conditions must be met, either of it failing with result in DMARC failure through SPF:
Condition 1: The email must pass an SPF check. Sender Policy Framework (SPF) is an email validation standard that’s designed to prevent email spoofing. Domain owners use SPF to tell email providers which servers are allowed to send email from their domains. SPF is defined in RFC 7208 in detail.
Condition 2: The domain in the From address of the email header must align with the MAIL FROM domain that the sending mail server specifies to the receiving mail server. When an email is sent, it has two addresses that indicate its source: a From address that’s displayed to the message recipient, and a MAIL FROM address that indicates where the message originated. By using a custom MAIL FROM domain, you are able to use SPF to achieve Domain-based Message Authentication, Reporting and Conformance (DMARC) validation.
To comply DMARC via DKIM:
DomainKeys Identified Mail (DKIM) is an email security standard designed to make sure that an email that claims to have come from a specific domain was indeed authorized by the owner of that domain. It uses public-key cryptography to sign an email with a private key. For an email to comply with DMARC based on DKIM, both of the following conditions must be met. Either of below conditions failing will result in DMARC failure through DKIM:
Condition 1: The message must have a valid DKIM signature. Condition 2: The From address in the email header must align with the domain in the DKIM signature. If the domain’s DMARC policy specifies strict alignment for DKIM, these domains must match exactly. If the domain’s DMARC policy specifies relaxed alignment for DKIM, the domain can be a subdomain of the From domain.
About configuring DMARC record :
You may refer to our document here to understand in detail about what is DMARC and how a DMARC record can be configured. It is a DNS record of type “TXT” that needs to be updated in authoritative zone file of the domain in concern. For example, DMARC record for domain “amazon.com” is set up in DNS of this domain as below:
This document has detailed explanation about syntax of a DMARC record and the associated implication of using each tag with a specific value.
A high level email flow via SES looks like this: —– Client Application—> SES—> Recipient ISP–> Recipient inbox —–
SES is a mail relay service, i.e., it takes the email from the sender mail server and forwards it to the recipient domain’s MTA. SES considers an email is successfully delivered as soon as it gets an 250 OK response from the recipient ISP. After the email is delivered, Amazon SES has no control over the email and can’t guarantee inbox placement. Internet service providers (ISPs) use different mechanisms and algorithms to filter emails to place them in either the recipient’s inbox folder or spam folder.
Some of the scenarios where you may need to investigate DMARC results are:
Your legitimate emails are being bounced by Recipient MTA
Your legitimate emails are landing in spam folder
Based on how you have configured your DMARC policy any of the above scenarios may occur. This is when we need to analyze your DMARC set up and raw headers received by recipient(in case of email landing in spam).
Email header analysis: In order to understand what was the authentication performed by recipient ISP and what was the result of it, it is required to analyse detailed headers received at recipient side. You may refer to our public blog here to understand how to gather raw email headers from inbox of recipient.
Below is a sample snippet of email headers captured from recipient inbox and captures DMARC failure:
Delivered-To: [email protected] Received: by 2002:a54:33ca:0:0:0:0:0 with SMTP id o10csp446075ect; Mon, 25 Apr 2022 05:56:54 -0700 (PDT) X-Google-Smtp-Source: ABdhPJzYtjfIvCYojV/yGDa/IWKE9sTfOs95kW9sKMV9bhx4B3GIuyOsGhvS+UUvw831ygQw4Tvt X-Received: by 2002:a05:622a:14d0:b0:2f3:4279:687c with SMTP id u16-20020a05622a14d000b002f34279687cmr11908123qtx.551.1650891414627; Mon, 25 Apr 2022 05:56:54 -0700 (PDT) ARC-Seal: i=1; a=rsa-sha256; t=1650891414; cv=none; d=google.com; s=arc-20160816; b=H3q0X5edXZe04nTYfoiyMWWiv+brEhRTc8+QuOOOa4s61q4FriokXnvMycU9M0/5Rk /CPz46yXdNKV3hlg7021dcowSMxUFoo3gAARXytmFapJVoYGAhpYqM3lFBXkfYYr8Vw/ 0CKlp/7bgtkW4Zo7QTT3nasNUIsF05/35zTBGM8H/RNPyCBhE94uLZf+b2b/SVV5KBa1 GRWh41rgvSgQYfOYkWb+5GmA0+sdkT5h8kP7vBeZhvrPmVLpyz+WAEMvDNz+htmmZAH5 A1D4E8XlEyanP174gQZSM8+xqUc7Hkdu5Fn28bN9cBICGVu//zTuL8xV9P3i2OcPJJjQ wlnA== ARC-Message-Signature: i=1; a=rsa-sha256; c=relaxed/relaxed; d=google.com; s=arc-20160816; h=feedback-id:date:message-id:subject:to:from:dkim-signature; bh=Gx2MAEm0xDXgqYf1y1e7XGf7LPovRt76Xkh1K6Z3T+w=; b=gRZV/qE9wWxs27C/je108Cu1NCr5AdGyeMnpf5jXsuDhC7TKvjSkBqcWPMontgY9WU Gc/WPM42zlSkJ7vNX/ey2mjc6gBdoQNHFen2Zq4JHvTe6vq4g7O/F7cPWDOsAK9QqYoP 5C6Hfd8WPVDY3WNv+2AhQfbXN6Q9H3k4XR/GsCDowYHScyTBJRb9z+sAWIOI4J2J0bda +TYIiUHzLexL69y3M1N3luMP1GnoD8H6NFPvd08CVJaYqRM2qKOoo6K1Oq0/FNiVMPF1 kdSkJ/1p2+V5YQM3679nuWqiZrK70+CsShsRTtBSBoiWtTft4rrlYKnr7wZLEEiVCKsZ 53QA== ARC-Authentication-Results: i=1; mx.google.com; dkim=pass [email protected] header.s=6gbrjpgwjskckoa6a5zn6fwqkn67xbtw header.b=GUxUTLBH; spf=pass (google.com: domain of 0100018060cbd9c7-d7da0315-7127-4369-b439-de6dd9b8d5e7-000000@amazonses.com designates 11.22.33.44 as permitted sender) smtp.mailfrom=0100018060cbd9c7-d7da0315-7127-4369-b439-de6dd9b8d5e7-000000@amazonses.com; dmarc=fail (p=QUARANTINE sp=QUARANTINE dis=QUARANTINE) header.from=amazon.com Return-Path: <0100018060cbd9c7-d7da0315-7127-4369-b439-de6dd9b8d5e7-000000@amazonses.com> Received: from a8-30.smtp-out.amazonses.com (a8-30.smtp-out.amazonses.com. [11.22.33.44]) by mx.google.com with ESMTPS id i13-20020ac85c0d000000b002f367d8d6bfsi873900qti.466.2022.04.25.05.56.54 for <[email protected]> (version=TLS1_2 cipher=ECDHE-ECDSA-AES128-GCM-SHA256 bits=128/128); Mon, 25 Apr 2022 05:56:54 -0700 (PDT) Received-SPF: pass (google.com: domain of 0100018060cbd9c7-d7da0315-7127-4369-b439-de6dd9b8d5e7-000000@amazonses.com designates 11.22.33.44 as permitted sender) client-ip=11.22.33.44; Authentication-Results: mx.google.com; dkim=pass [email protected] header.s=6gbrjpgwjskckoa6a5zn6fwqkn67xbtw header.b=GUxUTLBH; spf=pass (google.com: domain of 0100018060cbd9c7-d7da0315-7127-4369-b439-de6dd9b8d5e7-000000@amazonses.com designates 11.22.33.44 as permitted sender) smtp.mailfrom=0100018060cbd9c7-d7da0315-7127-4369-b439-de6dd9b8d5e7-000000@amazonses.com; dmarc=fail (p=QUARANTINE sp=QUARANTINE dis=QUARANTINE) header.from=amazon.com DKIM-Signature: v=1; a=rsa-sha256; q=dns/txt; c=relaxed/simple; s=6gbrjpgwjskckoa6a5zn6fwqkn67xbtw; d=amazonses.com; t=1650891414; h=From:To:Subject:Content-Type:Message-ID:Date:Feedback-ID; bh=ynH00ooK6J9gmzrcdqlUOWlsQMEivO17lTfThw55L2U=; b=GUxUTLBHFWyoCG/hLKzsdvrHfgHSSRN+UyY8x3T6kLnt4/a7Os54kmrEaIiVLqsY Zw2Z8H9ML4NjljwBdAO1M66l1+nl/Z5jNISykpp0BOYwSuD32IGLchNUCXyNmNyDahO opStirAtp+MFVGH1FtCwFxDmXu03rGTJhy5qzuEM= From: [email protected] To: [email protected]
The email in headers above was sent from a user having domain “amazon.com” to recipient using domain “gmail.com”. Now, DMARC compliance can pass either via SPF or DKIM. The logic basically works like below:
DMARC pass = (DKIM must pass) OR (SPF must pass)
So we will analyse DMARC compliance via DKIM and SPF one at a time:
Complying with DMARC through SPF
We shall look carefully at “Authentication-Results” header to see if SPF check passed. The sender IP is “11.22.33.44” and as per below details captured in “Authentication-Results”: — spf=pass (google.com: domain of 0100018060cbd9c7-d7da0315-7127-4369-b439-de6dd9b8d5e7-000000@amazonses.com designates 11.22.33.44 as permitted sender) —
From above snippet it can be confirmed that the recipient ISP could verify that sender IP 11.22.33.44 is designated as a valid sender. This confirms that recipient ISP validation on “Condition 1” stated above successfully passed.
Now, the “condition 2” states that the domain in the From address of the email header must align with the MAIL FROM domain. Let’s look at both these headers, sharing it below:
It can be observed that there is a mismatch in sender domain and MAIL FROM domain i.e. “amazon.com” and “amazonses.com” respectively. This happened because sender has not configured custom MAIL FROM domain in SES settings, so by default a subdomain of amazonses.com was used as default MAIL FROM domain. To resolve the issue, you should configure MAIL FROM domain which would be a subdomain of sender domain i.e. “amazon.com” in above case.
Complying with DMARC through DKIM
We shall look carefully at “Authentication-Results” header to see if DKIM check passed. Below are the details captured in “Authentication-Results”:
From above snippet it can be confirmed that the recipient ISP could verify DKIM signature was valid. This confirms that recipient ISP validation on “Condition 1” stated above successfully passed.
Now, the “condition 2” states that From address in the email header must align with the domain in the DKIM signature. The domain in the DKIM signature is “amazonses.com” as captured in value “d=amazonses.com” above. This value does not match with domain in header “From” i..e. amazon.com. Since the second condition failed, so overall DMARC compliance failed via DKIM as well. To resolve this issue, identity “[email protected]” using the domain “amazon.com” must have DKIM enabled. The document here has details about how to enable DKIM for a verified identity.
Now, since DMARC compliance failed both via DKIM as well as SPF overall DMARC compliance failed the received email. This is captured in header “Authentication-Results” below: — dmarc=fail (p=QUARANTINE sp=QUARANTINE dis=QUARANTINE) header.from=amazon.com — The value “p=QUARANTINE” will direct the recipient ISP to put email failing DMARC compliance into spam folder. However, it is up to the recipient ISP to take final action after they complete authentication checks.
Conclusion:
Overall, you will need to ensure that your domain complies with DMARC at least via SPF or DKIM. If DMARC set up for a domain is not complete, it is susceptible to deliverability issues like email landing in spam, being rejected or being blocked by recipient ISP. As a best practice, you can configure both DKIM and SPF to attain optimum deliverability while sending emails via SES. We hope the process of DMARC related analysis shared above helps you in troubleshooting DMARC compliance and configuring DMARC for your domains.
Whether you’re protecting your business against drive failures or optimizing performance, choosing the right RAID level for your NAS is important for data safety and efficiency. A simple question inspired this blog: At what size of RAID should you have a two-drive tolerance instead of one for your NAS device? The answer isn’t complex per se, but there were enough “if/thens” that we thought it warranted a bit more explanation.
So today, I’m explaining everything you need to know to choose the right RAID level for your needs, including their benefits, drawbacks, and different use cases.
Refresher: What’s NAS? What Is RAID?
NAS stands for network attached storage. It is an excellent solution for organizations and users that require shared access to large amounts of data. NAS provides cost-effective, centralized storage that can be accessed by multiple users, from different locations, simultaneously. However, as the amount of data stored on NAS devices grows, the risk of data loss also increases.
This is where RAID levels come into play. RAID stands for redundant array of independent disks (or “inexpensive disks” depending on who you ask). It’s crucial for NAS users to understand the different RAID levels so they can effectively protect data while ensuring optimal performance of their NAS system.
Both NAS devices and RAID are disk arrays. That is, they are a set of several hard disk drives (HDDs) and/or solid state drives (SSDs) that store large amounts of data, orchestrating the drives to work as one unit. The biggest difference is that NAS is configured to work over your network. That means that it’s easy to configure your NAS device to support RAID levels—you’re combining the RAID’s data storage strategy and the NAS’s user-friendly network capabilities to get the best of both worlds.
This combination allows NAS users to implement RAID types that align with their needs, whether for data redundancy, increased write performance, or a balance of both. With proper configuration, a NAS device equipped with RAID provides both flexibility and enhanced data protection.
What Is RAID Storage?
RAID was first introduced by researchers at the University of California, Berkeley in the late 1980s. The original paper, “A Case for Redundant Arrays of Inexpensive Disks (RAID)”, was authored by David Patterson, Garth A. Gibson, and Randy Katz, where they introduced the concept of combining multiple smaller disks into a single larger disk array for improved performance and data redundancy.
They also argued that the top-performing mainframe disk drives of the time could be beaten on performance by an array of the inexpensive drives. Since then, RAID has become a widely used data storage technology in the data storage industry, and many different levels of RAID levels evolved over time.
RAID storage is now utilized in systems ranging from NAS devices to enterprise-grade data centers, offering configurations that balance write performance, data protection, and fault tolerance. This flexibility makes RAID an important part of storage architectures, helping businesses and individuals store and protect their data blocks efficiently.
Different Types of RAID Storage Techniques
Before we learn more about the different types of RAID levels, it’s important to understand the different types of RAID storage techniques so that you will have a better understanding of how RAID levels work.
There are essentially three types of RAID storage techniques—striping, mirroring, and parity. Depending on the level, RAID systems combine these methods in different ways to achieve varying balances of performance, redundancy, and storage efficiency.
Striping
Striping distributes your data over multiple drives. If you use a NAS device, striping spreads the blocks that comprise your files across the available hard drives simultaneously. This allows you to create one large drive, giving you faster read and write access since data can be stored and retrieved concurrently from multiple disks. However, striping doesn’t provide any redundancy whatsoever, and it’s typically found in systems where performance is prioritized over data redundancy. If a single drive fails in the storage array, all data on the device can be lost. Striping is usually used in combination with other techniques, as we’ll explore below.
Striping
Mirroring
As the name suggests, mirroring makes a copy of your data. Data is written simultaneously to two disks, thereby providing redundancy by having two copies of the data. Even if one disk fails, your data can still be accessed from the other disk.
Mirroring
There’s also a performance benefit here for reading data—you can request blocks concurrently from the drives (e.g. you can request block 1 from HDD1 at the same time as block 2 from HDD2). The disadvantage is that mirroring requires twice as many disks for the same total storage capacity. Mirroring is typically used in RAID levels such as RAID 1 and RAID 10.
Parity
Parity is all about error detection and correction. The system creates an error correction code (ECC) and stores the code along with the data on the disk. This code allows the RAID controller to detect and correct errors that may occur during data transmission or storage, thereby reducing the risk of data corruption or data loss due to disk failure. If a drive fails, you can install a new drive and the NAS device will restore your files based on the previously created ECC.
Parity is commonly used in RAID 5 and RAID 6, and the latter uses double parity, meaning that two sets of parity data are stored for additional protection.
Parity
What Is RAID Fault Tolerance?
In addition to the different RAID storage techniques, the other essential factor to consider before choosing a RAID level is RAID fault tolerance.” RAID fault tolerance refers to the ability of a RAID configuration to continue functioning even in the event of a hard disk failure.
In other words, fault tolerance gives you an idea of how many drives you can afford to lose in a RAID level configuration, but continue to access or re-create the data.
Different RAID levels offer varying degrees of fault tolerance and redundancy, and it’s essential to understand the trade-offs in storage capacity, performance, and cost as we’ll cover next.
What Are the Different RAID Levels?
RAID levels are standardized by the Storage Networking Industry Association (SNIA) and are assigned a number based on how they affect data storage and redundancy.
While RAID levels evolved over time, the standard RAID levels available today are RAID 0, RAID 1, RAID 5, RAID 6, and RAID 10. In addition to RAID configurations, non-RAID drive architectures also exist like JBOD, which we’ll explain first.
Now that you understand the basics of RAID storage, let’s take a look at the different RAID level configurations for NAS devices, including their benefits, use cases, and degree of fault tolerance.
JBOD: Simple Arrangement, Data Written Across All Drives
JBOD, also referred to as “Just a Bunch of Disks” or “Just a Bunch of Drives”, is a storage configuration where multiple drives are combined as one logical volume. In JBOD, data is written in a sequential way, across all drives without any RAID configuration. This approach allows for flexible and efficient storage utilization, but it does not provide any data redundancy or fault tolerance.
JBOD: Just a bunch of disks.
JBOD has no fault tolerance to speak of. On the plus side, it’s the simplest storage arrangement, and all disks are available for use. But, there’s no data redundancy and no performance improvements.
RAID 0: Striping, Data Evenly Distributed Over All Disks
RAID 0, also referred to as a “stripe set” or “striped volume”, stores the data evenly across all disks. Blocks of data are written to each disk in the array in turn, resulting in faster read and write speeds. However, RAID 0 doesn’t provide fault tolerance or redundancy. The failure of one drive can cause the entire storage array to fail, resulting in total loss of data.
RAID 0 also has no fault tolerance. There are some pros: it’s easy to implement, you get faster read/write speeds, and it’s cost effective. But there’s no data redundancy and an increased risk of data loss.
RAID 0 is typically used in scenarios where speed is critical but data safety isn’t a priority, such as video editing or temporary storage of unimportant files.
RAID 0: Data evenly distributed across two drives.
Raid 0: The Math
We can do a quick calculation to illustrate how RAID 0, in fact, increases the chance of losing data. To keep the math easy, we’ll assume an annual failure rate (AFR) of 1%. This means that, out of a sample of 100 drives, we’d expect one of them to fail in the next year; that is, the probability of a given drive failing in the next year is 0.01.
Now, the chance of the entire RAID array failing–its AFR–is the chance that any of the disks fail. The way to calculate this is to recognize that the probability of the array surviving the year is simply the product of the probability of each drive surviving the year. Note: we’ll be rounding all results in this article to two significant figures.
Multiply the possibility of one drive failing by the number of drives you have. In this example, there are two.
0.99 x 0.99 = 0.98
Subtract that result from one to calculate the percentage. So, the AFR is:
1 – 0.98 = 0.02, or 2%
So the two-drive RAID array is twice as likely to fail as a single disk.
For larger arrays, the risk increases exponentially as the number of drives increases, which makes RAID 0 unsuitable for critical or long-term data storage.
RAID 1: Mirroring, Exact Copy of Data on Two or More Disks
RAID 1 uses disk mirroring to create an exact copy of a set of data on two or more disks to protect data from disk failure. The data is written to two or more disks simultaneously, resulting in disks that are identical copies of each other. If one disk fails, the data is still available on the other disk(s). The array can be repaired by installing a replacement disk and copying all the data from the remaining drive to the replacement. However, there is still a small chance that the remaining disk will fail before the copy is complete.
RAID 1 has a fault tolerance of one drive. Advantages include data redundancy and improved read performance. Disadvantages include reduced storage capacity compared to disk potential. It also requires twice as many disks as RAID 0.
RAID 1: Exact copy of data on two or more disks.
RAID 1: The Math
To calculate the AFR for a RAID 1 array, we need to take into account the time needed to repair the array—that is, to copy all of the data from the remaining good drive to the replacement. This can vary widely depending on the drive capacity, write speed, and whether the array is in use while it is being repaired.
For simplicity, let’s assume that it takes a day to repair the array, leaving you with a single drive. The chance that the remaining good drive will fail during that day is simply (1/365) x AFR:
(1/365) x 0.01 = 0.000027
Now, the probability that the entire array will fail is the probability that one drive will fail and also the remaining good drive fail during that one-day repair period:
0.01 x 0.000027 = 0.00000027
Since there are two drives, and so two possible ways for this to happen, we need to combine the probabilities as we did in the RAID 0 case:
1 – (1 – 0.00000027) x 2 = 0.00000055 = 0.000055%
That’s a tiny fraction of the AFR for a single disk—out of two million RAID arrays, we’d expect just one of them to fail over the course of a year, as opposed to 20,000 out of a population of two million single disks.
This calculation highlights how RAID 1 dramatically reduces the likelihood of data loss, making it a safer option than RAID 0 for critical data storage.
When AFRs are this small, we often flip the numbers around and talk about reliability in terms of “number of nines.” Reliability is the probability that a device will survive the year. Then, we just count the nines after the decimal point, disregarding the remaining figures. Our single drive has reliability a of 0.99, or two nines, and the RAID 0 array has just a single nine with a reliability of 0.98.
The reliability of this two-drive RAID 1 array, given our assumption that it will take a day to repair the array, is:
1 – 0.00000055 = 0.99999945
Counting the nines, we’d also call this six nines.
RAID 5: Striping and Parity With Error Correction
RAID 5 uses a combination of disk striping and parity to distribute data evenly across multiple disks, along with creating an error correction code. Parity, the error correction information, is calculated and stored in one block per stripe set. This way, even if there is a disk failure, the data can be reconstructed using error correction.
RAID 5 also has a fault tolerance of one drive. On the plus side, you get data redundancy and improved performance. It’s a cost-effective solution for those who need redundancy and performance. On the minus side, you only get limited fault tolerance: RAID 5 can only tolerate one disk failure. If two disks fail, data will be lost.
RAID 5 is well-suited for environments like web hosting or file servers where storage efficiency and reliability are critical but not at the cost of excessive redundancy.
RAID 5: Striping and parity distributed across disks.
RAID 5: The Math
Let’s do the math. The array fails when one disk fails, and any of the remaining disks fail during the repair period. A RAID 5 array requires a minimum of three disks. We’ll use the same numbers for AFR and repair time as we did previously.
We’ve already calculated the probability that either disk fails during the repair time as 0.000027.
And, given that there are three ways that this can happen, the AFR for the three-drive RAID array is:
1 – (1 – 0.000027)3 = 0.000082 = 0.0082%
To calculate the durability, we’d perform the same operation as previous sections (1 – AFR), which gives us four nines. That’s much better durability than a single drive, but much worse than a two-drive RAID 1 array. We’d expect 164 of two million three-drive RAID 5 arrays to fail. The tradeoff is in cost-efficiency—67% of the three-drive RAID 5 array’s disk space is available for data, compared with just 50% of the RAID 1 array’s disk space.
Increasing the number of drives to four increases the available space to 75%, but, since the array is now vulnerable to any of the three remaining drives failing, it also increases the AFR, to 0.033%, or just one nine.
RAID 6: Striping and Dual Parity With Error Correction
RAID 6 uses disk striping with dual parity. As with RAID 5, blocks of data are written to each disk in turn, but RAID 6 includes two parity blocks in each stripe set. This provides additional data protection compared to RAID 5, and a RAID 6 array can withstand two drive failures and continue to function.
With RAID 6, you get a fault tolerance of two drives. Advantages include higher data protection and improved performance. Disadvantages include reduced write speed. Due to dual parity, write transactions are slow. It also takes longer to repair the array because of its complex structure.
RAID 6 is ideal for large-scale environments like enterprise data centers where drive failures are more likely, and downtime is unacceptable.
RAID 6: Striping and dual parity with error correction.
RAID 6: The Math
The calculation for a four-drive RAID 6 array is similar to the four-drive RAID 5 case, but this time, we can calculate the probability that any two of the remaining three drives fail during the repair. First, the probability that a given pair of drives fail is:
(1/365) x (1/365) = 0.0000075
There are three ways this can happen, so the probability that any two drives fail is:
1 – (1 – 0.0000075)3 = 0.000022
So the probability of a particular drive failing, then a further two of the remaining three failing during the repair is:
0.01 * 0.000022 = 0.00000022
There are four ways that this can happen, so the AFR for a four-drive RAID array is therefore:
1 – (1 – 0.000000075)4 = 0.0000009, or 0.00009%
Subtracting our result from one, we calculate six nines of durability. We’d expect just two drives out of approximately two million to fail within a year. It’s not surprising that the AFR is similar to RAID 1, since, with a four-drive RAID 6 array, 50% of the storage is available for data.
As with RAID 5, we can increase the number of drives in the array, with a corresponding increase in the AFR. A five-drive RAID 6 array allows use of 60% of the storage, with an AFR of 0.00011%, or five nines; two of our approximately two million drives would fail.
RAID 1+0: Striping and Mirroring for Protection and Performance
RAID 1+0, also known as RAID 10, is a combination of RAID 0 and RAID 1, in which it combines both striping and mirroring to provide enhanced data protection and improved performance. In RAID 1+0, data is striped across multiple mirrored pairs of disks. This means that if one disk fails, the other disk on the mirrored pair can still provide access to the data.
RAID 1+0 requires a minimum of four disks, of which two will be used for striping and two for mirroring, allowing you to combine the speed of RAID 0 with the dependable data protection of RAID 1. It can tolerate multiple disk failures as long as they are not in the same mirrored pair of disks.
With RAID 1+0, you get a fault tolerance of one drive per mirrored set. This gives you high data protection and improved performance over RAID 1 or RAID 5. However, it comes at a higher cost as it requires more disks for data redundancy. Your storage capacity is also reduced (only 50% of the total disk space is usable).
RAID 10: Striping and mirroring for protection and performance.
The below table shows a quick summary of the different RAID levels, their storage methods, and their fault tolerance levels.
RAID Level
Storage Method
Fault Tolerance
Advantages
Disadvantages
JBOD
Just a bunch of disks
None
Simplest storage arrangement.
All disks are available for use.
No data redundancy.
No performance improvements.
RAID 0
Block-level striping
None
Easy to implement.
Faster read and write speeds.
Cost-effective.
No data redundancy.
Increased risk of data loss.
RAID 1
Mirroring
One drive
Data redundancy.
Improved read performance.
Reduced storage capacity compared to disk potential.
Requires twice as many disks.
RAID 5
Block-level striping with distributed parity
One drive
Data redundancy.
Improved performance.
Cost-effective for those who need redundancy and performance.
Limited fault tolerance.
RAID 6
Block-level striping with dual distributed parity
Two drives
Higher data protection.
Improved performance.
Reduced write speed: Due to dual parity, write transactions are slow.
Repairing the array takes longer because of its complex structure.
RAID 1+0
Block-level striping with mirroring
One drive per mirrored set
High data protection.
Improved performance over RAID 1 and RAID 5.
Higher cost, as it requires more disks for data redundancy.
Reduced storage capacity.
How Many Parity Disks Do I Need?
We’ve limited ourselves to the standard RAID levels in this article. It’s not uncommon for NAS vendors to offer proprietary RAID configurations offering features such as the ability to combine different sizes of disks into a single array, but the calculation usually comes down to fault tolerance, which is the same as the number of parity drives in the array.
The common case of a four-drive NAS device, assuming a per-drive AFR of 1% and a repair time of one day:
RAID Level
Storage Method
Fault Tolerance Level
Notes
RAID 2
Bit-level striping, variable number of dedicated parity disks
Variable
More complex than RAID 5 and 6 with negligible gains.
RAID 3
Byte-level striping, dedicated parity drive
One drive
Again, more complex than RAID 5 and 6 with no real benefit.
RAID 4
Block-level striping, dedicated parity drive
One drive
The dedicated parity drive is a bottleneck for writing data, and there is no benefit over RAID 5.
RAID 5, dedicating a single disk to parity, is a good compromise between space efficiency and reliability. Its AFR of 0.033% equates to an approximately one in 3000 chance of failure per year. If you prefer longer odds, then you can move to mirroring or two parity drives, giving you odds of between one in one million and one in three million.
A note on our assumptions: In our calculations, we assume that it will take one day to repair the array in case of disk failure. So, as soon as the disk fails, the clock is ticking! If you have to go buy a disk, or wait for an online order to arrive, that repair time increases, with a corresponding increase in the chances of another disk failing during the repair. A common approach is to buy a NAS device that has space for a “hot spare”, so that the replacement drive is always ready for action. If the NAS device detects a drive failure, it can immediately bring the hot spare online and start the repair process, minimizing the chances of a second, catastrophic, failure.
Even the Highest RAID Level Still Leaves You Vulnerable
Like we said, answering the question “What RAID level do you need?” isn’t super complex, but there are a lot of if/thens. Now, you should have a good understanding of the different RAID levels, the fault tolerance they provide, and their pros and cons. But, even with the highest RAID level, your data could still be vulnerable.
While different RAID levels offer different levels of data redundancy, they are not enough to provide complete data protection for NAS devices. RAID provides protection against physical disk failures by storing multiple copies of NAS data on different disks to achieve fault tolerance objectives. However, it does not protect against the broader range of events that could result in data loss, including natural disasters, theft, or ransomware attacks. Neither does RAID protect against user error. If you inadvertently delete an important file from your NAS device, it’s gone from that array, no matter how parity disks you have.
Of course, that assumes you have no backup files. To ensure complete NAS data protection, it’s important to implement additional measures for a complete backup strategy, such as off-site cloud backup—not that we’re biased or anything. Cloud storage solutions are an effective tool to protect your NAS data with a secure, off-site cloud backup, ensuring your data is secured against various data loss threats or other events that could affect the physical location of the NAS.
At the end of the day, taking a multi-layered approach is the safest way to protect your data. RAID is an important component to achieve data redundancy, but additional measures should also be taken for increased cyber resilience.
We’d love to hear from you about any additional measures you’re taking to protect your NAS data besides RAID. Share your thoughts and experiences in the comments below.
As ferramentas de programação de IA generativa estão transformando a maneira como as pessoas desenvolvedoras abordam as tarefas diárias de programação. Desde a documentação de nossas bases de código até a geração de testes de unidade, essas ferramentas estão ajudando a acelerar nossos fluxos de trabalho. No entanto, assim como acontece com qualquer tecnologia emergente, sempre há uma curva de aprendizado. Como resultado, as pessoas desenvolvedoras — tanto iniciantes quanto experientes — às vezes se sentem frustradas quando os assistentes de programação baseados em IA não geram o resultado desejado. (Familiar com isso?)
Por exemplo, ao pedir ao GitHub Copilot para desenhar uma casquinha de sorvete usando p5.js, uma biblioteca JavaScript para código criativo, continuamos recebendo sugestões irrelevantes ou, às vezes, nenhuma sugestão. Mas quando aprendemos mais sobre a maneira como o GitHub Copilot processa as informações, percebemos que precisávamos ajustar a maneira como nos comunicamos com elas.
Aqui está um exemplo do GitHub Copilot gerando uma solução irrelevante:
Quando ajustamos nosso prompt, conseguimos gerar resultados mais precisos:
Somos desenvolvedoras e entusiastas de IA. Eu, Rizel, usei o GitHub Copilot para criar uma extensão de navegador; jogo de pedra, papel e tesoura; e para enviar um Tweet. E eu, Michele, abri uma empresa de AI em 2021. Somos ambas Developer Advocates no GitHub e adoramos compartilhar nossas principais dicas para trabalhar com o GitHub Copilot.
Neste guia do GitHub Copilot, abordaremos:
O que exatamente é um prompt e o que é engenharia de prompt também (dica: depende se você está falando com uma pessoa desenvolvedora ou pesquisadora de machine learning)
Três práticas recomendadas e três dicas adicionais para criação imediata com o GitHub Copilot
Um exemplo em que você pode tentar solicitar ao GitHub Copilot para ajudá-lo a criar uma extensão de navegador
Progresso antes de perfeição
Mesmo com nossa experiência no uso de IA, reconhecemos que todes estão em uma fase de tentativa e erro com a tecnologia de IA generativa. Também conhecemos o desafio de fornecer dicas generalizadas de criação de prompts porque os modelos variam, assim como os problemas individuais nos quais as pessoas desenvolvedoras estão trabalhando. Este não é um guia definitivo. Em vez disso, estamos compartilhando o que aprendemos sobre criação de prompts para acelerar o aprendizado coletivo durante esta nova era de desenvolvimento de software.
O que é um prompt e o que é engenharia de prompt?
Depende de com quem você fala.
No contexto das ferramentas de programação de IA generativa, um prompt pode significar coisas diferentes, dependendo se você está perguntando a pessoas pesquisadoras de Machine Learning (ML) que estão construindo e ajustando essas ferramentas ou pessoas desenvolvedoras que as estão usando em seus IDEs.
Para este guia, definiremos os termos do ponto de vista de uma pessoa desenvolvedora que está usando uma ferramenta de programação AI generativa no IDE. Mas, para dar a você uma visão completa, também adicionamos as definições do pesquisador de ML abaixo em nosso gráfico.
Prompts
Engenharia de Prompt
Contexto
Pessoa Desenvolvedora
Blocos de código, linhas individuais de código ou comentários em linguagem natural que uma pessoa desenvolvedora escreve para gerar uma sugestão específica do GitHub Copilot.
Fornecer instruções ou comentários no IDE/strong> para gerar sugestões de código específicas.
DDetalhes que são fornecidos por uma pessoa desenvolvedora para especificar a saída desejada de uma ferramenta de programação AI generativa.
Pessoa Pesquisadora de ML
Compilação de código de IDE
e contexto relevante (comentários IDE, código em arquivos abertos, etc.) que são continuamente gerados por algoritmos e enviados para o modelo de uma ferramenta de programação AI generativa
3 melhores práticas para construção de prompt com GitHub Copilot
1. Defina o cenário com um objetivo de alto nível
Isso é mais útil se você tiver um arquivo em branco ou uma base de código vazia. Em outras palavras, se o GitHub Copilot não tiver contexto do que você deseja criar ou realizar, definir o cenário para a programação em par AI pode ser realmente útil. Isso ajuda a preparar o GitHub Copilot com uma descrição geral do que você deseja gerar – antes de entrar nos detalhes.
Ao solicitar o GitHub Copilot, pense no processo como uma conversa com alguém: como devo detalhar o problema para que possamos resolvê-lo juntes? Como eu abordaria a programação em par com essa pessoa?
Por exemplo, ao construir um editor de markdown em Next.jst, poderíamos escrever um comentário como este:
/*
Crie um editor de markdown básico em Next.jcom as seguintes habilidades:
- Use react hooks
- Crie um estado para markdown com texto default "digite markdown aqui"
- Uma área de texto onde pessoas usuárias podem escrever markdown a
- Mostre uma demostração ao vivo do markdown enquando a pessoas digitaS
- Suporte para sintaxe básica de markdown como cabeçalhos, negrito, itálico
- Use React markdown npm package
- O texto markdown e resultado em HTML devem ser salvos no estado do componente e atualizado em tempo real
*/
Isso solicitará que o GitHub Copilot gere o código a seguir e produza um editor de markdown muito simples, sem estilo, mas funcional, em menos de 30 segundos. Podemos usar o tempo restante para estilizar o componente:
Observação: esse nível de detalhe ajuda a criar um resultado mais desejado, mas os resultados ainda podem ser não determinísticos. Por exemplo, no comentário, solicitamos ao GitHub Copilot que criasse um texto padrão que diz “digite markdown aqui”, mas, em vez disso, gerou “visualização de markdown” como as palavras padrão.
2. Faça sua pergunta simples e específica. Procure receber uma saída curta do GitHub Copilot.
Depois de comunicar seu objetivo principal ao Copilot, articule a lógica e as etapas que ele precisa seguir para atingir esse objetivo. O GitHub Copilot entende melhor seu objetivo quando você detalha as coisas. (Imagine que você está escrevendo uma receita. Você dividiria o processo de cozimento em etapas discretas – não escreveria um parágrafo descrevendo o prato que deseja fazer.)
Deixe o GitHub Copilot gerar o código após cada etapa, em vez de pedir que ele gere vários códigos de uma só vez.
Aqui está um exemplo de nós fornecendo ao GitHub Copilot instruções passo a passo para reverter uma função:
3. De alguns exemplos para o GitHub Copilot.
Aprender com exemplos não é útil apenas para humanos, mas também para seu programador Copilot. Por exemplo, queríamos extrair os nomes do array de dados abaixo e armazená-los em um novo array:
Três dicas adicionais para criação imediata com o GitHub Copilot
Aqui estão três dicas adicionais para ajudar a orientar sua conversa com o GitHub Copilot.
1. Experimente com seus prompts.
Assim como a conversa é mais uma arte do que uma ciência, o mesmo acontece com a criação imediata. Portanto, se você não receber o que deseja na primeira tentativa, reformule seu prompt seguindo as práticas recomendadas acima.
Por exemplo, o prompt abaixo é vago. Ele não fornece nenhum contexto ou limites para o GitHub Copilot gerar sugestões relevantes.
# Escreva algum código para grades.py
Repetimos o prompt para sermos mais específicos, mas ainda não obtivemos o resultado exato que procurávamos. Este é um bom lembrete de que adicionar especificidade ao seu prompt é mais difícil do que parece. É difícil saber, desde o início, quais detalhes você deve incluir sobre seu objetivo para gerar as sugestões mais úteis do GitHub Copilot. É por isso que encorajamos a experimentação.
A versão do prompt abaixo é mais específica que a anterior, mas não define claramente os requisitos de entrada e saída.
# Implemente uma função em grades.py para calcular a nota média
Experimentamos o prompt mais uma vez definindo limites e delineando o que queríamos que a função fizesse. Também reformulamos o comentário para que a função fosse mais clara (dando ao GitHub Copilot uma intenção clara de verificação).
Desta vez, obtivemos os resultados que procurávamos.
# Implemente a função calculate_average_grade em grades.py que recebe uma lista de notas como entrada e retorna a nota média como um número de ponto flutuante
2. Mantenha algumas abas abertas.
Não temos um número exato de abas que você deve manter abertas para ajudar o GitHub Copilot a contextualizar seu código, mas, com base em nossa experiência, descobrimos que uma ou duas são úteis.
O GitHub Copilot usa uma técnica chamada de abas vizinhas que permite que a ferramenta programadora em par AI contextualize seu código processando todos os arquivos abertos em seu IDE em vez de apenas um único arquivo em que você está trabalhando. No entanto, não é garantido que o GitHub Copilot considere todos os arquivos abertos como contexto necessário para o seu código.
3. Use boas práticas de programação.
Isso inclui fornecer nomes e funções de variáveis descritivas e seguir estilos e padrões de codificação consistentes. Descobrimos que trabalhar com o GitHub Copilot nos encoraja a seguir boas práticas de programação que aprendemos ao longo de nossas carreiras.
Por exemplo, aqui usamos um nome de função descritivo e seguimos os padrões da base de código para alavancar casos de cobra.
def authenticate_user(username, password):
Como resultado, GitHub Copilot gera uma sugestão de código relevante:
def authenticate_user(username, password):
# Code for authenticating the user
if is_valid_user(username, password):
generate_session_token(username)
return True
else:
return False
Compare isso com o exemplo abaixo, onde introduzimos um estilo de programação inconsistente e nomeamos mal nossa função.
def rndpwd(l):
Em vez de sugerir código, o GitHub Copilot gerou um comentário que dizia: “O código vai aqui”.
def rndpwd(l):
# Code goes here
Fique esperto
Os LLMs por trás das ferramentas de programação de IA generativas são projetados para encontrar e extrapolar padrões de seus dados de treinamento, aplicar esses padrões à linguagem existente e, em seguida, produzir código que siga esses padrões. Dada a escala desses modelos, eles podem gerar uma sequência de código que ainda nem existe. Assim como você revisaria o código de um colega, você deve sempre avaliar, analisar e validar o código gerado por IA.
Las herramientas de codificación con IA generativa están transformando la forma en que los desarrolladores abordan las tareas de codificación diarias. Desde documentar nuestras bases de código hasta generar pruebas unitarias, estas herramientas están ayudando a acelerar nuestros flujos de trabajo. Sin embargo, como con cualquier tecnología emergente, siempre hay una curva de aprendizaje. Como resultado, los desarrolladores, tanto principiantes como experimentados, a veces se sienten frustrados cuando los asistentes de codificación impulsados por IA no generan el resultado que quieren. (¿Te suena familiar?)
Por ejemplo, al pedirle a GitHub Copilot que dibuje un cono de helado usando p5.js, una biblioteca de JavaScript para codificación creativa, seguimos recibiendo sugerencias irrelevantes, o a veces ninguna sugerencia en absoluto. Pero cuando aprendimos más sobre la forma en que GitHub Copilot procesa la información, nos dimos cuenta de que teníamos que ajustar la forma en que nos comunicábamos.
Aquí hay un ejemplo de GitHub Copilot generando una solución irrelevante:
Cuando ajustamos nuestra instrucción, pudimos generar resultados más precisos:
Somos tanto desarrolladoras como entusiastas de la IA. Yo, Rizel, he utilizado GitHub Copilot para construir una extensión de navegador; un juego de piedra, papel o tijera; y para enviar un tweet. Y yo, Michelle, lancé una compañía de IA en 2016. Ambas somos DevRel en GitHub y nos encanta compartir nuestros mejores consejos para trabajar con GitHub Copilot.
En esta guía para GitHub Copilot, cubriremos:
Qué es exactamente un “prompt” y qué es la ingeniería de prompts (pista: depende de si estás hablando con un desarrollador o con un investigador de aprendizaje automático)
Tres mejores prácticas y tres consejos adicionales para la creación de prompts con GitHub Copilot
Un ejemplo donde puedes probar a GitHub Copilot para que te ayude en la construcción de una extensión de navegador
Progreso sobre perfección
Incluso con nuestra experiencia usando IA, reconocemos que todos están en una fase de prueba y error con la tecnología de IA generativa. También conocemos el desafío de proporcionar consejos generales de elaboración de prompts porque los modelos varían, al igual que los problemas individuales en los que los desarrolladores están trabajando. Esta no es una guía definitiva. En su lugar, estamos compartiendo lo que hemos aprendido sobre la elaboración de prompts para acelerar el aprendizaje colectivo durante esta nueva era del desarrollo de software.
¿Qué es un “prompt” y qué es la ingeniería de prompt?
Depende de con quién hables.
En el contexto de las herramientas de codificación de IA generativa, un prompt puede significar diferentes cosas, dependiendo de si está preguntando a los investigadores de aprendizaje automático (ML) que están construyendo y ajustando estas herramientas, o a los desarrolladores que las están usando en sus IDE.
Para esta guía, definiremos los términos desde el punto de vista de un desarrollador que utiliza una herramienta de codificación de IA generativa en el IDE. Pero para brindarle una imagen completa, también agregamos las definiciones de investigador de ML a continuación.
Prompts
Ingenieria de Prompt
Contexto
Desarrollador
Bloques de código, líneas individuales de código, o comentarios en lenguaje natural que un desarrollador escribe para generar una sugerencia específica de GitHub Copilot.
Proporcionar instrucciones o comentarios en el IDE para generar sugerencias de código específicas
Detalles que proporciona un desarrollador para especificar la prompt deseada de una herramienta de codificación generativa de IA
Investigador de ML
Compilación de código de IDE y contexto relevante (comentarios de IDE, código en archivos abiertos, etc.) que se genera continuamente por algoritmos y se envíaal modelo de una herramienta de codificación generativa de IA
3 mejores prácticas para la elaboración de prompts con GitHub Copilot
1. Establecer el escenario con un objetivo de alto nivel.
Esto es más útil si tienes un archivo en blanco o una base de código vacía. En otras palabras, si GitHub Copilot no tiene ningún contexto de lo que quieres construir o lograr, establecer el escenario para el programador par de IA puede ser realmente útil. Ayuda a preparar a GitHub Copilot con una descripción general de lo que quieres que genere, antes de que te sumerjas en los detalles.
Al hacer prompts, GitHub Copilot, piensa en el proceso como si estuvieras teniendo una conversación con alguien: ¿Cómo debería desglosar el problema para que podamos resolverlo juntos? ¿Cómo abordaría la programación en pareja con esta persona?
Por ejemplo, al construir un editor de markdown en Next.js, podríamos escribir un comentario como este:
//
Crea un editor de markdown básico en Next.js con las siguientes características:
- Utiliza hooks de React
- Crea un estado para markdown con texto predeterminado "escribe markdown aquí"
- Un área de texto donde los usuarios pueden escribir markdown
- Muestra una vista previa en vivo del texto de markdown mientras escribo
- Soporte para la sintaxis básica de markdown como encabezados, negrita, cursiva
- Utiliza el paquete npm de React markdown
- El texto de markdown y el HTML resultante deben guardarse en el estado del componente y actualizarse en tiempo real
*/
Esto hará que GitHub Copilot genere el siguiente código y produzca un muy editor de rebajas simple, sin estilo pero funcional en menos de 30 segundos. Podemos usar el tiempo restante para diseñar el componente:
Nota: Este nivel de detalle te ayuda a crear una prompt más deseada, pero los resultados aún pueden ser no deterministas. Por ejemplo, en el comentario, solicitamos a GitHub Copilot que cree un texto predeterminado que diga “escribe markdown aquí”, pero en cambio generó “vista previa de markdown” como las palabras predeterminadas.
2. Haz tu solicitud simple y específica. Apunta a recibir una prompt corta de GitHub Copilot.
Una vez que comunicas tu objetivo principal al programador par AI, articula la lógica y los pasos que debe seguir para alcanzar ese objetivo. GitHub Copilot comprende mejor tu objetivo cuando desglosas las cosas. (Imagina que estás escribiendo una receta. Desglosarías el proceso de cocción en pasos discretos, no escribirías un párrafo describiendo el plato que quieres hacer.)
Deja que GitHub Copilot genere el código después de cada paso, en lugar de pedirle que genere un montón de código de una sola vez.
Aquí tienes un ejemplo de cómo proporcionamos a GitHub Copilot instrucciones paso a paso para invertir una función:
3. Proporciona a GitHub Copilot uno o dos ejemplos.
Aprender de ejemplos no solo es útil para los humanos, sino también para tu programador par AI. Por ejemplo, queríamos extraer los nombres del siguiente arreglo de datos y almacenarlos en un nuevo arreglo:
Cuando no le mostramos un ejemplo a GitHub Copilot …
// Mapee a través de una matriz de matrices de objetos para transformar datos
const data = [
  [
    { name: 'John', age: 25 },
    { name: 'Jane', age: 30 }
  ],
  [
    { name: 'Bob', age: 40 }
  ]
];
Tres consejos adicionales para la elaboración de prompts con GitHub Copilot
Aquí tienes tres consejos adicionales para ayudarte a guiar tu conversación con GitHub Copilot.
1. Experimenta con tus prompts.
Al igual que la conversación es más un arte que una ciencia, también lo es la elaboración de prompts. Así que, si no recibes lo que quieres en el primer intento, reformula tu prompts siguiendo las mejores prácticas mencionadas anteriormente.
Por ejemplo, la prompts de abajo es vaga. No proporciona ningún contexto ni límites para que GitHub Copilot genere sugerencias relevantes.
# Escribe algo de código para grades.py
Iteramos en el prompt para ser más específicos, pero aún no obtuvimos el resultado exacto que estábamos buscando. Este es un buen recordatorio de que añadir especificidad a tu prompt es más difícil de lo que parece. Es difícil saber, desde el principio, qué detalles debes incluir sobre tu objetivo para generar las sugerencias más útiles de GitHub Copilot. Por eso animamos a la experimentación.
La versión del promopt de abajo es más específica que la de arriba, pero no define claramente los requisitos de entrada y salida.
# Implementar una función en grades.py para calcular la nota media
Experimentamos una vez más con el promopt estableciendo límites y delineando lo que queríamos que hiciera la función. También reformulamos el comentario para que la función fuera más clara (dándole a GitHub Copilot una intención clara contra la que verificar).
Esta vez, obtuvimos los resultados que estábamos buscando.
# Implementa la función calculate_average_grade en grades.py que toma una lista de calificaciones como entrada y devuelve la calificación media como un número flotante.
2. Mantén un par de pestañas relevantes abiertas.
No tenemos un número exacto de pestañas que debas mantener abiertas para ayudar a GitHub Copilot a contextualizar tu código, pero en nuestra experiencia, hemos encontrado que una o dos es útil.
GitHub Copilot utiliza una técnica llamada pestañas vecinas que permite al programador de pares de IA contextualizar su código procesando todos los archivos abiertos en su IDE en lugar de solo el archivo en el que está trabajando. Sin embargo, no se garantiza que GItHub Copilot considere todos los archivos abiertos como contexto necesario para su código.
3. Utilice buenas prácticas de codificación.
Eso incluye proporcionar nombres y funciones de variables descriptivas, y seguir estilos y patrones de codificación consistentes. Hemos descubierto que trabajar con GitHub Copilot nos anima a seguir las buenas prácticas de codificación que hemos aprendido a lo largo de nuestras carreras.
Por ejemplo, aquí usamos un nombre de función descriptiva y seguimos los patrones de la base de código para aprovechar el caso de la serpiente.
def authenticate_user(nombre de usuario, contraseña):
Como resultado, GitHub Copilot generó una sugerencia de código relevante:
def authenticate_user(nombre de usuario, contraseña):
# Código para autenticar al usuario
Si is_valid_user(nombre de usuario, contraseña):
generate_session_token(nombre de usuario)
return True
más:
return Falso
Compare esto con el siguiente ejemplo, donde introdujimos un estilo de codificación inconsistente y mal nombramos nuestra función.
def rndpwd(l):
En lugar de sugerir código, GitHub Copilot generó un comentario que decía: “El código va aquí”.
def rndpwd(l):
# El código va aquí
Mantente inteligente
Los LLM detrás de las herramientas generativas de codificación de IA están diseñados para encontrar y extrapolar patrones de sus datos de entrenamiento, aplicar esos patrones al lenguaje existente y luego producir código que siga esos patrones. Dada la gran escala de estos modelos, podrían generar una secuencia de código que ni siquiera existe todavía. Al igual que revisaría el código de un colega, siempre debe evaluar, analizar y validar el código generado por IA.
Generative AI coding tools are transforming the way developers approach daily coding tasks. From documenting our codebases to generating unit tests, these tools are helping to accelerate our workflows. However, just like with any emerging tech, there’s always a learning curve. As a result, developers—beginners and experienced alike— sometimes feel frustrated when AI-powered coding assistants don’t generate the output they want. (Feel familiar?)
For example, when asking GitHub Copilot to draw an ice cream cone using p5.js, a JavaScript library for creative coding, we kept receiving irrelevant suggestions—or sometimes no suggestions at all. But when we learned more about the way that GitHub Copilot processes information, we realized that we had to adjust the way we communicated with it.
Here’s an example of GitHub Copilot generating an irrelevant solution:
When we adjusted our prompt, we were able to generate more accurate results:
We’re both developers and AI enthusiasts ourselves. I, Rizel, have used GitHub Copilot to build a browser extension, rock, paper, scissors game, and to send a Tweet. And I, Michelle, launched an AI company in 2016. We’re both developer advocates at GitHub and love to share our top tips for working with GitHub Copilot.
An example where you can try your hand at prompting GitHub Copilot to assist you in building a browser extension.
Progress over perfection
Even with our experience using AI, we recognize that everyone is in a trial and error phase with generative AI technology. We also know the challenge of providing generalized prompt-crafting tips because models vary, as do the individual problems that developers are working on. This isn’t an end-all, be-all guide. Instead, we’re sharing what we’ve learned about prompt crafting to accelerate collective learning during this new age of software development.
What’s a prompt and what is prompt engineering?
It depends on who you talk to.
In the context of generative AI coding tools, a prompt can mean different things, depending on whether you’re asking machine learning (ML) researchers who are building and fine-tuning these tools, or developers who are using them in their IDEs.
For this guide, we’ll define the terms from the point of view of a developer who’s using a generative AI coding tool in the IDE. But to give you the full picture, we also added the ML researcher definitions below in our chart.
Prompts
Prompt engineering
Context
Developer
Code blocks, individual lines of code, or natural language comments a developer writes to generate a specific suggestion from GitHub Copilot
Providing instructions or comments in the IDE to generate specific coding suggestions
Details that are provided by a developer to specify the desired output from a generative AI coding tool
ML researcher
Compilation of IDE code and relevant context (IDE comments, code in open files, etc.) that is continuously generated by algorithms and sent to the model of a generative AI coding tool
3 best practices for prompt crafting with GitHub Copilot
1. Set the stage with a high-level goal.
This is most helpful if you have a blank file or empty codebase. In other words, if GitHub Copilot has zero context of what you want to build or accomplish, setting the stage for the AI pair programmer can be really useful. It helps to prime GitHub Copilot with a big picture description of what you want it to generate—before you jump in with the details.
When prompting GitHub Copilot, think of the process as having a conversation with someone: How should I break down the problem so we can solve it together? How would I approach pair programming with this person?
For example, when building a markdown editor in Next.jst, we could write a comment like this
/*
Create a basic markdown editor in Next.js with the following features:
- Use react hooks
- Create state for markdown with default text "type markdown here"
- A text area where users can write markdown
- Show a live preview of the markdown text as I type
- Support for basic markdown syntax like headers, bold, italics
- Use React markdown npm package
- The markdown text and resulting HTML should be saved in the component's state and updated in real time
*/
This will prompt GitHub Copilot to generate the following code and produce a very simple, unstyled but functional markdown editor in less than 30 seconds. We can use the remaining time to style the component:
Note: this level of detail helps you to create a more desired output, but the results may still be non-deterministic. For example, in the comment, we prompted GitHub Copilot to create default text that says “type markdown here” but instead it generated “markdown preview” as the default words.
2. Make your ask simple and specific. Aim to receive a short output from GitHub Copilot.
Once you communicate your main goal to the AI pair programmer, articulate the logic and steps it needs to follow for achieving that goal. GitHub Copilot better understands your goal when you break things down. (Imagine you’re writing a recipe. You’d break the cooking process down into discrete steps–not write a paragraph describing the dish you want to make.)
Let GitHub Copilot generate the code after each step, rather than asking it to generate a bunch of code all at once.
Here’s an example of us providing GitHub Copilot with step-by-step instructions for reversing a function:
3. Give GitHub Copilot an example or two.
Learning from examples is not only useful for humans, but also for your AI pair programmer. For instance, we wanted to extract the names from the array of data below and store it in a new array:
Three additional tips for prompt crafting with GitHub Copilot
Here are three additional tips to help guide your conversation with GitHub Copilot.
1. Experiment with your prompts.
Just how conversation is more of an art than a science, so is prompt crafting. So, if you don’t receive what you want on the first try, recraft your prompt by following the best practices above.
For example, the prompt below is vague. It doesn’t provide any context or boundaries for GitHub Copilot to generate relevant suggestions.
# Write some code for grades.py
We iterated on the prompt to be more specific, but we still didn’t get the exact result we were looking for. This is a good reminder that adding specificity to your prompt is harder than it sounds. It’s difficult to know, from the start, which details you should include about your goal to generate the most useful suggestions from GitHub Copilot. That’s why we encourage experimentation.
The version of the prompt below is more specific than the one above, but it doesn’t clearly define the input and output requirements.
# Implement a function in grades.py to calculate the average grade
We experimented with the prompt once more by setting boundaries and outlining what we wanted the function to do. We also rephrased the comment so the function was more clear (giving GitHub Copilot a clear intention to verify against).
This time, we got the results we were looking for.
# Implement the function calculate_average_grade in grades.py that takes a list of grades as input and returns the average grade as a floating-point number
2. Keep a couple of relevant tabs open.
We don’t have an exact number of tabs that you should keep open to help GitHub Copilot contextualize your code, but from our experience, we’ve found that one or two is helpful.
GitHub Copilot uses a technique called neighboring tabs that allows the AI pair programmer to contextualize your code by processing all of the files open in your IDE instead of just the single file you’re working on. However, it’s not guaranteed that GItHub Copilot will deem all open files as necessary context for your code.
3. Use good coding practices.
That includes providing descriptive variable names and functions, and following consistent coding styles and patterns. We’ve found that working with GitHub Copilot encourages us to follow good coding practices we’ve learned throughout our careers.
For example, here we used a descriptive function name and followed the codebase’s patterns of leveraging snake case.
def authenticate_user(username, password):
As a result, GitHub Copilot generated a relevant code suggestion:
def authenticate_user(username, password):
    # Code for authenticating the user
    if is_valid_user(username, password):
        generate_session_token(username)
        return True
    else:
        return False
Compare this to the example below, where we introduced an inconsistent coding style and poorly named our function.
def rndpwd(l):
Instead of suggesting code, GitHub Copilot generated a comment that said, “Code goes here.”
def rndpwd(l):
    # Code goes here
Stay smart
The LLMs behind generative AI coding tools are designed to find and extrapolate patterns from their training data, apply those patterns to existing language, and then produce code that follows those patterns. Given the sheer scale of these models, they might generate a code sequence that doesn’t even exist yet. Just as you would review a colleague’s code, you should always assess, analyze, and validate AI-generated code.
Вицепрезидентът на Република България Илияна Йотова откри Международната младежка конференция на тема „Спасяването на българските евреи – възможен модел на поведение за младите хора днес”, която се провежда днес в…
Are you looking for an efficient way to handle incoming emails and streamline your email processing workflows? In this blog post, we’ll guide you through setting up Amazon Simple Email Service (SES) for incoming email, focusing on the setup, monitoring, and use of receipt rules to optimize your email handling.
Amazon SES is a powerful and flexible cloud-based email service that enables you to send and receive emails at scale, while ensuring high deliverability and maintaining compliance with email best practices. By using Amazon SES for incoming email, you can customize your email processing pipeline and seamlessly integrate with other AWS services such as Amazon S3, AWS Lambda, and Amazon SNS.
We’ll start by walking you through the process of verifying your domain and setting up DomainKeys Identified Mail (DKIM) to ensure your emails are secure and authenticated. Next, we’ll explain how to create and manage receipt rule sets and add receipt rules with various actions for different processing scenarios. We’ll also cover monitoring your email processing using Amazon CloudWatch metrics.
As we progress, we’ll dive into advanced topics such as conditional receipt rules and chaining receipt rules, which can help you build complex and tailored email processing workflows, including multi-tenant scenarios. By the end of this post, you’ll have a comprehensive understanding of how to harness the power of Amazon SES for your incoming email needs.
So, let’s get started on simplifying your incoming email processing with Amazon SES!
Setting up Amazon SES for email receiving
Identifying the AWS region
For new users of the Amazon Simple Email Service (SES) inbound feature, it’s important to understand that all AWS resources used for receiving email with Amazon SES, except for Amazon S3 buckets, need to be in the same AWS Region as the Amazon SES endpoint. This means that if you are using Amazon SES in a specific region, such as US West (Oregon), any additional resources like Amazon SNS topics, AWS KMS keys, and Lambda functions also need to be created in the same US West (Oregon) Region. Additionally, to successfully receive email with Amazon SES within a particular Region, you must create an active receipt rule set specifically in that Region. By adhering to these guidelines, new users can effectively configure and utilize the inbound feature of Amazon SES, ensuring seamless email reception and efficient management of related resources. Amazon SES only supports email receiving in certain AWS Regions. For a complete list of Regions where email receiving is supported, see Amazon Simple Email Service endpoints and quotas in the AWS General Reference.
Verifying your domain
Before you can start receiving emails with Amazon SES, you must verify your domain. Domain verification is a crucial step in the setup process, as it confirms your ownership of the domain and helps prevent unauthorized use. In this section, we’ll walk you through the process of verifying your domain in the Amazon SES console.
In the navigation pane, under Configuration, choose Verified identities.
In the list of Identities section, choose Create identity.
Under Identity details, choose Domain as the Identity type field. You must have access to the domain’s DNS settings to complete the domain verification process.
Enter the name of the domain or subdomain in the Domain field.
You must configure DKIM as part of the domain verification process. For Advanced DKIM settings, ensure that the Enabled box is checked in the DKIM signatures field.
Choose Create identity.
This will generate a list of DNS records that you need to add to your domain’s DNS configuration. These can be found in the DomainKeys Identified Mail (DKIM) container,under Publish DNS records.
Publish DNS records
Add the generated DNS records to your domain’s DNS configuration. These records include a Legacy TXT record for domain verification and CNAME records for DKIM authentication. You may need to consult your domain registrar’s documentation for instructions on adding DNS records.
Once the DNS records have been added, return to the Amazon SES console and wait for your domain’s verification status to change from “Verification pending” to “Verified.” This process may take up to 72 hours, depending on your domain registrar’s DNS propagation time.
Publishing an MX record for Amazon SES email receiving
To enable email receiving with Amazon SES, you need to publish an MX (Mail Exchange) record in your domain’s DNS configuration. The MX record directs incoming emails to Amazon SES for processing. Follow these steps to publish the MX record:
Log in to your domain registrar or DNS management console.
Locate the DNS management section for your domain.
Create a new MX record by specifying the following details:
Host/Name/Record: Leave this field blank or enter “@” to represent the root domain.
Value/Points to/Target: Enter the value “10 inbound-smtp.[AWS Region].amazonaws.com“, replacing [AWS Region] with the AWS region where you are using Amazon SES for email receiving. For example, if you are using US West (Oregon) region, the value should be “10 inbound-smtp.us-west-2.amazonaws.com“.
TTL (Time to Live): Set a TTL value according to your preference or leave it as the default.
Save the MX record.
Once the MX record is published with the correct value, incoming emails addressed to your domain will be routed to Amazon SES for processing. Remember to ensure that any other email-related resources, such as SNS topics or Lambda functions, are also created in the same AWS region as your Amazon SES endpoint.
For more detailed information on publishing MX records for Amazon SES email receiving, you can refer to the official documentation.
Creating a Receipt Rule set
A receipt rule set is a collection of rules that define how Amazon SES processes incoming emails for your domain. Each rule contains one or more actions that determine the processing flow of incoming emails. In this section, we’ll guide you through the process of creating a new receipt rule set in the Amazon SES console and activating it for your domain.
In the navigation pane, under Configuration, choose Email receiving.
Note: if you don’t see the Email receiving option in the menu, check again that you’re in fact in a region supporting this feature.
Under the Receipt rule sets tab in the Email receiving pane, choose Create rule set.
Enter a name for your new rule set in the Rule set name field. This name should be descriptive and easy to identify, such as “MyApp-IncomingEmail.”
After entering a unique name, choose Create rule set.
To activate the newly created rule set, choose Set as active next to your rule set’s name. This action will ensure that Amazon SES uses this rule set for processing incoming emails to your domain. Your new rule set will now be listed in the Active rule set section.
For more information on creating and managing receipt rule sets, you can refer to the official documentation.
In the next section, we’ll explore adding receipt rules to your rule set, which define the specific actions to be taken for incoming emails.
Adding Receipt Rules
Receipt rules define the specific actions that Amazon SES should take when processing incoming emails for your domain. Common actions include saving the email to an Amazon S3 bucket, invoking an AWS Lambda function, or publishing a notification to an Amazon SNS topic. In this section, we’ll guide you through the process of adding receipt rules to your rule set in the Amazon SES console and provide examples of when to use each action.
In the navigation pane, under Configuration, choose Email receiving.
Under the Email receiving pane, in the Receipt rule sets tab, select the name of your active rule set from the All rule sets section. This will navigate to the details page for that rule set.
Choose Create rule to begin creating a new receipt rule.
On the Define rule settings page, under Receipt rule details, enter a unique Rule name.
For Status, only clear the Enabled checkbox if you don’t want to run this rule after creation.
(Optional) For Transport Layer Security (TLS), by selecting Required you can enforce a specific TLS policy for incoming emails that match this rule. By default, Amazon SES will use the Optional policy, which means it will attempt to use TLS but will not require it.
For Spam and virus scanning, only clear the Enabled checkbox if you don’t want Amazon SES to scan incoming messages for spam and viruses.
After entering a unique rule name, choose Next.
On the Add recipients conditions page, under Recipients conditions, use the following procedure to specify one or more recipient conditions. You can have a maximum of 100 recipient conditions per receipt rule.
Under Recipient condition, specify the email addresses or domains that this rule should apply to. You can use wildcards to match multiple addresses or domains. For example, you can enter example.com and .example.com to apply the rule to all email addresses within the example.com domain and within all of its subdomains.
Repeat this step for each recipient condition you want to add. When you finish adding recipient conditions, choose Next.
On the Add actions page, open the Add new action menu and select the desired action from the list, such as Deliver to S3 bucket, Invoke AWS Lambda function, or Publish to Amazon SNS topic. Configure the selected action’s settings as required.
Deliver to S3 bucket: Choose this action if you’re expecting emails with large attachments, need to store emails for archival purposes, or plan to process emails using other AWS services that integrate with Amazon S3. You’ll need to specify the Amazon S3 bucket where the incoming emails should be stored.
Invoke AWS Lambda function: Choose this action if you want to process incoming emails using custom logic, such as filtering, parsing, or modifying the email content. You’ll need to specify the AWS Lambda function that should be invoked when an incoming email matches this rule.
Publish to Amazon SNS topic: Choose this action if you’re processing smaller emails or want to receive real-time notifications when an email arrives. You’ll need to specify the Amazon SNS topic where notifications should be published.
For more information and additional actions, see the Action options section of the Developer Guide.
Once configured, choose Next to proceed to the Review page.
On the Review page, review the settings and actions of the rule. If you need to make changes, choose the Edit option.
When finished, choose Create rule to add the new receipt rule to your rule set. The rule will now be applied to incoming emails that match the specified recipient conditions.
You can create multiple receipt rules within a rule set, each with different actions and conditions. Amazon SES will apply the rules in the order they appear in the rule set. For more information on creating and managing receipt rules, you can refer to the official documentation.
Monitoring your incoming email
Configuring Amazon CloudWatch metrics
Once you have enabled email receiving in Amazon SES and created receipt rules for your emails, you can monitor and view the metrics using Amazon CloudWatch. Follow these steps to configure Amazon CloudWatch metrics for Amazon SES email receiving:
Open the Amazon CloudWatch console.
Navigate to the Metrics section and select All metrics.
In the list of available metrics, locate and select SES to view SES-related metrics.
Expand the Receipt Rule Set Metrics and Receipt Rule Metrics sections to access the specific metrics for your receipt rule sets and rules.
Under Receipt Rule Set Metrics, you will find the following metrics:
“Received”: Indicates whether SES successfully received a message that has at least one rule applying. The metric value is always 1.
“PublishSuccess”: Indicates whether SES successfully executed all rules within a rule set.
“PublishFailure”: Indicates if SES encountered an error while executing rules within a rule set. The error may allow for retrying the execution.
“PublishExpired”: Indicates that SES will no longer retry executing the rules within a rule set after four hours.
These metrics can be filtered by the dimension RuleSetName to obtain data specific to individual rule sets.
Under Receipt Rule Metrics, you will find the following metrics:
“Received”: Indicates whether SES successfully received a message and will try to process the applied rule. The metric value is always 1.
“PublishSuccess”: Indicates whether SES successfully executed a rule that applies to the received message.
“PublishFailure”: Indicates if SES encountered an error while executing the actions in a rule. The error may allow for retrying the execution.
“PublishExpired”: Indicates that SES will no longer retry executing the actions of a rule after four hours.
These metrics can be filtered by the dimension RuleName to obtain data specific to individual rules.
Note that the metrics will only appear in the CloudWatch console if you have enabled email receiving, created receipt rules, and received mail that matches any of your rules.
Keep in mind that changes made to fix your receipt rule set will only apply to emails received by Amazon SES after the update. Emails are always evaluated against the receipt rule set in place at the time of receipt.
Amazon SES also provides an Automatic Dashboard for SES in the CloudWatch console, which offers a preconfigured set of SES metrics and alarms to monitor your email sending and receiving activity. This dashboard provides a consolidated view of key metrics, making it easier to track the performance and health of your Amazon SES environment.
By configuring Amazon CloudWatch metrics, you can gain valuable insights into the performance and execution of your receipt rule sets and rules within Amazon SES. For more detailed information on viewing metrics for Amazon SES email receiving using Amazon CloudWatch, refer to the official documentation.
Using receipt rules effectively
Chaining Receipt Rules
Chaining receipt rules enable you to create sophisticated email processing workflows by linking multiple rules together, allowing each rule to apply specific actions based on the outcome of the previous rule. This advanced technique can help you achieve greater flexibility and precision in handling your incoming emails with Amazon SES. In this section, we’ll explain how to create chained receipt rules and provide examples of common use cases.
Under the Email receiving pane, in the Receipt rule sets tab, select the name of your active rule set from the All rule sets section
Review the existing rules in your rule set and ensure that they are ordered correctly. Chaining relies on the order of the rules, as each rule’s conditions and actions are evaluated sequentially. Under the Reorder tab, the rule orders can be modified by selecting the corresponding arrow associated with each.
To chain additional rules, follow the steps previously outlined in the Adding Receipt Rules section and adjust the rule orders as necessary.
Chaining receipt rules can help you build complex email processing workflows with Amazon SES. Some common use cases include:
Executing multiple filtering criteria in an order that you specify. For example, adding a specific header value and then sending to additional AWS services such as Amazon S3, Amazon SNS, or AWS Lambda.
Creating multi-stage processing pipelines, where the output of one action (e.g., saving an email to Amazon S3) is used as the input for the next action (e.g., processing the email with AWS Lambda).
Implementing fallback actions, where the first rule in the chain attempts a specific action (e.g., saving an email to a primary S3 bucket), and if it fails, the next rule in the chain applies a different action (e.g., saving the email to a secondary S3 bucket).
The following figure shows how receipt rules, rule sets, and actions relate to each other.
For more information on creating and managing receipt rules, you can refer to the official documentation.
Handling the 200 Receipt Rules per Rule Set limit
For each AWS account, Amazon SES imposes a limit of 200 receipt rules per receipt rule set. While this limit is sufficient for most use cases, there might be situations where you need to process a higher volume of incoming emails with more complex rule sets. These are some strategies to work around the 200 receipt rule limit using Amazon SES and other AWS services:
Utilize rule chaining: As mentioned earlier, chaining receipt rules allows you to link multiple rules together, effectively extending the number of actions you can perform for a single email. By chaining rules, you can create more complex processing workflows without exceeding the 200 rule limit.
Combine rules with actions: Instead of creating separate rules for each scenario, consider combining multiple actions within a single rule. This approach can help you reduce the total number of rules while still catering to various email processing requirements.
Use AWS Lambda for custom processing: Leverage AWS Lambda to perform custom processing on incoming emails. By incorporating Lambda functions in your receipt rules, you can handle more complex processing tasks without increasing the number of rules. This approach also allows you to offload some processing logic from Amazon SES to Lambda, providing additional flexibility.
Consolidate similar actions: If you have several rules performing similar actions, it is advisable to consolidate them into a single rule with multiple actions. This consolidation can help you reduce the total number of rules while maintaining the desired functionality.
Evaluate rule usage: Regularly review and evaluate your existing receipt rules to identify any rules that are no longer in use or can be optimized. Removing or consolidating unnecessary rules can help you stay within the 200 rule limit while still addressing your email processing requirements.
By implementing these strategies, you can effectively work around the 200 receipt rule limit in Amazon SES and build more complex email processing workflows to cater to your specific needs. Remember to monitor and optimize your rule sets regularly to make the most of the available resources and maintain efficient email processing.
For more information on the inbound quotas and limits in Amazon SES, you can refer to the official AWS documentation at Quotas related to email receiving.
Best Practices for multi-tenant scenarios
When dealing with multi-tenant scenarios in your application, it’s crucial to manage incoming emails efficiently to ensure smooth operation and a seamless experience for your users. In this section, we’ll provide best practices to handle incoming emails in multi-tenant environments using Amazon SES.
In a multi-tenant scenario, where multiple customers or tenants share a single AWS account, it’s important to consider the limit of 200 receipt rules per receipt rule set imposed by Amazon SES. To ensure compliance with this limit and maintain optimal email processing, the following practices are recommended:
Segregate tenants using email subdomains: Create unique subdomains for each tenant and route their incoming emails accordingly. This approach makes it easier to manage email processing rules and helps isolate tenants from potential issues.
Create separate rule sets for each tenant: By creating dedicated rule sets for each tenant, you can maintain better control over email processing rules and actions specific to their needs. This can simplify management and make it easier to update rules for individual tenants without affecting others.
Use tags to identify tenant-specific emails: Apply tags to incoming emails using the AddHeader action in your receipt rules. These tags can include tenant-specific identifiers, which will help you route and process emails correctly. You can later use these tags in other AWS services (e.g., AWS Lambda) to process tenant-specific emails.
Leverage conditional receipt rules: Utilize conditional receipt rules to apply tenant-specific processing based on email headers, recipients, or other criteria. This way, you can ensure that the right actions are taken for each tenant’s incoming emails.
Monitor tenant-specific metrics: Configure Amazon CloudWatch metrics and alarms for each tenant to track their email processing performance separately. This enables you to keep a close eye on individual tenants and take appropriate actions when needed.
Implement rate limiting: To prevent tenants from overwhelming your email processing pipeline, consider implementing rate limiting based on the number of incoming emails per tenant. This can help ensure fair resource allocation and prevent potential abuse.
Ensure security and privacy: Always encrypt tenant data at rest and in transit, and follow best practices for data protection and privacy. Consider using AWS Key Management Service (KMS) to manage encryption keys for each tenant.
Test and validate rule sets: Before deploying rule sets for tenants, thoroughly test and validate them to ensure they function as intended. This can help prevent unexpected behavior and maintain a high level of service quality.
By following these best practices for handling incoming emails in multi-tenant scenarios with Amazon SES, you can ensure a robust and efficient email processing pipeline that caters to each tenant’s unique requirements. As you continue to work with Amazon SES in multi-tenant environments, stay up to date with AWS documentation and best practices to further optimize your email processing workflows.
Conclusion
In this blog post, we’ve explored how to set up Amazon Simple Email Service (SES) for incoming email processing using receipt rules, rule sets, and various actions. We’ve covered domain verification, DKIM setup, creating and managing rule sets, adding receipt rules, and configuring Amazon CloudWatch metrics and alarms. We’ve also delved into advanced topics such as chaining receipt rules for more complex email processing workflows.
By following this guide, you can effectively leverage Amazon SES to process and manage your incoming emails, optimizing your email workflows, and maintaining high email deliverability standards. With Amazon SES, you can customize your email processing pipeline to meet your specific needs and seamlessly integrate with other AWS services such as Amazon S3, AWS Lambda, Amazon SNS, and Amazon CloudWatch.
In future blog posts, we will explore monitoring and alerting in more detail, providing you with additional insights on how to effectively monitor your email processing pipelines and set up alerts for critical events. Stay tuned for more information on this important aspect of managing your email infrastructure.
As you continue to work with Amazon SES and its email receiving capabilities, remember to review AWS best practices and documentation to stay up to date with new features and improvements. Don’t hesitate to experiment with different rule sets, actions, and conditions to find the perfect email processing solution for your use case.
The Rust project has announced
the formation of the Rust Leadership Council, which will take the place of
the existing Core Team and Leadership Chat groups.
The Council will assume responsibility for top-level governance
concerns while most of the responsibilities of the Rust Project
(such as maintenance of the compiler and core tooling, evolution of
the language and standard libraries, administration of
infrastructure, etc.) remain with the nine top level teams.
The details on how this body is supposed to work can be found in RFC 3392.
Today, we’re making the case for why Time To First Byte (TTFB) is not a good metric for evaluating how fast web pages load. There are better metrics out there that give a more accurate representation of how well a server or content delivery network performs for end users. In this blog, we’ll go over the ambiguity of measuring TTFB, touch on more meaningful metrics such as Core Web Vitals that should be used instead, and finish on scenarios where TTFB still makes sense to measure.
Many of our customers ask what the best way would be to evaluate how well a network like ours works. This is a good question! Measuring performance is difficult. It’s easy to simplify the question to “How close is Cloudflare to end users?” The predominant metric that’s been used to measure that is round trip time (RTT). This is the time it takes for one network packet to travel from an end user to Cloudflare and back. We measure this metric and mention it from time to time: Cloudflare has an average RTT of 50 milliseconds for 95% of the Internet-connected population.
Whilst RTT is a relatively good indicator of the quality of a network, it doesn’t necessarily tell you that much about how good it is at actually delivering actual websites to end users. For instance, what if the web server is really slow? A user might be very close to the data center that serves the traffic, but if it takes a long time to actually grab the asset from disk and serve it the result will still be a poor experience.
This is where TTFB comes in. It measures the time it takes between a request being sent from an end user until the very first byte of the response being received. This sounds great on paper! However it doesn’t capture how a webpage or web application loads, and what happens after the first byte is received.
In this blog we’ll cover what TTFB is a good indicator of, what it's not great for, and what you should be using instead.
What is TTFB?
TTFB is a metric which reports the duration between sending the request from the client to a server for a given file, and the receipt of the first byte of said file. For example, if you were to download the Cloudflare logo from our website the TTFB would be how long it took to receive the first byte of that image. Similarly, if you were to measure the TTFB of a request to cloudflare.com the metric would return the TTFB of how long it took from request to receiving the first byte of the first HTTP response. Not how long it took for the image to be fully visible or for the web page to be loaded in a state that allowed a user to begin using it.
The simplest answer therefore is to look at the diametrically opposite measurement, Time to Last Byte (TTLB). TTLB, as you’d expect, measures how long it takes until the last byte of data is received from the server. For the Cloudflare logo file this would make sense, as until the image is fully downloaded it's not exactly useful. But what about for a webpage? Do you really need to wait until every single file is fully downloaded, even those images at the bottom of the page you can't immediately see? TTLB is fine for measuring how long it took to download a single file from a CDN / server. However for multi-faceted traffic, like web pages, it is too conservative, as it doesn’t tell you how long it took for the web page to be usable.
As an analogy we can look at measuring how long it takes to process an incoming airplane full of passengers. What's important is to understand how long it takes for those passengers to disembark, pass through passport control, collect their baggage and leave the terminal, if no onward journeys. TTFB would measure success as how long it took to get the first passenger off of the airplane. TTLB would measure how long it took the last passenger to leave the terminal, even if this passenger remained in the terminal for hours afterwards due to passport issues or getting lost. Neither are a good measure of success for the airline.
Why TTFB doesn't make sense
TTFB is a widely-used metric because it is easy-to-understand and it is a great signal for connection setup time, server time and network latency. It can help website owners identify when performance issues originate from their server. But is TTFB a good signal for how real users experience the loading speed of a web page in a browser?
When a web page loads in a browser, the user’s perception of speed isn’t related to the moment the browser first receives bytes of data. It is related to when the user starts to see the page rendering on the screen.
The loading of a web page in a browser is a very complex process. Almost all of this process happens after TTFB is reported. After the first byte has been received, the browser still has to load the main HTML file. It also has to load fonts, stylesheets, javascript, images and other resources. Often these resources link to other resources that also must be downloaded. Often these resources entirely block the rendering of the page. Alongside all these downloads, the browser is also parsing the HTML, CSS and JavaScript. It is building data structures that represent the content of the web page as well as how it is styled. All of this is in preparation to start rendering the final page onto the screen for the user.
When the user starts seeing the web page actually rendered on the screen, TTFB has become a distant memory for the browser. For a metric that signals the loading speed as perceived by the user, TTFB falls dramatically short.
Receiving the first byte isn't sufficient to determine a good end user experience as most pages have additional render blocking resources that get loaded after the initial document request. Render-blocking resources are scripts, stylesheets, and HTML imports that prevent a web page from loading quickly. From a TTFB perspective it means the client could stop the ‘TTFB clock’ on receipt of the first byte of one of these files, but the web browser is blocked from showing anything to the user until the remaining critical assets are downloaded.
This is because browsers need instructions for what to render and what resources need to be fetched to complete “painting” a given web page. These instructions come from a server response. But the servers sending these responses often need time to compile these resources — this is known as “server think time.” While the servers are busy during this time… browsers sit idle and wait. And the TTFB counter goes up.
There have been a number of attempts over the years to benefit from this “think time”. First came Server Push, which was superseded last year by Early Hints. Early Hints take advantage of “server think time” to asynchronously send instructions to the browser to begin loading resources while the origin server is compiling the full response. By sending these hints to a browser before the full response is prepared, the browser can figure out what it needs to do to load the webpage faster for the end user. It also stops the TTFB clock, meaning a lower TTFB. This helps ensure the browser gets the critical files sooner to begin loading the webpage, and it also means the first byte is delivered sooner as there is no waiting on the server for the whole dataset to be prepared and ready to send. Even with Early Hints, though, TTFB doesn’t accurately define how long it took the web page to be in a usable state.
TTFB also does not take into account multiplexing benefits of HTTP/2 and HTTP/3 which allow browsers to load files in parallel. It also doesn't take into account compression on the origin, which would result in a higher TTFB but a quicker page load overall due to the time the server took to compress the assets and send them in a small format over the network.
Cloudflare offers many features that can improve the loading speed of a website, but don’t necessarily impact the TTFB score. These features include Zaraz, Rocket Loader, HTTP/2 and HTTP/3 Prioritization, Mirage, Polish, Image Resizing, Auto Minify and Cache. These features improve the loading time of a webpage, ensuring they load optimally through a series of enhancements from image optimization and compression to render blocking elimination by optimizing the sending of assets from the server to the browser in the best possible order.
More comprehensive metrics are required to illustrate the full loading process of a web page, and the benefit provided by these features. This is where Real User Monitoring helps. At Cloudflare we are all-in on Real User Monitoring (RUM) as the future of website performance. We’re investing heavily in it: both from an observation point of view and from an optimization one also.
For those unfamiliar with RUM, we typically optimize websites for three main metrics – known as the “Core Web Vitals”. This is a set of key metrics which are believed to be the best and most accurate representation of a poorly performing website vs a well performing one. These key metrics are Largest Contentful Paint, First Input Delay and Cumulative Layout Shift.
LCP measures loading performance; typically how long it takes to load the largest image or text block visible in the browser. FID measures interactivity. For example, the time between when a user clicks or taps on a button to when the browser responds and starts doing something. Finally, CLS measures visual stability. A good, or bad example of CLS is when you go to a website on your mobile phone, tap on a link and the page moves at the last second meaning you tap something you didn't want to. That would be a lower CLS score as its poor user experience.
Looking at these metrics gives us a good idea of how the end user is truly experiencing your website (RUM) vs. how quickly the first byte of the file was retrieved from the nearest Cloudflare data center (TTFB).
Good TTFB, bad user experience
One of the “sub parts” that comprise LCP is TTFB. That means a poor TTFB is very likely to result in a poor LCP. If it takes you 20 seconds to retrieve the first byte of the first image, your user isn't going to have a good experience – regardless of your outlook on TTFB vs RUM.
Conversely, we found that a good TTFB does not always mean a good LCP score, or FID or CLS. We ran a query to collect RUM metrics of web pages we served which had a good TTFB score. Good is defined as a TTFB as less than 800ms. This allowed us to ask the question: TTFB says these websites are good. Does the RUM data support that?
We took four distinct samples from our RUM data in June. Each sample had a different date-range and sample-rate combination. In each sample we queried for 200,000 page views. From these 200,000 page views we filtered for only the page views that reported a 'Good' TTFB. Across the samples, of all page views that have a good TTFB, about 21% of them did not have a “good” LCP score. 46% of them did not have a “good” FID score. And 57% of them did not have a good CLS score.
This clearly shows the disparity between measuring the time it takes to receive the first byte of traffic, vs the time it takes for a webpage to become stable and interactive. In summary, LCP includes TTFB but also includes other parts of the loading experience. LCP is a more comprehensive, user-centric metric.
TTFB is not all bad
Reading this post and others from Speed Week 2023 you may conclude we really don't like TTFB and you should stop using it. That isn't the case.
There are a few situations where TTFB does matter. For starters, there are many applications that aren’t websites. File servers, APIs and all sorts of streaming protocols don’t have the same semantics as web pages and the best way to objectively measure performance is to in fact look at exactly when the first byte is returned from a server.
To help optimize TTFB for these scenarios we are announcing Timing Insights, a new analytics tool to help you understand what is contributing to "Time to First Byte" (TTFB) of Cloudflare and your origin. Timing Insights breaks down TTFB from the perspective of our servers to help you understand what is slow, so that you can begin addressing it.
Get started with RUM today
To help you understand the real user experience of your website we have today launched Cloudflare Observatory– the new home of performance at Cloudflare.
Cloudflare users can now easily monitor website performance using Real User Monitoring (RUM) data along with scheduled synthetic tests from different regions in a single dashboard. This will identify any performance issues your website may have. The best bit? Once we’ve identified any issues, Observatory will highlight customized recommendations to resolve these issues, all with a single click.
Start making your website faster today with Observatory.
If you care about the performance of your website or APIs, it’s critical to understand why things are slow.
Today we're introducing new analytics tools to help you understand what is contributing to "Time to First Byte" (TTFB) of Cloudflare and your origin. TTFB is just a simple timer from when a client sends a request until it receives the first byte in response. Timing Insights breaks down TTFB from the perspective of our servers to help you understand what is slow, so that you can begin addressing it.
But wait – maybe you've heard that you should stop worrying about TTFB? Isn't Cloudflare moving away from TTFB as a metric? Read on to understand why there are still situations where TTFB matters.
Why you may need to care about TTFB
It's true that TTFB on its own can be a misleading metric. When measuring web applications, metrics like Web Vitals provide a more holistic view into user experience. That's why we offer Web Analytics and Lighthouse within Cloudflare Observatory.
But there are two reasons why you still may need to pay attention to TTFB:
1. Not all applications are websites More than half of Cloudflare traffic is for APIs, and many customers with API traffic don't control the environments where those endpoints are called. In those cases, there may not be anything you can monitor or improve besides TTFB.
2. Sometimes TTFB is the problem Even if you are measuring Web Vitals metrics like LCP, sometimes the reason your site is slow is because TTFB is slow! And when that happens, you need to know why, and what you can do about it.
When you need to know why TTFB is slow, we’re here to help.
How Timing Insights can help
We now expose performance data through our GraphQL Analytics API that will let you query TTFB performance, and start to drill into what contributes to TTFB.
Specifically, customers on our Pro, Business, and Enterprise plans can now query for the following fields in the httpRequestsAdaptiveGroups dataset:
Time to First Byte (edgeTimeToFirstByteMs)
What is the time elapsed between when Cloudflare started processing the first byte of the request received from an end user, until when we started sending a response?
Origin DNS lookup time (edgeDnsResponseTimeMs)
If Cloudflare had to resolve a CNAME to reach your origin, how long did this take?
Origin Response Time (originResponseDurationMs)
How long did it take to reach, and receive a response from your origin?
We are exposing each metric as an average, median, 95th, and 99th percentiles (i.e. P50 / P95 / P99).
The httpRequestAdaptiveGroups dataset powers the Traffic analytics page in our dashboard, and represents all of the HTTP requests that flow through our network. The upshot is that this dataset gives you the ability to filter and “group by” any aspect of the HTTP request.
An example of how to use Timing Insights
Let’s walk through an example of how you’d actually use this data to pin-point a problem.
To start with, I want to understand the lay of the land by querying TTFB at various quantiles:
This shows that TTFB is over 1.3 seconds at P95 – that’s fairly slow, given that best practices are for 75% of pages to finish rendering within 2.5 seconds, and TTFB is just one component of LCP.
If I want to dig into why TTFB, it would be helpful to understand which URLs are slowest. In this query I’ll filter to that slowest 5% of page loads, and now look at the aggregate time taken – this helps me understand which pages contribute most to slow loads:
Based on this query, it looks like the /api/v2 path is most often responsible for these slow requests. In order to know how to fix the problem, we need to know why these pages are slow. To do this, we can query for the average (mean) DNS and origin response time for queries on these paths, where TTFB is above our P95 threshold:
According to this, most of the long TTFB values are actually due to resolving DNS! The good news is that’s something we can fix – for example, by setting longer TTLs with my DNS provider.
Conclusion
Coming soon, we’ll be bringing this to Cloudflare Observatory in the dashboard so that you can easily explore timing data via the UI.
And we’ll be adding even more granular metrics so you can see exactly which components are contributing to high TTFB. For example, we plan to separate out the difference between origin “connection time” (how long it took to establish a TCP and/or TLS connection) vs “application response time” (how long it took an HTTP server to respond).
We’ll also be making improvements to our GraphQL API to allow more flexible querying – for example, the ability to query arbitrary percentiles, not just 50th, 95th, or 99th.
Start using the GraphQL API today to get Timing Insights, or hop on the discussion about our Analytics products in Discord.
Today, Cloudflare is very excited to announce full support for HTTP/3 Extensible Priorities, a new standard that speeds the loading of webpages by up to 37%. Cloudflare worked closely with standards builders to help form the specification for HTTP/3 priorities and is excited to help push the web forward. HTTP/3 Extensible Priorities is available on all plans on Cloudflare. For paid users, there is an enhanced version available that improves performance even more.
Web pages are made up of many objects that must be downloaded before they can be processed and presented to the user. Not all objects have equal importance for web performance. The role of HTTP prioritization is to load the right bytes at the most opportune time, to achieve the best results. Prioritization is most important when there are multiple objects all competing for the same constrained resource. In HTTP/3, this resource is the QUIC connection. In most cases, bandwidth is the bottleneck from server to client. Picking what objects to dedicate bandwidth to, or share bandwidth amongst, is a critical foundation to web performance. When it goes askew, the other optimizations we build on top can suffer.
Today, we're announcing support for prioritization in HTTP/3, using the full capabilities of the HTTP Extensible Priorities (RFC 9218) standard, augmented with Cloudflare's knowledge and experience of enhanced HTTP/2 prioritization. This change is compatible with all mainstream web browsers and can improve key metrics such as Largest Contentful Paint (LCP) by up to 37% in our test. Furthermore, site owners can apply server-side overrides, using Cloudflare Workers or directly from an origin, to customize behavior for their specific needs.
Looking at a real example
The ultimate question when it comes to features like HTTP/3 Priorities is: how well does this work and should I turn it on? The details are interesting and we'll explain all of those shortly but first lets see some demonstrations.
In order to evaluate prioritization for HTTP/3, we have been running many simulations and tests. Each web page is unique. Loading a web page can require many TCP or QUIC connections, each of them idiosyncratic. These all affect how prioritization works and how effective it is.
To evaluate the effectiveness of priorities, we ran a set of tests measuring Largest Contentful Paint (LCP). As an example, we benchmarked blog.cloudflare.com to see how much we could improve performance:
As a film strip, this is what it looks like:
In terms of actual numbers, we see Largest Contentful Paint drop from 2.06 seconds down to 1.29 seconds. Let’s look at why that is. To analyze exactly what’s going on we have to look at a waterfall diagram of how this web page is loading. A waterfall diagram is a way of visualizing how assets are loading. Some may be loaded in parallel whilst some might be loaded sequentially. Without smart prioritization, the waterfall for loading assets for this web page looks as follows:
There are several interesting things going on here so let's break it down. The LCP image at request 21 is for 1937-1.png, weighing 30.4 KB. Although it is the LCP image, the browser requests it as priority u=3,i, which informs the server to put it in the same round-robin bandwidth-sharing bucket with all of the other images. Ahead of the LCP image is index.js, a JavaScript file that is loaded with a "defer" attribute. This JavaScript is non-blocking and shouldn't affect key aspects of page layout.
What appears to be happening is that the browser gives index.js the priority u=3,i=?0, which places it ahead of the images group on the server-side. Therefore, the 217 KB of index.js is sent in preference to the LCP image. Far from ideal. Not only that, once the script is delivered, it needs to be processed and executed. This saturates the CPU and prevents the LCP image from being painted, for about 300 milliseconds, even though it was delivered already.
The waterfall with prioritization looks much better:
We used a server-side override to promote the priority of the LCP image 1937-1.png from u=3,i to u=2,i. This has the effect of making it leapfrog the "defer" JavaScript. We can see at around 1.2 seconds, transmission of index.js is halted while the image is delivered in full. And because it takes another couple of hundred milliseconds to receive the remaining JavaScript, there is no CPU competition for the LCP image paint. These factors combine together to drastically improve LCP times.
How Extensible Priorities actually works
First of all, you don't need to do anything yourselves to make it work. Out of the box, browsers will send Extensible Priorities signals alongside HTTP/3 requests, which we'll feed into our priority scheduling decision making algorithms. We'll then decide the best way to send HTTP/3 response data to ensure speedy page loads.
Extensible Priorities has a similar interaction model to HTTP/2 priorities, client send priorities and servers act on them to schedule response data, we'll explain exactly how that works in a bit.
HTTP/2 priorities used a dependency tree model. While this was very powerful it turned out hard to implement and use. When the IETF came to try and port it to HTTP/3 during the standardization process, we hit major issues. If you are interested in all that background, go and read my blog post describing why we adopted a new approach to HTTP/3 prioritization.
Extensible Priorities is a far simpler scheme. HTTP/2's dependency tree with 255 weights and dependencies (that can be mutual or exclusive) is complex, hard to use as a web developer and could not work for HTTP/3. Extensible Priorities has just two parameters: urgency and incremental, and these are capable of achieving exactly the same web performance goals.
Urgency is an integer value in the range 0-7. It indicates the importance of the requested object, with 0 being most important and 7 being the least. The default is 3. Urgency is comparable to HTTP/2 weights. However, it's simpler to reason about 8 possible urgencies rather than 255 weights. This makes developer's lives easier when trying to pick a value and predicting how it will work in practice.
Incremental is a boolean value. The default is false. A true value indicates the requested object can be processed as parts of it are received and read – commonly referred to as streaming processing. A false value indicates the object must be received in whole before it can be processed.
Let's consider some example web objects to put these parameters into perspective:
An HTML document is the most important piece of a webpage. It can be processed as parts of it arrive. Therefore, urgency=0 and incremental=true is a good choice.
A CSS style is important for page rendering and could block visual completeness. It needs to be processed in whole. Therefore, urgency=1 and incremental=false is suitable, this would mean it doesn't interfere with the HTML.
An image file that is outside the browser viewport is not very important and it can be processed and painted as parts arrive. Therefore, urgency=3 and incremental=true is appropriate to stop it interfering with sending other objects.
An image file that is the "hero image" of the page, making it the Largest Contentful Pain element. An urgency of 1 or 2 will help it avoid being mixed in with other images. The choice of incremental value is a little subjective and either might be appropriate.
When making an HTTP request, clients decide the Extensible Priority value composed of the urgency and incremental parameters. These are sent either as an HTTP header field in the request (meaning inside the HTTP/3 HEADERS frame on a request stream), or separately in an HTTP/3 PRIORITY_UPDATE frame on the control stream. HTTP headers are sent once at the start of a request; a client might change its mind so the PRIORITY_UPDATE frame allows it to reprioritize at any point in time.
For both the header field and PRIORITY_UPDATE, the parameters are exchanged using the Structured Fields Dictionary format (RFC 8941) and serialization rules. In order to save bytes on the wire, the parameters are shortened – urgency to 'u', and incremental to 'i'.
Here's how the HTTP header looks alongside a GET request for important HTML, using HTTP/3 style notation:
The PRIORITY_UPDATE frame only carries the serialized Extensible Priority value:
PRIORITY_UPDATE:
    u=0,i
Structured Fields has some other neat tricks. If you want to indicate the use of a default value, then that can be done via omission. Recall that the urgency default is 3, and incremental default is false. A client could send "u=1" alongside our important CSS request (urgency=1, incremental=false). For our lower priority image it could send just "i=?1" (urgency=3, incremental=true). There's even another trick, where boolean true dictionary parameters are sent as just "i". You should expect all of these formats to be used in practice, so it pays to be mindful about their meaning.
Extensible Priority servers need to decide how best to use the available connection bandwidth to schedule the response data bytes. When servers receive priority client signals, they get one form of input into a decision making process. RFC 9218 provides a set of scheduling recommendations that are pretty good at meeting a board set of needs. These can be distilled down to some golden rules.
For starters, the order of requests is crucial. Clients are very careful about asking for things at the moment they want it. Serving things in request order is good. In HTTP/3, because there is no strict ordering of stream arrival, servers can use stream IDs to determine this. Assuming the order of the requests is correct, the next most important thing is urgency ordering. Serving according to urgency values is good.
Be wary of non-incremental requests, as they mean the client needs the object in full before it can be used at all. An incremental request means the client can process things as and when they arrive.
With these rules in mind, the scheduling then becomes broadly: for each urgency level, serve non-incremental requests in whole serially, then serve incremental requests in round robin fashion in parallel. What this achieves is dedicated bandwidth for very important things, and shared bandwidth for less important things that can be processed or rendered progressively.
Let's look at some examples to visualize the different ways the scheduler can work. These are generated by using quiche'sqlog support and running it via the qvis analysis tool. These diagrams are similar to a waterfall chart; the y-dimension represents stream IDs (0 at the top, increasing as we move down) and the x-dimension shows reception of stream data.
Example 1: all streams have the same urgency and are non-incremental so get served in serial order of stream ID.
Example 2: the streams have the same urgency and are incremental so get served in round-robin fashion.
Example 3: the streams have all different urgency, with later streams being more important than earlier streams. The data is received serially but in a reverse order compared to example 1.
Beyond the Extensible Priority signals, a server might consider other things when scheduling, such as file size, content encoding, how the application vs content origins are configured etc.. This was true for HTTP/2 priorities but Extensible Priorities introduces a new neat trick, a priority signal can also be sent as a response header to override the client signal.
This works especially well in a proxying scenario where your HTTP/3 terminating proxy is sat in front of some backend such as Workers. The proxy can pass through the request headers to the backend, it can inspect these and if it wants something different, return response headers to the proxy. This allows powerful tuning possibilities and because we operate on a semantic request basis (rather than HTTP/2 priorities dependency basis) we don't have all the complications and dangers. Proxying isn't the only use case. Often, one form of "API" to your local server is via setting response headers e.g., via configuration. Leveraging that approach means we don't have to invent new APIs.
Let's consider an example where server overrides are useful. Imagine we have a webpage with multiple images that are referenced via <img> tags near the top of the HTML. The browser will process these quite early in the page load and want to issue requests. At this point, it might not know enough about the page structure to determine if an image is in the viewport or outside the viewport. It can guess, but that might turn out to be wrong if the page is laid out a certain way. Guessing wrong means that something is misprioritized and might be taking bandwidth away from something that is more important. While it is possible to reprioritize things mid-flight using the PRIORITY_UPDATE frame, this action is "laggy" and by the time the server realizes things, it might be too late to make much difference.
Fear not, the web developer who built the page knows exactly how it is supposed to be laid out and rendered. They can overcome client uncertainty by overriding the Extensible Priority when they serve the response. For instance, if a client guesses wrong and requests the LCP image at a low priority in a shared bandwidth bucket, the image will load slower and web performance metrics will be adversely affected. Here's how it might look and how we can fix it:
Priority response headers are one tool to tweak client behavior and they are complementary to other web performance techniques. Methods like efficiently ordering elements in HTML, using attributes like "async" or "defer", augmenting HTML links with Link headers, or using more descriptive link relationships like “preload” all help to improve a browser's understanding of the resources comprising a page. A website that optimizes these things provides a better chance for the browser to make the best choices for prioritizing requests.
More recently, a new attribute called “fetchpriority” has emerged that allows developers to tune some of the browser behavior, by boosting or dropping the priority of an element relative to other elements of the same type. The attribute can help the browser do two important things for Extensible priorities: first, the browser might send the request earlier or later, helping to satisfy our golden rule #1 – ordering. Second, the browser might pick a different urgency value, helping to satisfy rule #2. However, "fetchpriority" is a nudge mechanism and it doesn't allow for directly setting a desired priority value. The nudge can be a bit opaque. Sometimes the circumstances benefit greatly from just knowing plainly what the values are and what the server will do, and that's where the response header can help.
Conclusions
We’re excited about bringing this new standard into the world. Working with standards bodies has always been an amazing partnership and we’re very pleased with the results. We’ve seen great results with HTTP/3 priorities, reducing Largest Contentful Paint by up to 37% in our test. If you’re interested in turning on HTTP/3 priorities for your domain, just head on over to the Cloudflare dashboard and hit the toggle.
Website performance is crucial to the success of online businesses. Study after study has shown that an increased load time directly affects sales. But how do you get test products that could improve your website speed without incurring an element of risk?
In today's digital landscape, it is easy to find code optimizations on the Internet including our own developers documentation to improve the performance of your website or web applications. However, implementing these changes without knowing the impact they’ll have can be daunting. It could also cause an outage, taking websites or applications offline entirely, leaving admins scrambling to remove the offending code and get the business back online.
Users need a way to see the impact of these improvements on their websites without impacting uptime. They want to understand “If I enabled this, what performance boost should I expect to get?”.
Today, we are excited to announce Performance Experiments in Cloudflare Observatory. Performance Experiments gives users a safe place to experiment and determine what the best setup is to improve their website performance before pushing it live for all visitors to benefit from. Cloudflare users will be able to simply enter the desired code, run our Observatory testing suite and view the impact it would have on their Lighthouse score. If they are satisfied with the results they can push the experiment live. With the click of a button.
Experimenting within Observatory
Cloudflare Observatory, announced today, allows users to easily monitor website performance by integrating Real-User Monitoring (RUM) data and synthetic tests in one location.. This allows users to easily identify areas for optimization and leverage Cloudflare's features to address performance issues.
Observatory's recommendations leverage insights from these Lighthouse test and RUM data, enabling precise identification of issues and offering tailored Cloudflare settings for enhanced performance. For example, when a Lighthouse report suggests image optimization improvements, Cloudflare recommends enabling Polish or utilizing Image Resizing. These recommendations can be implemented with a single click, allowing customers to boost their performance score effortlessly.
Fine tuning with Experiments
Cloudflare’s Observatory allows customers to easily enable recommended Cloudflare settings. However, through the medium of Cloudflare Workers web performance advocates have been able to create and share JavaScript examples of how to improve and optimize a website.
A great example of this is Fast Fonts. Google Fonts are slow due to how they are served. When using Google Fonts on your website, you include a stylesheet URL that contains the font styles you want to use. The CSS file is hosted on one domain (fonts.googleapis.com), while the font files are on another domain (fonts.gstatic.com). This separation means that each resource requires at least four round trips to the server for DNS lookup, establishing the socket connection, negotiating TLS encryption (for https), and making the request itself.
These requests cannot be done in parallel because the fonts are not known until after the CSS is downloaded and applied to the page. In the best-case scenario, this leads to eight round trips before the text can be displayed. On a slower 3G connection with a 300ms round-trip time, this delay can add up to 2.4 seconds. To fix this issue Cloudflare Workers can be used to reduce the performance penalties of serving Google Fonts directly from Google by 81%.
Another issue is resource prioritization. When all requests come from the same domain on the same HTTP/2 connection, critical resources like CSS and fonts can be prioritized and delivered before lower priority resources like images. However, since Google Fonts (and most third-party resources) are served from a different domain than the main page resources, they cannot be prioritized and end up competing with each other for download bandwidth. This competition can result in significantly longer fetch times than the best-case scenario of eight round trips.
To implement this Worker first create a Cloudflare Worker, implement the code from the GitHub repository using Wrangler and then run manual tests to see if performance has been improved and that there are no issues or problems with the website loading. Users can choose to implement the Cloudflare Worker on a test path that may not be a true reflection of production or complicate the Cloudflare Worker further by implementing an A/B test that could still have an impact on your end users. So how can users test code on their website to easily see if the code will improve the performance of their website and not have any adverse impact on end users?
Introducing Performance Experiments
Last year we announced Cloudflare Snippets. Snippets is a platform for running discrete pieces of JavaScript code on Cloudflare before your website is served to the user. They provide a convenient way to customize and enhance your website's functionality. If you are already familiar with Cloudflare Workers, our developer platform, you'll find Snippets to be a familiar and welcome addition to your toolkit. With Snippets, you can easily execute small pieces of user-created JavaScript code to modify the behavior of your website and improve performance, security, and user experience.
Combining Snippets with Observatory lets users easily run experiments and get instant feedback on the performance impact. Users will be able to find a piece of JavaScript, insert it into the Experiments window and hit test. Observatory will then automatically run multiple Lighthouse tests with the experiment disabled and then enabled. The results will show the before and after scores allowing users to determine the impact of the experiment e.g. “If I put this JavaScript on my website, my Lighthouse score would improve by 15 points”.
This allows users to understand if the JavaScript has had a positive performance impact on their website. Users can then deploy this JavaScript, via Snippets, against all requests or on a specific subset of traffic. For example, if I only wanted it run on traffic from the UK or my office IPs I would use the rule below:
Alternatively, if the results impact performance customers negatively users can safely discard the experiment or try another example. All without real visitors to the website being impacted or ever at risk.
Accessing Performance Experiments
Performance Experiments are currently under development — you can sign up here to join the waitlist for access.
We hope to begin admitting users later in the year, with an open beta to follow.
Today, Cloudflare is super excited to announce that we’re bringing traffic acceleration to customer’s UDP traffic. Now, you can improve the latency of UDP-based applications like video games, voice calls, and video meetings by up to 17%. Combining the power of Argo Smart Routing (our traffic acceleration product) with UDP gives you the ability to supercharge your UDP-based traffic.
When applications use TCP vs. UDP
Typically when people talk about the Internet, they think of websites they visit in their browsers, or apps that allow them to order food. This type of traffic is sent across the Internet via HTTP which is built on top of the Transmission Control Protocol (TCP). However, there’s a lot more to the Internet than just browsing websites and using apps. Gaming, live video, or tunneling traffic to different networks via a VPN are all common applications that don’t use HTTP or TCP. These popular applications leverage the User Datagram Protocol (or UDP for short). To understand why these applications use UDP instead of TCP, we’ll need to dig into how these different applications work.
When you load a web page, you generally want to see the entire web page; the website would be confusing if parts of it are missing. For this reason, HTTP uses TCP as a method of transferring website data. TCP ensures that if a packet ever gets lost as it crosses the Internet, that packet will be resent. Having a reliable protocol like TCP is generally a good idea when 100% of the information sent needs to be loaded. It’s worth noting that later HTTP versions like HTTP/3 actually deviated from TCP as a transmission protocol, but they still ensure packet delivery by handling packet retransmission using the QUIC protocol.
There are other applications that prioritize quickly sending real time data and are less concerned about perfectly delivering 100% of the data. Let’s explore Real-Time Communications (RTC) like video meetings as an example. If two people are streaming video live, all they care about is what is happening now. If a few packets are lost during the initial transmission, retransmission is usually too slow to render the lost packet data in the current video frame. TCP doesn’t really make sense in this scenario.
Instead, RTC protocols are built on top of UDP. TCP is like a formal back and forth conversation where every sentence matters. UDP is more like listening to your friend's stream of consciousness: you don’t care about every single bit as long as you get the gist of it. UDP transfers packet data with speed and efficiency without guaranteeing the delivery of those packets. This is perfect for applications like RTC where reducing latency is more important than occasionally losing a packet here or there. The same applies to gaming traffic; you generally want the most up-to-date information, and you don’t really care about retransmitting lost packets.
Gaming and RTC applications really care about latency. Latency is the length of time it takes a packet to be sent to a server plus the length of time to receive a response from the server (called round-trip time or RTT). In the case of video games, the higher the latency, the longer it will take for you to see other players move and the less time you’ll have to react to the game. With enough latency, games become unplayable: if the players on your screen are constantly blipping around it’s near impossible to interact with them. In RTC applications like video meetings, you’ll experience a delay between yourself and your counterpart. You may find yourselves accidentally talking over each other which isn’t a great experience.
Companies that host gaming or RTC infrastructure often try to reduce latency by spinning up servers that are geographically closer to their users. However, it’s common to have two users that are trying to have a video call between distant locations like Amsterdam and Los Angeles. No matter where you install your servers, that's still a long distance for that traffic to travel. The longer the path, the higher the chances are that you're going to run into congestion along the way. Congestion is just like a traffic jam on a highway, but for networks. Sometimes certain paths get overloaded with traffic. This causes delays and packets to get dropped. This is where Argo Smart Routing comes in.
Argo Smart Routing
Cloudflare customers that want the best cross-Internet application performance rely on Argo Smart Routing’s traffic acceleration to reduce latency. Argo Smart Routing is like the GPS of the Internet. It uses real time global network performance measurements to accelerate traffic, actively route around Internet congestion, and increase your traffic’s stability by reducing packet loss and jitter.
Argo Smart Routing was launched in May 2017, and its first iteration focused on reducing website traffic latency. Since then, we’ve improved Argo Smart Routing and also launched Argo Smart Routing for Spectrum TCP traffic which reduces latency in any TCP-based protocols. Today, we’re excited to bring the same Argo Smart Routing technology to customer’s UDP traffic which will reduce latency, packet loss, and jitter in gaming, and live audio/video applications.
Argo Smart Routing accelerates Internet traffic by sending millions of synthetic probes from every Cloudflare data center to the origin of every Cloudflare customer. These probes measure the latency of all possible routes between Cloudflare’s data centers and a customer’s origin. We then combine that with probes running between Cloudflare’s data centers to calculate possible routes. When an Internet user makes a request to an origin, Cloudflare calculates the results of our real time global latency measurements, examines Internet congestion data, and calculates the optimal route for customer’s traffic. To enable Argo Smart Routing for UDP traffic, Cloudflare extended the route computations typically used for HTTP and TCP traffic and applied them to UDP traffic.
We knew that Argo Smart Routing offered impressive benefits for HTTP traffic, reducing time to first byte by up to 30% on average for customers. But UDP can be treated differently by networks, so we were curious to see if we would see a similar reduction in round-trip-time for UDP. To validate, we ran a set of tests. We set up an origin in Iowa, USA and had a client connect to it from Tokyo, Japan. Compared to a regular Spectrum setup, we saw a decrease in round-trip-time of up to 17.3% on average. For the standard setup, Spectrum was able to proxy packets to Iowa in 173.3 milliseconds on average. Comparatively, turning on Argo Smart Routing reduced the average round-trip-time down to 143.3 milliseconds. The distance between those two cities is 6,074 miles (9,776 kilometers), meaning we've effectively moved the two closer to each other by over a thousand miles (or 1,609 km) just by turning on this feature.
We're incredibly excited about Argo Smart Routing for UDP and what our customers will use it for. If you're in gaming or real-time-communications, or even have a different use-case that you think would benefit from speeding up UDP traffic, please contact your account team today. We are currently in closed beta but are excited about accepting applications.
Website performance is crucial to the success of online businesses. Study after study has shown that an increased load time directly affects sales. In highly competitive markets the performance of a website is crucial for success. Just like a physical shop situated in a remote area faces challenges in attracting customers, a slow website encounters similar difficulties in attracting traffic. It is vital to measure and improve website performance to enhance user experience and maximize online engagement. Results from testing at home don’t take into account how your customers in different countries, on different devices, with different Internet connections experience your website.
Simply put, you might not know how your website is performing. And that could be costing your business money every single day.
Today we are excited to announce Cloudflare Observatory – the new home of performance at Cloudflare.
Cloudflare users can now easily monitor website performance using Real User Monitoring (RUM) data along with scheduled tests from different regions in a single dashboard. This will identify any performance issues your website may have. The best bit? Once we’ve identified any issues, Observatory will highlight customized recommendations to resolve these issues, all with a single click.
Making your website faster just got a lot easier.
I feel the need. The need for speed!
Having a fast website is crucial for achieving online success. According to Google, even a one-second improvement in load time can boost mobile conversions by up to 27%.
A study from Deloitte found “With a 0.1s improvement in site speed, we observed that retail consumers spent almost 10% more”. Another study, from Google, found “53% will leave a mobile site if it takes more than 3 seconds to load”. There is a very real link between website performance and business success.
In today's digital landscape, customers expect instant access to information and seamless browsing experiences. We have all encountered the frustration of waiting for a website to load, often leading us to click the back button and click on the next link. For ecommerce sites, this delay directly translates to lost revenue as users quickly navigate elsewhere.
This importance is further amplified in the world of Search Engine Optimization (SEO). In May 2021, Google announced that page speed would be incorporated into their ranking algorithm, highlighting the significance of fast-loading web pages for higher search engine rankings.
Introducing Observatory
In 2019, we launched the new Speed Tab with the mission to address two crucial questions: "How fast is my website after moving to Cloudflare?" and "How fast could it be?" This tab allowed customers to compare their website's performance before and after enabling Cloudflare features. However, it required users to delve into analytics and analyze traffic patterns and cache hit ratios to optimize their sites, which proved challenging for new Cloudflare users.
To address this, we developed Observatory, a fresh approach to performance monitoring at Cloudflare. Observatory fills the gap that previously existed in understanding website performance and simplifies the process of addressing performance issues by providing tailored recommendations.
Observatory integrates Real-User Monitoring (RUM) data, which enables users to understand their website's performance as experienced by their end users across the globe. By leveraging RUM data we can show valuable insight into the areas of the website that can be optimized and surface Cloudflare features and functionality that can address these issues.
Additionally, Observatory incorporates Google Lighthouse, the industry standard tool for evaluating web performance. We replaced WebPageTest with Lighthouse due to its versatility and widespread adoption in the performance community. With Lighthouse, users can run, schedule, and access Lighthouse performance reports directly in the Cloudflare dashboard.
Observatory also enables regional testing, recognizing the importance of understanding performance variations across different locations. By simulating website performance in different regions, users can understand if their webpage performs well in certain countries and poorly in others. This enables users to optimize their websites for a global audience, ensuring consistent and fast user experiences regardless of location.
Observatory becomes your unified place within the Cloudflare dashboard for website performance by bringing together RUM data, Lighthouse insights, and regional testing. Users can gain a comprehensive understanding of their website's performance and implement Cloudflare recommendations based on this data with just a click of a button.
Measuring performance in Cloudflare Observatory
We support the two main methods of testing website performance. These are synthetic tests and Real User Monitoring (RUM) tests.
Synthetic tests involve simulating user interactions and monitoring performance under controlled environments. These tests can provide valuable baseline measurements and help identify potential issues before deploying changes.
On the other hand, RUM tests involve collecting data directly from real users as they interact with the website, capturing their actual experiences in different environments and network conditions. RUM tests offer insights into the true end-user perspective. By combining both synthetic and RUM tests, website owners can gain a holistic view of performance, understanding how changes and optimizations affect both simulated and real user experiences.
Cloudflare Observatory combines both of these in one location. The integration of Google Lighthouse within the Observatory gives Cloudflare users a simple way to synthetically measure and understand their site's performance. Google Lighthouse measures several key performance metrics that impact user experience and search engine ranking. The generated report provides an overall performance score ranging from 1 (least performant) to 99 (most performant), making it easy for website owners to understand their site's performance.
Observatory offers a user-friendly interface that presents each Lighthouse metric in a traffic light system, indicating the result of the tested metric. One critical metric is Largest Contentful Paint (LCP), which measures a page's loading performance of the primary content. An optimal LCP score is less than 2.5 seconds, indicating satisfactory loading speed for the user. Through Observatory website owners can easily see their LCP score and other metrics. This allows them to optimize their site's performance and user experience. For example, by examining the LCP score website owners can identify opportunities for improvement and make informed decisions to enhance their site's performance.
New Smarter Recommendations
Recommendations from Observatory have become smarter by leveraging the insights gathered from Lighthouse and RUM testing. This enables us to precisely identify issues and offer tailored Cloudflare settings to enhance performance. For instance, when you receive a Lighthouse report it will highlight areas in which your website can be improved. In the provided report, several enhancements for image optimization are suggested. Cloudflare takes this feedback into account and provides product recommendations, such as enabling Polish or utilizing Image Resizing. This empowers our customers to enhance their performance score with just a single click.
Customers will have the convenience of viewing these recommendations within the Cloudflare dashboard, directly linked to the audit. The dashboard will encompass a wide range of Cloudflare features and functionalities, continually improving over time. With the addition of Cache Rules recommendations for uncached static content and a comprehensive testing suite, users will gain valuable insights into the benefits of implementing specific Cloudflare features before enabling them.
By knowing the performance impact of a product or feature before it is enabled, customers can make informed decisions and optimize their website's performance with confidence.
More tests, multiple regions and recurring tests
A significant piece of feedback we received from our old Speed Tab and beta testing was regarding the number and location of tests. We're thrilled to announce that we have addressed this feedback by increasing the number of tests allowed and enabling all plan types to schedule at least one recurring test, originating from a US region.
Customers on our Pro, Business, and Enterprise family of subscriptions can run tests from various regions to understand their site's performance in those areas. For instance, if a website is solely hosted in Iowa, USA, and a visitor is accessing it from Sydney, Australia, they will experience a slower page load due to the time it takes for an uncached file to be sent and rendered by the user's browser over a distance of 14,000 kilometers. By running tests from various regions, our customers can gain valuable insights into their website's performance and make informed decisions to optimize it for a better user experience – and an improved page load time.
The higher your plan type the more tests you are able to run and the more regions you are able to use. For example Pro customers can set up five recurring tests for their most important page from five different locations. These test runs will then be stored within the Observatory history tab allowing them to understand their Page Speed score from around the globe. Below is a table detailing the number of tests each plan type can run and the regions available to them.
Plan
Ad-hoc tests
Recurring tests
Frequency of recurring tests
Regions supported
Free
5
1
Weekly
Iowa, USA
Pro
10
5
Daily
Everything in Free and South Carolina, USA North Virginia, USA Dallas, USA Oregon, USA Hamina, Finland Madrid, Spain St. Ghislain, Belgium Eemshaven, Netherlands Milan, Italy Paris, France Changhua County, Taiwan Tokyo, Japan Osaka, Japan Tel Aviv, Israel London, England Jurong West, Singapore Sydney, Australia Frankfurt, Germany Mumbai, India São Paulo, Brazil
Business
20
10
Daily
Enterprise
50
15
Daily
Incorporating RUM
Cloudflare’s RUM service provides insights to a user's browser or devices, tracking metrics such as page load times, response times, and other user interactions. Cloudflare collects RUM data through its Browser Insights feature, which inserts a JavaScript "beacon" into HTML pages. This beacon sends information back to Cloudflare about the performance of a website from the perspective of real users, including metrics such as page load time, time to first byte, and other Web Vitals.
While you can always try a few page loads on your own laptop and see the results, gathering data from real users is the only way to take into account real-life device performance and network conditions.
Observatory now incorporates RUM data to match against your tested paths. This allows you to easily see how real users experience your site across the globe. This data is also dissected and located in the Observatory tab against your tested paths. Allowing you to view synthetic test data directly against Real User metrics.
Our RUM provider already incorporates the Interactive Next Paint (INP) Score. In 2022, Google announced Interaction to Next Paint (INP) as that new metric, promoting INP as the new Core Web Vital metric for responsiveness, replacing First Input Delay (FID). FID measures the delay between a user's first interaction with a web page and the browser's response to that interaction. INP measures the delay for any user interaction on a website, not just limited to the first input. This change reflects a more comprehensive approach to evaluating the responsiveness of a website.
If you don't have Web Analytics enabled on your Cloudflare zone then we will be unable to collect and display RUM data within Observatory. Enabling this feature is very simple and instructions can be found here.
One click optimizations
Observatory now includes an enhanced Optimization layout, which introduces a one-click recommendations center. Enabling these features on your Cloudflare zone enhances optimization for the latest HTTP protocols, including HTTP/3. Additionally, Image Delivery is improved by converting PNGs and JPEGs to the efficient WebP format. Finally, Cloudflare performance tools are also enabled, allowing users to seamlessly implement new technologies such as Early Hints. These features are designed to contribute to improved website speed and overall performance.
As we release new features that we believe are beneficial to our customers, we will continue to add them to the One Click Optimizations. We have also made changes to the overall layout of the tab, splitting our products into subcategories to allow easy navigation to the individual performance products.
Available now
Observatory is available now! Become the Web Performance advocate in your organization by taking advantage of the Observatory features such as Google Lighthouse integration, RUM data, and multi-region testing, all available now. You will be able to gain valuable insights into your website's performance and make informed decisions to optimize and improve your site's performance.
In the coming months, we will continue expanding the Recommendations engine, introducing more products that empower you to continually enhance your website's performance. Additionally, we will provide the capability to simulate requests for specific features, giving you a comprehensive understanding of the real-world performance benefits before implementing them on your website.
On May 10, 2023, Google announced that INP will replace FID in the Core Web Vitals in March 2024. The Core Web Vitals play a role in the Google Search algorithm. So website owners who care about Search Engine Optimization (SEO) should prepare for the change. Otherwise their search ranking might suffer.
This post will first explain what FID, INP and the Core Web Vitals are. Then it will show how FID and INP relate to each other across a large range of Cloudflare sites. (Spoiler alert – If a site has ‘Good’ scoring FID, it might not have ‘Good’ scoring INP). Then it will discuss how to prepare for this change and how Cloudflare can help.
A few definitions
In order to make sense of the upcoming change, here are some definitions that will set the scene.
Core Web Vitals
Measuring user-centric web performance is challenging. To face this challenge, Google developed a series of metrics called the Web Vitals. These Web Vitals are signals that measure different aspects of web performance. For example Time To First Byte (TTFB) is one of the Web Vitals: from the perspective of the browser, TTFB “measures the time between the request for a resource and when the first byte of a response begins to arrive.” – https://web.dev/ttfb/
A subset of the Web Vitals are the Core Web Vitals. The Core Web Vitals are identified as the most critical Web Vitals to pay attention to. As such, they play a role in the Google Search algorithm. Improving a webpage’s Core Web Vitals can improve success with Google Search. The Core Web Vitals currently consist of three metrics: Largest Contentful Paint (LCP), First Input Delay (FID) and Cumulative Layout Shift (CLS). Respectively they measure Loading Speed, Interactivity and Visual Stability. This will change in March 2024 when Interaction To Next Paint (INP) replaces FID as the Core Web Vital for Interactivity.
Interaction
An Interaction on a webpage starts with a user input. The browser then reacts to this input. This includes the input delay, the processing time and the presentation delay before the next paint occurs and the new frame is presented.
Keeping in mind that an interaction is composed of these three serialized durations – input delay, processing time and presentation delay – will help later on to understand the difference between FID and INP.
First Input Delay (FID)
“FID measures the time from when a user first interacts with a page (that is, when they click a link, tap on a button, or use a custom, JavaScript-powered control) to the time when the browser is actually able to begin processing event handlers in response to that interaction.” – https://web.dev/fid/
FID is the current Core Web Vital that measures interactivity. FID measures the first interaction with the page. User interactions after the first interaction are not measured with FID. FID also only measures the input delay part of the first interaction. It does not measure the processing time and the presentation delay.
FID is classed as ‘Good’ if the input delay is less than 100 ms. FID is classed as ‘Needs Improvement’ between 100ms and 300ms. Delays above 300 ms are classed as ‘Poor’.
“INP is a metric that assesses a page's overall responsiveness to user interactions by observing the latency of all click, tap, and keyboard interactions that occur throughout the lifespan of a user's visit to a page. The final INP value is the longest interaction observed, ignoring outliers.” - https://web.dev/inp/
INP, like FID, is also a Web Vital that measures interactivity. INP observes all user interactions in a page view and reports the longest. It measures more than just the input delay duration of each interaction. It also measures the processing time and the presentation delay until the next paint occurs. Once you understand the mechanics of it, the name ‘Interaction to Next Paint’ is a good description of the duration it measures.
INP is classed as ‘Good’ if the final reported value is less than 200 ms. INP is classed as ‘Needs Improvement’ between 200ms and 500ms. Any measurement above 500 ms is classed as ‘Poor’.
Both FID and INP measure interactivity by measuring delays after user interactions. But INP is more comprehensive than FID. As an example, let’s say a user loads a web page and interacts only once by clicking a button. In this case, FID will capture this interaction by reporting the input delay after the user input. INP will also observe this interaction but it will measure not only the input delay but also the subsequent processing time and the presentation delay. Since this is the only interaction on the web page, INP will observe this as the longest duration within the page view and so will report this duration as the final reported INP value. Already it is clear that with just a single user interaction, INP provides a more comprehensive signal of interactivity because it includes processing time and presentation delay.
But INP also goes beyond the first interaction on the page. It observes all the interactions within a page view and reports the longest interaction of the set (ignoring outliers). This means that web sites need to ensure that all interactions throughout the lifecycle of a page view are under 200ms in order to score a ‘Good’ INP. With FID, web sites only need to focus on optimizing the first interaction’s input delay under 100 ms to score ‘Good’ FID. With INP joining the Core Web Vitals, web sites will need to focus on optimizing all interactions.
Comparing FID with INP across Cloudflare
At Cloudflare, for sites that have enabled Real User Measurements (RUM) via the Web Analytics Product or the Observatory Product, we already collect INP data. This means we have a rich dataset across 850k sites with which to analyze INP against FID.
FID vs INP
Over the period of a week, across all Cloudflare RUM-enabled sites, we observed over four billion reported FIDs and INPs. 93% of the FID values classify as ‘Good’ (under 100 ms). 75% of the INP values classify as ‘Good’ (under 200 ms). Since these values are sourced from the same set of page views, it is already possible to see at a glance that INP is distributed more lightly in the ‘Good’ range than FID.
Interestingly, the P75 value for FID is just 16 ms. A 0.16 times multiple of the FID ‘Good’ threshold of 100 ms. For INP, the P75 value is 200 ms. A one times multiple of the INP ‘Good’ threshold.
INP across devices
Focusing on INP, when the INP data is segmented by device type, we observe that 88% of desktop INP classify as ‘Good’, but only 67% of mobile INP classify as ‘Good’. This suggests that INP is generally suffering more on mobile devices than on desktop.
The bottom line is that INP is more challenging than FID to ‘get into the Green’. Since INP is a more comprehensive measure of interactivity, web sites are more exposed, and less likely to score favorably.
How to prepare for the change
INP will start affecting Google Search rankings when it becomes a Core Web Vital in March 2024. To get ready, websites need to improve interactivity beyond the initial load of the site.
As always, in order to improve on a metric, a baseline must be drawn by collecting data on the metric. But with INP, this can be challenging because INP is best reported from field data. Field data means that the data comes from real users interacting with web pages on real browsers. With field data, synthetic tools like Google Lighthouse aren’t a great fit. Synthetic tools are not designed to emulate the wide range of users on the wide range of browsers and operating systems that will navigate a web page.
In order to collect real user data from real browsers, websites need to enable a RUM provider. RUM providers collect performance data from real browsers, and process the data so that it can be aggregated and analyzed. It’s worth noting that performance data is anonymous and does not include any personal identifiable information (PII).
So the first step to understanding INP on a website is to enable a RUM provider.
Once a RUM provider is enabled on a website, it is then possible to analyze INP data to understand which web pages are not optimized for interactivity. There can be many possible causes for this. Since INP is composed of input delay, processing time and presentation delay, optimizing INP can be broken down into optimizing these distinct durations.
The best advice for optimizing INP is set out by web.dev. Optimizing INP is not straight-forward – it can involve breaking up JavaScript tasks, reducing DOM interactions and layouts, avoiding use of timers, and limiting third-party code amongst a range of other measures. That’s why it’s best to get started early and learn as much as possible before the change takes place.
How Cloudflare can help
A free RUM provider
Cloudflare offers a free RUM provider which collects INP as part of its dataset. It currently powers Cloudflare Web Analytics and Cloudflare Observatory. By enabling RUM with Cloudflare, you can explore the interactivity of your site’s web pages and start to identify interactivity issues.
Just log onto the Cloudflare Dashboard, and head to your target account. Go to Web Analytics.
Reduce the impact of third-party scripts
One of the contributing causes of degraded INP is JavaScript blocking the main thread after an interaction. Often this can be caused by heavy third-party scripts attaching event listeners to DOM elements. For example, third-party analytics scripts can register listeners on interactive elements of a page to power various forms of analytics. Many sites have dozens, if not hundreds of third-party scripts running, each one potentially degrading INP.
Cloudflare offers a unique product that can entirely remove third-party scripts from the browser. This frees up the main thread, boosting interactivity. If you haven’t come across Cloudflare Zaraz before, check it out in our docs. Not only can it improve INP, but it can also dramatically improve the security posture of your site by reducing (or even entirely removing) the amount of third-party JavaScript that runs on your website.
Security updates have been issued by Debian (libxpm and php7.3), Fedora (chromium), Mageia (kernel, kernel-linus, and sysstat), Red Hat (c-ares), SUSE (libwebp), and Ubuntu (cups-filters, libjettison-java, and libsvgpp-dev).
Какво ще се получи, ако миксираме „Републиканци за България“ и „Има такъв народ“? Нещо консервативно, българо-мъжкарско, евроатлантическо, антипутинско, с три думи: партия на Гешев. Пилона на Рожен с вратовръзка на слончета и червен конец против уроки. И ще се извисим като народ в целия си ръст, както обеща бившият обвинител №1 в реч в YouTube, преди да прекрачи в политиката – вместо да поеме към кабинет във Върховната касационна прокуратура в съседство с бившия главен прокурор Сотир Цацаров и настоящия и.д. главен прокурор Борислав Сарафов.
Всъщност прекрачи от политиката в политиката, защото, по собствените му признания, политиката не е излязла от прокуратурата, а той така и не успя да убеди обществото, че е ефективен магистрат и българската прокуратура е независима и гарант за спазването на законността. За свое оправдание заяви, че „никоя прокуратура не може да се пребори с корупцията и кражбите тогава, когато корупцията и кражбите са превърнати в държавна политика“.
И това от най-недосегаемия човек в държавата, какъвто беше Иван Гешев в тези близо три години и половина от мандата си като главен прокурор, преди това – ръководител на специализираната прокуратура, магистрат, който имаше подръка институция, лостове и закони, за да се бори с мафията. Над него наистина беше само Господ, обаче зад него бяха политиците кукловоди.
Имидж за политическа употреба
Най-новата история на България показва, че преди да стартират политическата си кариера, политиците обикновено имат имиджов трамплин. Катапултът за Бойко Борисов бе легендата за неустрашимия главен секретар на МВР, изградена от медийно облюбване, черно кожено манто и маниери на мутра от Прехода.
За други входът в политиката е бащиното име – Сергей Станишев влезе в БСП като син на секретаря за международните връзки на ЦК на БКП Димитър Станишев. Трети биват изтласкани на политическата сцена от исторически обстоятелства – революции, протести и стачки, в които едни губят живота си, а други печелят огряно от слава и почести място. Има и политици като лидера на „Възраждане“ Костадин Костадинов, които чиракуват в други партии, шлифоват се на избори и ето че идва и техният ред.
Репутацията на Иван Гешев не е особено убедителна нито като борец с мафията, нито като защитник на прокуратурата – „последната крепост на правовия ред и демокрацията“ (из речта му от 24 февруари 2023 г.). Няма осъдени олигарси, няма осъдени за източването и фалита на КТБ – делото, с което се занимаваше две години като спецпрокурор и от което липсва олигархът и най-силният човек в ДПС – Делян Пеевски, а другите дела като „Барселонагейт“, които пряко засягат Бойко Борисов, стояха на трупчета. Свали ги в името на разплата, че го жертва, за да спаси кожата си. Както се констатира в анализ на „Сега“, делата, с които прокуратурата обича да се хвали, или не стигат до съда, или там се провалят. Затова и смелостта, обзела бившия главен прокурор на излизане от прокуратурата, изглежда комична.
За разлика от Борисов, който обикаляше страната, шофирайки джипа си на главен секретар, за да лови престъпници (!), като главен прокурор в последните месеци Гешев пътуваше, за да утешава близки на жертви на пътнотранспортни произшествия, да раздава икони, да беседва с ученици. Най-значимата му кауза беше срещу езика на омразата, за което го подкрепиха еврейски организации. Проведе и срещи с ромски лидери с помощта – за това помогна и Яков Джераси, един от активните представители на еврейската общност в България, съратник и на Сакскобургготски.
Трудно може да се напомпа рейтинг от такива събития. Ако си беше свършил работата като магистрат, те щяха да полират образа на борбения прокурор със състрадателна душа, отзивчив към човешките болки и проблемите на сегрегираните общности. Но извън този контекст пътуванията и срещите му още тогава предизвикаха коментари, че Гешев се готви за политическа кариера.
Място на терена
На терена, на който ще се бори и Гешев, е доста разкаляно. Разделението ляво–дясно не е валидно за българската политика, превзета от либерали vs. консерватори. Консерваторите са ѝ в повече – консерватори путинофили, патриотично-консервативни, консерватори русофоби, консерватори тръмписти… Консерватори се откриват във всяка коалиция и политическа сила в парламента и това е и общото кратно: „Демократи за силна България“ са консерваторите в ПП–ДБ, консерваторите доминират в ГЕРБ, а за „Има такъв народ“ и „Възраждане“ консервативното е част от политическата им тъкан. БСП отдавна е изгубила, ако изобщо е имала каквото и да било ляво, и е надянала същата консервативна маска.
На Иван Гешев най му подхожда като българин, мъж и християнин да застъпи в редиците на социалните консерватори, подкрепящи традиционното семейство, обявявайки се за социална устойчивост и умерен национализъм (не може да се мери с Костадинов, който е историк, а не върви все да говори за Левски като в ученическо есе), с умерен евроскептицизъм (все пак щеше да арестува Путин, ако дойде в България) и поносима доза религиозна екстатичност (сдържано, за да не напомня твърде много на евангелски дискурс за политиката). Според изследване на Gallup International Association (GIA) на религиозните нагласи в 61 държави от март т.г. 53% от българите се определят като религиозни, а 58% твърдят, че вярват в Бог. Данните поставят България малко под средата в листата на държавите по декларирана религиозност, което означава, че и червен конец на китката не пречи.
Позиционирането на Иван Гешев и бъдещата му политическа сила на този терен следва и политическите тенденции в световен мащаб, които показват изместване към консервативното дясно. Изследване на Gallup, представено по CNN, показа, че социалният консерватизъм в САЩ е на най-високото си ниво от десетилетие – предвид новите държавни предложения по проблемите на транссексуалните, абортите, употребата на наркотици и преподаване за пола и сексуалността в училищата. Така че шествия като походите в защита на традиционното семейство в България ще зачестят и нищо чудно Гешев да е в челните редици.
Тепърва ще разбере колко уязвим е като политик. Докато беше (главен) прокурор, институцията го пазеше. Но вече е политик, комуто изпълняващият длъжността главен прокурор е враг.
Заглавно изображение: Скрийншот от речта на Иван Гешев, публикувана в YouTube канала му на 19 юни 2023 г.
The collective thoughts of the interwebz
Manage Consent
To provide the best experiences, we use technologies like cookies to store and/or access device information. Consenting to these technologies will allow us to process data such as browsing behavior or unique IDs on this site. Not consenting or withdrawing consent, may adversely affect certain features and functions.
Functional
Always active
The technical storage or access is strictly necessary for the legitimate purpose of enabling the use of a specific service explicitly requested by the subscriber or user, or for the sole purpose of carrying out the transmission of a communication over an electronic communications network.
Preferences
The technical storage or access is necessary for the legitimate purpose of storing preferences that are not requested by the subscriber or user.
Statistics
The technical storage or access that is used exclusively for statistical purposes.The technical storage or access that is used exclusively for anonymous statistical purposes. Without a subpoena, voluntary compliance on the part of your Internet Service Provider, or additional records from a third party, information stored or retrieved for this purpose alone cannot usually be used to identify you.
Marketing
The technical storage or access is required to create user profiles to send advertising, or to track the user on a website or across several websites for similar marketing purposes.


 Vivek Gautam is a Data Architect with specialization in data lakes at AWS Professional Services. He works with enterprise customers building data products, analytics platforms, and solutions on AWS. When not building and designing modern data platforms, Vivek is a food enthusiast who also likes to explore new travel destinations and go on hikes.
 Mikhail Vaynshteyn is a Solutions Architect with Amazon Web Services. Mikhail works with healthcare and life sciences customers to build solutions that help improve patients’ outcomes. Mikhail specializes in data analytics services.
 Naresh Gautam is a Data Analytics and AI/ML leader at AWS with 20 years of experience, who enjoys helping customers architect highly available, high-performance, and cost-effective data analytics and AI/ML solutions to empower customers with data-driven decision-making. In his free time, he enjoys meditation and cooking.
 Harsha Tadiparthi is a specialist Principal Solutions Architect, Analytics at AWS. He enjoys solving complex customer problems in databases and analytics and delivering successful outcomes. Outside of work, he loves to spend time with his family, watch movies, and travel whenever possible.

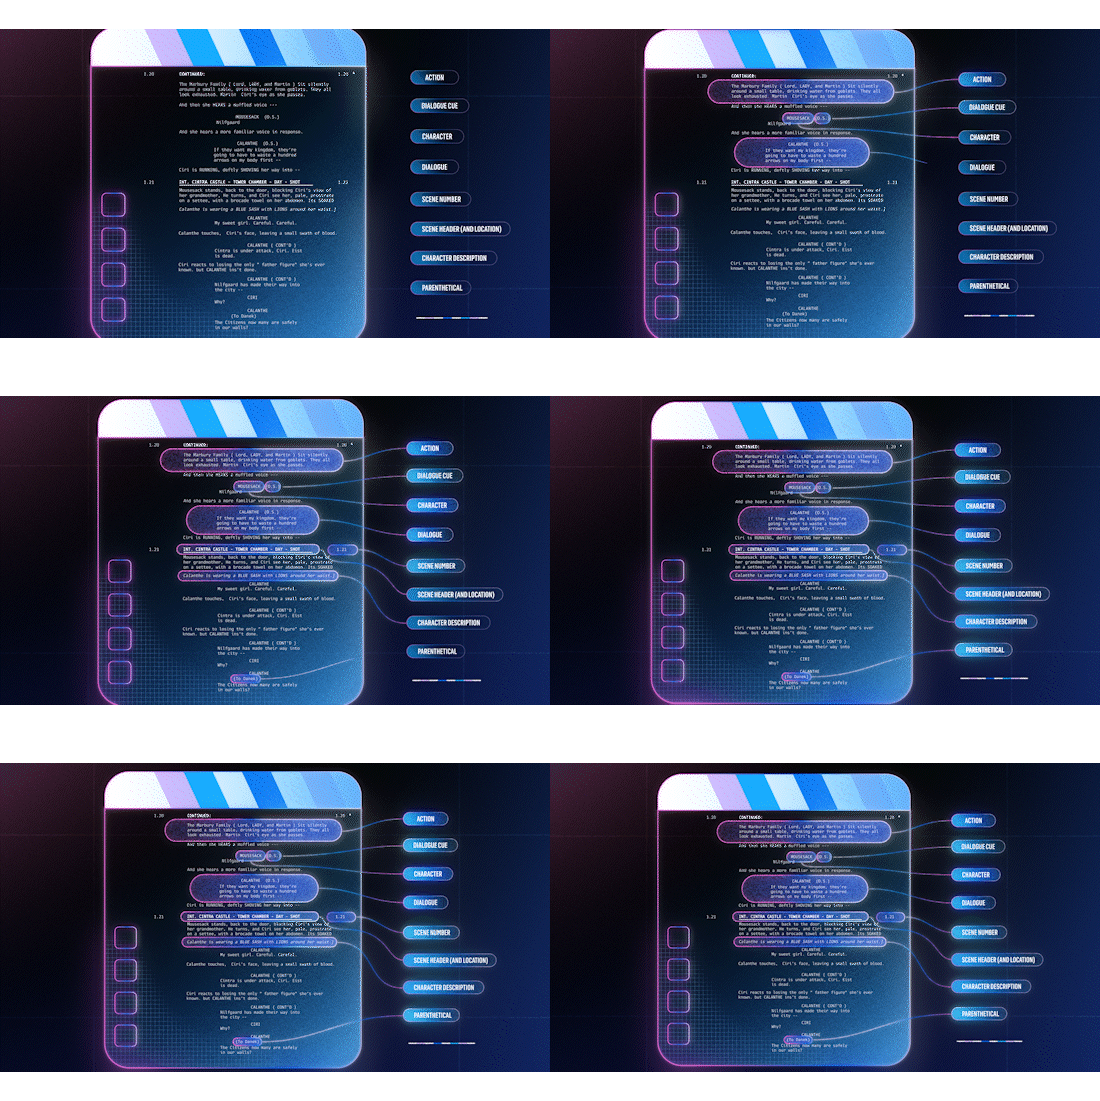





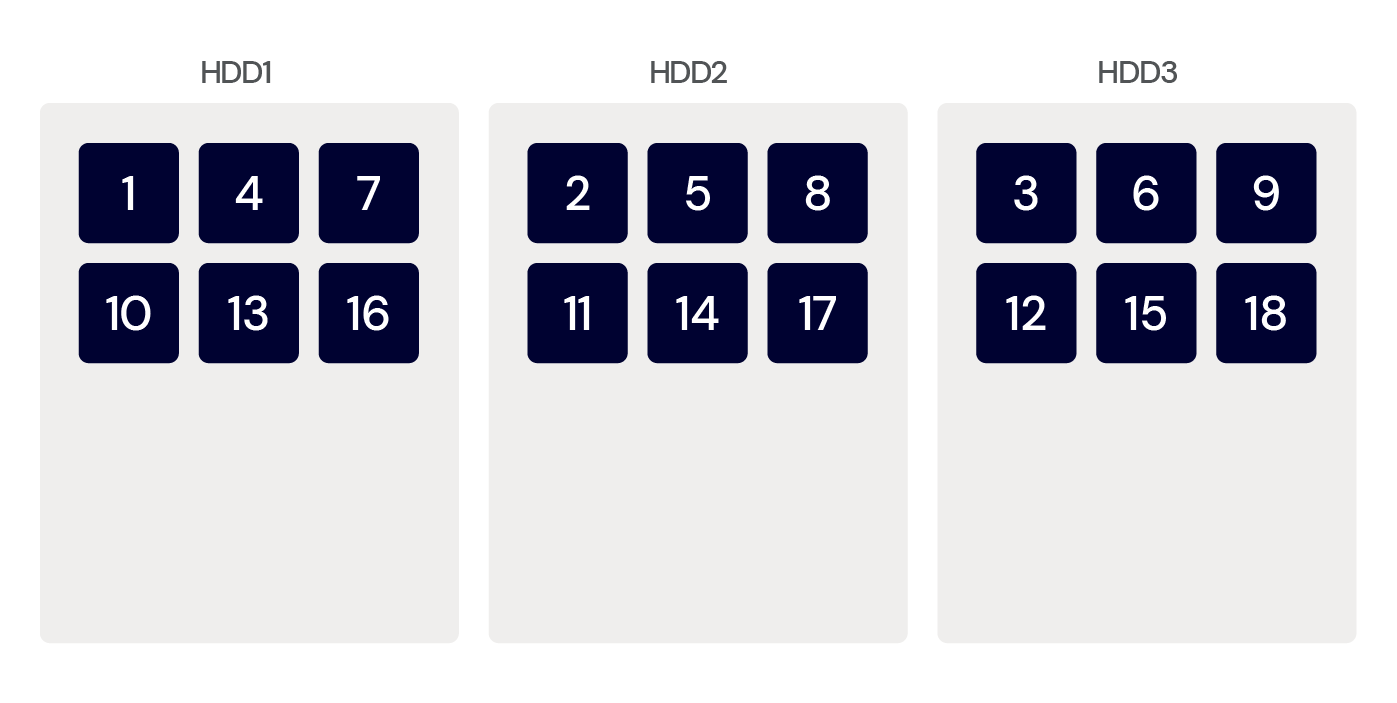
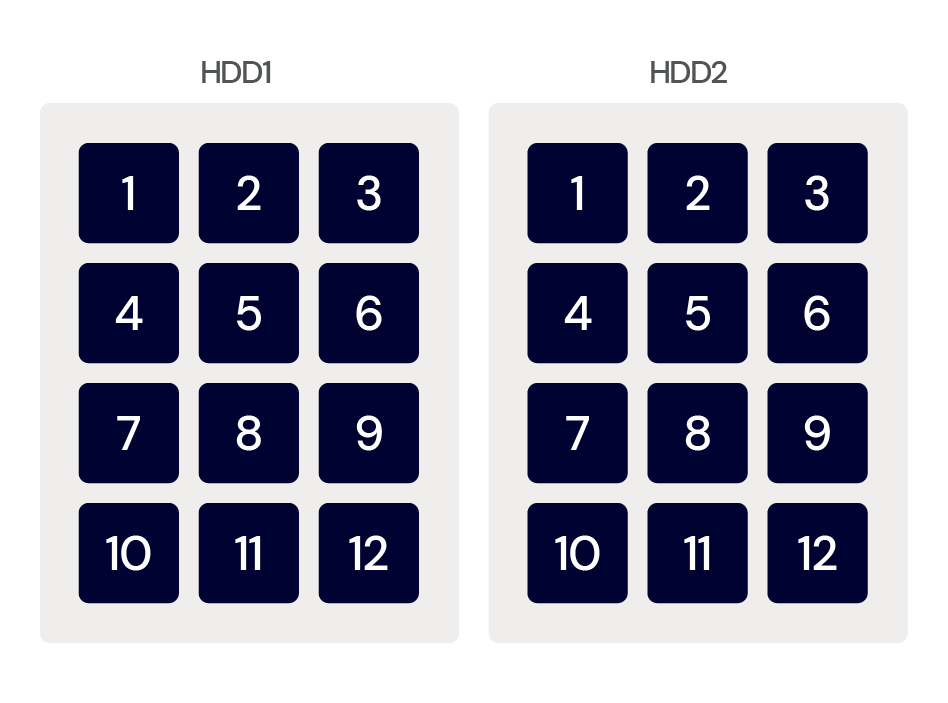
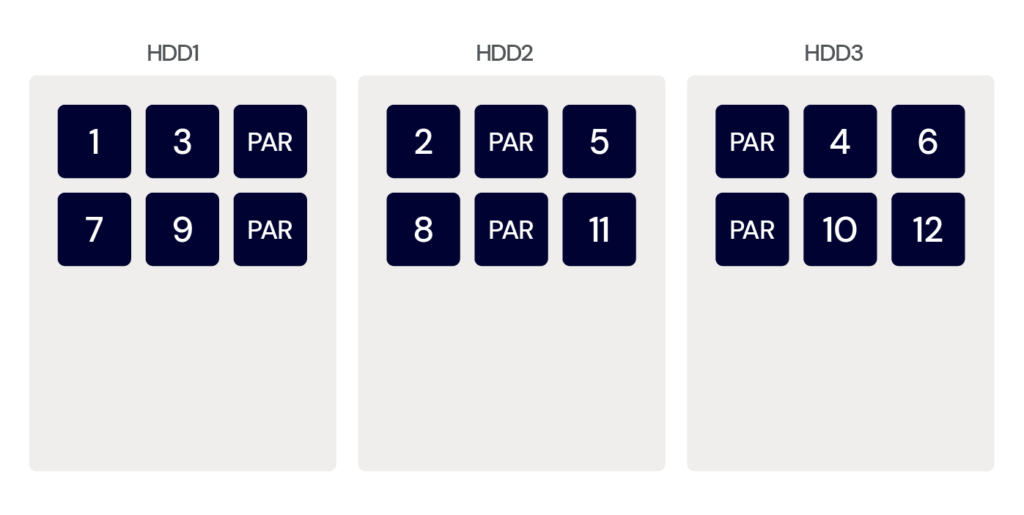
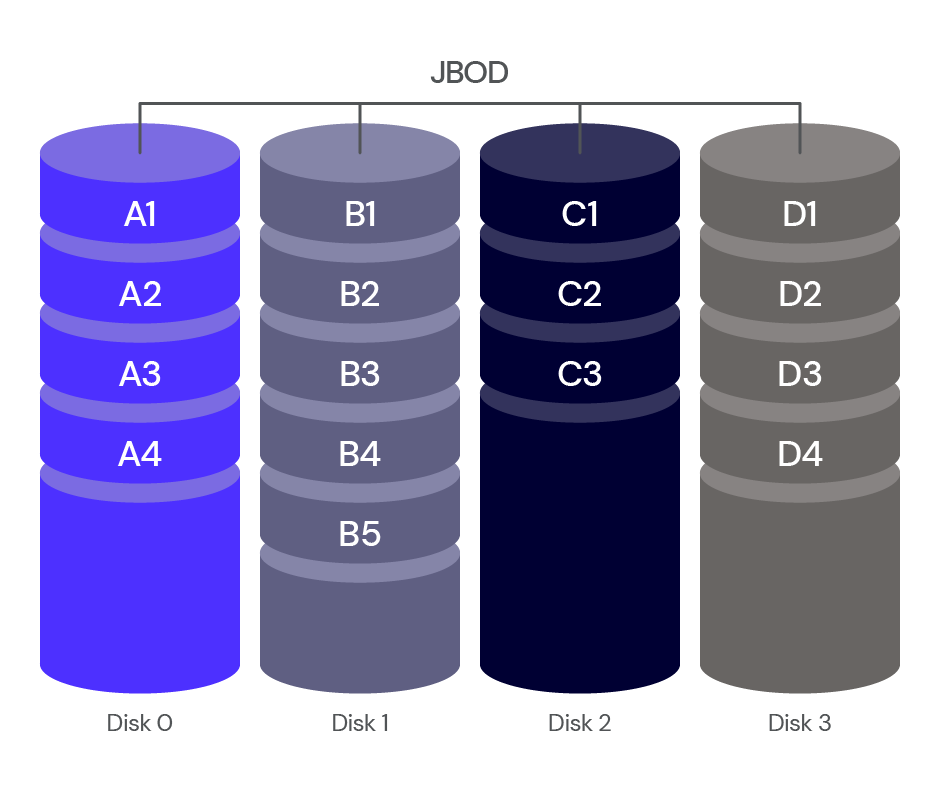
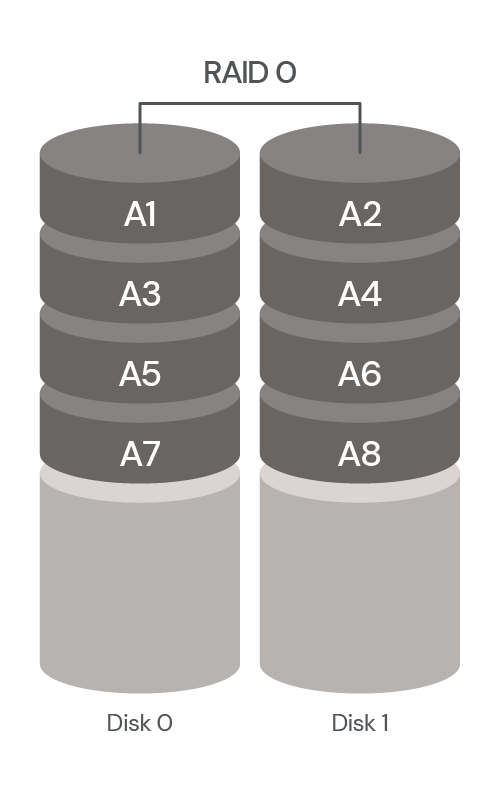
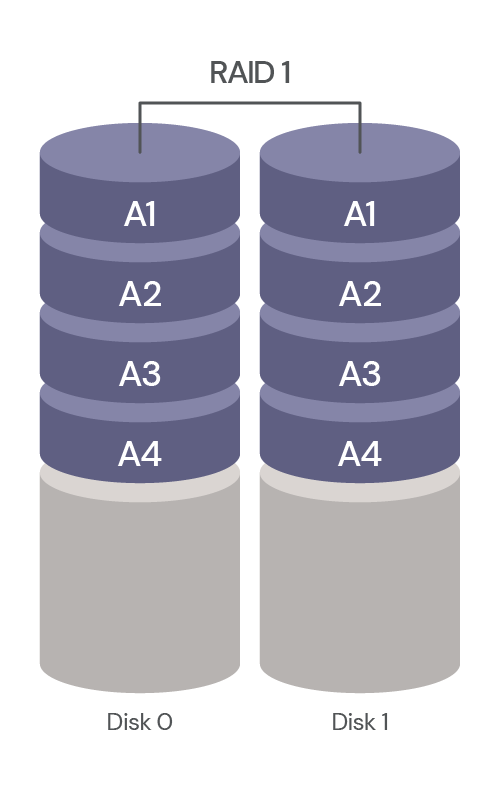
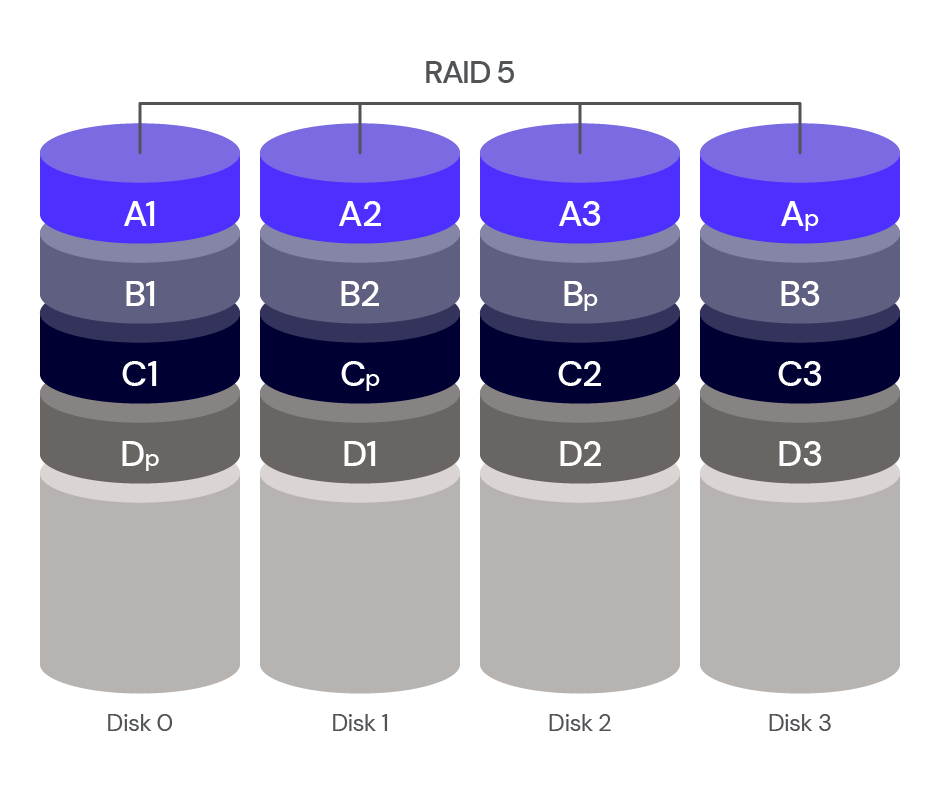
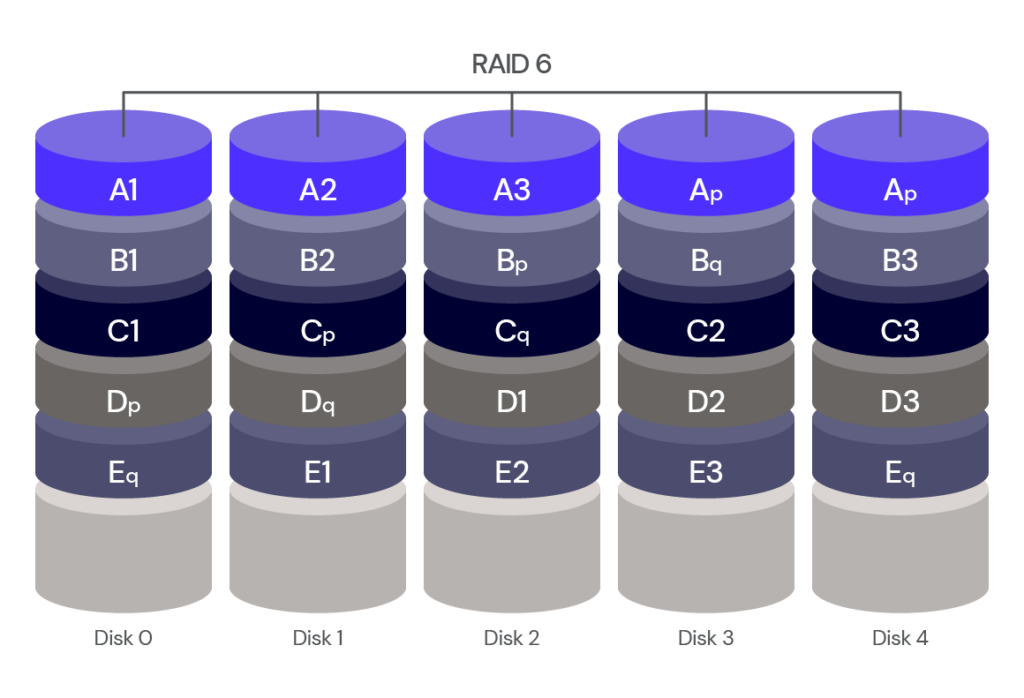
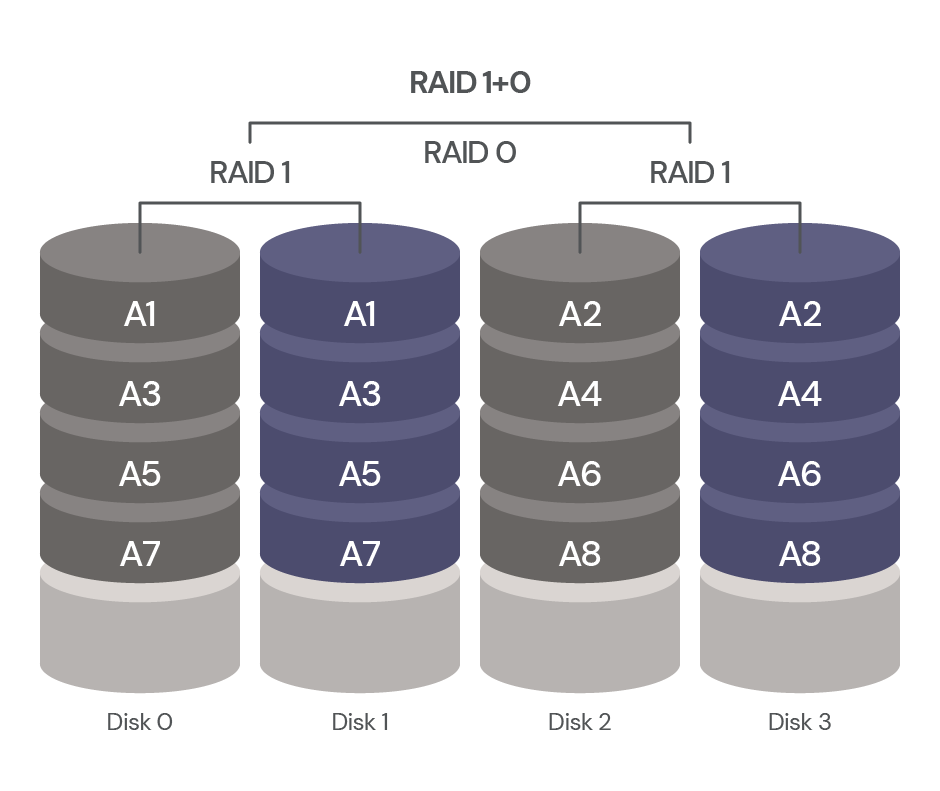
 usando p5.js, uma biblioteca JavaScript para código criativo, continuamos recebendo sugestões irrelevantes ou, às vezes, nenhuma sugestão. Mas quando aprendemos mais sobre a maneira como o GitHub Copilot processa as informações, percebemos que precisávamos ajustar a maneira como nos comunicamos com elas.
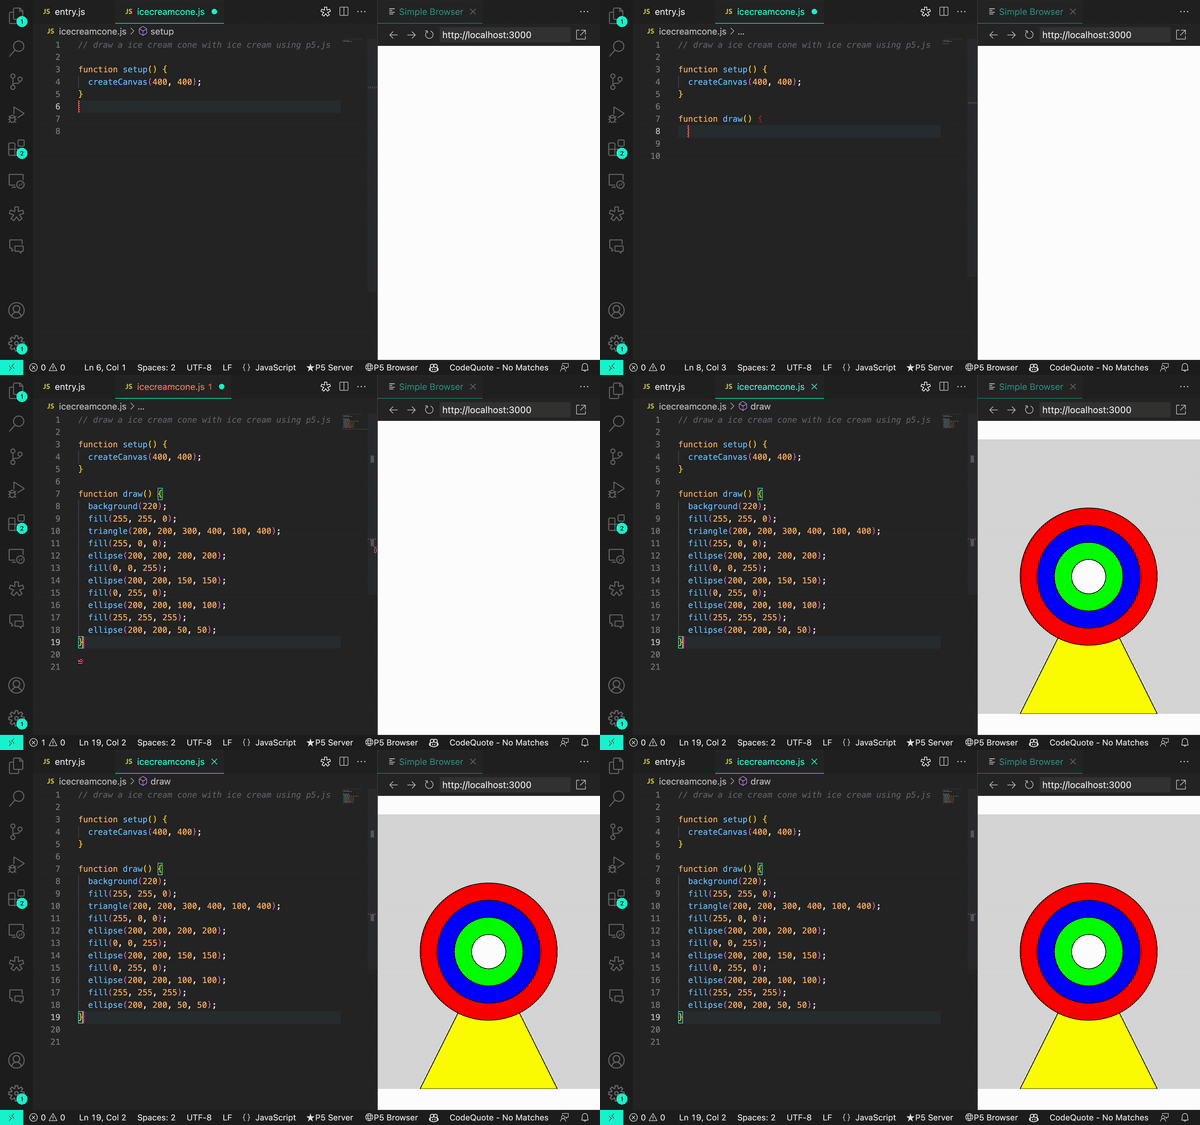
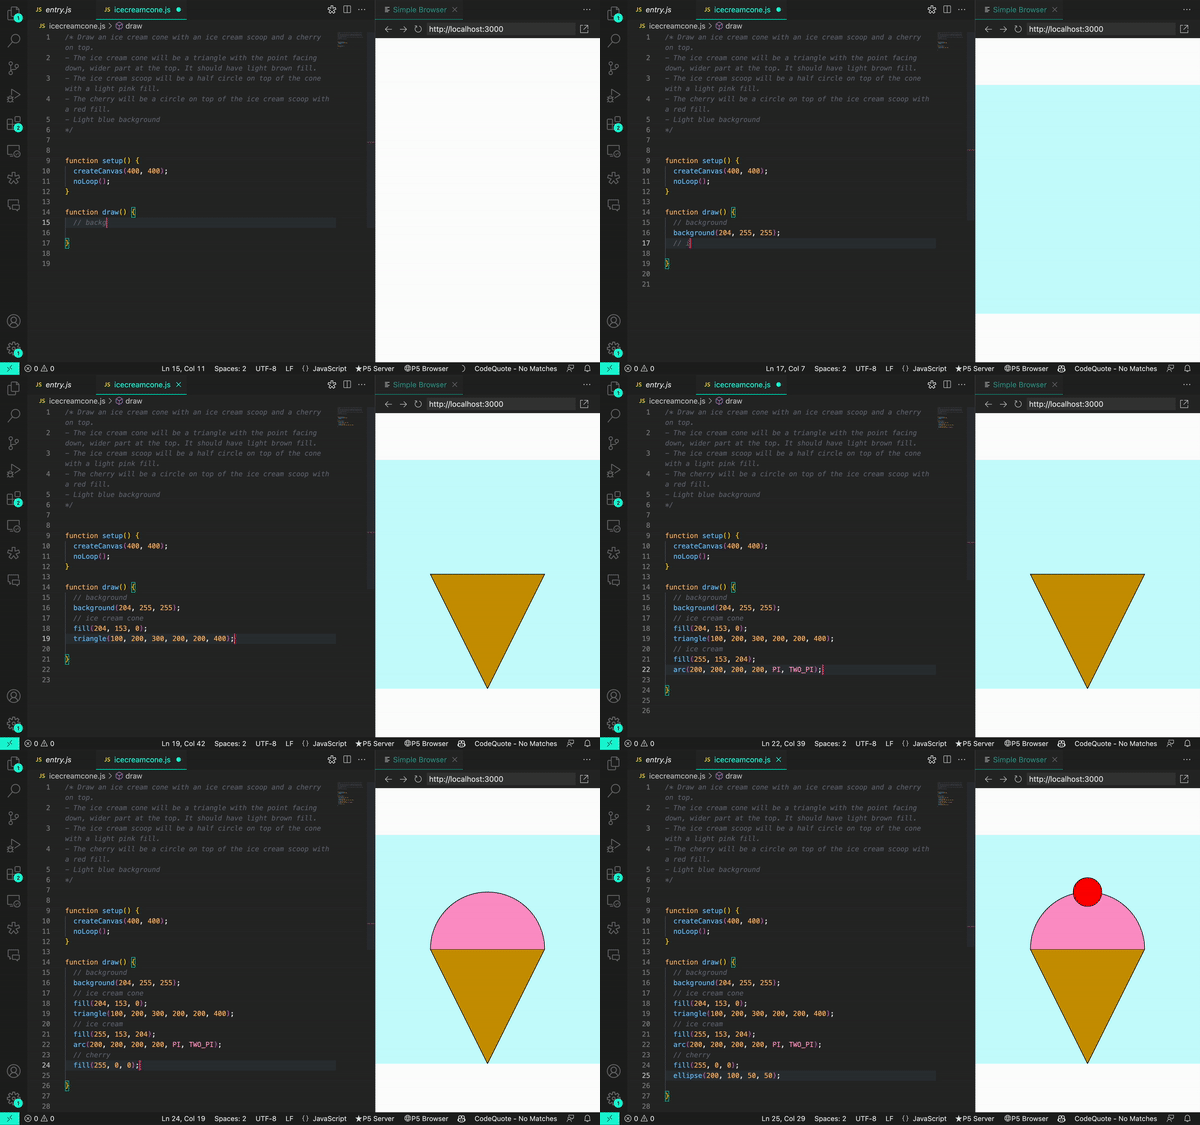


 de práctica