Analyze Amazon S3 storage costs using AWS Cost and Usage Reports, Amazon S3 Inventory, and Amazon Athena

Post Syndicated from Dagar Katyal original https://aws.amazon.com/blogs/big-data/analyze-amazon-s3-storage-costs-using-aws-cost-and-usage-reports-amazon-s3-inventory-and-amazon-athena/

Since its launch in 2006, Amazon Simple Storage Service (Amazon S3) has experienced major growth, supporting multiple use cases such as hosting websites, creating data lakes, serving as object storage for consumer applications, storing logs, and archiving data. As the application portfolio grows, customers tend to store data from multiple application and different business functions in a single S3 bucket, which can grow the storage in S3 buckets to hundreds of TBs. The AWS Billing console provides a way to look at the total storage cost of data stored in Amazon S3, but sometimes IT organizations need to understand the breakdown of costs of a particular S3 bucket by various prefixes or objects corresponding to a particular user or application. There are various reasons to analyze the costs of S3 buckets, such as to identify the spend breakdown, do internal chargebacks, understand the cost breakdown by business unit and application, and many more. As of this writing, there is no easy way to do a cost breakdown of S3 buckets by objects and prefixes.

In this post, we discuss a solution using Amazon Athena to query AWS Cost and Usage Reports and Amazon S3 Inventory reports to analyze the cost by prefixes and objects in an S3 bucket.

Overview of solution

The following figure shows the architecture for this solution. First, we enable the AWS Cost and Usage Reports (AWS CUR) and Amazon S3 Inventory features, which save the output into two separate pre-created S3 buckets. We then use Athena to query these S3 buckets for AWS CUR data and S3 object inventory data to correlate and allocate the cost breakdown at the object or prefix level.

architecture diagram

To implement the solution, we complete the following steps:

  1. Create S3 buckets for AWS CUR, S3 object inventory, and Athena results. Alternatively, you can create these respective buckets when enabling the respective individual features, but for the purpose of this post, we create all of them at the beginning.
  2. Enable the Cost and Usage Reports.
  3. Enable Amazon S3 Inventory configuration.
  4. Create AWS Glue Data Catalog tables for the CUR and S3 object inventory to query using Athena.
  5. Run queries in Athena.

Prerequisites

For this walkthrough, you should have the following prerequisites:

Create S3 buckets

Amazon S3 is an object storage service offering industry-leading scalability, data availability, security, and performance. Customers of all sizes and industries can store and protect any amount of data for virtually any use case, such as data lakes, cloud-native applications, and mobile apps. With cost-effective storage classes and easy-to-use management features, you can optimize costs, organize data, and configure fine-tuned access controls to meet specific business, organizational, and compliance requirements.

For this post, we use the S3 bucket s3-object-cost-allocation as the primary bucket for cost allocation. This S3 bucket is conveniently modeled to contain several prefixes and objects of different sizes for which cost allocation needs to be done based on the overall cost of the bucket. In a real-world scenario, you should use a bucket that has data for multiple teams and for which you need to allocate costs by prefix or object. Going forward, we refer to this bucket as the primary object bucket.

The following screenshot shows our S3 bucket and folders.

example Folders created

Now let’s create the three additional operational S3 buckets to store the datasets generated to calculate costs for the objects. You can create the following buckets or any existing buckets as needed:

  • cur-cost-usage-reports-<account_number> – This bucket is used to save the Cost and Usage Reports for the account.
  • S3-inventory-configurations-<account_number> – This bucket is used to save the inventory configurations of our primary object bucket.
  • athena-query-bucket-<account_number> – This bucket is used to save the query results from Athena.

Complete the following steps to create your S3 buckets:

  • On the Amazon S3 console, choose Buckets in the navigation pane.
  • Choose Create bucket.
  • For Bucket name, enter the name of your bucket (cur-cost-usage-reports-<account_number>).
  • For AWS Region, choose your preferred Region.
  • Leave all other settings at default (or according to your organization’s standards).
  • Choose Create bucket.
    create s3 bucket
  • Repeat these steps to create s3-inventory-configurations-<account_number> and athena-query-bucket-<account_number>.

Enable the Cost and Usage Reports

The AWS Cost and Usage Reports (AWS CUR) contains the most comprehensive set of cost and usage data available. You can use Cost and Usage Reports to publish your AWS billing reports to an S3 bucket that you own. You can receive reports that break down your costs by the hour, day, or month; by product or product resource; or by tags that you define yourself.

Complete the following steps to enable Cost and Usage Reports for your account:

  • On the AWS Billing console, in the navigation pane, choose Cost & Usage Reports.
  • Choose Create report.
  • For Report name, enter a name for your report, such as account-cur-s3.
  • For Additional report details, select Include resource IDs to include the IDs of each individual resource in the report.Including resource IDs will create individual line items for each of your resources. This can increase the size of your Cost and Usage Reports files significantly, which can affect the S3 storage costs for your CUR, based on your AWS usage. We need this feature enabled for this post.
  • For Data refresh settings, select whether you want the Cost and Usage Reports to refresh if AWS applies refunds, credits, or support fees to your account after finalizing your bill.When a report refreshes, a new report is uploaded to Amazon S3.
  • Choose Next.
  • For S3 bucket, choose Configure.
  • For Configure S3 Bucket, select an existing bucket created in the previous section (cur-cost-usage-reports-<account_number>) and choose Next.
  • Review the bucket policy, select I have confirmed that this policy is correct, and choose Save. This default bucket policy provides Cost and Usage Reports access to write data to Amazon S3.
  • For Report path prefix, enter cur-data/account-cur-daily.
  • For Time granularity, choose Daily.
  • For Report versioning, choose Overwrite existing report.
  • For Enable report data integration for, select Amazon Athena.
  • Choose Next.
  • After you have reviewed the settings for your report, choose Review and Complete.
    create cost and usage report

The Cost and Usage reports will be delivered to the S3 buckets within 24 hours.

The following sample CUR in CSV format shows different columns of the Cost and Usage Report, including bill_invoice_id, bill_invoicing_entity, bill_payer_account_id, and line_item_product_code, to name a few.

sample cost and usage report

Enable Amazon S3 Inventory configuration

Amazon S3 Inventory is one of the tools Amazon S3 provides to help manage your storage. You can use it to audit and report on the replication and encryption status of your objects for business, compliance, and regulatory needs. Amazon S3 Inventory provides comma-separated values (CSV), Apache Optimized Row Columnar (ORC), or Apache Parquet output files that list your objects and their corresponding metadata on a daily or weekly basis for an S3 bucket or a shared prefix (objects that have names that begin with a common string).

Complete the following steps to enable Amazon S3 Inventory on the primary object bucket:

  • On the Amazon S3 console, choose Buckets in the navigation pane.
  • Choose the bucket for which you want to configure Amazon S3 Inventory.
    This will be the existing bucket in your account that has data that needs to be analyzed. This could be your data lake or application S3 bucket. We created the bucket s3-object-cost-allocation with some sample data and folder structure.
  • Choose Management.
  • Under Inventory configurations, choose Create inventory configuration.
  • For Inventory configuration name, enter s3-object-cost-allocation.
  • For Inventory scope, leave Prefix blank.
    This is to ensure that all objects are covered for the report.
  • For Object Versions, select Current version only.
  • For Report details, choose This account.
  • For Destination, choose the destination bucket we created (s3-inventory-configurations-<account_number>).
  • For Frequency, choose Daily.
  • For Output format, choose as Apache Parquet.
  • For Status, choose Enable.
  • Keep server-side encryption disabled. To use server-side encryption, choose Enable and specify the encryption key.
  • For Additional fields, select the following to add to the inventory report:
    • Size – The object size in bytes.
    • Last modified date – The object creation date or the last modified date, whichever is the latest.
    • Multipart upload – Specifies that the object was uploaded as a multipart upload. For more information, see Uploading and copying objects using multipart upload.
    • Replication status – The replication status of the object. For more information, see Using the S3 console.
    • Encryption status – The server-side encryption used to encrypt the object. For more information, see Protecting data using server-side encryption.
    • Bucket key status – Indicates whether a bucket-level key generated by AWS KMS applies to the object.
    • Storage class – The storage class used for storing the object.
    • Intelligent-Tiering: Access tier – Indicates the access tier of the object if it was stored in Intelligent-Tie
      create s3 inventory
  • Choose Create.
    s3 inventory configuration

It may take up to 48 hours to deliver the first report.

Create AWS Glue Data Catalog tables for CUR and Amazon S3 Inventory reports

Wait for up to 48 hours for the previous step to generate the reports. In this section, we use Athena to create and define AWS Glue Data Catalog tables for the data that has been created using Cost and Usage Reports and Amazon S3 Inventory reports.

Athena is a serverless, interactive analytics service built on open-source frameworks, supporting open-table and file formats. Athena provides a simplified, flexible way to analyze petabytes of data where it lives.

Complete the following steps to create the tables using Athena:

  • Navigate to the Athena console.
  • If you’re using Athena for the first time, you need to set up a query result location in Amazon S3. If you preconfigured this in Athena , you can skip this step.
    • Choose View settings.
      athena setup query bucket
    • Choose Manage.
    • In the section Query result location and encryption, choose Browse S3 and choose the bucket that we created (athena-query-bucket-<account_number>).
    • Choose Save.
      Athena Config
    • Navigate back to the Athena query editor.
  • Run the following query in Athena to create a table for Cost and Usage Reports. Verify and update the section for <<LOCATION>> at the end of the query and point it to the correct S3 bucket and location. Note that the new table name should be account_cur.
    CREATE EXTERNAL TABLE `account_cur`(
    `identity_line_item_id` string,
    `identity_time_interval` string,
    `bill_invoice_id` string,
    `bill_billing_entity` string,
    `bill_bill_type` string,
    `bill_payer_account_id` string,
    `bill_billing_period_start_date` timestamp,
    `bill_billing_period_end_date` timestamp,
    `line_item_usage_account_id` string,
    `line_item_line_item_type` string,
    `line_item_usage_start_date` timestamp,
    `line_item_usage_end_date` timestamp,
    `line_item_product_code` string,
    `line_item_usage_type` string,
    `line_item_operation` string,
    `line_item_availability_zone` string,
    `line_item_resource_id` string,
    `line_item_usage_amount` double,
    `line_item_normalization_factor` double,
    `line_item_normalized_usage_amount` double,
    `line_item_currency_code` string,
    `line_item_unblended_rate` string,
    `line_item_unblended_cost` double,
    `line_item_blended_rate` string,
    `line_item_blended_cost` double,
    `line_item_line_item_description` string,
    `line_item_tax_type` string,
    `line_item_legal_entity` string,
    `product_product_name` string,
    `product_availability` string,
    `product_description` string,
    `product_durability` string,
    `product_event_type` string,
    `product_fee_code` string,
    `product_fee_description` string,
    `product_free_query_types` string,
    `product_from_location` string,
    `product_from_location_type` string,
    `product_from_region_code` string,
    `product_group` string,
    `product_group_description` string,
    `product_location` string,
    `product_location_type` string,
    `product_message_delivery_frequency` string,
    `product_message_delivery_order` string,
    `product_operation` string,
    `product_platopricingtype` string,
    `product_product_family` string,
    `product_queue_type` string,
    `product_region` string,
    `product_region_code` string,
    `product_servicecode` string,
    `product_servicename` string,
    `product_sku` string,
    `product_storage_class` string,
    `product_storage_media` string,
    `product_to_location` string,
    `product_to_location_type` string,
    `product_to_region_code` string,
    `product_transfer_type` string,
    `product_usagetype` string,
    `product_version` string,
    `product_volume_type` string,
    `pricing_rate_code` string,
    `pricing_rate_id` string,
    `pricing_currency` string,
    `pricing_public_on_demand_cost` double,
    `pricing_public_on_demand_rate` string,
    `pricing_term` string,
    `pricing_unit` string,
    `reservation_amortized_upfront_cost_for_usage` double,
    `reservation_amortized_upfront_fee_for_billing_period` double,
    `reservation_effective_cost` double,
    `reservation_end_time` string,
    `reservation_modification_status` string,
    `reservation_normalized_units_per_reservation` string,
    `reservation_number_of_reservations` string,
    `reservation_recurring_fee_for_usage` double,
    `reservation_start_time` string,
    `reservation_subscription_id` string,
    `reservation_total_reserved_normalized_units` string,
    `reservation_total_reserved_units` string,
    `reservation_units_per_reservation` string,
    `reservation_unused_amortized_upfront_fee_for_billing_period` double,
    `reservation_unused_normalized_unit_quantity` double,
    `reservation_unused_quantity` double,
    `reservation_unused_recurring_fee` double,
    `reservation_upfront_value` double,
    `savings_plan_total_commitment_to_date` double,
    `savings_plan_savings_plan_a_r_n` string,
    `savings_plan_savings_plan_rate` double,
    `savings_plan_used_commitment` double,
    `savings_plan_savings_plan_effective_cost` double,
    `savings_plan_amortized_upfront_commitment_for_billing_period` double,
    `savings_plan_recurring_commitment_for_billing_period` double,
    `resource_tags_user_bucket_name` string,
    `resource_tags_user_cost_tracking` string)
    PARTITIONED BY (
    `year` string,
    `month` string)
    ROW FORMAT SERDE
    'org.apache.hadoop.hive.ql.io.parquet.serde.ParquetHiveSerDe'
    STORED AS INPUTFORMAT
    'org.apache.hadoop.mapred.TextInputFormat'
    OUTPUTFORMAT
    'org.apache.hadoop.hive.ql.io.HiveIgnoreKeyTextOutputFormat'
    LOCATION
    '<<LOCATION>>'
  • Run the following query in Athena to create the table for Amazon S3 Inventory. Verify and update the section for <<LOCATION>> at the end of the query and point it to the correct S3 bucket and location.
    • To get the exact value of the location, navigate to the bucket where inventory configurations are stored and navigate to the folder path Hive . Use the S3 URI to replace <<LOCATION>> in the query.query path location
      CREATE EXTERNAL TABLE s3_object_inventory(
               bucket string,
               key string,
               version_id string,
               is_latest boolean,
               is_delete_marker boolean,
               size bigint,
               last_modified_date bigint,
               storage_class string,
               is_multipart_uploaded boolean,
               replication_status string,
               encryption_status string,
               intelligent_tiering_access_tier string,
               bucket_key_status string
      ) PARTITIONED BY (
              dt string
      )
      ROW FORMAT SERDE 'org.apache.hadoop.hive.ql.io.parquet.serde.ParquetHiveSerDe'
        STORED AS INPUTFORMAT 'org.apache.hadoop.hive.ql.io.SymlinkTextInputFormat'
        OUTPUTFORMAT 'org.apache.hadoop.hive.ql.io.IgnoreKeyTextOutputFormat'
        LOCATION '<<LOCATION>>';
      
  • We need to refresh the partitions and add new inventory lists to the table. Use the following commands to add data to the CUR table and Amazon S3 Inventory table:
    MSCK REPAIR TABLE `account_cur`;
    
    MSCK REPAIR TABLE s3_object_inventory;

Run queries in Athena to allocate the cost of objects in an S3 bucket

Now we can query the data we have available to get a cost allocation breakdown at the prefix level.

We need to provide some information in the following queries:

  • Update <<YYYY-MM-DD>> with the date for which you want to analyze the data
  • Update <<prefix>> with the prefix values for your bucket that needs to be analyzed
  • Update <<bucket_name>> with the name of the bucket that needs to be analyzed

We use the following part of the query to calculate the size of storage being used by the target prefix that we want to calculate the cost for:

select date_parse(dt,'%Y-%m-%d-%H-%i') dt, cast (sum(size) as double) targetPrefixBytes
from s3_object_inventory
where date_parse(dt,'%Y-%m-%d-%H-%i') = cast('<<YYYY-MM-DD>>' as timestamp)
and key like '<<prefix>>/%'
group by dt

Next, we calculate the total size of the bucket on that particular date:

select date_parse(dt,'%Y-%m-%d-%H-%i') dt, cast (sum(size) as double) totalBytes
from s3_object_inventory
where date_parse(dt,'%Y-%m-%d-%H-%i') = cast('<<YYYY-MM-DD>>' as timestamp)
group by dt

We query the CUR table to get the cost of a particular bucket on a particular date:

select line_item_usage_start_date as dt, sum(line_item_blended_cost) as line_item_blended_cost
from "account_cur"
where line_item_product_code = 'AmazonS3'
and product_servicecode = 'AmazonS3'
and line_item_operation = 'StandardStorage'
and line_item_resource_id = '<<bucket_name>>'
and line_item_usage_start_date = cast('<<YYYY-MM-DD>>' as timestamp)
group by line_item_usage_start_date

Putting all of this together, we can calculate the cost of a particular prefix (folder or a file) on a specific date. The complete query is as follows:

with
cost as (select line_item_usage_start_date as dt, sum(line_item_blended_cost) as line_item_blended_cost
from "account_cur"
where line_item_product_code = 'AmazonS3'
and product_servicecode = 'AmazonS3'
and line_item_operation = 'StandardStorage'
and line_item_resource_id = '<<bucket_name>>'
and line_item_usage_start_date = cast('<<YYYY-MM-DD>>' as timestamp)
group by line_item_usage_start_date),
total as (select date_parse(dt,'%Y-%m-%d-%H-%i') dt, cast (sum(size) as double) totalBytes
from s3_object_inventory
where date_parse(dt,'%Y-%m-%d-%H-%i') = cast('<<YYYY-MM-DD>>' as timestamp)
group by dt),
target as (select date_parse(dt,'%Y-%m-%d-%H-%i') dt, cast (sum(size) as double) targetPrefixBytes
from s3_object_inventory
where date_parse(dt,'%Y-%m-%d-%H-%i') = cast('<<YYYY-MM-DD>>' as timestamp)
and key like '<<prefix>>/%'
group by dt)
select target.dt,
(target.targetPrefixBytes/ total.totalBytes * 100) percentUsed,
cost.line_item_blended_cost totalCost,
cost.line_item_blended_cost*(target.targetPrefixBytes/ total.totalBytes) as prefixCost
from target, total, cost
where target.dt = total.dt
and target.dt = cost.dt

The following screenshot shows the results table for the sample data we used in this post. We get the following information:

  • dt – Date
  • percentUsed – The percentage of prefix space compared to overall bucket space
  • totalCost – The total cost of the bucket
  • prefixCost – The cost of the space used by the prefix

final result percetage

Clean up

To stop incurring costs, be sure to disable Amazon S3 Inventory and Cost and Usage Reports when you’re done.

Delete the S3 buckets created for the Amazon S3 Inventory reports and Cost and Usage Reports to avoid storage charges.

Other methods for Amazon S3 storage analysis

Amazon S3 Storage Lens can provide a single view of object storage usage and activity across your entire Amazon S3 storage. With S3 Storage Lens, you can understand, analyze, and optimize storage with over 29 usage and activity metrics and interactive dashboards to aggregate data for your entire organization, specific accounts, Regions, buckets, or prefixes. All of this data is accessible on the Amazon S3 console or as raw data in an S3 bucket.

S3 Storage Lens doesn’t provide cost analysis based on an object or prefix in a single bucket. If you want visibility of storage usage and trends across the entire storage footprint along with recommendations on cost efficiency and data protection best practices, S3 Storage Lens is the right option. But if you want a cost analysis of specific S3 buckets and looking for ways to get cost allocation of S3 objects at the object or prefix level, the solution in this post would be the best fit.

Conclusion

In this post, we detailed how to create a cost breakdown model at the object or prefix level for S3 buckets that contains data for multiple business units and applications. We used Athena to query the reports and datasets produced by the AWS CUR and Amazon S3 Inventory features that, when correlated, give us the cost allocation at the object and prefix level. This solution gives you an easy way to calculate costs for independent objects and prefixes, which can be used for internal chargebacks or just to know the per-object or per-prefix spending in a shared S3 bucket.


About the Authors


Dagar Katyal
is a Senior Solutions Architect at AWS, based in Chicago, Illinois. He works with customers and provides guidance for key strategic initiatives important for their business. Dagar has an MBA and has spent years over 15 years working with customers on projects on analytics strategy, roadmap, and using data as a key differentiator. When not working with customers, Dagar spends time with his family and doing home improvement projects.


Saiteja Pudi
is a Solutions Architect at AWS, based in Dallas, Tx. He has been with AWS for more than 3 years now, helping customers derive the true potential of AWS by being their trusted advisor. He comes from an application development background, interested in Data Science and Machine Learning.

Troubleshooting InsightAppSec Authentication Issues

Post Syndicated from Shane Queeney original https://blog.rapid7.com/2023/02/02/troubleshooting-insightappsec-authentication-issues/

Troubleshooting InsightAppSec Authentication Issues

For complete visibility into the vulnerabilities in your environment, proper authentication to web apps in InsightAppSec is essential. In this article, we’ll look at issues you might encounter with macro, traffic, and selenium authentication and how to troubleshoot them. Additionally, you’ll get practical and actionable tips on using InsightAppSec to its full potential.

The first step to troubleshooting InsightAppSec authentication is to look over the scan logs. The scan logs can be located under the scan in the upper left hand corner. The logs can give you useful information such as if the authentication fails, the website is unavailable, or if any other problems arose during the scan.

  • Event log will give you information about the scan itself.
  • Platform event log will give you information about the scan engine and if it encountered any issues during the scan.
  • Download additional logs: If you wanted to dive even deeper into what happened during the scan, you can to to look into the full scan logs.
Troubleshooting InsightAppSec Authentication Issues

Let’s look at some of the specific issues you might encounter with the different types of authentication noted above.

Macro Authentication

When a macro fails, the logs will give you the specific step where the macro had trouble. For example, in the image below, we can see that the macro failed on step 4, where it could not click on the specific object on the page. This could be caused by the page not loading quick enough, the name or ID of the element path changing, or the web app UI being different.

Troubleshooting InsightAppSec Authentication Issues

If you determine that the macro failed because the page isn’t loading fast enough, there are two ways you can slow the macro down.

The first way is to manually add a delay between the steps that are running too quickly. You can copy any of the delays that are currently in the macro, paste them into the spot that you want to slow down, and then change the step numbers. This way you can also set the specific duration for any delays you add into your macro.

Troubleshooting InsightAppSec Authentication Issues

The second way is to add additional delays throughout the macro, and change the Min Duration so the delays last longer. This is controlled via the export settings menu on the right. The default minimum duration is set to 3,000 milliseconds (3 seconds). Increasing the duration or adding delays will cause the macro to take longer to authenticate, but when running a scan overnight an extra few minutes to ensure the login works is a good tradeoff.

Troubleshooting InsightAppSec Authentication Issues

One other potential problem when recording a macro is when you have a password manager autofill the username and password. Anything that is automatically filled in will not be recorded by the macro. It is recommended to either turn off any password managers when recording a macro, or recording in Incognito/private browsing with all other plugins disabled to ensure nothing can modify or mess with the recording.

Lastly, if you have any events on your web app, such as a prompt to join a mailing list, that does not happen every time, you can mark that macro event as optional. If the event is not marked optional, then the macro will fail as it is unable to see the element on the page. Simply change the optional flag in the macro recording from 0 to 1 and you’re all set.

Troubleshooting InsightAppSec Authentication Issues

Traffic Authentication

While traffic authentication is usually successful when the login is working, there could still be some problems with playback. When traffic authentication fails, the scan logs don’t give you specific information like with macro authentication. Instead, the traffic authentication fails with the LoggedInRegex did not detect logged in state error. If you can’t get the traffic authentication working in the Rapid7 Appsec Plugin, you can always record the authentication within your browser.

For Chrome:

  • Click on the hamburger menu in the upper right.
  • Go to More Tools → Developer Options
  • Click on Network in the top tab
  • Make sure the dot in the upper left is red to signify you are recording.
  • Log in to your web app and when complete, right click on the recorded traffic and click Save all as HAR with content.

This will download the same .HAR file that the Appsec Plugin records, allowing you to use it for scanning.

Troubleshooting InsightAppSec Authentication Issues

Depending on how your web app responds, you might need to change the Use agent setting for how InsightAppsec interacts with your app.

Under your scan configuration, if you go to advanced options → HTTP Headers → User agent, you can then change what user agent is used to reach out to your web app. The latest version of Chrome should be fine for most modern web apps, but if you’re scanning a mobile app or an app that hasn’t been updated in a few years it might benefit from being changed.

Additional information can be found here.

Troubleshooting InsightAppSec Authentication Issues

Selenium Authentication

The third primary type of authentication is selenium. Selenium is similar to the macro authentication where you record all the actions to log in to your web app. Selenium is similar to traffic authentication where you will usually receive the LoggedInRegex did not detect logged in state error in the scan logs rather than specific information about the failure.

If the Selenium script could not find specific elements on the web page, you could also receive the Could not execute Selenium script error. This means there’s a problem with the script itself, the page didn’t load fast enough, or it couldn’t find the specific element on the web page. If this happens, try re-recording the script or adding a delay.

Troubleshooting InsightAppSec Authentication Issues

Using the plugin to record selenium scripts:

  • Click on the selenium plugin and Record a new test in a new project.
  • Give the project a name and enter in the base URL where you want recording to start.
  • In the new window that appears, log in to your web app. Once complete, close out of the window.
  • Before saving, you can click on the play icon to replay and test your selenium script.
  • Review the recording and then click on the save button in the upper right. You can then upload the .side file into InsightAppSec.
Troubleshooting InsightAppSec Authentication Issues

Just like macro authentication, if your website takes a while to load and the selenium script is running too fast, you can add additional delays to slow it down. There are implicit waits built into the IDE commands but if those don’t work for you, after running the authentication, you can add in wait for element commands to your selenium script.

  • Right click on the selenium recording and click insert new command
  • Set the command to wait for element visible
  • Set the target to the element you want to wait for. In this case, we’re waiting for id=email
  • By default the value is set to wait for 30,000 milliseconds (30 seconds)

Alternatively, you can use the pause command and set the value to how long you want the script to pause for. However, it is recommended to use the wait for element visible command if the web app responds at different times.

Additional information can be found here.

Troubleshooting InsightAppSec Authentication Issues

Logged-In Regex Errors

After ensuring the macro, traffic, and selenium files are working correctly, the next step in the authentication process is the logged-in regex. After the login is complete, InsightAppSec will look at the web page to find a logout button or look at the browser header for a session cookie. This can be modified by clicking into the scan configuration, navigating to the Authentication tab, and clicking on Additional Settings on the left.

Troubleshooting InsightAppSec Authentication Issues

Logged-in Regex

By default, the logged-in regex looks for sign out, sign off, log out and log off, with and without spaces between the words, on the web page.

One common problem is logged-in regex not seeing the logout button on the page before ending the authentication recording. If the logout button is on another page, or sometimes under a dropdown menu, the logged-in regex won’t detect it on the page, causing the authentication to fail.

Another common issue is if the logout button is an image or otherwise can’t be detected on the page. As the field is looking for a regular expression, you can use other words on the page to determine that the login was successful. You have to ensure that the word only appears on the page after logging in, such as the username. Otherwise the login might not actually be successful.

Troubleshooting InsightAppSec Authentication Issues

Logged-in Header Regex

Depending on how your web app is structured, you might need to use the logged-in header regex instead. For example, if there is no logout button, or if you have a single page web app that calls javascript files, the logged-in regex is more likely to fail. What you can do instead is grab the session ID cookie from the web browser, and if that is detected, then the regex will be successful.  

In Chrome:

  • Click on the three dots in the upper right corner
  • Then go to more tools and then developer options.
  • Click on the application tab at the top, then cookies on the left, and finally the web app cookie.
  • From there you want to find the session information cookie that only appears after logging in to the web app. Grab the name of the cookie and place that in the logged-in header regex.
Troubleshooting InsightAppSec Authentication Issues

The logged-in regex and logged-in header regex use AND logic, so if you put information in both fields, it will then need both to be successful in order for the login to work. Alternatively, if you remove the regex from both fields, it won’t run any post authentication checks, assuming the login is successful. It is recommended to do that as a last resort, you won’t be alerted if the login does start failing or if there are any other problems.

Troubleshooting InsightAppSec Authentication Issues

Other common issues and tricks

One issue you might encounter is where you start the authentication recording. For example, starting the recording after a page redirect. If your web app redirects to another page or SSO, and you start the authentication recording after the redirect, InsightAppSec won’t have the session information to properly redirect back to the target web app when it gets replayed during the scan. It is recommended to always start your recording on the root web app directory wherever possible.

You can also choose specific directories for scanning versus the entire web app. You want to remove the URL from the app Target URLs, and add it in specifically under the scan config. You can then set the target directory in the crawl and attack configs as literal, and then add a /* wildcard to hit any subdirectories.

Troubleshooting InsightAppSec Authentication Issues

Lastly, there is a way to restrict certain elements on a web page from being scanned. Under advanced options → CrawlConfig and AttackerConfig, there’s an option called ScopeConstraintList. This is where you can explicitly include or exclude specific pages from being scanned. You can take it a step further by adding a httpParameterList to explicitly exclude certain elements on the page from being scanned. For example, if you have a contact us page and you don’t want the scanner to hit the submit button, you can add it to the httpParameterList so it won’t be touched.

Below is an example of what the fields look like in the web page source code, and how it can be configured in IAS.

Email field source code: input type="email" name="contact_email"

Submit button source code: <button id="form-submit"

The entire site is in scope, and we are telling IAS not to hit the submit button or the email field.

Troubleshooting InsightAppSec Authentication Issues

You can find the Selenium and AppSec plugins below:

Enabling branch deployments through IssueOps with GitHub Actions

Post Syndicated from Grant Birkinbine original https://github.blog/2023-02-02-enabling-branch-deployments-through-issueops-with-github-actions/

At GitHub, the branch deploy model is ubiquitous and it is the standard way we ship code to production, and it has been for years. We released details about how we perform branch deployments with ChatOps all the way back in 2015.

We are able to use ChatOps to perform branch deployments for most of our repositories, but there are a few situations where ChatOps simply won’t work for us. What if developers want to leverage branch deployments but don’t have a full ChatOps stack integrated with their repositories? We wanted to set out to find a way for all developers to be able to take advantage of branch deployments with ease, right from their GitHub repository, and so the branch-deploy Action was born!

Gif demonstrating how to us the branch-deploy Action.

How Does GitHub use this Action?

GitHub primarily uses ChatOps with Hubot to facilitate branch deployments where we can. If ChatOps isn’t an option, we use this branch-deploy Action instead. The majority of our use cases include Infrastructure as Code (IaC) repositories where we use Terraform to deploy infrastructure changes. GitHub uses this Action in many internal repositories and so does npm. There are also many other public, open source, and corporate organizations adopting this Action, as well, to help ship their code to production!

Understanding the branch deploy model

Before we dive into the branch-deploy Action, let’s first understand what the branch deploy model is and why it is so useful.

To really understand the branch deploy model, let’s first take a look at a traditional deploy → merge model. It goes like this:

  1. Create a branch.
  2. Add commits to your branch.
  3. Open a pull request.
  4. Gather feedback plus peer reviews.
  5. Merge your branch.
  6. A deployment starts from the main branch.
Diagram outlining the steps of the traditional deploy model, enumerated in the numbered list above.

Now, let’s take a look at the branch deploy model:

  1. Create a branch.
  2. Add commits to your branch.
  3. Open a pull request.
  4. Gather feedback plus peer reviews.
  5. Deploy your change.
  6. Validate.
  7. Merge your branch to the main / master branch.
Diagram outlining the steps of the branch deploy model, enumerated in the list above.

The merge deploy model is inherently riskier because the main branch is never truly a stable branch. If a deployment fails, or we need to roll back, we follow the entire process again to roll back our changes. However, in the branch deploy model, the main branch is always in a “good” state and we can deploy it at any time to revert the deployment from a branch deploy. In the branch deploy model, we only merge our changes into main once the branch has been successfully deployed and validated.

Note: this is sometimes referred to as the GitHub flow.

Key concepts

Key concepts of the branch deploy model:

  • The main branch is always considered to be a stable and deployable branch.
  • All changes are deployed to production before they are merged to the main branch.
  • To roll back a branch deployment, you deploy the main branch.

By now you may be sold on the branch deploy methodology. How do we implement it? Introducing IssueOps with GitHub Actions!

IssueOps

The best way to define IssueOps is to compare it to something similar, ChatOps. You may be familiar with the concept, ChatOps, already; if not, here is a quick definition:

ChatOps is the process of interacting with a chat bot to execute commands directly in a chat platform. For example, with ChatOps you might do something like .ping example.org to check the status of a website.

IssueOps adopts the same mindset but through a different medium. Rather than using a chat service (Discord, Slack, etc.) to invoke the commands we use comments on a GitHub Issue or pull request. GitHub Actions is the runtime that executes our desired logic when an IssueOps command is invoked.

GitHub Actions

How does it work? This section will go into detail about how this Action works and hopefully inspire you to leverage it in your own projects. The full source code and further documentation can be found on GitHub.

Let’s walk through the process using the demo configuration of a branch-deploy Action below.

1. Create this file under .github/workflows/branch-deploy.yml in your GitHub repository:

name: "branch deploy demo"

# The workflow will execute on new comments on pull requests - example: ".deploy" as a comment
on:
  issue_comment:
    types: [created]

jobs:
  demo:
    if: ${{ github.event.issue.pull_request }} # only run on pull request comments (no need to run on issue comments)
    runs-on: ubuntu-latest
    steps:
      # Execute IssueOps branch deployment logic, hooray!
      # This will be used to "gate" all future steps below and conditionally trigger steps/deployments
      - uses: github/[email protected] # replace X.X.X with the version you want to use
        id: branch-deploy # it is critical you have an id here so you can reference the outputs of this step
        with:
          trigger: ".deploy" # the trigger phrase to look for in the comment on the pull request

      # Run your deployment logic for your project here - examples seen below

      # Checkout your project repository based on the ref provided by the branch-deploy step
      - uses: actions/[email protected]
        if: ${{ steps.branch-deploy.outputs.continue == 'true' }} # skips if the trigger phrase is not found
        with:
          ref: ${{ steps.branch-deploy.outputs.ref }} # uses the detected branch from the branch-deploy step

      # Do some fake "noop" deployment logic here
      # conditionally run a noop deployment
      - name: fake noop deploy
        if: ${{ steps.branch-deploy.outputs.continue == 'true' && steps.branch-deploy.outputs.noop == 'true' }} # only run if the trigger phrase is found and the branch-deploy step detected a noop deployment
        run: echo "I am doing a fake noop deploy"

      # Do some fake "regular" deployment logic here
      # conditionally run a regular deployment
      - name: fake regular deploy
        if: ${{ steps.branch-deploy.outputs.continue == 'true' && steps.branch-deploy.outputs.noop != 'true' }} # only run if the trigger phrase is found and the branch-deploy step detected a regular deployment
        run: echo "I am doing a fake regular deploy"

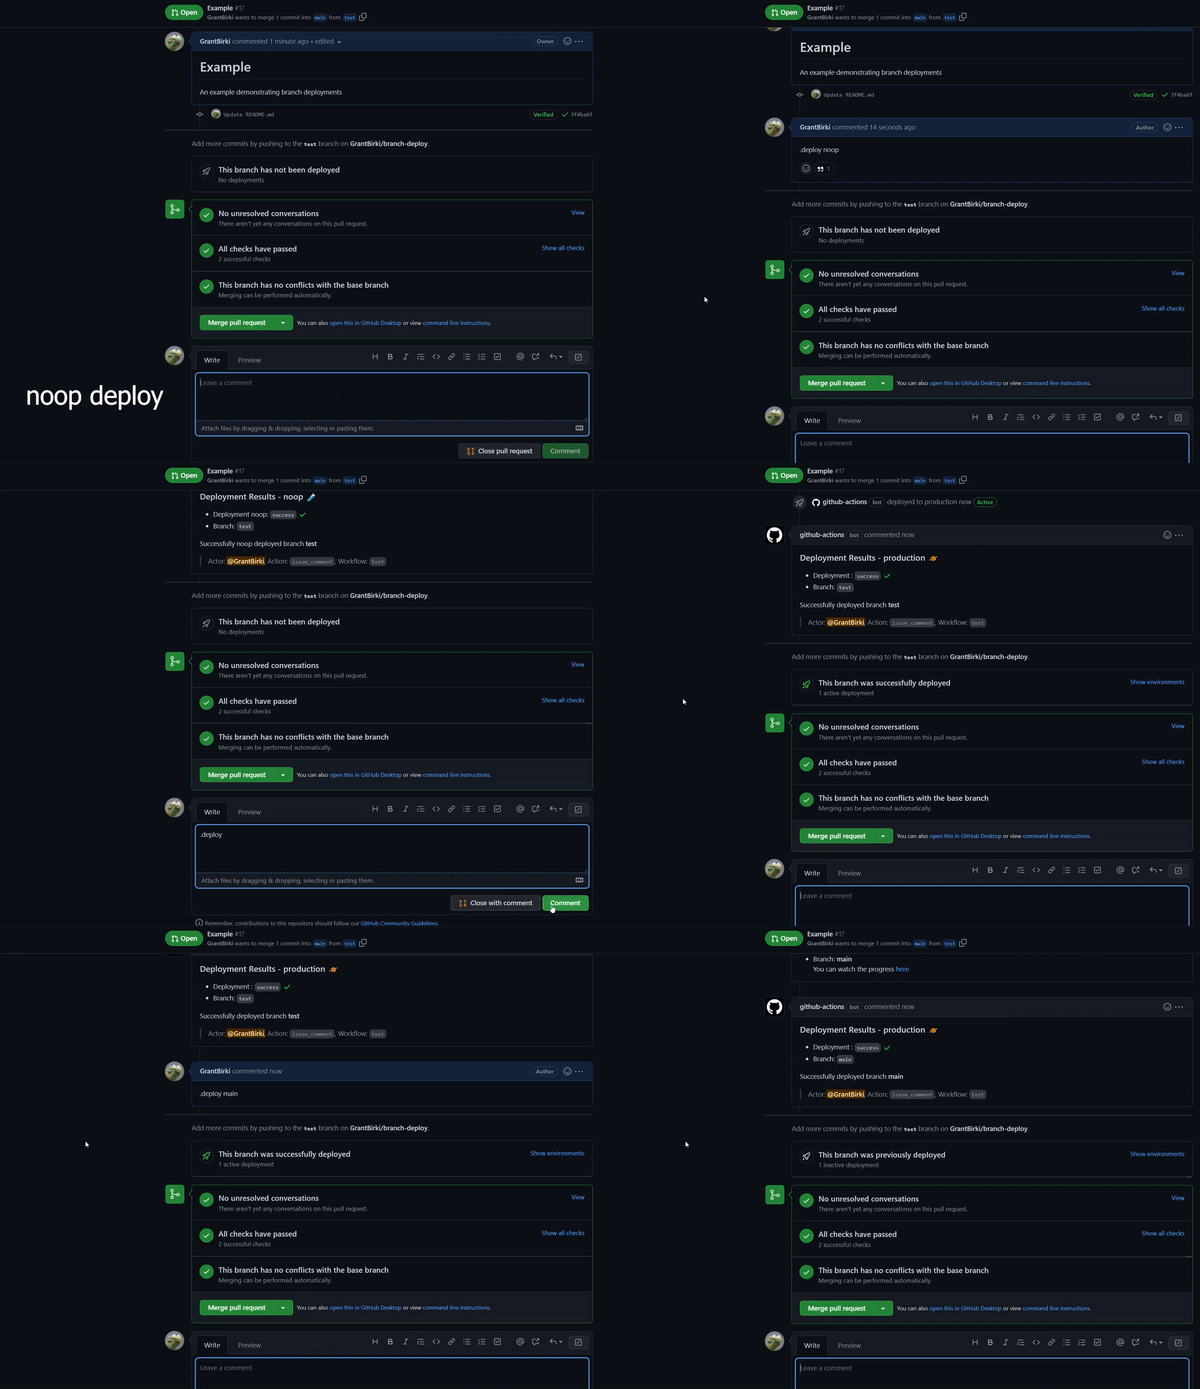
2. Trigger a noop deploy by commenting .deploy noop on a pull request.

A noop deployment is detected so this action outputs the noop variable to true. If you have the correct permissions to execute the IssueOps command, the action outputs the continue variable to true as well. The step named fake noop deploy runs, while the fake regular deploy step is skipped.

3. After your noop deploy completes, you would typically run .deploy to execute the actual deployment, fake regular deploy.

Features

The best part about the branch-deploy Action is that it is highly customizable for any deployment targets and use cases. Here are just a few of the features that this Action comes bundled with:

  • 🔍 Detects when IssueOps commands are used on a pull request.
  • 📝 Configurable: choose your command syntax, environment, noop trigger, base branch, reaction, and more.
  • ✅ Respects your branch protection settings configured for the repository.
  • 💬 Comments and reacts to your IssueOps commands.
  • 🚀 Triggers GitHub deployments for you with simple configuration.
  • 🔓 Deploy locks to prevent multiple deployments from clashing.
  • 🌎 Configurable environment targets.

The repository also comes with a usage guide, which can be referenced by you and your team to quickly get familiar with available IssueOps commands and how they work.

Examples

The branch-deploy Action is customizable and suited for a wide range of projects. Here are a few examples of how you can use the branch-deploy Action to deploy to different services:

Conclusion

If you are looking to enhance your DevOps experience, have better reliability in your deployments, or ship changes faster, then branch deployments are for you!

Hopefully, you now have a better understanding of why the branch deploy model is a great option for shipping your code to production.

By using GitHub plus Actions plus IssueOps you can leverage the branch deploy model in any repository!

Source code: GitHub

Shooting for the Clouds: How One Photo Storage Service Moved Beyond Physical Devices

Post Syndicated from Barry Kaufman original https://www.backblaze.com/blog/shooting-for-the-clouds-how-one-photo-storage-service-moved-beyond-physical-devices/

The sheer number of creative and unique ways our customers and partners utilize Backblaze B2 Cloud Storage never ceases to amaze us. Whether it’s pairing our storage with a streaming platform to deliver seamless video or protecting research data that is saving lives, we applaud their ingenuity. From time to time, we like to put the spotlight on one of these inspired customers, which brings us to the company we’re highlighting today: Monument, a photo management service with a strong focus on security and privacy.

The TL;DR

Situation: The Monument story started with a physical device where customers could securely save photos, but they saw the winds shifting to the cloud. They wanted to offer users the flexibility and automation that the cloud provides while maintaining their focus on privacy and security.

Solution: Monument launched their cloud-based offering, Monument Cloud, with Backblaze as its storage backbone. User photos are encrypted and stored in Backblaze B2 Cloud Storage, and are accessible via the Monument Cloud app.

Result: Monument Cloud eliminates the need for users to maintain a physical device at their homes or offices. Users just install the Monument Cloud app on their devices and their photos and videos are automatically backed up, fully encrypted, organized, and shareable.

What Is Monument?

Monument was founded in 2016 by a group of engineers and designers who wanted an easy way to back up and organize their photos without giving up their privacy and security. Since smartphones saturated the market, the average person’s digital photo archive has grown exponentially. The average user has around 2,100 photos on their smartphone at any given time, and that’s not even counting the photos stashed away on various old laptops, hard drives, USBs, and devices.

Photo management services like Google Photos stepped in to help folks corral all of those memories. But, most photo management services are a black box—you don’t know how they’re using your data or your images. Monument wanted to give folks the same functionality as something like iCloud or Google Photos while also keeping their private data private.

“There are plenty of photo storage solutions right now, but they come with limitations and fail to offer transparency about their privacy policies—how photos are being used or processed” said Monument’s co-founder Ercan Erciyes. “At Monument, we reimagined how we store and access our photos and provided a clutter-free experience while keeping users in the center, not their personal data.”

They launched their first generation product in 2017—a physical storage device with advanced AI software that helps users manage photo libraries between devices and organize photos by faces, scenery, and other properties. The hardware side was fueled by two rounds of Kickstarter funding, each helping create new versions of the company’s smart storage device powered by a neural processing unit (NPU) that lived on-device and allowed access from anywhere.

An Eye for Secure Photo Storage

That emphasis on privacy fueled the software side of Monument’s offering, an AI-driven approach that allows easy searchability of photos without processing any of the metadata on Monument’s end. Advanced image recognition couples with slick de-duplication features for an experience that catalogs photos without exposing photographers’ data to algorithms that influence their choices. No ads, no profiling, no creepy trackers, and Monument doesn’t use or sell customers’ personal data.

We were getting a lot of questions along the lines of, “What happens if my house catches fire?” or “What if there is physical damage to the device?” so we could see there was a lot of interest in a cloud solution.”

—Ercan Erciyes, Co-Founder, Monument Labs, Inc.

The Gathering Cloud

With the rise of cloud storage, Monument saw their typical consumer shifting away from on-prem solutions. “We were getting a lot of questions along the lines of, ‘What happens if my house catches fire?’ or ‘What if there is physical damage to the device?’ so we could see there was a lot of interest in a cloud solution,” said Ercan. “Plus there were a lot of users that didn’t want a physical device in their home.”

Their answer: Offer the same privacy-first service through a comprehensive cloud solution.

Using Free Credits Wisely

Launching a cloud-based storage service built around their philosophy of privacy and security was a clear necessity for the company’s future. To kick off their move to the cloud, Monument utilized free startup credits from AWS. But, they knew free credits wouldn’t last forever. Rather than using the credits to build a minimum viable product as fast as humanly possible, they took a very measured approach. “The credits are sweet,” Ercan said, “But you need to pay attention to your long-term vision. You need to have a backup plan, so to speak.” (We think so, too.)

Ercan ran the numbers with success in mind and realized they’d ultimately lose money if they built the infrastructure for Monument Cloud on AWS. He also didn’t want to accumulate tech debt and become locked in to AWS.

They ended up using the credits to develop the AI model, but not to build their infrastructure. For that they turned to specialized cloud providers.

Integrating Backblaze B2 Cloud Storage

Monument created a lean tech stack that incorporated Backblaze B2 for long-term encrypted storage. They run their AI software on Vultr, a Backblaze compute partner that offers free egress fees between the two services. And, they use another specialized cloud provider to store thumbnails that are displayed in the Monument Cloud app. The cloud service has quickly become the company’s flagship offering, drawing 25,000 active users.

Group Photos: Serving New Customers

With infrastructure that will scale without cutting into their margins, Monument is poised to serve an increasing number of customers who care about what happens to their personal data. More and more, customers are seeking out alternatives to big name cloud providers, using services like DuckDuckGo instead of Google Search or WhatsApp instead of garden variety text messaging apps. With a distributed, multi-cloud system, they can serve these types of customers with a cloud option while keeping data privacy front and center. And the customers that gravitate to this value proposition are wide-ranging.

Of course, the first ones you might think of would be prolific photo takers or even amateur photographers, but Ercan pointed out some surprising use cases for their technology. “We are seeing a lot of different use cases coming up from schools, real estate companies, and even elder care systems,” he said. With Monument’s new cloud solution, classrooms are exploring new online frontiers in education, and families scattered around the world are able to share photos with their elderly relatives.

A Monument to Security

Challenging monster brands like Google is no small task as a small team of just five people. Monument does it by keeping a laser focus on their core values and their customers’ needs. “If you keep the user’s needs in the center, building a solution doesn’t require an army of engineers,” Ercan said. Without having to worry about how to use customer data to build algorithms that keep advertisers happy, Monument can focus on serving their customers what they actually need—a photo management solution that just works.

Monument Co-founders Semih Hazar (left) and Ercan Erciyes (right)

Monument and Backblaze

Whether you’re the family photographer, the office party chronicler, or you just have a convoluted system of hard drives stickered and slotted onto a shelf somewhere that you’d like to get rid of, first and foremost: Make sure you’re availing yourself of the very reasonable storage available from Backblaze for archiving or backing up your data.

After you’re done with that: Check out Monument.

The post Shooting for the Clouds: How One Photo Storage Service Moved Beyond Physical Devices appeared first on Backblaze Blog | Cloud Storage & Cloud Backup.

Automating your workload deployments in AWS Local Zones

Post Syndicated from Sheila Busser original https://aws.amazon.com/blogs/compute/automating-your-workload-deployments-in-aws-local-zones/

This blog post is written by Enrico Liguori, SA – Solutions Builder , WWPS Solution Architecture.

AWS Local Zones are a type of infrastructure deployment that places compute, storage,and other select AWS services close to large population and industry centers.

We now have a total of 32 Local Zones; 15 outside of the US (Bangkok, Buenos Aires, Copenhagen, Delhi, Hamburg, Helsinki, Kolkata, Lagos, Lima, Muscat, Perth, Querétaro, Santiago, Taipei, and Warsaw) and 17 in the US. We will continue to launch Local Zones in 21 metro areas in 18 countries, including Australia, Austria, Belgium, Brazil, Canada, Colombia, Czech Republic, Germany, Greece, India, Kenya, Netherlands, New Zealand, Norway, Philippines, Portugal, South Africa, and Vietnam.

Customers using AWS Local Zones can provision the infrastructure and services needed to host their workloads with the same APIs and tools for automation that they use in the AWS Region, included the AWS Cloud Development Kit (AWS CDK).

The AWS CDK is an open source software development framework to model and provision your cloud application resources using familiar programming languages, including TypeScript, JavaScript, Python, C#, and Java. For the solution in this post, we use Python.

Overview

In this post we demonstrate how to:

  1. Programmatically enable the Local Zone of your interest.
  2. Explore the supported APIs to check the types of Amazon Elastic Compute Cloud (Amazon EC2) instances available in a specific Local Zone and get their associated price per hour;
  3. Deploy a simple WordPress application in the Local Zone through AWS CDK.

Prerequisites

To be able to try the examples provided in this post, you must configure:

  1. AWS Command Line Interface (AWS CLI)
  2. Python version 3.8 or above
  3. AWS CDK

Enabling a Local Zone programmatically

To get started with Local Zones, you must first enable the Local Zone that you plan to use in your AWS account. In this tutorial, you can learn how to select the Local Zone that provides the lowest latency to your site and understand how to opt into the Local Zone from the AWS Management Console.

If you prefer to interact with AWS APIs programmatically, then you can enable the Local Zone of your interest by calling the ModifyAvailabilityZoneGroup API through the AWS CLI or one of the supported AWS SDKs.

The following examples show how to opt into the Atlanta Local Zone through the AWS CLI and through the Python SDK:

AWS CLI:

aws ec2 modify-availability-zone-group \
  --region us-east-1 \
  --group-name us-east-1-atl-1 \
  --opt-in-status opted-in

Python SDK:

ec2 = boto3.client('ec2', config=Config(region_name='us-east-1'))
response = ec2.modify_availability_zone_group(
                  GroupName='us-east-1-atl-1',
                  OptInStatus='opted-in'
           )

The opt in process takes approximately five minutes to complete. After this time, you can confirm the opt in status using the DescribeAvailabilityZones API.

From the AWS CLI, you can check the enabled Local Zones with:

aws ec2 describe-availability-zones --region us-east-1

Or, once again, we can use one of the supported SDKs. Here is an example using Phyton:

ec2 = boto3.client('ec2', config=Config(region_name='us-east-1'))
response = ec2.describe_availability_zones()

In both cases, a JSON object similar to the following, will be returned:

{
"State": "available",
"OptInStatus": "opted-in",
"Messages": [],
"RegionName": "us-east-1",
"ZoneName": "us-east-1-atl-1a",
"ZoneId": "use1-atl1-az1",
"GroupName": "us-east-1-atl-1",
"NetworkBorderGroup": "us-east-1-atl-1",
"ZoneType": "local-zone",
"ParentZoneName": "us-east-1d",
"ParentZoneId": "use1-az4"
}

The OptInStatus confirms that we successful enabled the Atlanta Local Zone and that we can now deploy resources in it.

How to check available EC2 instances in Local Zones

The set of instance types available in a Local Zone might change from one Local Zone to another. This means that before starting deploying resources, it’s a good practice to check which instance types are supported in the Local Zone.

After enabling the Local Zone, we can programmatically check the instance types that are available by using DescribeInstanceTypeOfferings. To use the API with Local Zones, we must pass availability-zone as the value of the LocationType parameter and use a Filter object to select the correct Local Zone that we want to check. The resulting AWS CLI command will look like the following example:

aws ec2 describe-instance-type-offerings --location-type "availability-zone" --filters 
Name=location,Values=us-east-1-atl-1a --region us-east-1

Using Python SDK:

ec2 = boto3.client('ec2', config=Config(region_name='us-east-1'))
response = ec2.describe_instance_type_offerings(
      LocationType='availability-zone',
      Filters=[
            {
            'Name': 'location',
            'Values': ['us-east-1-atl-1a']
            }
            ]
      )

How to check prices of EC2 instances in Local Zones

EC2 instances and other AWS resources in Local Zones will have different prices than in the parent Region. Check the pricing page for the complete list of pricing options and associated price-per-hour.

To access the pricing list programmatically, we can use the GetProducts API. The API returns the list of pricing options available for the AWS service specified in the ServiceCode parameter. We also recommend defining Filters to restrict the number of results returned. For example, to retrieve the On-Demand pricing list of a T3 Medium instance in Atlanta from the AWS CLI, we can use the following:

aws pricing get-products --format-version aws_v1 --service-code AmazonEC2 --region us-east-1 \
--filters 'Type=TERM_MATCH,Field=instanceType,Value=t3.medium' \
--filters 'Type=TERM_MATCH,Field=location,Value=US East (Atlanta)'

Similarly, with Python SDK we can use the following:

pricing = boto3.client('pricing',config=Config(region_name="us-east-1")) response = pricing.get_products(
         ServiceCode='AmazonEC2',
         Filters= [
          {
          "Type": "TERM_MATCH",
          "Field": "instanceType",
          "Value": "t3.medium"
          },
          {
          "Type": "TERM_MATCH",
          "Field": "regionCode",
          "Value": "us-east-1-atl-1"
          }
        ],
         FormatVersion='aws_v1',
)

Note that the Region specified in the CLI command and in Boto3, is the location of the AWS Price List service API endpoint. This API is available only in us-east-1 and ap-south-1 Regions.

Deploying WordPress in Local Zones using AWS CDK

In this section, we see how to use the AWS CDK and Python to deploy a simple non-production WordPress installation in a Local Zone.

Architecture overview

architecture overview

The AWS CDK stack will deploy a new standard Amazon Virtual Private Cloud (Amazon VPC) in the parent Region (us-east-1) that will be extended to the Local Zone. This creates two subnets associated with the Atlanta Local Zone: a public subnet to expose resources on the Internet, and a private subnet to host the application and database layers. Review the AWS public documentation for a definition of public and private subnets in a VPC.

The application architecture is made of the following:

  • A front-end in the private subnet where a WordPress application is installed, through a User Data script, in a type T3 medium EC2 instance.
  • A back-end in the private subnet where MySQL database is installed, through a User Data script, in a type T3 medium EC2 instance.
  • An Application Load Balancer (ALB) in the public subnet that will act as the entry point for the application.
  • A NAT instance to allow resources in the private subnet to initiate traffic to the Internet.

Clone the sample code from the AWS CDK examples repository

We can clone the AWS CDK code hosted on GitHub with:

$ git clone https://github.com/aws-samples/aws-cdk-examples.git

Then navigate to the directory aws-cdk-examples/python/vpc-ec2-local-zones using the following:

$ cd aws-cdk-examples/python/vpc-ec2-local-zones

Before starting the provisioning, let’s look at the code in the following sections.

Networking infrastructure

The networking infrastructure is usually the first building block that we must define. In AWS CDK, this can be done using the VPC construct:

import aws_cdk.aws_ec2 as ec2
vpc = ec2.Vpc(
            self,
            "Vpc",
            cidr=”172.31.100.0/24”,
            subnet_configuration=[
                ec2.SubnetConfiguration(
                    name = 'Public-Subnet',
                    subnet_type = ec2.SubnetType.PUBLIC,
                    cidr_mask = 26,
                ),
                ec2.SubnetConfiguration(
                    name = 'Private-Subnet',
                    subnet_type = ec2.SubnetType.PRIVATE_ISOLATED,
                    cidr_mask = 26,
                ),
            ]      
        )

Together with the VPC CIDR (i.e. 172.31.100.0/24), we define also the subnets configuration through the subnet_configuration parameter.

Note that in the subnet definitions above there is no specification of the Availability Zone or Local Zone that we want to associate them with. We can define this setting at the VPC level, overwriting the availability_zones method as shown here:

@property
def availability_zones(self):
   return [“us-east-1-atl-1a”]

As an alternative, you can use a Local Zone Name as the value of the availability_zones parameter in each Subnet definition. For a complete list of Local Zone Names, check out the Zone Names on the Local Zones Locations page.

Specifying ec2.SubnetType.PUBLIC  in the subnet_type parameter, AWS CDK  automatically creates an Internet Gateway (IGW) associated with our VPC and a default route in its routing table pointing to the IGW. With this setup, the Internet traffic will go directly to the IGW in the Local Zone without going through the parent AWS Region. For other connectivity options, check the AWS Local Zone User Guide.

The last piece of our networking infrastructure is a self-managed NAT instance. This will allow instances in the private subnet to communicate with services outside of the VPC and simultaneously prevent them from receiving unsolicited connection requests.

We can implement the best practices for NAT instances included in the AWS public documentation using a combination of parameters of the Instance construct, as shown here:

nat = ec2.Instance(self, "NATInstanceInLZ",
                 vpc=vpc,
                 security_group=self.create_nat_SG(vpc),
                 instance_type=ec2.InstanceType.of(ec2.InstanceClass.T3, ec2.InstanceSize.MEDIUM),
                 machine_image=ec2.MachineImage.latest_amazon_linux(),
                 user_data=ec2.UserData.custom(user_data),
                 vpc_subnets=ec2.SubnetSelection(availability_zones=[“us-east-1-atl-1a”], subnet_type=ec2.SubnetType.PUBLIC),
                 source_dest_check=False
                )

In the previous code example, we specify the following as parameters:

The final required step is to update the route table of the private subnet with the following:

priv_subnet.add_route("DefRouteToNAT",
            router_id=nat_instance.instance_id,
            router_type=ec2.RouterType.INSTANCE,
            destination_cidr_block="0.0.0.0/0",
            enables_internet_connectivity=True)

The application stack

The other resources, including the front-end instance managed by AutoScaling, the back-end instance, and ALB are deployed using the standard AWS CDK constructs. Note that the ALB service is only available in some Local Zones. If you plan to use a Local Zone where ALB isn’t supported, then you must deploy a load balancer on a self-managed EC2 instance, or use a load balancer available in AWS Marketplace.

Stack deployment

Next, let’s go through the AWS CDK bootstrapping process. This is required only for the first time that we use AWS CDK in a specific AWS environment (an AWS environment is a combination of an AWS account and Region).

$ cdk bootstrap

Now we can deploy the stack with the following:

$ cdk deploy

After the deployment is completed, we can connect to the application with a browser using the URL returned in the output of the cdk deploy command:

terminal screenshot

The WordPress install wizard will be displayed in the browser, thereby confirming that the deployment worked as expected:

The WordPress install wizard

Note that in this post we use the Local Zone in Atlanta. Therefore, we must deploy the stack in its parent Region, US East (N. Virginia). To select the Region used by the stack, configure the AWS CLI default profile.

Cleanup

To terminate the resources that we created in this post, you can simply run the following:

$ cdk destroy

Conclusion

In this post, we demonstrated how to interact programmatically with the different AWS APIs available for Local Zones. Furthermore, we deployed a simple WordPress application in the Atlanta Local Zone after analyzing the AWS CDK code used for the deployment.

We encourage you to try the examples provided in this post and get familiar with the programmatic configuration and deployment of resources in a Local Zone.

Ekstrand: Exploring Rust for Vulkan drivers, part 1

Post Syndicated from original https://lwn.net/Articles/922008/

Faith Ekstrand begins
an exploration of using the Rust language
to write Vulkan graphics
drivers.

Whenever a Vulkan object is created or destroyed, the parent object
is passed to both the create and destroy functions. This ensures
that the lifetime of the child object is contained within the
lifetime of the parent object. In Rust terms, this means it’s safe
for the child object to contain a non-mutable reference to the
parent object. Vulkan also defines which entrypoint parameters must
be externally synchronized by the client. Externally synchronized
objects follow the same rules as mutable references in Rust.

GNU C Library 2.37 released

Post Syndicated from original https://lwn.net/Articles/922003/

Version
2.37
of the GNU C Library has been released. This looks like a
relatively low-key release, with the one “major new feature” described as:

The getent tool now supports the –no-addrconfig option. The output
of getent with –no-addrconfig may contain addresses of families
not configured on the current host i.e. as-if you had not passed
AI_ADDRCONFIG to getaddrinfo calls.

There is more information in the release
notes
.

[$] Git archive generation meets Hyrum’s law

Post Syndicated from original https://lwn.net/Articles/921787/

On January 30, the GitHub blog carried a
brief notice
that the checksums of archives (such as tarballs)
generated by the site had just changed. GitHub’s engineers were seemingly
unaware of the consequences of such a change — consequences that were
immediately evident to anybody familiar with either packaging systems or
Hyrum’s law. Those checksums were
widely depended on by build systems, which immediately broke when the
change went live; the resulting impact of
jawbones hitting the floor was observed by seismographs worldwide. The
change has been reverted for now, but it is worth looking at how GitHub
managed to casually break vast numbers of build systems — and why this sort
of change will almost certainly happen again.

Cisco UCS M7 Servers with 4th Gen Intel Xeon Sapphire Rapids Launched

Post Syndicated from Cliff Robinson original https://www.servethehome.com/cisco-ucs-m7-servers-with-4th-gen-intel-xeon-sapphire-rapids-launched/

The new Cisco UCS M7 generation with 4th Gen Intel Xeon Scalable “Sapphire Rapids” processors is out. We cover a few interesting launch tidbits.

The post Cisco UCS M7 Servers with 4th Gen Intel Xeon Sapphire Rapids Launched appeared first on ServeTheHome.

Cloudflare’s handling of a bug in interpreting IPv4-mapped IPv6 addresses

Post Syndicated from Lucas Ferreira original https://blog.cloudflare.com/cloudflare-handling-bug-interpreting-ipv4-mapped-ipv6-addresses/

Cloudflare's handling of a bug in interpreting IPv4-mapped IPv6 addresses

Cloudflare's handling of a bug in interpreting IPv4-mapped IPv6 addresses

In November 2022, our bug bounty program received a critical and very interesting report. The report stated that certain types of DNS records could be used to bypass some of our network policies and connect to ports on the loopback address (e.g. 127.0.0.1) of our servers. This post will explain how we dealt with the report, how we fixed the bug, and the outcome of our internal investigation to see if the vulnerability had been previously exploited.

RFC 4291 defines ways to embed an IPv4 address into IPv6 addresses. One of the methods defined in the RFC is to use IPv4-mapped IPv6 addresses, that have the following format:

   |                80 bits               | 16 |      32 bits        |
   +--------------------------------------+--------------------------+
   |0000..............................0000|FFFF|    IPv4 address     |
   +--------------------------------------+----+---------------------+

In IPv6 notation, the corresponding mapping for 127.0.0.1 is ::ffff:127.0.0.1 (RFC 4038)

The researcher was able to use DNS entries based on mapped addresses to bypass some of our controls and access ports on the loopback address or non-routable IPs.

This vulnerability was reported on November 27 to our bug bounty program. Our Security Incident Response Team (SIRT) was contacted, and incident response activities began shortly after the report was filed. A hotpatch was deployed three hours later to prevent exploitation of the bug.

Date Time (UTC) Activity
27 November 2022 20:42 Initial report to Cloudflare’s bug bounty program
21:04 SIRT oncall is paged
21:15 SIRT manager on call starts working on the report
21:22 Incident declared and team is assembled and debugging starts
23:20 A hotfix is ready and deployment starts
23:47 Team confirms that the hotfix is deployed and working
23:58 Team investigates if other products are affected. Load Balancers and Spectrum are potential targets. Both products are found to be unaffected by the vulnerability.
28 November 2022 21:14 A permanent fix is ready
29 November 2022 21:34 Permanent fix is merged

Blocking exploitation

Immediately after the vulnerability was reported to our Bug Bounty program, the team began working to understand the issue and find ways to quickly block potential exploitation. It was determined that the fastest way to prevent exploitation would be to block the creation of the DNS records required to execute the attack.

The team then began to implement a patch to prevent the creation of DNS records that include IPv6 addresses that map loopback or RFC 1918 (internal) IPv4 addresses. The fix was fully deployed and confirmed three hours after the report was filed. We later realized that this change was insufficient because records hosted on external DNS servers could also be used in this attack.

The exploit

The exploit provided consisted of the following: a DNS entry, and a Cloudflare Worker. The DNS entry was an AAAA record pointing to ::ffff:127.0.0.1:

exploit.example.com AAAA ::ffff:127.0.0.1

The worker included the following code:

export default {
    async fetch(request) {
        const requestJson = await request.json()
        return fetch(requestJson.url, requestJson)
    }
}

The Worker was given a custom URL such as proxy.example.com.

With that setup, it was possible to make the worker attempt connections on the loopback interface of the server where it was running. The call would look like this:

curl https://proxy.example.com/json -d '{"url":"http://exploit.example.com:80/url_path"}'

The attack could then be scripted to attempt to connect to multiple ports on the server.

It was also found that a similar setup could be used with other IPv4 addresses to attempt connections into internal services. In this case, the DNS entry would look like:

exploit.example.com AAAA ::ffff:10.0.0.1

This exploit would allow an attacker to connect to services running on the loopback interface of the server. If the attacker was able to bypass the security and authentication mechanisms of a service, it could impact the confidentiality and integrity of data. For services running on other servers, the attacker could also use the worker to attempt connections and map services available over the network. As in most networks, Cloudflare’s network policies and ACLs must allow a few ports to be accessible. These ports would be accessible by an attacker using this exploit.

Investigation

We started an investigation to understand the root cause of the problem and created a proof-of-concept that allowed the team to debug the issue. At the same time, we started a parallel investigation to determine if the issue had been previously exploited.

It all happened when two bugs collided.

The first bug happened in our internal DNS system which is responsible for mapping hostnames to IP addresses of our customers’ origin servers (the DNS system). When the DNS system tried to answer a query for the DNS record from exploit.example.com, it serialized the IP as a string. The Golang net library used for DNS automatically converted the IP ::ffff:10.0.0.1 to string “10.0.0.1”. However, the DNS system still treated it as an IPv6 address. So a query response {ipv6: “10.0.0.1”} was returned.

The second bug was in our internal HTTP system (the proxy) which is responsible for forwarding HTTP traffic to customer’s origin servers. The bug happened in how the proxy validates this DNS response, {ipv6: “10.0.0.1”}. The proxy has two deny lists of IPs that are not allowed to be used, one for IPv4 and one for IPv6. These lists contain localhost IPs and private IPs. The bug was that the proxy system compared the address 10.0.0.1 against the IPv6 deny list because the address was in the “ipv6” section. Naturally the address didn’t match any entry in the deny list. So the address was allowed to be used as an origin IP address.

The second investigation team searched through the logs and found no evidence of previous exploitation of this vulnerability. The team also checked Cloudflare DNS for entries using IPv4-mapped IPv6 addresses and determined that all the existing entries had been used for testing purposes. As of now, there are no signs that this vulnerability could have been previously used against Cloudflare systems.

Remediating the vulnerability

To address this issue we implemented a fix in the proxy service to correctly use the deny list of the parsed address, not the deny list of the IP family the DNS API response claimed to be, to validate the IP address. We confirmed both in our test and production environments that the fix did prevent the issue from happening again.

Beyond maintaining a bug bounty program, we regularly perform internal security reviews and hire third-party firms to audit the software we develop. But it is through our bug bounty program that we receive some of the most interesting and creative reports. Each report has helped us improve the security of our services. We invite those that find a security issue in any of Cloudflare’s services to report it to us through HackerOne.

AIs as Computer Hackers

Post Syndicated from Bruce Schneier original https://www.schneier.com/blog/archives/2023/02/ais-as-computer-hackers.html

Hacker “Capture the Flag” has been a mainstay at hacker gatherings since the mid-1990s. It’s like the outdoor game, but played on computer networks. Teams of hackers defend their own computers while attacking other teams’. It’s a controlled setting for what computer hackers do in real life: finding and fixing vulnerabilities in their own systems and exploiting them in others’. It’s the software vulnerability lifecycle.

These days, dozens of teams from around the world compete in weekend-long marathon events held all over the world. People train for months. Winning is a big deal. If you’re into this sort of thing, it’s pretty much the most fun you can possibly have on the Internet without committing multiple felonies.

In 2016, DARPA ran a similarly styled event for artificial intelligence (AI). One hundred teams entered their systems into the Cyber Grand Challenge. After completing qualifying rounds, seven finalists competed at the DEFCON hacker convention in Las Vegas. The competition occurred in a specially designed test environment filled with custom software that had never been analyzed or tested. The AIs were given 10 hours to find vulnerabilities to exploit against the other AIs in the competition and to patch themselves against exploitation. A system called Mayhem, created by a team of Carnegie-Mellon computer security researchers, won. The researchers have since commercialized the technology, which is now busily defending networks for customers like the U.S. Department of Defense.

There was a traditional human–team capture-the-flag event at DEFCON that same year. Mayhem was invited to participate. It came in last overall, but it didn’t come in last in every category all of the time.

I figured it was only a matter of time. It would be the same story we’ve seen in so many other areas of AI: the games of chess and go, X-ray and disease diagnostics, writing fake news. AIs would improve every year because all of the core technologies are continually improving. Humans would largely stay the same because we remain humans even as our tools improve. Eventually, the AIs would routinely beat the humans. I guessed that it would take about a decade.

But now, five years later, I have no idea if that prediction is still on track. Inexplicably, DARPA never repeated the event. Research on the individual components of the software vulnerability lifecycle does continue. There’s an enormous amount of work being done on automatic vulnerability finding. Going through software code line by line is exactly the sort of tedious problem at which machine learning systems excel, if they can only be taught how to recognize a vulnerability. There is also work on automatic vulnerability exploitation and lots on automatic update and patching. Still, there is something uniquely powerful about a competition that puts all of the components together and tests them against others.

To see that in action, you have to go to China. Since 2017, China has held at least seven of these competitions—called Robot Hacking Games—many with multiple qualifying rounds. The first included one team each from the United States, Russia, and Ukraine. The rest have been Chinese only: teams from Chinese universities, teams from companies like Baidu and Tencent, teams from the military. Rules seem to vary. Sometimes human–AI hybrid teams compete.

Details of these events are few. They’re Chinese language only, which naturally limits what the West knows about them. I didn’t even know they existed until Dakota Cary, a research analyst at the Center for Security and Emerging Technology and a Chinese speaker, wrote a report about them a few months ago. And they’re increasingly hosted by the People’s Liberation Army, which presumably controls how much detail becomes public.

Some things we can infer. In 2016, none of the Cyber Grand Challenge teams used modern machine learning techniques. Certainly most of the Robot Hacking Games entrants are using them today. And the competitions encourage collaboration as well as competition between the teams. Presumably that accelerates advances in the field.

None of this is to say that real robot hackers are poised to attack us today, but I wish I could predict with some certainty when that day will come. In 2018, I wrote about how AI could change the attack/defense balance in cybersecurity. I said that it is impossible to know which side would benefit more but predicted that the technologies would benefit the defense more, at least in the short term. I wrote: “Defense is currently in a worse position than offense precisely because of the human components. Present-day attacks pit the relative advantages of computers and humans against the relative weaknesses of computers and humans. Computers moving into what are traditionally human areas will rebalance that equation.”

Unfortunately, it’s the People’s Liberation Army and not DARPA that will be the first to learn if I am right or wrong and how soon it matters.

This essay originally appeared in the January/February 2022 issue of IEEE Security & Privacy.

Blocking free API access to Twitter doesn’t stop abuse

Post Syndicated from original https://mjg59.dreamwidth.org/65647.html

In one week from now, Twitter will block free API access. This prevents anyone who has written interesting bot accounts, integrations, or tooling from accessing Twitter without paying for it. A whole number of fascinating accounts will cease functioning, people will no longer be able to use tools that interact with Twitter, and anyone using a free service to do things like find Twitter mutuals who have moved to Mastodon or to cross-post between Twitter and other services will be blocked.

There’s a cynical interpretation to this, which is that despite firing 75% of the workforce Twitter is still not profitable and Elon is desperate to not have Twitter go bust and also not to have to tank even more of his Tesla stock to achieve that. But let’s go with the less cynical interpretation, which is that API access to Twitter is something that enables bot accounts that make things worse for everyone. Except, well, why would a hostile bot account do that?

To interact with an API you generally need to present some sort of authentication token to the API to prove that you’re allowed to access it. It’s easy enough to restrict issuance of those tokens to people who pay for the service. But, uh, how do the apps work? They need to be able to communicate with the service to tell it to post tweets, retrieve them, and so on. And the simple answer to that is that they use some hardcoded authentication tokens. And while registering for an API token yourself identifies that you’re not using an official client, using the tokens embedded in the clients makes it look like you are. If you want to make it look like you’re a human, you’re already using tokens ripped out of the official clients.

The Twitter client API keys are widely known. Anyone who’s pretending to be a human is using those already and will be unaffected by the shutdown of the free API tier. Services like movetodon.org do get blocked. This isn’t an anti-abuse choice. It’s one that makes it harder to move to other services. It’s one that blocks a bunch of the integrations and accounts that bring value to the platform. It’s one that hurts people who follow the rules, without hurting the ones who don’t. This isn’t an anti-abuse choice, it’s about trying to consolidate control of the platform.

comment count unavailable comments

Какво се случва с електронната идентификация

Post Syndicated from Bozho original https://blog.bozho.net/blog/4004

Електронната идентификация, както много пъти съм писал, е ключова стъпка за постигане на широко използване и развитие на електронното управление. В последната година има доста детайли и развития, включително с мое участие.

Предисторията накратко: през 2016 г., с мое експертно участие, а подготвен и приет Закона за електронната идентификация. След това в много кратък срок (3-4 месеца) написахме и правилник за прилагане на закона, и съвместно с Информационно обслужване подготвихме техническа спецификация, по която МВР да проведе процедура за възлагане на обществена поръчка, с която да се изгради цялата софтуерна инфраструктура.

МВР обяви поръчката в началото на 2017 г. и след няколко странни и фиктивни жалби я прекрати в средата годината. Точно 1 година по-късно МВР обяви „голяма“ процедура за новите лични документи, като електронната идентификация беше включена в тази процедура като отделна дейност. Това, според мен, беше грешка и всички последващи събития го показват. Процедурата беше по особен ред по Закона за обществените поръчки със секретни елементи (заради личните документи), с няколко етапа, което доведе до това изпълнител да бъде избран чак през пролетта на 2020 г. За съжаление, методиката за оценка имаше една голяма недомислица, която позволяваше с висока цена по една дейност да се субсидира друга дейност с цел получаване на по-висока оценка (при прогнозна стойност за eID от около 19 милиона, избраният участник е оферирал около 80 милиона). Отчасти поради това, а и заради големия материален интерес, решението беше обжалвано от загубилия кандидат.

Обжалването мина през КЗК и Върховния административен съд, но той, вместо да вземе решение, изпрати преюдициално запитване до Съда на Европейския съюз, за да бъде изтълкувана директивата за обществени поръчки. Заради забавянето на това решение през 2021 г от ДБ зададохме въпрос на служебния министър-председател дали България ще изпрати искане за ускоряване на процедурата. Такова не беше изпратено и до момента, в който станах министър, нямаше движение по тази тема.

Първата ми задача беше да подготвим техническа спецификация и да приемем решение на Министерски съвет за конкретни срокове.. В периода от 2016 г. до 2022 г. смартфоните се развиха достатъчно, така че да са сигурен носител на криптографски ключове (или части от тях), така че да могат да се използват вместо отделен носител (лична карта, друга карта или четец-„флашка“). В поръчката на МВР такова мобилно приложение нямаше – беше загатнато като опция, при технологична възможност, след предложение от изпълнителя и одобрение от възложителя. Поради което това приложение и прилежащата инфраструктура не противоречаха на поръчката на МВР, която продължаваше да е „забила“. Има предвидено мобилно приложение с изцяло различен обхват – четец на лични документи по NFC, както е предвидено в Правилника за прилагане на Закона за електронна идентификация. В обновената спецификация на МВР от 2018 г. също има загатнато съхранение на криптографски ключове в мобилното устройството, но буквално в едни ред в скоби, което не е ясно какво ще произведе като резултат – напр. един проблем там е, че е заложено използване на мобилен номер, което увеличава рисковете за сигурността.

Затова новото приложение е нужно, а техническата му спецификация беше максимално детайлна, обществено обсъдена и възложена по реда на чл. 7с от Закона за електронното управление на Информационно обслужване, които, като един от малкото доставчици на удостоверителни услуги, имат конкретна експертиза с управление на криптографска инфраструктура.

В законодателната програма на министерството (вкл. приета с решение на Министерски съвет за извършване на оценка на въздействието) бяхме приели изменение на Закона за електронната идентификация, за да „слеем“ двете системи. За съжаление, правителството беше свалено и тази инициатива спря. Все пак в проекта за изменения на Закона за електронното управление предвидихме изрична уредба на системата за електронна идентификация на министерството. Такава не е стриктно необходима, тъй като тези неща произтичат от Регламент на ЕС и изпълнителната власт има възможност да урежда различни средства за електронна идентификация. Уредбата в закон е по-скоро поради друга пречка, която МВР постави в последните седмици на мандата ни – че отказваше данни за българските документи за самоличност, които биха направили възможна отдалечената първоначална регистрация. Имам и парламентарен въпрос по темата няколко месеца по-късно. Това, в комбинация с предсрочните избори, по които Информационно обслужване има ангажимент по закон, забави дори спря разработването на приложението, както е видно от отговора на министъра на електронното управление по друг мой въпрос.

В края на декември, Съдът на ЕС взе решение, в съответствие с което ВАС решава делото в полза на избрания изпълнител и МВР сключва договор. Това е противно на очакванията на МВР и поставя въпроси за ефективността на съвместното съществуване на „старата“ система по проекта на МВР и новата на МЕУ (министерство на електронното управление). Именно поради това свиках среща в Народното събрание с МВР, МЕУ и Информационно обслужване, на която изразих моите притеснения и дадох конкретни идеи. Няколко дни след това изпратих официално искане за становище до двете министерства, на което все още нямам отговор.

След обсъждане с други парламентарни групи, подготвих и изменения на Закона за електронната идентификация, с които да се уреди сливането на двете системи в рамките на процедурата на МВР и включването на МЕУ като съвместен възложител. За съжаление Народното събрание приключва своя живот и мнозинството няма достатъчно мотивация да разгледа Закона за електронното управление и съответно да въведем тези изменения в другия закон. Това нежелание за уж консенсусен законопроект беше видно и по много други законопроекти, но тук дори е отчетено с гласуване, когато един късен следобед предложих заседанието да продължи до приемането на този законопроект, залата (с изключение на ДБ и ПП) гласува „против“ (или „въздържал се“), а законопроектът няколко седмици беше включван толкова назад в дневния ред, с ясното съзнание от определящите дневния ред, че до него няма да се стигне.

По същество – смятам, че МВР не трябва да е орган за електронна идентификация. През 2016 г. това беше единственият възможен орган, тъй като Държавна агенция „Електронно управление“ още не беше създадена. Министерството, надграждащо агенцията, се появи в нашето правителство в края на 2021 г. (на практика в началото на 2022). В момента именно то е най-подходящо за единствен орган за електронна идентификация, без това да пречи на процедурата на МВР. Разработеното от Информационно обслужване може да се прехвърли в МВР и да бъде довършено от избрания от МВР изпълнител, като след това всички системи бъдат прехвърлени на МЕУ, за да оперира системата.

В последните 6 месеца, основно заради гореспоменатия отказ на МВР да предостави достъп до данни, приложението не е напреднало и е замразено (затова и все още няма качен изходен код). Смятам, че този отказ е незаконосъобразен, но това в крайна сметка е и политическо решение. Занапред ще направя възможното да има ясна концепция как да се процедира с вече изградените функционалности и как да се слеят със системите на МВР, което според мен е правилният път напред. А прехвърлянето от МВР към МЕУ ще направим в следващия парламент.

Проактивността на нашето правителство по темата даде надежда, че в края на 2022 г. приложението (по подобие на естонското SmartID, холандското DigiD, датското MitID и украинското Diia), може да заработи и съответно много услуги да станат удобни и достъпни за гражданите и бизнеса. За съжаление тази проактивност отстъпи на административно безвремие, но това не е обвинение към някого, а обичайното състояние на нещата. За преодоляване на съпротивителните сили на административното безвремие е нужно политическо мнозинство, каквото служебният кабинет няма.

В следващите месец все пак има нужда от проактивност, за да се използва вече разработеното, за да се съкратят сроковете, предвидени в процедурата на МВР. Иначе ще е готово след година (по спомен за графика на поръчката на МВР) и ще продължим да пилеем време и да отлагаме ефективното електронно управление. Ще опитам да помагам по тази линия, за бъде постигната целта.

Електронната идентификация може да звучи нишово, но е отключващ фактор. Нейното бързо реализиране ще отвори много врати и ще подобри много процеси за гражданите, бизнеса и администрацията.

Материалът Какво се случва с електронната идентификация е публикуван за пръв път на БЛОГодаря.

На Путин ли е войната, или на руснаците? Данните говорят

Post Syndicated from Йоанна Елми original https://www.toest.bg/na-putin-li-e-voynata-ili-na-rusnatsite-dannite-govoryat/

„Обърнете внимание, че е възможно резултатите от изследвания по редица въпроси относно ситуацията в Украйна да се отклоняват от реалните настроения. Руснаците се боят да говорят на тази тема – наблюдава се увеличение на отказите за участие и спад в искреността на отговорите.“

На Путин ли е войната, или на руснаците? Данните говорят

Така са представени резултатите от изследване на нагласите спрямо инвазията в Украйна, проведено от руската комуникационна агенция Russian Field.

Почти година след началото на войната въпросът дали я води само Путин, или я подкрепя целият руски народ, продължава да разделя експертите. Изследване на Института Open Minds дава отговор, сравнявайки отворени с официални руски данни.

Според данните подкрепата за военните действия срещу Украйна зависи от тона на властта. Тази подкрепа обаче не означава готовност за мобилизация – едва около 30% от руснаците са готови лично да се включат във войната. По-голяма част от руското население (39%) би предпочела мирни преговори пред продължаване на конфликта. Анализ на дискусии в социалните мрежи сочи, че недоволството от управлението на Путин нараства.

В доклада на Open Minds са сравнени официални данни на Росстат, според които около 97 000 души са напуснали страната през първите шест месеца от началото на конфликта, с данни от Казахстан, Грузия и ЕС, които показват, че при обявяването на мобилизацията през септември 200 000 души са напуснали Русия в рамките на 9 дни. Ако сентенцията, че истината е някъде по средата, важи във време на война и пропаганда, то проучването на Open Minds със сигурност е стъпка в тази посока.

Зад желязната завеса на цензурата

Мисията на организацията, в която работят и украински експерти, е да изследва настроенията във вътрешността на Русия, „отвъд желязната завеса“ на цензурата. За това помагат наличните руски данни от вътрешни проучвания, анализът на социалните мрежи с изкуствен интелект, работата с отворени данни, както и експертността на културни антрополози, психолози и поведенчески специалисти.

Описаната методология подлага на критичен анализ информацията от руски социологически проучвания и официални данни, които се съпоставят и с други налични източници във и извън Русия, като по този начин се осигурява максимална обективност.

Цензурата в Русия е причина да липсват изцяло надеждни данни. Всеки, за когото се смята, че разпространява „невярна информация“ за войната, се наказва с глоба и затвор до 15 години. Критици на войната, като опозиционерите Иля Яшин и Владимир Кара-Мурза, бяха арестувани заради нарушение на новите закони, след чието въвеждане над 150 журналисти напуснаха страната.

Какво може да се случи с обикновените граждани, ако не внимават какво казват? Историята на Сергей Клоков, който е със смесен руско-украински произход, е добър пример. Клоков е служител в московската полиция, дръзнал да сподели в личен телефонен разговор, че според него Русия не бива да води война срещу Украйна. Арестуван е и го заплашват от пет до десет години лишаване от свобода. Разбираемо е защо руснаците са предпазливи дори в общуването си с близки и познати.

Затова не е изненадващо, че само в рамките на година тревожността в руското общество е нараснала със 119%. Тази информация се потвърждава от медийни анализи, телефонни анкети и статистики за количеството лекарства за психични разстройства, продадени за последната година. Близо половината руснаци признават в местни проучвания, че събитията, свързани с Украйна, имат негативно влияние над психичното им здраве.

Вътрешната съпротива е възможна, но малко вероятна

„В общи линии руснаците се адаптират към проблемите от изминалите три години. Способността за приспособяване към все по-неблагоприятни условия е основата на стабилността в руското общество в наши дни“, пише в доклада. Изследването не изключва протести и вътрешна съпротива, но и не предлага хипотези или доказателства за подобен сценарий.

По време на концерт на групата „Кис-Кис“ през май 2022 г. публиката скандира срещу войната. Любов Собол – юрист от екипа на Алексей Навални, който продължава да е затворник в колония, споделя видео от концерта с думите, че не всички руснаци подкрепят Путин. Въпреки цензурата руски културни дейци, като издателя Борис Куприянов и писателката Мария Степанова, публично заклеймяват войната и чертаят разграничителна линия между Путин и Русия. Имаше и изолирани протести, като този в Дагестан, където жители скандираха против войната и мобилизацията.


Критици, като академика Владислав Иноземцев, директор на Московския център за изследване на постиндустриалните науки, обаче смятат, че „Русия е Путин и Путин е Русия“. Сред често срещаните аргументи е липсата на вътрешна съпротива – щом руснаците не свалят режима и дори подкрепят инвазията, то не можем да виним само Путин. Данните, събрани от Open Minds, по-скоро подкрепят това становище, но обясняват защо апатията, обзела руското общество, не е задължително равна на подкрепа.

„Твърде вероятно е мнозинството руснаци да последват всякакви заповеди от политическите лидери. Нивата на подкрепа към руската агресия срещу Украйна остават високи. Не се наблюдават значителни промени в тези тенденции въпреки провалите на руската армия на бойното поле и проблемите, породени от частичната мобилизация“, казват авторите.

Профил на подкрепящите войната

С какво може да се обясни тази подкрепа? Първото предположение би било медийната пропаганда. Макар че все по-малко руснаци разчитат на телевизията като основен източник на информация – наблюдава се спад от близо 10% за последните две години, – стойностите на доверие и гледаемост остават високи.

Според други данни 29% от руснаците предпочитат интернет като основен източник на новини, а 52% се информират и от телевизията, и от интернет. Телевизията е особено непопулярна сред по-младите руснаци, 60% от които се информират от социалните мрежи. „Няма как да сме твърде оптимистично настроени относно обективността на онлайн съдържанието, което може да е също толкова проправителствено“, пишат авторите, но посочват, че реалната информация за събитията със сигурност е по-достъпна онлайн. Много руснаци са изтощени от следенето на новини за войната въобще.

Пропагандата не е единствената причина. Психологическите характеристики също играят роля в изразяването на подкрепа или опозиционни настроения към „специалната военна операция“, както е официалното название на инвазията в Русия, макар президентът Путин и подчинените му вече открито да говорят за война.

Две от хипотезите на изследователите – че хора, чиито качества попадат в т.нар. тъмна триада, и тези, които смятат, че НАТО е заплаха за Русия, биха имали високи нива на подкрепа – не се потвърждават. Проучването открива друга променлива, която дава предвидими и значителни резултати: безусловното подчинение. „Едно от ключовите убеждения на подкрепящите Путин е, че властта винаги е права просто защото е власт“, пишат авторите.

Още един показател, помагащ да се предскаже поддръжка за войната, е националната принадлежност – колкото по-силно е това чувство у хората, толкова по-вероятно е те да подкрепят войната. Колективният нарцисизъм – преувеличената вяра във важността и положителния образ на групата, към която принадлежи човек, например даден народ или етнос – също играе роля в подкрепата за инвазията.

Руснаците, поддържащи войната, вярват във величието на нацията си и смятат, че светът не я признава в достатъчна степен, посочват авторите. Те са по-стабилни психологически и регистрират по-ниска степен на емоционално прегаряне и стрес, а и мислят, че са повече, тъй като опозицията по-скоро остава скрита поради суровите мерки. Руснаците, противопоставящи се на инвазията в Украйна, са маргинализирани, чувстват, че са малцинство и обект на преследване от държавата и обществото, което влошава психическото им здраве.

За руснаците по-важни са вътрешните проблеми

За повечето руснаци войната е пореден елемент от една така или иначе сурова реалност, към която са свикнали да се приспособяват. Наблюдава се спад в интереса към репортажите за войната и апатичност към темата.

По-важни са вътрешните проблеми – финансова нестабилност, корупция, липса на въоръжение и екипировка за армията, както и обща тревожност за бъдещето. Тези теми се дискутират активно в руските социални мрежи, станали обект на изследването, представено в доклада. Аргументите за край на войната често са обвързани по-скоро с вътрешна стабилизация. Директната критика е насочена към местните власти.

„Руснаците все пак смятат, че държавата им върви в правилната посока. Те не искат войната да ги засегне лично, но са психически подготвени за продължителен конфликт, тъй като вярват, че така или иначе не е възможно да променят вътрешната ситуация в Русия. В случай на нова мобилизационна вълна не са подготвени да протестират. Те са объркани и нямат ясна визия за бъдещето на Руската федерация“, казват авторите в заключение.

Руснаците нямат желание да участват непосредствено във войната, която страната им води, особено след успешната украинска контраофанзива. Според изследването висок процент руснаци биха приели мирни преговори, което би могло да означава, че не смятат, че териториалното разширение към Украйна е в техен интерес.

Прогнозите на част от международните експерти за вътрешни протести в Русия остават неосъществени. Надеждата, че режимът ще бъде свален под вътрешен натиск, е по-скоро наивна. Не е ясно и какъв ще е изходът от вътрешните борби за власт, като например все по-явното присъствие на милиардера Евгений Пригожин в медийното пространство и съревнованието между неговите наемници от „Вагнер“ (чието съществуване руската държава доскоро отричаше) и руската армия.

Възможно е причината за липсата на масови протести и съпротива да е именно отсъствието на вяра у руснаците, че са способни да променят хода на руската политика. Освен твърдата подкрепа за войната, липсата на визия и идеи за алтернативно развитие на Русия също играят роля. Докладът на Open Minds показва, че когато се задава въпросът дали това е войната на Путин, или войната на руснаците, трябва да се вземат предвид много вътрешни фактори – ако, разбира се, говорим с данни. Моралният дебат е далеч по-сложен. И аргументите, че войната е само на Путин или че всъщност е подкрепена от голямата част от руснаците, тепърва ще се градят.

На Путин ли е войната, или на руснаците? Данните говорят

Post Syndicated from Йоанна Елми original https://www.toest.bg/na-putin-li-e-voynata-ili-na-rusnatsite-dannite-govoryat/

„Обърнете внимание, че е възможно резултатите от изследвания по редица въпроси относно ситуацията в Украйна да се отклоняват от реалните настроения. Руснаците се боят да говорят на тази тема – наблюдава се увеличение на отказите за участие и спад в искреността на отговорите.“

На Путин ли е войната, или на руснаците? Данните говорят

Така са представени резултатите от изследване на нагласите спрямо инвазията в Украйна, проведено от руската комуникационна агенция Russian Field.

Почти година след началото на войната въпросът дали я води само Путин, или я подкрепя целият руски народ, продължава да разделя експертите. Изследване на Института Open Minds дава отговор, сравнявайки отворени с официални руски данни.

Според данните подкрепата за военните действия срещу Украйна зависи от тона на властта. Тази подкрепа обаче не означава готовност за мобилизация – едва около 30% от руснаците са готови лично да се включат във войната. По-голяма част от руското население (39%) би предпочела мирни преговори пред продължаване на конфликта. Анализ на дискусии в социалните мрежи сочи, че недоволството от управлението на Путин нараства.

В доклада на Open Minds са сравнени официални данни на Росстат, според които около 97 000 души са напуснали страната през първите шест месеца от началото на конфликта, с данни от Казахстан, Грузия и ЕС, които показват, че при обявяването на мобилизацията през септември 200 000 души са напуснали Русия в рамките на 9 дни. Ако сентенцията, че истината е някъде по средата, важи във време на война и пропаганда, то проучването на Open Minds със сигурност е стъпка в тази посока.

Зад желязната завеса на цензурата

Мисията на организацията, в която работят и украински експерти, е да изследва настроенията във вътрешността на Русия, „отвъд желязната завеса“ на цензурата. За това помагат наличните руски данни от вътрешни проучвания, анализът на социалните мрежи с изкуствен интелект, работата с отворени данни, както и експертността на културни антрополози, психолози и поведенчески специалисти.

Описаната методология подлага на критичен анализ информацията от руски социологически проучвания и официални данни, които се съпоставят и с други налични източници във и извън Русия, като по този начин се осигурява максимална обективност.

Цензурата в Русия е причина да липсват изцяло надеждни данни. Всеки, за когото се смята, че разпространява „невярна информация“ за войната, се наказва с глоба и затвор до 15 години. Критици на войната, като опозиционерите Иля Яшин и Владимир Кара-Мурза, бяха арестувани заради нарушение на новите закони, след чието въвеждане над 150 журналисти напуснаха страната.

Какво може да се случи с обикновените граждани, ако не внимават какво казват? Историята на Сергей Клоков, който е със смесен руско-украински произход, е добър пример. Клоков е служител в московската полиция, дръзнал да сподели в личен телефонен разговор, че според него Русия не бива да води война срещу Украйна. Арестуван е и го заплашват от пет до десет години лишаване от свобода. Разбираемо е защо руснаците са предпазливи дори в общуването си с близки и познати.

Затова не е изненадващо, че само в рамките на година тревожността в руското общество е нараснала със 119%. Тази информация се потвърждава от медийни анализи, телефонни анкети и статистики за количеството лекарства за психични разстройства, продадени за последната година. Близо половината руснаци признават в местни проучвания, че събитията, свързани с Украйна, имат негативно влияние над психичното им здраве.

Вътрешната съпротива е възможна, но малко вероятна

„В общи линии руснаците се адаптират към проблемите от изминалите три години. Способността за приспособяване към все по-неблагоприятни условия е основата на стабилността в руското общество в наши дни“, пише в доклада. Изследването не изключва протести и вътрешна съпротива, но и не предлага хипотези или доказателства за подобен сценарий.

По време на концерт на групата „Кис-Кис“ през май 2022 г. публиката скандира срещу войната. Любов Собол – юрист от екипа на Алексей Навални, който продължава да е затворник в колония, споделя видео от концерта с думите, че не всички руснаци подкрепят Путин. Въпреки цензурата руски културни дейци, като издателя Борис Куприянов и писателката Мария Степанова, публично заклеймяват войната и чертаят разграничителна линия между Путин и Русия. Имаше и изолирани протести, като този в Дагестан, където жители скандираха против войната и мобилизацията.


Критици, като академика Владислав Иноземцев, директор на Московския център за изследване на постиндустриалните науки, обаче смятат, че „Русия е Путин и Путин е Русия“. Сред често срещаните аргументи е липсата на вътрешна съпротива – щом руснаците не свалят режима и дори подкрепят инвазията, то не можем да виним само Путин. Данните, събрани от Open Minds, по-скоро подкрепят това становище, но обясняват защо апатията, обзела руското общество, не е задължително равна на подкрепа.

„Твърде вероятно е мнозинството руснаци да последват всякакви заповеди от политическите лидери. Нивата на подкрепа към руската агресия срещу Украйна остават високи. Не се наблюдават значителни промени в тези тенденции въпреки провалите на руската армия на бойното поле и проблемите, породени от частичната мобилизация“, казват авторите.

Профил на подкрепящите войната

С какво може да се обясни тази подкрепа? Първото предположение би било медийната пропаганда. Макар че все по-малко руснаци разчитат на телевизията като основен източник на информация – наблюдава се спад от близо 10% за последните две години, – стойностите на доверие и гледаемост остават високи.

Според други данни 29% от руснаците предпочитат интернет като основен източник на новини, а 52% се информират и от телевизията, и от интернет. Телевизията е особено непопулярна сред по-младите руснаци, 60% от които се информират от социалните мрежи. „Няма как да сме твърде оптимистично настроени относно обективността на онлайн съдържанието, което може да е също толкова проправителствено“, пишат авторите, но посочват, че реалната информация за събитията със сигурност е по-достъпна онлайн. Много руснаци са изтощени от следенето на новини за войната въобще.

Пропагандата не е единствената причина. Психологическите характеристики също играят роля в изразяването на подкрепа или опозиционни настроения към „специалната военна операция“, както е официалното название на инвазията в Русия, макар президентът Путин и подчинените му вече открито да говорят за война.

Две от хипотезите на изследователите – че хора, чиито качества попадат в т.нар. тъмна триада, и тези, които смятат, че НАТО е заплаха за Русия, биха имали високи нива на подкрепа – не се потвърждават. Проучването открива друга променлива, която дава предвидими и значителни резултати: безусловното подчинение. „Едно от ключовите убеждения на подкрепящите Путин е, че властта винаги е права просто защото е власт“, пишат авторите.

Още един показател, помагащ да се предскаже поддръжка за войната, е националната принадлежност – колкото по-силно е това чувство у хората, толкова по-вероятно е те да подкрепят войната. Колективният нарцисизъм – преувеличената вяра във важността и положителния образ на групата, към която принадлежи човек, например даден народ или етнос – също играе роля в подкрепата за инвазията.

Руснаците, поддържащи войната, вярват във величието на нацията си и смятат, че светът не я признава в достатъчна степен, посочват авторите. Те са по-стабилни психологически и регистрират по-ниска степен на емоционално прегаряне и стрес, а и мислят, че са повече, тъй като опозицията по-скоро остава скрита поради суровите мерки. Руснаците, противопоставящи се на инвазията в Украйна, са маргинализирани, чувстват, че са малцинство и обект на преследване от държавата и обществото, което влошава психическото им здраве.

За руснаците по-важни са вътрешните проблеми

За повечето руснаци войната е пореден елемент от една така или иначе сурова реалност, към която са свикнали да се приспособяват. Наблюдава се спад в интереса към репортажите за войната и апатичност към темата.

По-важни са вътрешните проблеми – финансова нестабилност, корупция, липса на въоръжение и екипировка за армията, както и обща тревожност за бъдещето. Тези теми се дискутират активно в руските социални мрежи, станали обект на изследването, представено в доклада. Аргументите за край на войната често са обвързани по-скоро с вътрешна стабилизация. Директната критика е насочена към местните власти.

„Руснаците все пак смятат, че държавата им върви в правилната посока. Те не искат войната да ги засегне лично, но са психически подготвени за продължителен конфликт, тъй като вярват, че така или иначе не е възможно да променят вътрешната ситуация в Русия. В случай на нова мобилизационна вълна не са подготвени да протестират. Те са объркани и нямат ясна визия за бъдещето на Руската федерация“, казват авторите в заключение.

Руснаците нямат желание да участват непосредствено във войната, която страната им води, особено след успешната украинска контраофанзива. Според изследването висок процент руснаци биха приели мирни преговори, което би могло да означава, че не смятат, че териториалното разширение към Украйна е в техен интерес.

Прогнозите на част от международните експерти за вътрешни протести в Русия остават неосъществени. Надеждата, че режимът ще бъде свален под вътрешен натиск, е по-скоро наивна. Не е ясно и какъв ще е изходът от вътрешните борби за власт, като например все по-явното присъствие на милиардера Евгений Пригожин в медийното пространство и съревнованието между неговите наемници от „Вагнер“ (чието съществуване руската държава доскоро отричаше) и руската армия.

Възможно е причината за липсата на масови протести и съпротива да е именно отсъствието на вяра у руснаците, че са способни да променят хода на руската политика. Освен твърдата подкрепа за войната, липсата на визия и идеи за алтернативно развитие на Русия също играят роля. Докладът на Open Minds показва, че когато се задава въпросът дали това е войната на Путин, или войната на руснаците, трябва да се вземат  предвид много вътрешни фактори – ако, разбира се, говорим с данни. Моралният дебат е далеч по-сложен. И аргументите, че войната е само на Путин или че всъщност е подкрепена от голямата част от руснаците, тепърва ще се градят.

Uptick in healthcare organizations experiencing targeted DDoS attacks

Post Syndicated from Cat Allen original https://blog.cloudflare.com/uptick-in-healthcare-organizations-experiencing-targeted-ddos-attacks/

Uptick in healthcare organizations experiencing targeted DDoS attacks

Healthcare in the crosshairs

Uptick in healthcare organizations experiencing targeted DDoS attacks

Over the past few days, Cloudflare, as well as other sources, have observed healthcare organizations targeted by a pro-Russian hacktivist group claiming to be Killnet. There has been an increase in the amount of healthcare organizations coming to us to help get out from under these types of attacks. Multiple healthcare organizations behind Cloudflare have also been targeted by HTTP DDoS attacks and Cloudflare has helped them successfully mitigate these attacks. The United States Department of Health and Human Services issued an Analyst Note detailing the threat of Killnet-related cyberattacks to the healthcare industry.

A rise in political tensions and escalation of the conflict in Ukraine are all factors that play into the current cybersecurity threat landscape. Unlike traditional warfare, the Internet has enabled and empowered groups of individuals to carry out targeted attacks regardless of their location or involvement. Distributed-denial-of-Service (DDoS) attacks have the unfortunate advantage of not requiring an intrusion or a foothold to be launched and have, unfortunately, become more accessible than ever before.

The attacks observed by the Cloudflare global network do not show a clear indication that they are originating from a single botnet and the attack methods and sources seem to vary. This could indicate the involvement of multiple threat actors acting on behalf of Killnet or it could indicate a more sophisticated, coordinated attack.

Cloudflare application services customers are protected against the attacks. Cloudflare systems have been automatically detecting and mitigating the attacks on behalf of our customers. Our team continues to monitor the situation closely and is prepared to deploy countermeasures, if needed.

As an extra precaution, customers in the Healthcare industry are advised to follow the mitigation recommendations in the “How to Prepare” section below.

Uptick in healthcare organizations experiencing targeted DDoS attacks

Who is Killnet?

Killnet is a group of pro-Russian individuals that gather and communicate on a Telegram channel. The channel provides a space for pro-Russian sympathizers to volunteer their expertise by participating in cyberattacks against Western interests. Previously, in the fourth quarter of 2022, Killnet called to attack US airport websites.

Why DDoS attacks?

DDoS attacks, unlike ransomware, do not require an intrusion or foothold in the target network to be launched. Much like how physical addresses are publicly available via directories or for services like mail delivery, IP addresses and domain names are also publicly available. Unfortunately, this means that every domain name (layer 7) and every network that connects to the Internet (layers 3 & 4) must proactively prepare to defend against DDoS attacks. DDoS attacks are not new threats, but they have become larger, more sophisticated, and more frequent in recent years.

How to prepare

While Cloudflare’s systems have been automatically detecting and mitigating these DDoS attacks, we recommend additional precautionary measures to improve your security posture:

  1. Ensure all other DDoS Managed Rules are set to default settings (High sensitivity level and mitigation actions) for optimal DDoS activation
  2. Cloudflare Enterprise customers with Advanced DDoS should consider enabling Adaptive DDoS Protection, which mitigates traffic that deviates based on your traffic profiles
  3. Deploy firewall rules and rate-limiting rules to enforce a combined positive and negative security model. Reduce the traffic allowed to your website based on your known usage.
  4. Ensure your origin is not exposed to the public Internet (i.e. only enable access to Cloudflare IP addresses)
  5. Customers with access to Managed IP Lists should consider leveraging those lists in firewall rules
  6. Enable caching as much as possible to reduce the strain on your origin servers
  7. Enable DDoS alerting to improve your response time

Though attacks are launched by humans, they are carried out by bots. Defenders who do not leverage automated defenses are at a disadvantage. Cloudflare has helped, and will continue to help, our customers in the healthcare industry prepare for and respond to these attacks.

Under attack? We can help. Visit this webpage or call us at +1 (888) 99 FLARE

How Amazon Devices scaled and optimized real-time demand and supply forecasts using serverless analytics

Post Syndicated from Avinash Kolluri original https://aws.amazon.com/blogs/big-data/how-amazon-devices-scaled-and-optimized-real-time-demand-and-supply-forecasts-using-serverless-analytics/

Every day, Amazon devices process and analyze billions of transactions from global shipping, inventory, capacity, supply, sales, marketing, producers, and customer service teams. This data is used in procuring devices’ inventory to meet Amazon customers’ demands. With data volumes exhibiting a double-digit percentage growth rate year on year and the COVID pandemic disrupting global logistics in 2021, it became more critical to scale and generate near-real-time data.

This post shows you how we migrated to a serverless data lake built on AWS that consumes data automatically from multiple sources and different formats. Furthermore, it created further opportunities for our data scientists and engineers to use AI and machine learning (ML) services to continuously feed and analyze data.

Challenges and design concerns

Our legacy architecture primarily used Amazon Elastic Compute Cloud (Amazon EC2) to extract the data from various internal heterogeneous data sources and REST APIs with the combination of Amazon Simple Storage Service (Amazon S3) to load the data and Amazon Redshift for further analysis and generating the purchase orders.

We found this approach resulted in a few deficiencies and therefore drove improvements in the following areas:

  • Developer velocity – Due to the lack of unification and discovery of schema, which are primary reasons for runtime failures, developers often spent time dealing with operational and maintenance issues.
  • Scalability – Most of these datasets are shared across the globe. Therefore, we must meet the scaling limits while querying the data.
  • Minimal infrastructure maintenance – The current process spans multiple computes depending on the data source. Therefore, reducing infrastructure maintenance is critical.
  • Responsiveness to data source changes – Our current system gets data from various heterogeneous data stores and services. Any updates to those services takes months of developer cycles. The response times for these data sources are critical to our key stakeholders. Therefore, we must take a data-driven approach to select a high-performance architecture.
  • Storage and redundancy – Due to the heterogeneous data stores and models, it was challenging to store the different datasets from various business stakeholder teams. Therefore, having versioning along with incremental and differential data to compare will provide a remarkable ability to generate more optimized plans
  • Fugitive and accessibility – Due to the volatile nature of logistics, a few business stakeholder teams have a requirement to analyze the data on demand and generate the near-real-time optimal plan for the purchase orders. This introduces the need for both polling and pushing the data to access and analyze in near-real time.

Implementation strategy

Based on these requirements, we changed strategies and started analyzing each issue to identify the solution. Architecturally, we chose a serverless model, and the data lake architecture action line refers to all the architectural gaps and challenging features we determined were part of the improvements. From an operational standpoint, we designed a new shared responsibility model for data ingestion using AWS Glue instead of internal services (REST APIs) designed on Amazon EC2 to extract the data. We also used AWS Lambda for data processing. Then we chose Amazon Athena as our query service. To further optimize and improve the developer velocity for our data consumers, we added Amazon DynamoDB as a metadata store for different data sources landing in the data lake. These two decisions drove every design and implementation decision we made.

The following diagram illustrates the architecture

arch

In the following sections, we look at each component in the architecture in more detail as we move through the process flow.

AWS Glue for ETL

To meet customer demand while supporting the scale of new businesses’ data sources, it was critical for us to have a high degree of agility, scalability, and responsiveness in querying various data sources.

AWS Glue is a serverless data integration service that makes it easy for analytics users to discover, prepare, move, and integrate data from multiple sources. You can use it for analytics, ML, and application development. It also includes additional productivity and DataOps tooling for authoring, running jobs, and implementing business workflows.

With AWS Glue, you can discover and connect to more than 70 diverse data sources and manage your data in a centralized data catalog. You can visually create, run, and monitor extract, transform, and load (ETL) pipelines to load data into your data lakes. Also, you can immediately search and query cataloged data using Athena, Amazon EMR, and Amazon Redshift Spectrum.

AWS Glue made it easy for us to connect to the data in various data stores, edit and clean the data as needed, and load the data into an AWS-provisioned store for a unified view. AWS Glue jobs can be scheduled or called on demand to extract data from the client’s resource and from the data lake.

Some responsibilities of these jobs are as follows:

  • Extracting and converting a source entity to data entity
  • Enrich the data to contain year, month, and day for better cataloging and include a snapshot ID for better querying
  • Perform input validation and path generation for Amazon S3
  • Associate the accredited metadata based on the source system

Querying REST APIs from internal services is one of our core challenges, and considering the minimal infrastructure, we wanted to use them in this project. AWS Glue connectors assisted us in adhering to the requirement and goal. To query data from REST APIs and other data sources, we used PySpark and JDBC modules.

AWS Glue supports a wide variety of connection types. For more details, refer to Connection Types and Options for ETL in AWS Glue.

S3 bucket as landing zone

We used an S3 bucket as the immediate landing zone of the extracted data, which is further processed and optimized.

Lambda as AWS Glue ETL Trigger

We enabled S3 event notifications on the S3 bucket to trigger Lambda, which further partitions our data. The data is partitioned on InputDataSetName, Year, Month, and Date. Any query processor running on top of this data will scan only a subset of data for better cost and performance optimization. Our data can be stored in various formats, such as CSV, JSON, and Parquet.

The raw data isn’t ideal for most of our use cases to generate the optimal plan because it often has duplicates or incorrect data types. Most importantly, the data is in multiple formats, but we quickly modified the data and observed significant query performance gains from using the Parquet format. Here, we used one of the performance tips in Top 10 performance tuning tips for Amazon Athena.

AWS Glue jobs for ETL

We wanted better data segregation and accessibility, so we chose to have a different S3 bucket to improve performance further. We used the same AWS Glue jobs to further transform and load the data into the required S3 bucket and a portion of extracted metadata into DynamoDB.

DynamoDB as metadata store

Now that we have the data, various business stakeholders further consume it. This leaves us with two questions: which source data resides on the data lake and what version. We chose DynamoDB as our metadata store, which provides the latest details to the consumers to query the data effectively. Every dataset in our system is uniquely identified by snapshot ID, which we can search from our metadata store. Clients access this data store with an API’s.

Amazon S3 as data lake

For better data quality, we extracted the enriched data into another S3 bucket with the same AWS Glue job.

AWS Glue Crawler

Crawlers are the “secret sauce” that enables us to be responsive to schema changes. Throughout the process, we chose to make each step as schema-agnostic as possible, which allows any schema changes to flow through until they reach AWS Glue. With a crawler, we could maintain the agnostic changes happening to the schema. This helped us automatically crawl the data from Amazon S3 and generate the schema and tables.

AWS Glue Data Catalog

The Data Catalog helped us maintain the catalog as an index to the data’s location, schema, and runtime metrics in Amazon S3. Information in the Data Catalog is stored as metadata tables, where each table specifies a single data store.

Athena for SQL queries

Athena is an interactive query service that makes it easy to analyze data in Amazon S3 using standard SQL. Athena is serverless, so there is no infrastructure to manage, and you pay only for the queries you run. We considered operational stability and increasing developer velocity as our key improvement factors.

We further optimized the process to query Athena so that users can plug in the values and the queries to get data out of Athena by creating the following:

  • An AWS Cloud Development Kit (AWS CDK) template to create Athena infrastructure and AWS Identity and Access Management (IAM) roles to access data lake S3 buckets and the Data Catalog from any account
  • A library so that client can provide an IAM role, query, data format, and output location to start an Athena query and get the status and result of the query run in the bucket of their choice.

To query Athena is a two-step process:

  • StartQueryExecution – This starts the query run and gets the run ID. Users can provide the output location where the output of the query will be stored.
  • GetQueryExecution – This gets the query status because the run is asynchronous. When successful, you can query the output in an S3 file or via API.

The helper method for starting the query run and getting the result would be in the library.

Data lake metadata service

This service is custom developed and interacts with DynamoDB to get the metadata (dataset name, snapshot ID, partition string, timestamp, and S3 link of the data) in the form of a REST API. When the schema is discovered, clients use Athena as their query processor to query the data.

Because all datasets have a snapshot ID are partitioned, the join query doesn’t result in a full table scan but only a partition scan on Amazon S3. We used Athena as our query processor because of its ease in not managing our query infrastructure. Later, if we feel we need something more, we can use either Redshift Spectrum or Amazon EMR.

Conclusion

Amazon Devices teams discovered significant value by moving to a data lake architecture using AWS Glue, which enabled multiple global business stakeholders to ingest data in more productive ways. This enabled the teams to generate the optimal plan to place purchase orders for devices by analyzing the different datasets in near-real time with appropriate business logic to solve the problems of the supply chain, demand, and forecast.

From an operational perspective, the investment has already started to pay off:

  • It standardized our ingestion, storage, and retrieval mechanisms, saving onboarding time. Before the implementation of this system, one dataset took 1 month to onboard. Due to our new architecture, we were able to onboard 15 new datasets in less than 2 months, which improved our agility by 70%.
  • It removed scaling bottlenecks, creating a homogeneous system that can quickly scale to thousands of runs.
  • The solution added schema and data quality validation before accepting any inputs and rejecting them if data quality violations are discovered.
  • It made it easy to retrieve datasets while supporting future simulations and back tester use cases requiring versioned inputs. This will make launching and testing models simpler.
  • The solution created a common infrastructure that can be easily extended to other teams across DIAL having similar issues with data ingestion, storage, and retrieval use cases.
  • Our operating costs have fallen by almost 90%.
  • This data lake can be accessed efficiently by our data scientists and engineers to perform other analytics and have a predictive approach as a future opportunity to generate accurate plans for the purchase orders.

The steps in this post can help you plan to build a similar modern data strategy using AWS-managed services to ingest data from different sources, automatically create metadata catalogs, share data seamlessly between the data lake and data warehouse, and create alerts in the event of an orchestrated data workflow failure.


About the authors

avinash_kolluriAvinash Kolluri is a Senior Solutions Architect at AWS. He works across Amazon Alexa and Devices to architect and design modern distributed solutions. His passion is to build cost-effective and highly scalable solutions on AWS. In his spare time, he enjoys cooking fusion recipes and traveling.

vipulVipul Verma is a Sr.Software Engineer at Amazon.com. He has been with Amazon since 2015,solving real-world challenges through technology that directly impact and improve the life of Amazon customers. In his spare time, he enjoys hiking.

The collective thoughts of the interwebz