Cloudflare Radar was launched two years ago to give everyone access to the Internet trends, patterns and insights Cloudflare uses to help improve our service and protect our customers.
Until then, these types of insights were only available internally at Cloudflare. However, true to our mission of helping build a better Internet, we felt everyone should be able to look behind the curtain and see the inner workings of the Internet. It’s hard to improve or understand something when you don’t have clear visibility over how it’s working.
On Cloudflare Radar you can find timely graphs and visualizations on Internet traffic, security and attacks, protocol adoption and usage, and outages that might be affecting the Internet. All of these can be narrowed down by timeframe, country, and Autonomous System (AS). You can also find interactive deep dive reports on important subjects such as DDoS and the Meris Botnet. It’s also possible to search for any domain name to see details such as SSL usage and which countries their visitors are coming from.
Since launch, Cloudflare Radar has been used by NGOs to confirm the Internet disruptions their observers see in the field, by journalists looking for Internet trends related to an event in a country of interest or at volume of cyberattacks as retaliation to political sanctions, by analysts looking at the prevalence of new protocols and technologies, and even by brand PR departments using Cloudflare Radar data to analyze the online impact of a major sports event.
Cloudflare Radar has clearly become an important tool for many and, most importantly, we find it has helped shed light on parts of the Internet that deserve more attention and investment.
Introducing Cloudflare Radar 2.0
What has made Cloudflare Radar so valuable is that the data and insights it contains are unique and trustworthy. Cloudflare Radar shows aggregate data from across the massive spectrum of Internet traffic we see every day, presenting you with datasets you won’t find elsewhere.
However, there were still gaps. Today, on the second anniversary of Cloudflare Radar, we are launching Cloudflare Radar 2.0 in beta. It will address three common pieces of feedback from users:
Ease of finding insights and data. The way information was structured on Cloudflare Radar made finding information daunting for some people. We are redesigning Cloudflare Radar so that it becomes a breeze.
Number of insights. We know many users have wanted to see insights about other important parts of the Internet, such as email. We have also completely redesigned the Cloudflare Radar backend so that we can quickly add new insights over the coming months (including insights into email).
Sharing insights.The options for sharing Cloudflare Radar insights were limited. We will now provide you the options you want, including downloadable and embeddable graphs, sharing to social media platforms, and an API.
Finding insights and data
On a first visit to the redesigned Cloudflare Radar homepage one will notice:
Prominent and intuitive filtering capabilities on the top bar. A global search bar is also coming soon.
Content navigation on the sidebar.
Content cards showing glanceable and timely information.
The content you find on the homepage are what we call “quick bytes”. Those link you to more in-depth content for that specific topic, which can also be found through the sidebar navigation.
At the top of the page you can search for a country, autonomous system number (ASN), domain, or report to navigate to a home page for that specific content. For example, the domain page for google.com:
The navigation sidebar allows you to find more detailed insights and data related to Traffic, Security & Attacks, Adoption & Usage, and Domains. (We will be adding additional topic areas in the future.) It also gives you quick access to the Cloudflare Radar Outage Center, a tool for tracking Internet disruptions around the world and to which we are dedicating a separate blog post, and to Radar Reports, which are interactive deep dive reports on important subjects such as DDoS and the Meris Botnet.
Within these topic pages (such as the one for Adoption & Usage shown above), you will find the quick bytes for the corresponding topic at the top, and quick bytes for related topics on the right. The quick bytes on the right allow you to quickly glance at and navigate to related sections.
In the middle of the page are the more detailed charts for the topic you’re exploring.
Sharing insights
Cloudflare Radar’s reason to exist is to make Internet insights available to everyone, but historically we haven’t been as flexible as our users would want. People could download a snapshot of the graph, but not much more.
With Cloudflare Radar 2.0 we will be introducing three major new ways of using Radar insights and data:
Social share. Cloudflare Radar 2.0 charts have a more modern and clean look and feel, and soon you’ll be able to share them directly on the social media platform of your choice. No more dealing with low quality screenshots.
Embeddable charts. The beautiful charts will also be able to be embedded directly into your webpage or blog – it will work just like a widget, always showing up-to-date information.
API. If you like the data on Cloudflare Radar but want to manipulate it further for analysis, visualization, or for posting your own charts, you’ll have the Cloudflare Radar API available to you starting today.
Note: The API is available today. To use the Cloudflare API you need an API token or key (more details here). Embedding charts and sharing directly to social are new features to be released later this year.
Technology changes
Cloudflare Radar 2.0 was built on a new technology stack; we will write a blog post about why and how we did it soon. A lot changed: we now have proper GraphQL data endpoints and a public API, the website runs on top of Cloudflare Pages and Workers, and we’re finally doing server-side rendering using Remix. We adopted SVG whenever possible, built our reusable data visualization components system, and are using Cosmos for visual TDD. These foundational changes will provide a better UX/UI to our users and give us speed when iterating and improving Cloudflare Radar in the future.
We hope you find this update valuable, and recommend you keep an eye on radar.cloudflare.com to see the new insights and topics we’ll be adding regularly. If you have any feedback, please send it to us through the Cloudflare Community.
Historically, Cloudflare has covered large-scale Internet outages with timely blog posts, such as those published for Iran, Sudan, Facebook, and Syria. While we still explore such outages on the Cloudflare blog, throughout 2022 we have ramped up our monitoring of Internet outages around the world, posting timely information about those outages to @CloudflareRadar on Twitter.
Furthermore, this initial release is also laying the groundwork for the CROC to become a first stop and key resource for civil society organizations, journalists/news media, and impacted parties to get information on, or corroboration of, reported or observed Internet outages.
What information does the CROC contain?
At launch, the CROC includes summary information about observed outage events. This information includes:
Location: Where was the outage?
ASN: What autonomous system experienced a disruption in connectivity?
Type: How broad was the outage? Did connectivity fail nationwide, or at a sub-national level? Did just a single network provider have an outage?
Scope: If it was a sub-national/regional outage, what state or city was impacted? If it was a network-level outage, which one?
Cause: Insight into the likely cause of the outage, based on publicly available information. Historically, some have been government directed shutdowns, while others are caused by severe weather or natural disasters, or by infrastructure issues such as cable cuts, power outages, or filtering/blocking.
Start time: When did the outage start?
End time: When did the outage end?
Using the CROC
Radar pages, including the main landing page, include a card displaying information about the most recently observed outage, along with a link to the CROC. The CROC will also be linked from the left-side navigation bar
Within the CROC, we have tried to keep the interface simple and easily understandable. Based on the selected time period, the global map highlights locations where Internet outages have been observed, along with a tooltip showing the number of outages observed during that period. Similarly, the table includes information (as described above) about each observed outage, along with a link to more information. The linked information may be a Twitter post, a blog post, or a custom Radar graph.
As mentioned in the Radar 2.0 launch blog post, we launched an associated API alongside the new site. Outage information is available through this API as well — in fact, the CROC is built on top of this API. Interested parties, including civil society organizations, data journalists, or others, can use the API to integrate the available outage data with their own data sets, build their own related tools, or even develop a custom interface.
Information about the related API endpoint and how to access it can be found in the Cloudflare API documentation.
We recognize that some users may want to download the whole list of observed outages for local consumption and analysis. They can do so by clicking the “Download CSV” link below the table.
The status page the Internet needs (coming soon)
Today’s launch of the Cloudflare Radar Outage Center is just the beginning, as we plan to improve it over time. This includes increased automation of outage detection, enabling us to publish more timely information through both the API and the CROC tool, which is important for members of the community that track and respond to Internet outages. We are also exploring how we can use synthetic monitoring in combination with other network-level performance and availability information to detect outages of popular consumer and business applications/platforms.
And anyone who uses a cloud platform provider (such as AWS) will know that those companies’ status pages take a surprisingly long time to update when there’s an outage. It’s very common to experience difficulty accessing a service, see hundreds of messages on Twitter and message boards about a service being down, only to go to the cloud platform provider’s status page and see everything green and “All systems normal”.
For the last few months we’ve been monitoring the performance of cloud platform providers to see if we can detect when they go down and provide our own, real time status page for them. We believe we can and Cloudflare Radar Outage Center will be extended to include cloud service providers and give the Internet the status page it needs.
If you have questions about the CROC, or suggestions for features that you would like to see, please reach out to us on Twitter at @CloudflareRadar.
Back in June 2022, we announced an upcoming feature that would allow for Cloudflare Zero Trust users to easily create prefilled HTTP policies in Cloudflare Gateway (Cloudflare’s Secure Web Gateway solution) via issues identified by CASB, a new Cloudflare product that connects, scans, and monitors your SaaS apps – like Google Workspace and Microsoft 365 – for security issues.
With Cloudflare’s 12th Birthday Week nearing its end, we wanted to highlight, in true Cloudflare fashion, this new feature in action.
What is CASB? What is Gateway?
To quickly recap, Cloudflare’s API-driven CASB offers IT and security teams a fast, yet effective way to connect, scan, and monitor their SaaS apps for security issues, like file exposures, misconfigurations, and Shadow IT. In just a few clicks, users can see an exhaustive list of security issues that may be affecting the security of their SaaS apps, including Google Workspace, Microsoft 365, Slack, and GitHub.
Cloudflare Gateway, our Secure Web Gateway (SWG) offering, allows teams to monitor and control the outbound connections originating from endpoint devices. For example, don’t want your employees to access gambling and social media websites on company devices? Just block access to them in our easy-to-use Zero Trust dashboard.
The problems at hand
As we highlighted in our first post, Shadow IT – or unapproved third-party applications being used by employees – continues to be one of the biggest pain points for IT administrators in the cloud era. When employees grant access to external services without the consent of their IT or security department, they risk granting bad actors access to some of the company’s most sensitive data stored in these SaaS applications.
Another major issue affecting the security of data stored in the cloud is file exposure in the form of oversharing. When an employee shares a highly sensitive Google Doc to someone via a public link, would your IT or security team know about it? And even if they do, do they have a way to minimize the risk and block access to it?
With these two products now being used by customers around the world, we’re excited to share how visibility and basic awareness of SaaS security issues doesn’t have to be the end of it. What are admins supposed to do next?
Gateway + CASB: blocking identified threats in three (yes, three) clicks
Now, when CASB discovers a problem (which we call a Finding), it’s now possible to easily create a corresponding Gateway policy in as few as three clicks.
This means users can now automatically generate fine-grained Gateway policies to prevent specific inappropriate behavior from continuing, while still allowing for expected access and usage that meets company policy.
Example 1: Block employees from uploading to their personal Google Drive
A common use case we heard during CASB’s beta program was the tendency for employees to upload corporate data – documents, spreadsheets, files, folders, etc. – to their personal Google Drive (or similar) accounts, presenting the risk of intellectual property making its way out of a secure corporate environment. With Gateway and CASB working together, IT administrators can now directly block upload activity from anywhere other than their corporate tenant of Google Drive or Microsoft OneDrive.
Example 2: Restrict repeat oversharers from uploading and downloading files
A great existing use case of Cloudflare CASB has been the ability to identify employees that are habitual oversharers of files in their corporate Google or Microsoft tenants – sharing files to anyone that has the link, sharing files with emails outside their company, etc.
Now when these employees are identified, CASB admins can create Gateway policies to block specific users from further upload and download activity until the behavior has been addressed.
Example 3: Prevent file uploads to unapproved, Shadow IT applications
To address the concern of Shadow IT, CASB-originating Gateway policies can be customized, including being able to restrict upload and download events to only the SaaS applications your organization uses. Let’s say your company uses Box as its file storage solution; in just a few clicks, you can use an identified CASB Finding to create a Gateway policy that blocks activity to any file sharing application other than Box. This gives IT and security admins the peace of mind that their files will only end up in the approved cloud application they use.
Get started today with the Cloudflare Zero Trust
Ultimately, the power of Cloudflare Zero Trust comes from its existence as a single, unified platform that draws strength from its combination of products and features. As we continue our work towards bringing these new and exciting offerings to market, we believe that it’s just as important to highlight their synergies and associated use cases, this time from Cloudflare Gateway and CASB.
For those not already using Cloudflare Zero Trust, don’t hesitate to get started today – see the platform yourself with 50 free seats by signing up here.
For those who already know and love Cloudflare Zero Trust, reach out to your Cloudflare sales contact to get started with CASB and Gateway. We can’t wait to hear what interesting and exciting use cases you discover from this new cross-product functionality.
The Internet is a living organism. Technology changes, shifts in human behavior, social events, intentional disruptions, and other occurrences change the Internet in unpredictable ways, even to the trained eye.
Cloudflare Radar has long been the place to visit for accessing data and getting unique insights into how people and organizations are using the Internet across the globe, as well as those unpredictable changes to the Internet.
One of the most popular features on Radar has always been the “Most Popular Domains,” with both global and country-level perspectives. Domain usage signals provide a proxy for user behavior over time and are a good representation of what people are doing on the Internet.
Today, we’re going one step further and launching a new dataset called Radar Domain Rankings (Beta). Domain Rankings is based on aggregated 1.1.1.1 resolver data that is anonymized in accordance with our privacy commitments. The dataset aims to identify the top most popular domains based on how people use the Internet globally, without tracking individuals’ Internet use.
There are a few reasons why we’re doing this now. One is obviously to improve our Radar features with better data and incorporate new learnings. But also, ranking lists are used all over the Internet in all sorts of systems. One of the most used and trusted sources of domain rankings was Alexa, but that service was recently deprecated. We believe we are in a good position to provide a strong alternative.
Let’s see how we built it.
Differences in domain names
Before we dig into the data science behind Domain Rankings, it’s important to understand what a domain and DNS are. Internet domain names are human-readable dot-separated letters, digits and hyphens that correspond to a network resource, like a server or a website. However, your computer and applications don’t know what to do with a domain name; they need IP addresses to send and receive information over the network. DNS is the system that converts, or resolves, a domain name into an IP address. Think of it as an Internet phonebook for domain names.
Note: This is a simplification. A new standard called Internationalized Domain Names, or IDN, allows using Unicode strings in domain names.
Each dot defines a new hierarchy level, reading right to left. Domains can have multiple levels of depth. The highest level corresponds to country code top-level domains (ccTLDs) like .uk, .fr or .pt, or generic top-level domains (gTLDs) like .com, .org, or .net. These are normally assigned to and managed by either country-level entities or administrative organizations operating a registry.
Then there are the second-level domains like cloudflare.com or google.com. These are normally purchased and registered by individuals or organizations, which are then free to create and manage as many hostnames and hierarchy levels as they want.
Unfortunately, however, there are exceptions. For instance, many countries use second-level domain registration. One such example is the United Kingdom, where commercial domains can only be registered under the .co.uk hierarchy. That’s why Google in the UK isn’t google.uk, but rather google.co.uk.
But that’s not all. Some countries use 3rd level domain registrations. One example is Japan, which offers Regional Domain registration under cities like *.aisai.aichi.jp.
Projects like the Public Suffix List are a good starting point for understanding the variations involved, and how they affect validations and assumptions in other systems, such as cookies in web browsers.
Domain Rankings takes some of this nuance into account to inform the definition of our current ruleset:
We boil everything down to second-level domains, such as cloudflare.com or google.com.
However, if the second level is .edu, .com, .org, .gov, .net, .gov, .net, .co or .mil, then we use third-level domains.
We don’t distinguish between what we think is a website or an infrastructure system. A domain represents an Internet-available resource.
We will also semi-automate, curate and maintain a list of domains that map to popular platforms and services in the future. Example: fb.audio, fb.com, fb.watch, all map to a “facebook” platform.
Defining popularity
Definitions are important. We established what we consider a domain, but what does domain popularity mean exactly? Our research showed that the volume of traffic generated to a given domain doesn’t really work as a proxy for what we perceive as popular. Instead, Domain Rankings looks at the size of the population of users that look up a domain per unit of time. The more people who are interested in a domain, the more popular it is.
Sounds pretty straightforward, right? Well, it’s not. Our databases don’t have cookies, IPs, or other tracking artifacts, and we strip information that leads to identifying an individual from all of our data, by design.
The good news, however, is that we do a very good job at identifying automated traffic (for instance, you can read about Bot Management and how we use Machine Learning to detect bots in HTTP traffic in our blog) and we found we could develop a reasonable proxy for the unique users metric without sacrificing privacy (using other data points that we store for a limited period of time, like the ASN and high-level geolocation information of the request or the Cloudflare data center that served it).
Domain Rankings’ popularity metric is best described as the estimated relative size of the user population that accesses a domain over some period of time.
Our approach
We announced 1.1.1.1, our privacy-first consumer DNS resolver in 2018, and over the years it’s grown to become one of the top DNS services in the world. 1.1.1.1 is also part of a Research Agreement with APNIC in which we collaborate with them doing public research and DNS data insights.
The data we collect from it honors our privacy commitments, and is aggregated and stripped of any information that could lead to identifying or tracking users. We conducted a privacy examination by a Big Four accounting firm to determine whether the 1.1.1.1 resolver was effectively configured to meet our privacy commitments. You can read more about it in this blog, and the full report is publicly available on our compliance page.
Even without this personally identifying information, the resulting collection is vast and representative of Internet activity.
The 1.1.1.1 service is used in many ways. Regular (human) Internet users use it as their DNS resolver, either because they explicitly configured it in their devices, or their ISP did, or because they use WARP, or their browser uses 1.1.1.1 under the hood. However, servers and cloud infrastructure, IoT devices, home routers, and bots also use 1.1.1.1 extensively, which creates a lot of challenges for us when trying to identify human traffic.
We’ve been using DNS data to calculate the top and trending domains found on both the global and country pages on Cloudflare Radar. It’s been quite a learning experience trying to improve these lists. We have implemented aggregations, counts, filters, handling exceptions, and tried reducing noise, and yet they’re far from perfect. We felt that there had to be a better way.
We’ve spent the last six months building a variety of machine learning models to help us predict the rank of a domain.
Building the model was no easy feat. We experimented with multiple regression types first, to know exactly what the model was doing, and then more complex algorithms to get better performance. We played with different datasets, changed the population groups, variables (features), and combinations of variables, and used synthetic data.
After evaluation, one of our first conclusions was that building a model that could produce good results for the highest ranked domains and the long tail would be difficult.
The paper “A Long Way to the Top: Significance, Structure, and Stability of Internet Top Lists” describes this problem well. “The ranking of domains in the long tail should be based on significantly smaller and hence less reliable numbers.” Talking to our Research Team who submitted the collaboration paper “Toppling Top Lists: Evaluating the Accuracy of Popular Website Lists” to IMC 2022, got us to the same conclusion: the most popular domains (like google.com and facebook.com) have feature values disproportionally higher than the lower-ranked domains.
Therefore, we selected the two models that performed best. One model was trained on the population with the highest feature values, uses more features, and is used to generate the ordered top 100 domain list. A second model was trained on a more general group of domains, uses fewer features, and is used to get the top one million most popular domains, which we then divide into ranking buckets.
These buckets are ranked, but each bucket’s contents are intentionally unordered. For example, the second bucket of 10,000 most popular domains includes the set of domains that rank from 10,001 to 20,000, but give no further indication of the individual ranking of domains in that bucket. Given the size of some of these buckets and the window of time we use to populate them, they will inherently be exposed to more instability, too. We feel this is a good compromise between the described natural uncertainties of our long tail model and providing a reasonable idea of how close to the top a domain is.
Results
It’s important to mention there is no global view that can establish the perfect rank, and there’s no easy mechanism to confirm if a ranking is, ultimately, good. Data-driven results are always subject to some bias and skewing, related to the context of the organizations and systems that collect them. Sometimes all that can be done is to be transparent about potential sources of bias. The geographical distribution of customers and users, product characteristics, platform features, and behavioral diversity play an essential role in the final result. We are presenting the Cloudflare view, what we see.
Having said this, Cloudflare sits in a privileged position and handles a significant amount of Internet traffic. We have plenty of signals we can extract from our aggregated data, and believe that makes it possible to generate high quality domain rankings.
Domain Rankings are available today. You can head up to the Domains page and check it out:
Ordered list of the top 100 most popular domains globally and per country, based on our first model. Last 24 hours, updated daily.
Unordered global most popular domains datasets divided into buckets of the following sizes: 200, 500, 1,000, 2,000, 5,000, 10,000, 20,000, 50,000, 100,000, 200,000, 500,000, 1,000,000. Last 7 days, updated weekly.
Next steps
We will keep improving Domain Rankings and monitoring the results. Anyone can access them on Cloudflare Radar, read the results, and download the CSV files.
Feel free to explore our Domain Rankings and share feedback with us.
In this blog post, you will learn how to set up backups for your Zabbix environment. There’s a wide variety of different options when it comes to taking backups of our Zabbix environment, for us, it will just be a matter of choosing the right fit.
Introduction
Monitoring is an important part of our IT infrastructure and often times when our monitoring isn’t working for a certain period, we feel like we are blind as to what is going on with our different IT components. As such, taking backups of our Zabbix environment is an important part of running a production Zabbix environment, as we do want to be prepared for a possible issue that might corrupt or even lose our data. It’s always a possibility and as such we should be prepared.
For Zabbix, there are a few different methods on how to take backups and it all starts at the database level. Both the Zabbix frontend as well as the Zabbix server write their data into the Zabbix database as we can see in the illustration below:
This means that both our configuration as well as all of our collected values are present in the same Zabbix database and if we take a database backup, we back up (almost) everything we need. So, let’s start there and have a look at how we can make a database backup.
How to
MySQL backups
Let’s start with the most used variant of Zabbix databases: MySQL and it’s forks like MariaDB and Percona. All of them can easily be backed up using built-in functionality like the MySQLDump command and we can then use other industry standards to get things going. First, we have to understand the tables in our database though. Most of the tables in your Zabbix environment contain configuration data and as such, they are all important to backup. There are a few tables that we need to consider, however, as they can contain Giga or even Terabytes of data. These are the History, Trends and Events tables:
It is possible to omit these tables from your backup and make smaller, more manageable backups. To make the backup we can then start using tools like MySQLDump:
Once we have taken a backup, we can easily import that back into our environment using the MySQLImport command or simply using the cat command:
Do not forget, taking and importing large backups can take a long time. This completely depends on your MySQL database performance tuning settings as well as the underlying resources like CPU, Memory and Disk I/O. Also, make sure to check out the MySQL documentation:
Alternatively, it’s also possible to create backups using tools like xtrabackup and mariadbbackup.
PostgreSQL backups
We can actually use the same kinds of methods for the PostgreSQL backups. Keep the required tables in mind and fire away with the built-in tools:
Then we can restore it by loading the file into postgres:
What about the configuration files?
Once we have a database backup, everything is backed up, right? Well, almost everything. With just a database backup we are quite safe, but (and this is oftentimes overlooked) there are a lot of configuration files and perhaps even custom scripts we need to take into account! There are three parts to this story – the Zabbix server, the Zabbix frontend, and also the Zabbix additional components. All of them have their own set of configuration files and locations that are used for storing custom scripts.
The Zabbix frontend location and configuration files can be different, depending on the environment, as we have a few choices to make. Are we running Apache or Nginx? On what Linux distribution? All of these have to be considered when making configuration backups. In general, the locations for the configuration would be:
/etc/nginx/
/etc/httpd/
/etc/apache2
There’s also a symlink to the Zabbix frontend configuration file located in /etc/zabbix/ but we will get to that one in a bit.
Then we have the Zabbix server itself, which keeps its configuration in /etc/zabbix/ and if we’re following best practices any script should be placed in /usr/lib/zabbix. So we need:
/etc/zabbix/
/usr/lib/zabbix
Let’s add them to the list and find a method to back up these files. Crontab is a built-in tool that we can use, but there are definitely other (perhaps better) solutions out there. Let’s add the following to cron:
I also added a find command here, which will serve as our roll-over or rotation toll. It will find files older than 180 days and delete them from /mnt/backup/config_files/. Make sure to pick a good (network) folder to store these files as it’s important to keep these safe. Feel free to change the number of days you’d like to store the files for.
What about the additional components like Zabbix proxy, Zabbix Java gateway and Zabbix web service (used for PDF reporting)?. Well, these have configuration files as well. Make sure to run a backup on the devices running these additional components. As for Zabbix proxies – they have the same file locations as Zabbix server:
For Zabbix Java gateway and Zabbix web service, we can omit the /usr/lib/zabbix/ folder.
Don’t forget the import/export files!
In general, database backups are slow to make, but also slow to import back unless we do not include the history/trends in the backup. But even then, restoring an entire database simply because someone made an error on a single template is a hassle. Zabbix ships with the built-in frontend export functionality, allowing us to export (and then import) entire parts of the configuration instantly! We can use these for a number of different parts of the configuration:
Hosts
Templates
Media types
Maps
images
Host groups (API ONLY)
Template groups (API ONLY)
All of these are available through the Zabbix API allowing us to choose whether we do a manual configuration backup from the frontend, as well as providing us with automation options using that API. You could even manage and update your Zabbix configuration from GIT entirely if you write the right scripts for this.
Frontend backups
To run an export from the frontend simply go to one of the supported sections like Configuration | Templates and select the export data format. When selecting multiple entities, keep in mind that they will all be exported to a single file.
We can then make our edits and import files from the frontend as well:
For Templates this will even result in a nice diff pop-up window, detailing all the changes, deletes and additions to the templates:
API backups
For the API things get a little more complicated as we need to select a mode of execution. Of course, it’s possible to do a curl command from the CLI or even use something like Postman:
Request body
The response will then look something like this:
But this feature really starts to shine once we combine it with our own automation scripts. Use it wisely!
High availability
So, what about high availability? Isn’t that some form of a backup?
Well yes and no. High availability is not an “IT backup” in the form of making sure we can recover something that is broken. But it is a backup in the way that if a Zabbix server instance fails, another one takes over for it. HA is somewhat out of scope for this blog post, but it’s still worth mentioning. There are several solutions to set up Zabbix as a full high availability cluster. For MySQL we can use a Primary/Primary setup, for the frontend we can use load balancing techniques like HAProxy and for the Zabbix server, we can use the built-in high availability method. Combine all of these together and you’ll definitely be able to serve your every (production ready!) need.
Conclusion
To conclude, there are many options to start taking backups of our Zabbix environment. It all starts at the database and these backups are definitely vital to keep things safe in case of disaster. When making the backups, do not forget about the configuration files and custom scripts as well as the frontend backup option. Combining all of these solutions will safeguard our environment, but if that isn’t enough – do not forget about industry standards like snapshots. Even further safeguarding our environment on multiple levels.
I hope you enjoyed reading this blog post. If you have any questions or need help configuring anything on your Zabbix setup feel free to contact me and the team at Opensource ICT Solutions. We build a ton of cool integrations like this and much more!
„Служебна“ се нарича победа, която не е постигната в състезание, а е присъдена по други, формални критерии. Спорно е дали предстоящите парламентарни избори на 2 октомври ще излъчат отчетлив победител, който да е в състояние да сформира правителство, дори в коалиция. Сигурно е обаче, че те ще произведат все някакви резултати. Акцентът тук е върху „все някакви“. Проблемът е в прецизността, с която ще се измерят. По-точно – в липсата ѝ.
Колко и как са разпределени имащите право на глас?
Отговорът на този въпрос е от съществено значение, защото избирателната активност представлява делът на гласувалите от всички, които имат право на глас. А избирателната активност определя легитимността на бъдещите управляващи, или колко от българските граждани са реално представени в парламента. По нея се мери и тежестта на купения и контролирания вот. Броят на имащите право на глас определя и броя на мандатите (депутатските места) от съответния избирателен район. Ако те са изчислени на неточна база, резултатите са „на око“.
По предварителни данни от преброяването на населението през 2021 г. в България живеят около 6,5 милиона души. В тях влизат не само имащите право на глас, а и непълнолетните, чужденците без българско гражданство, лишените от свобода с влязла в сила присъда, поставените под запрещение – все групи, чиито представители не могат да гласуват.
Официалните резултати от преброяването ще се огласят в особен момент.
Националният статистически институт ще обяви първите официални резултати от преброяването „поради засилен интерес“ на 3 октомври. Това е тъкмо в деня след изборите. Едва тогава ще стане ясно какви биха били резултатите, ако организацията на гласуването беше съобразена с актуалните данни за гласоподавателите на България.
Междувременно според Централната избирателна комисия имащите право на глас са 6,6 милиона, тоест повече от цялото население на България според предварителните резултати от преброяването. От ЦИК обясняват несъответствието със следния аргумент:
6 милиона и 600 хиляди са всички български граждани, които имат избирателни права, във всички части на света. Ако сравняваме с преброяването – в него участват всички граждани на територията на България.
Ала откъде ЦИК знае колко са българските граждани в чужбина? И съответно тези от тях с право на глас?
Държавата ни няма инструмент, с който да води точен регистър на броя им. А и като се замислим, това не е лесна работа. Много български граждани може изобщо да не си направят труда да уведомят държавата, че живеят в чужбина. Още по-малко – че се намират извън родната си страна към момента на провеждане на изборите.
България няма как да изиска достоверна информация от властите на всички държави за това колко български граждани се намират на територията им. А такава информация е възможно и да липсва – например ако наш сънародник пребивава в страна членка на ЕС, може до три месеца да не регистрира престоя си. На практика – и доста по-дълго. Ако български гражданин в чужбина почине, българските институции може така и да не разберат.
За броя на гласоподавателите, съобщен от ЦИК, има по-логично обяснение.
Избирателните списъци се съставят на основата на данните на Главна дирекция „Гражданска регистрация и административно обслужване“ (ГРАО) към Министерството на регионалното развитие и благоустройството. Според последните данни на ГРАО от 15 септември 2022 г. с постоянна адресна регистрация в България са 8 258 712 души. Това е сборът на регистрираните по постоянен адрес във всички 28 области на страната. Като извадим от тях „на око“ нямащите право на глас, обявените от ЦИК 6,6 милиона придобиват известен смисъл.
Защо регистрираните в системата на ГРАО са с над 1,7 милиона повече от населението на България според преброяването, като имаме предвид, че то поне на теория обхваща и бездомните, а не само тези с адресна регистрация? НСИ се опитва да установи колко хора действително живеят в България. Мнозина имат постоянен адрес, на който не живеят. Това важи и за немалка част от българите в чужбина. Други от тях обаче не са адресно регистрирани у нас. Така че тези 1,7 милиона не отговарят непременно на броя на сънародниците ни извън страната.
А колко са точни резултатите от преброяването?
В България отдавна не живеят над 8 милиона души, но каква е гаранцията, че при последното преброяване е установен реалният брой на населението? Много хора не са взели участие в преброяването – било от недоверие, било заради пандемията, било защото хазяите са им забранили, защото се страхуват, че така може да ги хванат, че не плащат данъци (това впрочем е широко разпространен проблем), било по други причини.
Според НСИ преброените към предпоследния ден на преброителната кампания са 6,62 милиона, или около 82% от населението. Останалите ще бъдат „обхванати по административен път“, тоест вероятно чрез бази данни като тази на ГРАО. Възниква обаче логичният въпрос – откъде НСИ знае колко е населението, че да може да изчисли 82% от него? Та нали целта на преброяването е именно да се установи колко и какви хора живеят в България? Ако това е предварително известно на НСИ, защо е цялото усилие? (Друг е въпросът за някои от формулировките в преброителната карта, които изначално гарантират некоректни резултати по някои признаци – като например етнос, майчин език или религия.)
И все пак, при цялата си условност, резултатите от преброяването по всяка вероятност са по-коректни от данните на ГРАО, защото има поне опит за връзка с реалното население на страната. С помощта на преброяването се добива по-ясна представа и за разпределението на хората в България по райони – нещо, което тромавата система на адресните регистрации изключително изкривява.
Кой губи от неточната статистика на населението?
Ако разпределението на избирателните мандати отговаря на структурата на населението според последното преброяване, поне 15 мандата ще се разместят, а 11 от тях ще отидат в София, установява разследване на Полина Паунова в „Капитал“. Причината е, че от предишното преброяване през 2011 г. населението в цялата страна е намаляло, освен в София, където се е увеличило. Така, вместо 42-ма, депутатите от трите софийски избирателни района биха били общо 53-ма.
От това губи най-вече „Демократична България“, чиито гласоподаватели са концентрирани основно в София. На изборите за 46-тото Народно събрание ДБ дори е първа политическа сила в два от трите избирателни района в столицата. Губи и „Продължаваме промяната“ – на изборите за 47-мото НС най-големият дял от избирателите ѝ е в София.
От неточната статистика обаче губят и партии, които остават под ръба на 4-процентовата бариера. Понякога и една стотна от процента може да бъде решаваща за това дали една политическа сила ще има парламентарно представителство. Или ще вземе субсидия. Като се има предвид, че бариерата е повече или по-малко условна, обяснимо би било недоволството у некласираните.
Най-големите губещи обаче са избирателите. Защото те ще бъдат неадекватно представени не (само) заради спецификата на политическите партии и в резултат на собствения си избор, а и заради формални математически несъответствия. И колкото и да им се натяква, че сами са си виновни, поне за последното не са.
Компаниите, които са се облагодетелствали от авансите за АМ „Хемус“, без да са завършили строителните работи, гонят екипа на „Биволъ“ от строежа на скоростния път „Видин – Ботевград“. Медията ни…
Финалът на предизборната кампания в България съвпадна с поредните новини за руската агресия в Украйна. В разрез с първоначално обявените принципи на „операцията“, които предвиждаха само професионални военнослужещи да изпълняват мисии в Украйна, на 21 септември Владимир Путин обяви „частична“ мобилизация, която да се извърши успоредно с референдуми в окупираните украински територии. В България новината стана повод за нов залп от анализи на познати лица по радиа и телевизии. Няма да коментираме българските реакции, защото те в най-добрия случай са неадекватни. Докато ЕС и САЩ поне към момента заемат твърда позиция и обещават засилване на помощта за Украйна и говорят за остра реакция срещу руския ядрен шантаж, българският предизборен и експертен дебат се върти около славянската идентичност и нашата историческа принадлежност.
С решението си Владимир Путин за момента отне инициативата от Украйна, която само дни преди това успешно си върна Харковска област. Анонсирането на „частичната“ мобилизация от Путин бе последвано от кампанийно медийно отразяване, чийто акцент е върху хилядите бягащи от страната руснаци. Към момента данните сочат, че около 260 000 са напуснали Русия. Медиите излъчват кадри и на жени, които със сълзи изпращат мъжете си. Заслужава внимание фактът, че значително по-малко в медийното пространство намират място иначе изобилните кадри на вече мобилизирани руснаци, които примирено приемат повиквателните си и облекли своите униформи, се отправят на запад. Най-често тези кадри се заменят от клипове на пияни мобилизирани руснаци.
Ако се отстраним обаче от медийната суматоха, следва да отбележим, че
надеждите, че мобилизацията ще доведе до бързия край на режима на Путин, вероятно са твърде преувеличени.
Все още протестите срещу решението на руския президент са малко и е рано да се каже дали могат да прераснат в по-сериозен бунт. Множеството истории за мобилизиране на неподлежащи на военна служба млади неслужили, болни или възрастни мъже и призивите тези грешки да бъдат поправени по-скоро целят да заблудят обществото в Русия и да го накарат да повярва в бащинската грижа на държавата пред лицето на абсурда. Историческите паралели сами ни идват на помощ. След като подобно поведение е проработило при Сталин, защо да не проработи и сега? А не бива да забравяме, че в периода на т.нар. Гладомор и на голямата чистка през 30-те години на XX век загиват десетки милиони.
Много е важно да отбележим, че официалните руски власти оценяват мобилизационния потенциал на страната на около 25 млн. мъже. Когато поставим нещата в тази перспектива, ситуацията вече не предразполага към бързо изостряне на ситуацията вътре в Русия заради мобилизацията. Процентът на избягалите е наистина малък в сравнение с общия брой военнозадължени. Освен това руската армия по този начин се чисти от възможни подривни елементи, които биха разлагали бойния дух на войниците на фронта, както е станало по време на Първата световна война.
Друга тенденция, която заслужава внимание след обявената мобилизация, е да се осмива качеството на руските военнослужещи и тяхното снабдяване. Тази тенденция е доста опасна форма на подценяване на врага. Да не забравяме, че един милион дори лошо обучени и зле екипирани мъже представляват в крайна сметка един милион въоръжени мъже. Те може да не са в състояние да изпълнят задачите на една активна настъпателна операция или да създадат основа за надеждна отбрана, но все пак
чрез своя внушителен брой представляват фактор и сила, който никой професионален военен няма да си позволи да пренебрегне.
Към момента Украйна не разполага с необходимото техническо превъзходство, за да се справи с лекота с тази по същество нова военна сила, така както например САЩ надви в Ирак през 2003 г. голямата по численост, но напълно деморализирана армия на Саддам Хюсеин. Именно поради тази причина главнокомандващият украинските въоръжени сили ген. Валерий Залужни заяви, че войната ще бъде дълга и Украйна трябва да се готви и за следващия ѝ етап. Тук бихме могли да се застраховаме и да кажем, че е възможно рязко ескалиране на ситуацията заради един или друг инцидент. В крайна сметка и през 1979 г. никой в Западна Европа не е вярвал, че в Иран на Пахлави е възможна революция, но историята показа, че къщата от карти, построена от шаха, се срути за броени дни.
Непосредствени паралели с историческото минало трябва да се правят с внимание, тъй като те биха могли да са некоректни. И все пак най-честите паралели за случващото се в Украйна са със събитията от 1914 г. и от 1941 г., когато Русия осъществява своите мащабни мобилизации. Първата завършва с Октомврийската революция, но втората, с огромна външна помощ и въпреки невъобразимите загуби, завършва с победа. Интересно е да отбележим, че днес Украйна получава военна помощ именно по силата на програма „Ленд-лийз“, която помага в огромна степен на СССР преди 80 години срещу нацистка Германия.
В нашето динамично време сме свикнали да очакваме бързи решения.
След 24 февруари се прогнозираше бърз край на украинската държавност и армия. Сега се предрича бърз край на Русия и на Путиновия режим. Усещането за прекомерна бързина на събитията може да бъде измамно. Както не се оправдаха очакванията в началото на конфликта, така и сега няма причина да мислим, че след още едно сериозно поражение руската държава ще се разпадне на части или че ще започнат процеси на модернизация в самата Русия.
Европа ще трябва да се подготви за продължителен конфликт. Дори и военните действия да спрат до средата на следващата година с поражение за Русия, това поражение няма да е пълно – подобно на разгрома на Германия през 1945 г., който доведе до принудителни реформи. Русия няма да премине в скоро време през процес на „денацификация“, което означава, че желанието за реванш и „можем повторить“ ще останат силни и ще доведат до нов рунд от военни действия.
Важно е да не се забравя, че Русия винаги е воювала с броя на войниците си
и е прието жертвите да бъдат големи, стига да се постигне целта. Руските власти са готови да жертват хората си и това не ги притеснява. Самите руснаци, свикнали да се подчиняват на Върховната власт, не смятат, че нещо зависи от тях, и са готови да приемат и най-страшните за западните хора решения в името на величието на държавата. Надеждите за успех на протестите поне в краткосрочен план са неоправдани. Виждаме как за пореден път протестиращи са извличани от силовите структури без дори минимален опит за съпротива. Към момента „дълбинният народ“ не се противопоставя на мобилизацията. Именно поради тази причина европейските политически лидери и общества трябва да преосмислят приоритетите си и начините за постигане на своите цели.
В България е необходимо да се намали силата на звука на руската пропаганда и да се проведе истинска дискусия за нашите приоритети и виждания за бъдещето. Ако се стигне до национален консенсус, че бъдещето ни не е свързано неотклонно с Русия, то трябва да се набележи списък от краткосрочни и дългосрочни мерки за опазване на европейското ни бъдеще. Част от краткосрочните мерки включват спешно изпращане на военна помощ за Украйна и замяна на остарялото ни съветско въоръжение с модерно западно.
Много важна тук е и подготовката на въоръжените ни сили. Както виждаме от конфликта, това, че разполагаш с повече танкове и самолети, не ти гарантира победата. Обучението и бойният дух на войската винаги са били водещи за победата. Тревожен е броят на български висши военни на активна служба или в оставка, които с изказванията си недвусмислено демонстрират подкрепа за Русия. Време е да се запитаме именно
какво става в редовете на българската армия и каква е нейната готовност по отношение на националния суверенитет и сигурност на България.
Ако историята ни учи на нещо, то е, че не можем с увереност да очакваме непременно благоприятен развой на събитията. Както уместно припомня Аркадий Бабченко, след Николай Втори идват Ленин и Сталин. Възможността след Владимир Путин да дойде на власт някой по-страшен не бива да се пренебрегва. Какво ще бъде руското поведение към Запада, ако на трона в Москва застане Рамзан Кадиров или някой шовинист като Игор Гиркин-Стрелков? Тогава вътрешната съпротива ще бъде докрай смазана или ще избухне с пълна сила гражданска война.
В дългосрочен план вътрешната ситуация ще се промени, но Путин, като един истински възпитаник на спецслужбите, има афинитет към дългосрочната игра. След провала на внезапното завладяване на Киев, Москва премина към война на изтощение, надявайки се, че по познатия от Сирия сценарий ще удържи. Русия има по-големи човешки и материални ресурси от Украйна и целенасочено разрушава икономиката ѝ и гони с терор населението.
В момента Западът все повече засилва помощта за Украйна и постепенно настъпва паритет, показан с успешното украинско настъпление в Балаклея и Изюм. Тук обаче следва да си зададем въпроса
докога тази подкрепа ще продължи.
Никой не може да каже какъв ще е обемът ѝ след година или две. Руският президент разчита на милионите, с които Москва тайно финансира политически партии и проекти в ЕС и САЩ, да демонстрират своята полза. По примера на България, не са малко онези, включително и водещи политически сили, които говорят за „мирно решение на конфликта с отчитане интересите и на двете страни“. Духът на наратива за неутралитет е извън бутилката и удобно гали слуха на множеството, което е стъписано от цената на енергийните ресурси, обяснени единствено с недалновидността на „брюкселските чиновници“.
Всичко това, заедно с инфлацията и икономическите трудности, трябва да доведе до нестабилност в Европа, която да се откаже от помощта за Украйна и в най-добрия случай да я принуди да приеме мир при неизгодни за нея условия. С две думи, повтаряне на сирийския сценарий в по-голям мащаб – воюваш достатъчно дълго, докато в един момент никой не си спомня как е започнала войната, но всички искат живи да видят нейния край, ако трябва да поспорим с Платон.
Всичко, което се случва, е понякога учудващо близко до паралелите с Втората световна война.
Действията на Владимир Путин силно напомнят плана на Сталин преди началото на войната, целящ да противопостави западни държави една срещу друга. Към общата картина на създаване на нестабилност може да се отнесе и значителното по обем бягство на руснаци в близките страни. Москва, изчиствайки се от възможните нежелателни елементи, които биха предизвиквали брожение в страната или на фронта, предизвиква напрежение в Европа и съседните на Русия страни. Възможни са спорове с украинските бежанци, проблеми с настаняването и изхранването, а е важно и да се отбележи, че мнозинството от тези хора, подкрепящи „величието на Русия“, просто не са готови да умрат за него.
Москва се опитва да поддържа напрежението и чрез обявените референдуми, които никоя държава не би признала, но чрез тях плаши с възможна употреба на ядрено оръжие. Дали Русия ще използва реално тактическо или стратегическо ядрено оръжие, окончателният отговор е в полето на астролозите и ясновидците. При всички случаи това е една реална заплаха за света, която трябва да бъде разгледана и да бъдат предприети възможните мерки за неутрализирането ѝ или поне за ограничаването на щетите. Важен е също така единен отговор на този шантаж.
В заключение, България продължава да се намира в доста опасно положение – страната ни не подкрепи открито Украйна и по тази причина е гледана с недоверие от своите партньори в ЕС. В същото време не се възползвахме от възможността за модернизация на армията ни чрез предоставяне на въоръжение на Киев. Трудностите с енергийните доставки, комбинирани с руското влияние, пък допълнително могат да ни вкарат в политическа криза. Измъчената ни подкрепа за Украйна ни поставя в затруднено положение в дългосрочен план. Евентуалното бъдещо влизане на Украйна в ЕС може да бъде проблемно за нас и за Съюза предвид нереформираните ѝ институции и ширещата се корупция. Ние обаче няма да сме в позиция да поставяме условия.
On Thursday, September 29, a Vietnamese security firm called GTSC published information and IOCs on what they claim is a pair of unpatched Microsoft Exchange Server vulnerabilities being used in attacks on their customers’ environments dating back to early August 2022. The impact of exploitation is said to be remote code execution. From the information released, both vulnerabilities appear to be post-authentication flaws. According to GTSC, the vulnerabilities are being exploited to drop webshells on victim systems and establish footholds for post-exploitation behavior.
There has been no formal communication from Microsoft confirming or denying the existence of the flaws as of 4:30 PM EDT on Thursday, September 29. Our own teams have not validated the vulnerabilities directly.
Notably, it appears that both vulnerabilities have been reported to (and accepted by) Trend Micro’s Zero Day Initiative (ZDI) for disclosure coordination and are listed on ZDI’s site as “Upcoming Advisories.” This lends credibility to the claim, as does the specificity of the indicators shared in the firm’s blog. You can view the two reported vulnerabilities on this page by searching ZDI’s advisories for ZDI-CAN-18802 and ZDI-CAN-18333.
We are monitoring for additional detail and official communications and will update this blog with further information as it becomes available.
NEVER MISS A BLOG
Get the latest stories, expertise, and news about security today.
Over on the Collabora blog, Marius Vlad writes about the recent Weston 11.0.0 release. Weston is the reference compositor for the Wayland display server protocol. Vlad looks at features of the release, including some things that are being deprecated and removed, as well as features coming in Weston 12.
Color management infrastructure code has landed that allows HDR [high dynamic range] characteristics to be delivered to an HDR-capable monitor by setting-up HDR metadata in a weston.ini configuration file and delivering that to KMS [kernel mode setting]. Once Weston gains the ability to produce HDR content in a future version, it will come naturally supported.
This new version brings in multiple RDP [remote desktop protocol] improvements, like clipboard pasting, various keyboard language support, bumped support for a newer version of FreeRDP library, and many more other improvements and fixes.
In this post, we’ll walk through the best practices to implement before you enable Amazon Macie across all of your AWS accounts within AWS Organizations.
Amazon Macie is a data classification and data protection service that uses machine learning and pattern matching to help secure your critical data in AWS. To do this, Macie first automatically provides an inventory of Amazon Simple Storage Service (Amazon S3) buckets in AWS accounts managed by Macie and identifies S3 buckets with security risks, including unencrypted buckets, publicly accessible buckets, and buckets shared with AWS accounts external to AWS Organizations. Second, Macie applies machine learning and pattern matching techniques to the buckets you select to discover, identify, and create alerts for sensitive data, such as personally identifiable information (PII). With the visibility provided by Macie, you can centrally manage your sensitive data findings across your data estate and automate and take actions on Macie findings.
By enabling Amazon Macie within AWS Organizations, you immediately start receiving the benefits of viewing your Macie policy findings and sensitive data findings from jobs that ran for member AWS accounts. When you enable Macie for member accounts, a service-linked role is created within each member AWS account. Macie uses a service-linked role (AWSServiceRoleForAmazonMacie) to monitor resources on your behalf. The service-linked role has a trust relationship with the Macie service (macie.amazonaws.com). For more information about using Macie in your AWS Organizations architecture, see the AWS Security Reference Architecture (AWS SRA).
The best practices we’ll walk through include how to create least-privilege AWS Identity and Access Management (IAM) policies for Macie-delegated administrators and for security engineers who will use Macie on a day-to-day basis. We’ll also show you how to create classification buckets, provide you with the correct resource permissions to allow the Macie service-linked role in each AWS account, and cover how to troubleshoot common issues.
IAM roles to provision for Amazon Macie
The least-privilege principle is important when managing access to sensitive data within your AWS accounts. In this section, we’ll show you how to create least-privilege IAM roles for the following personas for Macie:
Data administrator
Data security engineers
DevOps/DevSecOps engineer
Macie sensitive data findings reviewer
The personas can vary based on your organization, and this list is primarily meant to serve as an example. You will need to align the appropriate permissions to each role in order to enable Macie with the principle of least privilege. You can create your own customer managed policies after you know the specific permissions required for each persona.
Important: In general, AWS strongly recommends you limit the use of wildcards where possible. However, in some of the persona policies that follow, wildcards are necessary to accomplish the task. To implement the principle of least privilege where wildcards must be used, you should put limits on the resources that the persona can access. You can do this by adding condition keys for Macie; or if you deployed Macie by using AWS Organizations, you can add a condition for aws:ResourceOrgId.
Persona 1: Data administrator
This persona is a data administrator who is responsible for setting up and configuring Macie within AWS Organizations. To enforce separation of duties, this persona is not able to view or access Macie findings. You can perform the following steps to verify that the entity has the required permissions to enable the Macie-delegated administrator, and onboard the member AWS accounts within AWS Organizations. You can find the full procedure for each step by following the links to the Macie User Guide.
It’s important to note that Macie is a Regional service. This means that the designation of a Macie administrator account is a Regional designation. A Macie administrator account in a specific AWS Region can manage Macie for member accounts only in that Region. To centrally manage Macie accounts in multiple Regions, the management account must log in to each Region where the organization uses Macie, and then designate the Macie administrator account in each of those Regions. You can use a single Macie administrator account to centrally manage up to 5,000 AWS accounts.
In the following policy, replace <account-id> with the Macie-delegated administrator account ID.
This persona is a data security engineer who has day-to-day responsibility for reviewing Macie findings or Macie sensitive data discovery job configurations. Depending on your use case, you may need to separate this persona into two distinct personas where one is responsible to view Macie findings and the other to set Macie job configurations. To allow an IAM principal read-only permissions to view the Macie dashboard, configurations, and features, you can use the following policy. To enforce least privilege and restrict the resources to the Macie-delegated administrator, replace <region> with the AWS Region in which the delegated administrator is designated, and replace <account-id> with the Macie delegated administrator account ID.
This persona is a DevOps or DevSecOps engineer who is responsible for building and maintaining applications that run on AWS resources. These application builders typically receive top-level security guidance from central security, and they are directly responsible for the security of the applications that they design, build, and operate in AWS. DevSecOps engineers might need limited additional IAM permissions to configure Macie discovery jobs, depending on how Macie will be used within AWS Organizations. To allow an IAM principal the ability to pause or stop Macie jobs, you can add the following policy. Be sure to replace <region> with the AWS Region in which the delegated administrator is designated, and replace <account-id> with the Macie delegated administrator AWS account number.
This persona is a reviewer (usually a security engineer) who is responsible for investigating the sensitive data associated with Macie findings. There are a number of ways this persona can be set up, based on your specific use case and the needs of your organization. In this section, we will describe two of the options for setting up this persona.
In this option, Macie doesn’t use the Macie service-linked role for your account to perform these tasks. Instead, you use your IAM identity to locate, retrieve, encrypt, and reveal the samples for sensitive findings. You can retrieve and reveal sensitive data samples for a finding if you’re allowed to access the requisite resources and data, and you’re allowed to perform the requisite actions. All the requisite actions are logged in AWS CloudTrail. In the following policy, be sure to replace <account-id>, <region>, and <key-id> with your own values.
Option 2: Create IAM roles to review findings and objects in the same AWS account where objects are located
For a command line utility to help you investigate the sensitive data, you can use the Macie Finding Data Reveal project. The Macie Finding Data Reveal project needs permissions to invoke macie:GetFindings on the account and s3:GetObject on the specific object reported in the finding.
In the following policy, be sure to replace <DOC-EXAMPLE-BUCKET> with the values for the S3 bucket where the finding is reported; and replace <account-id>, <region>, and <key-id> with your own values. You will also need to configure the KMS key and S3 bucket resource policies to allow permissions to your IAM role.
If you use an IAM role in the same AWS account, you can specify permissions to access the object and encryption key by using resource policies, and you can leave off the ReportedS3Object and KMSPermissions statement ID (Sid).
Apply SCPs to restrict unauthorized changes to Macie
After you create the personas, you need to verify that the Macie configurations to manage Macie members within AWS Organizations are only updated by authorized IAM principals. The following is an example service control policy (SCP) that you can use to prevent users from disabling Macie, or from modifying Macie configurations within the organization. Make sure to replace <account-id> and <data-admin-role-name> with your own values for the authorized IAM principal.
Allow the Macie service-linked IAM role to scan S3 objects
When Macie analyzes files, it needs permissions to analyze encrypted files. This is important so that you don’t have blind spots in your data protection initiatives.
Before you run a Macie job against S3 objects, make sure that existing KMS keys that are used to encrypt the S3 buckets also grant the Macie service-linked IAM role in the AWS account the necessary permissions to decrypt the S3 objects. For more information, see Service-linked roles for Amazon Macie. To confirm that Macie can scan encrypted objects, the associated KMS key resource policies must allow the Macie service-linked role to use the KMS key to decrypt objects.
Furthermore, depending on the object’s type of encryption, Macie might not be able to fully scan the object. The following table summarizes types of object encryption and the ability Macie has to scan the object. For more information, see Macie supported encryption types.
S3 object encryption type
Macie scan ability
Client-side encryption
Macie cannot decrypt and analyze the object. Macie can only store and report metadata for the object.
Server-side encryption with Amazon S3 managed keys (SSE-S3)
Macie can decrypt and analyze the object.
Server-side encryption with AWS managed AWS KMS encryption (AWS-KMS)
Macie can decrypt and analyze the object.
Server-side encryption with customer managed AWS KMS encryption (SSE-KMS)
Macie can decrypt and analyze the object if Macie is authorized to use the KMS key. Otherwise, Macie can only store and report metadata for the object.
Server-side encryption with customer provided key (SSE-C)
Macie cannot decrypt and analyze the object. Macie can only store and report metadata for the object.
The Macie service-linked role (AWSServiceRoleForAmazonMacie) is not authorized to decrypt S3 objects in Macie member accounts, because no resource-based policy allows the kms:Decrypt action. Check for the following error message in AWS CloudTrail if the AWS KMS resource-based policy implicitly denies the Macie service-linked role. Your error message will show <account-id> and <region> as your own values.
sourceIPAddress: "macie.amazonaws.com" and eventSource : "kms.amazonaws.com" and eventName : "Decrypt" and errorCode : "AccessDenied" Filter the results by error message: “User: arn:aws:sts::<account-id>:assumed-role/AWSServiceRoleForAmazonMacie/classifier-content-fetcher is not authorized to perform: kms:Decrypt on resource: arn:aws:kms:<region>:key/key-id because no resource-based policy allows the kms:Decrypt action…”
In order to remediate a KMS implicit deny error for a customer-managed key, add the following to the customer managed key policy. Be sure to replace <account_name> with your own value.
The Macie service-linked role (AWSServiceRoleForAmazonMacie) is not authorized to decrypt S3 objects in Macie member accounts, because resource-based policies explicitly deny the kms:Decrypt action for the Macie service-linked role. Check for the following error message in AWS CloudTrail if the AWS KMS resource-based policy explicitly denies the Macie service-linked role. Your error message will show <account_name> and <region> as your own values.
sourceIPAddress : "macie.amazonaws.com" and eventSource : "kms.amazonaws.com" and eventName : "Decrypt" and errorCode : "AccessDenied" Filter the results by error message:
 “User:arn:aws:sts::<account_name>:assumed-role/AWSServiceRoleForAmazonMacie/classifier-content-fetcher is not authorized to perform: kms:Decrypt on resource: arn:aws:kms:<region>:key/key-id with an explicit deny in resource-based policy…”
In order to remediate a KMS explicit deny error, update the policy statement to allow the Macie service-linked role access to decrypt and describe key actions. Be sure to replace <account_name> with your own value.
The Macie service-linked role (AWSServiceRoleForAmazonMacie) is explicitly denied in the S3 bucket policy. Check for the following error messages in AWS CloudTrail for S3 explicit deny.
userIdentity.sessionContext.sessionIssuer.userName: "AWSServiceRoleForAmazonMacie" and eventSource: "s3.amazonaws.com" and eventName: " GetBucketEncryption" and errorcode: “ServerSideEncryptionConfigurationNotFoundError” and errormessage: “The server side encryption configuration was not found” OR userIdentity.sessionContext.sessionIssuer.userName: "AWSServiceRoleForAmazonMacie" and eventSource: "s3.amazonaws.com" and eventName: "GetBucketReplication" and errorcode: " ReplicationConfigurationNotFoundError" and errormessage: “The replication configuration was not found” OR userIdentity.sessionContext.sessionIssuer.userName: "AWSServiceRoleForAmazonMacie" and eventSource: "s3.amazonaws.com" and eventName: " GetBucketTagging" and errorcode: " NoSuchTagSet" and errormessage: “The TagSet does not exist” OR userIdentity.sessionContext.sessionIssuer.userName: "AWSServiceRoleForAmazonMacie" and eventSource: "s3.amazonaws.com" and eventName: "GetBucketAcl" and responseElements: "null" OR userIdentity.sessionContext.sessionIssuer.userName: "AWSServiceRoleForAmazonMacie" and eventSource: "s3.amazonaws.com" and eventName: " GetBucketPublicAccessBlock" and responseElements: "null" OR userIdentity.sessionContext.sessionIssuer.userName: "AWSServiceRoleForAmazonMacie" and eventSource: "s3.amazonaws.com" and eventName: "GetBucketLocation" and responseElements: "null" OR userIdentity.sessionContext.sessionIssuer.userName: "AWSServiceRoleForAmazonMacie" and eventSource: "s3.amazonaws.com" and eventName: "GetBucketVersioning" and responseElements: "null" OR userIdentity.sessionContext.sessionIssuer.userName: "AWSServiceRoleForAmazonMacie" and eventSource: "s3.amazonaws.com" and eventName: " GetBucketPolicy" and errorcode: "NoSuchBucketPolicy" and errormessage: “The bucket policy does not exist” OR userIdentity.sessionContext.sessionIssuer.userName: "AWSServiceRoleForAmazonMacie" and eventSource: "s3.amazonaws.com" and eventName: " GetBucketEncryption" and responseElements: "null" OR userIdentity.sessionContext.sessionIssuer.userName: "AWSServiceRoleForAmazonMacie" and eventSource: "s3.amazonaws.com" and eventName: " GetBucketPolicy" and responseElements: "null"
Note: Nearly all S3 explicit deny and S3 object ownership error messages have the same event names. See the Ensure S3 and KMS resource policy compliance section in this post to view the S3 object ownership setting.
Macie cannot decrypt and analyze S3 objects if there is an explicit deny in the S3 bucket policy. The following is an example of an S3 bucket policy that explicitly denies the Macie service-linked role. Be sure to replace <DOC-EXAMPLE-BUCKET> and <account_id> with your own values.
Macie can decrypt and analyze S3 objects if there is no explicit deny in the S3 bucket. The following is an example of the permission for the S3 bucket policy to explicitly allow the Macie service-linked role to have access to your S3 bucket. Be sure to replace <DOC-EXAMPLE-BUCKET> and <account-id> with your own values.
Macie is unable to scan S3 objects that are owned by another AWS account, due to access control list (ACL) settings and permissions. Event names are identical for both S3 explicit deny errors and S3 Object Ownership errors. S3 explicit deny has the following additional two event names.
userIdentity.sessionContext.sessionIssuer.userName: "AWSServiceRoleForAmazonMacie" and eventSource: "s3.amazonaws.com" and eventName: " GetBucketEncryption" and errorcode: “ServerSideEncryptionConfigurationNotFoundError” and errormessage: “The server side encryption configuration was not found” OR userIdentity.sessionContext.sessionIssuer.userName: "AWSServiceRoleForAmazonMacie" and eventSource: "s3.amazonaws.com" and eventName: " GetBucketPolicy" and errorcode: "NoSuchBucketPolicy" and errormessage: “The bucket policy does not exist”
The S3 Object Ownership feature has the following three settings that you can use to control ownership of objects that are uploaded to your bucket, and to disable or enable ACLs. We recommend that you disable ACLs on your S3 buckets.
Bucket owner enforced (recommended) – ACLs are disabled, and the bucket owner automatically owns and has full control over every object in the bucket. ACLs no longer affect permissions to data in the S3 bucket. The bucket uses policies to define access control.
Bucket owner preferred – The bucket owner owns and has full control over new objects that other accounts write to the bucket with the bucket-owner-full-control canned ACL.
Object writer (default) – The AWS account that uploads an object owns the object, has full control over it, and can grant other users access to it through ACLs.
In order to remediate an S3 object ownership issue, there are two options available:
Option 1: Change object ownership settings to bucket owner enforced (recommended). When you disable ACLs, it changes the ownership of existing objects to the bucket owner account. You should consider the following scenarios prior to changing the S3 Object Ownership setting.
S3 objects in the source bucket (account A) are encrypted with a customer-managed key, and you copy the object in the destination bucket (account B) that has the object writer object ownership setting and its own customer managed key. If you copy S3 objects from the source bucket (account A) to the destination bucket (account B), and you do not specify a customer-managed key to use during the copy command, and the object ownership setting in the destination bucket (account B) is bucket owner enforced (ACLs disabled), then this will result in an object ownership change to bucket owner. These actions will also set the object’s server-side encryption to use the encryption settings in the destination bucket (account B).
However, if you specify a customer-managed key during the S3 copy command, then the object’s server-side encryption remains with the source bucket account (account A) customer managed key.
Option 2: Use S3 batch operations to copy objects and set ACLs. Changing the object ownership
setting to bucket owner preferred only applies to new objects and not the existing objects. You can use one one-time batch operation to set ACLs on existing objects.
Ensure S3 and KMS resource policy compliance
Another best practice to follow when you enable Macie with AWS Organizations is to use Macie to verify your organization’s policy compliance for S3 objects and KMS resources. In the Macie-delegated admin account, the summary page provides an overview of S3 data and security and access control in your organization in AWS Organizations. Users can view information about S3 security posture, such as whether S3 buckets are public or not, server-side encryption of S3 buckets, and whether S3 buckets are shared inside or outside of your organization. Data privacy and compliance groups can get organization-wide visibility across their accounts and buckets.
Your organization is responsible for introducing guardrails based on your organization’s security policies. To automate compliance checks for S3 objects and KMS resources, make sure to update your continuous integration and continuous deployment (CI/CD) pipeline. This will allow you to set up continuous compliance checks for the Macie service-linked role by using tools like CloudFormation Guard or Open Policy Agent.
In order to check S3 object ownership settings, you can use AWS Command Line Interface (AWS CLI) commands to view bucket ownership settings. Currently, Macie and AWS Config do not report on S3 object ownership as part of the resource configuration. You can run the following AWS CLI command in AWS accounts within AWS Organizations, making sure to replace <DOC-EXAMPLE-BUCKET> with your own value, to view bucket ownership settings. This can be scripted to list all AWS accounts within AWS Organizations, list all S3 buckets within the AWS account, then get the bucket ownership configuration.
After checking these ownership settings, you can run the following AWS CLI commands to view the S3 objects ownership settings, making sure to replace <DOC-EXAMPLE-BUCKET> with your own value.
You should also consider the following recommendations before you enable Macie, so that you can manage Macie findings and member accounts efficiently at scale:
Enable Security Hub Region aggregation to consolidate Macie findings in a single Region.
Ingest logs from AWS CloudWatch Logs to enable custom alerting for Macie sensitive data discovery job results.
In Macie settings, turn on the Auto-enable setting. That way, Macie will automatically be enabled for new accounts when the accounts are added to your organization in AWS Organizations.
Store sensitive data discovery results in an S3 bucket, with default encryption enabled, after you have configured your Macie delegated administrator account.
Conclusion
In this blog post, we walked you through the best practices to implement before you enable Amazon Macie across your AWS accounts within AWS Organizations. In order to efficiently use Macie within AWS Organizations, it is important to understand why failures can occur, how to investigate the logs, and how to remediate the issues for both existing and future resources.
Now that you have a better understanding of how to prepare for using Macie, try running a Macie sensitive data discovery job. The next aspect to start thinking about is how to review and respond to Macie findings. You can deploy another solution to automatically send notifications with Slack when Macie findings are generated.
If you have feedback about this post, submit comments in the Comments section below. If you have any questions about this post, start a thread on the Amazon Macie forum.
Want more AWS Security news? Follow us on Twitter.
The GDB debugger has a long
history; it was first created in 1986. It may thus be
unsurprising that some GDB development happens over relatively long time
frames but, even when taking that into account, the existence of an open
bug first reported in
2007 may be a little surprising. At the 2022 GNU Tools Cauldron,
GDB maintainer Pedro Alves talked about why this problem has been difficult
to solve, and what the eventual solution looks like.
Welcome back to The Lost Bots! In this episode, we dive into one of our favorite topics: threat hunting. It’s a subject we’ve talked about before, but this time, we’re focusing on the practical side of getting your threat hunting efforts up and running.
Our hosts Stephen Davis, Lead D&R Sales Technical Advisor, and Jeffrey Gardner, Detection and Response Practice Advisor, give us the basics of what a threat hunting hypothesis is and what makes a good one. They talk about the importance of ensuring your hypothesis is both observable and testable. They also cover the differences between intelligence-driven, situational, and domain expertise hypotheses, and explain how to actually put these concepts into action when engaging in cyber threat hunting.
Check back with us on Thursday, October 26, for our next installment of The Lost Bots!
Organizations in many sectors and verticals have user bases to whom they send transactional SMS messages such as OTPs (one-time passwords), Notices, or transaction/purchase confirmations, among other things. Amazon Pinpoint enables customers to send transactional SMS messages to a global audience through a single API endpoint, and the messages are routed to recipients by the service. Amazon Pinpoint relies on downstream SMS providers and telecom operators to deliver the messages to end user’s device. While most of the times the SMS messages gets delivered to recipients but sometimes these messages could not get delivered due to carrier/telecom related issues which are transient in nature. This impacts customer’s brand name. As a result, customers need to implement a solution that allows them to retry the transmission of SMS messages that fail due to transitory problems caused by downstream SMS providers or telecom operators.
In this blog post, you will discover how to retry sending unsuccessfully delivered SMS messages caused by transitory problems at the downstream SMS provider or telecom operator side.
Prerequisites
For this post, you should be familiar with the following:
The architecture depicted below is a potential architecture for re-sending unsuccessful SMS messages at real time. The application sends the SMS message to Amazon Pinpoint for delivery using sendMessge API. Pinpoint receives the message and returns a receipt notification with the Message ID; the application records the message content and ID to a Datastore or DynamoDB. Amazon Pinpoint delivers messages to users and then receives SMS engagement events. The same SMS engagement events are provided to Amazon Kinesis Data Streams which as an event source for Lambda function that validates the event type, If the event type indicates that the SMS message was unable to be sent and it make sense to retry, the Lambda function logic retrieves respective “message id” from the SMS events and then retrieves the message body from the database. Then it sends the SMS message to Amazon Pinpoint for redelivery, you can choose same or an alternative origination number as origination identity while resending the SMS to end users. We recommend configuring the number of retries and adding a retry message tag within Pinpoint to analyse retries and also to avoid infinite loops. All events are also sent to Amazon Kinesis Firehose which then saved to your S3 data lake for later audit and analytics purpose.
Note: The Lambda concurrency and DynamoDB WCU/RCUs need to be provisioned accordingly. The AWS CloudFormation template provided in this post automatically sets up the different architecture components required to retry unsuccessful SMS messages
At the same time, if you use Amazon Kinesis Firehose delivery stream instead of Kinesis data stream to stream data to a storage location, you might consider utilising Transformation lambda as part of the kinesis Firehose delivery stream to retry unsuccessful messages. The architecture is as follows; application sends the SMS payload to Amazon Pinpoint using SendMessage API/SDK while also writing the message body to a persistent data store, in this case a DynamoDB database. The SMS related events are then sent to Amazon Kinesis Firehose, where a transformation lambda is setup. In essence, if SMS event type returns no errors, the event is returned to Firehose as-is. However, if an event type fails and it makes sense to retry, lambda logic sends another SendMessage until the retry count (specified to 5 within the code) is reached. If just one retry attempt is made, S3 storage is not loaded with an event (thus the result=Dropped). Since Pinpoint event do not contain actual SMS content, a call to DynamoDB is made to get the message body for a new SendMessage.
Amazon Pinpoint provides event response for each transactional SMS communications for retrying unsuccessful SMS connections, there are primarily two factors to consider in this architecture. 1/ Type of event (event_type) 2/ Record Status (record_status). So whenever the event_type is “_SMS.FAILURE” and record_status is any of “UNREACHABLE”, “UNKNOWN”, “CARRIER_UNREACHABLE”, “EXPIRED”. Then surely customer application need to retry the SMS message delivery. Following pseudo code snippet explains the conditional flow for failed SMS sending logic within the lambda function.
Prerequisite tasks to be completed before deploying the logging solution
Go to CloudFormation Console and Click Create Stack.
Select Amazon S3 Url redio button and provide the cloud formation link.
Click Next on Create Stack screen.
Specify Stack Name, for example “SMS-retry-stack”
Specify event stream configuration option, this will trigger the respective child cloud formation stack . There are three Event stream configuration you can choose from.
No Existing event stream setup – Select this option if you don’t have any event stream setup for Amazon Pinpoint.
Event stream setup with Amazon Kinesis Stream – Select this option if your Amazon Pinpoint project already have Amazon Kinesis as event stream destination.
Event stream setup with Amazon Kinesis Firehose – Select this option if you have configured Kinesis Firehose delivery stream as event stream destination.
Specify the Amazon Pinpoint project app ID (Pinpoint project ID), and click Next.
Click Next on Configure stack options screen.
Select “I acknowledge that AWS CloudFormation might create IAM resources” and click Create Stack.
Wait for the CloudFormation template to complete and then verify resources in the CloudFormation stack has been created. Click on individual resources and verify.
Parent stack-
Child Stack –
As described in the architectural overview session, the maxRetries configuration inside “RetryLambdaFunction” ensures that unsuccessful SMS messages are tried resending repeatedly. This number is set to 3 by default.” If you want to adjust the maxRetry count, go to the settings “RetryLambdaFunction” and change it to the desired number.
Notes :- The Cloudformation link in the blog specifically points to the parent cloudformation template, which has links to the child Cloudformation stack, these child stacks will be deployed automatically as you go through the patent stack.
Testing the solution
You can test the solution using “PinpointDDBProducerLambdaFunction” and SMS simulator numbers . PinpointDDBProducerLambdaFunction has sample code that shall trigger the SMS using Amazon Pinpoint.
Now follow the steps below to test the solution.
Go to environment variables for PinpointDDBProducerLambdaFunction
Update “destinationNumber” and “pinpointApplicationID,” where destination number is the recipient number for whom you wish to send the SMS as a failed attempt and Amazon Pinpoint application id is the Pinpoint Project ID for which the Pinpoint SMS channel has already been configured.
Deploy and test the Lambda function.
Check the “Pinpoint Message state” DyanamoDB table and open the Latest table ITEM.
If you observe the table Items, it states the retry_count=2 (SMS send retry has been attempted 2 times and all_retries_failed=true ( for both of the times the SMS could not get delivered.)
Notes :
If existing Kinesis stream has pre-defined destination lambda then current stack will not replace it but exit gracefully.
If existing Kinesis firehose has pre-existing transformation lambda then current stack shall not replace the current stack.
Remarks
This SMS retry solution is based on best effort. This means that the solution is dependent on event response data from SMS aggregators. If the SMS aggregator data is incorrect, this slotion may not produce the desired effec
Cost
Considering that the retry mechanism is applicable for 1000000 unsuccessful SMS messages per month, this solution will approximately cost around $20 per month. Here is AWS calculator link for reference
Clean up
When you’re done with this exercise, complete the following steps to delete your resources and stop incurring costs:
On the CloudFormation console, select your stack and choose Delete.
This cleans up all the resources created by the stack.
Conclusion
In this blog post, we have demonstrated how customers can retry sending the undelivered/failed SMS messages via Amazon Pinpoint. We explained how to leverage the Amazon kinesis data streams and AWS Lambda functions to assess the status of unsuccessful SMS messages and retry delivering them in an automatic manner.
Extending the solution
This blog provides a rightful frame work to Implement a solution to retry sending failed SMS messages. You can download the AWS Cloudformation templates, code, and scripts for this solution from our GitHub repository and modify it to fit your needs.
About the Authors Satyasovan Tripathy works as a Senior Specialist Solution Architect at AWS. He is situated in Bengaluru, India, and focuses on the AWS Digital User Engagement product portfolio. He enjoys reading and travelling outside of work.
Nikhil Khokhar is a Solutions Architect at AWS. He specializes in building and supporting data streaming solutions that help customers analyze and get value out of their data. In his free time, he makes use of his 3D printing skills to solve everyday problems.
Data lakes on Amazon Simple Storage Service (Amazon S3) have become the default repository for all enterprise data and serve as a common choice for a large number of users querying from a variety of analytics and machine learning (ML) tools. Oftentimes you want to ingest data continuously into the data lake from multiple sources and query against the data lake from many analytics tools concurrently with transactional capabilities. Features like supporting ACID transactions, schema enforcement, and time travel on an S3 data lake have become an increasingly popular requirement in order to build a high-performance transactional data lake running analytics queries that return consistent and up-to-date results. AWS is designed to provide multiple options for you to implement transactional capabilities on your S3 data lake, including Apache Hudi, Apache Iceberg, AWS Lake Formation governed tables, and open-source Delta Lake.
Amazon EMR is a cloud big data platform for running large-scale distributed data processing jobs, interactive SQL queries, and ML applications using open-source analytics frameworks such as Apache Spark, Apache Hive, and Presto.
Delta Lake is an open-source project that helps implement modern data lake architectures commonly built on Amazon S3 or HDFS. Delta Lake offers the following functionalities:
Ensures ACID transactions (atomic, consistent, isolated, durable) on Spark so that readers continue to see a consistent view of the table during a Spark job
Scalable metadata handling using Spark’s distributed processing
Combining streaming and batch uses cases using the same Delta table
Automatic schema enforcements to avoid bad records during data ingestion
Time travel using data versioning
Support for merge, update and delete operations to enable complex use cases like change data capture (CDC), slowly changing dimension (SCD) operations, streaming upserts, and more
In this post, we show how you can run open-source Delta Lake (version 2.0.0) on Amazon EMR. For demonstration purposes, we use Amazon EMR Studio notebooks to walk through its transactional capabilities:
Read
Update
Delete
Time travel
Upsert
Schema evolution
Optimizations with file management
Z-ordering (multi-dimensional clustering)
Data skipping
Multipart checkpointing
Transactional data lake solutions on AWS
Amazon S3 is the largest and most performant object storage service for structured and unstructured data and the storage service of choice to build a data lake. With Amazon S3, you can cost-effectively build and scale a data lake of any size in a secure environment where data is protected by 99.999999999% (11 9s) of durability.
Traditionally, customers have used Hive or Presto as a SQL engine on top of an S3 data lake to query the data. However, neither SQL engine comes with ACID compliance inherently, which is needed to build a transactional data lake. A transactional data lake requires properties like ACID transactions, concurrency controls, schema evolution, time travel, and concurrent upserts and inserts to build a variety of use cases processing petabyte-scale data. Amazon EMR is designed to provide multiple options to build a transactional data lake:
Apache Hudi – Apache Hudi is an open-source transactional data lake framework that greatly simplifies incremental data processing and data pipeline development. Starting with release version 5.28, Amazon EMR installs Hudi components by default when Spark, Hive, or Presto are installed. Since then, several new capabilities and bug fixes have been added to Apache Hudi and incorporated into Amazon EMR. Amazon EMR 6.7.0 contains Hudi version 0.11.0. For the version of components installed with Hudi in different Amazon EMR releases, see the Amazon EMR Release Guide.
Apache Iceberg – Apache Iceberg is an open table format for huge analytic datasets. Table formats typically indicate the format and location of individual table files. Iceberg adds functionality on top of that to help manage petabyte-scale datasets as well as newer data lake requirements such as transactions, upsert or merge, time travel, and schema and partition evolution. Iceberg adds tables to compute engines including Spark, Trino, PrestoDB, Flink, and Hive using a high-performance table format that works just like a SQL table. Starting with Amazon EMR release 6.5.0 (Amazon EMR version 6.7.0 supports Iceberg 0.13.1), you can reliably work with huge tables with full support for ACID transactions in a highly concurrent and performant manner without getting locked into a single file format.
Open-source Delta Lake – You can also build your transactional data lake by launching Delta Lake from Amazon EMR using Amazon EMR Serverless, Amazon EMR on EKS, or Amazon EMR on Amazon Elastic Compute Cloud (Amazon EC2) by adding Delta JAR packages to the Spark classpath to run interactive and batch workloads.
Lake Formation governed tables – We announced the general availability of Lake Formation transactions, row-level security, and acceleration at AWS re:Invent 2021. These capabilities are available via new update and access APIs that extend the governance capabilities of Lake Formation with row-level security, and provide transactions over data lakes. For more information, refer to Effective data lakes using AWS Lake Formation, Part 3: Using ACID transactions on governed tables.
Although all these options have their own merits, this post focuses on Delta Lake to provide more flexibility to our customers to build your transactional data lake platform using your tool of choice. Delta Lake provides many capabilities, including snapshot isolation and efficient DML and rollback. It provides improved performance through features like Z-order partitioning and file optimizations through compaction.
Solution overview
Navigate through the steps provided in this post to implement Delta Lake on Amazon EMR. You can access the sample notebook from the GitHub repo. You can also find this notebook in your EMR Studio workspace under Notebook Examples.
Prerequisites
To walk through this post, we use Delta Lake version 2.0.0, which is supported in Apache Spark 3.2.x. Choose the Delta Lake version compatible with your Spark version by visiting the Delta Lake releases page. We create an EMR cluster using the AWS Command Line Interface (AWS CLI). We use Amazon EMR 6.7.0, which supports Spark version 3.2.1.
Set up Amazon EMR and Delta Lake
We use the bootstrap action to install Delta Lake on the EMR cluster. Create the following script and store it into your S3 bucket (for example, s3://<your bucket>/bootstrap/deltajarinstall.sh) to be used for bootstrap action:
Use the following AWS CLI command to create an EMR cluster with the following applications installed: Hadoop, Spark, Livy, and Jupyter Enterprise Gateway. You can also use the Amazon EMR console to create an EMR cluster with the bootstrap action. Replace <your subnet> with one of the subnets in which your EMR Studio is running. In this example, we use a public subnet because we need internet connectivity to download the required JAR files for the bootstrap action. If you use a private subnet, you may need to configure network address translation (NAT) and VPN gateways to access services or resources located outside of the VPC. Update <your-bucket> with your S3 bucket.
We use EMR Studio to launch our notebook environment to test Delta Lake PySpark codes on our EMR cluster. EMR Studio is an integrated development environment (IDE) that makes it easy for data scientists and data engineers to develop, visualize, and debug data engineering and data science applications written in R, Python, Scala, and PySpark. For setup instructions, refer to Set up an Amazon EMR Studio. Alternatively, you can also set up EMR Notebooks instead of EMR Studio.
To set up Apache Spark with Delta Lake, use the following configuration in the PySpark notebook cell:
Create Delta tables. Now you can start running some Spark tests on files converted to Delta format. To do that, we read a public dataset (Amazon Product Reviews Dataset) and write the data in Delta Lake format to the S3 bucket that we created in the previous step.
Read the Amazon Product Reviews Parquet file in the DataFrame (we’re loading one partition for the sake of simplicity):
Check the Amazon S3 location that you specified in deltaPath for new objects created in the bucket. Notice the _delta_log folder that got created in the S3 bucket. This is the metadata directory for the transaction log of a Delta table. This directory contains transaction logs or change logs of all the changes to the state of a Delta table.
You can also set the table location in Spark config, which allows you to read the data using SQL format:
spark.conf.set('table.location', deltaPath)
Query Delta tables with DML operations
Now that we have successfully written data in Amazon S3 in Delta Lake 2.0.0 table format, let’s query the Delta Lake and explore Delta table features.
You can also use standard SQL statements, even though the table has not yet been created or registered within a data catalog (such as a Hive metastore or the AWS Glue Data Catalog). In this case, Delta allows the use of a special notation delta.TABLE_PATH to infer the table metadata directly from a specific location. For tables that are registered in a metastore, the LOCATION path parameter is optional. When you create a table with a LOCATION parameter, the table is considered unmanaged by the metastore. When you issue a DROP statement on a managed table without the path option, the corresponding data files are deleted, but for unmanaged tables, the DROP operation doesn’t delete the data files underneath.
%%sql
SELECT * FROM  delta.`s3://<your-bucket>/delta-amazon-reviews-pds/` LIMIT 10
Update
Firstly, run the following step to define the Delta table:
deltaTable = DeltaTable.forPath(spark, deltaPath)
Now let’s update a column and observe how the Delta table reacts. We update the marketplace column and replace the value US with USA. There are different syntaxes available to perform the update.
%%sql
update delta.`s3://<your-bucket>/delta-hive-amazon-reviews-pds/`
set marketplace = 'US' where marketplace = 'USA'
Test if the update was successful:
deltaTable.toDF().show()
You can see that the marketplace value changed from US to USA.
Delete
GDPR and CCPA regulations mandate the timely removal of individual customer data and other records from datasets. Let’s delete a record from our Delta table.
Check the existence of records in the file with verified_purchase = 'N':
df_delta.filter("verified_purchase = 'N'").show()
Then delete all records from the table for verified_purchase = 'N':
deltaTable.delete("verified_purchase = 'N'")
When you run the same command again to check the existence of records in the file with verified_purchase = 'N', no rows are available.
Note that the delete method removes the data only from the latest version of a table. These records are still present in older snapshots of the data.
To view the previous table snapshots for the deleted records, run the following command:
To view the Delta table history, run the following command. This command retrieves information on the version, timestamp, operation, and operation parameters for each write to a Delta table.
You can see the history in the output, with the most recent update to the table appearing at the top. You can find the number of versions of this table by checking the version column.
In the previous example, you checked the number of versions available for this table. Now let’s check the oldest version of the table (version 0) to see the previous marketplace value (US) before the update and the records that have been deleted:
marketplace is showing as US, and you can also see the verified_purchase = ‘N’ records.
To erase data history from the physical storage, you need to explicitly vacuum older versions.
Upsert
You can upsert data from an Apache Spark DataFrame into a Delta table using the merge operation. This operation is similar to the SQL MERGE command but has additional support for deletes and extra conditions in updates, inserts, and deletes. For more information, refer to Upsert into a table using merge.
Create some records to prepare for the upsert operation we perform in a later stage. We create a dataset that we use to update the record in the main table for "review_id":'R315TR7JY5XODE' and add a new record for "review_id":'R315TR7JY5XOA1':
Now let’s perform the upsert with the Delta Lake merge operation. In this example, we update the record in the main table for "review_id":'R315TR7JY5XODE' and add a new record for "review_id":'R315TR7JY5XOA1' using the data_upsert DataFrame we created:
Notice that for "review_id":'R315TR7JY5XODE', many column values like product_id, product_parent, helpful_votes, review_headline, and review_body got updated.
Schema evolution
By default, updateAll and insertAll assign all the columns in the target Delta table with columns of the same name from the source dataset. Any columns in the source dataset that don’t match columns in the target table are ignored.
However, in some use cases, it’s desirable to automatically add source columns to the target Delta table. To automatically update the table schema during a merge operation with updateAll and insertAll (at least one of them), you can set the Spark session configuration spark.databricks.delta.schema.autoMerge.enabled to true before running the merge operation.
Schema evolution occurs only when there is either an updateAll (UPDATE SET *) or an insertAll (INSERT *) action, or both.
Optimization with file management
Delta Lake provides multiple optimization options to accelerate the performance of your data lake operations. In this post, we show how you can implement Delta Lake optimization with file management.
With Delta Lake, you can optimize the layout of data storage to improve query performance. You can use the following command to optimize the storage layout of the whole table:
deltaTable.optimize().executeCompaction()
To reduce the scope of optimization for very large tables, you can include a where clause condition:
Delta Lake uses Z-ordering to reduce the amount of data scanned by Spark jobs. To perform the Z-order of data, you specify the columns to order in the ZORDER BY clause. In the following example, we’re Z-ordering the table based on a low cardinality column verified_purchase:
Delta Lake automatically collects data skipping information during the Delta Lake write operations. Delta Lake refers to the minimum and maximum values for each column at runtime to accelerate the query performance. This feature is automatically activated and there is no need to make any changes in the application.
Multipart checkpointing
Delta Lake automatically compacts all the incremental updates to the Delta logs into a Parquet file. This checkpointing allows faster reconstruction of the current state. With the SQL configuration spark.databricks.delta.checkpoint.partSize=<n>, (where n is the limit of number of actions, such as AddFile), Delta Lake can parallelize the checkpoint operation and write each checkpoint in a single Parquet file.
Clean up
To avoid ongoing charges, delete the S3 buckets and EMR Studio, and stop the EMR cluster used for experimentation of this post.
Conclusion
In this post, we discussed how to configure open-source Delta Lake with Amazon EMR, which helps you create a transactional data lake platform to support multiple analytical use cases. We demonstrated how you can use different kinds of DML operations on a Delta table. Check out the sample Jupyter notebook used in the walkthrough. We also shared some new features offered by Delta Lake, such as file compaction and Z-ordering. You can implement these new features to optimize the performance of the large-scale data scan on a data lake environment. Because Amazon EMR supports two ACID file formats (Apache Hudi and Apache Iceberg) out of the box, you can easily build a transactional data lake to enhance your analytics capabilities. With the flexibility provided by Amazon EMR, you can install the open-source Delta Lake framework on Amazon EMR in order to support a wider range of transactional data lake needs based on various use cases.
Now, you can use the latest open-source version of Delta Lake using the bootstrap actions shown in this post to run on Amazon EMR to build your transactional data lake.
About the Authors
Avijit Goswami is a Principal Solutions Architect at AWS specialized in data and analytics. He supports AWS strategic customers in building high-performing, secure, and scalable data lake solutions on AWS using AWS managed services and open-source solutions. Outside of his work, Avijit likes to travel, hike in the San Francisco Bay Area trails, watch sports, and listen to music.
Ajit Tandale is a Big Data Solutions Architect at Amazon Web Services. He helps AWS strategic customers accelerate their business outcomes by providing expertise in big data using AWS managed services and open-source solutions. Outside of work, he enjoys reading, biking, and watching sci-fi movies.
Thippana Vamsi Kalyan is a Software Development Engineer at AWS. He is passionate about learning and building highly scalable and reliable data analytics services and solutions on AWS. In his free time, he enjoys reading, being outdoors with his wife and kid, walking, and watching sports and movies.
Anyone involved in hiring security analysts in the last few years is likely painfully aware of the cybersecurity skills shortage – but the talent hasn’t “gone anywhere” so much as it’s been bouncing around all over the place, looking for the highest bidder and most impactful work environment. Particularly since the advent of the pandemic, more highly skilled cybersecurity talent has been able to take advantage of work-from-anywhere opportunities, as well as other factors like work/life balance, the desire to avoid negative office politics – and, of course, potentially higher wages elsewhere.
Retain where it counts
Money isn’t everything, but it’s a lot. An awful lot. That’s what it may seem like to an experienced analyst who’s been working in the security operations center (SOC) for long hours over years, who doesn’t feel like they can really take time off, and who perhaps has been on LinkedIn of late just to “see what’s out there.” Having casual conversations with a recruiter can quickly turn into a conversation with you, their manager, that begins, “I need to put in my two-week notice.”
There are simply companies out there that will pay more and hire away your talent faster than you can say “onboarding.” You can attempt to shore up some budget to retain talent, but if money isn’t just one prong of a larger mix to keep your best and brightest, they’ll slowly start to join the quiet-quitting club and look elsewhere.
The balance shouldn’t be an act
It’s true that life – especially as we become adults – becomes a delicate balancing act. But for companies pitching a great work/life balance to prospective cybersecurity talent, that pitch needs to be genuine. A 2021 Gartner survey saw 43% of respondents say that flexibility in work hours helped them achieve greater productivity. And if the attempt is to woo talent with longer, more illustrious resumes, that attempt should highlight a meaningful work/life balance that’s able to coexist with the company’s values and mission – not to mention one that fits in well with the team dynamic that talent is entering or helping to build.
After all, you’re asking potential employees to sit in the trenches with their peers, fending off threats from some of the most ruthless attackers and organizations in the world. That can sometimes be a dark place to spend your days. Thus, the pervading environment around that function should be one of positivity, camaraderie, inclusivity, and celebration.
The pandemic took work/life balance to another level, one in which companies were forced to adopt work-from-home measures at least semi-permanently. In that scenario, the employee gained the ability to demand a better balance. And that’s something that can’t be taken away, even in part. Because talent loves a good party – and they can always leave yours.
Burn(out) ban in effect
One of the major reasons talent might decide that the party at your SOC has come to an end? Burnout. Currently, around 71% of SOC analysts say they feel burned out on the job. Reasons for this may have nothing to do with the environment in your SOC shop or greater organization. Burnout could be the result of a seasonal uptick in incident-response activities (end-of-year or holiday retail activities come to mind) or in response to the latest emergent threat. However, it’s good to be vigilant of how talent churn might become a common occurrence and how you can institute a ban on burnout.
It takes a team: To build out a fully operational SOC and achieve something close to 24×7 coverage, it takes several people. So, if you’re placing the hopes of round-the-clock coverage on the shoulders of, say, six analysts, they’re likely to burn bright for a short period of time and then leave the party.
The same thing, over and over: Your workday expectations may be music to the ears of prospective talent: 9 to 5, and then you log off and go home. That kind of schedule can be great for work/life balance. But is it pretty much the same thing, every day, year in and year out? Is there a heavy amount of alert fatigue that could be offset by a more efficient solution? Are you leveraging automation to its fullest, so that your SOC doesn’t become full of expert talent spending their days doing mundane tasks?
Burnout may come back to bite you: Glassdoor… it’s a thing. And people will talk. Your SOC may have developed a reputation for burnout without you even realizing it. It’s called social media, and you can sink or succeed by it – especially if it isn’t just one former analyst on Glassdoor talking about your security organization in relation to burnout. What if you find out it’s 50 people over the span of five years? Sure, it’s actionable data, but by then it may be too late.
The soul of your SOC
Think about it from their point of view. What do your employees consider a positive work environment? What would constitute a brain-drain culture? Taking proactive measures like sending out a survey and soliciting anonymous responses is an easy way of taking the temperature of the culture.
And if burnout is becoming a real thing, maybe it’s time to think about a managed services partner who can take on some of the more mundane security tasks and free up your in-house talent to innovate.
At AWS, we love to give our customers choices: the choice of infrastructure to deploy your workloads, to store your most important data, or the operating systems for your virtual desktops.
Many of you choose Amazon Workspaces to provision and distribute virtual desktops securely and at scale to your workforce. Our customers choose Workspaces when choosing a solution to enable secure remote workers or when they want to quickly provision desktop for contractors, just to name two use cases. When using Workspaces, you’ve had the choice between two operating systems: Microsoft Windows or Amazon Linux.
Starting today, you can also provision Ubuntu desktops for your developers, engineers, or data scientists. This allows virtual desktop users to have more choices and to embrace new categories of workloads. It also gives virtual desktop administrators a consistent experience whether you are managing Windows or Linux-based desktops for your workforce. You can now have one process and set of tools to manage the majority of your desktop operating systems.
According to the HackerEarth 2020 Developer Survey, Ubuntu is the most widely used operating system among professional developers (66 percent Ubuntu, 61 percent Windows, and 57 percent macOS). Many developers or DevOps engineers have a battery of scripts, tools, or libraries well tested on their Ubuntu desktops or laptops. Providing Ubuntu desktop on Workspaces gives developers and engineers a familiar and compatible environment allowing them to work from anywhere, with access to a wealth of open-source tools and libraries in cutting-edge fields like data science, AI/ML, cloud, and IoT. All Ubuntu WorkSpaces benefit from Ubuntu Pro, which includes support for expanded security patching for 10 years.
Having Ubuntu on Amazon Workspaces is important for you, but also for us, AWS, and for Canonical, the publisher of Ubuntu.
“ We’ve brought Ubuntu Desktop to WorkSpaces so developers can streamline the design, coding, pipelines, and deployment of Ubuntu-based workloads, whether instances or containers, all within the AWS environment,” said Alex Gallagher, VP Cloud for Canonical. “ Also, Ubuntu virtual desktops on WorkSpaces enable IT organizations to quickly and easily provision high-performance Ubuntu Desktop instances, delivered as a fully managed AWS service. In the face of constant and increasing pressure to support the security and productivity needs of hybrid workers, that’s a win for IT organizations and their end users.”
Why a Virtual Desktop for Developers And Engineers? There are several benefits to providing virtual cloud desktops to your technical workforce.
First, the security: all your files are securely stored on cloud-based volumes within the security perimeter of your AWS account. Application assets such as source code or design documents are not locally stored on end-user machines, and no data is at risk in case of a laptop being lost or stolen.
Second, the ease of provisioning at scale. Providing new desktops, including with the latest generation of hardware, is a matter of minutes. Onboarding new team members or contractors is accelerated, and can even be automated.
Third, the reduction in costs by paying on demand, either monthly or hourly, just for the time the resources are used.
Fourth, end-users may access their desktop from anywhere. They can work with the same desktop from on premises, from home, or when traveling.
And fifth, virtual desktop administrators now have a common administration experience across Windows and two distributions of Linux (Ubuntu and Amazon Linux).
How to Get Started For IT administrators, provisioning Ubuntu desktops is no different than provisioning Windows or Amazon Linux desktops. You may choose the hardware bundle, with various sizes of CPUs and memory, depending on the end-user needs. Workspaces are bound to an Active Directory. You may use your on-premises AD or a fully managed directory service in the cloud.
For this blog post, I choose to show you the end-user experience instead. As a developer or engineer, once my desktop is provisioned, I receive an email like this one:
For this demo, I am using the Windows Workspaces client. After downloading and installing it, I enter the registration code I received by email.
A few seconds later, I have access to my Ubuntu desktop.
Imagine I later travel to a family member’s place, and I have to access my work desktop. I can borrow a web browser and reconnect from the web client. Not surprisingly, I find my desktop in the exact state I left it—even the mouse pointer is in the same place. When closing a session, I am confident that I did not leave any confidential files behind me. All my files, messages, and applications are securely stored within my company AWS account.
Things You Need To Know The service team is actively listening to your feedback and building new capabilities into Workspaces.
For this launch, we chose to use version 22.04 LTS (Jammy Jellyfish). Canonical has optimized the base image for cloud development use cases. We have preinstalled AWS CLI and SDK.
You may select from a selection of Value, Standard, Performance, Power, or Power Pro bundles. These bundles provide you with computer sizes starting at 1 vCPU and 2 GB RAM, up to 8 vCPU and 32 GB RAM.
There are two features of Workspaces that are not present today for the launch of Ubuntu Workspaces. They will be added in the very near future. First, you may connect today using the Windows or web-based Workspaces clients. Linux and macOS clients will be supported as a quick follow-up to this launch. Second, the GPU-based Graphics.g4dn, and GraphicsPro.g4dn bundles will be available in the coming weeks.
Availability and Pricing Ubuntu Workspaces are available in all AWS Regions where Workspaces is available, except a Region in China: China (Ningxia). Again, we’re working hard to add support for China (Ningxia) as a quick follow-up after launch.
Workspace pricing is either per month, for users that primarily use Workspaces as their main desktop, or per hour for those in your workforce making occasional use of the workspace. Ubuntu Workspace prices start at $23 per month and per desktop or $0.19 per hour. Our pricing page has the details.
To provide the best experiences, we use technologies like cookies to store and/or access device information. Consenting to these technologies will allow us to process data such as browsing behavior or unique IDs on this site. Not consenting or withdrawing consent, may adversely affect certain features and functions.
Functional
Always active
The technical storage or access is strictly necessary for the legitimate purpose of enabling the use of a specific service explicitly requested by the subscriber or user, or for the sole purpose of carrying out the transmission of a communication over an electronic communications network.
Preferences
The technical storage or access is necessary for the legitimate purpose of storing preferences that are not requested by the subscriber or user.
Statistics
The technical storage or access that is used exclusively for statistical purposes.The technical storage or access that is used exclusively for anonymous statistical purposes. Without a subpoena, voluntary compliance on the part of your Internet Service Provider, or additional records from a third party, information stored or retrieved for this purpose alone cannot usually be used to identify you.
Marketing
The technical storage or access is required to create user profiles to send advertising, or to track the user on a website or across several websites for similar marketing purposes.


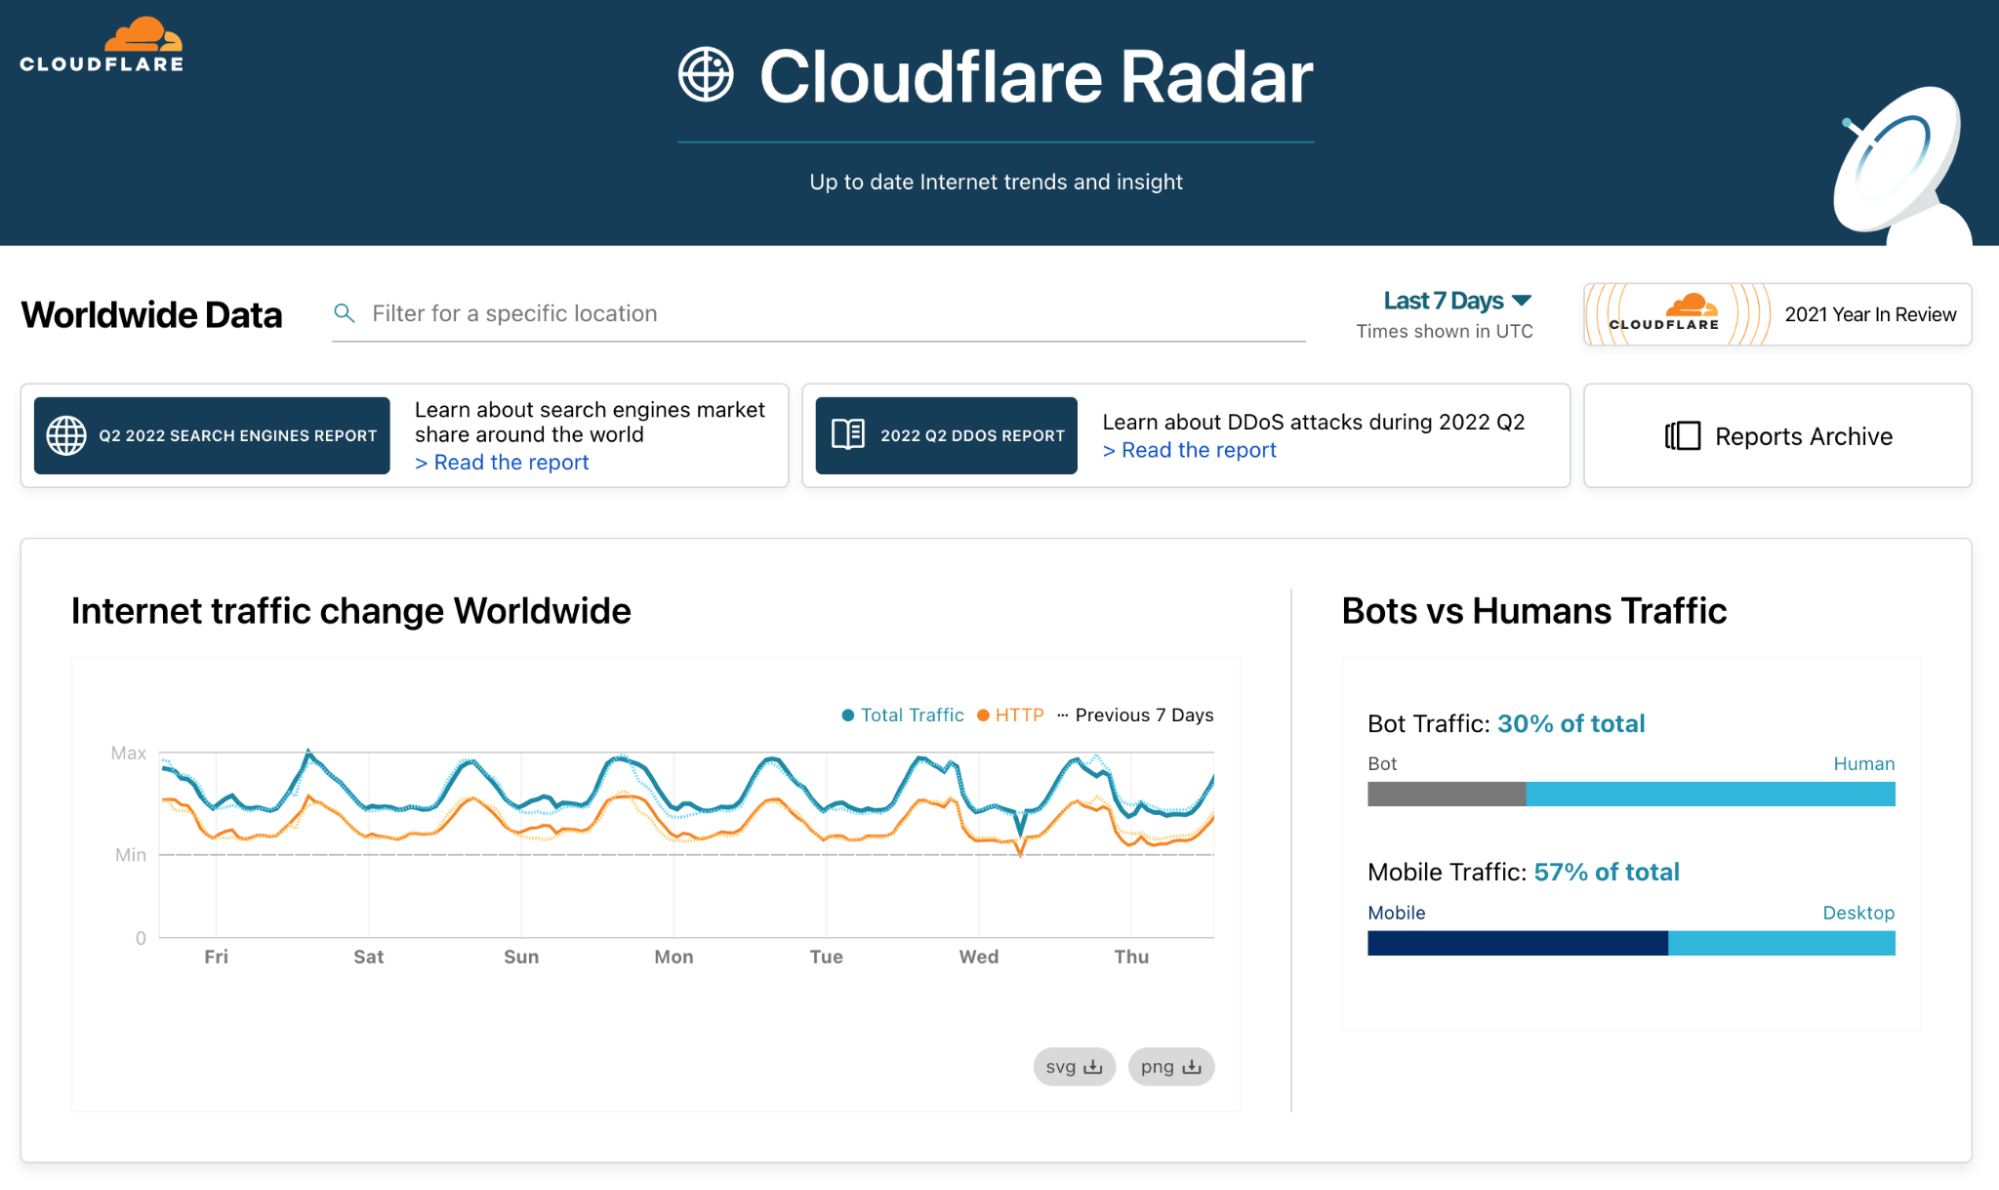
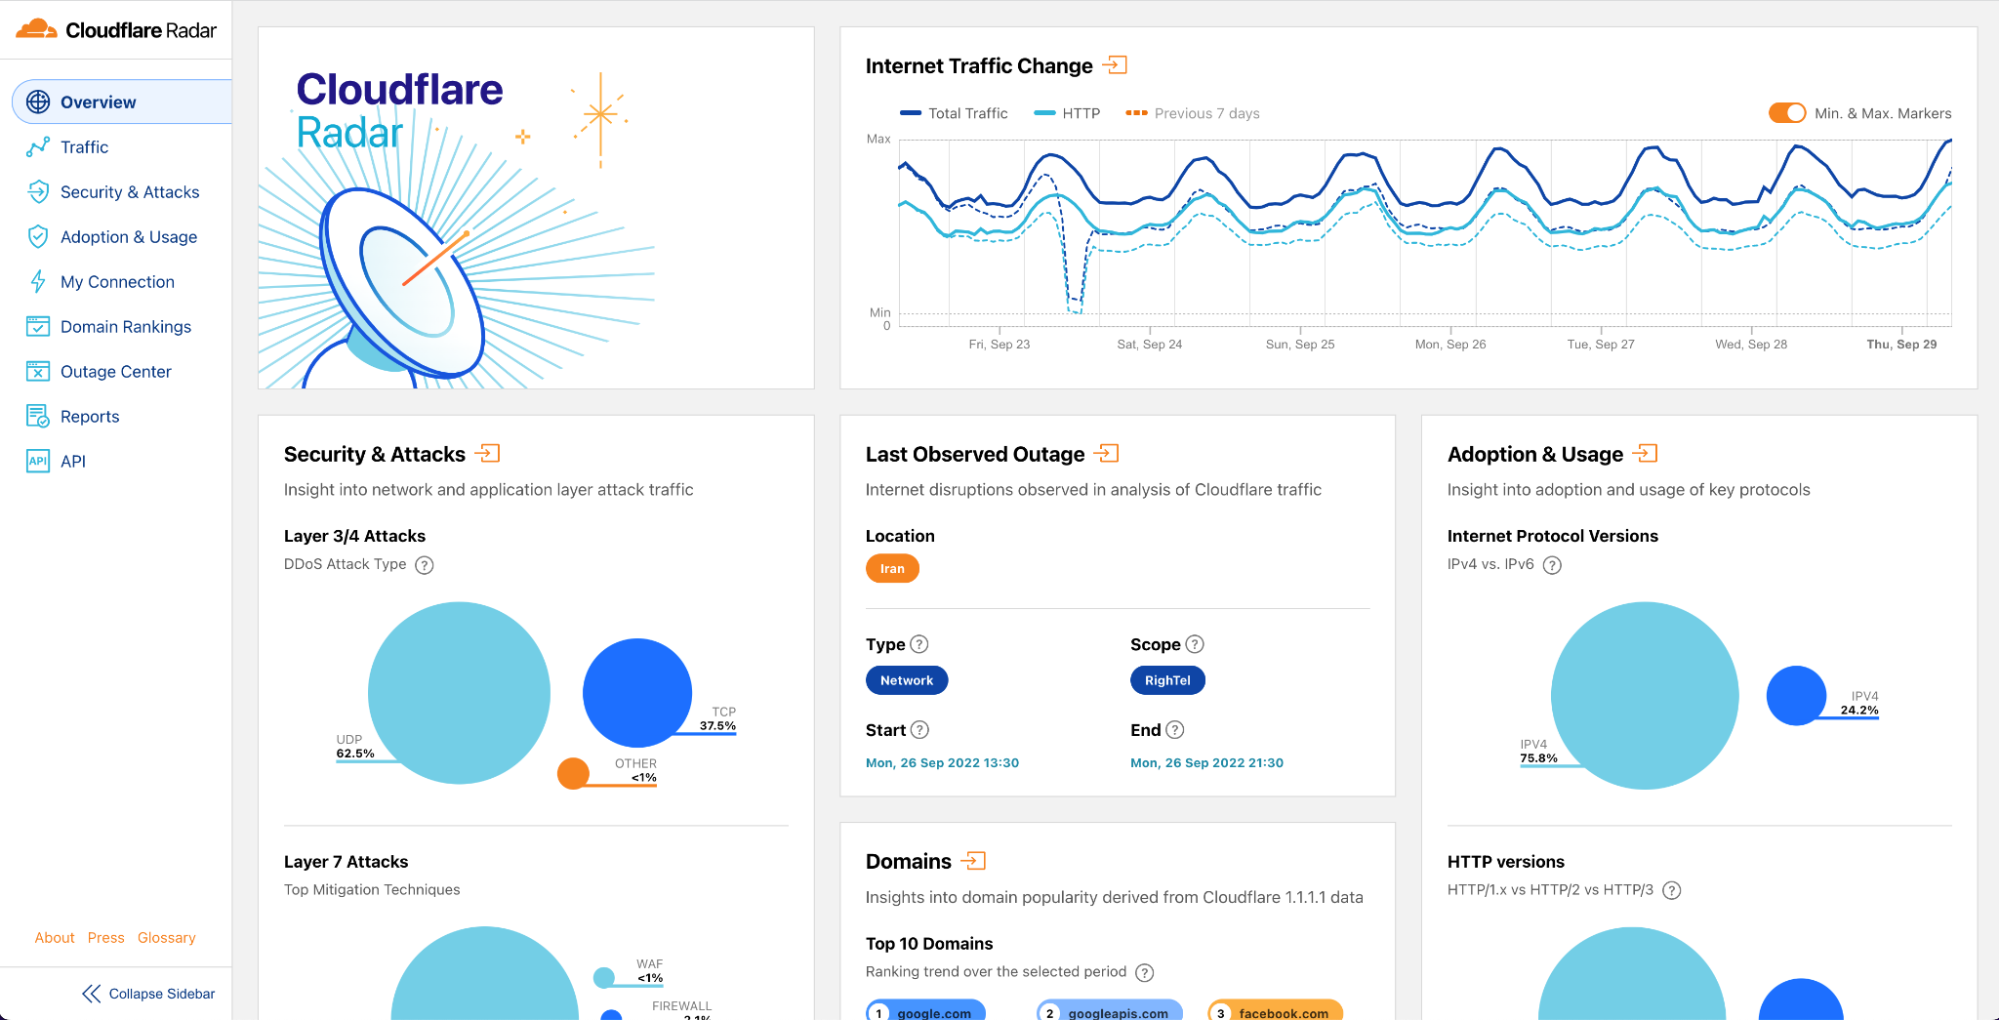
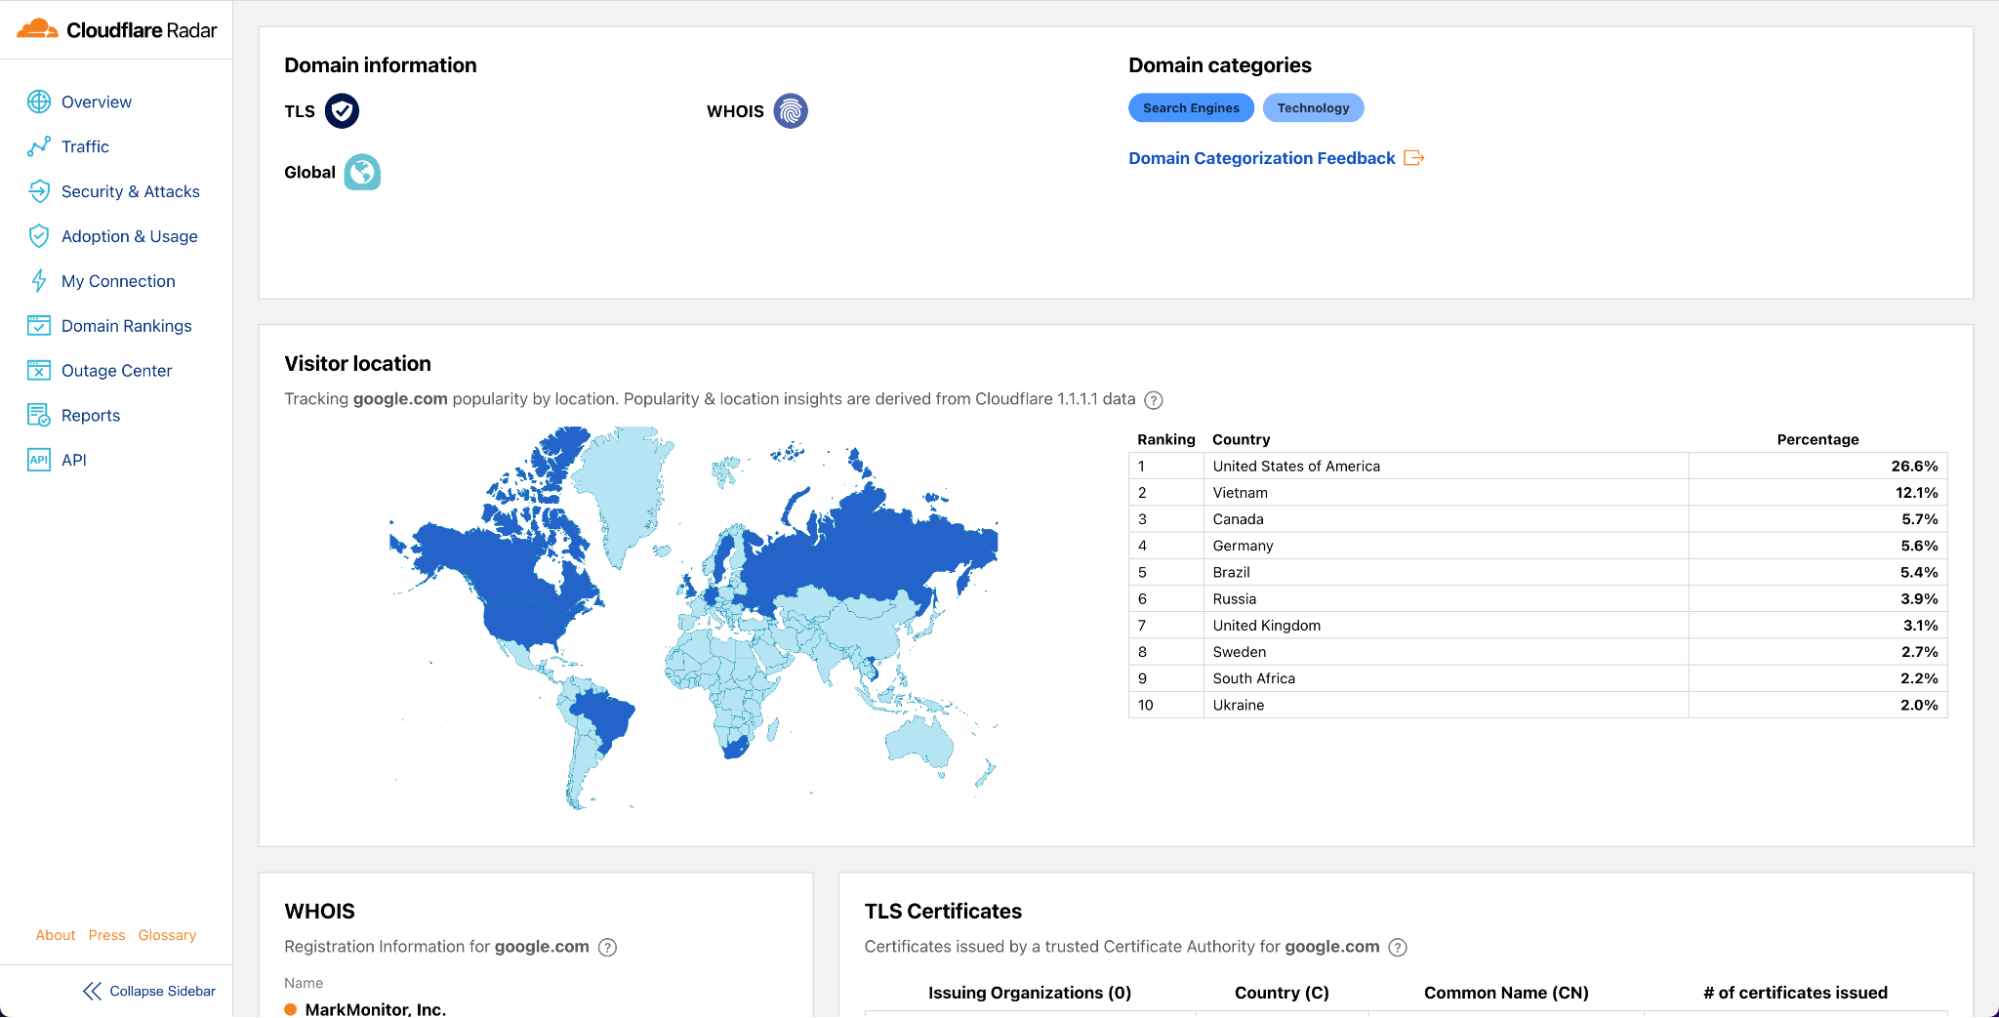
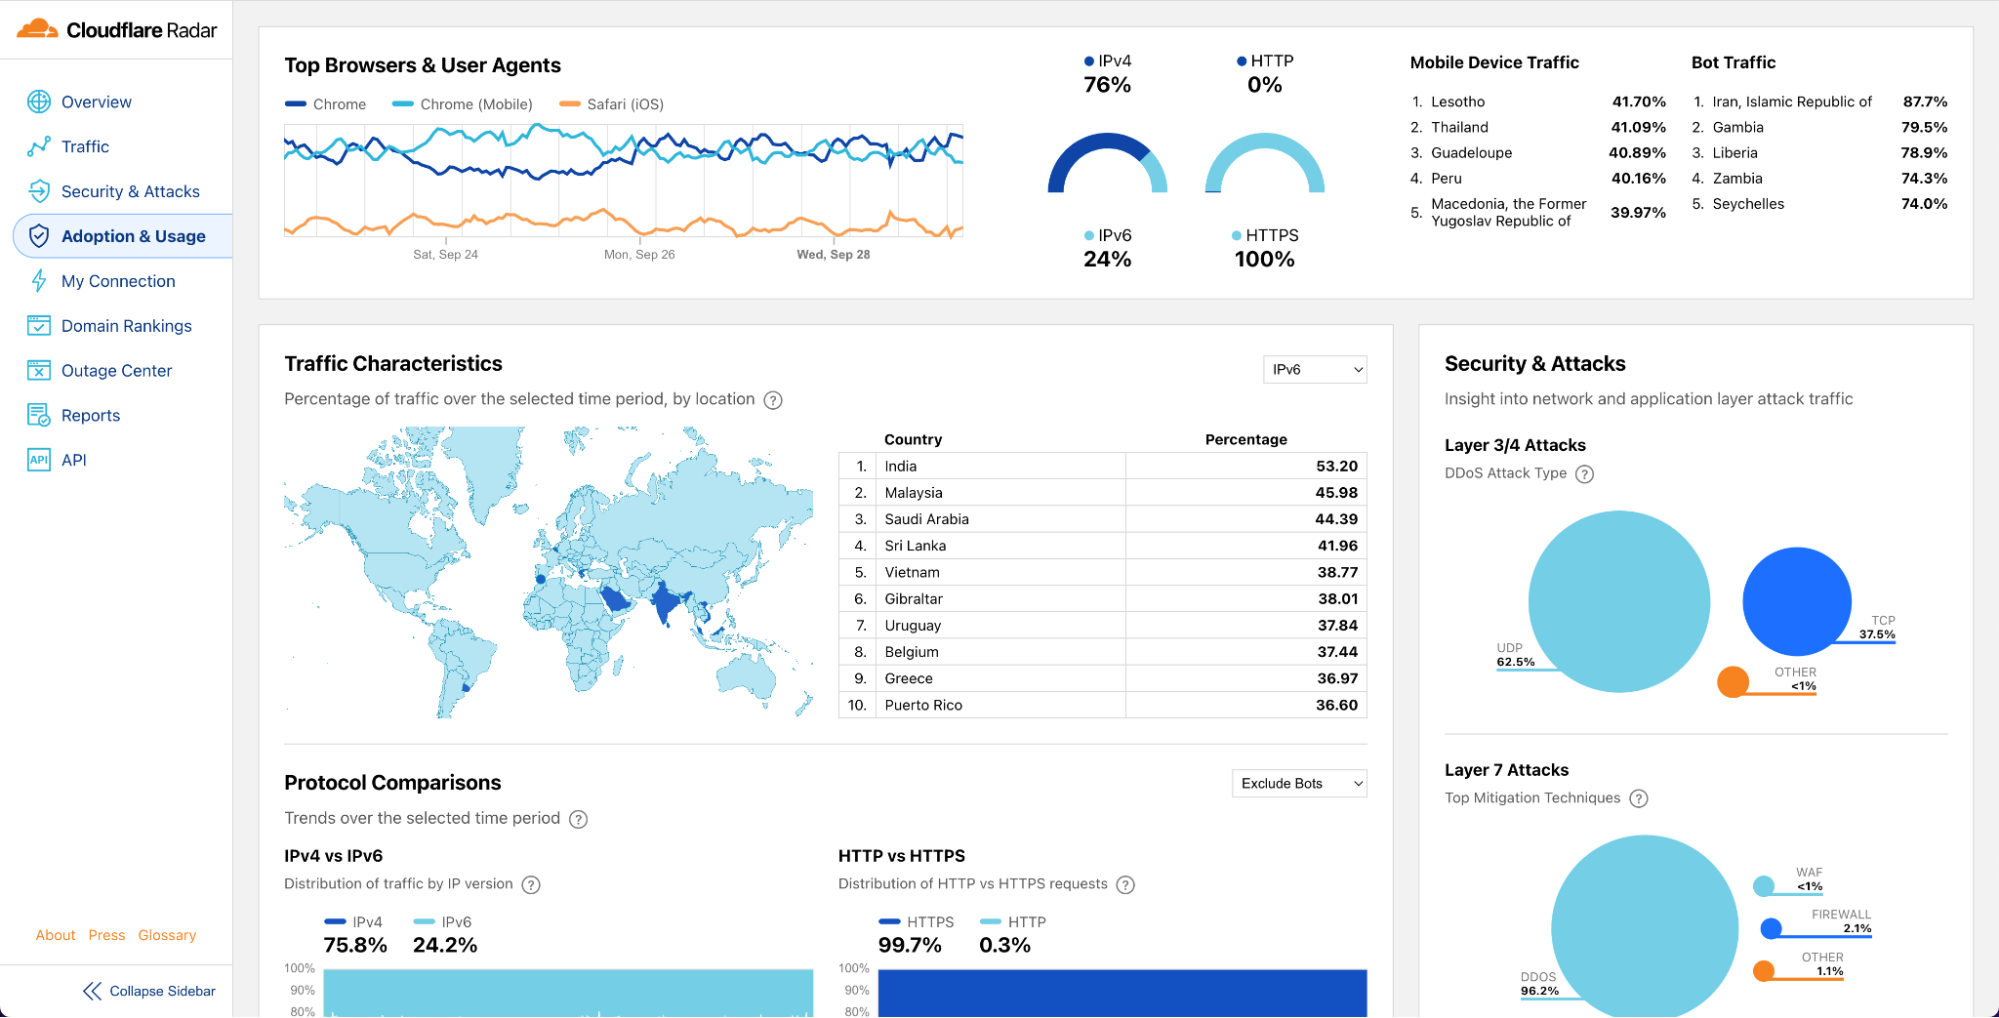



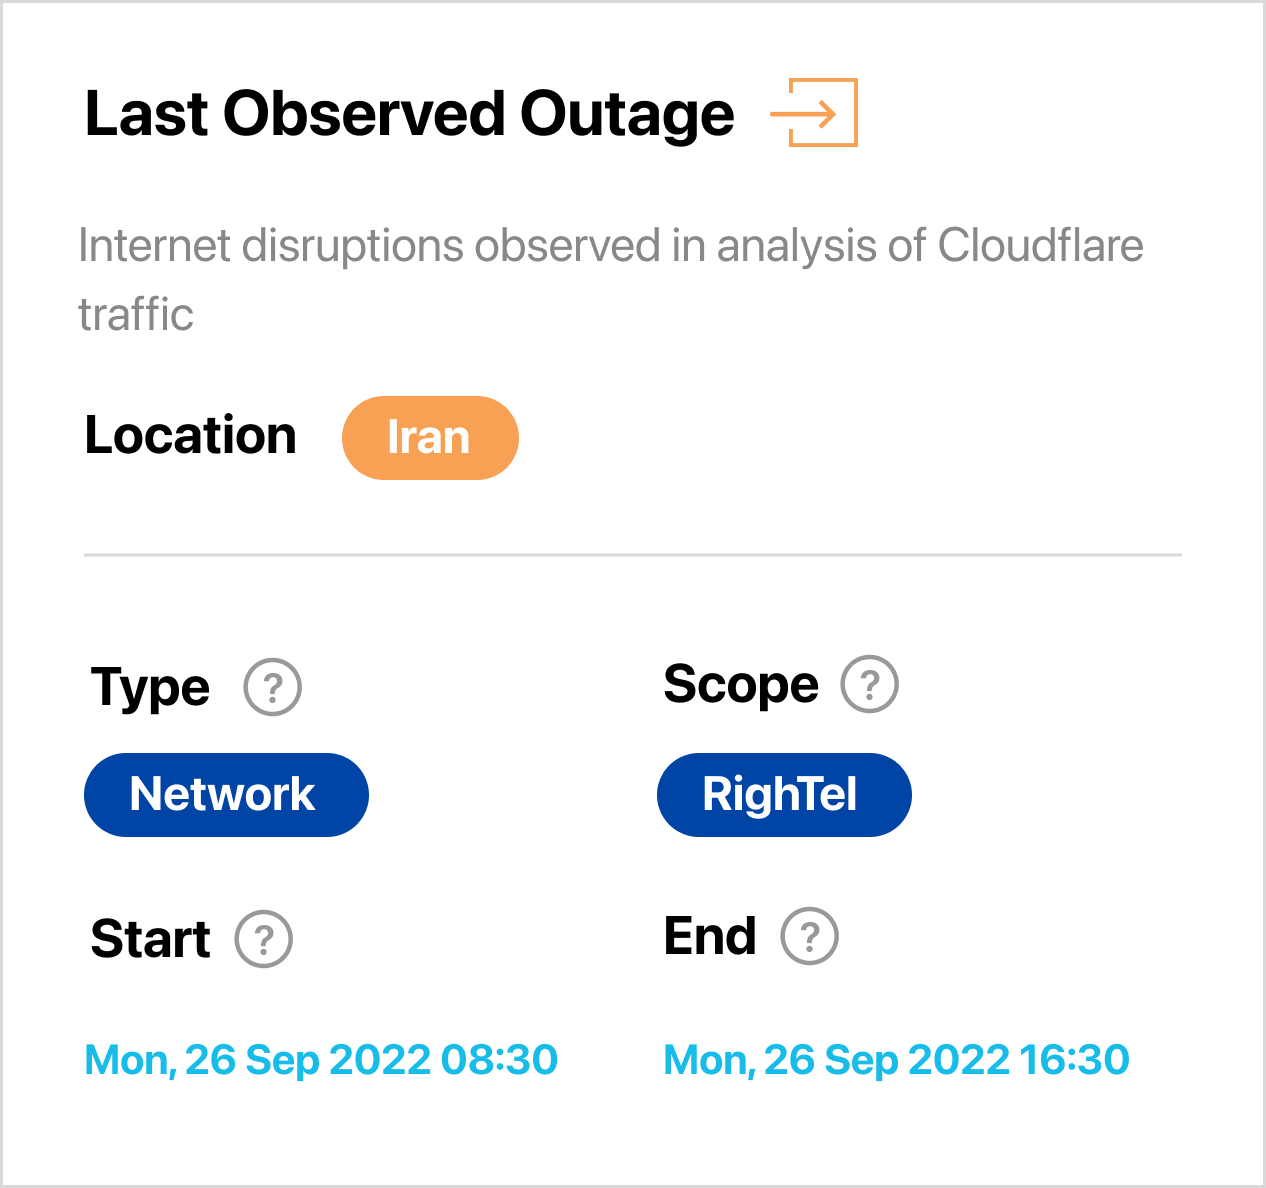
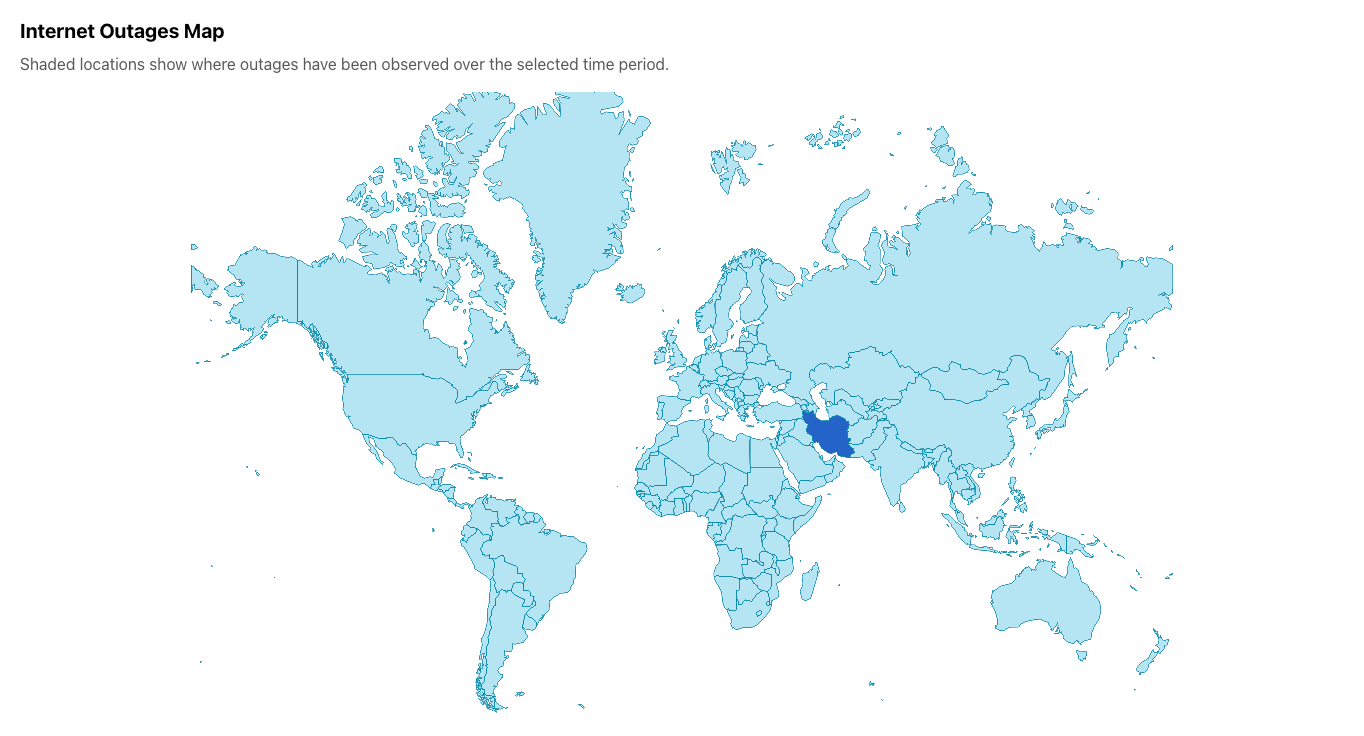
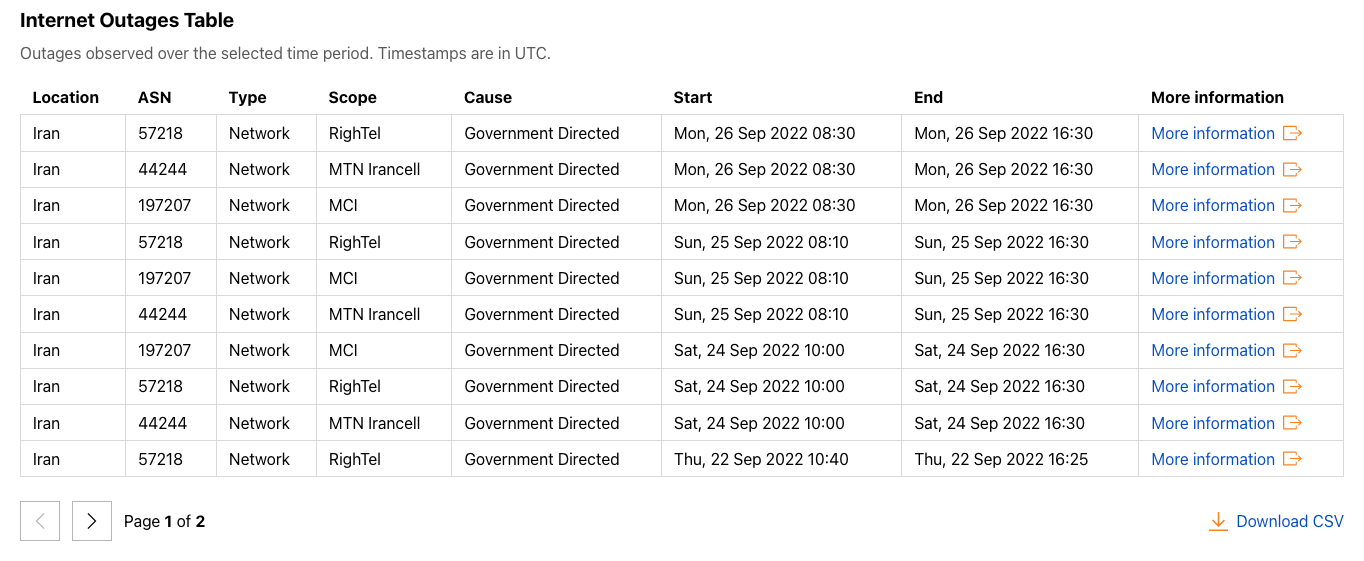
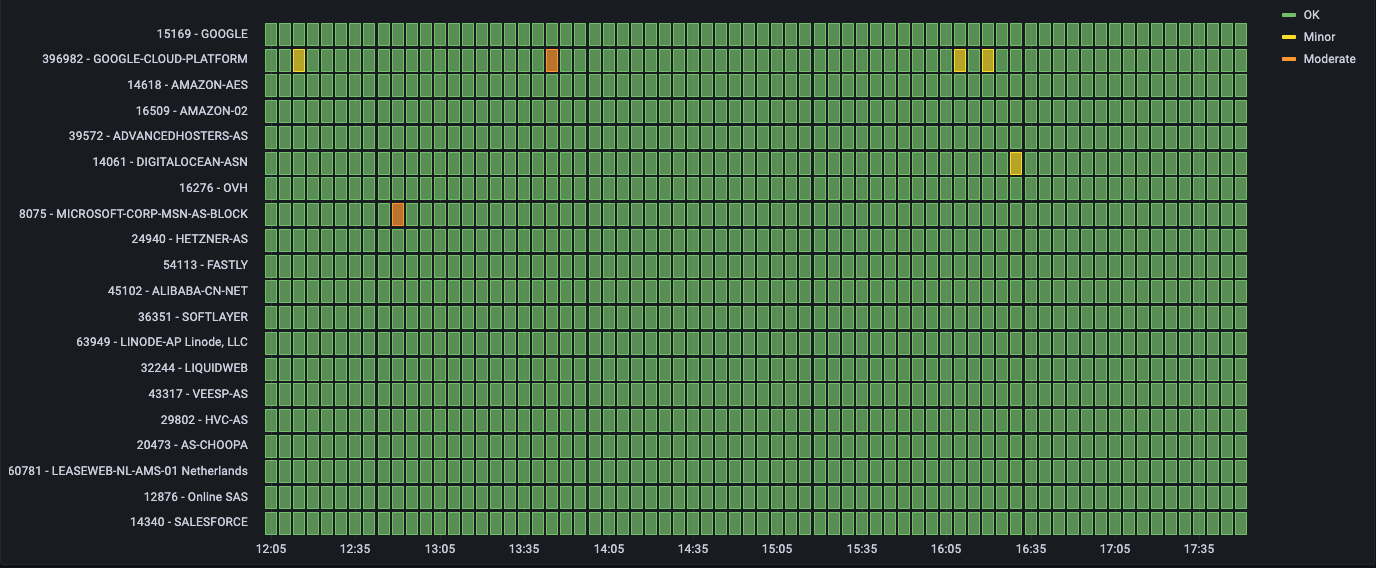


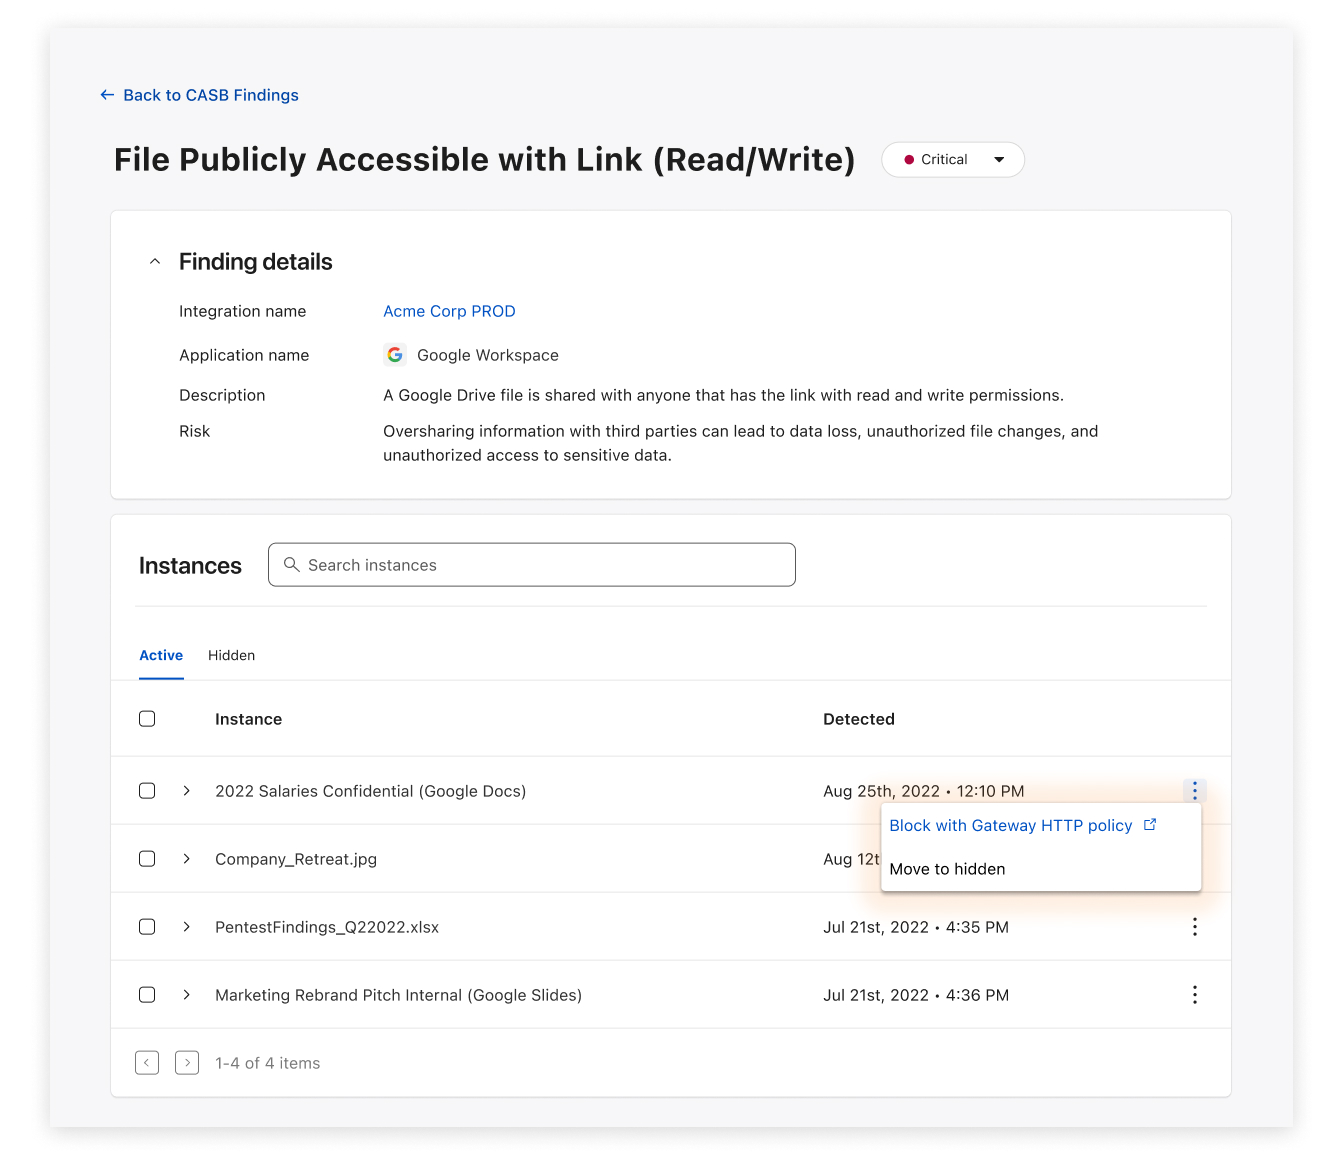
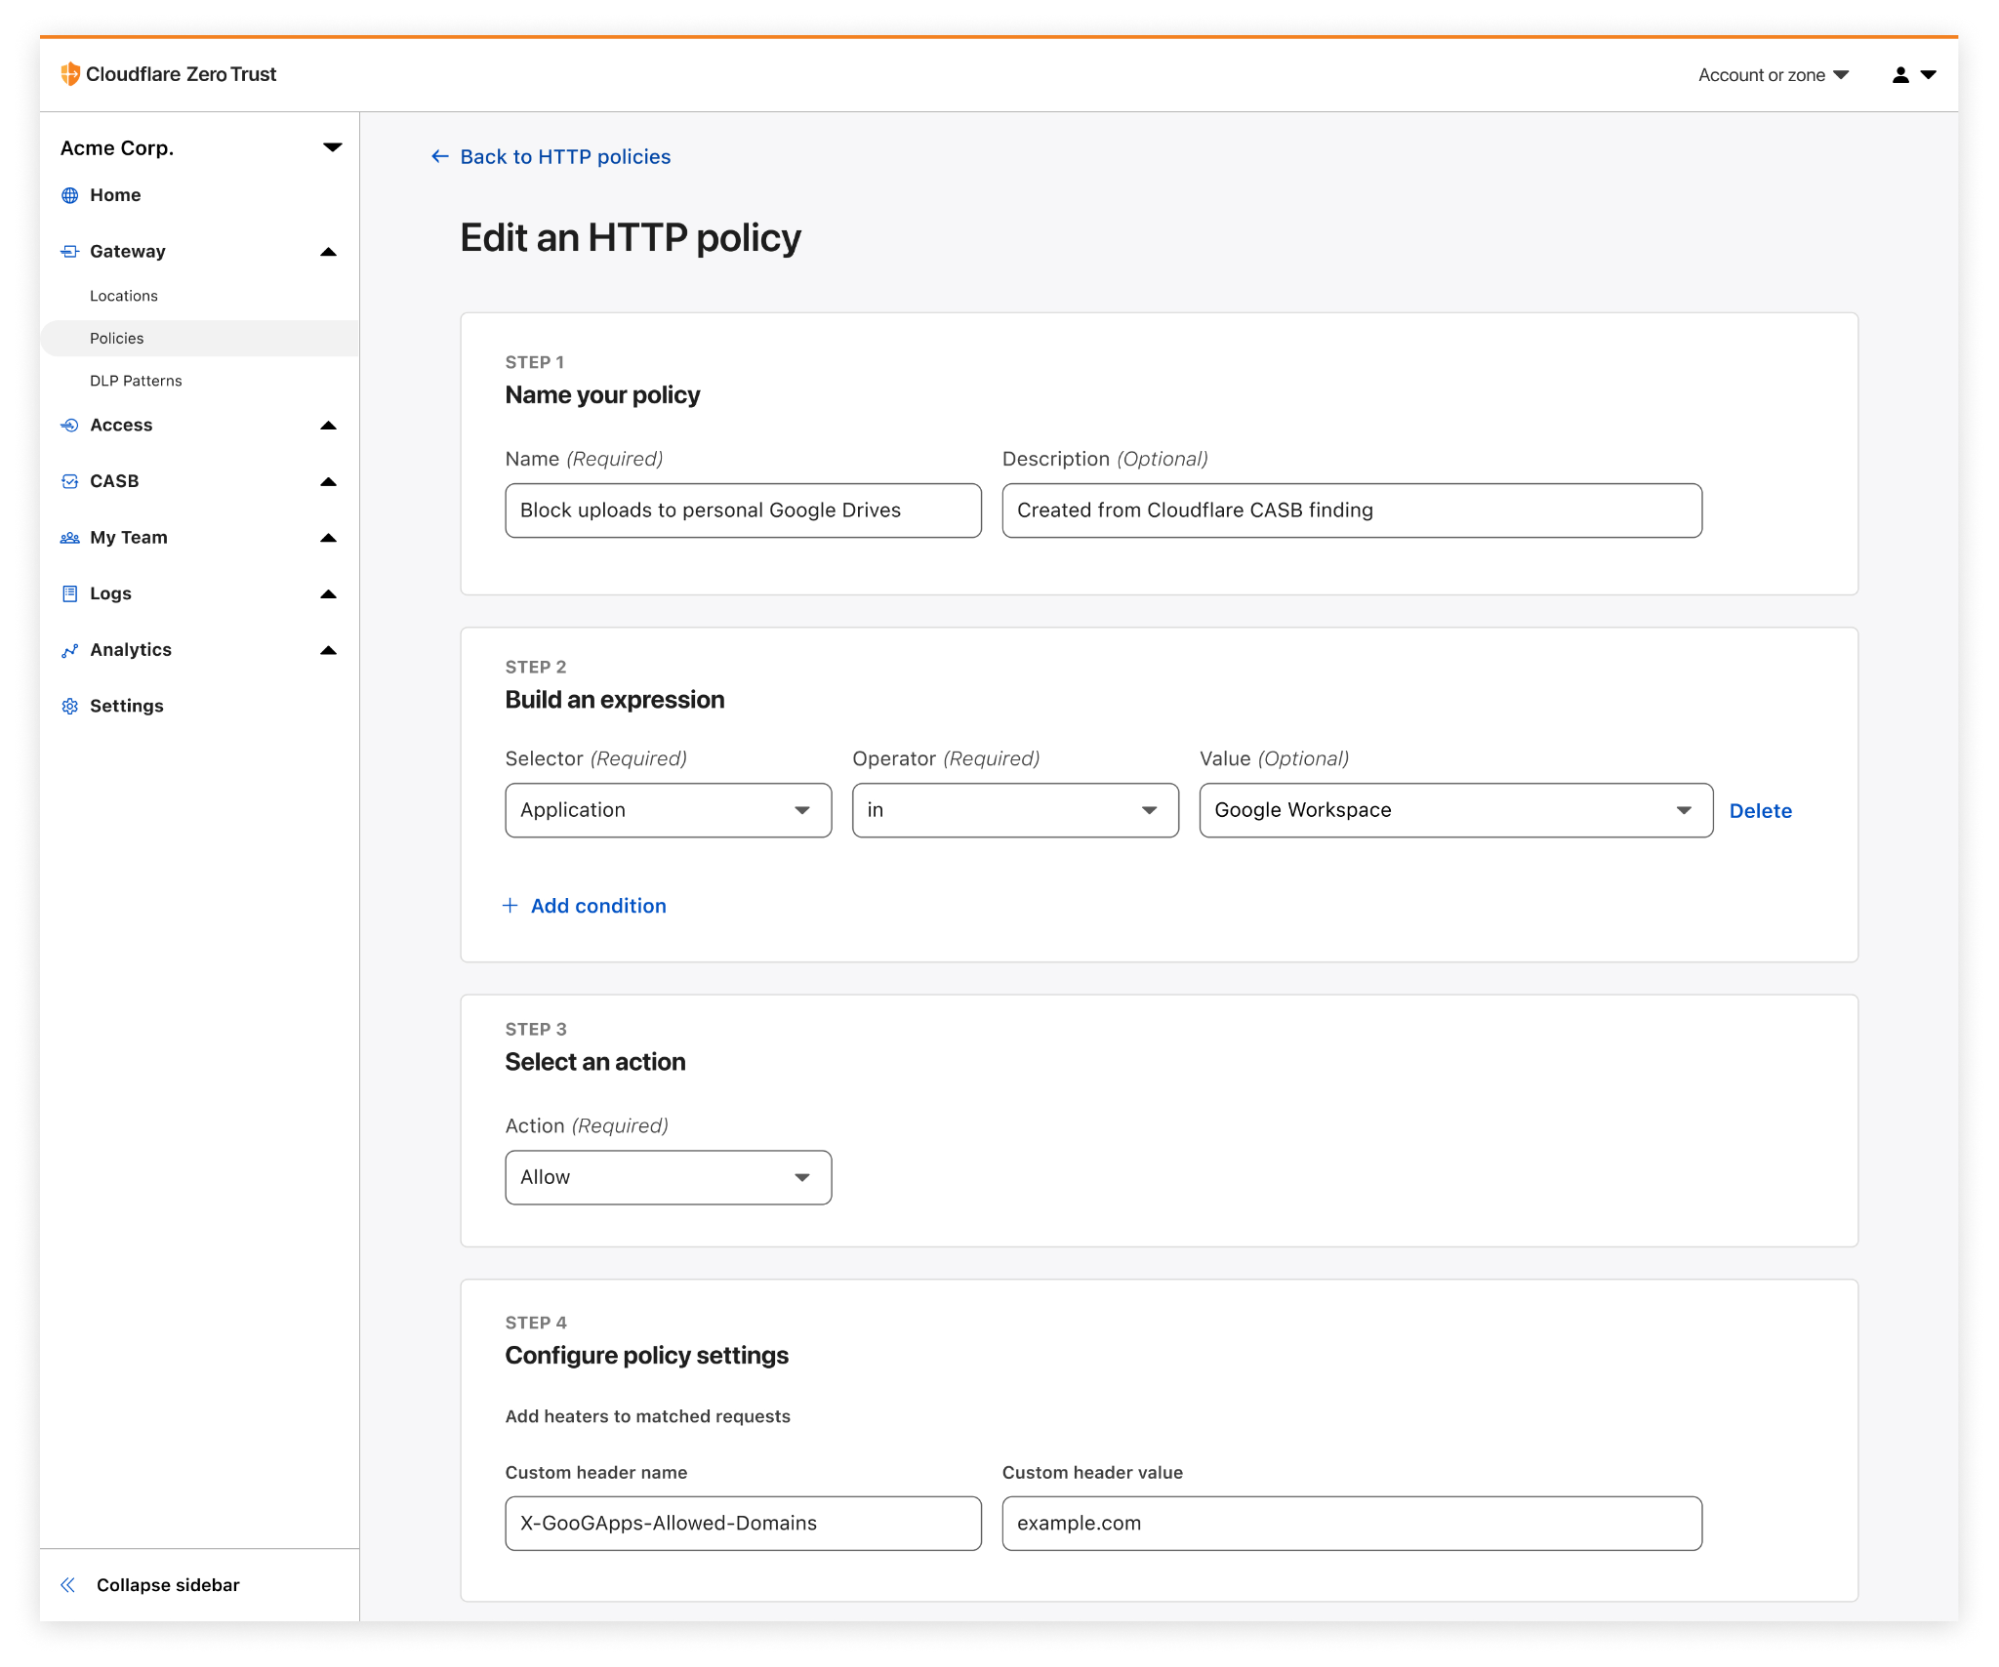
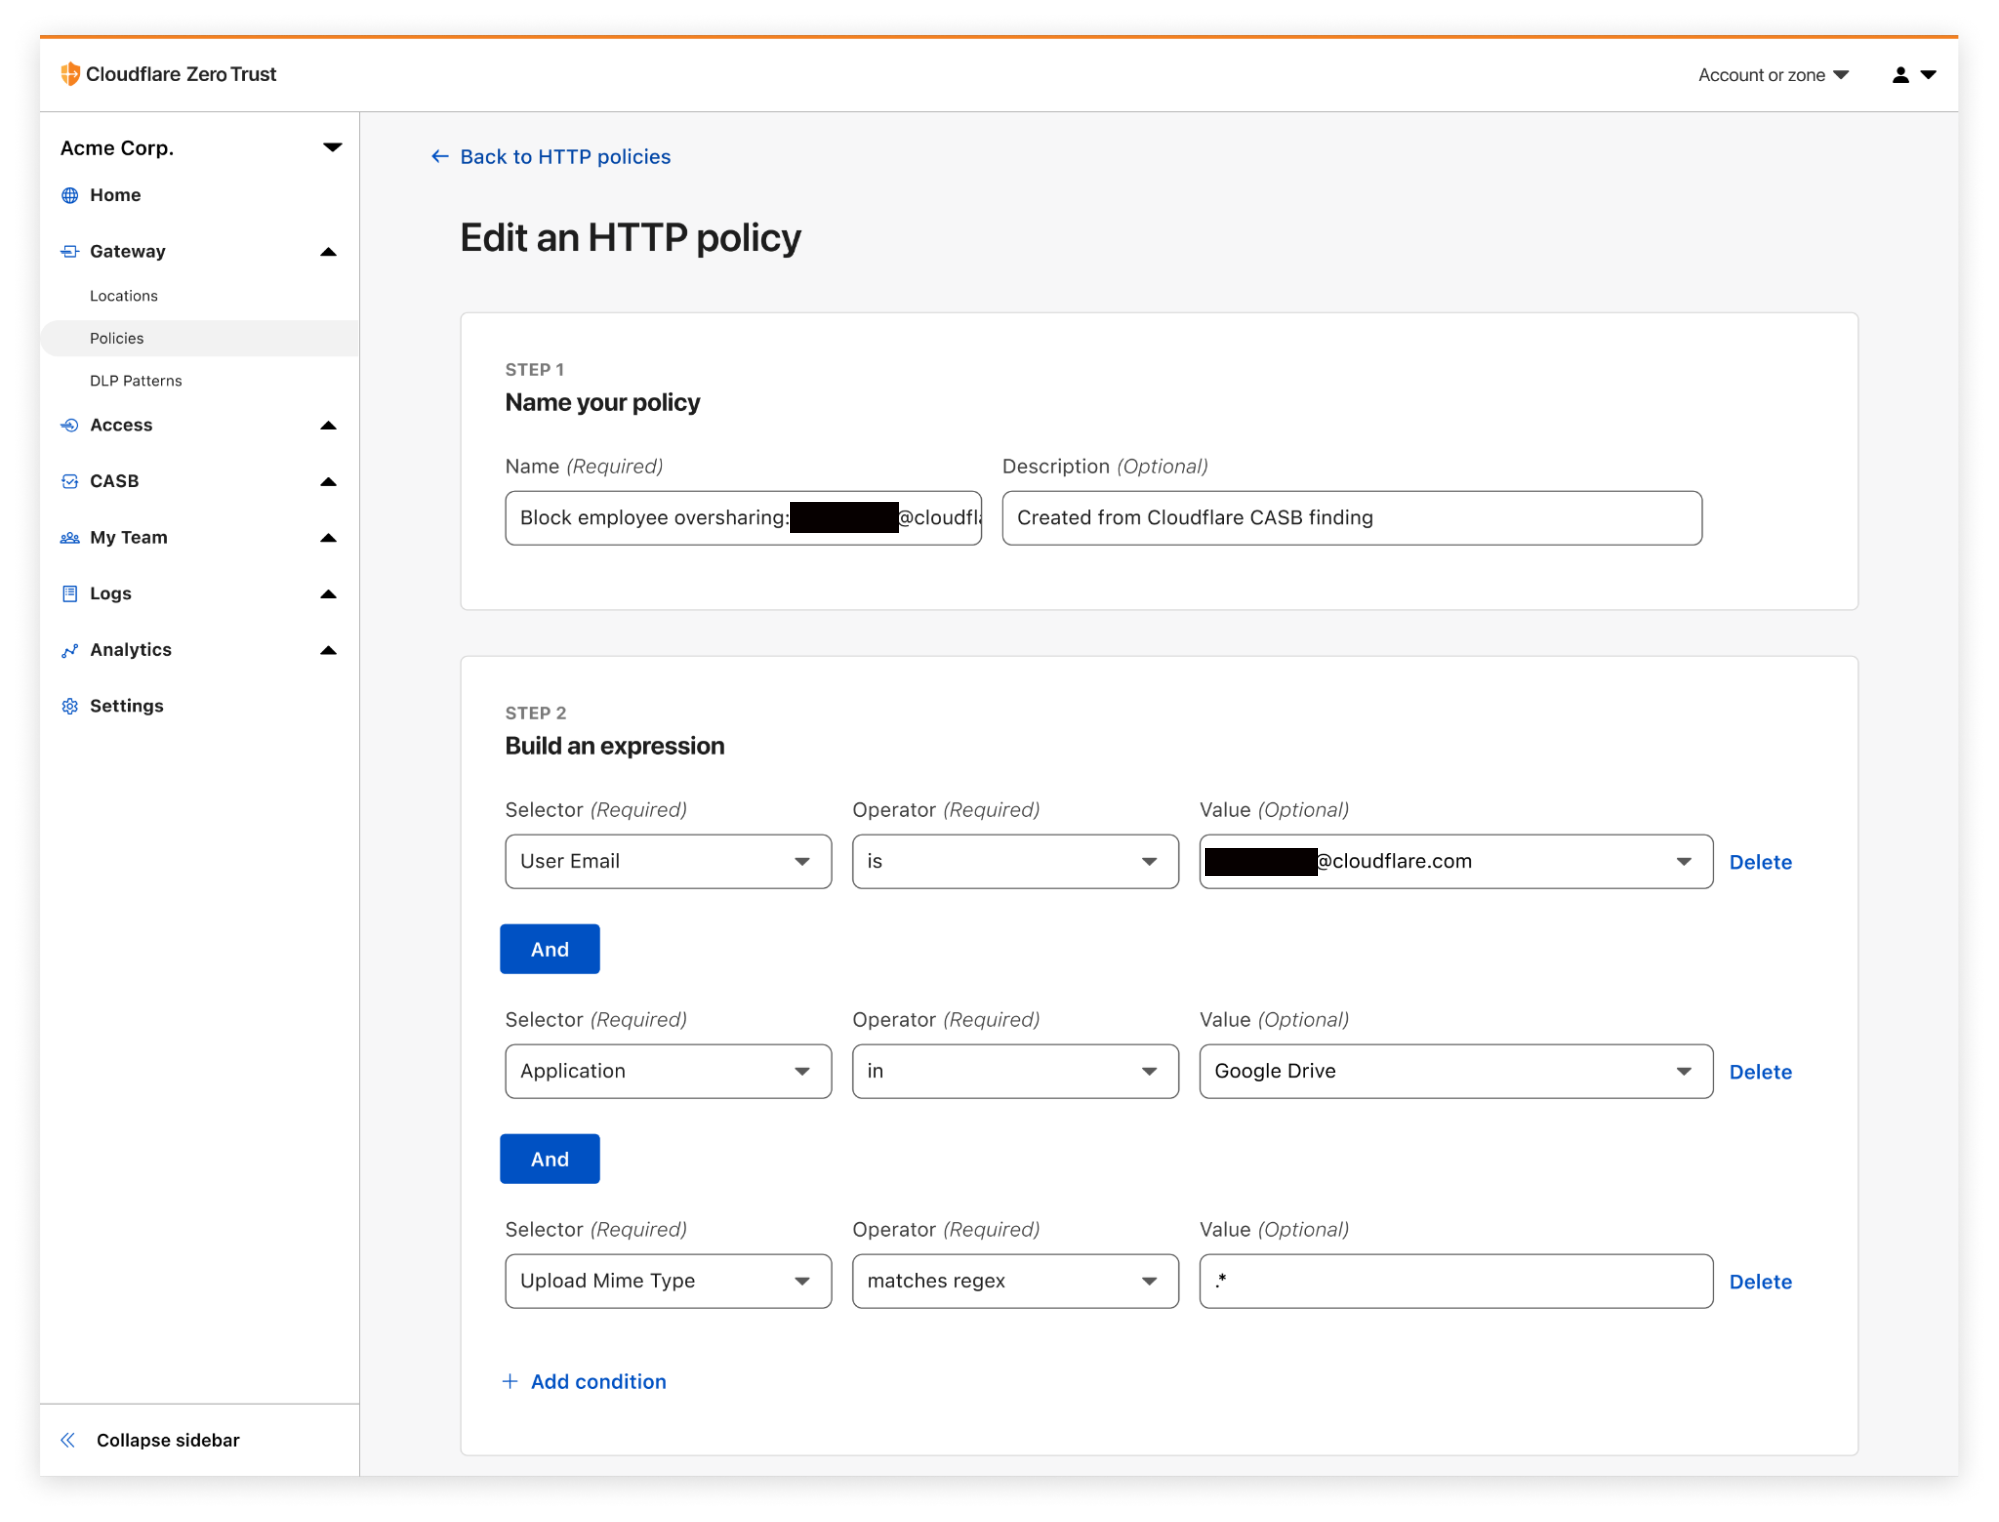
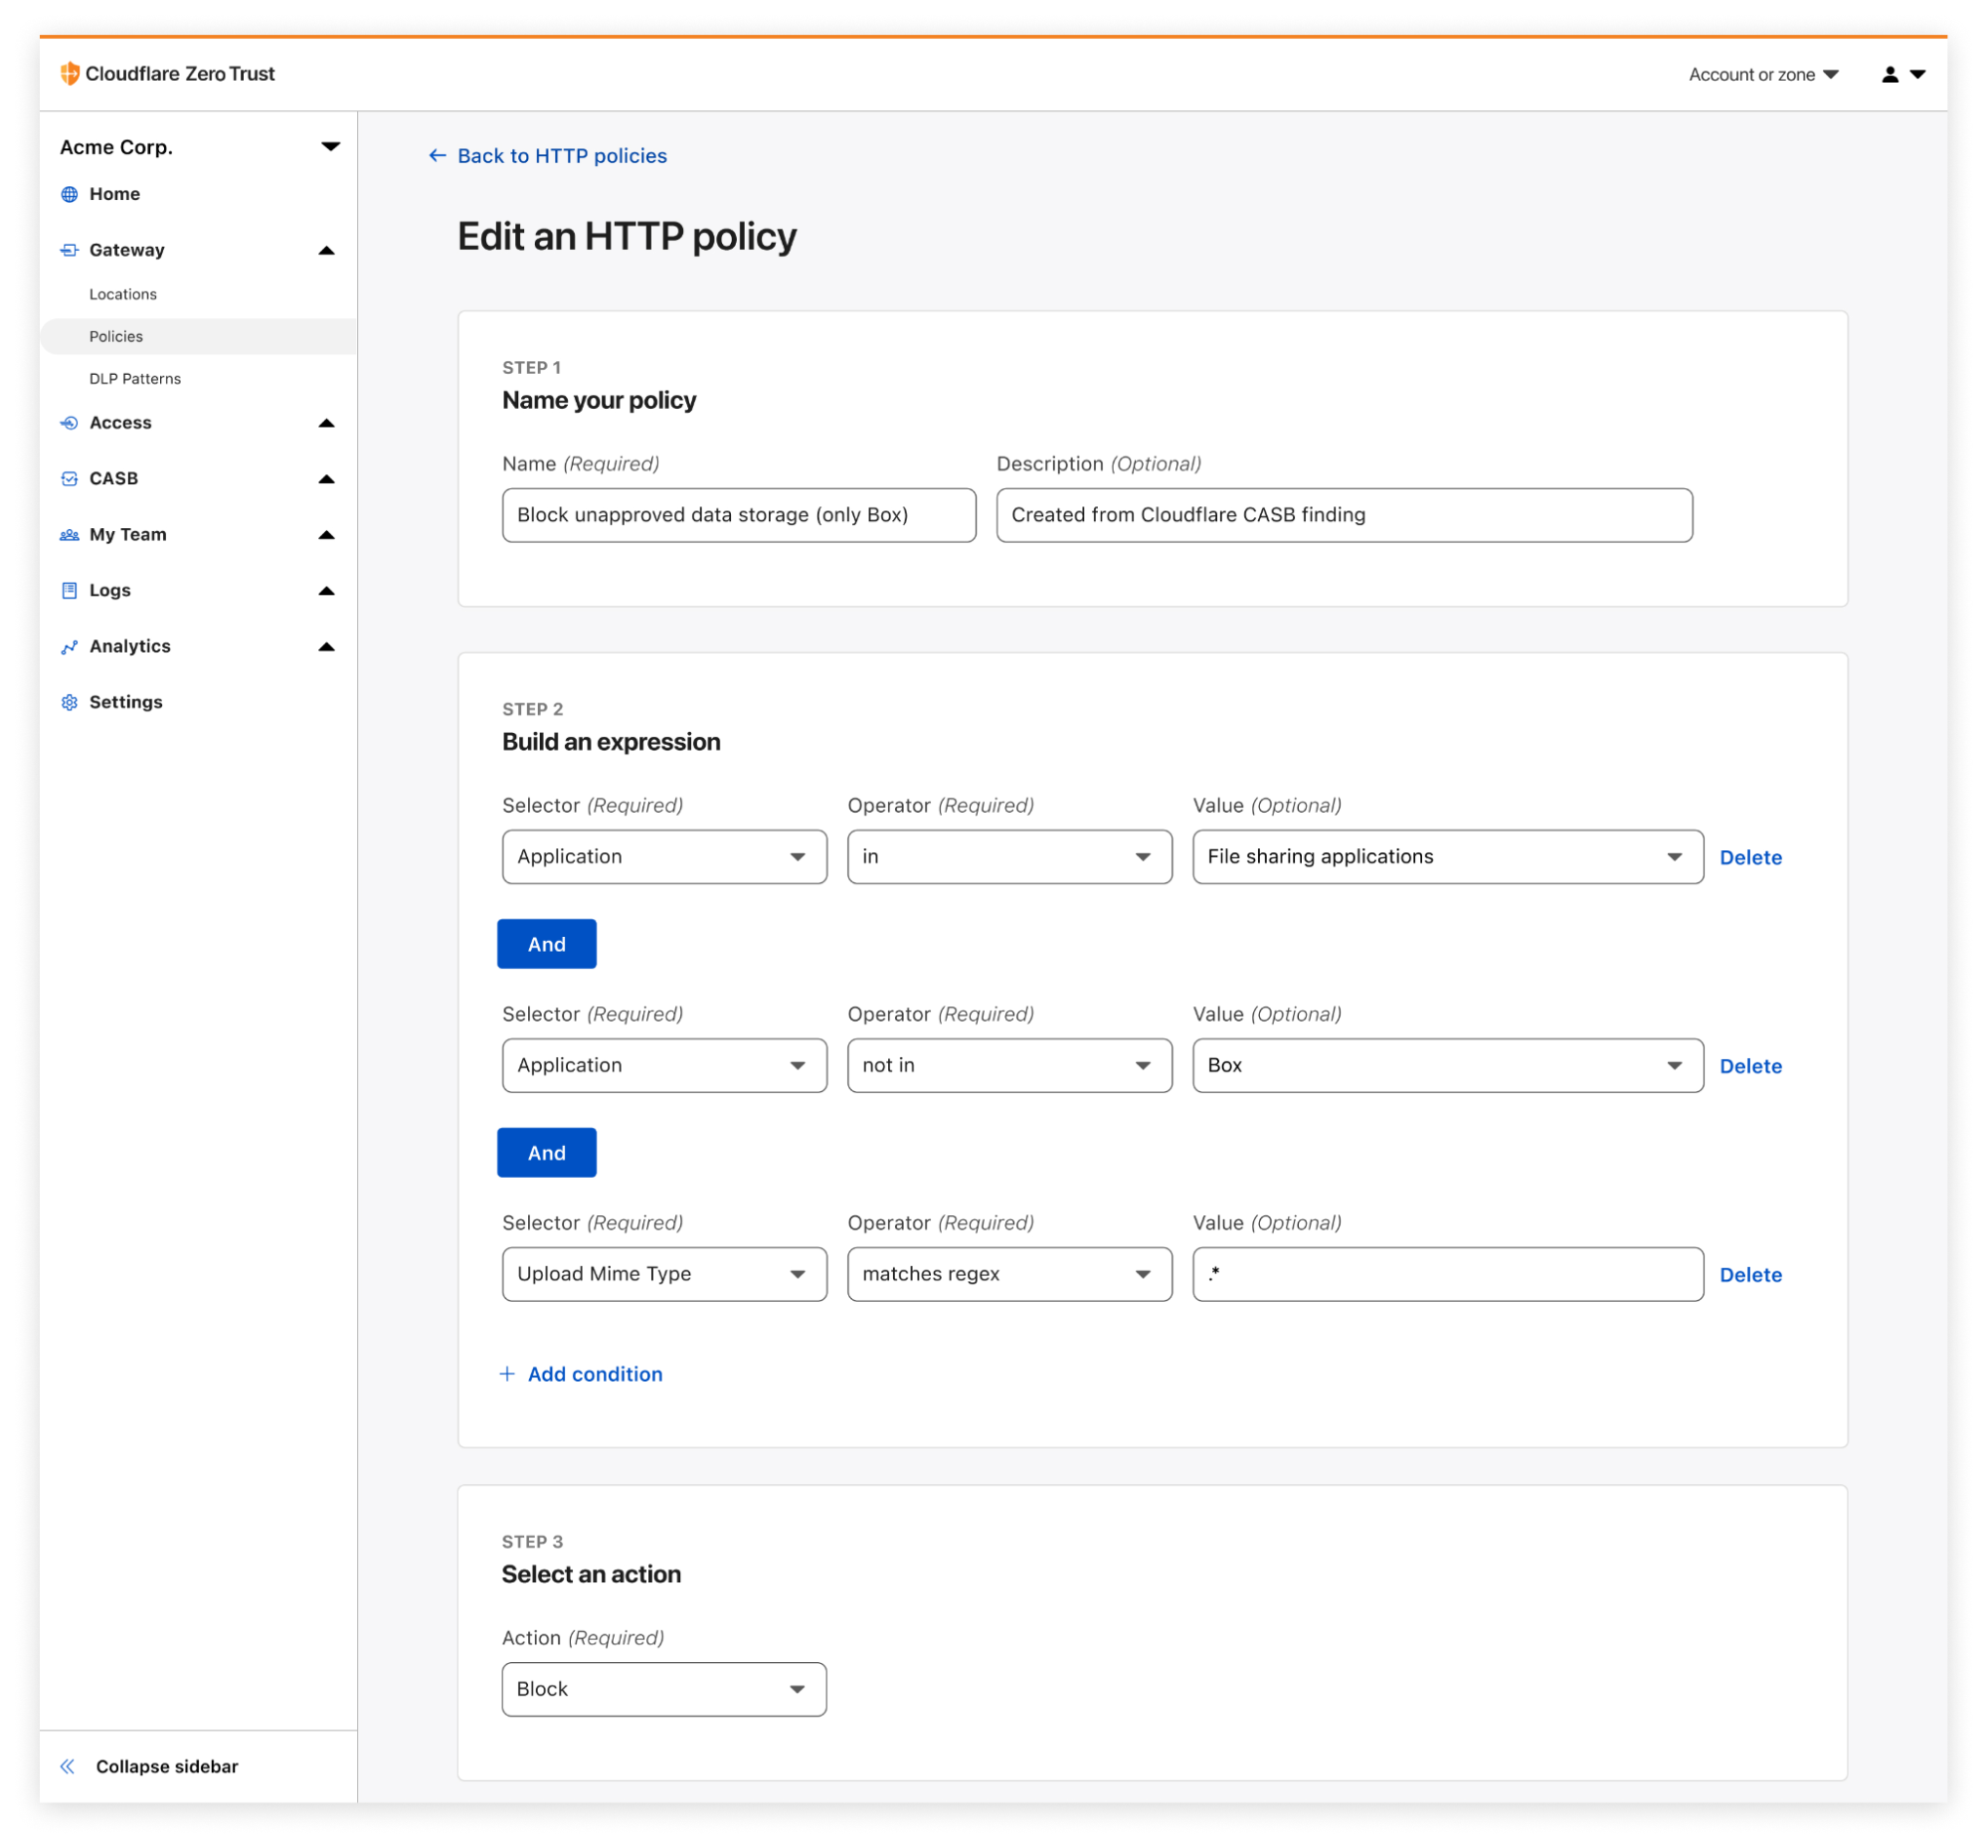








 Satyasovan Tripathy works as a Senior Specialist Solution Architect at AWS. He is situated in Bengaluru, India, and focuses on the AWS Digital User Engagement product portfolio. He enjoys reading and travelling outside of work.
 Nikhil Khokhar is a Solutions Architect at AWS. He specializes in building and supporting data streaming solutions that help customers analyze and get value out of their data. In his free time, he makes use of his 3D printing skills to solve everyday problems.


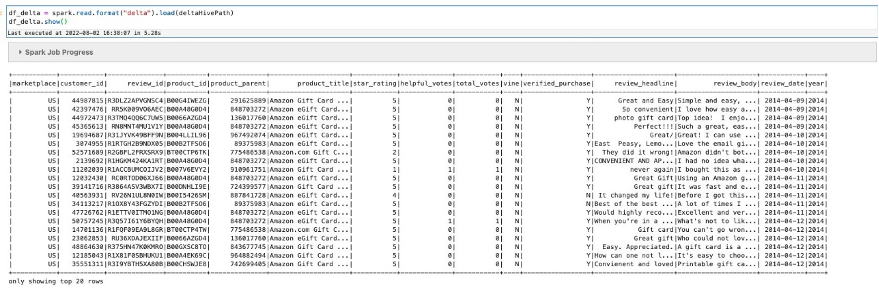
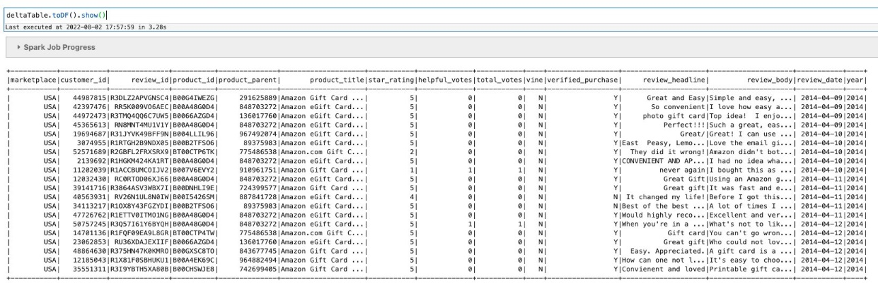
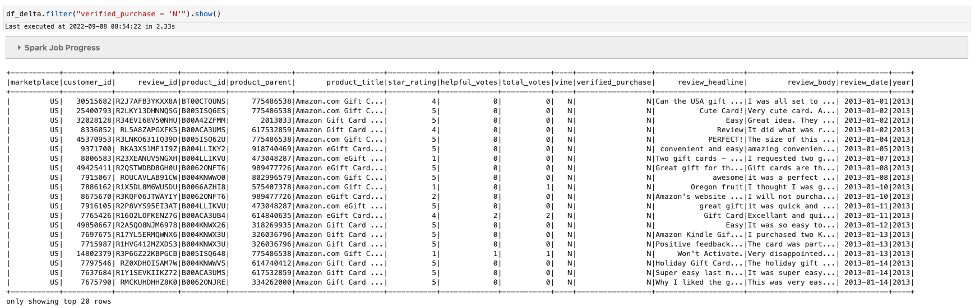

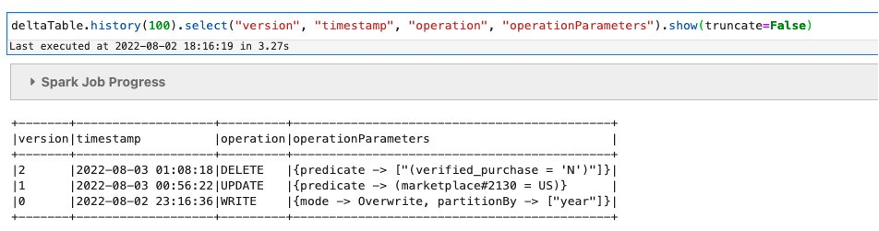
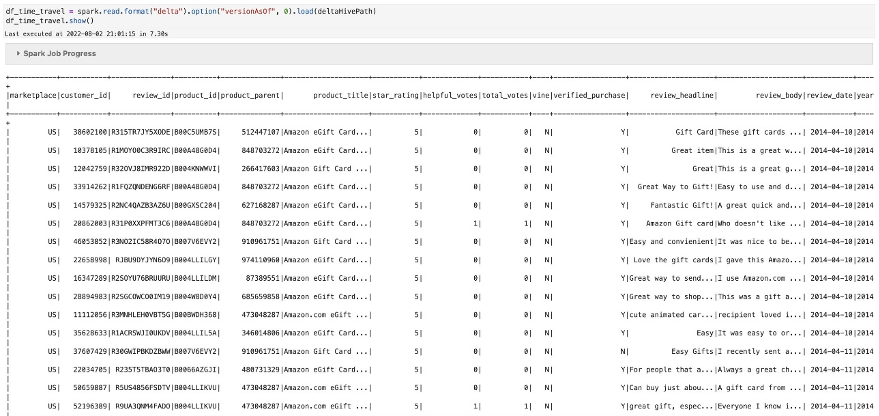


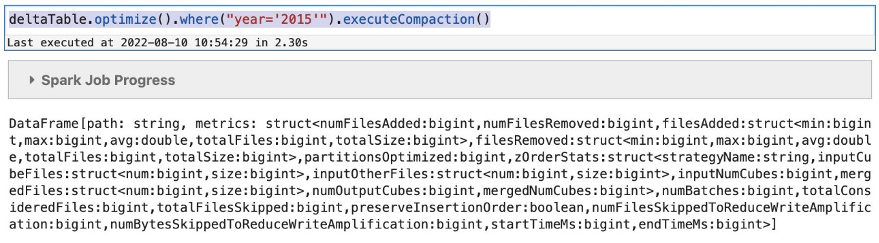
 Avijit Goswami is a Principal Solutions Architect at AWS specialized in data and analytics. He supports AWS strategic customers in building high-performing, secure, and scalable data lake solutions on AWS using AWS managed services and open-source solutions. Outside of his work, Avijit likes to travel, hike in the San Francisco Bay Area trails, watch sports, and listen to music.
 Ajit Tandale is a Big Data Solutions Architect at Amazon Web Services. He helps AWS strategic customers accelerate their business outcomes by providing expertise in big data using AWS managed services and open-source solutions. Outside of work, he enjoys reading, biking, and watching sci-fi movies.
 Thippana Vamsi Kalyan is a Software Development Engineer at AWS. He is passionate about learning and building highly scalable and reliable data analytics services and solutions on AWS. In his free time, he enjoys reading, being outdoors with his wife and kid, walking, and watching sports and movies.