Post Syndicated from digiblur DIY original https://www.youtube.com/watch?v=eh9Agjnlu00
The Murder of Morgan Earp
Post Syndicated from The History Guy: History Deserves to Be Remembered original https://www.youtube.com/watch?v=rUamgC9Jqe4
Square Units
Post Syndicated from xkcd.com original https://xkcd.com/3065/

Failing upwards: the Twitter encrypted DM failure
Post Syndicated from Matthew Garrett original https://mjg59.dreamwidth.org/71188.html
Almost two years ago, Twitter launched encrypted direct messages. I wrote about their technical implementation at the time, and to the best of my knowledge nothing has changed. The short story is that the actual encryption primitives used are entirely normal and fine – messages are encrypted using AES, and the AES keys are exchanged via NIST P-256 elliptic curve asymmetric keys. The asymmetric keys are each associated with a specific device or browser owned by a user, so when you send a message to someone you encrypt the AES key with all of their asymmetric keys and then each device or browser can decrypt the message again. As long as the keys are managed appropriately, this is infeasible to break.
But how do you know what a user’s keys are? I also wrote about this last year – key distribution is a hard problem. In the Twitter DM case, you ask Twitter’s server, and if Twitter wants to intercept your messages they replace your key. The documentation for the feature basically admits this – if people with guns showed up there, they could very much compromise the protection in such a way that all future messages you sent were readable. It’s also impossible to prove that they’re not already doing this without every user verifying that the public keys Twitter hands out to other users correspond to the private keys they hold, something that Twitter provides no mechanism to do.
This isn’t the only weakness in the implementation. Twitter may not be able read the messages, but every encrypted DM is sent through exactly the same infrastructure as the unencrypted ones, so Twitter can see the time a message was sent, who it was sent to, and roughly how big it was. And because pictures and other attachments in Twitter DMs aren’t sent in-line but are instead replaced with links, the implementation would encrypt the links but not the attachments – this is “solved” by simply blocking attachments in encrypted DMs. There’s no forward secrecy – if a key is compromised it allows access to not only all new messages created with that key, but also all previous messages. If you log out of Twitter the keys are still stored by the browser, so if you can potentially be extracted and used to decrypt your communications. And there’s no group chat support at all, which is more a functional restriction than a conceptual one.
To be fair, these are hard problems to solve! Signal solves all of them, but Signal is the product of a large number of highly skilled experts in cryptography, and even so it’s taken years to achieve all of this. When Elon announced the launch of encrypted DMs he indicated that new features would be developed quickly – he’s since publicly mentioned the feature a grand total of once, in which he mentioned further feature development that just didn’t happen. None of the limitations mentioned in the documentation have been addressed in the 22 months since the feature was launched.
Why? Well, it turns out that the feature was developed by a total of two engineers, neither of whom is still employed at Twitter. The tech lead for the feature was Christopher Stanley, who was actually a SpaceX employee at the time. Since then he’s ended up at DOGE, where he apparently set off alarms when attempting to install Starlink, and who today is apparently being appointed to the board of Fannie Mae, a government-backed mortgage company.
Anyway. Use Signal.
![]() comments
comments
Comic for 2025.03.18 – Which Came First?
Post Syndicated from Explosm.net original https://explosm.net/comics/which-came-first
New Cyanide and Happiness Comic
Migrating your on-premises workloads to AWS Outposts Rack
Post Syndicated from Art Baudo original https://aws.amazon.com/blogs/compute/migrating-your-on-premises-workloads-to-aws-outposts-rack-2/
This post is written by Craig Warburton, Senior Solutions Architect, Hybrid; Sedji Gaouaou, Senior Solutions Architect, Hybrid; and Brian Daugherty, Principal Solutions Architect, Hybrid.
Migrating workloads to AWS Outposts Rack offers you the opportunity to gain the benefits of cloud computing while keeping your data and applications on premises.
For organizations with strict data residency requirements, by deploying AWS infrastructure and services on premises, you can keep sensitive data and mission-critical applications within your own data centers or facilities, helping ensure compliance with data sovereignty laws and regulatory frameworks.
On the other hand, if your organization does not have stringent data residency requirements, you may opt for a hybrid approach, using both Outposts Rack and the AWS Regions. With this flexibility, you can process and store data in the most appropriate location based on factors such as latency, cost optimization, and application requirements.
In this post, we cover options to migrate your workloads to an Outposts Rack, taking into account your specific data residency requirements. We explore strategies, tools, and best practices to enable a successful migration tailored to your organization’s needs.
Overview
AWS has several services to help you migrate and rehost workloads, including AWS Migration Hub, AWS Application Migration Service, AWS Elastic Disaster Recovery. Alternatively, you can use backup and recovery solutions provided by AWS partners.
At AWS, we use the 7 Rs framework to help organizations evaluate and choose the appropriate migration strategy for moving applications and workloads to the AWS Cloud. The 7 Rs represent:
- Rehosting (rehost or lift and shift)
- Replatforming (lift, tinker, and shift)
- Repurchasing (republish or re-vendor)
- Refactoring (re-architecting)
- Retiring
- Retaining (revisit)
- Relocating (remigrate).
This post focuses on rehosting and the services available to help rehost on-premises applications to Outposts Rack.
Before getting started with any migration, AWS recommends a three-phase approach to migrating workloads to the cloud (AWS Region or Outposts Rack). The three phases are assess, mobilize, and migrate and modernize.

Figure 1: Diagram showing the three migration phases of assess, mobilize, and migrate and modernize
This post describes the steps that you can take in the migrate and modernize phase. However, the assess and mobilize phases are also critical to allow you to understand what applications are migrated, the dependencies between them, and the planning associated with how and when migration occurs.
Workload migration to Outposts Rack: With staging environment in a Region
After deploying an Outposts Rack to your desired on-premises location, you can perform migrations of on-premises systems and virtual machines using either Application Migration Service and AMI creation or third-party backup and recovery services. Both scenarios are described in the following sections.
Scenario 1: Using Application Migration Service with AMI creation
Application Migration Service is able to lift and shift a large number of physical or virtual servers without compatibility issues, performance disruption, or long cutover windows.
In this scenario, at least one Outposts Rack is deployed on premises with the following prerequisites:
- An AWS Replication Agent installed on each source server
- At least one Outposts Rack installed and activated
- VPC in an AWS Region
- Staging subnet for staging migrated instances
- Cutover subnet to validating migrated instances
- Extended VPC spanning Region to the Outposts Rack
- Migrated resources subnet where instances will be deployed from AMIs
The following diagram shows the solution architecture including the prerequisites and the on-premises servers that will be migrated to the Outposts Rack.

Figure 2: Architecture diagram showing migration with Application Migration Service
Step 1: Outposts Rack configuration
You can work with AWS specialists to size your Outposts for your workload and application requirements. In this scenario, you don’t need additional Outposts Rack capacity for migration because the staging area will be deployed in the Region (see 1 in Figure 2).
Step 2: Prepare Application Migration service
Set up Application Migration Service from the console in the Region to which your Outposts Rack is anchored. If this is your first setup, then choose Get started on the Application Migration Service console. When creating the replication settings template, ensure that your staging area is using subnets in the anchor Region (see 2 in Figure 2).
Step 3: Install the AWS Replication Agent to the source servers or machines
For large migrations, source servers may have a wide variety of operating system versions and may be distributed across multiple data centers. Application Migration Service offers the MGN connector, a feature that allows you to automate running commands on your source environment. Finally, ensure that communication is possible between the agent and Application Migration Service (see 3 in Figure 2).
In the following image, there is an example of deploying the AWS Replication Agent providing the necessary parameters (AWS Region, AWS access key and AWS secret access key).

When the AWS Replication Agent is installed, the server is added to the Application Migration Service console. Next, it undergoes the initial syncronization process, which is completed when showing the Ready for testing lifecycle state in the Application Migration Service console.
Step 4: Configure launch settings
Prior to testing or cutting over an instance, you must configure the launch settings by creating Amazon Elastic Compute Cloud (Amazon EC2) launch templates, ensuring that your cutover subnet is selected and that you choose an available instance type (see 4 in Figure 2). The instance type right-sizing feature allows AWS Application Migration Service to launch a test or cutover instance type that best matches the hardware configuration of the source server, by selecting the Basic option, AWS Application Migration Service will launch a test or cutover AWS instance type that best matches the OS, CPU, and RAM of your source server.
Step 5: Install AWS Systems Manager Agent on your cutover instances. When the launch settings are defined, you must activate the post-launch actions for either a specific server or all the servers. You must leave the Install the Systems Manager agent and allow executing actions on launched servers option toggled on in order for post-launch actions to work. Untoggling the option would disallow Application Migration Service to install the AWS Systems Manager Agent on your servers, and post-launch actions would no longer be executed (see 5 in Figure 2).

Figure 3: Post-launch actions on the Application Migration Service console
Step 6: Testing and cutover in Region
When you have configured the launch settings for each source server, you are ready to launch the servers as test instances. Best practice is to test instances before cutover.

Figure 4: Application Migration Service console ready to launch test instances
Finally, after completing the testing of all the source servers, you are ready for cutover (see 6 on Figure 2). Prior to launching cutover instances, check that the source servers are listed as Ready for cutover under Migration lifecycle and Healthy under Data replication status.

Figure 5: Application Migration Console ready for cutover
To launch the cutover instances, choose the instances you want to cutover and then choose Launch cutover instances under Cutover (see Figure 5). The Application Migration Service console indicates Cutover finalized when the cutover has completed successfully the chosen source servers’ Migration lifecycle column shows the Cutover complete status, the Data replication status column shows Disconnected, and the Next step column shows Mark as archived. The source servers have now been successfully migrated into AWS. You can now archive your source servers that have launched cutover instances.
Step 7: Create a Migration AMI
After migrating all your workloads in the region where the Outposts is anchored to, create Amazon Machine Images (AMI). When you create an AMI from an instance, Amazon EC2 powers down the instance before creating the AMI to make sure that everything on the instance is stopped and in a consistent state during the creation process. If you are confident that your instance is in a consistent state appropriate for AMI creation, you can tell Amazon EC2 not to power down and reboot the instance.
This step can be automated using an existing Post Launch Action.
Step 8: Launch instances on AWS Outposts
The final part is to launch your created AMIs to your Outposts. To identify the EC2 instances configured on your Outpost you can use the following AWS Command Line Interface (AWS CLI):
Outposts get-outpost-instance-types \
–outpost-id op-abcdefgh123456789
The output of this command lists the instance types and sizes configured on your Outpost:
InstanceTypes:
– InstanceType: c5.xlarge
– InstanceType: c5.4xlarge
– InstanceType: r5.2xlarge
– InstanceType: r5.4xlarge
With knowledge of the instance types configured, you can now determine how many of each are available. For example, the following AWS CLI command, which is run on the account that owns the Outpost, lists the number of c5.xlarge instances available for use:
aws cloudwatch get-metric-statistics \
–namespace AWS/Outposts \
–metric-name AvailableInstanceType_Count \
–statistics Average –period 3600 \
–start-time $(date -u -Iminutes -d ‘-1hour’) \
–end-time $(date -u -Iminutes) \
–dimensions \
Name=OutpostId,Value=op-abcdefgh123456789 \
Name=InstanceType,Value=c5.xlarge
This command returns:
Datapoints:
– Average: 10.0
Timestamp: ‘2024-04-10T10:39:00+00:00’
Unit: Count
Label: AvailableInstanceType_Count
The output indicates that there were (on average) 10 c5.xlarge instances available in the specified time period (one hour). Using the same command for the other instance types, you discover that there are also 20 c5.4xlarge, 10 r5.2xlarge, and 6 r5.4xlarge available for use in completing the necessary EC2 launch templates.
Scenario 2: Using partner backup and replication solutions
You may already be using a third-party or AWS Partner solution to create on-premises backups of bare-metal or virtualized systems. These solutions often use local disk-arrays or object stores to create tiered backups of systems covering restore-points going back years, days, or just a few hours or minutes.
These solutions may also have inherent capabilities to restore from these backups directly to the AWS. This enables migration of on-premises systems to EC2 instances deployed to Outposts Rack.
In the scenario illustrated in Figure 6, the partner backup and replication service (BR) creates backups (see 1 in Figure 6) of virtual machines to on-premises disk or object storage repositories. Using the service’s AWS integration, virtual machines can be restored (see 2 in Figure 6) to an EC2 instance deployed on Outposts Rack, which is also on-premises. The restoration may follow a process that uses helper instances and volumes (see 3 in Figure 6) during intermediate steps to create Amazon Elastic Block Store (Amazon EBS) snapshots (see 4 in Figure 6) and then AMIs of the systems being migrated (see 5 in Figure 6), which are ultimately deployed (see 6 in Figure 6) to Outposts Rack.

Figure 6: Architecture diagram of the partner backup and replication scenario
When deploying an AMI created from a restored instance you must specify the target VPC and subnet. These should be the VPC being extended to the Outpost and a subnet that has been created in that VPC on the Outpost. You also need to specify an EC2 instance type that is available on the Outpost, which can be discovered using the process described in the previous section.
Workload migration to Outposts Rack using AWS Elastic Disaster Recovery (DRS)
Data residency can be a critical consideration for organizations that collect and store sensitive information, such as personally identifiable information (PII), financial data, or medical records. AWS Elastic Disaster Recovery, supported on Outposts Rack, helps enable seamless replication of on-premises data to Outposts Rack and addresses data residency concerns by keeping data within your on-premises environment, using Amazon EBS and Amazon S3 on Outposts.
In this scenario, an Outpost Rack is deployed on-premises with the following prerequisites:
- At least one Outposts Rack installed and activated
- The Outposts Rack must be in Direct VPC Routing (DVR) mode
- VPC extended to the Outposts Rack containing subnets for staging and target resources
- Amazon S3 on Outposts (necessary for all Elastic Disaster Recovery replication destinations)
- An AWS Replication Agent installed on each source server
The following diagram shows the solution architecture and includes the on-premises servers that are migrated from the local network to the Outposts Rack. It also includes the staging VPC used to deploy the replication servers on Outposts Rack, Amazon S3 on Outposts to store the local Amazon EBS snapshots, and the target VPC extended to Outposts Rack.

Figure 7: Architecture diagram for workflow migration to Outposts Rack
Step 1: Outposts Rack configuration
To use Elastic Disaster Recovery on Outposts Rack, you need to configure both Amazon EBS and Amazon S3 on Outposts to support continuous replication and point-in-time recovery for your workload needs (see 1 in Figure 7). Specifically, you need to size the Amazon EBS and Amazon S3 on Outposts capacity according to your workload capacity requirements and application interdependencies. To do this, you can define dependency groups: each dependency group is a collection of applications and their underlying infrastructure with technical or non-technical dependencies. A 2:1 ratio is recommended for the EBS volumes to be used for near-continuous replication, and a 1:1 ratio is recommended for the Amazon S3 on Outposts ratio for EBS snapshots. For example, to migrate 40 TB of workloads, you need to plan for 80 TB of EBS volumes and 40 TB of Amazon S3 on Outposts capacity.
Step 2: Extend VPC to your Outposts Rack
When your Outpost has been provisioned and is available, extend the necessary Amazon Virtual Private Cloud (Amazon VPC) connection to the Outpost from the Region by creating the desired staging and target subnets (see 2 in Figure 7).
Step 3: Prepare Elastic Disaster Recovery service
Prepare the Elastic Disaster Recovery service from the Console to set the default replication and launch settings. When defining these settings, make sure that the Outposts resources available are chosen for staging and target subnets and instance and storage type (see 3 in Figure 7).
Step 4: Install the AWS Replication Agent to the source servers or machines
The next phase is to install the AWS Replication Agent to the source servers and to make sure that communication is possible between the AWS Replication Agent and your Outposts replication subnet through the Outposts local gateway, which makes sure that replication traffic uses the local network (see 4 in Figure 7).
Step 5: Continuous block-level replication
Staging area resources are automatically created and managed by Elastic Disaster Recovery. When the AWS Replication Agent has been deployed, continuous block-level replication (compressed and encrypted in transit) occurs (see 5 in Figure 7) over the local network.
Step 6: Launch Outposts Rack resources
Finally, migrated instances can now be launched using Outposts Rack resources based on the launch settings defined previously (see 6 in Figure 7).
Conclusion
In this post, you have learned how to migrate your workloads from your on-premises environment to AWS Outposts Rack based on your specific data residency requirements. When you have the flexibility of using AWS Regional services, AWS migration services or partner solutions can be used with infrastructure already in place. If your data must stay on-premises, then using AWS Elastic Disaster Recovery allows you to migrate your data without using Regional services, allowing you to migrate to Outposts Rack without your data leaving the boundary of a certain geographic location.
To learn more about an end-to-end migration and modernization journey, visit the AWS Migration Hub.
2024 H2 IRAP report is now available on AWS Artifact for Australian customers
Post Syndicated from Patrick Chang original https://aws.amazon.com/blogs/security/2024-h2-irap-report-is-now-available-on-aws-artifact-for-australian-customers/
Amazon Web Services (AWS) is excited to announce that a new Information Security Registered Assessors Program (IRAP) report (2024 H2) is now available through AWS Artifact. An independent Australian Signals Directorate (ASD) certified IRAP assessor completed the IRAP assessment of AWS in February 2025.
The new IRAP report includes an additional six AWS services that are now assessed at the PROTECTED level under IRAP. This brings the total number of services assessed at the PROTECTED level to 164.
The following are the six newly assessed services:
- AWS CodeConnections
- AWS HealthLake
- Amazon Kinesis Video Streams
- Amazon Managed Grafana
- Amazon Verified Permissions
- Amazon WorkSpaces Secure Browser
For the full list of services, see the IRAP tab on the AWS Services in Scope by Compliance Program page.
AWS has developed an IRAP documentation pack to help Australian customers and their partners plan, architect, and assess risk for their workloads when they use AWS Cloud services.
We developed this pack in accordance with the Australian Cyber Security Centre (ACSC) Cloud Security Guidance and Cloud Assessment and Authorisation framework, which addresses guidance within the Australian Government’s Information Security Manual (ISM, September 2024 version), the Department of Home Affairs’ Protective Security Policy Framework (PSPF), and the Digital Transformation Agency’s Secure Cloud Strategy.
The IRAP pack on AWS Artifact also includes newly updated versions of the AWS Consumer Guide and the whitepaper Reference Architectures for ISM PROTECTED Workloads in the AWS Cloud.
Reach out to your AWS representatives to let us know which additional services you would like to see in scope for upcoming IRAP assessments. We strive to bring more services into scope at the PROTECTED level under IRAP to support your requirements.
If you have feedback about this post, submit comments in the Comments section below. If you have questions about this post, contact AWS Support.
Enable single-sign-on for Amazon WorkMail with IAM Identity Center and Okta Universal Directory
Post Syndicated from Zip Zieper original https://aws.amazon.com/blogs/messaging-and-targeting/enable-single-sign-on-for-amazon-workmail-with-iam-identity-center-and-okta-universal-directory/
Securing your business email is more critical than ever in today’s digital workplace. To help you protect your users and data in Amazon WorkMail (WorkMail), we regularly introduce security features that give organizations more control and protection for their business email. Thanks to the recently announced integration between WorkMail and AWS Identity and Access Management (IAM) Identity Center (IAM IdC), WorkMail users can now enjoy single sign-on (SSO) via compatible 3rd party external identity providers including Okta Universal Directory (Okta), Microsoft Entra ID, Google Workspace, JumpCloud, OneLogin, Ping Identity products and Active Directory.
This blog post explains the specific steps needed to integrate WorkMail with Okta via IAM IdC. WorkMail customers who use other 3rd party identity providers that are compatible with IdC will also find this post useful alongside the AWS documentation for their specific identity source. Alternatively, WorkMail organization administrators who do not use an external identity provider, but wish to enable multi-factor-authentication (MFA) for WorkMail viaIAM IdC will find guidance in a different blog post.
By integrating WorkMail with Okta via IAM IdC, users benefit from the security, convenience, and familiarity of SSO when accessing their WorkMail inbox and calendars via the WorkMail web-app. WorkMail organization administrators benefit from the security and efficiency of managing WorkMail user additions, modifications, or removals via the Okta admin tools. More detailed information about this integration can be found in the IAM IdC documentation as well as in the WorkMail documentation.
Introduction
Email remains a critical business communication tool, yet it is also one of the most targeted entry points for cyber threats. A single compromised email account can expose sensitive business data, damage an organization’s reputation, and serve as a gateway for further cyber attacks. As traditional username and password authentication becomes increasingly inadequate, organizations must adopt stronger access controls to protect their users and communications.
You can enhance your WorkMail organization’s security and simplify user authentication with SSO and a familiar login experience by integrating WorkMail with IAM IdC and Okta. This (and similar) integrations provide a more seamless authentication experience and helps administrators enforce consistent security policies across their organization.
The integration between WorkMail, IAM IdC and Okta supports these industry standards:
- System for Cross-domain Identity Management (SCIM) – Which enables automated user provisioning and identity synchronization across systems and applications.
- Security Assertion Markup Language (SAML) – Which provides secure authentication and authorization by exchanging identity and privilege information between identity providers and WorkMail.
WorkMail authentication options
When you first set up WorkMail, you use the built-in user directory which relies upon standard username | password authentication for the WorkMail web browser client as well as popular desktop and mobile email clients such as Microsoft Outlook, Apple Mail and Thunderbird.

By default, WorkMail uses username | password authentication
The integration between IAM Identity Center and Okta uses the SCIM protocol to provision and map user attributes in Okta to named attributes in IAM IdC. Once enabled, user and group information from Okta is automatically synchronized with IAM IdC. IAM IdC in turn uses the SAML protocol to provide Okta users with a familiar and convenient SSO experience.
After integrating IAM IdC with Okta, WorkMail uses:
- Okta SSO for users of the WorkMail web-app.
- Personal access tokens (PAT) for users of desktop &/or mobile email applications.

After integration with IdC and Okta, WorkMail uses SSO (web-app) and username | PAT (desktop/mobile) for authentication
Prerequisites for the WorkMail, IAM IdC and Okta integration
- Admin access to an AWS account
- You can evaluate the integration in this post for a limited period of time using an AWS Free Tier Account
- Admin access to an Amazon WorkMail Organization
- The integration uses the email domain that is configured as WorkMail’s default
- Admin access to Amazon IAM Identity Center
- Or admin access to the IdC organization account
- Your WorkMail and IAM Identity Center must be in the same AWS region
- IAM Role with the security credentials needed to deploy AWS infrastructure via the AWS CDK
- Administrator access to a fully functional Okta Identity account populated with users and (optionally) group(s) that you want to integrate and synchronize with IAM IdC and WorkMail.
- Access to the AWS Samples GitHub repository, where you’ll find sample code that deploys via AWS CDK. This code sample deploys a customizable AWS Lambda initially configured to perform user synchronization between IAM IdC and WorkMail every 15 minutes.
- A source code editor such as Visual Studio Code with your AWS admin credentials.
High-level Steps
- Configure Identity Center (See our documentation for detailed information).
- Configure Okta Identity integration with IAM Identity Center. See this post for more information
- Provision and synchronize Okta’s Groups (or Okta Users) with IAM Identity Center
- Configure WorkMail to use Identity Center
- Deploy the AWS CDK sample project found in aws-samples in GitHub
- Test user access to WorkMail with and without Okta SSO (web-app) and Personal Access Token (desktop & mobile email clients)
- Notify WorkMail users of upcoming changes to login procedures.
- Switch WorkMail Authentication Mode to IAM IdC.
Detailed Configuration Guidance
The instructions that follow walk you through the steps needed to integrate your Okta system with IAM IdC. Once IAM IdC is synchronizing with Okta, you’ll integrate IAM IdC with WorkMail. This process will keep your WorkMail organization’s users and groups synchronized with Okta. Once fully enabled, your WorkMail users will use their Otka SSO credentials to access the WorkMail web-client or a username and unique Personal Access Tokens to access desktop &/or mobile email clients. Let’s get started!
Configure Okta integration with IAM Identity Center (these steps have been adapted from this blog post)
-
- Open the Okta admin landing page in a new browser (tab).

-
- Click the Applications Section in the left menu.
- Click on Applications in the dropdown menu.
- Click Browse App Catalog.

-
- Type AWS IAM Identity Center in the search box.
- Click on the app that matches AWS IAM Identity Center.

-
- Click Add Integration to initiate the integration process.

-
- Type a memorable name (like
Workshop AWS IAM Identity Center) for the application label, and click Done.
- Type a memorable name (like

-
- Click on the Sign On tab, scroll down to view SAML Signing Certificates.

-
- Click Actions to download the certificate to your local machine. Keep the Okta Admin dashboard Open, you will need the SAML information found here to configure IdC in the next section.
Configure AWS IAM IdC
- In a new browser window (or tab), open the IAM IdC console in the same region as your WorkMail Organization (we’re using us-east-1).
- If this is your first time accessing IAM IdC, you’ll be greeted with the IdC console home page prompting you to “Enable IAM Identity Center”. Click Enable.

- Check that you are in the correct region, click Enable (note – this will enable an Organization instance of IdC, which is recommended. If you want to use an Account instance of IdC, please see the documentation).

- Once IdC has been enabled, scroll down to the IAM Identity Center setup section and click Confirm Identity Source.

- Click Actions, and select Change identity source from dropdown menu.

- Select External identity provider and click Next.

- Upload the SAML certificate you downloaded from Okta (above, step xx)
- Open the Okta dashboard browser/tab. Under the SAML 2.0 configuration, scroll down and expand > More details.
-
- Copy the Sign on URL from Okta SAML and paste the URL into the IdP sign-in URL field in IdC.
- Copy the Issuer URL from Okta SAML and paste the URL into the IdP sign-in URL field in IdC.
- Click Next.
- Type ACCEPT in the confirmation text box & click Change identity source.

- Switch back to the IAM IdC console browser window/tab. On the Settings page, locate the Automatic provisioning information box, and then choose Enable. Leave this browser window/tab open as you’ll need it to copy the values for the SCIM endpoint and Access token into Okta shortly (note – IdC Automatic provisioning uses SCIM protocol to provision users from Okta).

- Return to the Okta admin dashboard (you should have left it open in another browser window or tab). Under IAM Identity Center applications, select the Workshop AWS IAM Identity Center and open the Provisioning tab.
- Under Integration, click Configure API Integration.

- Select the checkbox next to Enable API integration to enable provisioning.
- Refer to the IAM IcC console browser window/tab you left open and copy (from IdC) and paste (into Okta) the values for:
-
- Base URL field – paste the IdC SCIM endpoint value (make sure there is no trailing forward slash at the end of the URL).
- API Token field, enter the Access token value.
- Import Groups should be checked
- Click Test API Credentials to verify the credentials entered are valid (the message AWS IAM Identity Center was verified successfully! should appear).

- Save.
- Under Settings, choose To App, click Edit and select Enable for Create Users, Update User Attributes and Deactivate Users. Click Save.

- In the Okta admin dashboard’s left-hand menu pane, click on Directory.
-
- Choose Groups to see the list of existing groups.
- Click on the Add Group button to create a new group called workmail_users.
- Fill in the required details for the new group, including:
- Group Name: Enter
workmail_usersfor the group. - Group Description (optional): Provide a description for the group’s purpose (
WorkMail_users).
- Group Name: Enter
- Save the New Group
- Reload the page to see the newly created group
- Click Assign people
- Add Okta users to the workmail_users group
- Click Save
- In the Okta admin dashboard’s left-hand menu pane, click on Applications and open the AWS IAM Identity Center application.
- Click the Assignments tab, choose Assign, then choose Assign to people.
- Choose the Okta users that you want to have access to WorkMail via IAM Identity Center app.
- For each user, click Assign, review the user info, and click Save then Go Back
- When all Okta users for whom you want WorkMail users created/synced have been assigned, click Done to start the process of provisioning the users into IAM Identity Center.

- On the Assignments page, choose Assign, and then choose Assign to groups.
- Click the Okta group (
workmail_users) that you want to have access to WorkMail via IAM Identity Center. - Click Assign, review the selections, click Save and Go Back. Click Done. This starts the process of provisioning the users in the workmail_users group into IAM Identity Center.
- Choose the Push Groups tab.
- Choose the
workmail_usersgroup that contains all the users that you assigned to the IAM Identity Center app. - If the group is not found in the list, choose the Find groups by name option by clicking (+)Push Groups Menu.
- Enter the group name (
workmail_users) that you created in the previous step and select it from the search results - Click Save. The group status changes to “pushing” then “Active” (this can take several minutes), once the Okta workmail_users group and all its members have been pushed to IAM Identity Center.
- Return to the browser window/tab with the IAM Identity Center console.
- In the left navigation, select Groups (or Users) (you should see the Group (or users) list that was just populated by the Okta “push” action).

Enable IAM Identity Center in Amazon WorkMail
- Open a new browser window (tab) to the WorkMail console in the same region as IdC, and open your WorkMail Organization.
- In WorkMail’s left navigation rail click Identity Center
- Click on Multi-factor authentication setup guide, Click Enable Identity Center, read the default configuration notice ,and click Enable

- Under Identity Center Settings, click the Authentication mode tab and ensure it is set for WorkMail directory and Identity center (this is the default).
- This mode is needed for testing and to allow desktop & mobile email client users to retrieve their unique personal access tokens.
- Once the integration with IdC is successfully tested, and those WorkMail users who rely on desktop or mobile email clients for access have had the opportunity to login to the WorkMail web app to retrieve a PAT, you will change the Authentication mode to Identity center only.
Deploy the sample solution from GitHub
Solution prerequisites:
– AWS Account
– AWS IAM user with Administrator permissions
– Python (> v3.x) and Pip fully installed and configured on your computer
– AWS CLI (v2) installed and configured on your computer
– AWS CDK (v2) installed and configured on your computer
– Sample CDK project that creates and deploys an AWS Lambda in your AWS account to perform users synchronization between IAM IdC and WorkMail.
The instructions that follow guide you in deploying a sample solution for the AWS Samples Serverless-Mail repository that programmatically creates/syncs WorkMail users from IAM Identity Center using the AWS CDK CLI. The sample uses naming conventions used in this blog. For example, the Lambda only syncs those users found in the IdC Group named "workmail_users". If your IdC group has a different name, or you want to sync multiple IdC groups with WorkMail, you will need to modify the sample code before proceeding. (BE AWARE: The sample code base is an Open Source starter project designed to provide a demonstration and a base to start from for specific use cases. It should not be considered fully Production-ready, nor should it be deployed in a production environment. Refer to the README.md and License.md for more information.)
- Clone the sample project to your computer (
git clone https://github.com/aws-samples/serverless-mail/tree/main/idc_okta-workmail). CD into the ‘idc_okta-workmail‘ directory. - Create a virtual environment for packaging in Python (Docker must already be running locally) with
python3 -m venv .venv Activate the virtual environment withsource .venv/bin/activate- Make sure
cdk.jsonreferences the correct path to Python (by default cdk.json refers to.venv/bin/python app.py). If you need to locate Python, run thewhich pythoncommand. - Install the project dependencies with
pip3 install -r requirements.txt - Check the AWS CLI local credentials and region with
aws sts get-caller-identity. If you need to change any parameter, runaws configure - Prepare the `app.py` file by running
python3 get-my-variables.py. The ‘get-my-variables.py’ script fetches the necessary variables from your AWS account and create the `app.py` file needed by the CDK. You may want to review the auto-generated `app.py` file for accuracy, especially if the AWS account has been used for other IdC or WorkMail related projects. The app.py file requires the following account variables:- AWS accountId
- AWS Region – the region must be the same for IdC and WorkMail.
- IDENTITYSTORE_ID – – found in the Identity Center console under settings or via the AWS CLI
aws identitystore list-groups --identity-store-id {identity_store_id} - IDENTITY_CENTER_INSTANCE_ARN – found in the Identity Center console under settings or via the AWS CLI
aws sso-admin list-instances - IDENTITY_CENTER_APPLICATION_ARN – found in the Identity Center console under Applications or via the AWS CLI
aws sso-admin list-applications --instance-arn {instance_arn}` - WORKMAIL_ORGANIZATION_ID – found in the WorkMail console under Organizations or via the AWS CLI
aws workmail list-organizations - OKTA_GROUP_ID_TO_ASSIGN_TO_WORKMAIL – found in the Identity Center console under Groups > General Information or via the AWS CLI
aws identitystore list-groups --identity-store-id {identity_store_id}
- Bootstrap the package (this step may take several minutes to complete) with
cdk bootstrap - Synthesize the package (this step may take several minutes to complete) with
cdk synthesize - Deploy your package (this step may take several minutes to complete) with
cdk deployand follow the prompts in the AWS CDK CLI. - Once deployment to your AWS account starts, you can view the deployment status in the CloudFormation console.
Confirm WorkMail Authentication mode
WorkMail’s default Authentication mode should be set to WorkMail directory and Identity center. Don’t change this yet. This mode will allow WorkMail web-app users to continue to login to the WorkMail client directly, without Okta SSO. WorkMail’s Personal access token configuration default is set to active, and token lifespan set to 365 days. You can change this if your security needs differ from the default. PATs are used by desktop and mobile email clients to login to WorkMail. Leaving WorkMail’s default Authentication mode set to WorkMail directory allows desktop and mobile email clients to continue to login to the WorkMail with their username and password, without yet requiring a PAT instead of password.
Conduct a few spot tests to verify WorkMail web-app users can properly access their WorkMail accounts via:
- The Amazon WorkMail web application URL (found on the WorkMail organization page)

- Your organization’s unique AWS access portal URL (found on the setting page of the IAM IdC dashboard).

- This will open a new browser tab that redirects to the Okta user login page.

- Once user has authenticated, this page will redirect to the AWS access portal with linked application tiles to all of the AWS applications that have been integrated with IAM Identity Center.

- Click on the WorkMail logo, and the WorkMail web-app will load.

- Desktop or mobile email software users need to create a WorkMail Personal Access Token (PAT) to access WorkMail. These users must retrieve their own PATs after logging into the WorkMail web-client. Open the Webmail login link found on the WorkMail Organization page under User Login
- In the WorkMail web-app,
- click the settings gear (in top right)
- Click Personal Access token and enter a token name (i.e.
desktop-thunderbird-pat) - Click Create token.
- Click Create token.
- Copy the token value (this is the only time you can retrieve this token value).
- Open your desktop or mobile email software, enter your username and your PAT (the PAT replaces your existing user password).

- In settings, click Personal Access token and Create token
- Enter a token name (typically the device on which you’ll use this PAT) and select create token.
- Copy the token value (this is the only time you can retrieve this token value).
- Open your desktop or mobile email software, enter your username and your PAT (the PAT replaces your existing user password), and test your new login (username | PAT).

Notify your WorkMail users of upcoming changes to login procedures
Once you have tested the integration between WorkMail and IAM Identity Center with a few test users, you should prepare your WorkMail users for the increased login security. For example, you could send them an email that explains:
- The organization is adding an additional login security step to help protect their inboxes.
- Inform them that they should anticipate an email from the AWS IAM Identity Center with info about the upcoming implementation of MFA for web-app users and PATs for desktop and mobile client users.
- Users should accept the invitation and create a new password for the AWS IAM Identity Center.
- Inform them that once WorkMail MFA is enabled, all WorkMail web-app users will be required to use their username, password and MFA.
- Inform them that once WorkMail PATs are enabled, all WorkMail desktop and mobile email client users will need to login to the WorkMail web client (with MFA) via the AWS access portal URL, create one PAT per software client (the same PAT can not be used on desktop and mobile). They then must update their desktop or mobile email software to use their username and PAT, instead of their current password. Explain that the PAT is now their email client application password and their personal desktop or mobile email software passwords will no longer work.
- Provide users with a way to request support.
Switch WorkMail Authentication Mode to Identity Center only
- Once you are satisfied that your WorkMail users have incorporated Okta SSO and/or PATs into their WorkMail login routines, the WorkMail administrator should disable the WorkMail directory Authentication mode found in the WorkMail console under Organization > Identity Center.

- Optional – Ask several trusted users to test their ability to login to WorkMail web app via Okta credentials.
Congratulations, your WorkMail organization’s authentication is now being managed by IAM Identity Center and your external identity provider, Okta.
Conclusion
By integrating IAM Identity Center with Okta Identity and WorkMail, you can provide your users with the convenience of Okta SSO for the WorkMail web-app. This allows your organization to improve it’s email security posture, better safeguard sensitive communications and protect you WorkMail organization against unauthorized access. Furthermore, this integration reduces admin overhead as user access to WorkMail is allowed, or revoked via the Okta administration dashboard.
Take control of your email communications today with Amazon WorkMail:
- Visit the WorkMail Console to begin configuration.
- Enable IAM Identity Center Integration with Okta and WorkMail.
- Connect your WorkMail organization to centralized access management.
- Configure WorkMail to require:
- Okta SSO – Adds an extra layer of security for web-app users.
- Personal Access Tokens (PAT) – Add an extra layer of security for desktop and mobile client access.
Need guidance? Check out our technical documentation. Contact your AWS account team.
To help keep your WorkMail organization secure, we recommend:
- Regularly reviewing your WorkMail audit logs for unexpected activity.
- Monitoring for unauthorized access attempts.
- Staying informed about the latest security practices.
Dive deeper into WorkMail security with these resources:
Join the Conversation:
Connect with other administrators and security professionals on the AWS re:Post community to share insights and learn best practices.
[$] Oxidizing Ubuntu: adopting Rust utilities by default
Post Syndicated from jzb original https://lwn.net/Articles/1014002/
If all goes according to plan, the Ubuntu project will soon be
replacing many of the traditional GNU utilities with implementations
written in Rust, such as those created by the uutils project, which we covered in
February. Wholesale replacement of core utilities at the heart of a
Linux distribution is no small matter, which is why Canonical’s VP of
engineering, Jon Seager, has released oxidizr. It
is a command-line utility that helps users easily enable or disable
the Rust-based utilities to test their suitability. Seager is calling
for help with testing and for users to provide feedback with their
experiences ahead of a possible switch for Ubuntu 25.10, an interim release
scheduled for October 2025. So far, responses from the Ubuntu
community seem positive if slightly skeptical of such a major
change.
NVIDIA GTC 2025 Keynote Live Coverage
Post Syndicated from Ryan Smith original https://www.servethehome.com/nvidia-gtc-2025-keynote-live-coverage/
We are covering the NVIDIA GTC 2025 keynote where we expect a huge number of announcements in GPUs, AI, networking, and robotics
The post NVIDIA GTC 2025 Keynote Live Coverage appeared first on ServeTheHome.
AWS completes the annual UAE Information Assurance Regulation compliance assessment
Post Syndicated from Vishal Pabari original https://aws.amazon.com/blogs/security/aws-completes-the-annual-uae-information-assurance-regulation-compliance-assessment-2/
Amazon Web Services (AWS) is pleased to announce the publication of our annual compliance assessment report on the Information Assurance Regulation (IAR) established by the Telecommunications and Digital Government Regulatory Authority (TDRA) of the United Arab Emirates (UAE). The report covers the AWS Middle East (UAE) Region.
The IAR provides management and technical information security controls to help establish, implement, maintain, and continuously improve information assurance. AWS alignment with IAR requirements demonstrates our ongoing commitment to adhere to the heightened expectations for cloud service providers. As such, IAR-regulated customers can continue to use AWS services with confidence.
Independent third-party auditors from BDO evaluated AWS for the period of November 1, 2023, to October 31, 2024. The assessment report that illustrates the status of AWS compliance is available through AWS Artifact. AWS Artifact is a self-service portal for on-demand access to AWS compliance reports. Sign in to AWS Artifact in the AWS Management Console, or learn more at Getting Started with AWS Artifact.
AWS strives to continuously bring services into the scope of its compliance programs to help you meet your architectural and regulatory needs. If you have questions or feedback about IAR compliance, reach out to your AWS account team.
To learn more about our compliance and security programs, see AWS Compliance Programs. As always, we value your feedback and questions; reach out to the AWS Compliance team through the Contact Us page.
If you have feedback about this post, submit comments in the Comments section below.
Gaza Is Struggling to Keep Clean Water Flowing
Post Syndicated from The Atlantic original https://www.youtube.com/watch?v=iPtygeRR75o
Implement Amazon EMR HBase Graceful Scaling
Post Syndicated from Yu-Ting Su original https://aws.amazon.com/blogs/big-data/implement-amazon-emr-hbase-graceful-scaling/
Apache HBase is a massively scalable, distributed big data store in the Apache Hadoop ecosystem. We can use Amazon EMR with HBase on top of Amazon Simple Storage Service (Amazon S3) for random, strictly consistent real-time access for tables with Apache Kylin. It ingests data through spark jobs and queries the HTables through Apache Kylin cubes. The HBase cluster uses HBase write-ahead logs (WAL) instead of Amazon EMR WAL.
A time goes by, companies may want to scale in long-running Amazon EMR HBase clusters because of issues such as Amazon Elastic Compute Cloud (Amazon EC2) scheduling events and budget concerns. Another issue is that companies may use Spot Instances and auto scaling for task nodes for short-term parallel computation power, like MapReduce tasks and spark executors. Amazon EMR also runs HBase region servers on task nodes for Amazon EMR on S3 clusters. Spot interruptions will lead to an unexpected shutdown on HBase region servers. For an Amazon EMR HBase cluster without enabling write-ahead logs (WAL) for Amazon EMR feature, an unexpected shutdown on HBase region servers will cause WAL splits with server recovery process, and it will bring extra load to the cluster and sometimes makes HTables inconsistent.
For these reasons, administrators look for a way to scale-in Amazon EMR HBase cluster gracefully and stop all HBase region servers on the task nodes.
This post demonstrates how to gracefully decommission target region servers programmatically. The scripts do the following tasks. The script also tests successfully in Amazon EMR 7.3.0, Amazon EMR 6.15.0, and 5.36.2.
- Automatically move the HRegions through a script
- Raise the decommission priority
- Decommission HBase region servers gracefully
- Prevent Amazon EMR provisioning region servers on task nodes by Amazon EMR software configurations
- Prevent Amazon EMR provisioning region servers on task nodes by Amazon EMR steps
Overview of solution
For graceful scaling in, the script uses HBase built-in graceful_stop.sh to move regions to other region servers to avoid WAL splits when decommissioning nodes. The script uses HDFS CLI and web interface to make sure there are no missing and corrupted HDFS block during the scaling events. To prevent Amazon EMR provisions HBase region servers on task nodes, administrators need to specify software configurations per instance groups when launching a cluster. For existing clusters, administrators can either use a step to terminate HBase region servers on task nodes, or reconfigure the task instance group’s HBase storagerootdir.
Solution
For a running Amazon EMR cluster, administrators can use AWS Command Line Interface (AWS CLI) to issue a modify-instance-groups with EC2InstanceIdsToTerminate to terminate specified instances immediately. But terminating an instance in this way can cause a data loss and unpredictable cluster behavior when HDFS blocks have not enough copies or there are ongoing tasks on those decommissioned nodes. To avoid these risks, administrators can send a modify-instance-groups with a new instance request count without a specific instance ID that administrators want to terminate. This command triggers a graceful decommission process on the Amazon EMR side. However, Amazon EMR only supports graceful decommission for YARN and HDFS. Amazon EMR doesn’t support graceful decommission for HBase.
Hence, administrators can try method 1, as described later in this post, to raise the decommission priority of the decommission targets as the first step. In case tweaking the decommissions priority didn’t work, move forward to the second approach, method 2. Method 2 is to stop the resizing request, and move the HRegions manually before terminating the target core nodes. Note that Amazon EMR is a managed service. Amazon EMR service will terminate the EC2 instance after anyone stops it or detach its Amazon Elastic Block Store (Amazon EBS) volumes. Therefore, don’t try to detach EBS volumes on the decommission targets and attach them to new nodes.
Method 1: Decommission HBase region servers through resizing
To decommission Hadoop nodes, administrators can add decommission targets to HDFS’s and YARN’s exclude list, which were dfs.hosts.exclude and yarn.nodes.exclude.xml. However, Amazon EMR disallows manual update to these files. The reason is that the Amazon EMR service daemon, master instance controller, is the only valid process to update these two files on master nodes. Manual updates to these two files will be reset.
Thus, one of the most accessible ways to raise a core node’s decommission priority according to Amazon EMR is having less instance controller heartbeat.
As the first step, pass move_regions to the following script on Amazon S3, blog_HBase_graceful_decommission.sh, as an Amazon EMR step to move HRegions to other region servers and shutdown processes of region server and instance controller. Please also provide targetRS and S3Path to blog_HBase_graceful_decommission.sh. targetRS represents to the private DNS of the decommission target region server. S3Path represents the location of the region migration script.
This step needs to be run in off-peak hours. After all HRegions on the target region server are moved to other nodes, splitting WAL activities after stopping the HBase region server will generate a very low workload to the cluster because it serves 0 regions.
For more information , refer to blog_HBase_graceful_decommission.sh.
Taking a closer look at the move_regions option in blog_HBase_graceful_decommission.sh, this script disables the region balancer and moves the regions to other region servers. The script retrieves Secure Shell (SSH) credentials from AWS Secrets Manager to access worker nodes.
In addition, the script included some AWS CLI operations. Please make sure the instance profile, EMR_EC2_DefaultRole, can operate the following APIs and have SecretsManagaerReadWrite permission.
Amazon EMR APIs:
describe-clusterlist-instancesmodify-instance-groups
Amazon S3 APIs:
cp
Secrets Manager APIs:
get-secret-value
In Amazon EMR 5.x, HBase on Amazon S3 will make the master node also work as a region server hosting hbase:meta regions. This script will get stuck when trying to move non-hbase:meta HRegions to the master. To automate the script, the parameter, maxthreads, is increased to move regions through multiple threads. By moving regions in a while loop, one of the threads got a runtime error because it tries to move non-hbase:meta HRegions to the master node. Other threads can keep on moving HRegions to other region servers. After the only stuck thread timed out after 300 seconds, it moves forward to the next run. After six retries, manual actions will be required, such as using a move action through the HBase shell for the remaining regions’ movement or resubmitting the step.
The following is the syntax to use the script to invoke the move_regions function through blog_HBase_graceful_decommission.sh as an Amazon EMR step:
Here’s an Amazon EMR step example to move regions:
In the HBase web UI, the target region server will serve 0 regions after the evacuation, as shown in the following screenshot.

After that, the stop_RS_IC function in the script stopped the HBase region server and instance controller process on the decommission target after making sure that there is no running YARN container on that node.
Note that the script is for Amazon EMR 5.30.0 and later release versions. For Amazon EMR 4.x-5.29.0 release versions, stop_RS_IC in the script needs to be updated by referring to How do I restart a service in Amazon EMR? In the AWS Knowledge Center. Also, in Amazon EMR versions earlier than 5.30.0, Amazon EMR uses a service nanny to watch the status of other processes. If a service nanny automatically restarts the instance controller, please stop the service nanny using the stop_RS_IC function before stopping the instance controller on that node. Here’s an example:
After the step is successfully completed, scale in and define (current core node amount is −1) as the desired target node amount using the Amazon EMR console. Amazon EMR might pick up the target core node to decommission it because the instance controller isn’t running on that node. There can be a few minutes of delay for Amazon EMR to detect the heartbeat loss of that target node through polling the instance controller. Thus, make sure the workload is very low and there will be no container to the target node for a while.
Stopping the instance controller merely increases the decommissioning priority. But method 1 doesn’t guarantee that the target core node will be picked up as the decommissioning target by Amazon EMR. If Amazon EMR doesn’t pick up the decommission target as the decommissioning victim after using method 1, administrators can stop the resize activity using the AWS Management Console. Then, proceed to method 2.
Method 2: Manually decommission the target core nodes
Administrators can terminate the node using the EC2InstanceIdsToTerminate option in the modify-instance-groups API. But this action will directly terminate the EC2 instance and will risk losing HDFS blocks. To mitigate the risk of having a data loss, administrators can use the following steps in off-peak hours with zero or very few running jobs.
First, run the move_hregions function through blog_HBase_graceful_decommission.sh as an Amazon EMR step in method 1. The function moves HRegions to other region servers and stopped the HBase region server as well as the instance controller process.
Then, run the terminate_ec2 function in blog_HBase_graceful_decommission.sh as an Amazon EMR step. To run this function successfully, please provide the target instance group ID and target instance ID to the script. This function merely terminates one node at a time by specifying the EC2InstanceIdsToTerminate option in the modify-instance-groups API. This makes sure that the core nodes are not terminated back-to-back and lowered the risks of missing HDFS blocks. It inspects HDFS and makes sure all HDFS blocks had at least two copies. If an HDFS block have only one copy, the script will exit with an error message similar to, “Some HDFS blocks have only 1 copy. Please increase HDFS replication factor through the following command for existing HDFS blocks.”
To make sure all upcoming HDFS blocks have at least two copies, reconfigure the core instance group with the following software configuration:
In addition, the terminateEC2 function compares the metadata of the replicating blocks before and after terminating the core node using hdfs dfsadmin -report. This makes sure no under-replicating, corrupted, or missing HDFS block increased.
The terminateEC2 function tracked decommission status. The script will complete after the decommission completes. It can take some time to recover HDFS blocks. The elapsed time depends on several factors such as the total number of blocks, I/O, bandwidth, HDFS handler amount, and name node resources. If there are many HDFS blocks to be recovered, it may take a few hours to complete. Before running the script, please make sure that the instance profile, EMR_EC2_DefaultRole, have permission of elasticmapreduce:ModifyInstanceGroups.
The following is the syntax to use the script to invoke the terminate_ec2 function through blog_HBase_graceful_decommission.sh as an Amazon EMR step:
Here’s an Amazon EMR step example to move regions:
While invoking terminate_ec2, the script checks HDFS Name Node Web UI for the decommission target to understand how many blocks need to be recovered on other nodes after submitting the decommission request. Here are the steps:
- On the Amazon EMR console, version 6.x, find HDFS NameNode web UI. For example, enter http://<master-node-public-DNS>:9870
- On the top menu bar, choose Datanodes
- In the In operation section, check the on-service data nodes and the total number of data blocks on the nodes, as shown in the following screenshot.

- To view the HDFS decommissioning progress, go to Overview, as shown in the following screenshot.


On the Datanodes page, the decommission target node will not have a green checkmark, and the node will be in the Decommissioning section, as shown in the following screenshot.


The step’s STDOUT also reveals the decommission status:
The decommission target will transit from Decommissioning to Decommissioned in the HDFS NameNode web UI, as shown in the following screenshot.

The decommissioned target will appear in the Dead datanodes section in the step’s STDOUT after the process is completed:
After the target node is decommissioned, the hdfs dfsadmin report will be displayed in the last section in the step’s STDOUT . There should be no difference between rep_blocks_${beforeDate} and rep_blocks_${afterDate} as described in the script. It means no additional amount of under-replicated, missing, or corrupt blocks after the decommission. In HBase web UI, the decommissioned region server will be moved to dead region servers. The dead region server records will be reset after restarting HMaster during routine maintenance.

After the Amazon EMR step is completed without errors, please repeat the preceding steps to decommission the next target core node because administrators may have more than one core nodes to decommission.
After administrators complete all decommission tasks, administrators can manually enable the HBase balancer through the HBase shell again:
Prevent Amazon EMR from provisioning HBase region servers on task nodes
For new clusters, configure HBase settings for master and core groups only and keep the HBase settings empty when launching an Amazon EMR HBase on an S3 cluster. This prevents provisioning HBase region servers on task nodes.
For example, define configurations for applications other than HBase settings in the software configuration textbox in the Software settings section on the Amazon EMR console, as shown in the following screenshot.

Then, configure HBase settings in Node configuration – optional for each instance group in the Cluster configuration – required section, as shown in the following screenshot.

For master and core instance groups, HBase configurations will be like the following screenshot.

Here’s a json formatted example:
For task instance groups, there will be no HBase configuration, as shown in the following screenshot.

Here’s a json formatted example:
Here’s an example in AWS CLI:
Stop decommission the HBase region servers on task nodes
For an existing Amazon EMR HBase on an S3 cluster, pass stop_and_check_task_rs to blog_HBase_graceful_decommission.sh as an Amazon EMR step to stop HBase region servers on nodes in a task instance group. The script requirs a task instance group ID and an S3 location to place sharing scripts for task nodes.
The following is the syntax to pass stop_and_check_task_rs to blog_HBase_graceful_decommission.sh as an Amazon EMR step:
Here’s an Amazon EMR step example to stop HBase regions on nodes in a task group:
This step above not only stops HBase region servers on existing task nodes. To avoid provisioning HBase region servers on new task nodes, the script also reconfigures and scales in the task group. Here are the steps:
- Using the
move_regionsfunction, inblog_HBase_graceful_decommission.sh, move HRegions on the task group to other nodes and stop region servers on those task nodes.
After making sure that the HBase region servers are stopped at these task nodes, the script reconfigures the task instance group. The reconfiguration details are to let HBase rootdir point to a non-existing location. These settings only apply to the task group. Here’s an example:
When the task group’s state returns to RUNNING, the script scales in these task nodes to 0. New task nodes in the upcoming scaling out events will not run HBase region servers.
Conclusion
These scaling steps demonstrate how to handle Amazon EMR HBase scaling gracefully. The functions in the script can help administrators to resolve problems when companies want to gracefully scale the Amazon EMR HBase on S3 clusters without Amazon EMR WAL.
If you have a similar request to scale in an Amazon EMR HBase on an S3 cluster gracefully because the cluster doesn’t enable Amazon EMR WAL, you can refer to this post. Please test the steps in the testing environment for verifications first. After you confirm the steps can meet your production requirements, you can proceed and apply the steps to production environment.
About the Authors
 Yu-Ting Su is a Sr. Hadoop Systems Engineer at Amazon Web Services (AWS). Her expertise is in Amazon EMR and Amazon OpenSearch Service. She’s passionate about distributing computation and helping people to bring their ideas to life.
 Hsing-Han Wang is a Cloud Support Engineer at Amazon Web Services (AWS). He focuses on Amazon EMR and AWS Lambda. Outside of work, he enjoys hiking and jogging, and he is also an Eorzean.
 Cheng Wang is a Technical Account Manager at AWS who has over 10 years of industry experience, focusing on enterprise service support, data analysis, and business intelligence solutions.
 Chris Li is an Enterprise Support manager at AWS. He leads a team of Technical Account Managers to solve complex customer problems and implement well-structured solutions.
pomeroy historic marker event
Post Syndicated from The History Guy: History Deserves to Be Remembered original https://www.youtube.com/watch?v=nljd0RlaWHY
Има ли бизнес в минералните води?
Post Syndicated from Иво Анев original https://www.toest.bg/ima-li-biznes-v-mineralnite-vodi/

Пили ли сте минерална вода? По всяка вероятност – да. Затова интуитивно си мислим, че знаем какво представлява тя. Съществуват обаче множество определения за минералната вода. От практическа гледна точка най-важното, което е добре да знаем, е, че тази вода:
- е подземна, с дълбоко залягане (намира се под водонепроницаем слой);
- има повишена температура и/или минерален състав;
- е определена от закона като такава.
Какво съдържат минералните води?
Икономически най-ценният състав на минералните води може да се раздели на различни компоненти:
- Термален (топлинен). Това е енергията, съдържаща се във водата, която може да бъде използвана в зависимост от температурата за производство на електрическа енергия, отопление и др.
- Воден. Това е чисто водното съдържание, което може да се използва за бутилиране, спа и балнеологични процедури, поливни дейности и др.
- Минерален, химичен (вкл. газово съдържание) и биологичен. Именно това е отличителният състав на минералната вода, от който зависят уникалността и качествата ѝ. Този компонент може да се използва за производство на козметика и е важна част от качествата на бутилираната вода и от спецификите на спа процедурите, които се провеждат с нея. Но може да възникнат и проблеми. Например голямото минерално съдържание може да доведе до значително увеличени разходи за инфраструктурна поддръжка. Наднорменото съдържание на арсен, уран и други опасни вещества води до невъзможност водата да бъде използвана за питейни, а в някои случаи и за спа и балнеологични нужди.
Каква е цената на минералните води?
Цените, имащи отношение към минералните води, се определят от Тарифата за таксите за водовземане, за ползване на воден обект и за замърсяване от 16 юли 2019 г. Тя постановява таксите за извличането им в зависимост от целта на използване и температурата на водата.
За находищата на минерални води, предоставени за управление на общините, съответните общински съвети имат право да определят свои такси, които обаче не могат да бъдат по-ниски от посочените в националната тарифа. Община Карлово например е приела тарифа, съответстваща на националната, с единични размери на таксите, вариращи в зависимост от целта на използване и температурата на водата.
Цената на минералната вода се определя от Министерството на околната среда и водите. В зависимост от температурата, таксата за използването за битови и питейни нужди варира между 0,031 и 0,29 лв. за кубичен метър. За болниците за лечение и рехабилитация таксата е между 0,04 и 0,05 лв./м³, за всички други цели – между 0,15 и 0,5 лв./м³.
Тези такси значително отстъпват дори от цената на водата, която може да бъде закупена от водопроводната мрежа. Например „Софийска вода“ доставя питейна вода в Столичната община за 2,194 лв./м³ с ДДС, като общата цена заедно с отвеждането и пречистването на отпадни води достига 3,695 лв./м³ с ДДС.
Това означава, че цената на кубичен метър минерална вода е между 71 и 4,4 пъти по-ниска, отколкото на водата, доставяна по водопроводната мрежа. И то дори без да се отчита, че термалните минерални води притежават също значителна топлинна енергия, понякога надхвърляща стойността на водата.
Каква е същинската стойност на минералната вода?
Нека се опитаме да пресметнем каква би била истинската стойност на минералната вода. За основа може да вземем например стойността на водата, предоставена за ползване на Столичната община. Нейният дебит е 83,49 л/сек. За да можете да си представите за какво количество става въпрос, това е малко повече от водата, която тече в Перловска река в Южния парк през лятото.

Обемът на минералната вода за една година, предоставена на Столичната община, е 2,633 млрд. л. Ако приравним закупуването на тези количества за една година с цената на водата от водопроводната мрежа, без да добавяме разходите за отвеждане и пречистване, ще получим, че еквивалентната цена на тази вода за една година е 5,774 млн. лв.
Средната (претеглена) температура на всички източници на минерална вода, предоставени на Столичната община, е 35,75°C. Топлинната енергия във водата (пресметната като разлика със средната температура на водата от водопроводната мрежа, която е 14°C) е еквивалентна на 67 073 623 киловата годишно, или 67,07 гигавата.
Средната цена на електроенергията за крайни потребители на „Електрохолд“ е 0,282 лв./кВтч. Следователно годишната цена за загряване на това количество вода без загуби би била 18,915 млн. лв.
Ако направим консервативна сметка – дори без да отчитаме допълнителната стойност на полезните вещества в състава на водата, – можем да установим, че става въпрос за ресурс на стойност 24,689 млн. лв. годишно, от който се използва много малка част – около 3 л/сек.
Привлекателната сила на минералната вода
Минералните води са силно привлекателни. Това ясно се вижда, когато сравним спа курорта Карлови Вари и целия Южноморавски регион в Чехия. Карлови Вари се простира на площ от 59,08 кв.км, а населението му е малко под 50 000 души. Южноморавският регион заема площ от 7188 кв. км, а населението му е над 1,2 млн. души. Карлови Вари обаче привлича 1 390 000 туристи годишно, докато целият Южноморавски регион – едва 830 000.
Каква е причината? И на двете места има красиви замъци, а в Южноморавския район има значително повече природни дадености, с изключение на минерални води.
Какво обаче привлича туристите толкова много към Карлови Вари? Можем да твърдим, че това е именно минералната вода. На този красноречив пример може да се противопостави Прага, която въпреки липсата на минерална вода е посетена от 7,44 млн. туристи през 2023 г. Прага обаче е европейска столица с население 1,335 млн. жители и с несравнимо по-голяма икономика от Карлови Вари. Освен това туристическите посещения в балнеокурорта, съотнесени към населението, са 5 пъти повече.
Наличието на впечатляващи сгради, казина и курортни дейности в Карлови Вари, за които можем да твърдим, че са привлекателни за туристите, са следствие от наличието на термални минерални води.

Въпреки липсата на достатъчно данни, същата зависимост наблюдаваме и в България – местата с наличие на термални минерални води в общия случай привличат повече туристи и икономически се развиват по-добре, отколкото места с аналогични дадености, но без минерална вода. Например град Сандански, известен със своите минерални води, не само привлича повече туристи, но е икономически по-силен от традиционния център на района – град Петрич, а от 2024 г. има и по-голямо население. Най-популярният ни зимен курорт – Банско, разполага с минерална вода, както и най-популярният летен – Слънчев бряг.
Преки и косвени приходи от минералните води
Безусловно най-големи преки приходи от минерална вода се получават от нейното бутилиране. Нека направим следния мисловен експеримент. Започваме да бутилираме водата от Централната минерална баня при среден размер на бутилката 1 литър и печалба 0,05 лв. При пълна продажба на бутилираната вода директната ни печалба ще е 20,183 млн. лв.
Бутилирането обаче унищожава възможността за косвени приходи. Известен факт е, че директното ползване на термална минерална вода често не води до големи приходи, а още по-малко до печалби. Именно затова около местата за отдих и възстановяване навсякъде по света винаги са се изграждали ресторанти, козметична индустрия, казина, опери и др., които се възползват от привлекателната сила на водата. Град Баден-Баден в Германия например разполага с минерална вода, чийто дебит е малко над 9 л/сек, но брутният вътрешен продукт (БВП) на глава от населението е 52 234 евро, което надхвърля регионалния – 50 982 евро, а още повече средния за Германия – 49 525 евро, въпреки относителната откъснатост на курорта от големите икономически центрове. Това се дължи именно на всички допълнителни услуги, свързани с минералната вода, които подпомагат икономическото развитие.
Подобни примери има и в други курорти, села и градове, разполагащи с термална минерална вода – от Виши във Франция до Сареин в Иран.
Изчислението на косвените ползи от минералните води е сложна задача, тъй като зависи от огромно количество променящи се фактори. Наличието им обаче е очевидно и неотменимо и от гледна точка на БВП, и от гледна точка на допълнителните заведения и забавления, които често се изграждат около и на местата, където има термални минерални води. Маркетингът на съответната минерална вода и на допълнителните (косвени) услуги, както и достъпността са от ключово значение за успеха.
Термалната минерална вода е привлекателна за хората, съответно е и двигател на икономиката и туризма. Използването ѝ може да максимизира нейната полезност при правилно разпределение на ресурсите там, където могат да бъдат най-нужни за гражданите и туристите. Търсенето единствено на директни печалби от минералната вода показва липсата на разбиране за нейната притегателна сила и за големия потенциал за привличане на косвени приходи.
Бизнес в минералните води има, но са необходими и инвестиции, и мисъл.
В настоящата ни съвместна поредица с „Екипът на София“ обсъждаме планирането, озеленяването, архитектурата, инфраструктурата, мобилността и още много други градски теми, описваме добрите примери и търсим възможните решения за подобряването на качеството на живот в нашите градове.
Security updates for Tuesday
Post Syndicated from corbet original https://lwn.net/Articles/1014543/
Security updates have been issued by Debian (freetype and rails), Fedora (mosquitto and python-django4.2), Mageia (libarchive, libreoffice, php, and quictls), Red Hat (webkit2gtk3), SUSE (erlang, nethack, python312, and wpa_supplicant), and Ubuntu (freetype and plantuml).
Extending Cloudflare Radar’s security insights with new DDoS, leaked credentials, and bots datasets
Post Syndicated from David Belson original https://blog.cloudflare.com/cloudflare-radar-ddos-leaked-credentials-bots/
Security and attacks continues to be a very active environment, and the visibility that Cloudflare Radar provides on this dynamic landscape has evolved and expanded over time. To that end, during 2023’s Security Week, we launched our URL Scanner, which enables users to safely scan any URL to determine if it is safe to view or interact with. During 2024’s Security Week, we launched an Email Security page, which provides a unique perspective on the threats posed by malicious emails, spam volume, the adoption of email authentication methods like SPF, DMARC, and DKIM, and the use of IPv4/IPv6 and TLS by email servers. For Security Week 2025, we are adding several new DDoS-focused graphs, new insights into leaked credential trends, and a new Bots page to Cloudflare Radar. We are also taking this opportunity to refactor Radar’s Security & Attacks page, breaking it out into Application Layer and Network Layer sections.
Below, we review all of these changes and additions to Radar.
Since Cloudflare Radar launched in 2020, it has included both network layer (Layers 3 & 4) and application layer (Layer 7) attack traffic insights on a single Security & Attacks page. Over the last four-plus years, we have evolved some of the existing data sets on the page, as well as adding new ones. As the page has grown and improved over time, it risked becoming unwieldy to navigate, making it hard to find the graphs and data of interest. To help address that, the Security section on Radar now features separate Application Layer and Network Layer pages. The Application Layer page is the default, and includes insights from analysis of HTTP-based malicious and attack traffic. The Network Layer page includes insights from analysis of network and transport layer attacks, as well as observed TCP resets and timeouts. Future security and attack-related data sets will be added to the relevant page. Email Security remains on its own dedicated page.
Radar’s quarterly DDoS threat reports have historically provided insights, aggregated on a quarterly basis, into the top source and target locations of application layer DDoS attacks. A new map and table on Radar’s Application Layer Security page now provide more timely insights, with a global choropleth map showing a geographical distribution of source and target locations, and an accompanying list of the top 20 locations by share of all DDoS requests. Source location attribution continues to rely on the geolocation of the IP address originating the blocked request, while target location remains the billing location of the account that owns the site being attacked.
Over the first week of March 2025, the United States, Indonesia, and Germany were the top sources of application layer DDoS attacks, together accounting for over 30% of such attacks as shown below. The concentration across the top targeted locations was quite different, with customers from Canada, the United States, and Singapore attracting 56% of application layer DDoS attacks.
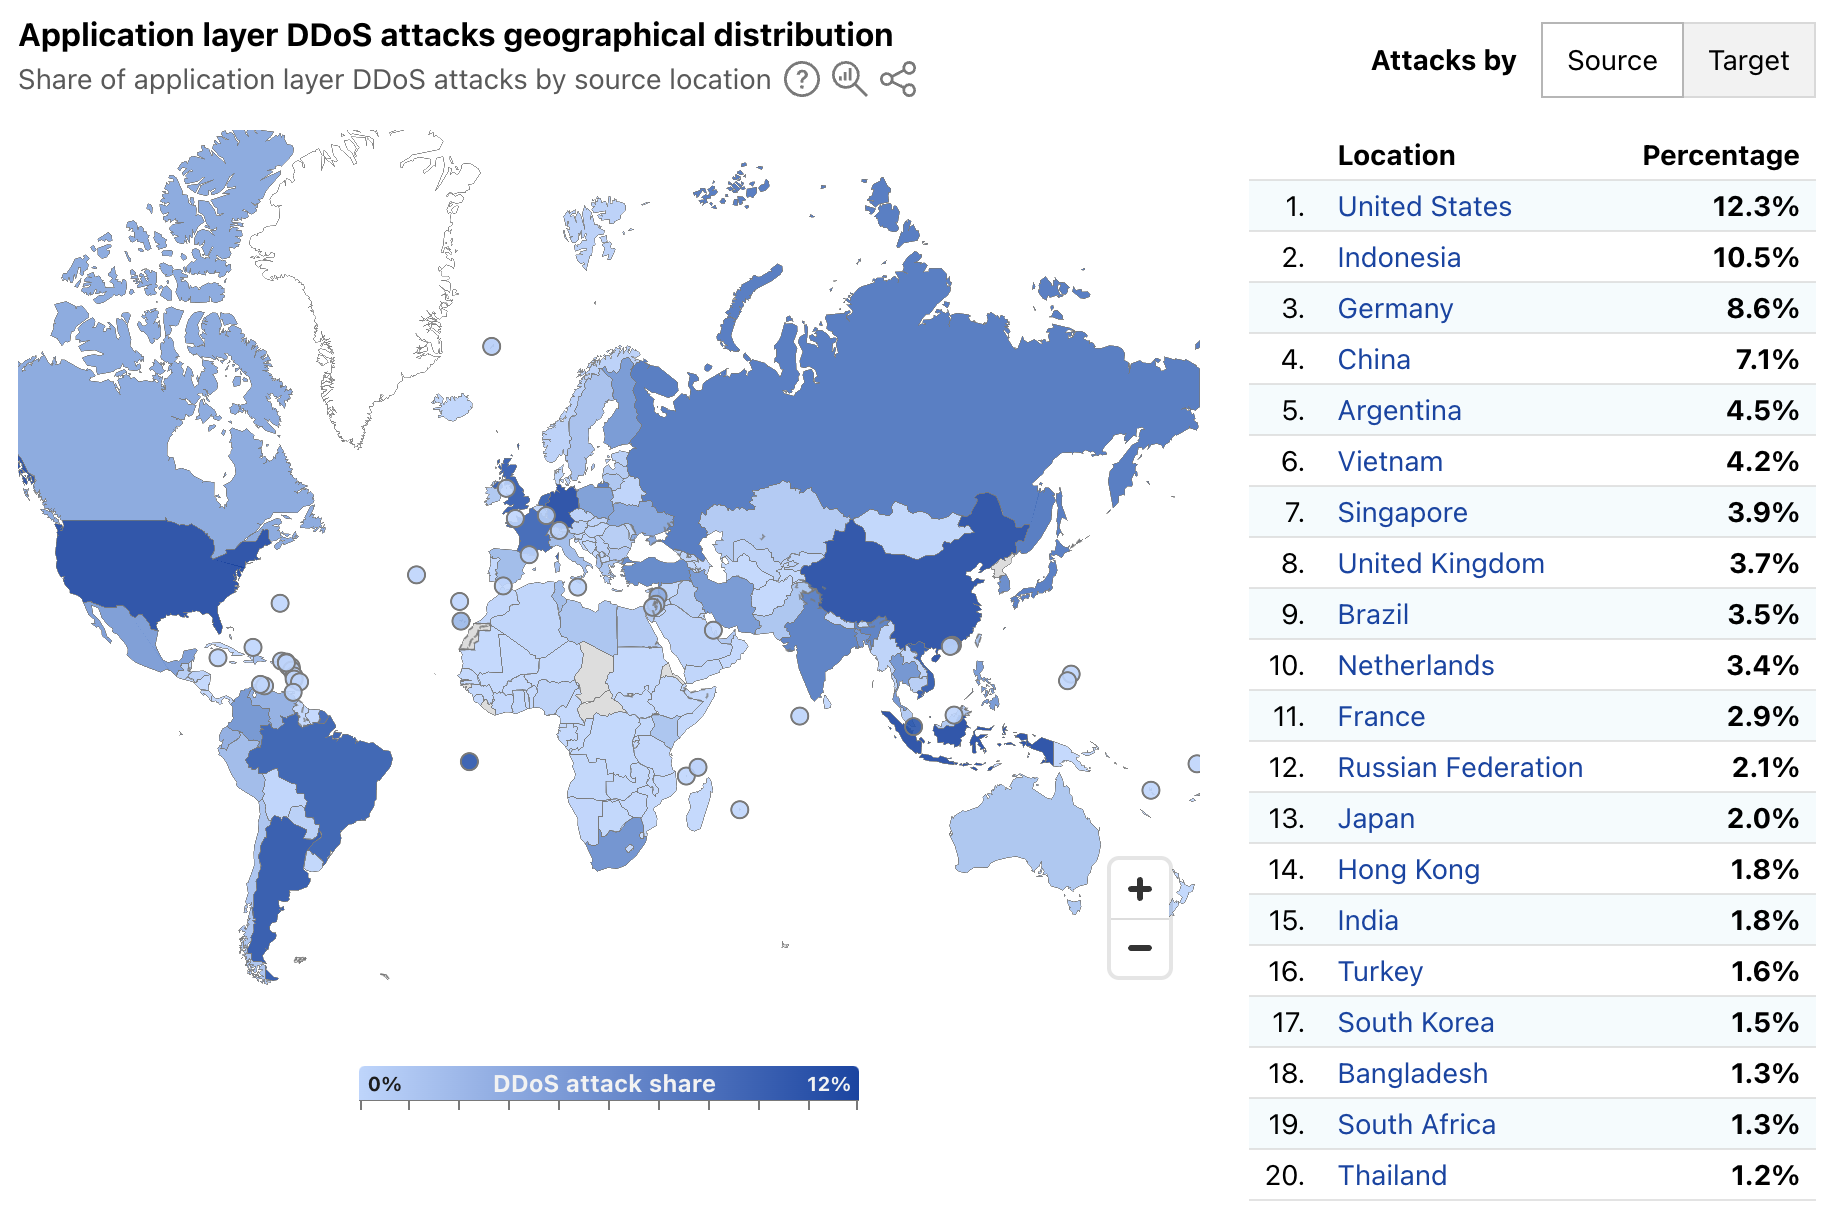
In addition to extended visibility into the geographic source of application layer DDoS attacks, we have also added autonomous system (AS)-level visibility. A new treemap view shows the distribution of these attacks by source AS. At a global level, the largest sources include cloud/hosting providers in Germany, the United States, China, and Vietnam.
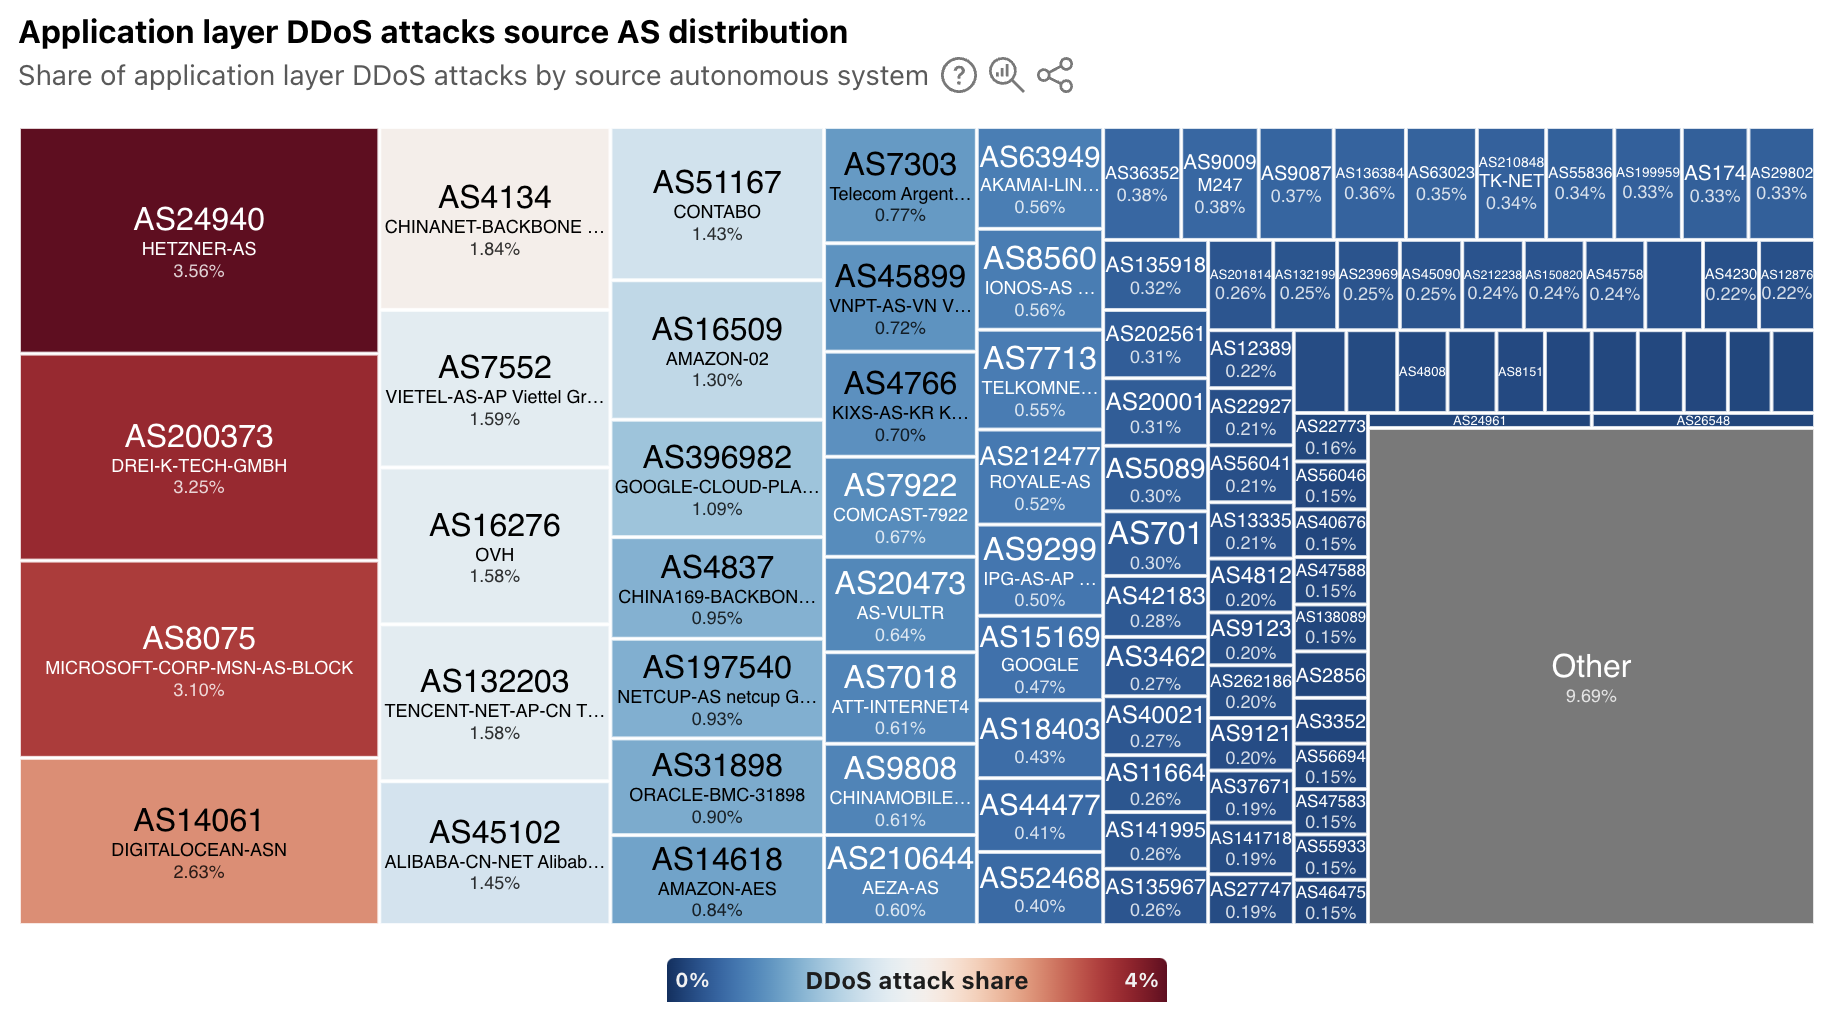
For a selected country/region, the treemap displays a source AS distribution for attacks observed to be originating from that location. In some, the sources of attack traffic are heavily concentrated in consumer/business network providers, such as in Portugal, shown below. However, in other countries/regions that have a large cloud provider presence, such as Ireland, Singapore, and the United States, ASNs associated with these types of providers are the dominant sources. To that end, Singapore was listed as being among the top sources of application layer DDoS attacks in each of the quarterly DDoS threat reports in 2024.
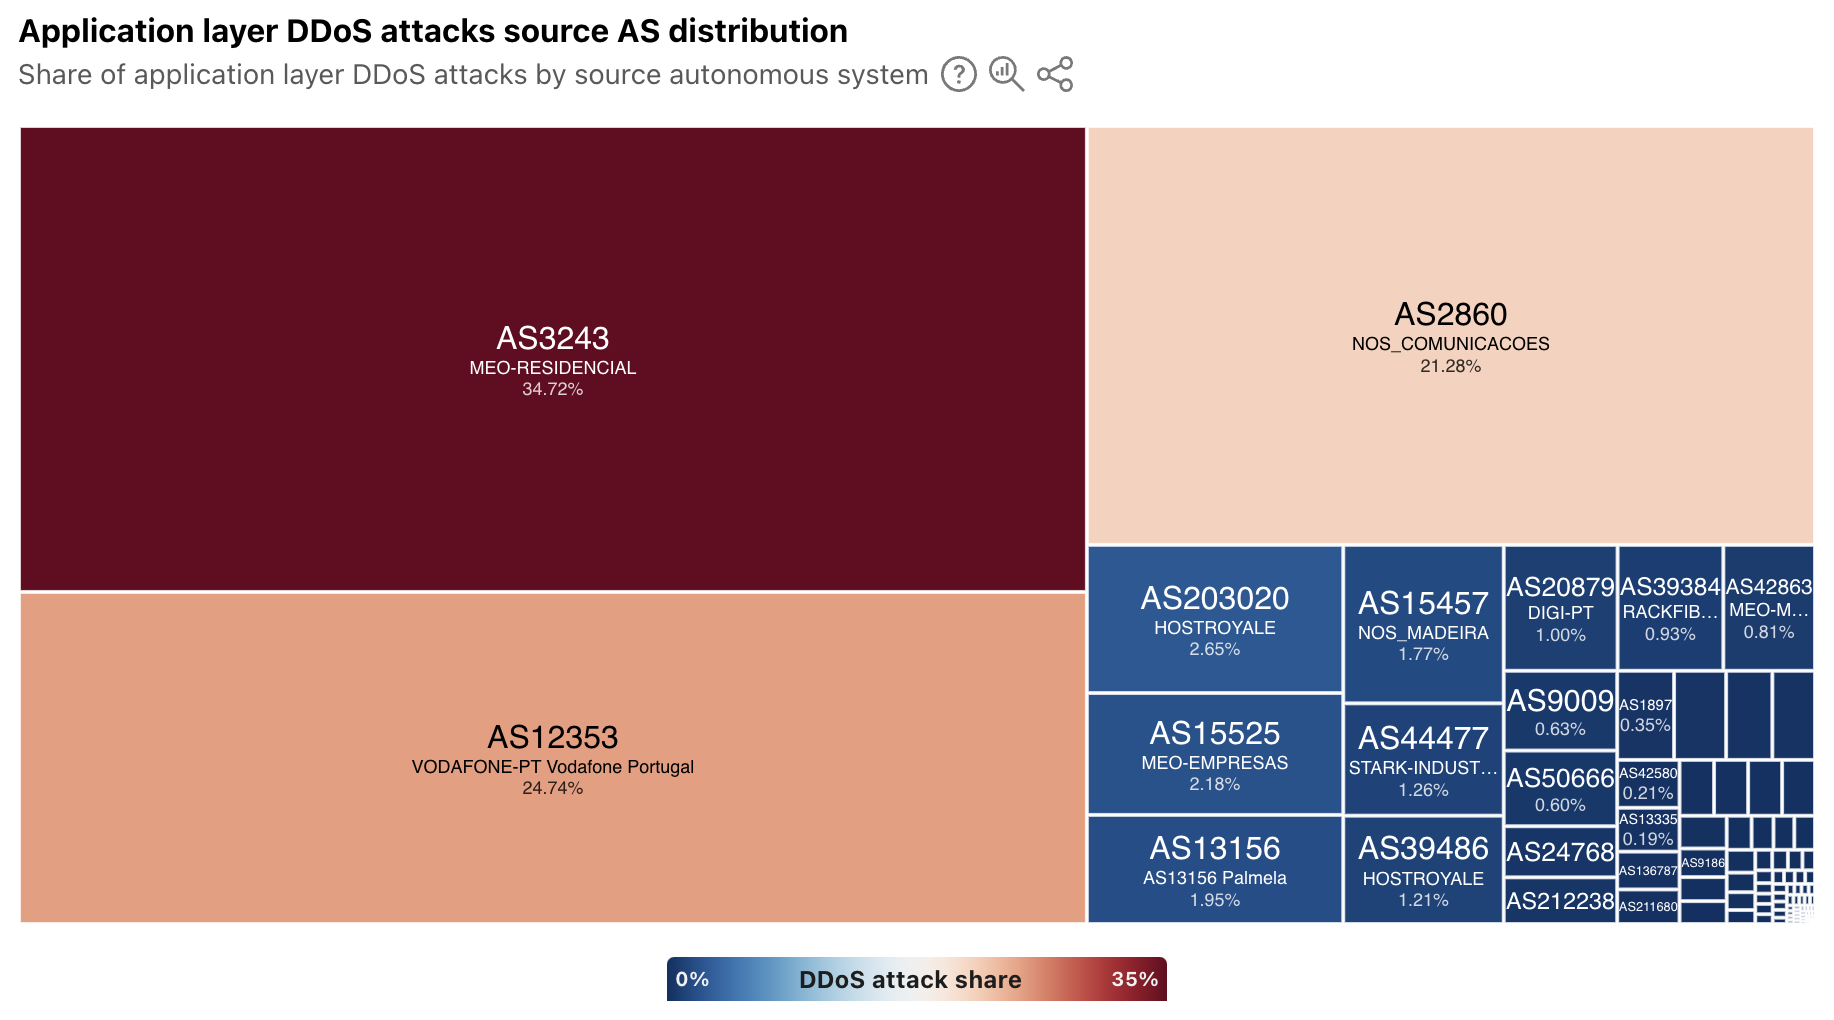
Every week, it seems like there’s another headline about a data breach, talking about thousands or millions of usernames and passwords being stolen. Or maybe you get an email from an identity monitoring service that your username and password were found on the “dark web”. (Of course, you’re getting those alerts thanks to a complementary subscription to the service offered as penance from another data breach…)
This credential theft is especially problematic because people often reuse passwords, despite best practices advising the use of strong, unique passwords for each site or application. To help mitigate this risk, starting in 2024, Cloudflare began enabling customers to scan authentication requests for their websites and applications using a privacy-preserving compromised credential checker implementation to detect known-leaked usernames and passwords. Today, we’re using aggregated data to display trends in how often these leaked and stolen credentials are observed across Cloudflare’s network. (Here, we are defining “leaked credentials” as usernames or passwords being found in a public dataset, or the username and password detected as being similar.)
Leaked credentials detection scans incoming HTTP requests for known authentication patterns from common web apps and any custom detection locations that were configured. The service uses a privacy-preserving compromised credential checking protocol to compare a hash of the detected passwords to hashes of compromised passwords found in databases of leaked credentials. A new Radar graph on the worldwide Application Layer Security page provides visibility into aggregate trends around the detection of leaked credentials in authentication requests. Filterable by authentication requests from human users, bots, or all (human + bot), the graph shows the distribution requests classified as “clean” (no leaked credentials detected) and “compromised” (leaked credentials, as defined above, were used). At a worldwide level, we found that for the first week of March 2025, leaked credentials were used in 64% of all, over 65% of bot, and over 44% of human authorization requests.
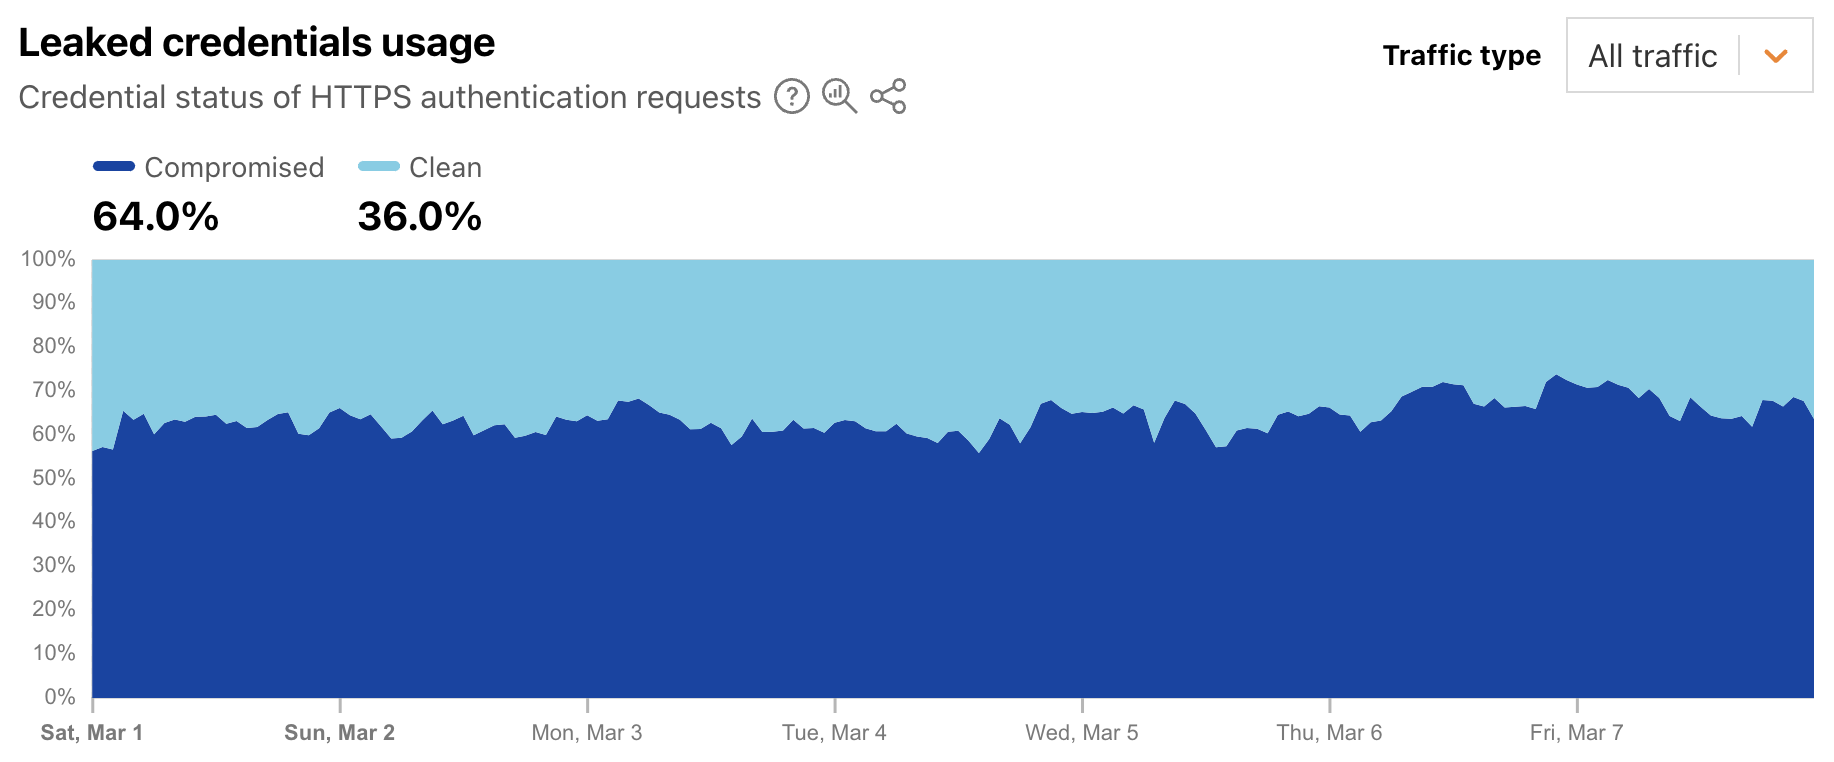
This suggests that from a human perspective, password reuse is still a problem, as is users not taking immediate actions to change passwords when notified of a breach. And from a bot perspective, this suggests that attackers know that there is a good chance that leaked credentials for one website or application will enable them to access that same user’s account elsewhere.
As a complement to the leaked credentials data, Radar is also now providing a worldwide view into the share of authentication requests originating from bots. Note that not all of these requests are necessarily malicious — while some may be associated with credential stuffing-style attacks, others may be from automated scripts or other benign applications accessing an authentication endpoint. (Having said that, automated malicious attack request volume far exceeds legitimate automated login attempts.) During the first week of March 2025, we found that over 94% of authentication requests came from bots (were automated), with the balance coming from humans. Over that same period, bot traffic only accounted for 30% of overall requests. So although bots don’t represent a majority of request traffic, authentication requests appear to comprise a significant portion of their activity.
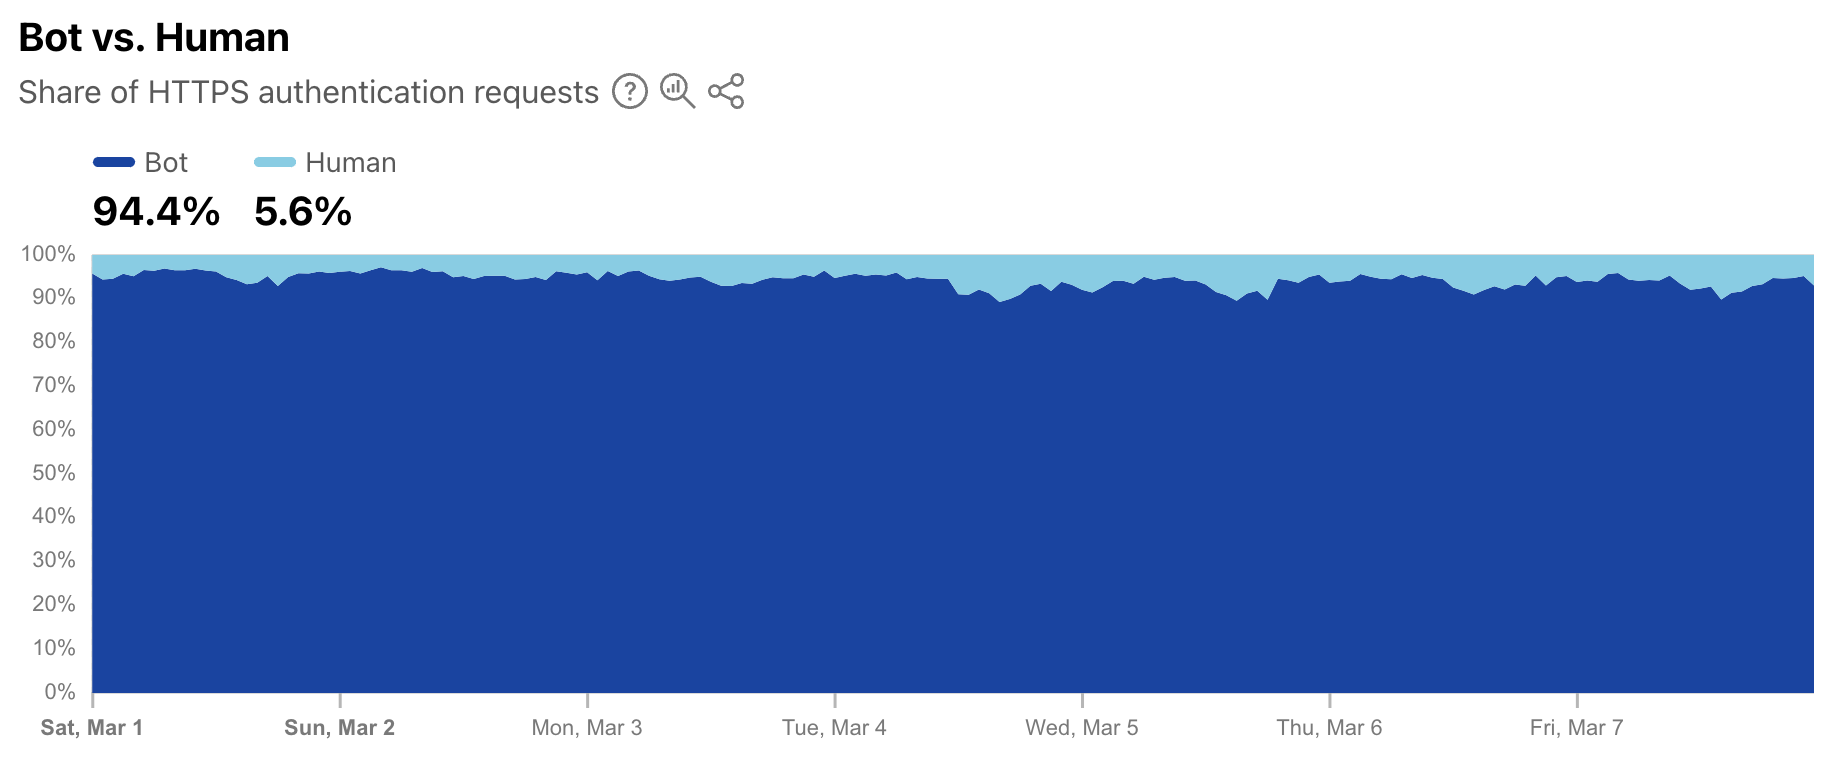
As a reminder, bot traffic describes any non-human Internet traffic, and monitoring bot levels can help spot potential malicious activities. Of course, bots can be helpful too, and Cloudflare maintains a list of verified bots to help keep the Internet healthy. Given the importance of monitoring bot activity, we have launched a new dedicated Bots page in the Traffic section of Cloudflare Radar to support these efforts. For both worldwide and location views over the selected time period, the page shows the distribution of bot (automated) vs. human HTTP requests, as well as a graph showing bot traffic trends. (Our bot score, combining machine learning, heuristics, and other techniques, is used to identify automated requests likely to be coming from bots.)
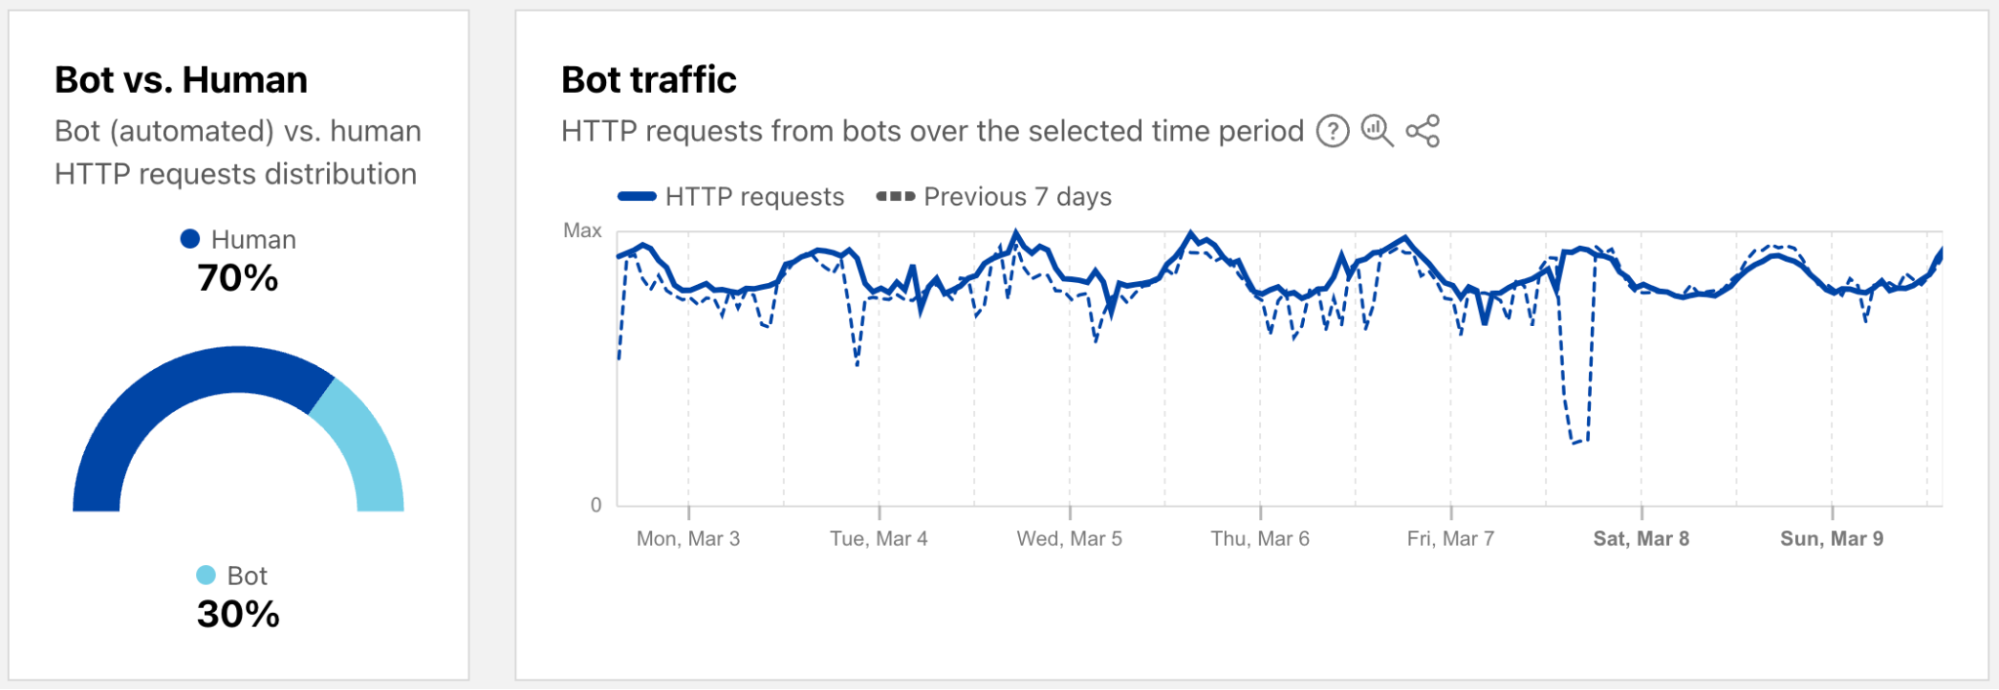
Both the 2023 and 2024 Cloudflare Radar Year in Review microsites included a “Bot Traffic Sources” section, showing the locations and networks that Cloudflare determined that the largest shares of automated/likely automated traffic was originating from. However, these traffic shares were published just once a year, aggregating traffic from January through the end of November.
In order to provide a more timely perspective, these insights are now available on the new Radar Bots page. Similar to the new DDoS attacks content discussed above, the worldwide view includes a choropleth map and table illustrating the locations originating the largest shares of all bot traffic. (Note that a similar Traffic Characteristics map and table on the Traffic Overview page ranks locations by the bot traffic share of the location’s total traffic.) Similar to Year in Review data linked above, the United States continues to originate the largest share of bot traffic.
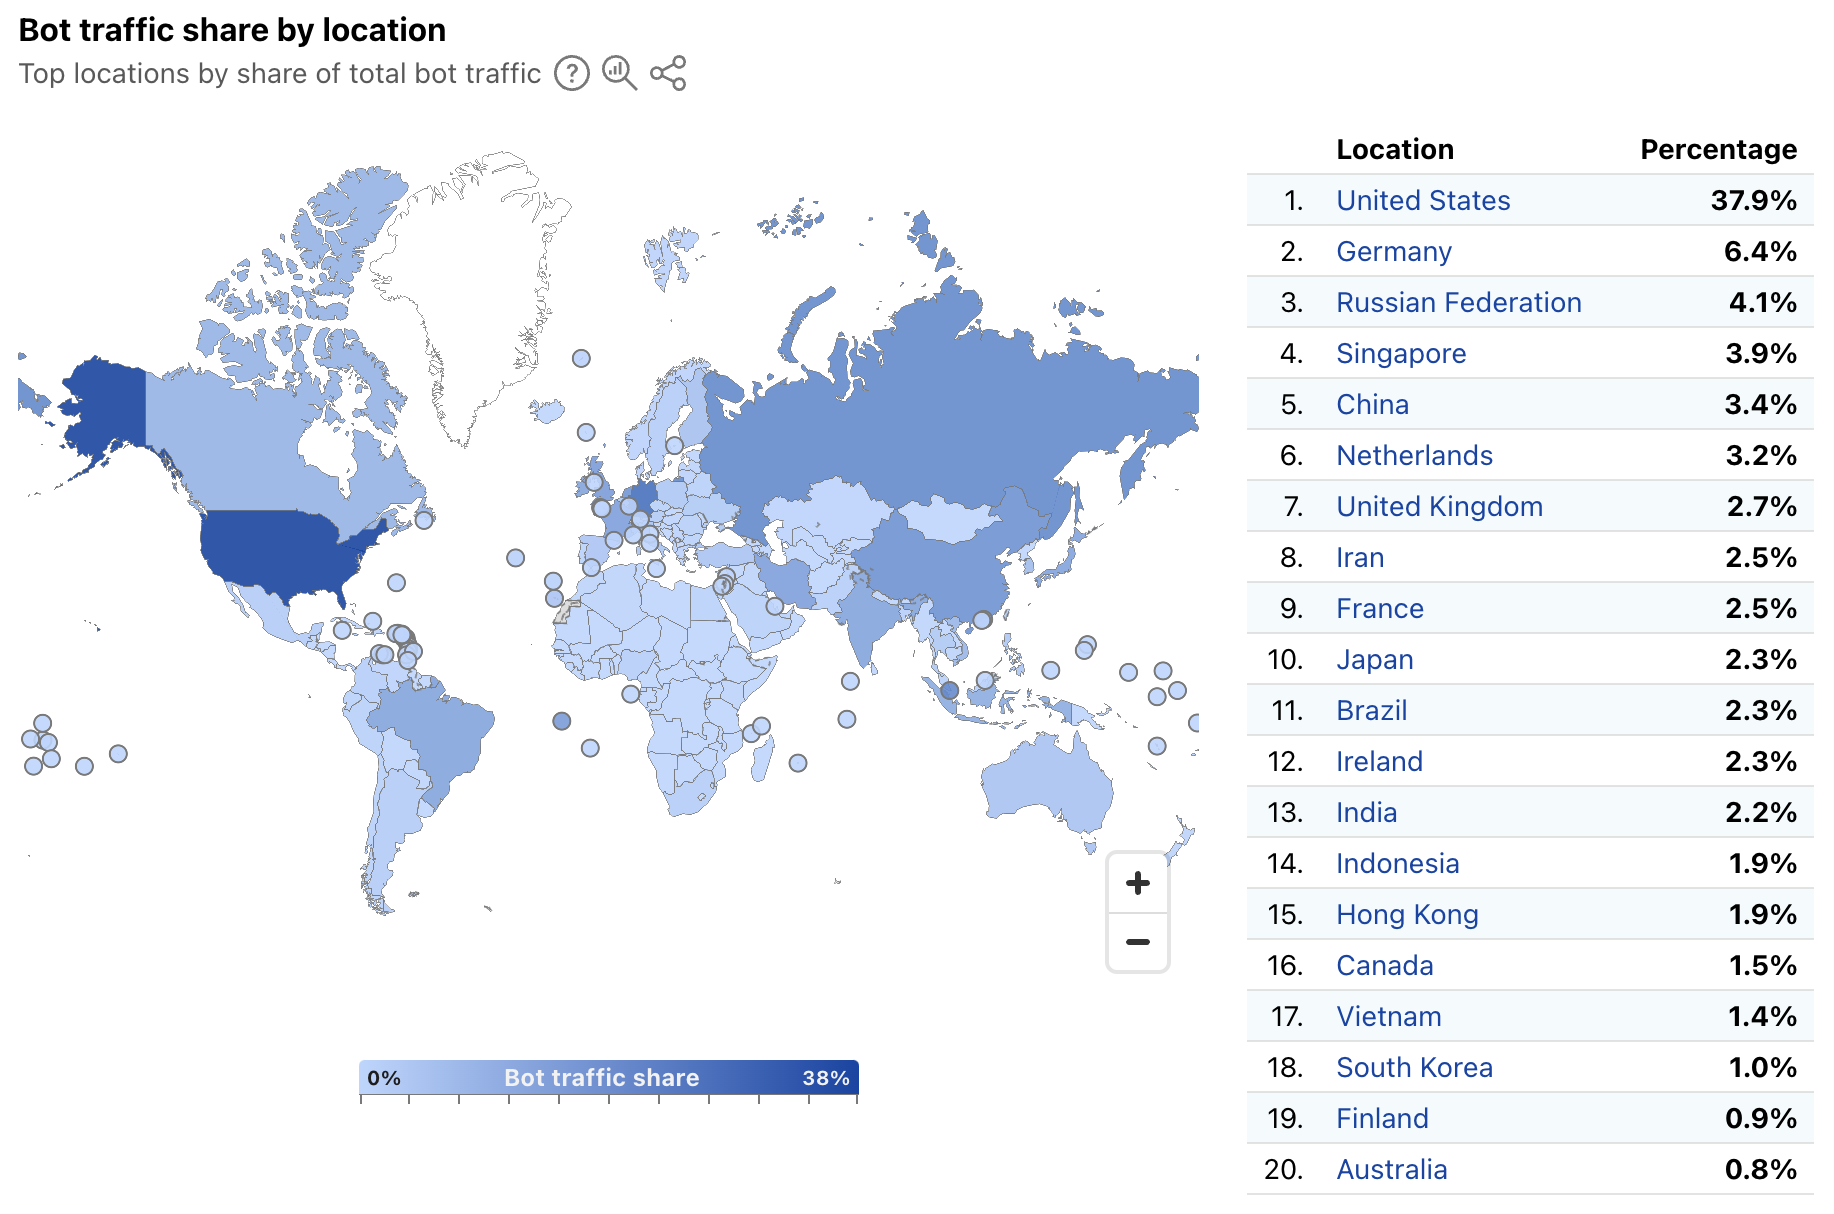
In addition, the worldwide view also breaks out bot traffic share by AS, mirroring the treemap shown in the Year in Review. As we have noted previously, cloud platform providers account for a significant amount of bot traffic.

At a location level, depending on the country/region selected, the top sources of bot traffic may be cloud/hosting providers, consumer/business network providers, or a mix. For instance, France’s distribution is shown below, and four ASNs account for just over half of the country’s bot traffic. Of these ASNs, two (AS16276 and AS12876) belong to cloud/hosting providers, and two (AS3215 and AS12322) belong to network providers.

In addition, the Verified Bots list has been moved to the new Bots page on Radar. The data shown and functionality remains unchanged, and links to the old location will automatically be redirected to the new one.
The Cloudflare dashboard provides customers with specific views of security trends, application and network layer attacks, and bot activity across their sites and applications. While these views are useful at an individual customer level, aggregated views at a worldwide, location, and network level provide a macro-level perspective on trends and activity. These aggregated views available on Cloudflare Radar not only help customers understand how their observations compare to the larger whole, but they also help the industry understand emerging threats that may require action.
The underlying data for the graphs and data discussed above is available via the Radar API (Application Layer, Network Layer, Bots, Leaked Credentials). The data can also be interactively explored in more detail across locations, networks, and time periods using Radar’s Data Explorer and AI Assistant. And as always, Radar and Data Explorer charts and graphs are downloadable for sharing, and embeddable for use in your own blog posts, websites, or dashboards.
If you share our security, attacks, or bots graphs on social media, be sure to tag us: @CloudflareRadar and @1111Resolver (X), noc.social/@cloudflareradar (Mastodon), and radar.cloudflare.com (Bluesky). If you have questions or comments, you can reach out to us on social media, or contact us via email.
Upgraded Turnstile Analytics enable deeper insights, faster investigations, and improved security
Post Syndicated from Sally Lee original https://blog.cloudflare.com/upgraded-turnstile-analytics-enable-deeper-insights-faster-investigations/
Attackers are increasingly using more sophisticated methods to not just brute force their way into your sites but also simulate real user behavior for targeted harmful activity like account takeovers, credential stuffing, fake account creation, content scraping, and fraudulent transactions. They are no longer trying to simply take your website down or gain access to it, but rather cause actual business harm. There is also the increasing complexity added by attackers rotating IP addresses, routing through proxies, and using VPNs. In this evolving security landscape, meaningful analytics matter. Many traditional CAPTCHA solutions provide simplistic pass or fail trends on challenges without insights into traffic patterns or behavior. Cloudflare Turnstile aims to equip you with more than just basic trends, so you can make informed decisions and stay ahead of the attackers.
We are excited to introduce a major upgrade to Turnstile Analytics. With these upgraded analytics, you can identify harder-to-detect bots faster, and fine-tune your bot security posture with less manual log analysis than before. Turnstile, our privacy-first CAPTCHA alternative, has been helping you protect your applications from automated abuse while ensuring a seamless experience for legitimate users. Now, using enhanced analytics, you can gain deeper insights into your visitor traffic, challenge effectiveness, and potential security threats.
Previously, Turnstile users had limited visibility into what types of bots were being blocked, what specific characteristics were exhibited by bots that were attacking your website, and what identifiable behavior they had. Customers had to manually sift through limited analytics, correlate Siteverify API responses, and cross-reference multiple sources to identify trends. The previous Turnstile analytics dashboard made it difficult to get a bird’s eye view of Turnstile efficacy, identify any patterns of abuse, and drill down on the specifics of an attack to create additional rules and safeguards.
The new Turnstile Analytics surfaces all of this information in one place, making it easier than before to assess your visitor traffic patterns through Turnstile and take immediate action against suspicious activity.
The main motivation behind this release is to provide actionable insights that further strengthen the layers of protection and to give customers the ability to dissect visitor traffic by the most relevant attributes, so that identifying bot behavior patterns becomes easier. New features of Turnstile Analytics include:
Top statistics
When you click into widget analytics under Turnstile in the Cloudflare Dashboard, you now have enhanced visibility of TopN statistics, and granular views of your traffic. The new TopN section is where you can view the top statistics of attributes such as hostname, autonomous system (ASN), user agent, browser, source IP address, country, and OS. This allows customers to analyze traffic at a more granular level and detect potential anomalies or patterns. You can analyze which browsers, user agents, ASNs, and locations generated the most failed challenges, making it easier to detect bot behavior patterns and anomalies in your visitor traffic. Suspicious IP addresses that have a high challenge failure rate can be proactively mitigated through additional security measures. For instance, if you have WAF custom rules in place based on suspicious IP addresses, you can in turn adjust your WAF custom rules based on the trends you see in Turnstile, strengthening your other layers of security even further.
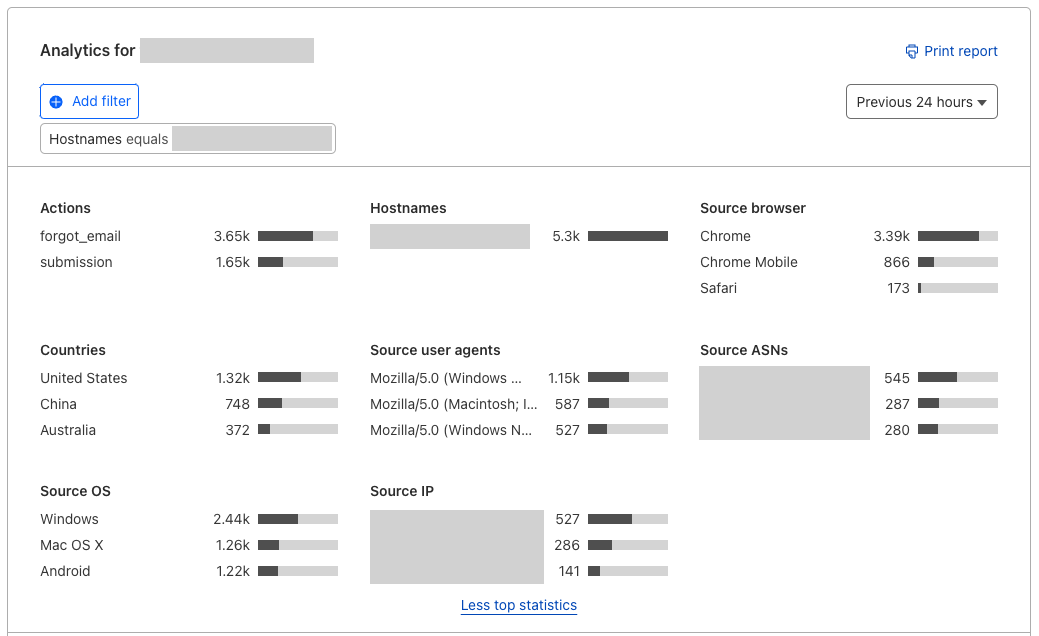
TopN section of Turnstile Analytics
Challenge outcomes
When a visitor encounters Turnstile, it issues a challenge to assess whether the visitor is a human or a bot, based on various signals. The Challenge outcomes section helps you evaluate what portion of your traffic is likely human or likely bots.
The ability to easily monitor the effectiveness of Turnstile by looking at trends of Likely Human and Likely Bot metrics is important for peace of mind, knowing that the bots are being blocked and Turnstile is protecting your sites. But it’s also important to track changes in bot activity over time by monitoring challenge success and failure trends and across different attributes. You can detect anomalies in your traffic pattern and solve rates. For example, a sudden drop in solve rate overlaid with a surge in challenge attempts may indicate an attack. It is crucial to monitor bot behaviors and attacks that may be specific to your industry or to your business through Turnstile Analytics and correlate them with your internal security logs to keep your security rules up to date, to easily investigate any attacks, and to find areas of vulnerability.

Challenge outcomes section of Turnstile Analytics
Solve rates
When the visitor successfully solves the challenge, the Solve rates section shows how the visitors have solved the challenge. Solve rates can be broken down into interactive solves, non-interactive solves, and pre-clearance solves. If you are using the managed mode, for example, you can see how many of your visitors required interaction with the widget and were prompted to check the box for Turnstile to verify that they are human.
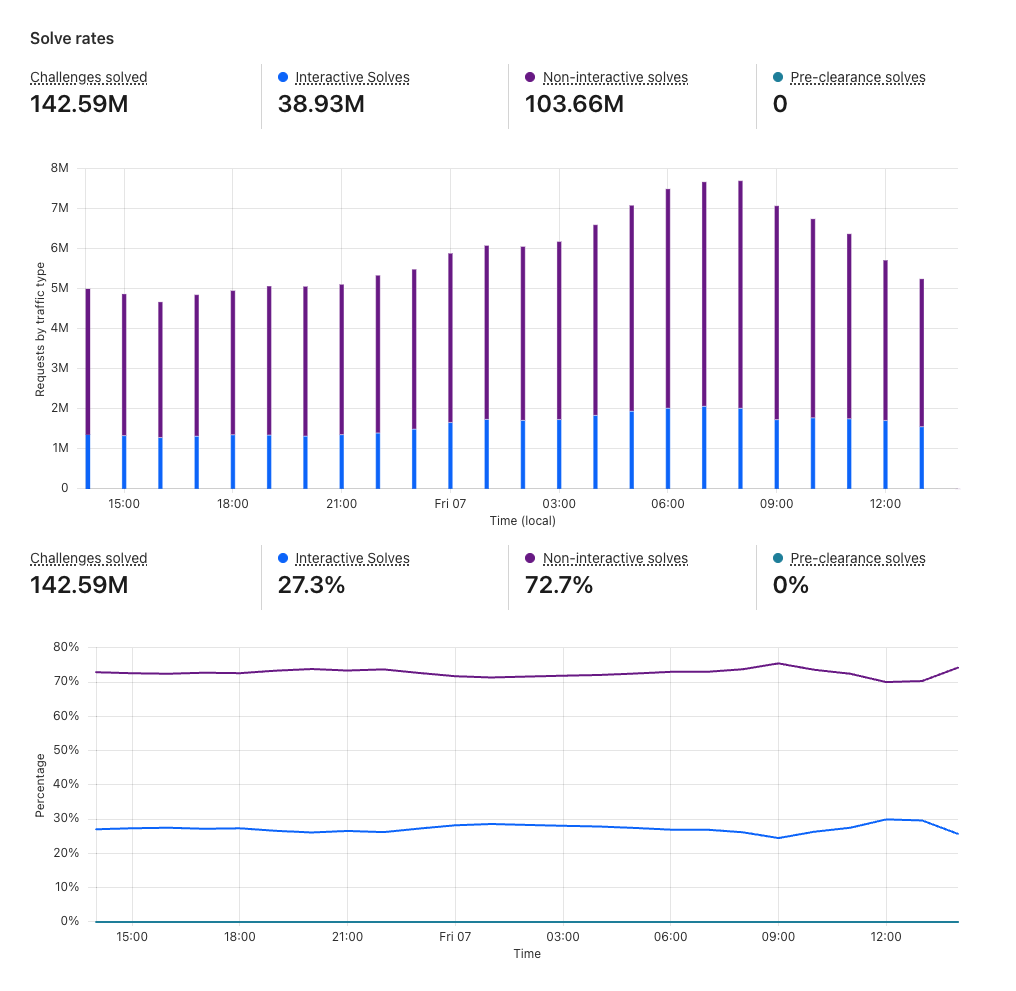
Solve rates section of Turnstile Analytics
Token validations
After a visitor successfully completes a Turnstile challenge, a token is generated that must be validated via the Siteverify API. The API response provides the ultimate outcome of our bot determination. Only rendering the widget on the client side without calling the Siteverify API for token validation is an incomplete implementation of Turnstile, and your site will not be protected. The Turnstile token that is returned from the challenge stage must be validated via the Siteverify API as we check if the token is valid, whether it has been redeemed already (a single token can only be redeemed once), and whether it has expired.

Token validation section of Turnstile Analytics
Common use cases of Turnstile include protecting login and sign up pages from credential stuffing, account takeover, and fraudulent account creation attacks. Let’s walk through how you can best set up Turnstile on your login pages and interpret your traffic with the new Turnstile analytics.
You can set up two separate widgets for your login and sign up page, or you can set up one widget and use the ‘action‘ field to distinguish traffic between these pages. The ‘cData’ field can be used to pass along custom data to keep track of each individual attempt. This field is useful to track any pertinent information from your business logic such as account ID, session ID, etc. In this case, let’s assume we are passing along a session ID along with the login attempt. This is helpful if you are trying to protect and monitor against account takeover attacks or credential stuffing attacks. cData is a custom data field that is not stored in Cloudflare systems at any time.
Rendering the Turnstile widget
To place the Turnstile widget on your login page:
<script src="https://challenges.cloudflare.com/turnstile/v0/api.js" async defer></script>
<form action="/login" method="POST">
  <div class="cf-turnstile" data-sitekey="your-site-key" data-action="login" data-cdata=”session123”></div>
  <input type="submit" value="Log in">
</form>
To place the Turnstile widget on your signup page:
<form action="/signup" method="POST">
  <div class="cf-turnstile" data-sitekey="your-site-key" data-action="signup"></div>
  <input type="submit" value="Sign up">
</form>
Validating the Turnstile token with the Siteverify API
At this point, you have placed the Turnstile widget in your login page. When a visitor visits this page, a Turnstile challenge will be issued and when the visitor completes the challenge, you will receive a Turnstile token that contains the outcome of the challenge. This must be validated via the Siteverify API like below:
// This is the demo secret key.
// In production, we recommend you store your secret key(s) safely.
const SECRET_KEY = "1x0000000000000000000000000000000AA";

async function handlePost(request) {
  const body = await request.formData();
  // Turnstile injects a token in "cf-turnstile-response".
  const token = body.get("cf-turnstile-response");
  const ip = request.headers.get("CF-Connecting-IP");

  // Validate the token by calling the
  // "/Siteverify" API endpoint.
  let formData = new FormData();
  formData.append("secret", SECRET_KEY);
  formData.append("response", token);
  formData.append("remoteip", ip);

  const url = "https://challenges.cloudflare.com/turnstile/v0/siteverify";
  const result = await fetch(url, {
    body: formData,
    method: "POST",
  });

  const outcome = await result.json();
  if (outcome.success) {
    // happy path: let the visitor continue with login/signup
  } else {
    // option 1: custom error page directing the visitor to reach out to support
    // option 2: same as happy path but flag as potential bot
  }
}
As you can see in the code example above, you can control the visitor experience based on the Siteverify outcome. In the case where Siteverify API said the token is valid, it’s straightforward — let the visitor continue to log in and sign up. This can be monitored by the Valid tokens metric in the Token validation section in the new Turnstile Analytics.
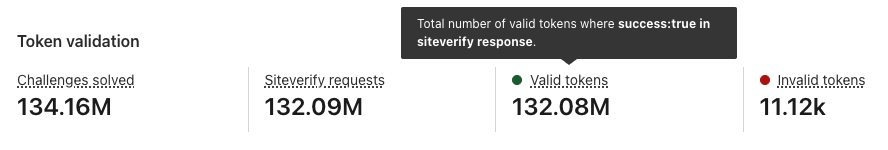
Example Invalid Token Siteverify Outcome:
{
  "success": false,
  "challenge_ts": "2025-02-28T15:14:30.096Z",
  "hostname": "mybusiness.com",
  "error-codes": [],
  "action": "login",
  "cdata": "account123",
  "metadata":{
    "ephemeral_id": "x:9f78e0ed210960d7693b167e"
  }
}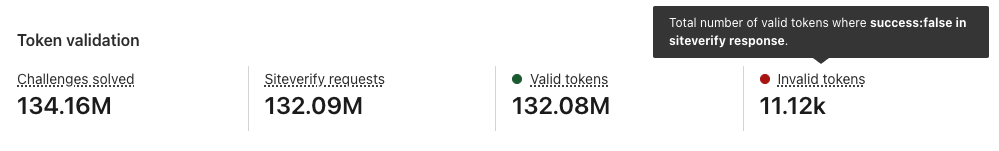
If Siteverify returns "success": false, this means that the token was invalid and Turnstile determined the visitor to be a bot. In this case, you have control over what you want the experience to be, such as redirecting the user to a custom error page where they can reach out to support.
You can also flag that session (in this case, “session123”) as suspicious and require the account owner to take action. You can implement the UI so that it seems like the bot was successful in logging in to an account, but block any important actions, such as account changes or purchases. Likewise, you can alert the account owner that there has been a suspicious login attempt.
Turnstile is a building block to help you build out your security defenses, and you can design your logic to fit your priorities across UI, UX, and security.
Interpreting login page analytics
The very first thing to monitor is the Top Statistics section to look out for any anomalous traffic characteristics in the “countries”, “source ASN”, and “source user agents” metrics. By seeing the traffic distribution, you can have a better understanding of your visitors and potentially spot any anomalies. At this point, you can also take a look at “Source browsers”, “Source OS”, and “Countries” to see if that aligns with your visitor demographics. If you have a list of suspicious IP addresses that you maintain, you can cross-reference them to see their success and failure rates.
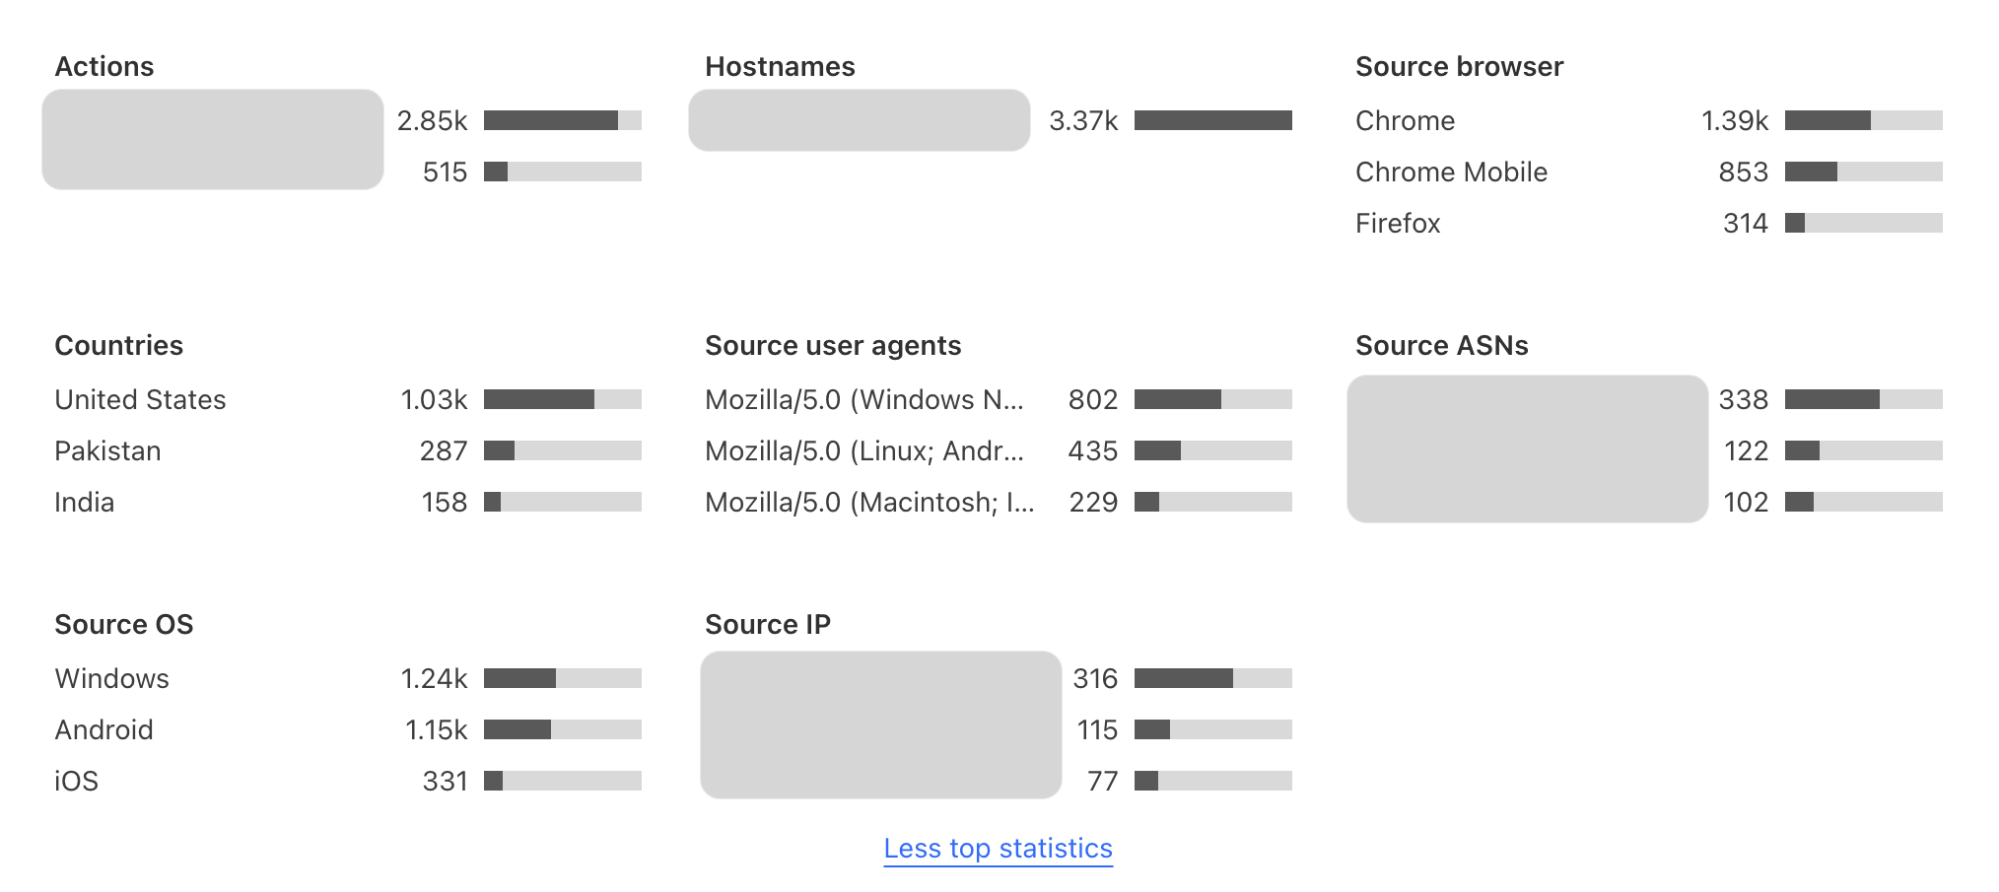
Example TopN Section
Let’s say you suspect there has been a credential stuffing attack where bots were brute forcing their way into accounts. Below is mock data of what your analytics may look like where the time window is zoomed into the time of the attack.
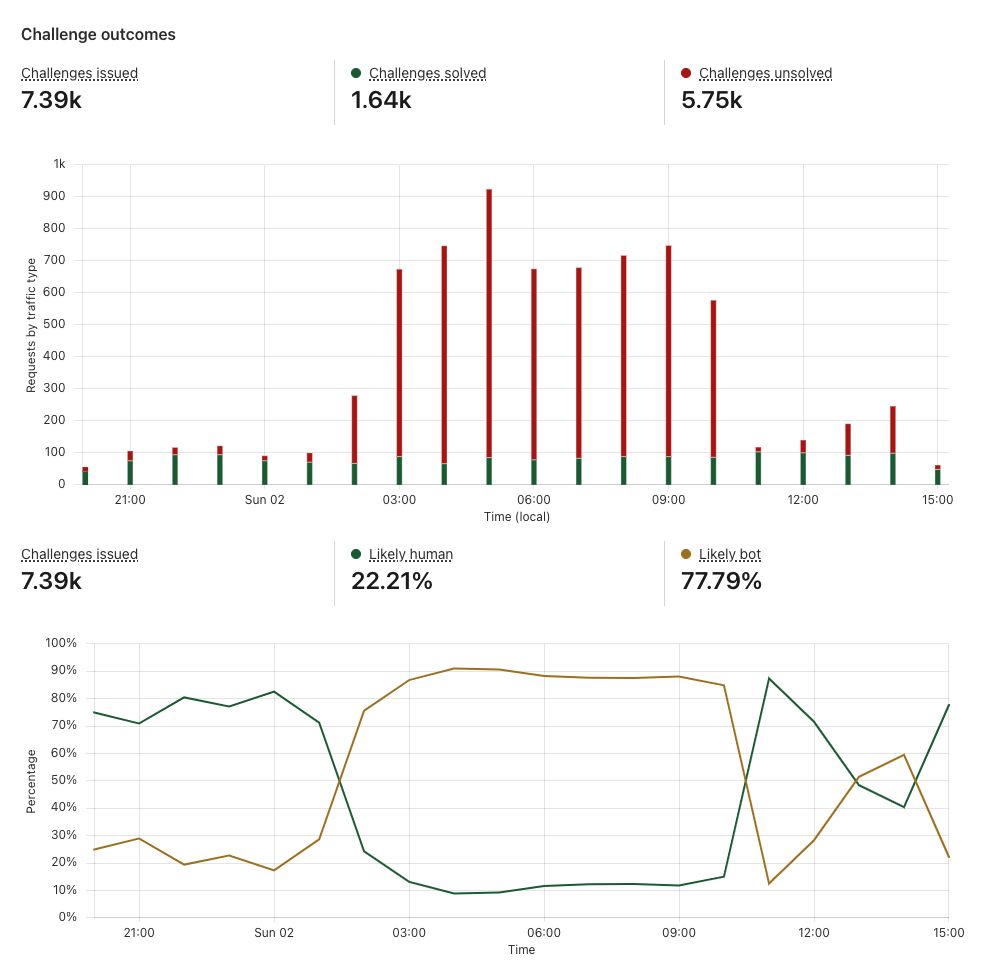
Example Challenge outcomes section
You can see that time period where the number of challenges unsolved started spiking and the “likely bot” metric shot up. This shows an increase in bot traffic, indicating an attack. However, you can also see that Turnstile was able to catch these bots as they were unable to solve or even complete the challenge.
Let’s look at another example.

Example Token validation section
In this case, of the 11.13M tokens issued in the timeframe, 0.01% of them were invalid. This means that 0.01% of the traffic is considered to be non-legitimate visitors, despite the fact that they received the Turnstile tokens. This is why it is crucial to always validate your tokens through the Siteverify API. What becomes more interesting is if the login credentials these suspicious visitors provided were correct credentials, which could indicate that this is a potential account takeover attack or the accounts in question have been compromised. If the login credentials were incorrect, but the attempts were in a burst, that could indicate credential stuffing attack. By correlating Turnstile analytics with your internal application data such as whether the login attempt had a correct or incorrect password, you can further identify the nature and behavior of the attacker and build out the defenses or mitigate accordingly.
This was an example showing how Turnstile can protect and provide insights on just your login page. Imagine how this could be expanded to other use cases such as your sign-up pages, submit form pages, contact pages, checkout pages, and more.
We are not planning on stopping here with Turnstile Analytics. Next on our roadmap is to expand Turnstile Analytics to give you more insights around client side and server side errors, so that you can further break down the traffic beyond just the challenge outcomes. We will also be incorporating Ephemeral IDs into the analytics, so that you can filter by Ephemeral ID, see top Ephemeral IDs, and the frequency of their solve attempts.
We have many more exciting things in store for Turnstile for 2025! There is no prerequisite with Turnstile, and our free tier is unlimited in volume, so there is no barrier to get started today. Let’s help make the Internet a more secure, better place, together!
Cloudflare enables native monitoring and forensics with Log Explorer and custom dashboards
Post Syndicated from Jen Sells original https://blog.cloudflare.com/monitoring-and-forensics/
In 2024, we announced Log Explorer, giving customers the ability to store and query their HTTP and security event logs natively within the Cloudflare network. Today, we are excited to announce that Log Explorer now supports logs from our Zero Trust product suite. In addition, customers can create custom dashboards to monitor suspicious or unusual activity.
Every day, Cloudflare detects and protects customers against billions of threats, including DDoS attacks, bots, web application exploits, and more. SOC analysts, who are charged with keeping their companies safe from the growing spectre of Internet threats, may want to investigate these threats to gain additional insights on attacker behavior and protect against future attacks. Log Explorer, by collecting logs from various Cloudflare products, provides a single starting point for investigations. As a result, analysts can avoid forwarding logs to other tools, maximizing productivity and minimizing costs. Further, analysts can monitor signals specific to their organizations using custom dashboards.
Log Explorer stores your Cloudflare logs for a 30-day retention period so that you can analyze them natively and in a single interface, within the Cloudflare Dashboard. Cloudflare log data is diverse, reflecting the breadth of capabilities available. For example, HTTP requests contain information about the client such as their IP address, request method, autonomous system (ASN), request paths, and TLS versions used. Additionally, Cloudflare’s Application Security WAF Detections enrich these HTTP request logs with additional context, such as the WAF attack score, to identify threats.
Today we are announcing that seven additional Cloudflare product datasets are now available in Log Explorer. These seven datasets are the logs generated from our Zero Trust product suite, and include logs from Access, Gateway DNS, Gateway HTTP, Gateway Network, CASB, Zero
Trust Network Session, and Device Posture Results. Read on for examples of how to use these logs to identify common threats.
By reviewing Access logs and HTTP request logs, we can reveal attempts to access resources or systems without proper permissions, including brute force password attacks, indicating potential security breaches or malicious activity.
Below, we filter Access Logs on the Allowed field, to see activity related to unauthorized access.
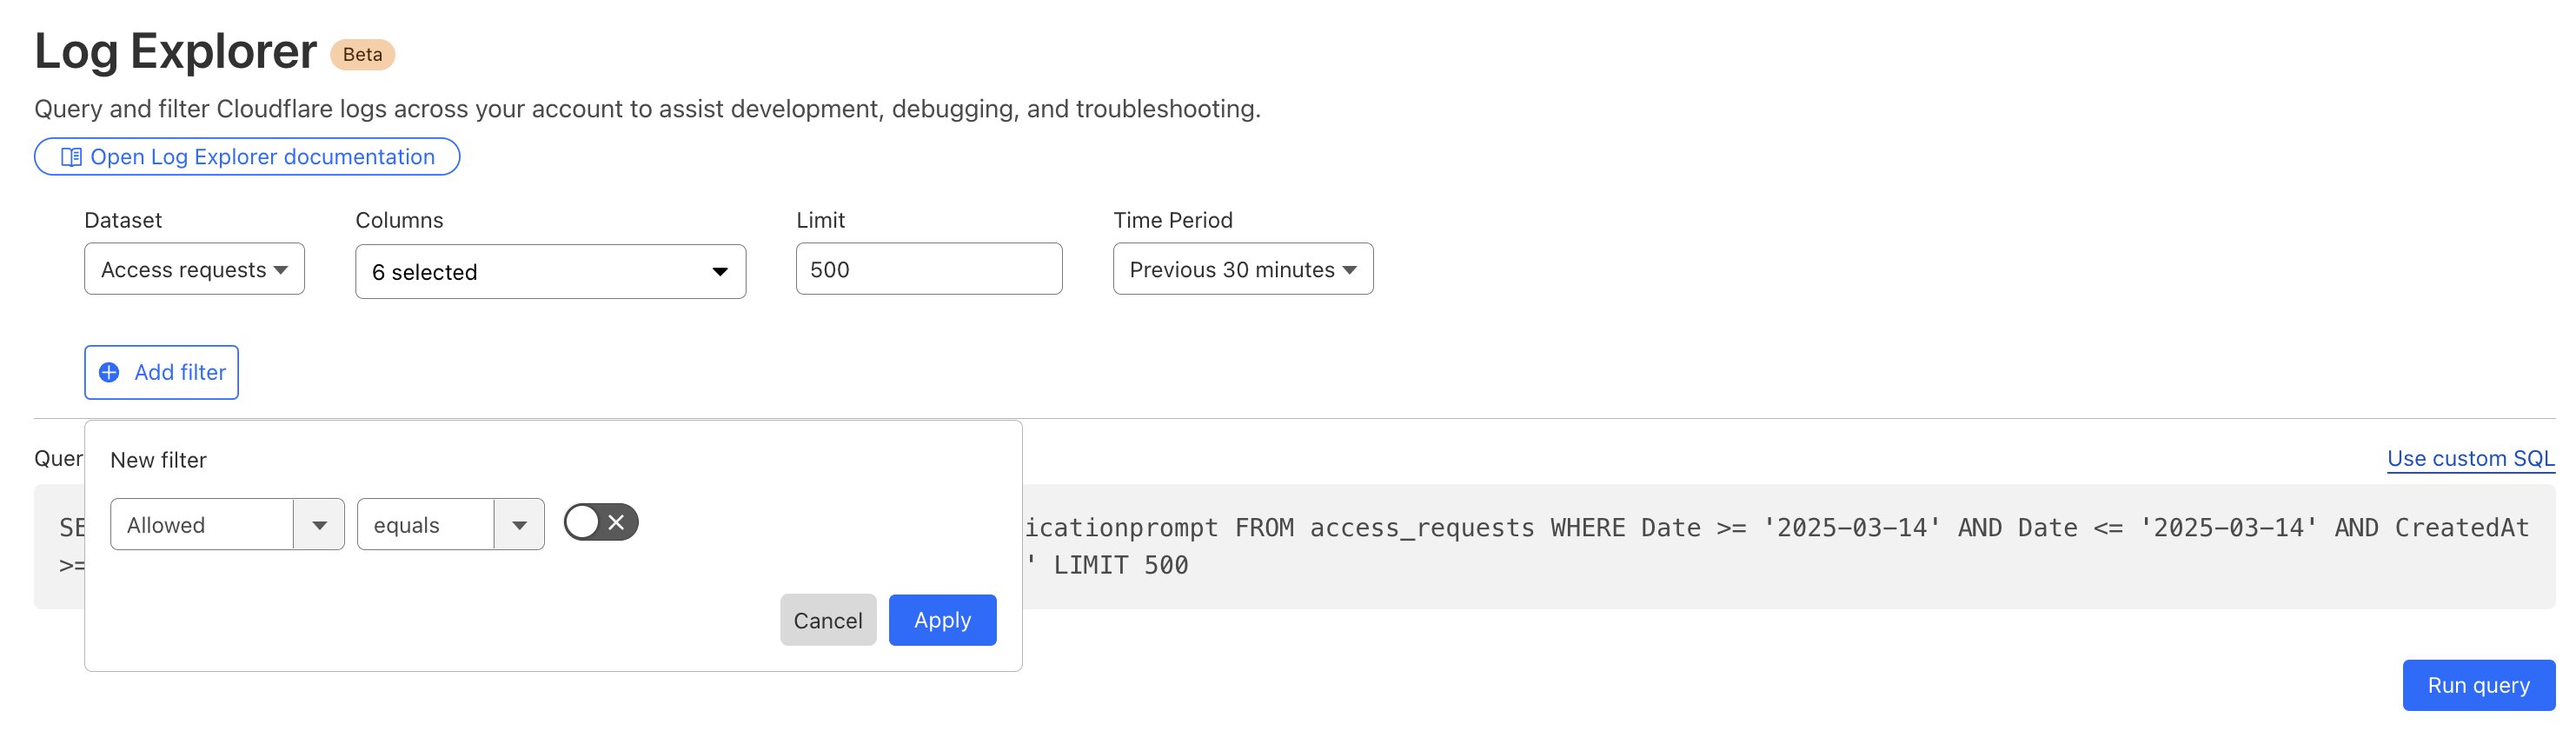
By then reviewing the HTTP logs for the requests identified in the previous query, we can assess if bot networks are the source of unauthorized activity.
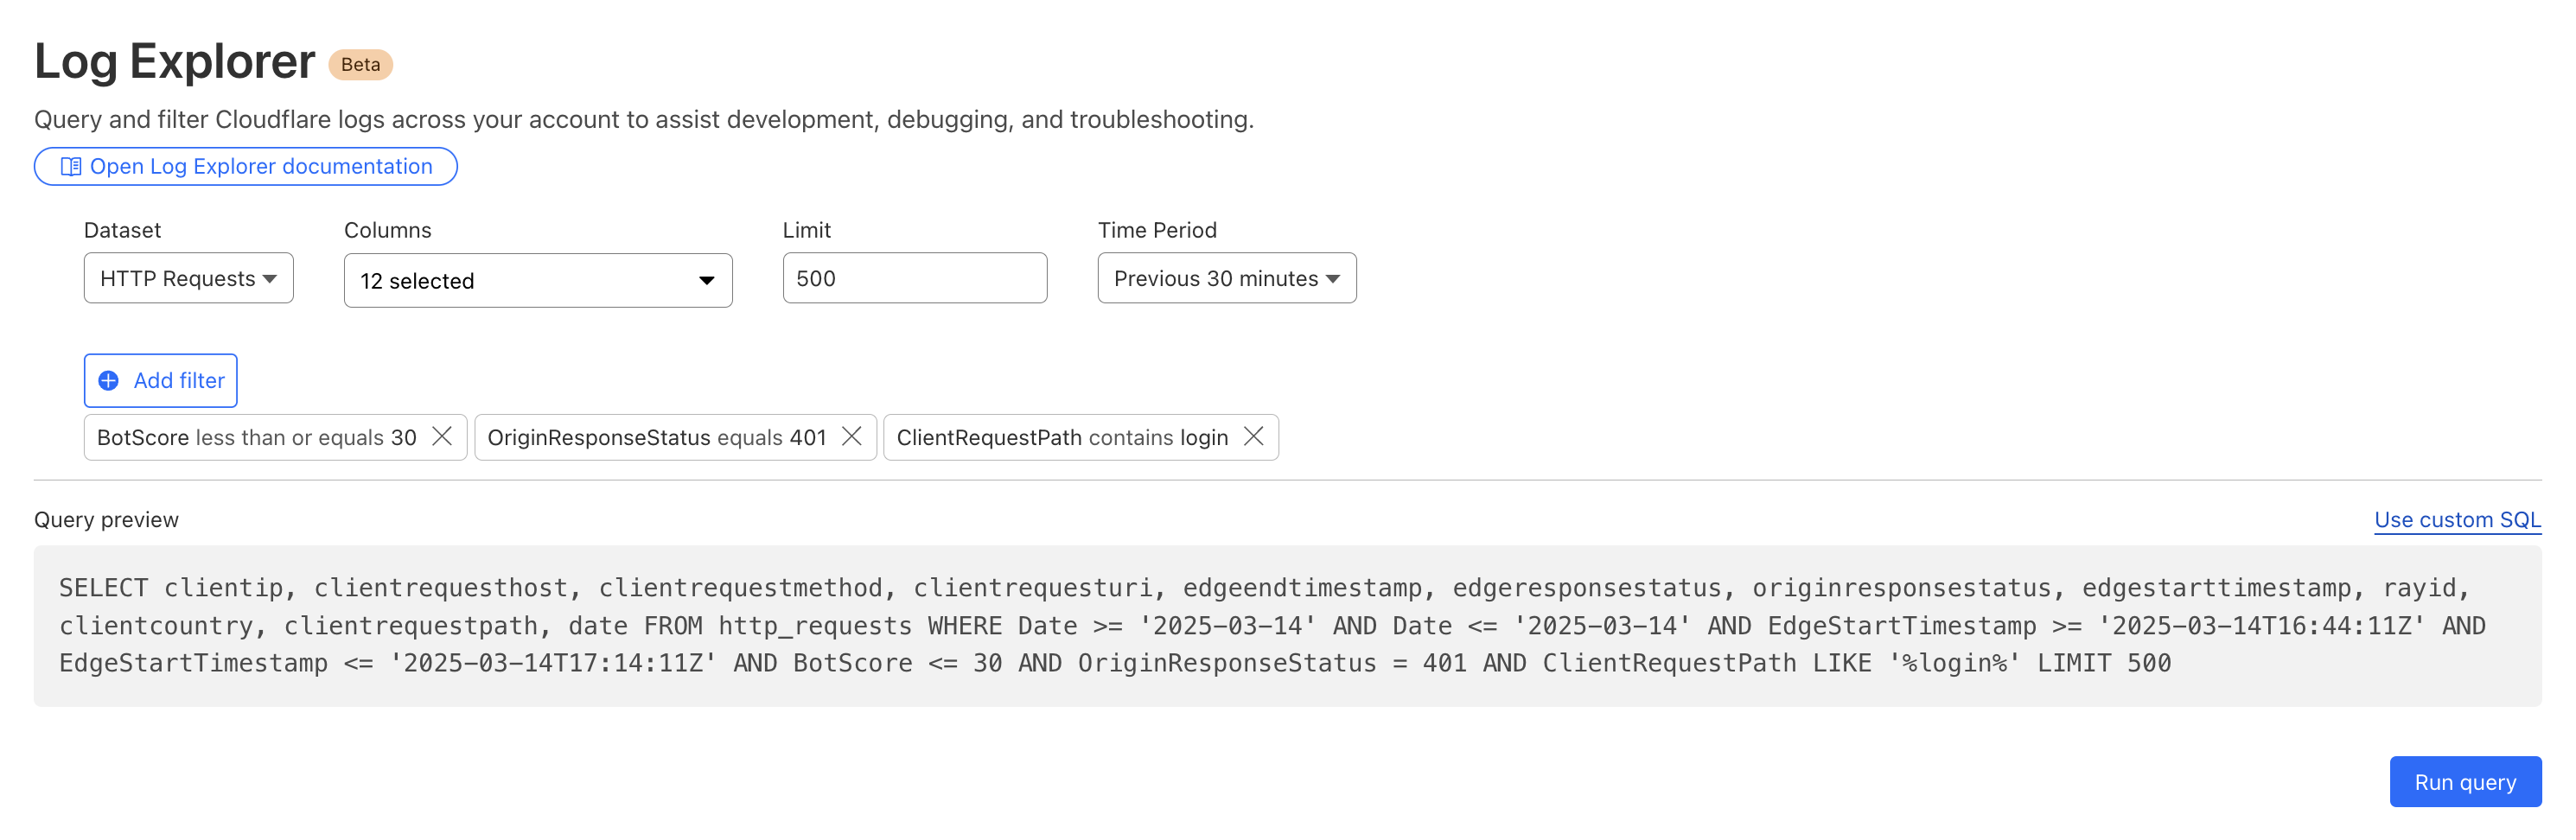
With this information, you can craft targeted Custom Rules to block the offending traffic.
Cloudflare’s Web Gateway can track which websites users are accessing, allowing administrators to identify and block access to malicious or inappropriate sites. These logs can be used to detect if a user’s machine or account is compromised by malware attacks. When reviewing logs, this may become apparent when we look for records that show a rapid succession of attempts to browse known malicious sites, such as hostnames that have long strings of seemingly random characters that hide their true destination. In this example, we can query logs looking for requests to a spoofed YouTube URL.
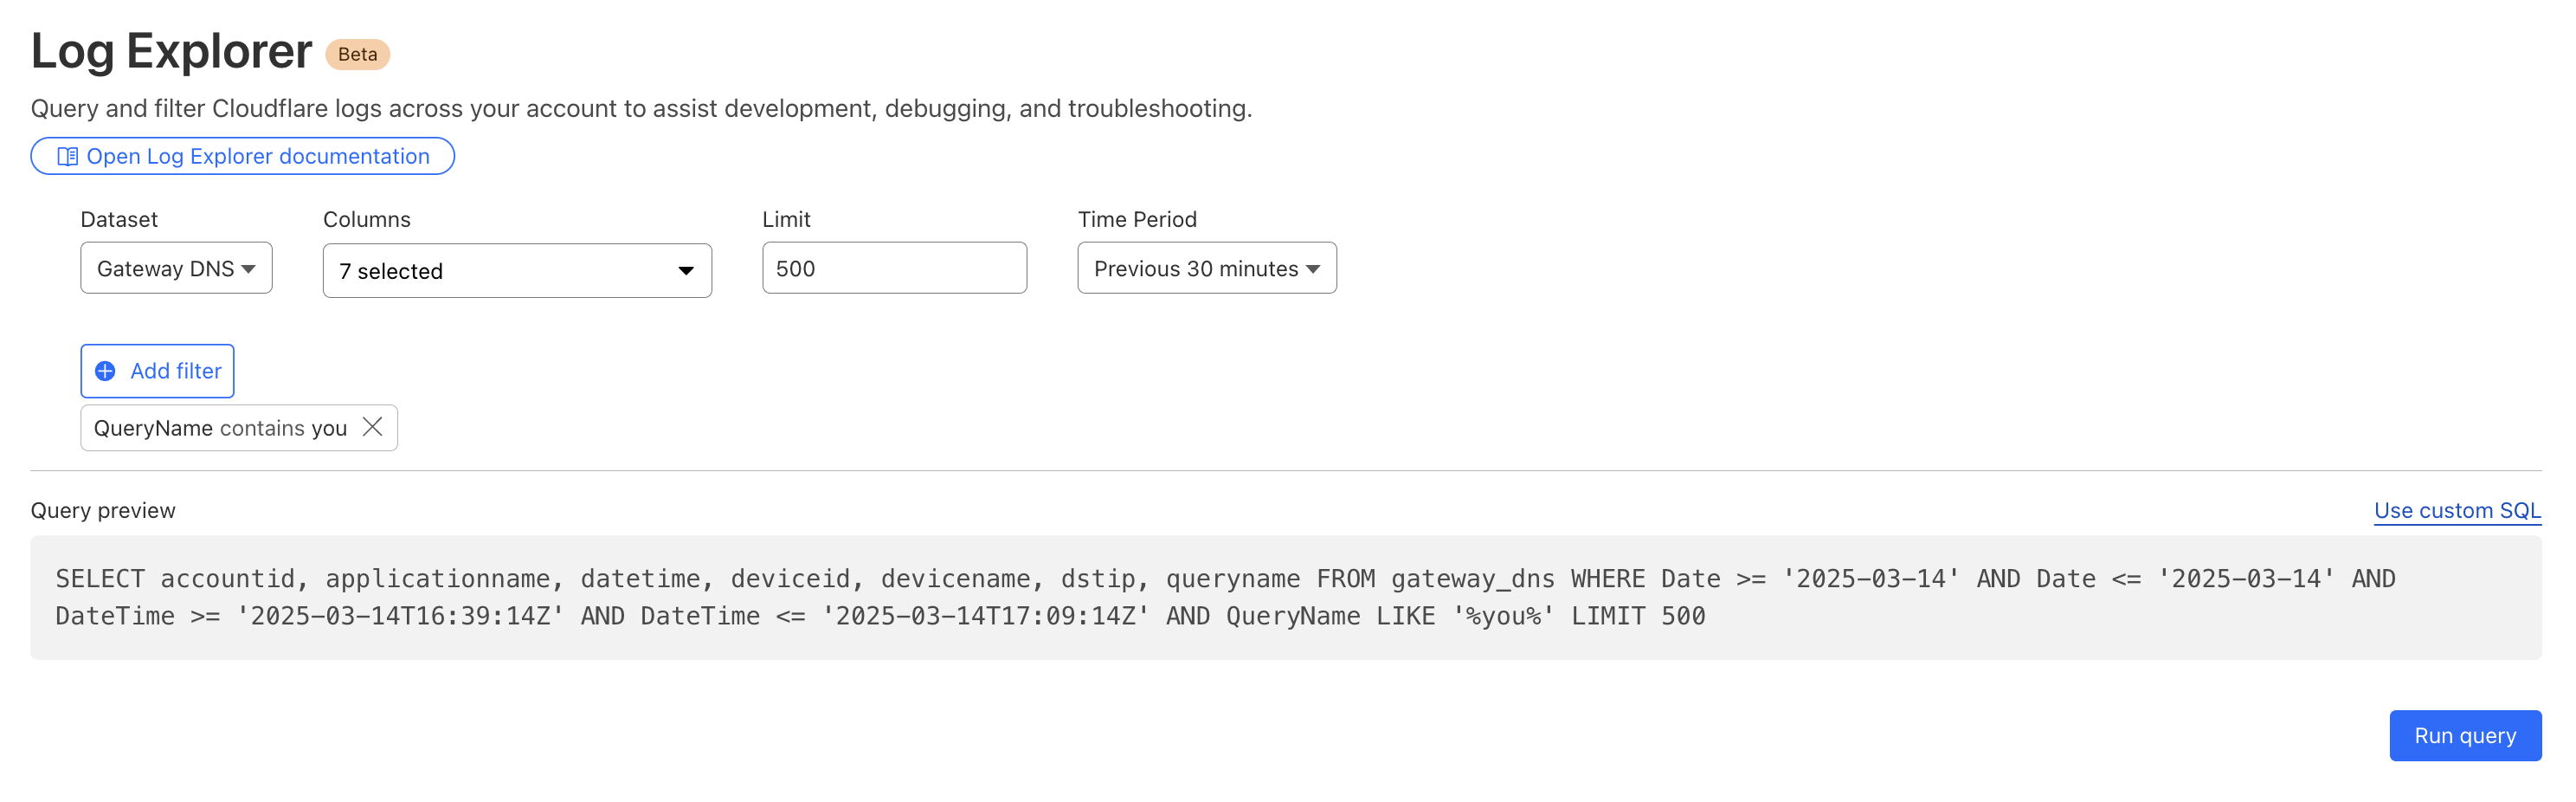
Security monitoring is not one size fits all. For instance, companies in the retail or financial industries worry about fraud, while every company is concerned about data exfiltration, of information like trade secrets. And any form of personally identifiable information (PII) is a target for data breaches or ransomware attacks.
While log exploration helps you react to threats, our new custom dashboards allow you to define the specific metrics you need in order to monitor threats you are concerned about.
Getting started is easy, with the ability to create a chart using natural language. A natural language interface is integrated into the chart create/edit experience, enabling you to describe in your own words the chart you want to create. Similar to the AI Assistant we announced during Security Week 2024, the prompt translates your language to the appropriate chart configuration, which can then be added to a new or existing custom dashboard.
-
Use a prompt: Enter a query like “Compare status code ranges over time”. The AI model decides the most appropriate visualization and constructs your chart configuration.
-
Customize your chart: Select the chart elements manually, including the chart type, title, dataset to query, metrics, and filters. This option gives you full control over your chart’s structure.
Video shows entering a natural language description of desired metric “compare status code ranges over time”, preview chart shown is a time series grouped by error code ranges, selects “add chart” to save to dashboard.
For more help getting started, we have some pre-built templates that you can use for monitoring specific uses. Available templates currently include:
-
Bot monitoring: Identify automated traffic accessing your website
-
API Security: Monitor the data transfer and exceptions of API endpoints within your application
-
API Performance: See timing data for API endpoints in your application, along with error rates
-
Account Takeover: View login attempts, usage of leaked credentials, and identify account takeover attacks
-
Performance Monitoring: Identify slow hosts and paths on your origin server, and view time to first byte (TTFB) metrics over time
Templates provide a good starting point, and once you create your dashboard, you can add or remove individual charts using the same natural language chart creator.
Video shows editing chart from an existing dashboard and moving individual charts via drag and drop.
Custom dashboards can be used to monitor for suspicious activity, or to keep an eye on performance and errors for your domains. Let’s explore some examples of suspicious activity that we can monitor using custom dashboards.
Take, for example, our use case from above: investigating unauthorized access. With custom dashboards, you can create a dashboard using the Account takeover template to monitor for suspicious login activity related to your domain.
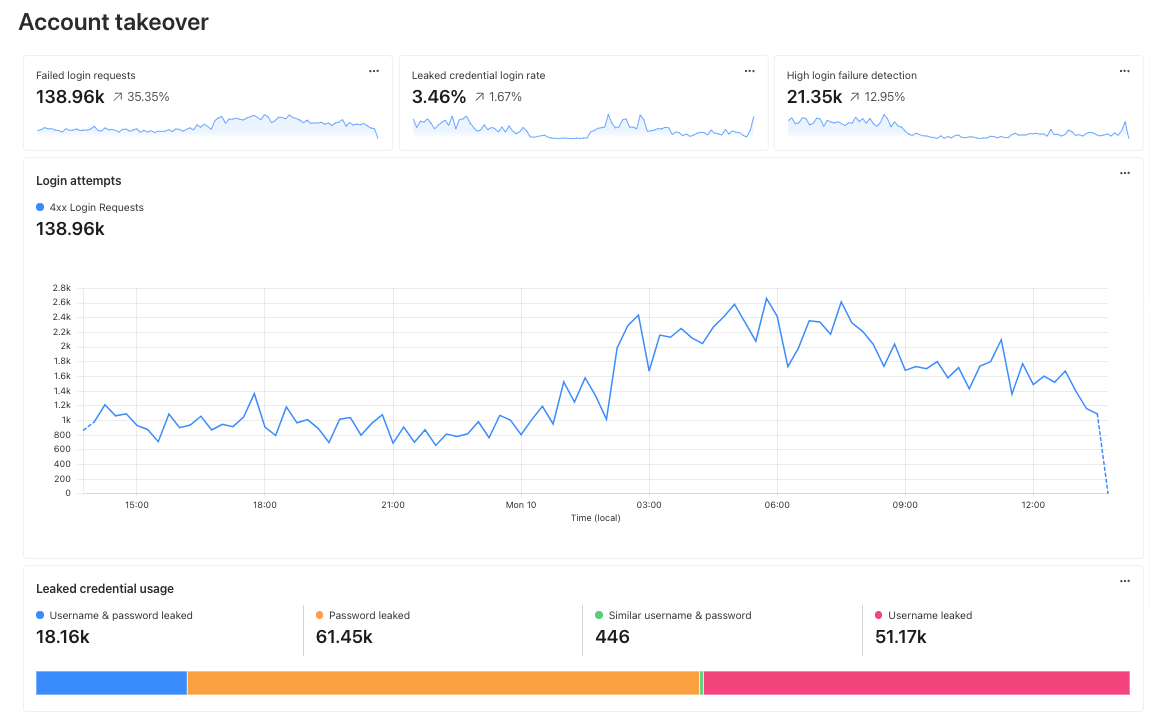
As another example, spikes in requests or errors are common indicators that something is wrong, and they can sometimes be signals of suspicious activity. With the Performance Monitoring template, you can view origin response time and time to first byte metrics as well as monitor for common errors. For example, in this chart, the spikes in 404 errors could be an indication of an unauthorized scan of your endpoints.
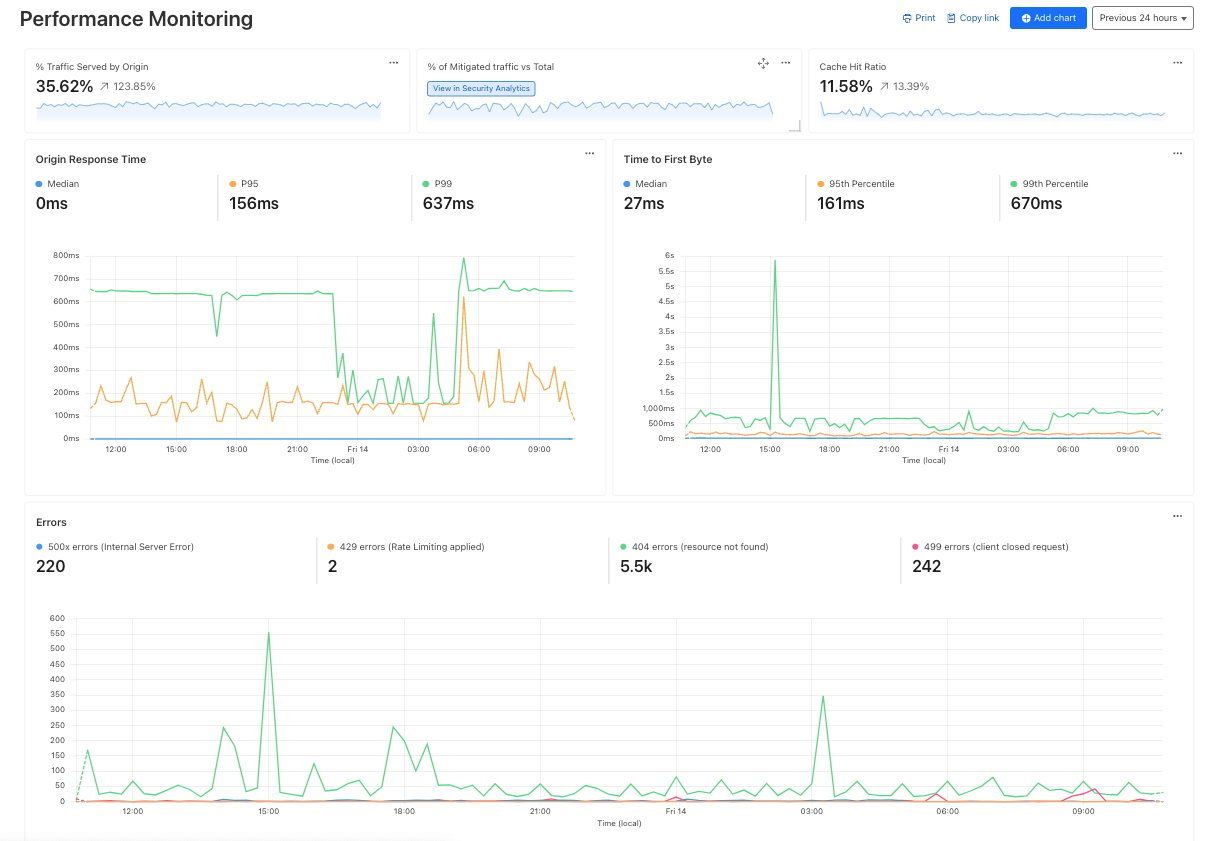
When using custom dashboards, if you observe a traffic pattern or spike in errors that you would like to further investigate, you can click the button to “View in Security Analytics” in order to drill down further into the data and craft custom WAF rules to mitigate the threat.
These tools, seamlessly integrated into the Cloudflare platform, will enable users to discover, investigate, and mitigate threats all in one place, reducing time to resolution and overall cost of ownership by eliminating the need to forward logs to third party security analysis tools. And because it is a native part of Cloudflare, you can immediately use the data from your investigation to craft targeted rules that will block these threats.
Stay tuned as we continue to develop more capabilities in the areas of observability and forensics, with additional features including:
-
Custom alerts: create alerts based on specific metrics or anomalies
-
Scheduled query detections: craft log queries and run them on a schedule to detect malicious activity
-
More integration: further streamlining the journey between detect, investigate, and mitigate across the full Cloudflare platform.
Current Log Explorer beta users get immediate access to the new custom dashboards feature. Pricing will be made available to everyone during Q2 2025. Between now and then, these features continue to be available at no cost.
Let us know if you are interested in joining our Beta program by completing this form, and a member of our team will contact you.
One platform to manage your company’s predictive security posture with Cloudflare
Post Syndicated from Zhiyuan Zheng original https://blog.cloudflare.com/cloudflare-security-posture-management/
In today’s fast-paced digital landscape, companies are managing an increasingly complex mix of environments — from SaaS applications and public cloud platforms to on-prem data centers and hybrid setups. This diverse infrastructure offers flexibility and scalability, but also opens up new attack surfaces.
To support both business continuity and security needs, “security must evolve from being reactive to predictive”. Maintaining a healthy security posture entails monitoring and strengthening your security defenses to identify risks, ensure compliance, and protect against evolving threats. With our newest capabilities, you can now use Cloudflare to achieve a healthy posture across your SaaS and web applications. This addresses any security team’s ultimate (daily) question: How well are our assets and documents protected?
A predictive security posture relies on the following key components:
-
Real-time discovery and inventory of all your assets and documents
-
Continuous asset-aware threat detection and risk assessment
-
Prioritised remediation suggestions to increase your protection
Today, we are sharing how we have built these key components across SaaS and web applications, and how you can use them to manage your business’s security posture.
Regardless of the applications you have connected to Cloudflare’s global network, Cloudflare actively scans for risks and misconfigurations associated with each one of them on a regular cadence. Identified risks and misconfigurations are surfaced in the dashboard under Security Center as insights.
Insights are grouped by their severity, type of risks, and corresponding Cloudflare solution, providing various angles for you to zoom in to what you want to focus on. When applicable, a one-click resolution is provided for selected insight types, such as setting minimum TLS version to 1.2 which is recommended by PCI DSS. This simplicity is highly appreciated by customers that are managing a growing set of assets being deployed across the organization.
To help shorten the time to resolution even further, we have recently added role-based access control (RBAC) to Security Insights in the Cloudflare dashboard. Now for individual security practitioners, they have access to a distilled view of the insights that are relevant for their role. A user with an administrator role (a CSO, for example) has access to, and visibility into, all insights.
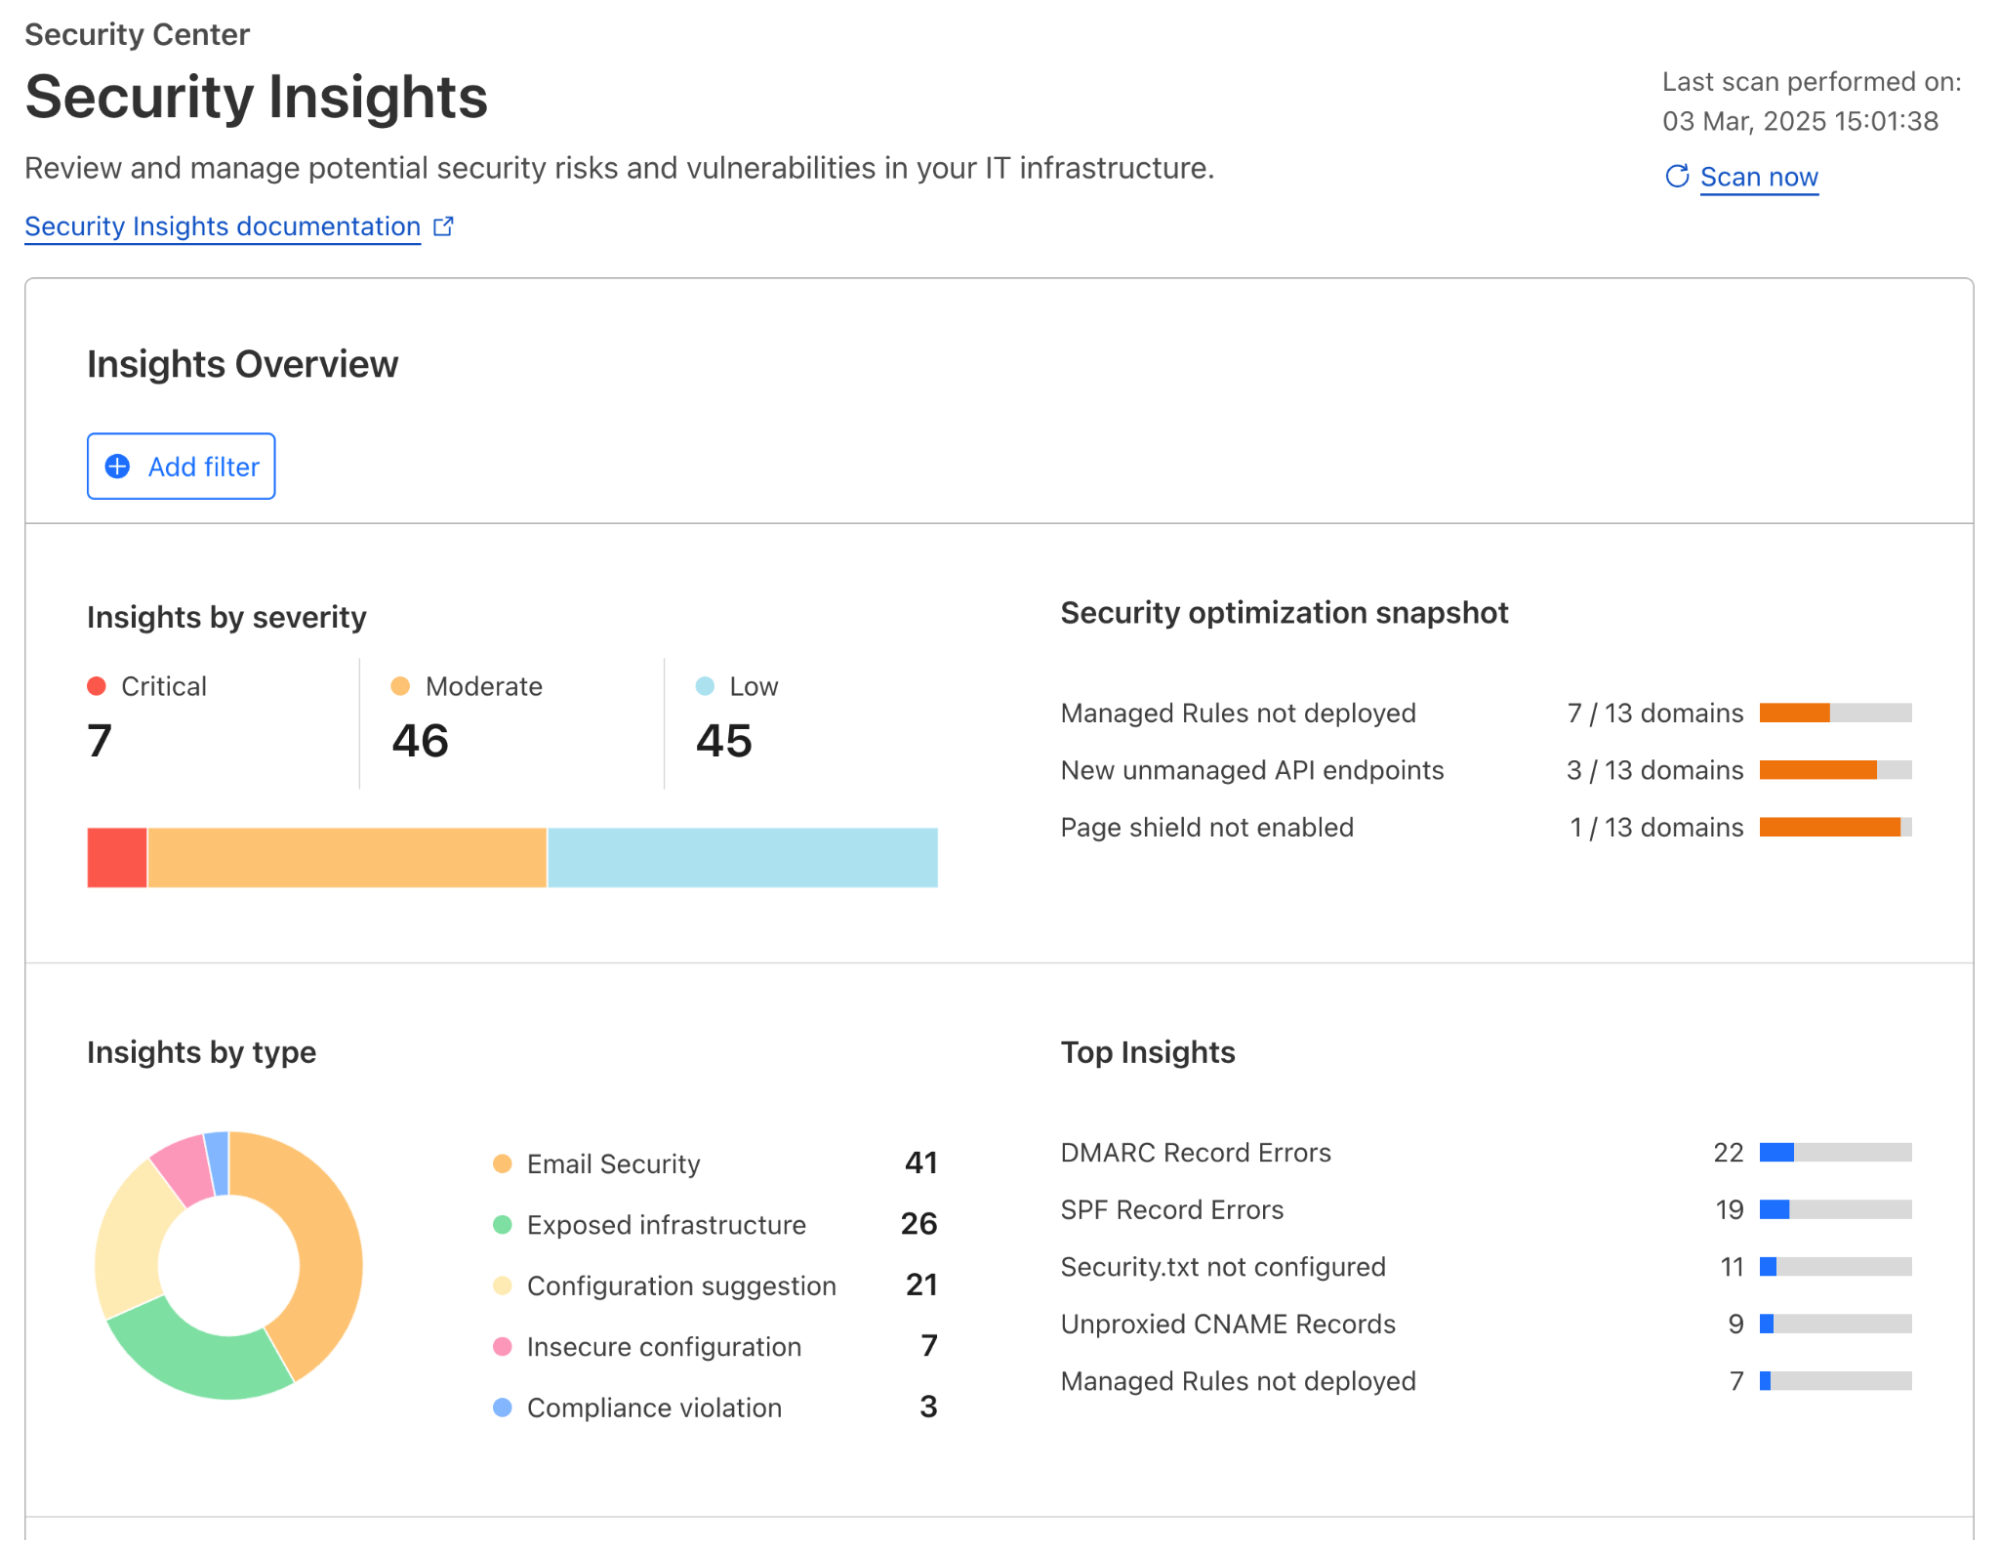
In addition to account-wide Security Insights, we also provide posture overviews that are closer to the corresponding security configurations of your SaaS and web applications. Let’s dive into each of them.
Without centralized posture management, SaaS applications can feel like the security wild west. They contain a wealth of sensitive information – files, databases, workspaces, designs, invoices, or anything your company needs to operate, but control is limited to the vendor’s settings, leaving you with less visibility and fewer customization options. Moreover, team members are constantly creating, updating, and deleting content that can cause configuration drift and data exposure, such as sharing files publicly, adding PII to non-compliant databases, or giving access to third party integrations. With Cloudflare, you have visibility across your SaaS application fleet in one dashboard.
Posture findings across your SaaS fleet
From the account-wide Security Insights, you can review insights for potential SaaS security issues:
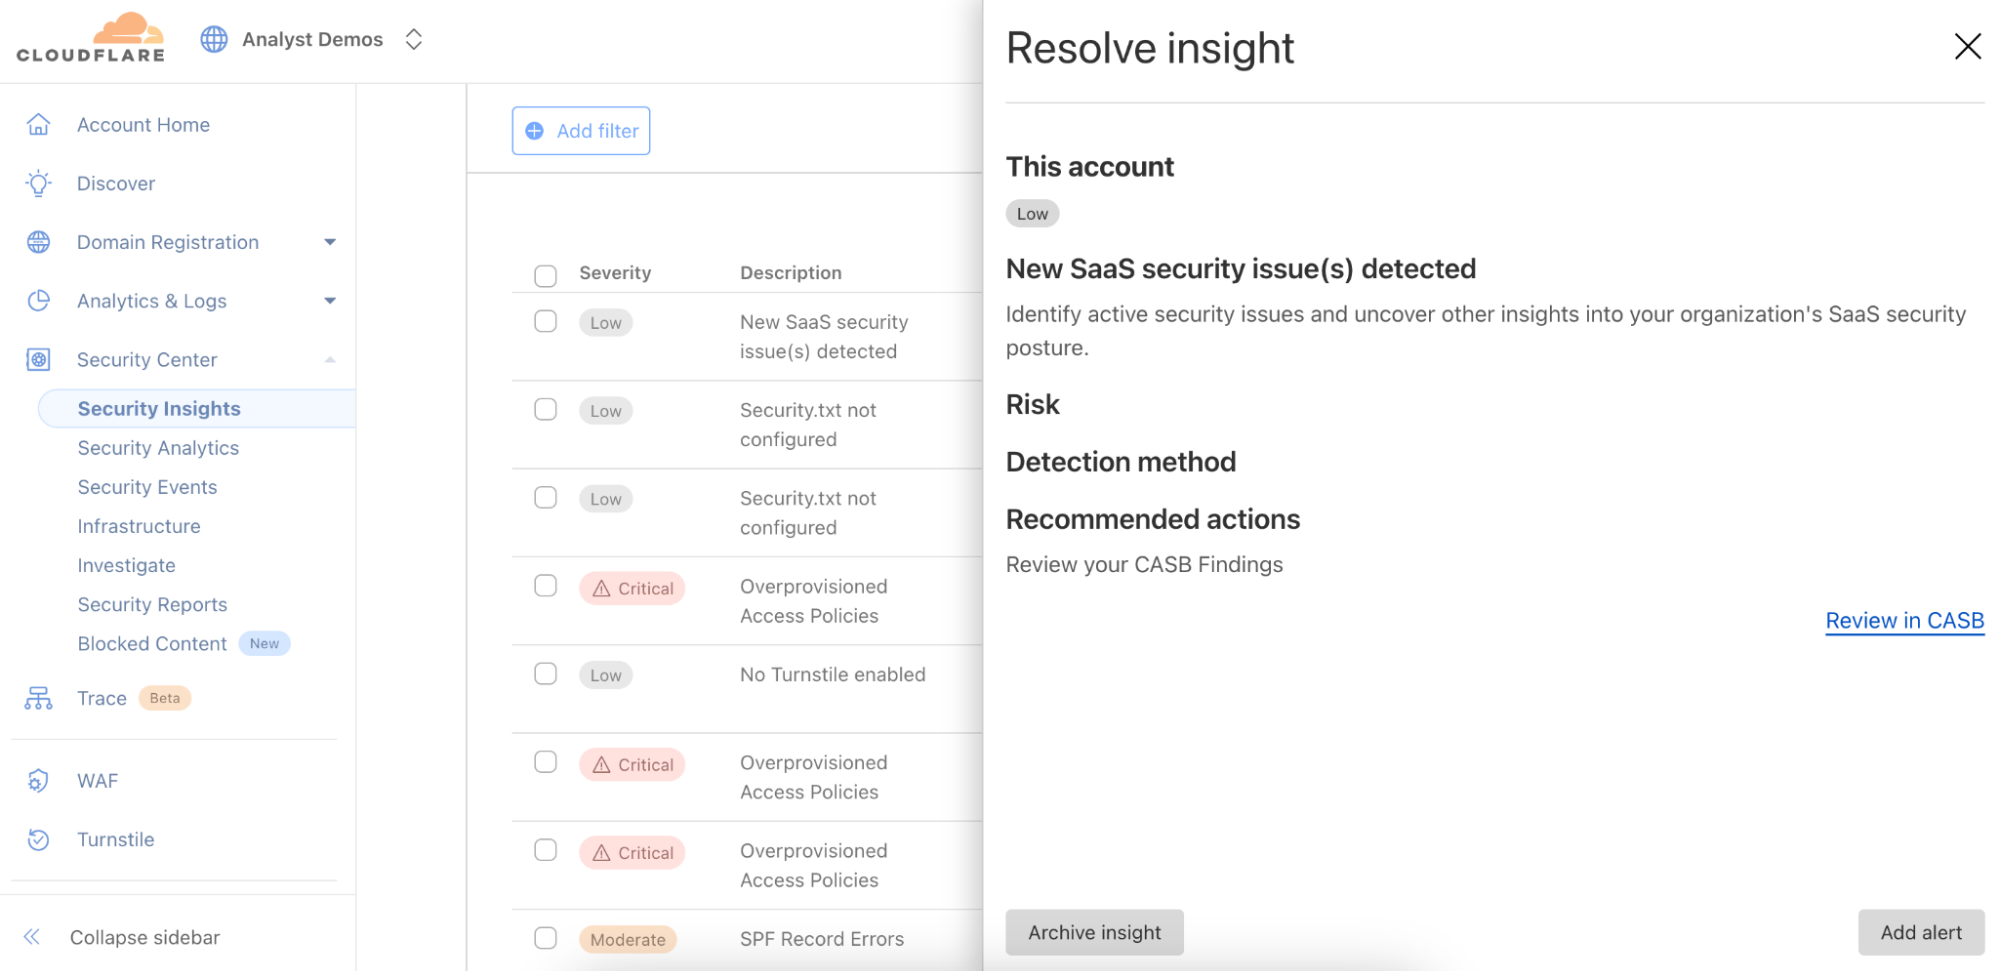
You can choose to dig further with Cloud Access Security Broker (CASB) for a thorough review of the misconfigurations, risks, and failures to meet best practices across your SaaS fleet. You can identify a wealth of security information including, but not limited to:
-
Publicly available or externally shared files
-
Third-party applications with read or edit access
-
Unknown or anonymous user access
-
Databases with exposed credentials
-
Users without two-factor authentication
-
Inactive user accounts
You can also explore the Posture Findings page, which provides easy searching and navigation across documents that are stored within the SaaS applications.
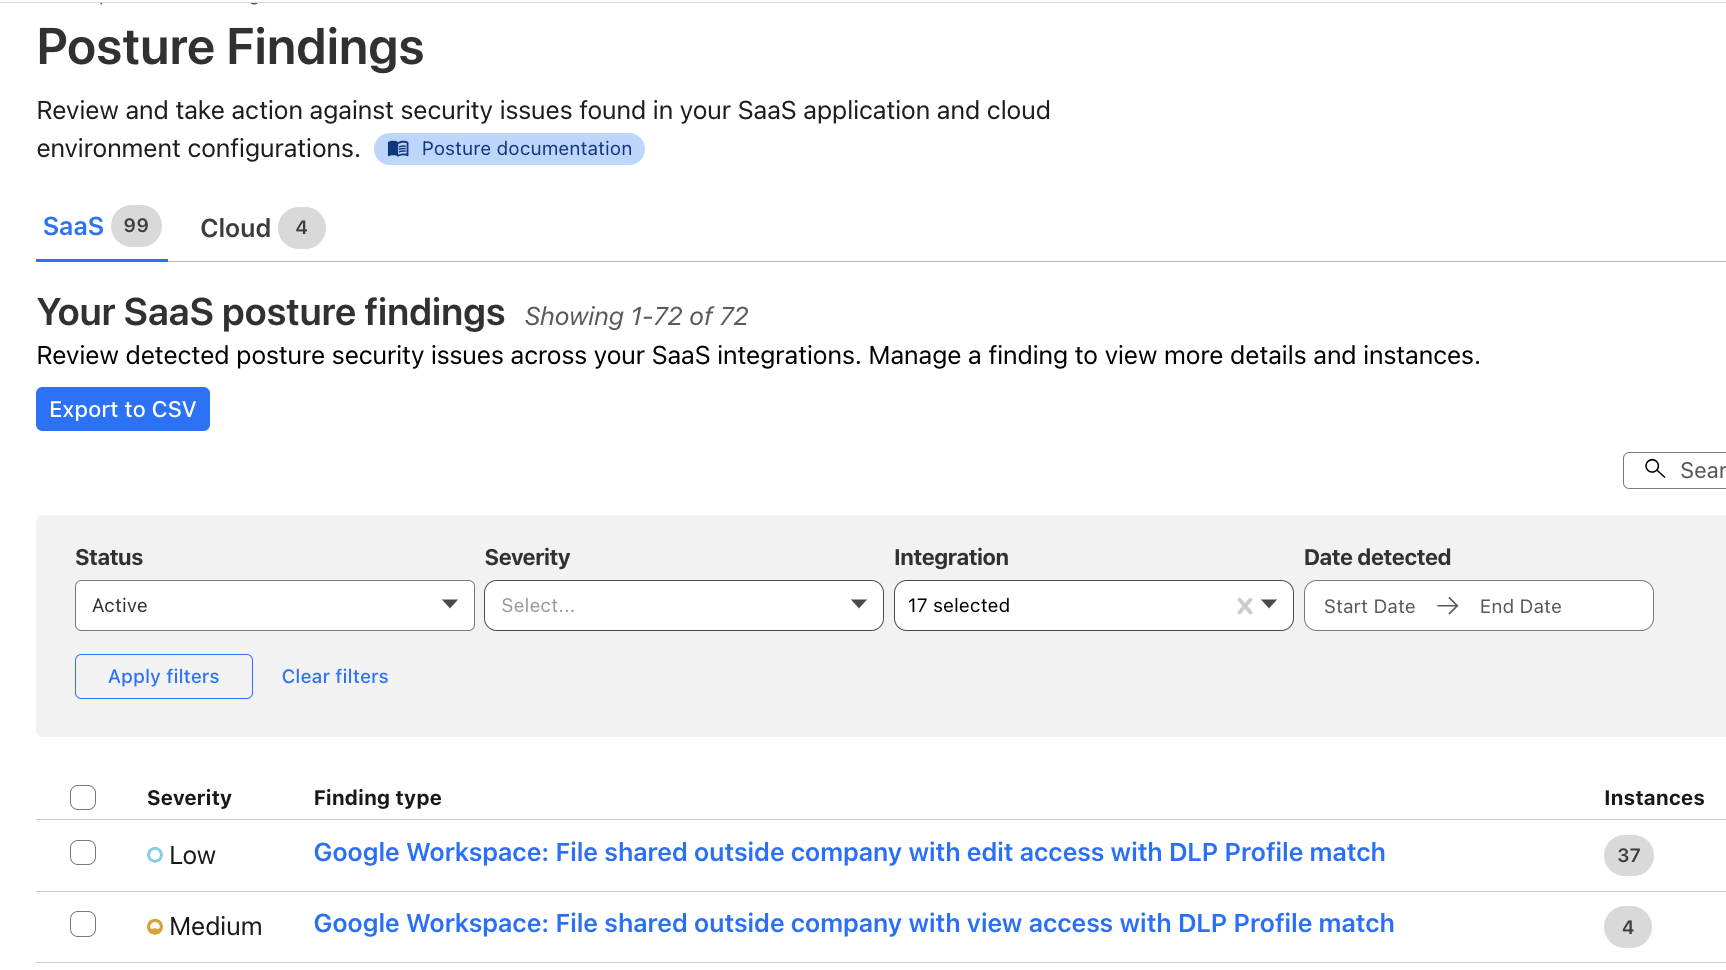
Additionally, you can create policies to prevent configuration drift in your environment. Prevention-based policies help maintain a secure configuration and compliance standards, while reducing alert fatigue for Security Operations teams, and these policies can prevent the inappropriate movement or exfiltration of sensitive data. Unifying controls and visibility across environments makes it easier to lock down regulated data classes, maintain detailed audit trails via logs, and improve your security posture to reduce the risk of breaches.
How it works: new, real-time SaaS documents discovery
Delivering SaaS security posture information to our customers requires collecting vast amounts of data from a wide range of platforms. In order to ensure that all the documents living in your SaaS apps (files, designs, etc.) are secure, we need to collect information about their configuration — are they publicly shared, do third-party apps have access, is multi-factor authentication (MFA) enabled?
We previously did this with crawlers, which would pull data from the SaaS APIs. However, we were plagued with rate limits from the SaaS vendors when working with larger datasets. This forced us to work in batches and ramp scanning up and down as the vendors permitted. This led to stale findings and would make remediation cumbersome and unclear – for example, Cloudflare would be reporting that a file is still shared publicly for a short period after the permissions were removed, leading to customer confusion.
To fix this, we upgraded our data collection pipeline to be dynamic and real-time, reacting to changes in your environment as they occur, whether it’s a new security finding, an updated asset, or a critical alert from a vendor. We started with our Microsoft asset discovery and posture findings, providing you real-time insight into your Microsoft Admin Center, OneDrive, Outlook, and SharePoint configurations. We will be rapidly expanding support to additional SaaS vendors going forward.
Listening for update events from Cloudflare Workers
Cloudflare Workers serve as the entry point for vendor webhooks, handling asset change notifications from external services. The workflow unfolds as follows:
-
Webhook listener: An initial Worker acts as the webhook listener, receiving asset change messages from vendors.
-
Data storage & queuing: Upon receiving a message, the Worker uploads the raw payload of the change notification to Cloudflare R2 for persistence, and publishes it to a Cloudflare Queue dedicated to raw asset changes.
-
Transformation Worker: A second Worker, bound as a consumer to the raw asset change queue, processes the incoming messages. This Worker transforms the raw vendor-specific data into a generic format suitable for CASB. The transformed data is then:
-
Stored in Cloudflare R2 for future reference.
-
Published on another Cloudflare Queue, designated for transformed messages.
-
CASB Processing: Consumers & Crawlers
Once the transformed messages reach the CASB layer, they undergo further processing:
-
Polling consumer: CASB has a consumer that polls the transformed message queue. Upon receiving a message, it determines the relevant handler required for processing.
-
Crawler execution: The handler then maps the message to an appropriate crawler, which interacts with the vendor API to fetch the most up-to-date asset details.
-
Data storage: The retrieved asset data is stored in the CASB database, ensuring it is accessible for security and compliance checks.
With this improvement, we are now processing 10 to 20 Microsoft updates per second, or 864,000 to 1.72 million updates daily, giving customers incredibly fast visibility into their environment. Look out for expansion to other SaaS vendors in the coming months.
A unique challenge of securing web applications is that no one size fits all. An asset-aware posture management bridges the gap between a universal security solution and unique business needs, offering tailored recommendations for security teams to protect what matters.
Posture overview from attacks to threats and risks
Starting today, all Cloudflare customers have access to Security Overview, a new landing page customized for each of your onboarded domains. This page aggregates and prioritizes security suggestions across all your web applications:
-
Any (ongoing) attacks detected that require immediate attention
-
Disposition (mitigated, served by Cloudflare, served by origin) of all proxied traffic over the last 7 days
-
Summary of currently active security modules that are detecting threats
-
Suggestions of how to improve your security posture with a step-by-step guide
-
And a glimpse of your most active and lately updated security rules
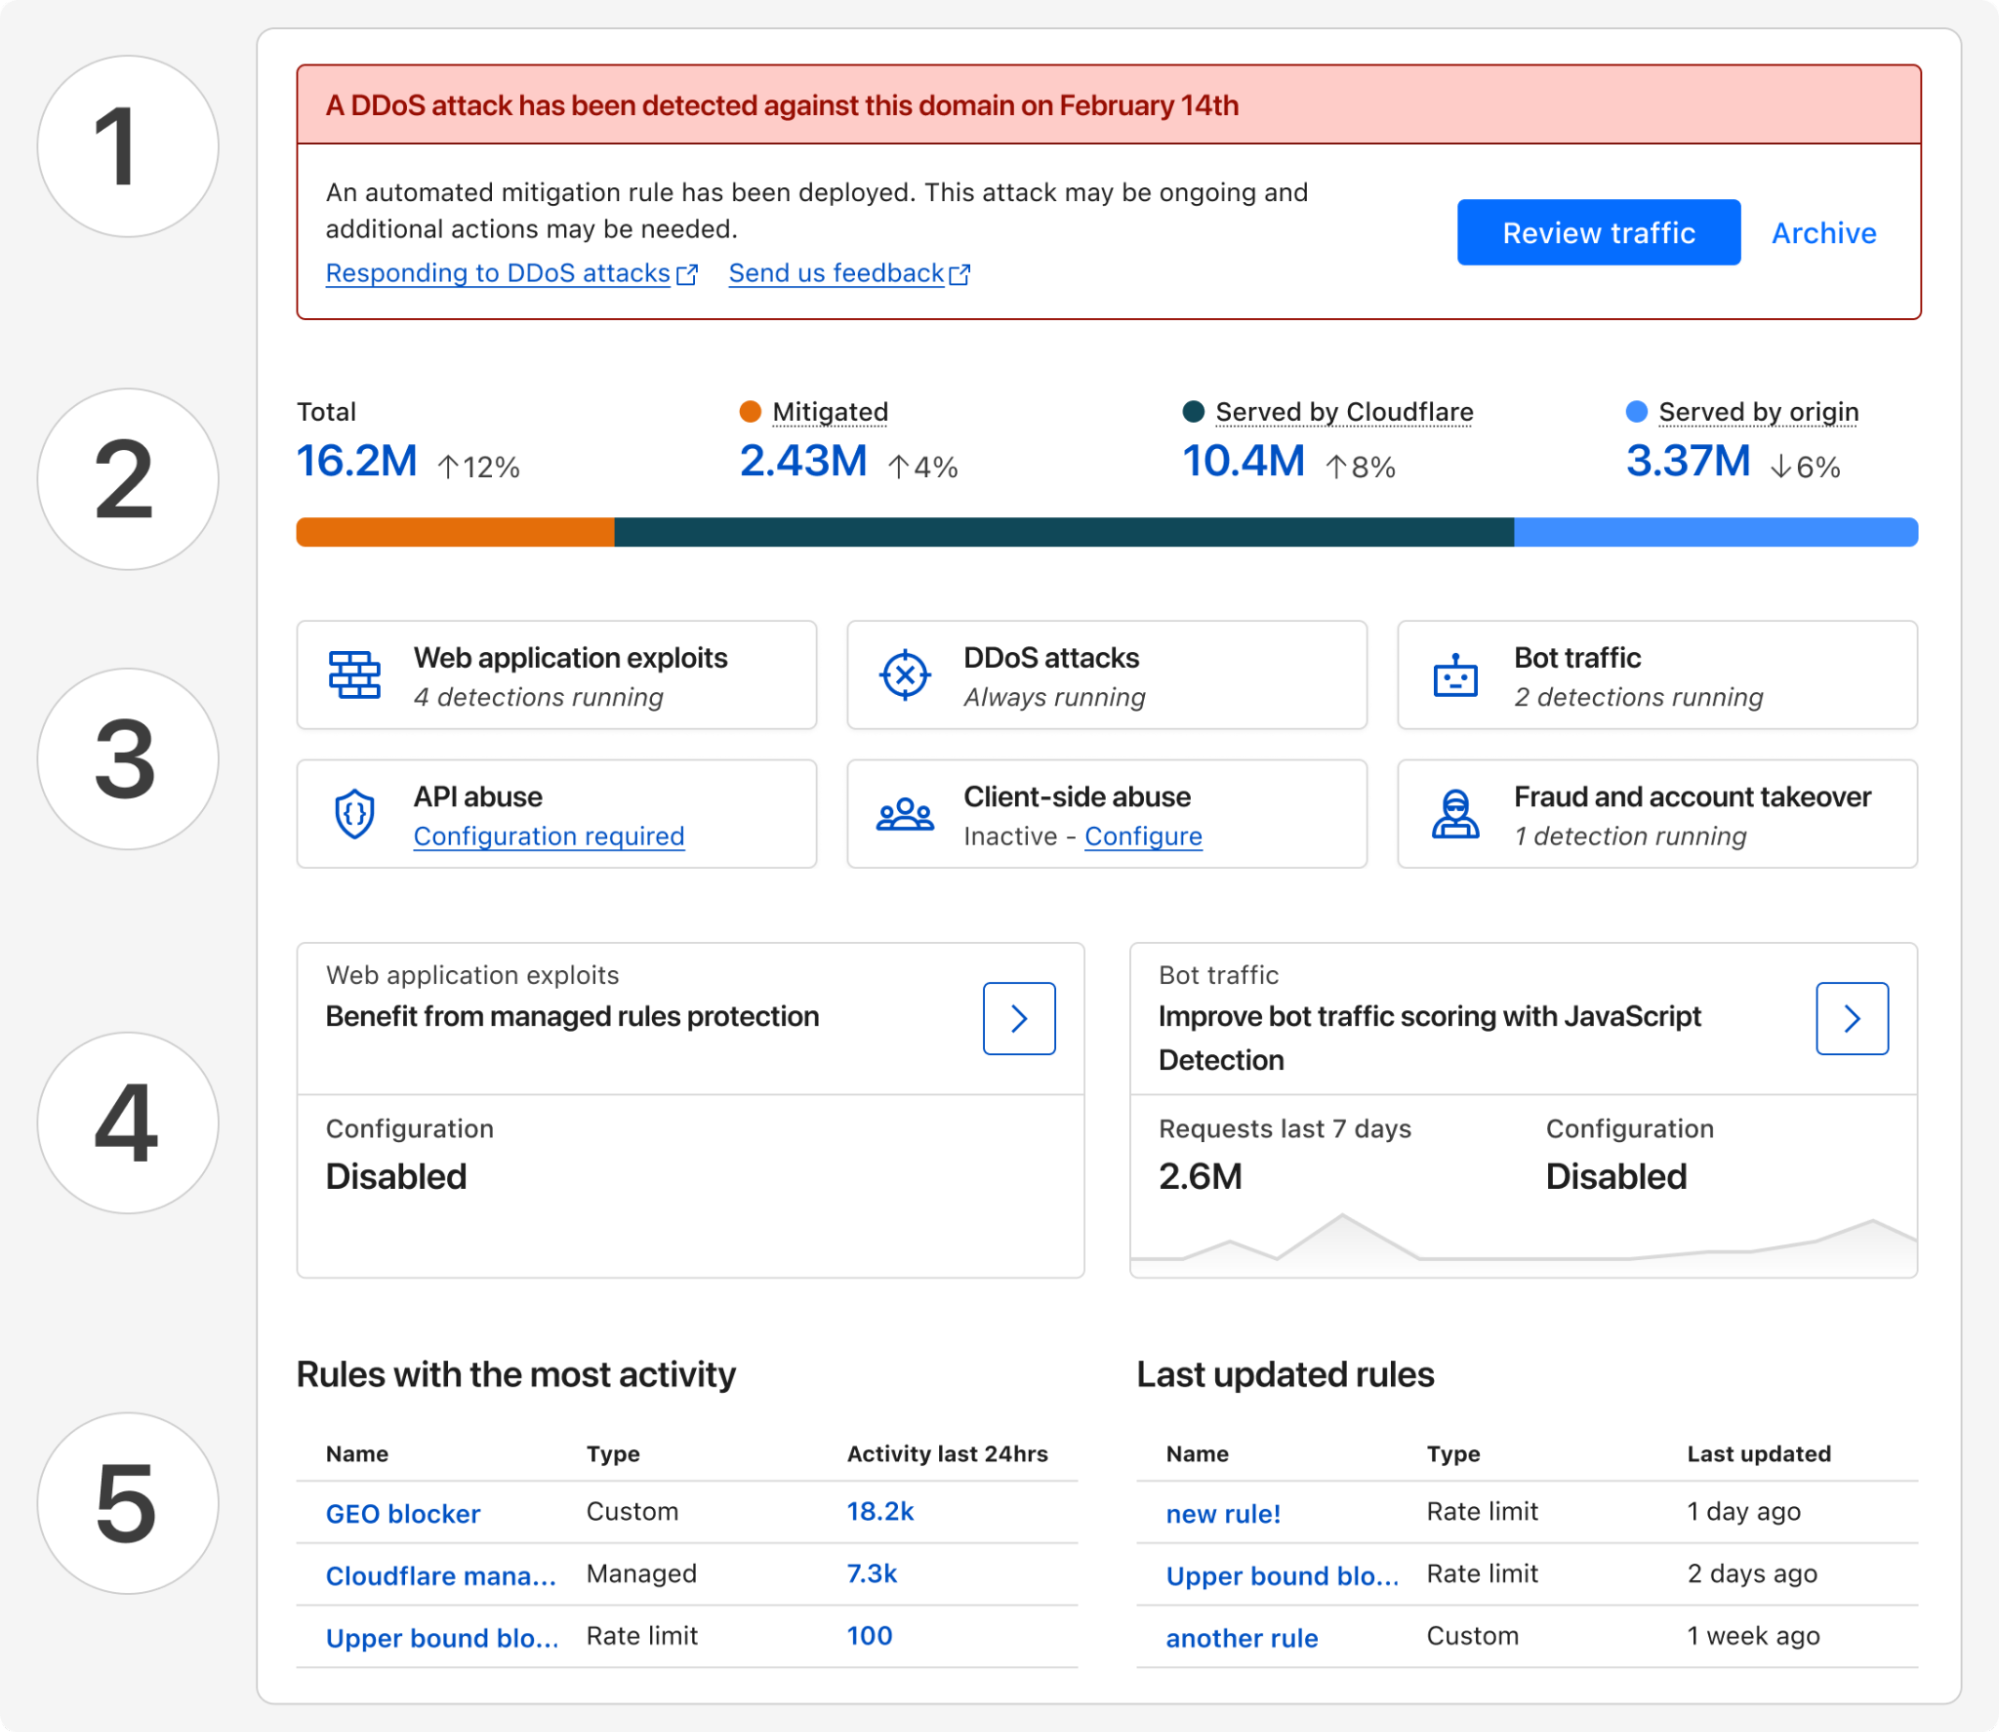
These tailored security suggestions are surfaced based on your traffic profile and business needs, which is made possible by discovering your proxied web assets.
Discovery of web assets
Many web applications, regardless of their industry or use case, require similar functionality: user identification, accepting payment information, etc. By discovering the assets serving this functionality, we can build and run targeted threat detection to protect them in depth.
As an example, bot traffic towards marketing pages versus login pages have different business impacts. Content scraping may be happening targeting your marketing materials, which you may or may not want to allow, while credential stuffing on your login page deserves immediate attention.
Web assets are described by a list of endpoints; and labelling each of them defines their business goals. A simple example can be POST requests to path /portal/login, which likely describes an API for user authentication. While the GET requests to path /portal/login denote the actual login webpage.
To describe business goals of endpoints, labels come into play. POST requests to the /portal/login endpoint serving end users and to the /api/admin/login endpoint used by employees can both can be labelled using the same cf-log-in managed label, letting Cloudflare know that usernames and passwords would be expected to be sent to these endpoints.
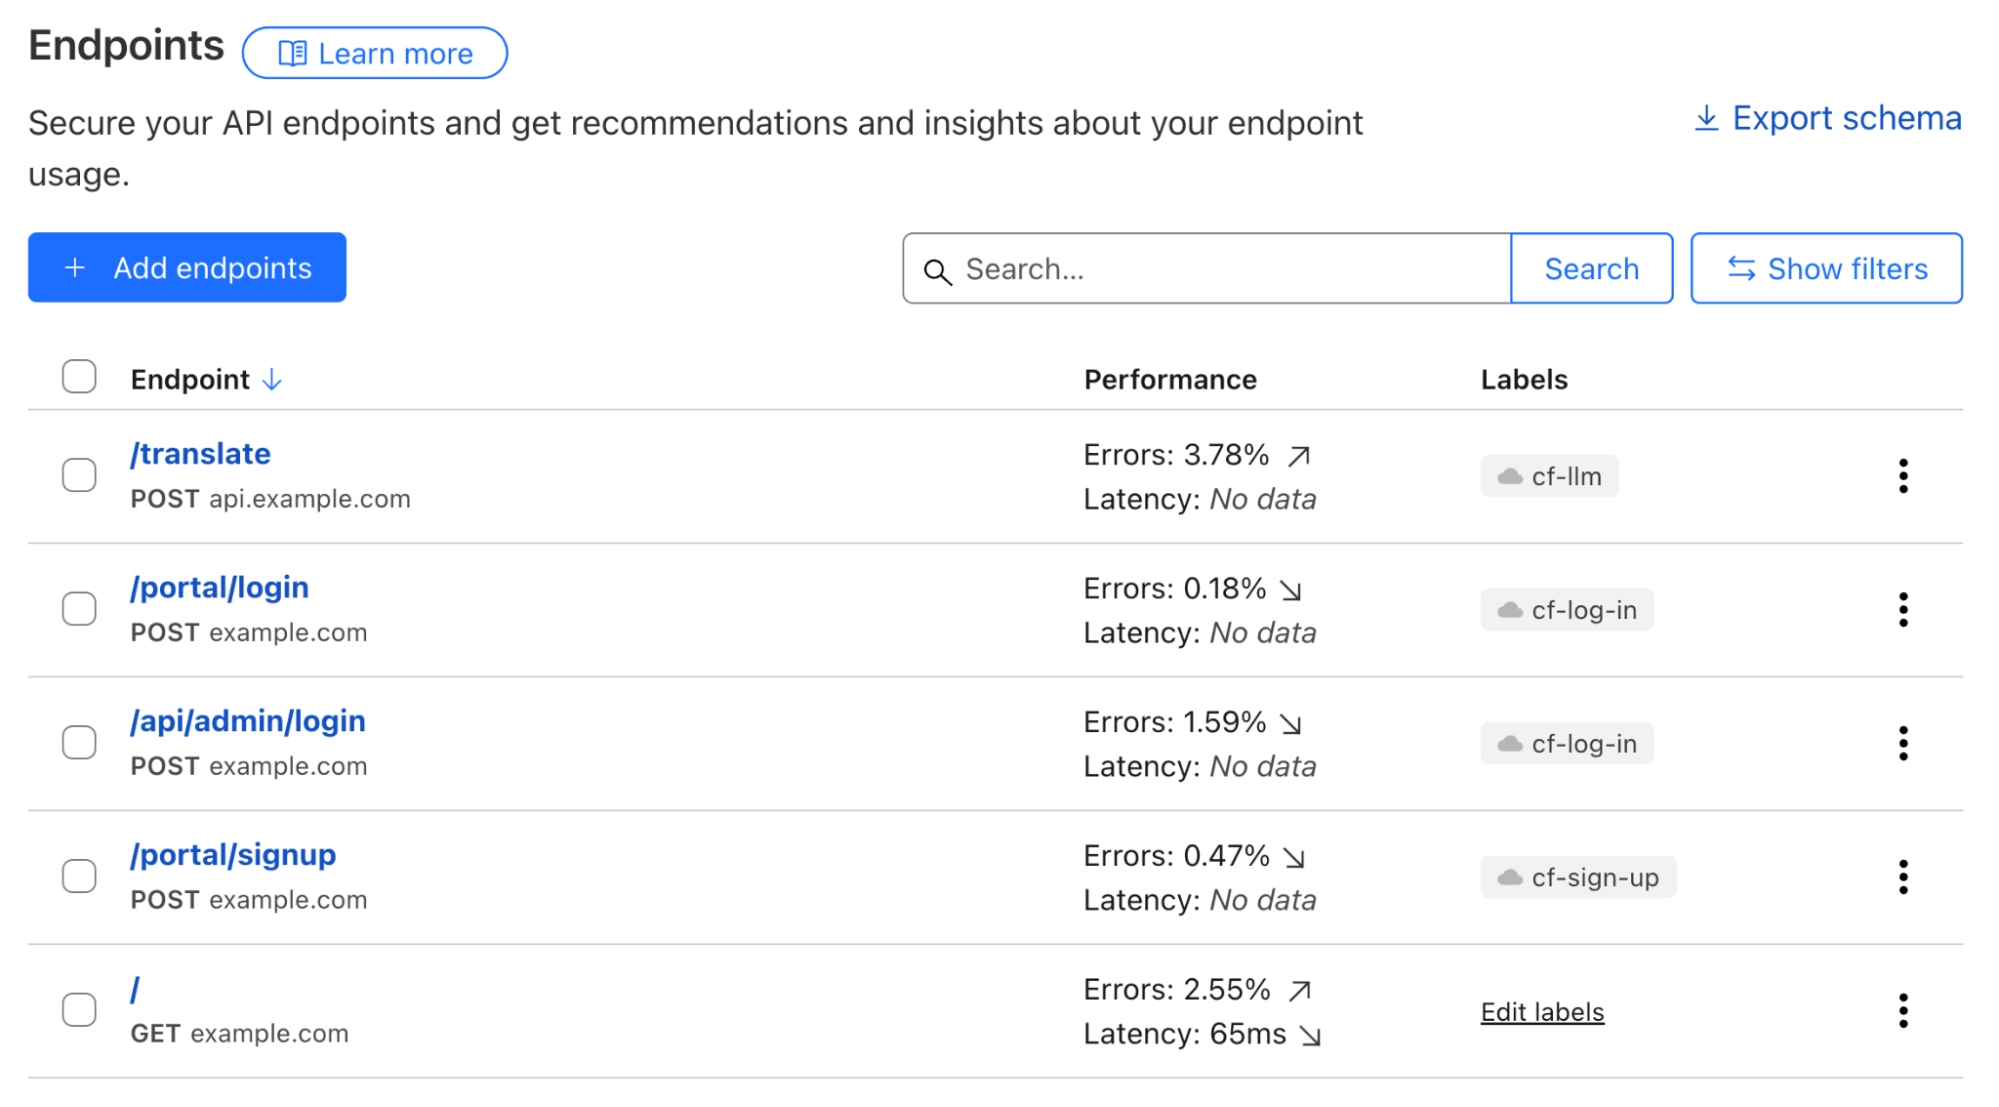
API Shield customers can already make use of endpoint labelling. In early Q2 2025, we are adding label discovery and suggestion capabilities, starting with three labels, cf-log-in, cf-sign-up, and cf-rss-feed. All other customers can manually add these labels to the saved endpoints. One example, explained below, is preventing disposable emails from being used during sign-ups.
Always-on threat detection and risk assessment
Use-case driven threat detection
Customers told us that, with the growing excitement around generative AI, they need support to secure this new technology while not hindering innovation. Being able to discover LLM-powered services allows fine-tuning security controls that are relevant for this particular technology, such as inspecting prompts, limit prompting rates based on token usage, etc. In a separate Security Week blog post, we will share how we build Cloudflare Firewall for AI, and how you can easily protect your generative AI workloads.
Account fraud detection, which encompasses multiple attack vectors, is another key area that we are focusing on in 2025.
On many login and signup pages, a CAPTCHA solution is commonly used to only allow human beings through, assuming only bots perform undesirable actions. Put aside that most visual CAPTCHA puzzles can be easily solved by AI nowadays, such an approach cannot effectively solve the root cause of most account fraud vectors. For example, human beings using disposable emails to sign up single-use accounts to take advantage of signup promotions.
To solve this fraudulent sign up issue, a security rule currently under development could be deployed as below to block all attempts that use disposable emails as a user identifier, regardless of whether the requester was automated or not. All existing or future cf-log-in and cf-sign-up labelled endpoints are protected by this single rule, as they both require user identification.
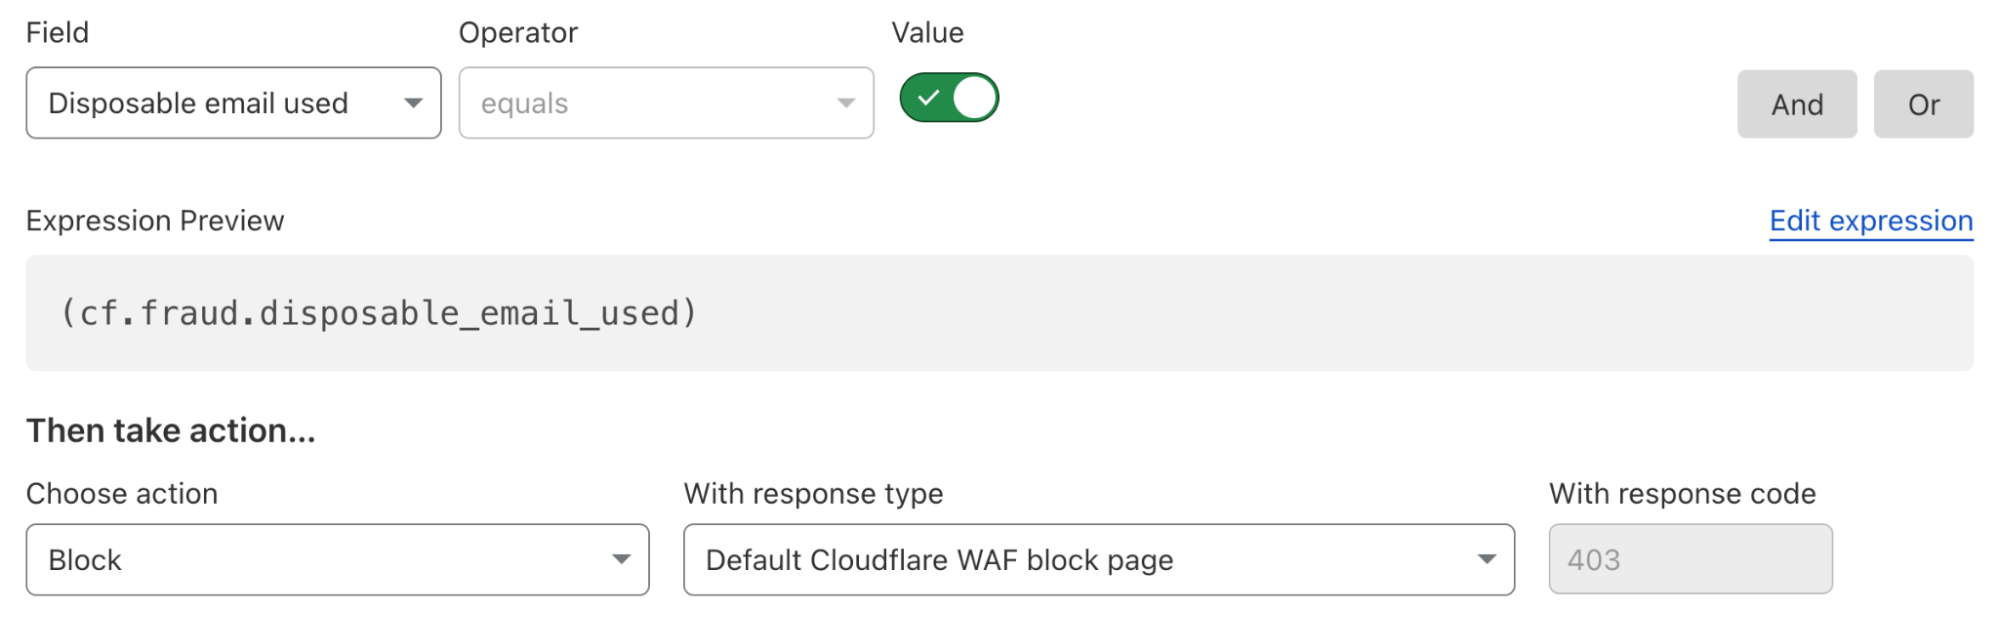
Our fast expanding use-case driven threat detections are all running by default, from the first moment you onboarded your traffic to Cloudflare. The instant available detection results can be reviewed through security analytics, helping you make swift informed decisions.
API endpoint risk assessment
APIs have their own set of risks and vulnerabilities, and today Cloudflare is delivering seven new risk scans through API Posture Management. This new capability of API Shield helps reduce risk by identifying security issues and fixing them early, before APIs are attacked. Because APIs are typically made up of many different backend services, security teams need to pinpoint which backend service is vulnerable so that development teams may remediate the identified issues.
Our new API posture management risk scans do exactly that: users can quickly identify which API endpoints are at risk to a number of vulnerabilities, including sensitive data exposure, authentication status, Broken Object Level Authorization (BOLA) attacks, and more.
Authentication Posture is one risk scan you’ll see in the new system. We focused on it to start with because sensitive data is at risk when API authentication is assumed to be enforced but is actually broken. Authentication Posture helps customers identify authentication misconfigurations for APIs and alerts of their presence. This is achieved by scanning for successful requests against the API and noting their authentication status. API Shield scans traffic daily and labels API endpoints that have missing and mixed authentication for further review.
For customers that have configured session IDs in API Shield, you can find the new risk scan labels and authentication details per endpoint in API Shield. Security teams can take this detail to their development teams to fix the broken authentication.
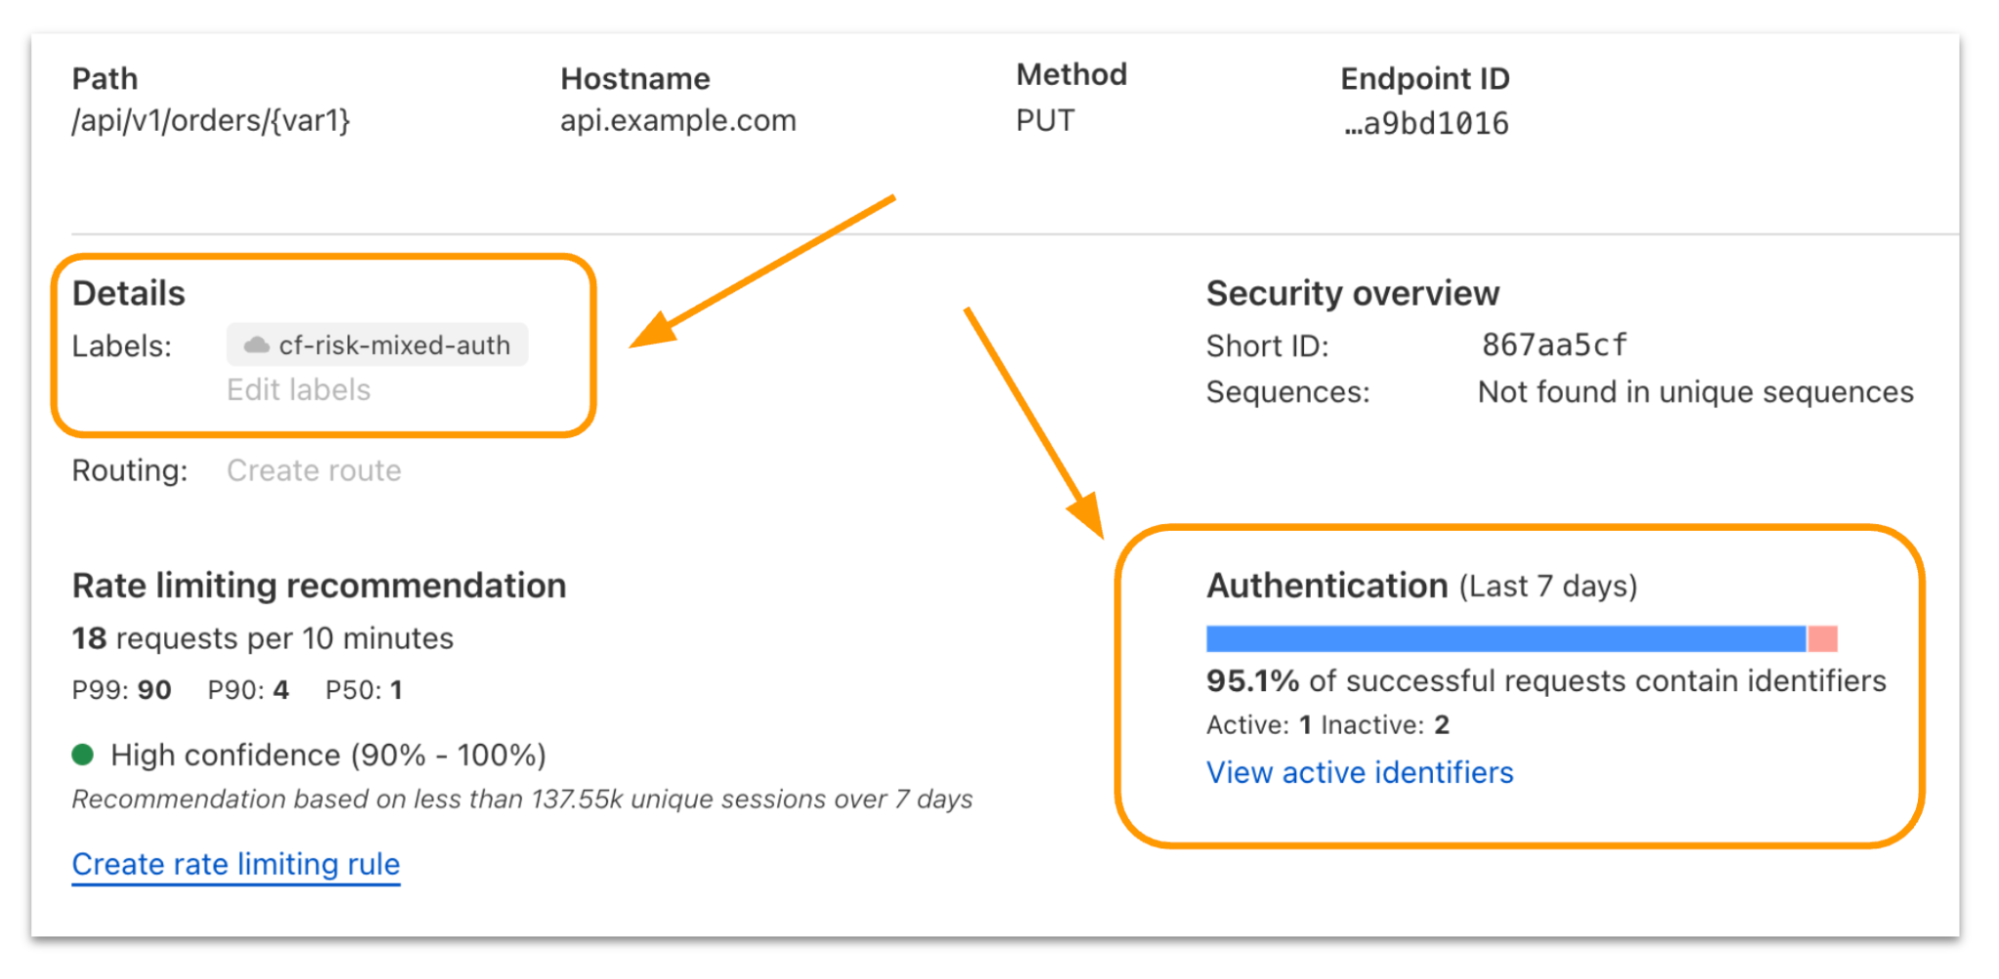
We’re launching today with scans for authentication posture, sensitive data, underprotected APIs, BOLA attacks, and anomaly scanning for API performance across errors, latency, and response size.
Achieving a good security posture in a fast-moving environment requires innovative solutions that can transform complexity into simplicity. Bringing together the ability to continuously assess threats and risks across both public and private IT environments through a single platform is our first step in supporting our customers’ efforts to maintain a healthy security posture.
To further enhance the relevance of security insights and suggestions provided and help you better prioritize your actions, we are looking into integrating Cloudflare’s global view of threat landscapes. With this, you gain additional perspectives, such as what the biggest threats to your industry are, and what attackers are targeting at the current moment. Stay tuned for more updates later this year.
If you haven’t done so yet, onboard your SaaS and web applications to Cloudflare today to gain instant insights into how to improve your business’s security posture.