How social learning can lead to better outcomes in your computing classroom

Post Syndicated from Sean Sayers original https://www.raspberrypi.org/blog/how-social-learning-can-lead-to-better-outcomes-in-your-computing-classroom/

Throughout our lives, we’re constantly learning from others. Whether we’re interacting with teachers or trainers, or observing friends or strangers, we’re learning either deliberately or inadvertently. This process is known as ‘social learning’. 

In today’s blog, you’ll dive into what social learning is and how you can use it to create more engaging and effective learning experiences in your computing classroom.

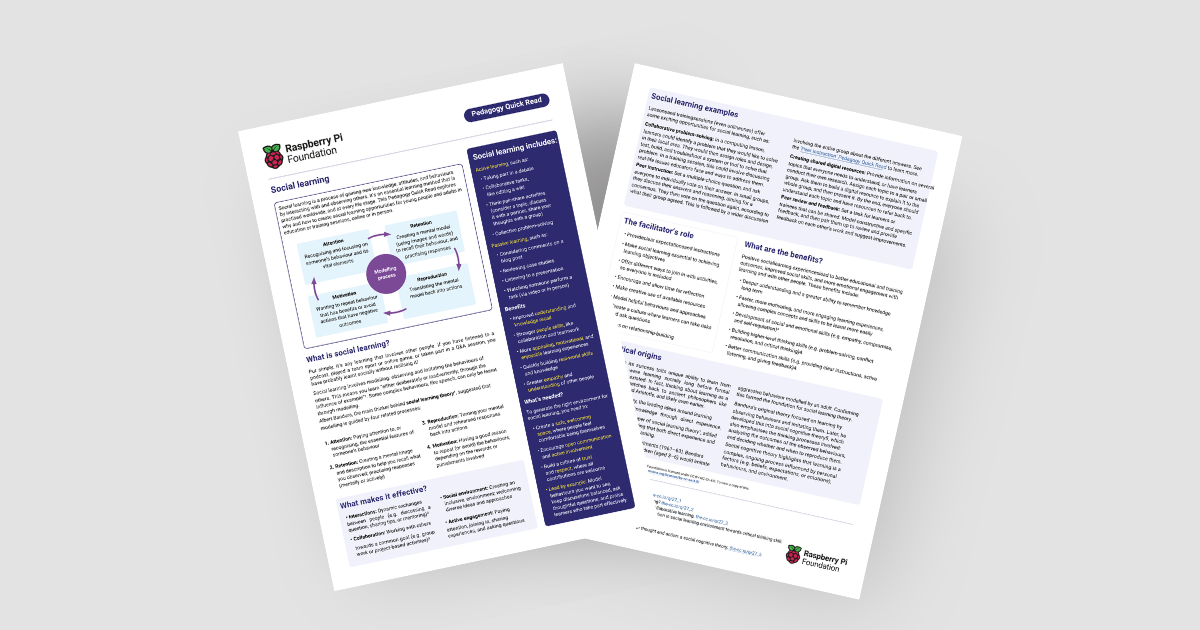
Image of our latest Pedagogy Quick Read

You’ll also find our latest Pedagogy Quick Read, which explores social learning. It’s free to download and includes: 

  • Practical tips for how to use social learning and related approaches with your learners
  • A summary of the research behind social learning

What is social learning?

Social learning is simply any learning that involves other people. It can take any form, from watching a video, to taking part in a classroom discussion. It can take place in person or online, and it can happen without people realising they’re learning something.

Social learning is based on modelling and involves people observing and imitating the behaviours that others model. Albert Bandura, the acknowledged originator of social learning theory, suggested that social learning is guided by four related processes:

  • Attention: Recognising and focusing on someone’s behaviour and its vital elements
  • Retention: Creating a mental image and description to help you recall what you observed; practising responses (mentally or actively)
  • Reproduction: Translating the mental image back into actions
  • Motivation: Having a good reason to repeat (or avoid) the behaviours, depending on the rewards or punishments involved

How can I enable social learning?

There’s lots of ways you can involve social learning in your computing classroom, including through other teaching approaches and frameworks. 

4 children social learning in the classroom

To help your learners get the most out of social learning, it’s best to:

  • Create a safe environment for learners to share learnings, ask questions, and actively engage in the learning process
  • Include a mix of resources and activities to ensure inclusion and accessibility
  • Set clear expectations and instructions, and ensure that social learning is key to achieve learning objectives

Applying social learning: Some teaching approaches

Among our pedagogy resources, you’ll find lots of practical advice for teaching approaches that promote social learning. The approaches we recommend for the pedagogy principles ‘Work together’ and ‘Model everything’ are especially suitable.

Work together:

Model everything:

Using a PRIMM (PDF) approach for structuring programming lessons, and encouraging students to talk about code as part of these, also works well for social learning.

Applying social learning: Practical examples

Let’s look at pair programming as an example. In this activity, pairs of learners work together to create a computer program, taking on distinct roles that they swap regularly. One learner acts as the ‘driver’, writing the code, while the other is the ‘navigator’, guiding the process, reviewing the code, and identifying potential issues. 

As they work, each learner is able to observe the other person’s approach, learning with and from their partner throughout the activity. This constant interaction and shared problem solving can help them to understand programming concepts better and to build stronger teamwork skills.

Children in the classroom social learning

Another example is setting your class the task to create shared digital resources on several topics everyone needs to learn about. In this activity, you split learners into small groups or pairs, and assign them a topic to later explain to the whole group. Grouped learners work together to create a resource explaining their topic. As the facilitator, you can either provide the information they need, or let them conduct their own research. At the end of the activity, each group presents their resource to the wider class.

An activity like this helps learners develop their knowledge through working together and talking to each other, and also provides the class with resources they can keep using.

The benefits of social learning

Potential benefits for teachers:

  • Improved student engagement and learning
  • Enhanced professional development experiences, leading to more confident teaching

Potential benefits for students:

  • Improved social skills
  • Opportunities to build higher-level thinking skills
  • Deeper understanding and a greater ability to remember knowledge in the long term

A social approach to shaping the future

In a world filled with complex challenges, there’s more need than ever for people to work together. By using social learning approaches in your classroom, you help your students to engage more deeply with your teaching and to develop the skills to succeed in collaboration with others. In this way, you’ll prepare them for navigating technological change as well as for shaping a common future where everyone can thrive.

The post How social learning can lead to better outcomes in your computing classroom appeared first on Raspberry Pi Foundation.

LLM Coding Integrity Breach

Post Syndicated from Bruce Schneier original https://www.schneier.com/blog/archives/2025/08/llm-coding-integrity-breach.html

Here’s an interesting story about a failure being introduced by LLM-written code. Specifically, the LLM was doing some code refactoring, and when it moved a chunk of code from one file to another it changed a “break” to a “continue.” That turned an error logging statement into an infinite loop, which crashed the system.

This is an integrity failure. Specifically, it’s a failure of processing integrity. And while we can think of particular patches that alleviate this exact failure, the larger problem is much harder to solve.

Davi Ottenheimer comments.

Zabbix at the Zhongnan University of Economics and Law

Post Syndicated from Michael Kammer original https://blog.zabbix.com/zabbix-at-the-zhongnan-university-of-economics-and-law/30949/

Zhongnan University of Economics and Law (ZUEL), located in Wuhan City, Hubei Province, China, is a key university with two campuses – Nanhu and Shouyi. The school boasts over 20,000 full-time undergraduate students, more than 8,800 graduate students, and over 2,500 faculty and staff members. ZUEL enjoys an outstanding reputation in the fields of law and economics, with four national key disciplines. Its law discipline, meanwhile, has been included in the list of national “Double First-Class” disciplines.

The challenge

As the information infrastructure at ZUEL continues to expand, the scale of the university’s IT infrastructure has rapidly grown to encompass power systems, dynamic environmental systems, servers, network devices, security appliances, storage systems, virtualization platforms, operating systems, databases, data lakes, and campus application systems.

At the same time, the daily academic and administrative activities of faculty and students increasingly demand higher levels of stability and reliability from information systems. To ensure the efficient operation of these systems, the Information Management department needed a monitoring and management system that could cover the entire university’s IT resources and address the growing complexities of operational maintenance.

The university found that traditional monitoring and management systems often fall short when faced with such large-scale and diverse monitoring demands, revealing problems like insufficient monitoring points, poor real-time capabilities, and limited scalability. To address these challenges, the university decided to adopt Zabbix 7.0 and develop a custom IP Radar platform to further meet its refined operational maintenance needs.

The solution

When combined with Zabbix 7.0, the IP Radar system can achieve comprehensive monitoring and management of the university’s entire IT infrastructure through the integrated application of multiple monitoring protocols and technologies. Specifically, the system collects data and performs monitoring with the help of the following core technologies:

  • Zabbix 7.0. As an enterprise-level open-source monitoring platform renowned for its robust data collection and analysis capabilities, Zabbix enhances the system’s high availability, supporting large-scale concurrent processing to make sure that the monitoring system remains stable and delivers uninterrupted service even under heavy loads.
  • Parallel monitoring with multiple protocols. The system collects data through a variety of protocols, including Agent, SNMP, IPMI, MODBUS, MQTT, and more, enabling the real-time monitoring of a wide variety of IT hardware.
  • High-availability design. To accommodate the monitoring demands of massive devices and thousands of users, the Zabbix 7.0 platform supports multi-node deployment and redundancy design, enabling load balancing and failover among proxy servers. Even in the event of a node failure, the system maintains uninterrupted monitoring services, and it’s also equipped with an automated fault alerting and repair mechanism.
  • The self-developed IP Radar platform. To meet a demanding set of operation and maintenance management needs, ZUEL has developed the IP Radar system based on the Zabbix 7.0 platform, further customizing its business monitoring capabilities. IP Radar not only conducts real-time monitoring of the IT infrastructure, but it also provides detailed performance analysis reports and trend predictions, while integrating behavior monitoring capabilities to enhance the school’s network security management.

The IP Radar platform itself contains a variety of unique and innovative features, including:

  • Comprehensive monitoring coverage. The IP Radar system monitors over a million items – everything from hardware devices to application systems, affecting everything from network performance to user experience. This extensive coverage gives the Information Management department to a comprehensive understanding of the operational status of the school’s IT resources while providing sufficient data support for troubleshooting and performance optimization.
  • Customized monitoring strategies. Compared to traditional monitoring systems, IP Radar offers highly customized monitoring strategies. ZUEL can tailor different business dashboards for networks, computing resources, user experience, data center environments, and more, based on its own needs and the permissions granted to operation and maintenance personnel. Depending on different monitoring thresholds and alerting strategies, the system can automatically generate alerts and notify relevant personnel through enterprise WeChat, SMS, and other channels.
  • Intelligent alerting and automated handling. The intelligent alerting system of the IP Radar platform leverages machine learning algorithms to analyze historical monitoring data, enabling it to predict potential fault risks and issue early warnings. At the same time, the system integrates automated operation and maintenance capabilities, which allow it to automatically execute predetermined repair operations when certain common faults occur, reducing the time and cost of manual intervention.
  • Network security monitoring. In terms of network security, the IP Radar system is capable of identifying abnormal traffic patterns and promptly detecting potential security threats through real-time analysis of the school’s entire network traffic. The system also supports the monitoring of online behavior to ensure that network access activities comply with the school’s security policies.

The results

After implementing the Zabbix-based system, ZUEL was able to measure a wide range of monitoring performance improvements, including:

  • Improved operational and maintenance efficiency. Through the IP Radar system, the school’s Information Management department has been able to monitor the operational status of over 28,000 hosts in real-time, significantly enhancing operational efficiency. The system’s automated fault handling capabilities reduce the complexity of manual operations, allowing operations and maintenance personnel to focus on addressing only the complex issues that the system is unable to resolve automatically. At the same time, the system’s intelligent alerting feature enables the early detection of potential problems, preventing sudden failures.
  • Enhancing system stability and reliability. The high availability design of Zabbix 7.0 ensures that the system remains stable even under heavy loads. Its redundant design and automatic failover mechanisms guarantee the reliability of the system, and the trend analysis functionality provided by IP Radar helps administrators to identify factors that may affect system stability in advance and making corresponding adjustments, enhancing the overall reliability of the IT system in the process.
  • Advancing detailed information management. The IP Radar platform lets schools manage multiple IT resources with greater precision. The system not only monitors the operational status of hardware devices, but it also analyzes the performance of business systems, helping administrators to optimize system configurations and enhancing user experiences. During project development, historical data from the monitoring platform serves as an essential basis for decision-making. In the acceptance phase, the monitoring platform provides evaluation reference data for operational efficiency and stability.

The IP Radar monitoring and management system developed by ZUEL and based on Zabbix 7.0 has become the largest, most widely used, and most effective (in terms of the volume of monitored data) in the Chinese education sector. The successful implementation of this system not only provides strong support for the school’s information management, but it also offers valuable references for information operation and maintenance at other universities.

In conclusion

Looking ahead, the IP Radar system is poised to expand its functionalities further by integrating more intelligent operation and maintenance management tools. Through the introduction of emerging technologies such as big data analysis and artificial intelligence, the system will achieve more breakthroughs in areas like automated operation and maintenance as well as intelligent fault prediction, providing even more comprehensive technical support for the university’s information management.

To learn more about what Zabbix can do for educational institutions, visit our website.


The post Zabbix at the Zhongnan University of Economics and Law appeared first on Zabbix Blog.

[$] LWN.net Weekly Edition for August 14, 2025

Post Syndicated from corbet original https://lwn.net/Articles/1032862/

Inside this week’s LWN.net Weekly Edition:

  • Front: Indico; Arch Linux wiki; StarDict; Python debugging; LLM assistants for kernel development; 6.17 Merge window; Signed BPF programs.
  • Briefs: CalyxOS; ACME on NGINX; Debian 13; LVFS sustainability; Go 1.25; Radicle 1.3.0; Rust 1.89; Syncthing 2.0; Quotes; …
  • Announcements: Newsletters, conferences, security updates, patches, and more.

End of Life Plan for RFC 6962 Certificate Transparency Logs

Post Syndicated from Let's Encrypt original https://letsencrypt.org/2025/08/14/rfc-6962-logs-eol.html

Let’s Encrypt operates two types of Certificate Transparency (“CT”) logs—some implement the original RFC 6962 API, and some that implement the newer Static CT API. Today we are announcing that on November 3, 2025, we will make our RFC 6962 logs read-only. Past that date, we will write only to our Static CT logs. On February 9, 2026, we will entirely shut down our RFC 6962 logs.

End users (consumers or relying parties) of Web PKI certificates do not need to take any action. The work that needs to be done to make this transition will be handled by Let’s Encrypt and the browsers.

RFC 6962 is from June of 2013 and describes the original version of CT. It was a revolutionary upgrade for transparency in the Web PKI, ultimately allowing anyone to monitor issuance from all certificate authorities. Over time, though, growth in certificate issuance volume has revealed that the original CT design doesn’t scale well enough. Let’s Encrypt currently issues more publicly trusted certificates in a single day than existed in total during 2013.

What are the issues with RFC 6962 logs?

Cost

The first issue with RFC 6962 logs is the high cost of running them, particularly at Web scale, which has significantly limited the number of entities willing to operate them. Annual cloud costs for our logs are approaching seven figures.

The biggest contributor to this is that the data is stored in a relational database. We’ve scaled that up by splitting each year’s worth of data into a “shard” with its own database, and then later shrinking the shards to cover six months instead of a full year.

The approach of splitting into more and more databases is not something we want to continue doing forever, as the operational burden and costs increase. The current storage size of a CT log shard is between 7 and 10 terabytes. That’s big enough to be concerning for a single database: we previously had a test log fail when we ran into a 16 TiB limit in MySQL.

Scaling read capacity up requires large database instances with fast disks and lots of RAM, which are not cheap. We’ve had numerous instances of CT logs becoming overloaded by clients attempting to read all the data in the log, overloading the database in the process. When rate limits are imposed to prevent overloading, clients are forced to slowly crawl the API, diminishing CT’s efficiency as a fast mechanism for detecting mis-issued certificates. Ideally, clients should be able to obtain copies of the whole log in a relatively short time, but the traditional API has made that impractical.

Availability

The second issue with RFC 6962 logs is the potential for problems and non-compliance when the period called a Maximum Merge Delay (“MMD”) is exceeded.

One of the goals of CT was to have limited latency for submission to the logs. The Merge Delay design feature was added to guarantee that property. When receiving a new certificate submission, a CT log can return a Signed Certificate Timestamp (SCT) immediately, with a promise to include it in the log within the log’s MMD, conventionally 24 hours. While this seems like a good tradeoff to avoid the alternative of slowing down certificate issuance, there have been multiple incidents in which important logs have exceeded their maximum merge delay, breaking that promise.

If the log does not integrate the certificate within the MMD window, the log is out of compliance and can be distrusted. If a log is distrusted, it’s disruptive for the operators and those who depend on it, and there are fewer logs for the ecosystem to rely on.

How does the new type of log resolve these issues?

In 2023 Filippo Valsorda suggested a new API for CT logs that avoids both of these issues—the Static CT API. The Static CT API for submitting certificates to logs is the same as RFC 6962, but the API for retrieving certificate information is quite different and the MMD is eliminated. The result is logs that are much more cost effective to operate and have better availability. We previously discussed our experiences testing out the new design in “Reflections on a Year of Sunlight.”

Serving Tiles

Certificate Transparency logs are a binary tree, with every node containing a hash of its two children. The “leaf” level contains the actual entries of the log: the certificates, appended to the right side of the tree. The top of the tree is digitally signed. This forms a cryptographically verifiable structure called a Merkle Tree, which can be used to check if a certificate is in the tree, and that the tree is append-only.

Static CT tiles are files containing 256 elements each, either hashes at a certain tree “height” or certificates (or pre-certificates) at the leaf level. Russ Cox has a great explanation of how tiles work on his blog, or you can read the relevant section of the Static CT specification.

Unlike the dynamic endpoints in the RFC 6962 API, serving a tree as tiles doesn’t require any dynamic computation or request processing, so we can eliminate the need for API servers. Because the tiles are static, they’re efficiently cached, in contrast with CT APIs like get-proof-by-hash, which have a different response for every certificate, so there’s no shared cache. The leaf tiles can also be stored compressed, saving even more storage!

The idea of exposing the log as a series of static tiles is motivated by our desire to scale out the read path horizontally and relatively inexpensively. We can directly expose tiles in cloud object storage like S3, use a caching CDN, or use a webserver and a filesystem.

Object or file storage is readily available, can scale up easily, and costs significantly less than databases from cloud providers. It seemed like the obvious path forward. In fact, we already have an S3-backed cache in front of our existing CT logs, which means we are currently storing our data twice.

No More Merge Delay

Static CT takes a different approach to adding certificates to the log while maintaining the same external submission API as RFC 6962. Static CT logs hold submissions while it batches and integrates certificates in the log, eliminating the merge delay. While this leads to a small latency increase, we think it’s worthwhile to avoid one of the more common CT log failure cases.

It also lets us embed the final leaf index in an extension of our SCTs, bringing CT a step closer to direct client verification of Merkle tree proofs. The extension also makes it possible for clients to fetch the proof of log inclusion from the new static tile-based APIs, without requiring server-side lookup tables or databases.

Going Forward

Let’s Encrypt has submitted new Static CT API logs for inclusion in certificate transparency programs. We expect these logs to be included and trusted prior to the read-only date for our RFC 6962 logs, and we will begin submitting our certificates to them as soon as possible.

We may stop submitting our own certificates to our RFC 6962 logs prior to the read-only date, but other CAs will be able to write certificates to our RFC 6962 logs until the read-only date.

Conclusion

The Static CT API has proven to be operationally better and more scalable than the RFC 6962 design in almost every way. With the substantial increase in certificate volume over time, we need that improved efficiency to make running CT logs cost-effective. As a result, we’re switching fully to the new log architecture in order to make the best use of our resources. The Static CT API logs we operate will provide exactly the same security and transparency benefits as our old RFC 6962 log did.

As we explained above, this requires no changes at all for end users. It may require configuration changes on the part of certificate authorities that have been submitting certs to our old log (they can start submitting to one or both of our new logs instead). It also requires software updates for ecosystem participants who monitor logs; they’ll need to ensure that they have client software that’s compatible with the new API. Overall, this change should help ensure that our CT logging continues to be able to grow with the Web PKI.

Build data pipelines with dbt in Amazon Redshift using Amazon MWAA and Cosmos

Post Syndicated from Cindy Li original https://aws.amazon.com/blogs/big-data/build-data-pipelines-with-dbt-in-amazon-redshift-using-amazon-mwaa-and-cosmos/

Effective collaboration and scalability are essential for building efficient data pipelines. However, data modeling teams often face challenges with complex extract, transform, and load (ETL) tools, requiring programming expertise and a deep understanding of infrastructure. This complexity can lead to operational inefficiencies and challenges in maintaining data quality at scale.

dbt addresses these challenges by providing a simpler approach where data teams can build robust data models using SQL, a language they’re already familiar with. When integrated with modern development practices, dbt projects can use version control for collaboration, incorporate testing for data quality, and utilize reusable components through macros. dbt also automatically manages dependencies, making sure data transformations execute in the correct sequence.

In this post, we explore a streamlined, configuration-driven approach to orchestrate dbt Core jobs using Amazon Managed Workflows for Apache Airflow (Amazon MWAA) and Cosmos, an open source package. These jobs run transformations on Amazon Redshift, a fully managed data warehouse that enables fast, scalable analytics using standard SQL. With this setup, teams can collaborate effectively while maintaining data quality, operational efficiency, and observability. Key steps covered include:

  • Creating a sample dbt project
  • Enabling auditing within the dbt project to capture runtime metrics for each model
  • Creating a GitHub Actions workflow to automate deployments
  • Setting up Amazon Simple Notification Service (Amazon SNS) to proactively alert on failures

These enhancements enable model-level auditing, automated deployments, and real-time failure alerts. By the end of this post, you will have a practical and scalable framework for running dbt Core jobs with Cosmos on Amazon MWAA, so your team can ship reliable data workflows faster.

Solution overview

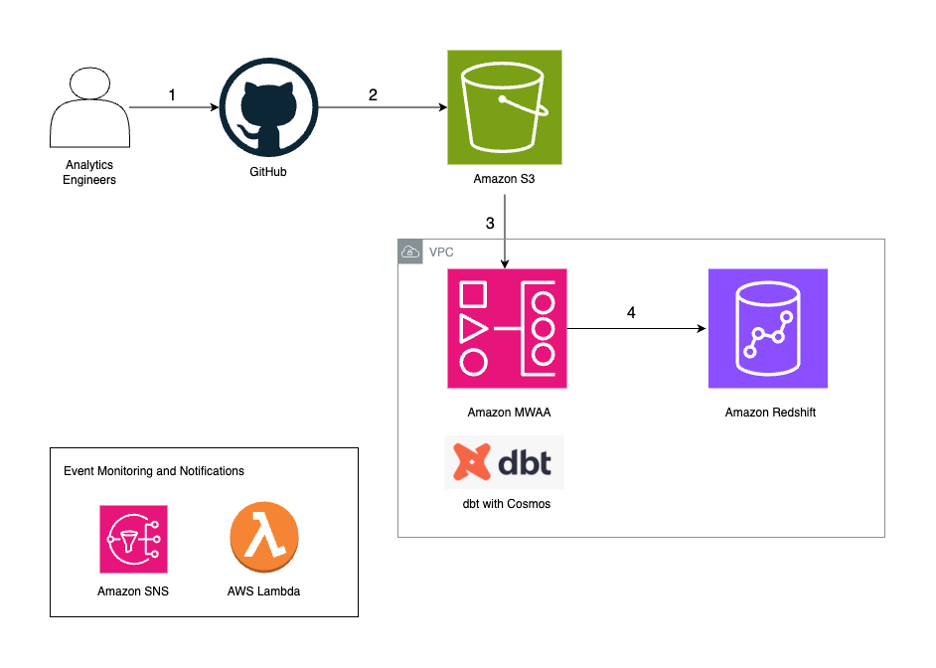
The following diagram illustrates the solution architecture.

The workflow contains the following steps:

  1. Analytics engineers manage their dbt project in their version control tool. In this post, we use GitHub as an example.
  2. We configure an Apache Airflow Directed Acyclic Graph (DAG) to use the Cosmos library to create an Airflow task group that contains all the dbt models as part of the dbt project.
  3. We use a GitHub Actions workflow to sync the dbt project files and the DAG to an Amazon Simple Storage Service (Amazon S3) bucket.
  4. During the DAG run, dbt converts the models, tests, and macros to Amazon Redshift SQL statements, which run directly on the Redshift cluster.
  5. If a task in the DAG fails, the DAG invokes an AWS Lambda function to send out a notification using Amazon SNS.

Prerequisites

You must have the following prerequisites:

Create a dbt project

A dbt project is structured to facilitate modular, scalable, and maintainable data transformations. The following code is a sample dbt project structure that this post will follow:

MY_SAMPLE_DBT_PROJECT
├── .github
│   └── workflows
│       └── publish_assets.yml
└── src
    ├── dags
    │   └── dbt_sample_dag.py
    └── my_sample_dbt_project
        ├── macros
        ├── models
        └── dbt_project.yml

dbt uses the following YAML files:

  • dbt_project.yml –  Serves as the main configuration for your project. Objects in this project will inherit settings defined here unless overridden at the model level. For example:
# Name your project! Project names should contain only lowercase characters
# and underscores. 
name: 'my_sample_dbt_project'
version: '1.0.0'

# These configurations specify where dbt should look for different types of files.
# The `model-paths` config, for example, states that models in this project can be
# found in the "models/" directory. 
model-paths: ["models"]
macro-paths: ["macros"]

# Configuring models
# Full documentation: https://docs.getdbt.com/docs/configuring-models
# In this example config, we tell dbt to build models in the example/
# directory as views. These settings can be overridden in the individual model
# files using the `{{ config(...) }}` macro.
models:
  my_sample_dbt_project:
    # Config indicated by + and applies to files under models/example/
    example:
      +materialized: view
      
on-run-end:
# add run results to audit table 
  - "{{ log_audit_table(results) }}" 
  • sources.yml – Defines the external data sources that your dbt models will reference. For example:
sources:
  - name: sample_source
    database: sample_database
    schema: sample_schema
    tables:
      - name: sample_table
  • schema.yml – Outlines the schema of your models and data quality tests. In the following example, we have defined two columns, full_name for the model model1 and sales_id for model2. We have declared them as the primary key and defined data quality tests to check if the two columns are unique and not null.
version: 2

models:
  - name: model1
    config: 
      contract: {enforced: true}

    columns:
      - name: full_name
        data_type: varchar(100)
        constraints:
          - type: primary_key
        tests:
          - unique
          - not_null

  - name: model2
    config: 
      contract: {enforced: true}

    columns:
      - name: sales_id
        data_type: varchar(100)
        constraints:
          - type: primary_key
        tests:
          - unique
          - not_null

Enable auditing within dbt project

Enabling auditing within your dbt project is crucial for facilitating transparency, traceability, and operational oversight across your data pipeline. You can capture run metrics at the model level for each execution in an audit table. By capturing detailed run metrics such as load identifier, runtime, and number of rows affected, teams can systematically monitor the health and performance of each load, quickly identify issues, and trace changes back to specific runs.

The audit table consists of the following attributes:

  • load_id – An identifier for each model run executed as part of the load
  • database_name – The name of the database within which data is being loaded
  • schema_name – The name of the schema within which data is being loaded
  • name – The name of the object within which data is being loaded
  • resource_type – The type of object to which data is being loaded
  • execution_time – The time duration taken for each dbt model to complete execution as part of each load
  • rows_affected – The number of rows affected in the dbt model as part of the load

Complete the following steps to enable auditing within your dbt project:

  1. Navigate to the models directory (src/my_sample_dbt_project/models) and create the audit_table.sql model file:
{%- set run_date = "CURRENT_DATE" -%}
{{
    config(
        materialized='incremental',
        incremental_strategy='append',
        tags=["audit"]
    )
}}

with empty_table as (
    select
        'test_load_id'::varchar(200) as load_id,
        'test_invocation_id'::varchar(200) as invocation_id,
        'test_database_name'::varchar(200) as database_name,
        'test_schema_name'::varchar(200) as schema_name,
        'test_model_name'::varchar(200) as name,
        'test_resource_type'::varchar(200) as resource_type,
        'test_status'::varchar(200) as status,
        cast('12122012' as float) as execution_time,
        cast('100' as int) as rows_affected,
        {{run_date}} as model_execution_date
)

select * from empty_table
-- This is a filter so we will never actually insert these values
where 1 = 0
  1. Navigate to the macros directory (src/my_sample_dbt_project/macros) and create the parse_dbt_results.sql macro file:
{% macro parse_dbt_results(results) %}
    -- Create a list of parsed results
    {%- set parsed_results = [] %}
    -- Flatten results and add to list
    {% for run_result in results %}
        -- Convert the run result object to a simple dictionary
        {% set run_result_dict = run_result.to_dict() %}
        -- Get the underlying dbt graph node that was executed
        {% set node = run_result_dict.get('node') %}
        {% set rows_affected = run_result_dict.get(
        'adapter_response', {}).get('rows_affected', 0) %}
        {%- if not rows_affected -%}
            {% set rows_affected = 0 %}
        {%- endif -%}
        {% set parsed_result_dict = {
                'load_id': invocation_id ~ '.' ~ node.get('unique_id'),
                'invocation_id': invocation_id,
                'database_name': node.get('database'),
                'schema_name': node.get('schema'),
                'name': node.get('name'),
                'resource_type': node.get('resource_type'),
                'status': run_result_dict.get('status'),
                'execution_time': run_result_dict.get('execution_time'),
                'rows_affected': rows_affected
                }%}
        {% do parsed_results.append(parsed_result_dict) %}
    {% endfor %}
    {{ return(parsed_results) }}
{% endmacro %}
  1. Navigate to the macros directory (src/my_sample_dbt_project/macros) and create the log_audit_table.sql macro file:
{% macro log_audit_table(results) %}
    -- depends_on: {{ ref('audit_table') }}
    {%- if execute -%}
        {{ print("Running log_audit_table Macro") }}
        {%- set run_date = "CURRENT_DATE" -%}
        {%- set parsed_results = parse_dbt_results(results) -%}
        {%- if parsed_results | length  > 0 -%}
            {% set allowed_columns = ['load_id', 'invocation_id', 'database_name', 
            'schema_name', 'name', 'resource_type', 'status', 'execution_time', 
            'rows_affected', 'model_execution_date'] -%}
            {% set insert_dbt_results_query -%}
                insert into {{ ref('audit_table') }}
                    (
                        load_id,
                        invocation_id,
                        database_name,
                        schema_name,
                        name,
                        resource_type,
                        status,
                        execution_time,
                        rows_affected,
                        model_execution_date
                ) values
                    {%- for parsed_result_dict in parsed_results -%}
                        (
                            {%- for column, value in parsed_result_dict.items() %}
                                {% if column not in allowed_columns %}
                                    {{ exceptions.raise_compiler_error("Invalid
                                     column") }}
                                {% endif %}
                                {% set sanitized_value = value | replace("'", "''") %}
                                '{{ sanitized_value }}'
                                {%- if not loop.last %}, {% endif %}
                            {%- endfor -%}
                        )
                        {%- if not loop.last %}, {% endif %}
                    {%- endfor -%}
            {%- endset -%}
            {%- do run_query(insert_dbt_results_query) -%}
        {%- endif -%}
    {%- endif -%}
    {{ return ('') }}
{% endmacro %}
  1. Append the following lines to the dbt_project.yml file:
on-run-end:
  - "{{ log_audit_table(results) }}" 

Create a GitHub Actions workflow

This step is optional. If you prefer, you can skip it and instead upload your files directly to your S3 bucket.

The following GitHub Actions workflow automates the deployment of dbt project files and DAG file to Amazon S3. Replace the placeholders {s3_bucket_name}, {account_id}, {role_name}, and {region} with your S3 bucket name, account ID, IAM role name, and AWS Region in the workflow file.

To enhance security, it’s recommended to use OpenID Connect (OIDC) for authentication with IAM roles in GitHub Actions instead of relying on long-lived access keys.

name: Sync dbt Project with S3

on:
  workflow_dispatch:
  push:
    branches: [ main ]
    paths:
      - "src/**"

permissions:
  id-token: write   # This is required for requesting the JWT
  contents: read    # This is required for actions/checkout
  pull-requests: write

jobs:
  sync-dev:
    runs-on: ubuntu-latest
    environment: dev
    defaults:
      run:
        shell: bash
    steps:
      - uses: actions/checkout@v4
      - name: Assume AWS IAM Role
        uses: aws-actions/[email protected]
        with:
          aws-region: {region}
          role-to-assume: arn:aws:iam::{account_id}:role/{role_name}
          role-session-name: my_sample_dbt_project_${{ github.run_id }}
          role-duration-seconds: 3600 # 1 hour

      - run: aws sts get-caller-identity

      - name: Sync dbt Model files
        id: dbt_project_files
        working-directory: src/my_sample_dbt_project
        run: aws s3 sync . s3://{s3_bucket_name}/dags/dbt/my_sample_dbt_project 
        --delete
        continue-on-error: false

      - name: Sync DAG files
        id: dag_file
        working-directory: src/dags
        run: aws s3 sync . s3://{s3_bucket_name}/dags

GitHub has the following security requirements:

  • Branch protection rules – Before proceeding with the GitHub Actions workflow, make sure branch protection rules are in place. These rules enforce required status checks before merging code into protected branches (such as main).
  • Code review guidelines – Implement code review processes to make sure changes undergo review. This can include requiring at least one approving review before code is merged into the protected branch.
  • Incorporate security scanning tools – This can help detect vulnerabilities in your repository.

Make sure you are also adhering to dbt-specific security best practices:

  • Pay attention to dbt macros with variables and validate their inputs.
  • When adding new packages to your dbt project, evaluate their security, compatibility, and maintenance status to make sure they don’t introduce vulnerabilities or conflicts into your project.
  • Review dynamically generated SQL to safeguard against issues like SQL injection.

Update the Amazon MWAA instance

Complete the following steps to update the Amazon MWAA instance:

  1. Install the Cosmos library on Amazon MWAA by adding astronomer-cosmos in the requirements.txt file. Make sure to check for version compatibility for Amazon MWAA and the Cosmos library.
  2. Add the following entries in your startup.sh script:
    1. In the following code, DBT_VENV_PATH specifies the location where the Python virtual environment for dbt will be created. DBT_PROJECT_PATH points to the location of your dbt project inside Amazon MWAA.
      #!/bin/sh
      export DBT_VENV_PATH="${AIRFLOW_HOME}/dbt_venv"
      export DBT_PROJECT_PATH="${AIRFLOW_HOME}/dags/dbt"

    2. The following code creates a Python virtual environment at the path ${DBT_VENV_PATH} and installs the dbt-redshift adapter to run dbt transformations on Amazon Redshift:
      python3 -m venv "${DBT_VENV_PATH}"
      ${DBT_VENV_PATH}/bin/pip install dbt-redshift

Create a dbt user in Amazon Redshift and store credentials

To create dbt models in Amazon Redshift, you must set up a native Redshift user with the necessary permissions to access source tables and create new tables. It is essential to create separate database users with minimal permissions to follow the principle of least privilege. The dbt user should not be granted admin privileges, instead, it should only have access to the specific schemas required for its tasks.

Complete the following steps:

  1. Open the Amazon Redshift console and connect as an admin (for more details, refer to Connecting to an Amazon Redshift database).
  2. Run the following command in the query editor v2 to create a native user, and note down the values for dbt_user_name and password_value:
    create user {dbt_user_name} password 'sha256|{password_value}';

  3. Run the following commands in the query editor v2 to grant permissions to the native user:
    1. Connect to the database where you want to source tables from and run the following commands:
      grant usage on schema {schema_name} to {dbt_user_name};
      grant select on all tables in schema {schema_name} to {dbt_user_name};

    2. To allow the user to create tables within a schema, run the following command:
      grant create on schema {schema_name} to {dbt_user_name};

  4. Optionally, create a secret in AWS Secrets Manager and store the values for dbt_user_name and password_value from the previous step as plaintext:
{
    "username":"dbt_user_name",
    "password":"password_value"
}

Creating a Secrets Manager entry is optional, but recommended for securely storing your credentials instead of hardcoding them. To learn more, refer to AWS Secrets Manager best practices.

Create a Redshift connection in Amazon MWAA

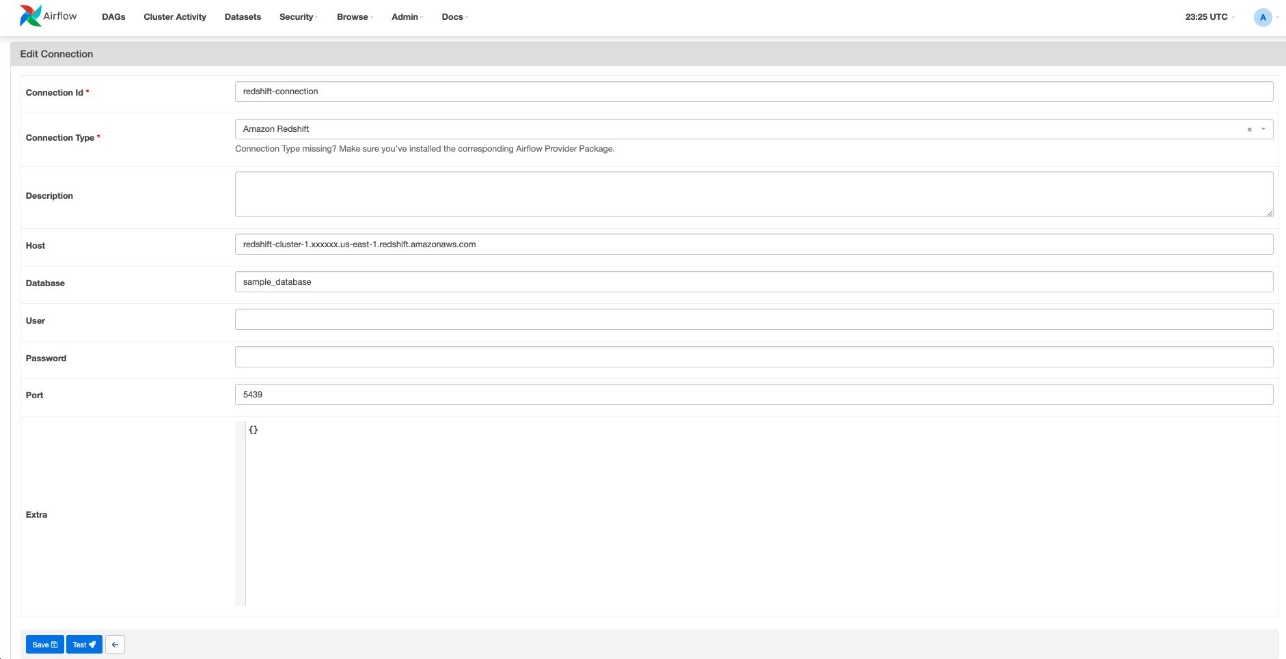
We create one Redshift connection in Amazon MWAA for each Redshift database, making sure that each data pipeline (DAG) can only access one database. This approach provides distinct access controls for each pipeline, helping prevent unauthorized access to data. Complete the following steps:

  1. Log in to the Amazon MWAA UI.
  2. On the Admin menu, choose Connections.
  3. Choose Add a new record.
  4. For Connection Id, enter a name for this connection.
  5. For Connection Type, choose Amazon Redshift.
  6. For Host, enter the endpoint of the Redshift cluster without the port and database name (for example, redshift-cluster-1.xxxxxx.us-east-1.redshift.amazonaws.com).
  7. For Database, enter the database of the Redshift cluster.
  8. For Port, enter the port of the Redshift cluster.

Set up an SNS notification

Setting up SNS notifications is optional, but they can be a useful enhancement to receive alerts on failures. Complete the following steps:

  1. Create an SNS topic.
  2. Create a subscription to the SNS topic.
  3. Create a Lambda function with the Python runtime.
  4. Modify the function code in your Lambda function, and replace {topic_arn} with your SNS topic Amazon Resource Name (ARN):
import json

sns_client = boto3.client('sns')

def lambda_handler(event, context):
     try:
        # Extract DAG name from event
        failed_dag = event['dag_name']
        
        # Send notification 
        sns_client.publish(
            TopicArn={topic_arn}, 
            Subject="Data modelling dags - WARNING", 
            Message=json.dumps({'default': json.dumps(f"Data modelling DAG - 
            {failed_dag} has failed, please inform the data modelling team")}),
            MessageStructure='json'
        )
        
    except KeyError as e:
        # Handle missing 'dag_name' in the event
        logger.error(f"KeyError: invalid payload - dag_name not present")

Configure a DAG

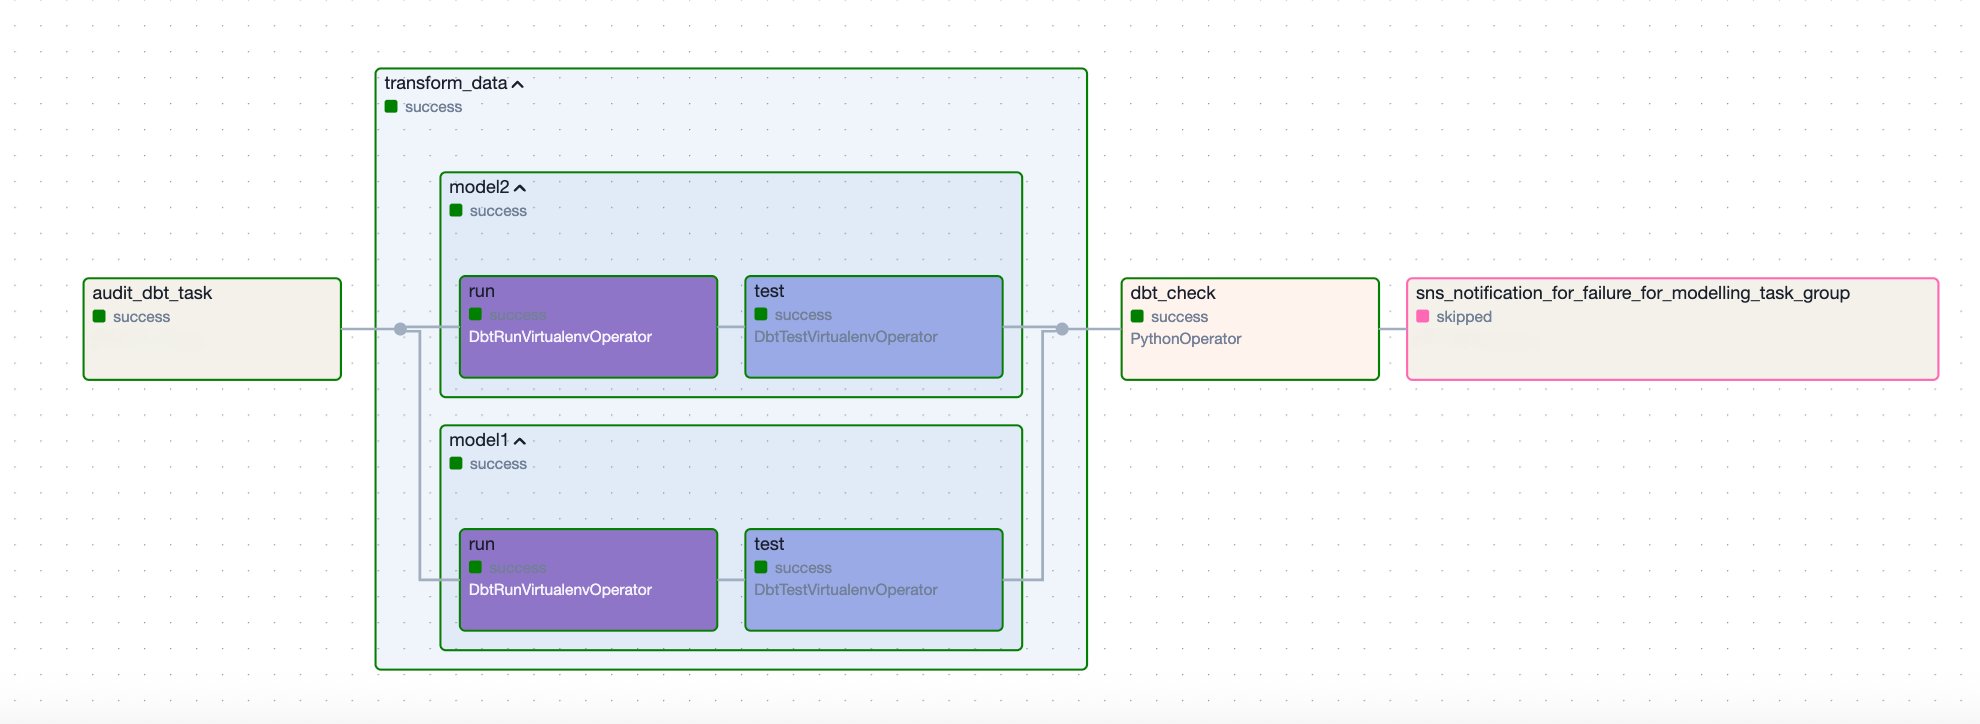
The following sample DAG orchestrates a dbt workflow for processing and auditing data models in Amazon Redshift. It retrieves credentials from Secrets Manager, runs dbt tasks in a virtual environment, and sends an SNS notification if a failure occurs. The workflow consists of the following steps:

  1. It starts with the audit_dbt_task task group, which creates the audit model.
  2. The transform_data task group executes the other dbt models, excluding the audit-tagged one. Inside the transform_data group, there are two dbt models, model1 and model2, and each is followed by a corresponding test task that runs data quality tests defined in the schema.yml file.
  3. To properly detect and handle failures, the DAG includes a dbt_check Python task that runs a custom function, check_dbt_failures. This is important because when using DbtTaskGroup, individual model-level failures inside the group don’t automatically propagate to the task group level. As a result, downstream tasks (such as the Lambda operator sns_notification_for_failure) configured with trigger_rule='one_failed' will not be triggered unless a failure is explicitly raised.

The check_dbt_failures function addresses this by inspecting the results of each dbt model and test, and raising an AirflowException if a failure is found. When an AirflowException is raised, the sns_notification_for_failure task is triggered.

  1. If a failure occurs, the sns_notification_for_failure task invokes a Lambda function to send an SNS notification. If no failures are detected, this task is skipped.

The following diagram illustrates this workflow.

Configure DAG variables

To customize this DAG for your environment, configure the following variables:

  • project_name – Make sure the project_name matches the S3 prefix of your dbt project
  • secret_name – Provide the name of the secret that stores dbt user credentials
  • target_database and target_schema – Update these variables to reflect where you want to land your dbt models in Amazon Redshift
  • redshift_connection_id – Set this to match the connection configured in Amazon MWAA for this Redshift database
  • sns_lambda_function_name – Provide the Lambda function name to send SNS notifications
  • dag_name – Provide the DAG name that will be passed to the SNS notification Lambda function
import os
import json
import boto3
from airflow import DAG
from cosmos import (
    DbtTaskGroup, ProfileConfig, ProjectConfig,
    ExecutionConfig, RenderConfig
)
from cosmos.constants import ExecutionMode, LoadMode
from cosmos.profiles import RedshiftUserPasswordProfileMapping
from pendulum import datetime
from airflow.operators.python_operator import PythonOperator
from airflow.providers.amazon.aws.operators.lambda_function import (
    LambdaInvokeFunctionOperator
)
from airflow.exceptions import AirflowException

# project name - should match the s3 prefix of your dbt project
project_name = "my_sample_dbt_project"
# name of the secret that stores dbt user credentials 
secret_name = "dbt_user_credentials_secret"
# target database to land dbt models
target_database = "sample_database"
# target schema to land dbt models
target_schema = "sample_schema"
# Redshift connection name from MWAA
redshift_connection_id = "my_sample_dbt_project_connection"
# sns lambda function name
sns_lambda_function_name = "sns_notification"
# dag name - this will be passed to SNS for notification
payload = json.dumps({
            "dag_name": "my_sample_dbt_project_dag"
        })

Incorporate DAG components

After setting the variables, you can now incorporate the following components to complete the DAG.

Secrets Manager

The DAG retrieves dbt user credentials from Secrets Manager:

sm_client = boto3.client('secretsmanager')

def get_secret(secret_name):
    try:
        get_secret_value_response = sm_client.get_secret_value(SecretId=secret_name)
        return json.loads(get_secret_value_response["SecretString"])
    except Exception as e:
        raise

secret_value = get_secret(secret_name)
username = secret_value["username"]
password = secret_value["password"]

Redshift connection configuration

It uses RedshiftUserPasswordProfileMapping to authenticate:

profile_config = ProfileConfig(
    profile_name="redshift",
    target_name=target_database,
    profile_mapping=RedshiftUserPasswordProfileMapping(
        conn_id=redshift_connection_id,
        profile_args={"schema": target_schema,
                      "user": username, "password": password}
    ),
)

dbt execution setup

This code contains the following variables:

  • dbt executable path – Uses a virtual environment
  • dbt project path – Is located in the environment variable DBT_PROJECT_PATH under your project
execution_config = ExecutionConfig(
    dbt_executable_path=f"{os.environ['DBT_VENV_PATH']}/bin/dbt",
    execution_mode=ExecutionMode.VIRTUALENV,
)

project_config = ProjectConfig(
    dbt_project_path=f"{os.environ['DBT_PROJECT_PATH']}/{project_name}",
)

Tasks and execution flow

This step includes the following components:

  • Audit dbt task group (audit_dbt_task) – Runs the dbt model tagged with audit
  • dbt task group (transform_data) – Runs the dbt models tagged with operations, excluding the audit model

In dbt, tags are labels that you can assign to models, tests, seeds, and other dbt resources to organize and selectively run subsets of your dbt project. In your render_config, you have exclude=["tag:audit"]. This means dbt will exclude models that have the tag audit, because the audit model runs separately.

  • Failure check (dbt_check) – Checks for dbt model failures, raises an AirflowException if upstream dbt tasks fail
  • SNS notification on failure (sns_notification_for_failure) – Invokes a Lambda function to send an SNS notification upon a dbt task failure (for example, a dbt model in the task group)
def check_dbt_failures(**kwargs):
    if kwargs['ti'].state == 'failed':
        raise AirflowException('Failure in dbt task group')

with DAG(
    dag_id="my_sample_dbt_project_dag",
    start_date=datetime(2025, 4, 2),
    schedule_interval="@daily",
    catchup=False,
    tags=["dbt"]
):

    audit_dbt_task = DbtTaskGroup(
        group_id="audit_dbt_task",
        execution_config=execution_config,
        profile_config=profile_config,
        project_config=project_config,
        operator_args={
            "install_deps": True,
        },
        render_config= RenderConfig(
            select=["tag:audit"],
            load_method=LoadMode.DBT_LS
        )
    )

    transform_data = DbtTaskGroup(
        group_id="transform_data",
        execution_config=execution_config,
        profile_config=profile_config,
        project_config=project_config,
        operator_args={
            "install_deps": True,
            # install necessary dependencies before running dbt command
        },
        render_config= RenderConfig(
            exclude=["tag:audit"],
            load_method=LoadMode.DBT_LS
        )
    )

    dbt_check = PythonOperator(
        task_id='dbt_check', 
        python_callable=check_dbt_failures,
        provide_context=True,
    )

    sns_notification_for_failure = LambdaInvokeFunctionOperator(
        task_id="sns_notification_for_failure",
        function_name=sns_lambda_function_name,
        payload=payload,
        trigger_rule='one_failed'
    )

    audit_dbt_task >> transform_data >> dbt_check >> sns_notification_for_failure

The sample dbt orchestrates a dbt workflow in Amazon Redshift, starting with an audit task and followed by a task group that processes data models. It includes a failure handling mechanism that checks for failures and raises an exception to trigger an SNS notification using Lambda if a failure occurs. If no failures are detected, the SNS notification task is skipped.

Clean up

If you no longer need the resources you created, delete them to avoid additional charges. This includes the following:

  • Amazon MWAA environment
  • S3 bucket
  • IAM role
  • Redshift cluster or serverless workgroup
  • Secrets Manager secret
  • SNS topic
  • Lambda function

Conclusion

By integrating dbt with Amazon Redshift and orchestrating workflows using Amazon MWAA and the Cosmos library, you can simplify data transformation workflows while maintaining robust engineering practices. The sample dbt project structure, combined with automated deployments through GitHub Actions and proactive monitoring using Amazon SNS, provides a foundation for building reliable data pipelines. The addition of audit logging facilitates transparency across your transformations, so teams can maintain high data quality standards.

You can use this solution as a starting point for your own dbt implementation on Amazon MWAA. The approach we outlined emphasizes SQL-based transformations while incorporating essential operational capabilities like deployment automation and failure alerting. Get started by adapting the configuration to your environment, and build upon these practices as your data needs evolve.

For more resources, refer to Manage data transformations with dbt in Amazon Redshift and Redshift setup.


About the authors

Cindy Li is an Associate Cloud Architect at AWS Professional Services, specialising in Data Analytics. Cindy works with customers to design and implement scalable data analytics solutions on AWS. When Cindy is not diving into tech, you can find her out on walks with her playful toy poodle Mocha.

Akhil B is a Data Analytics Consultant at AWS Professional Services, specializing in cloud-based data solutions. He partners with customers to design and implement scalable data analytics platforms, helping organizations transform their traditional data infrastructure into modern, cloud-based solutions on AWS. His expertise helps organizations optimize their data ecosystems and maximize business value through modern analytics capabilities.

Joao Palma is a Senior Data Architect at Amazon Web Services, where he partners with enterprise customers to design and implement comprehensive data platform solutions. He specializes in helping organizations transform their data into strategic business assets and enabling data-driven decision making.

Harshana Nanayakkara is a Delivery Consultant at AWS Professional Services, where he helps customers tackle complex business challenges using AWS Cloud technology. He specializes in data and analytics, data governance, and AI/ML implementations.
GigaPlus GP-S25-1602 Review A Cheap 16-port 2.5GbE and 2-port 10G Switch

Post Syndicated from Rohit Kumar original https://www.servethehome.com/gigaplus-gp-s25-1602-review-a-cheap-16-port-2-5gbe-and-2-port-10g-switch/

In our GigaPlus GP-S25-1602 review, we see how this 16-port 2.5GbE and 2-port 10G SFP+ switch is constructed in a surprising manner

The post GigaPlus GP-S25-1602 Review A Cheap 16-port 2.5GbE and 2-port 10G Switch appeared first on ServeTheHome.

NGINX adds native support for ACME protocol

Post Syndicated from jzb original https://lwn.net/Articles/1033657/

NGINX has announced
the preview release of the nginx-acme
module, which adds native support to NGINX for the Automatic
Certificate Management Environment
(ACME) protocol:

NGINX’s native support for ACME brings a variety of benefits that
simplify and enhance the overall SSL/TLS certificate management
process. Being able to configure ACME directly using NGINX directives
drastically reduces manual errors and eliminates much of the ongoing
overhead traditionally associated with managing SSL/TLS
certificates. It also reduces reliance on external tools like Certbot,
creating a more secure and streamlined workflow with fewer
vulnerabilities and a smaller attack surface.

177 AWS services achieve HITRUST certification

Post Syndicated from Mark Weech original https://aws.amazon.com/blogs/security/177-aws-services-achieve-hitrust-certification/

Amazon Web Services (AWS) is excited to announce that 177 AWS services have achieved HITRUST certification for the 2025 assessment cycle, including the following five services which were certified for the first time:

The full list of AWS services, which a third-party assessor audited and certified under the HITRUST CSF, is now available on our Services in Scope by Compliance Program page. Customers can view and download our 2025 HITRUST certification on demand through AWS Artifact.

AWS HITRUST certification is available for customer inheritance

As an added benefit to our customers, organizations no longer have to assess inherited controls for their HITRUST validated assessment because AWS already has. You can deploy business solutions to the AWS Cloud and inherit our HITRUST certification, provided that you use only in-scope services and properly apply the controls detailed on the HITRUST website according to the AWS Shared Responsibility Model.

Our HITRUST certification is based on the version 11.5.1 control framework, so you can inherit the latest controls and related scoring, knowing that AWS has attested to the latest framework standards available. Leading organizations in a variety of industries have adopted HITRUST CSF as part of their approach to security and privacy. For more information, see the HITRUST website.

As always, we value your feedback and questions and are committed to helping you achieve and maintain the highest standard of security and compliance. Feel free to contact the team through AWS Compliance Support. If you have feedback about this post, submit comments in the Comments section below.

Mark Weech
Mark L. Weech

Mark is the AWS HITRUST Compliance Program Manager and has 30 years of experience in compliance and cybersecurity roles pertaining to the healthcare, finance, and national defense industries. Mark holds several cybersecurity certifications including the latest AWS Artificial Intelligence (AI) Foundation Practitioner Certification.

Meet our newest AWS Heroes — August 2025

Post Syndicated from Taylor Jacobsen original https://aws.amazon.com/blogs/aws/meet-our-newest-aws-heroes-august-2025/

We are excited to announce the latest cohort of AWS Heroes, recognized for their exceptional contributions and technical leadership. These passionate individuals represent diverse regions and technical specialties, demonstrating notable expertise and dedication to knowledge sharing within the AWS community. From AI and machine learning to serverless architectures and security, our new Heroes showcase the breadth of cloud innovation while fostering inclusive and engaging technical communities. Join us in welcoming these community leaders who are helping to shape the future of cloud computing and inspiring the next generation of AWS builders.

Kristine Armiyants – Masis, Armenia

Community Hero Kristine Armiyants is a software engineer and cloud support engineer who transitioned into technology from a background in finance, having earned an MBA before becoming self-taught in software development. As the founder and leader of AWS User Group Armenia for over 2.5 years, she has transformed the local tech landscape by organizing Armenia’s first AWS Community Day, scaling it from 320 to 440+ attendees, and leading a team that brings international-scale events to her country. Through her technical articles in Armenian, hands-on workshops, and “no-filter” blog series, she makes cloud knowledge more accessible while mentoring new user group organizers and early-career engineers. Her dedication to community building has resulted in five new AWS Community Builders from Armenia, demonstrating her commitment to creating inclusive spaces for learning and growth in the AWS community.

Nadia Reyhani – Perth, Australia

Machine Learning Hero Nadia Reyhani is an AI Product Engineer who integrates DevOps best practices with machine learning systems. She is a former AWS Community Builder and regularly presents at AWS events on building scalable AI solutions using Amazon SageMaker and Bedrock. As a Women in Digital Ambassador, she combines technical expertise with advocacy, creating inclusive spaces for underrepresented groups in cloud and AI technologies.

Raphael Manke – Karlsruhe, Germany

DevTools Hero Raphael Manke is a Senior Product Engineer at Dash0 and the creator of the unofficial AWS re:Invent planner, which is used to help build a schedule for the event. With a decade of AWS experience, he specializes in serverless technologies and DevTools that streamline cloud development. As the organizer of the AWS User Group in Karlsruhe and a former AWS Community Builder, he actively contributes to product enhancement through public speaking and direct collaboration with AWS service teams. His commitment to the AWS community spans from local user group leadership to providing valuable feedback to service teams.

Rowan Udell – Brisbane, Australia

Security Hero Rowan Udell is an independent AWS security consultant specializing in AWS Identity and Access Management (IAM). He has been sharing AWS security expertise for over a decade through books, blog posts, meet-ups, workshops, and conference presentations. Rowan has taken part in many AWS community programs, was an AWS Community Builder for four years, and is part of the AWS Community Day Australia Organizing Committee. A frequent speaker at AWS events including Sydney Summit and other community meetups, Rowan is known for transforming complex security concepts into simple, practical, and workable solutions for businesses securing their AWS environments.

Sangwoon (Chris) Park – Seoul, Korea

Serverless Hero Sangwoon (Chris) Park leads development at RECON Labs, an AI startup specializing in AI-driven 3D content generation. He is a former AWS Community Builder and the creator of “AWS Classroom” YouTube channel, and he shares practical serverless architecture knowledge with the AWS community. Chris hosts monthly AWS Classroom Meetups and the AWS KRUG Serverless Small Group, actively promoting serverless technologies through community events and educational content.

Toshal Khawale – Pune, India

Community Hero Toshal Khawale is an experienced technology leader with over 22 years of expertise in engineering and AWS cloud technology, holding 12 AWS certifications that demonstrate his cloud knowledge. As a Managing Director at PwC, Toshal guides organizations through cloud transformation, digital innovation, and application modernization initiatives, having led numerous large-scale AWS migrations and generative AI implementations. He was an AWS Community Builder for six years and continues to serve as the AWS User Group Pune Leader, actively fostering community engagement and knowledge sharing. Through his roles as a mentor, frequent speaker, and advocate, Toshal helps organizations maximize their AWS investments while staying at the forefront of cloud technology trends.

Learn More

Visit the AWS Heroes webpage if you’d like to learn more about the AWS Heroes program, or to connect with a Hero near you.

— Taylor

GigaPlus GP-S25-1602 Review A Cheap 16-port 2.5GbE and 2-port 10G Switch

Post Syndicated from Rohit Kumar original https://www.servethehome.com/gigaplus-gp-s25-1602-review-a-cheap-16-port-2-5gbe-and-2-port-10g-switch/

In our GigaPlus GP-S25-1602 review, we see how this 16-port 2.5GbE and 2-port 10G SFP+ switch is constructed in a surprising manner

The post GigaPlus GP-S25-1602 Review A Cheap 16-port 2.5GbE and 2-port 10G Switch appeared first on ServeTheHome.

The collective thoughts of the interwebz