Трябва да се ядосаме, … а после?

Post Syndicated from Боян Юруков original https://yurukov.net/blog/2025/trqbva-da-se-qdosame/

Много се изписа като интерпретации на думите на Терзиев, притеснения какво е публично и какво не, както и идеи какво следва да се направи за ония небостъргач. Вярвам, че всички сме на една страна и съм убеден, че в администрацията има премного хора работещи за по-добра градска среда и в обществена полза. „Просто“ явно не си говорят достатъчно.

Днес се сетих как наскоро архитекти от съюзи и инвеститорски фирми ме обвиняваха, че картата ми за застрояване е лъжела и тия неща дето били в червено нямало да ги има или да са въобще така. Долу виждате не само 215 метровия небостъргач, а и всичко, което се планира около него. Всъщност, когато изготвях картата, пропуснах тази сграда, защото реших, че има грешка в данните на НАГ. Нямаше да е за пръв път и ми се стори невъзможно. Именно хората, от които сте чели днес за случая ми потвърдиха, че е вярно и гласувано от СОС.

Не знам дали общината или общинския съвет имат полезни ходове. Знам, че процесите са сложни с много замесени лица, регулации и врати в полето вложени в закона. Знам също, че тези, които не чухме днес да се изказват за проекта, се възползват прекрасно от тази сложност и къде с поставени лица, със заплахи и корупция си издействат лисчетата нужни за заветното разрешително. Знам, че отказите без основание лесно падат в администативните съдилища и плащаме обезщетения от данъците си, но и дори добре аргументираните в обществена полза също биват нелогично и в разрез със закона спирани поради аналогични на предишната ми точка причини. Знам и че в администацията има редица чиновници, които еднолично са натоварени с отговорността да контролират, но не го правят, както и че често натискът от инвеститори и недостига на хора на тези контролни функции прави надзора над подобни проекти, строителството и след това почти невъзможни.

Докато искаме намаляване на разходите в администрацията, контролът над всички недъзи на града, наглите по улиците, замърсяващите индустриално и прочие изисква голям човешки ресурс. Аналогично всеки ръководещ дори малка организация знае колко трудно е да изкорениш откровено вредните елементи от нея, особено когато трябва да ги замениш с квалифицирани такива рискова позиция със заплата по-ниска от продавач на вейпове.

Знам и че всичко това е до болка познато и като граждани на града искаме просто да се спре и някой друг да измисли как. Днес в парламента видяхме какво става когато хора успяват да прокарат икономическите си интереси през политическа власт. Ако не друго, това следва да покаже, че мотивацията на тези на власт е от голямо значение. Има много паралели между градоустройството в София и пробитата каца и обслужване на здравеопазването. Тук обаче искам на друго да наблегна.

По стечение на обстоятелствата съм се фокусирал много върху прозрачността именно на градоустройството в София и разбиране какво стои зад проблемите. Не като специалист, защото не съм, а като потърпевш на недъзите, натрупаните проблеми и липсата на видим напредък. Виждам как ще изглежда града, ако не направим нещо с постоянство и в широк спектър от сфери, закони, администрация и надзор. Има хора, които искат да подобрят положението с наличните инструменти и са готови да жертват сигурността и името си за това. Има също разминаване в разбиранията как следва да се случи и кой да носи отговорност. Липсва обща работа и комуникация, което първосигнално ескалира в надвикване, затваряне и мръщене от всички страни.

Отстрани това изглежда като „същото както другите“, а всъщност разликата е огромна. Въпросът е как да се решат тези заложени подводни камъни систематично без да си избождаме очите един друг. Та дори да не е баш по правилата, имайки предвид, че нито регулаторите, нито министерствата, нито съд и прокуратура, нито ДНСК или дори някои районни кметове работят според закона и задълженията си.

Не призовавам към търпение, а точно обратното – трябва да се ядосаме. Следва обаче да се научим, че онези със схема не са хората, които биха оправили наболелите проблеми, а ще се възползват от тях. Да се опитаме да различим хората с план от хората със схема и да накараме първите да работят заедно, защото решенията са трудни, мъчни и спорни, а схемите обединяват най-лесно и тихо и го виждаме премного в СОС и парламента.

Повече за случая може да прочетете мнения на районния кмет Димитър Божилов, Борис Бонев и Спаси София тук, тук и тук, Любо Георгиев от План за София. Това, което показвам в началото ще намерите в картата със застрояването.

The post Трябва да се ядосаме, … а после? first appeared on Блогът на Юруков.

Build a data lakehouse in a hybrid Environment using Amazon EMR Serverless, Apache DolphinScheduler, and TiDB

Post Syndicated from Shiyang Wei original https://aws.amazon.com/blogs/big-data/build-a-data-lakehouse-in-a-hybrid-environment-using-amazon-emr-serverless-apache-dolphinscheduler-and-tidb/

While helping our customers build systems on AWS, we found out that a large number of enterprise customers who pay great attention to data security and compliance, such as B2C FinTech enterprises, build data-sensitive applications on premises and use other applications on AWS to take advantage AWS managed services. Using AWS managed services can greatly simplify daily operation and maintenance, as well as help you achieve optimized resource utilization and performance.

This post discusses a decoupled approach of building a serverless data lakehouse using AWS Cloud-centered services, including Amazon EMR Serverless, Amazon Athena, Amazon Simple Storage Service (Amazon S3), Apache DolphinScheduler (an open source data job scheduler) as well as PingCAP TiDB, a third-party data warehouse product that can be deployed either on premises or on the cloud or through a software as a service (SaaS).

Solution overview

For our use case, an enterprise data warehouse with business data is hosted on an on-premises TiDB platform, an AWS Global Partner that is also available on AWS through AWS Marketplace.

The data is then processed by an Amazon EMR Serverless Job to achieve data lakehouse tiering logic. Different tiering data are stored in separate S3 buckets or separate S3 prefixes under the same S3 bucket. Typically, there are four layers in terms of data warehouse design.

  1. Operational data store layer (ODS) – This layer stores raw data of the data warehouse
  2. Data warehouse stage layer (DWS) – This layer is a temporary staging area within the data warehousing architecture where data from various sources is loaded, cleaned, transformed, and prepared before being loaded into the data warehouse database layer;
  3. Data warehouse database layer (DWD) – This layer is the central repository in a data warehousing environment where data from various sources is integrated, transformed, and stored in a structured format for analytical purposes;
  4. Analytical data store (ADS) – This layer is a subset of the data warehousing that is specifically designed and optimized for a particular business function, department, or analytical purpose.

For this post, we only use ODS and ADS layers to demonstrate the technical feasibility.

The schema of this data is managed through the AWS Glue Data Catalog, and can be queried using Athena. The EMR Serverless Jobs are orchestrated using Apache DolphinScheduler deployed in cluster mode on Amazon Elasctic Compute Cloud (Amazon EC2) instances, with meta data stored in an Amazon Relational Database Service (Amazon RDS) for MySQL instance.

Using DolphinScheduler as the data lakehouse job orchestrator offers the following advantages:

  • Its distributed architecture allows for better scalability, and the visual DAG designer makes workflow creation more intuitive for team members with varying technical expertise
  • It provides more granular task-level controls and supports a wider range of task types out-of-the-box, including Spark, Flink, and machine learning (ML) workflows, without requiring additional plugin installations;
  • Its multi-tenancy feature enables better resource isolation and access control across different teams within an organization.

However, DolphinScheduler requires more initial setup and maintenance effort, making it more suitable for organizations with strong DevOps capabilities and a desire for complete control over their workflow infrastructure.

The following diagram illustrates the solution architecture.

Prerequisites

You need to create an AWS account and set up an AWS Identity and Access Management (IAM) user as a prerequisite for the following implementation. Complete the following steps:

For AWS account signing up, please follow up the actions guided per page link.

  1. Create an AWS account.
  2. Sign in to the account using the root user for the first time.
  3. One the IAM console, create an IAM user with AdministratorAccess Policy.
  4. Use this IAM user to log in AWS Management Console rather the root user.
  5. On the IAM console, choose Users in the navigation pane.
  6. Navigate to your user, and on the Security credentials tab, create an access key.
  7. Store the access key and secret key in a secure place and use them for further API access of the resources of this AWS account.

Set up DolphinScheduler, IAM configuration, and the TiDB Cloud table

In this section, we walk through the steps to install DolphinScheduler, complete additional IAM configurations to enable the EMR Serverless job, and provision the TiDB Cloud table.

Install DolphinScheduler on an EC2 instance with an RDS for MySQL instance storing DolphinScheduler metadata. The production deployment mode of DolphinScheduler is cluster mode. In this blog, we use pseudo cluster mode which has the same installation steps as cluster mode, and could achieve resource economy. We name the EC2 instance ds-pseudo.

Make sure the inbound rule of the security group attached to the EC2 instance allows port 12345’s TCP traffic. Then complete the following steps:

  1. Log in to Amazon EC2 as the root user, and install jvm:
    sudo dnf install java-1.8.0-amazon-corretto
    java -version

  2. Switch to dir /usr/local/src:
    cd /usr/local/src
  3. Install Apache Zookeeper:
    wget https://archive.apache.org/dist/zookeeper/zookeeper-3.8.0/apache-zookeeper-3.8.0-bin.tar.gz
    tar -zxvf apache-zookeeper-3.8.0-bin.tar.gz
    cd apache-zookeeper-3.8.0-bin/conf
    cp zoo_sample.cfg zoo.cfg
    cd ..
    nohup bin/zkServer.sh start-foreground &> nohup_zk.out &
    bin/zkServer.sh status

  4. Check the Python version:
    python3 --version

    The version should be 3.9 or above. It is recommended that you use Amazon Linux 2023 or later as the Amazon EC2 operating system (OS); Python version 3.9 meets the requirement. For detail information, refer to Python in AL2023.

  5. Install Dolphinscheduler
    1. Download the dolphinscheduler package:
      cd /usr/local/src
      wget https://dlcdn.apache.org/dolphinscheduler/3.1.9/apache-dolphinscheduler-3.1.9-bin.tar.gz
      tar -zxvf apache-dolphinscheduler-3.1.9-bin.tar.gz
      mv apache-dolphinscheduler-3.1.9-bin apache-dolphinscheduler
    2. Download the mysql connector package:
      wget https://downloads.mysql.com/archives/get/p/3/file/mysql-connector-j-8.0.31.tar.gz
      tar -zxvf mysql-connector-j-8.0.31.tar.gz
    3. Copy specific mysql connector JAR file to the following destinations:
      cp mysql-connector-j-8.0.31/mysql-connector-j-8.0.31.jar ./apache-dolphinscheduler/api-server/libs/
      cp mysql-connector-j-8.0.31/mysql-connector-j-8.0.31.jar ./apache-dolphinscheduler/alert-server/libs/
      cp mysql-connector-j-8.0.31/mysql-connector-j-8.0.31.jar ./apache-dolphinscheduler/master-server/libs/
      cp mysql-connector-j-8.0.31/mysql-connector-j-8.0.31.jar ./apache-dolphinscheduler/worker-server/libs/
      cp mysql-connector-j-8.0.31/mysql-connector-j-8.0.31.jar ./apache-dolphinscheduler/tools/libs/
    4. Add the user dolphinscheduler, and make sure the directory apache-dolphinscheduler and the files under it are owned by the user dolphinscheduler:
      useradd dolphinscheduler
      echo "dolphinscheduler" | passwd --stdin dolphinscheduler
      sed -i '$adolphinscheduler ALL=(ALL) NOPASSWD: NOPASSWD: ALL' /etc/sudoers
      sed -i 's/Defaults   requirett/#Defaults requirett/g' /etc/sudoers
      chown -R dolphinscheduler:dolphinscheduler apache-dolphinscheduler
  6. Install the mysql client:
    sudo dnf update -y 
    sudo dnf install mariadb105
  7. On the Amazon RDS console, provision an RDS for MySQL instance with the following configurations:
    1. For Database Creation Method, select Standard create.
    2. For Engine options, choose MySQL.
    3. For Edition: choose MySQL 8.0.35.
    4. For Templates: select Dev/Test.
    5. For Availability and durability, select Single DB instance.
    6. For Credentials management, select Self-managed.
    7. For Connectivity, select Connect to an EC2 compute resource, and choose the EC2 instance created earlier.
    8. For Database Authentication: choose Password Authentication.
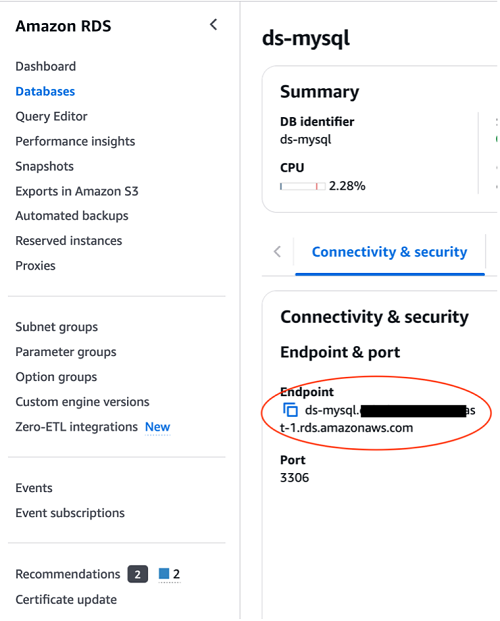
  8. Navigate to the ds- mysql database details page, and under Connectivity & security, copy the RDS for MySQL endpoint.
  9. Configure the intance:
    mysql -h <RDS for mysql Endpoint> -u admin -p
    mysql> CREATE DATABASE dolphinscheduler DEFAULT CHARACTER SET utf8 DEFAULT COLLATE utf8_general_ci;
    mysql> exit;
  10. Configure the dolphinscheduler configuration file:
    cd /usr/local/src/apache-dolphinscheduler/
  11. Revise dolphinscheduler_env.sh:
    vim bin/env/dolphinscheduler_env.sh
    export DATABASE=${DATABASE:-mysql}
    export SPRING_PROFILES_ACTIVE=${DATABASE}
    export SPRING_DATASOURCE_URL="jdbc:mysql://ds-mysql.cq**********.us-east-1.rds.amazonaws.com/dolphinscheduler?useUnicode=true&amp;characterEncoding=UTF-8&amp;useSSL=false"
    export SPRING_DATASOURCE_USERNAME="admin"
    export SPRING_DATASOURCE_PASSWORD="<your password>"
  12. On the Amazon EC2 console, navigate to the instance details page and copy the private IP address.
  13. Revise install_env.sh:
    vim bin/env/install_env.sh
    ips=${ips:-"<private ip address of ds-pseudo EC2 instance>"}
    masters=${masters:-"<private ip address of ds-pseudo EC2 instance>"}
    workers=${workers:-" private ip address of ds-pseudo EC2 instance:default"}
    alertServer=${alertServer:-" private ip address of ds-pseudo EC2 instance "}
    apiServers=${apiServers:-" private ip address of ds-pseudo EC2 instance "}
    installPath=${installPath:-"~/dolphinscheduler"}
    export JAVA_HOME=${JAVA_HOME:-/usr/lib/jvm/jre-1.8.0-openjdk}
    export PYTHON_HOME=${PYTHON_HOME:-/bin/python3}
  14. Configure the dolphinscheduler configuration file:
    cd /usr/local/src/apache-dolphinscheduler/
    bash tools/bin/upgrade-schema.sh
  15. Install DolphinScheduler:
    cd /usr/local/src/apache-dolphinscheduler/
    su dolphinscheduler
    bash ./bin/install.sh
  16. Start DolphinScheduler after installation:
    cd /usr/local/src/apache-dolphinscheduler/
    su dolphinscheduler
    bash ./bin/start-all.sh
  17. Open the DolphinScheduler console:
    http://<ec2 ip address>:12345/dolphinscheduler/ui/login

After input the initial username and password, press Login button to enter into the dashboard shown as below.

initial user/password admin/dolphinscheduler123

Configure IAM role to enable the EMR serverless job

The EMR serverless job role needs to have permission to access a specific S3 bucket to read job scripts and potentially write results, and also have permission to access AWS Glue to read the Data Catalog which stores the tables’ meta data. For detailed guidance, please refer to Grant permission to use EMR Serverless or EMR Serverless Samples.

The following screenshot shows the IAM role configured with the trust policy attached.


The IAM role should have the following permissions policies attached, as shown in the following screenshot.

Provision the TiDB Cloud table

  1. To provision the TiDB Cloud table, complete the following steps:
    1. Register for TiDB Cloud.
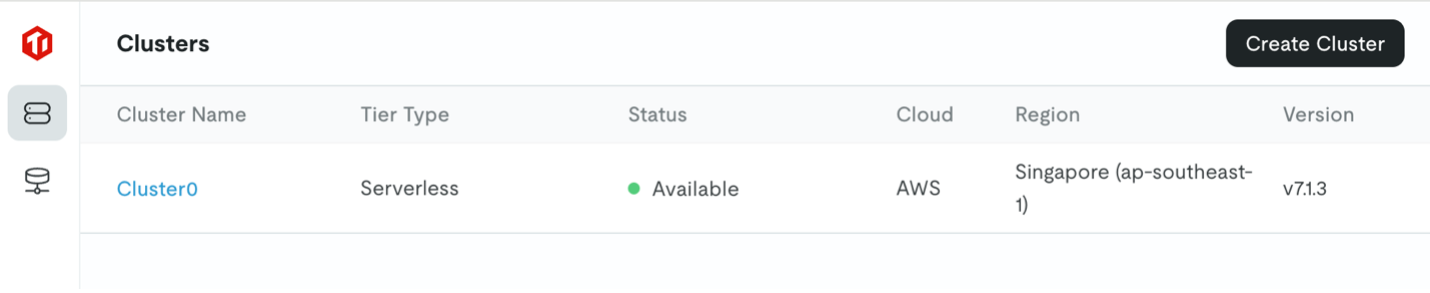
    2. Create a serverless cluster, as shown in the following screenshot. For this post, we name the cluster Cluster0.
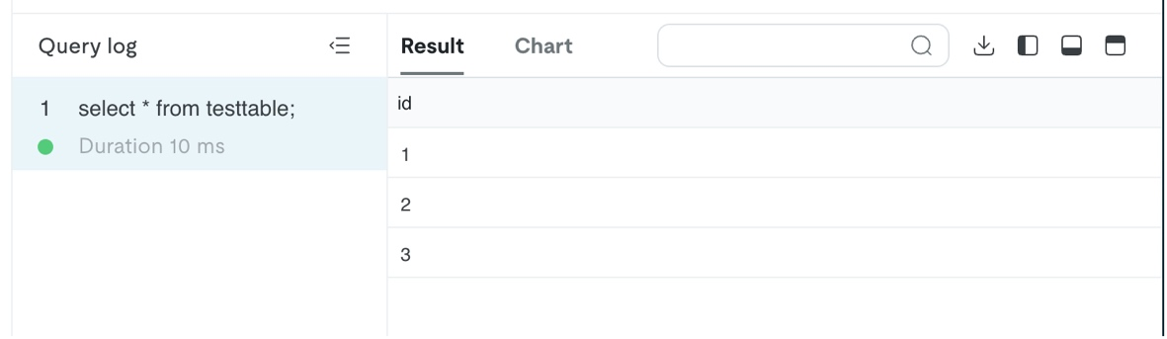
  2. Choose Cluster0, then choose SQL Editor to create a database named test:
    create table testtable (id varchar(255));
    insert into testtable values (1);
    insert into testtable values (2);
    insert into testtable values (3);

Synchronize data between on-premises TiDB and AWS

In this section, we discuss how to synchronize historical data as well as incremental data between TiDB and AWS.

Use TiDB Dumpling to sync historical data from TiDB to Amazon S3

Use the commands in this section to dump data stored in TiDB as CSV files into a S3 bucket. For full details on how to achieve a data sync from on-premises TiDB to Amazon S3, see Export data to Amazon S3 cloud storage. For this post, we use TiDB tool Dumpling. Complete the following steps:

  1. Log in to the EC2 instance created earlier as root.
  2. Run the following command to install TiUP:
    curl --proto '=https' --tlsv1.2 -sSf https://tiup-mirrors.pingcap.com/install.sh | sh
    
    cd /root
    source .bash_profile
    
    tiup --version

  3. Run the following command to install Dumpling:
    tiup install dumpling
  4. Run the following command to achieve target database table dumpling to the specific S3 bucket.
    tiup dumpling -u <prefix.root> -P 4000 -h <tidb serverless endpoint/host> -r 200000 -o "s3://<specific s3 bucket>" --sql "select * from <target database>.<target table>" --ca "/etc/pki/tls/certs/ca-bundle.crt" --password <tidb serverless password>
  5. To acquire the TiDB serverless connection information, navigate to the TiDB Cloud console and choose Connect.

You can collect the specific connection information of test database from the following screenshot.

Yan can view the data stored in the S3 bucket on the Amazon S3 console.

You can use Amazon S3 Select to query the data and get results similar to the following screenshot, confirming that the data has been ingested into testtable.

Use TiDB Dumpling with a self-managed checkpoint to sync incremental data from TiDB to Amazon S3

To achieve incremental data synchronization using TiDB Dumpling, it’s essential to self-manage the check point of the target synchronized data. One recommended way is to store the ID of the final ingested record into a certain media (such as Amazon ElastiCache for Redis, Amazon DynamoDB) to achieve a self-managing checkpoint when running the shell/Python job that trigges TiDB Dumpling. The prerequisite for implementing this is that the target table has a monotonically increasing id field as its primary key.

You can use the following TiDB Dumpling command to filter the exported data:

tiup dumpling -u <prefix.root> -P 4000 -h <tidb serverless endpoint/host> -r 200000 -o "s3://<specific s3 bucket>" --sql "select * from <target database>.<target table> where id > 2" --ca "/etc/pki/tls/certs/ca-bundle.crt" --password <tidb serverless password>

Use the TiDB CDC connector to sync incremental data from TiDB to Amazon S3

The advantage of using TiDB CDC connector to achieve incremental data synchronization from TiDB to Amazon S3 is that there is built-in change data capture (CDC) mechanism, and because the backend engine is Flink, the performance is fast. However, there is one trade-off: you need to create several Flink tables to map the ODS tables on AWS.

For instructions to implement the TiDB CDC connector, refer to TiDB CDC.

Use an EMR serverless job to sync historical and incremental data from a Data Catalog table to the TiDB table

Data usually flows from on premises to the AWS Cloud. However, in some cases, the data might flow from the AWS Cloud to your on-premises database.

After landing on AWS, the data will be wrapped up and managed by the Data Catalog by created Athena tables with the specific tables’ schema. The table DDL script is as follows:

CREATE EXTERNAL TABLE IF NOT EXISTS `testtable`(
  `id` string
) 
ROW FORMAT SERDE 'org.apache.hadoop.hive.serde2.OpenCSVSerde'
LOCATION 's3://<bucket_name>/<prefix_name>/';  

The screenshot below showcases the DDL running result using Athena console.

The data stored in testtable table is queried using select * from testable SQL. The query result is shown as follows:

In this case, an EMR serverless spark job can accomplish the work of synchronizing data from an AWS Glue table to your on premises table.

If the Spark job is written in Scala, the sample code is as below:

package com.example
import org.apache.spark.sql.{DataFrame, SparkSession}

object Main  {

  def main(args: Array[String]): Unit = {

    val spark = SparkSession.builder()
      .appName("<specific app name>")
      .enableHiveSupport()
      .getOrCreate()

    spark.sql("show databases").show()
    spark.sql("use default")
    var df=spark.sql("select * from testtable")

    df.write
      .format("jdbc")
      .option("driver","com.mysql.cj.jdbc.Driver")
      .option("url", "jdbc:mysql://<tidbcloud_endpoint>:4000/namespace")
      .option("dbtable", "<table_name>")
      .option("user", "<user_name>")
      .option("password", "<password_string>")
      .save()

    spark.close()
  }
}

You can acquire the TiDB serverless endpoint connection information on the TiDB console by choosing Connect, as shown earlier in this post.

After you have wrapped the Scala code as JAR file using SBT, you can submit the job to EMR Serverless with the following AWS Command Line Interface (AWS CLI) command:

export applicationId=00fev6mdk***

export job_role_arn=arn:aws:iam::<aws account id>:role/emr-serverless-job-role

aws emr-serverless start-job-run \
    --application-id $applicationId \
    --execution-role-arn $job_role_arn \
    --job-driver '{
        "sparkSubmit": {
            "entryPoint": "<s3 object url for the wrapped jar file>",
            "sparkSubmitParameters": "--conf spark.hadoop.hive.metastore.client.factory.class=com.amazonaws.glue.catalog.metastore.AWSGlueDataCatalogHiveClientFactory --conf spark.driver.cores=1 --conf spark.driver.memory=3g --conf spark.executor.cores=4 --conf spark.executor.memory=3g --jars s3://spark-sql-test-nov23rd/mysql-connector-j-8.2.0.jar"
        }
    }'

If the Spark job is written in PySpark, the sample code is as follows:

import os
import sys
import pyspark.sql.functions as F
from pyspark.sql import SparkSession

if __name__ == "__main__":

    spark = SparkSession\
        .builder\
        .appName("app1")\
        .enableHiveSupport()\
        .getOrCreate()

    df=spark.sql(f"select * from {str(sys.argv[1])}")

    df.write.format("jdbc").options(
        driver="com.mysql.cj.jdbc.Driver",
        url="jdbc:mysql://tidbcloud_endpoint:4000/namespace ",
        dbtable="table_name",
        user="use_name",
        password="password_string").save()

    spark.stop()

You can submit the job to EMR Serverless using the following AWS CLI command:

export applicationId=00fev6mdk***

export job_role_arn=arn:aws:iam::<aws account id>:role/emr-serverless-job-role

aws emr-serverless start-job-run \
    --application-id $applicationId \
    --execution-role-arn $job_role_arn \
    --job-driver '{
        "sparkSubmit": {
            "entryPoint": "<s3 object url for the python script file>",
            "entryPointArguments": ["testspark"],
            "sparkSubmitParameters": "--conf spark.hadoop.hive.metastore.client.factory.class=com.amazonaws.glue.catalog.metastore.AWSGlueDataCatalogHiveClientFactory --conf spark.driver.cores=1 --conf spark.driver.memory=3g --conf spark.executor.cores=4 --conf spark.executor.memory=3g --jars s3://spark-sql-test-nov23rd/mysql-connector-j-8.2.0.jar"
        }
    }'

The preceding PySpark code and AWS CLI command achieves outbound parameter input as well: the table name (specifically testspark) is ingested into the SQL sentence when submitting the job.

EMR Serverless job pperation essentials

An EMR Serverless application is a resource pool concept. An application holds a certain capacity of compute, memory, and storage resources for jobs running on it to use. You can configure the resource capacity using AWS CLI or the console. Because it’s a resource pool, EMR Serverless application creation is usually a one-time action with the initial capacity and maximum capacity being configured.

An EMR Serverless job is a working unit that actually processes the compute task. In order for a job to work, you need to set the EMR Serverless application ID, the execution IAM role (discussed previously), and the specific application configuration (the resources the job is planning to use). Although you can create the EMR Serverless job on the console, it’s recommended to create the EMR Serverless job using the AWS CLI for further integration with the scheduler and scripts.

For more details on EMR Serverless application creation and EMR Serverless job provisioning, refer to EMR Serverless Hive query or EMR Serverless PySpark job

DolphinScheduler integration and job orchestration

DolphinScheduler is a modern data orchestration platform. It’s agile to create high- performance workflows with low code. It also provides a powerful UI, dedicated to solving complex task dependencies in the data pipeline and providing various types of jobs out of the box.

DolphinScheduler is developed and maintained by WhaleOps, and available in AWS Marketplace as WhaleStudio.

DolphinScheduler has been natively integrated with Hadoop: DolphinScheduler cluster mode is by default recommended to be deployed on a Hadoop cluster (usually on HDFS data nodes), and the HQL scripts uploaded to DolphinScheduler Resource Manager are stored by default on HDFS, and can be orchestrated using the following native Hive shell command:

Hive -f example.sql

Moreover, for specific case in which the orchestration DAGs are quite complicated, each DAG consists of several jobs (for example, more than 300), and almost all the jobs are HQL scripts stored in DolphinScheduler Resource Manager.

Complete the steps listed in this section to achieve a seamless integration between DolphinScheduler and EMR Serverless.

Switch the storage layer of DolphinScheduler Resource Center from HDFS to Amazon S3

Edit the common.properties files under directories /usr/local/src/apache-dolphinscheduler/api-server/ and directory /usr/local/src/apache-dolphinscheduler/worker-server/conf. The following code snippet shows the part of the file that needs to be revised:

# resource storage type: HDFS, S3, OSS, NONE
#resource.storage.type=NONE
resource.storage.type=S3
# resource store on HDFS/S3 path, resource file will store to this base path, self configuration, please make sure the directory exists on hdfs and have read write permissions. "/dolphinscheduler" is recommended
resource.storage.upload.base.path=/dolphinscheduler

# The AWS access key. if resource.storage.type=S3 or use EMR-Task, This configuration is required
resource.aws.access.key.id=AKIA************
# The AWS secret access key. if resource.storage.type=S3 or use EMR-Task, This configuration is required
resource.aws.secret.access.key=lAm8R2TQzt*************
# The AWS Region to use. if resource.storage.type=S3 or use EMR-Task, This configuration is required
resource.aws.region=us-east-1
# The name of the bucket. You need to create them by yourself. Otherwise, the system cannot start. All buckets in Amazon S3 share a single namespace; ensure the bucket is given a unique name.
resource.aws.s3.bucket.name=dolphinscheduler-shiyang
# You need to set this parameter when private cloud s3. If S3 uses public cloud, you only need to set resource.aws.region or set to the endpoint of a public cloud such as S3.cn-north-1.amazonaws.com.cn
resource.aws.s3.endpoint=s3.us-east-1.amazonaws.com

After editing and saving the two files, restart the api-server and worker-server by running the following commands, under folder path /usr/local/src/apache-dolphinscheduler/

bash ./bin/stop-all.sh
bash ./bin/start-all.sh
bash ./bin/status-all.sh

You can validate whether switching the storage layer to Amazon S3 was successful by uploading a script using DolphinScheduler Resource Center Console, check if the file appears in relevant S3 bucket folder.

Before verifying that Amazon S3 is now the storage location of DolphinScheduler, you need to create a tenant on the DolphinScheduler console and bundle the admin user with the tenant, as illustrated in the following screenshots:

After that, you can create a folder on the DolphinScheduler console, and check whether the folder is visible on the Amazon S3 console.

Make sure the job scripts uploaded from Amazon S3 are available in the DolphinScheduler Resource Center

After accomplishing the first task, you can upload the scripts from the DolphinScheduler Resource Center console, and confirm that the scripts are stored in Amazon S3. However, in practice, you need to migrate all scripts directly to Amazon S3. You can find and modify the scripts stored in Amazon S3 using DolphinScheduler Resource Center console. To do so, you can revise the metadata table t_ds_resources by inserting all the scripts’ metadata. The table schema of table t_ds_resources is shown in the following screenshot.

The insert command is as follows:

insert into t_ds_resources values(6, 'count.java', ' count.java','',1,1,0,'2024-11-09 04:46:44', '2024-11-09 04:46:44', -1, 'count.java',0);

Now there are two records in the table t_ds_resoruces.

You can access relevant records on the DolphinScheduler console.

The following screenshot shows the files on the Amazon S3 console.

Make the DolphinScheduler DAG orchestrator aware of the jobs’ status so the DAG can move forward or take relevant actions

As mentioned earlier, DolphinScheduler is natively integrated with the Hadoop ecosystem, and the HQL scripts can be orchestrated by the DolphinScheduler DAG orchestrator via Hive -f xxx.sql command. As a result, when the scripts changed to shell scripts or Python scripts (EMR Severless jobs needs to be orchestrated via shell scripts or Python scripts rather than the simple Hive command), the DAG orchestrator can start the job, but can’t get the real time status of the job, and therefore can’t continue the workflow to further steps. Because the DAGs in this case are very complicated, it’s not feasible to amend the DAGs; instead we follow a lift-and-shift strategy.

We use the following scripts to capture jobs’ status and take appropriate actions.

Persist the application ID list with the following code:

var=$(cat applicationlist.txt|grep appid1)
applicationId=${var#* }
echo $applicationId

Enable the DolphinScheduler step status auto-check using a Linux shell:

app_state
{
  response2=$(aws emr-serverless get-application --application-id $applicationId)
  application=$(echo $response1 | jq -r '.application')
  state=$(echo $application | jq -r '.state')
  echo $state
}

job_state
{
  response4=$(aws emr-serverless get-job-run --application-id $applicationId --job-run-id $JOB_RUN_ID)
  jobRun=$(echo $response4 | jq -r '.jobRun')
  JOB_RUN_ID=$(echo $jobRun | jq -r '.jobRunId')
  JOB_STATE=$(echo $jobRun | jq -r '.state')
  echo $JOB_STATE
}

state=$(job_state)

while [ $state != "SUCCESS" ]; do
  case $state in
    RUNNING)
         state=$(job_state)
         ;;
    SCHEDULED)
         state=$(job_state)
         ;;
    PENDING)
         state=$(job_state)
         ;;
    FAILED)
         break
         ;;
   esac
done

if [ $state == "FAILED" ]
then
  false
else
  true
fi

Clean up

To clean up your resources, we recommend using APIs through the following steps:

  1. Delete the EC2 instance:
    1. Find the instance using the following command:
      aws ec2 describe-instances 
    2. Delete the instance using the following command:
      aws ec2 terminate-instances –instance-ids <specific instance id>
  2. Delete the RDS instance:
    1. Find the instance using the following command:
      aws rds describe-db-instances
    2. Delete the instance using the following command:
      aws rds delete-db-instances –db-instance-identifier <speficic rds instance id>
  3. Delete the EMR Serverless application
    1. Find the EMR Serverless application using the following command:
      aws emr-serverless list-applications 
    2. Delete the EMR Serverless application using the following command:
       aws emr-serverless delete-application –application-id <specific application id>

Conclusion

In this post, we discussed how EMR Serverless, as AWS managed serverless big data compute engine, integrates with popular OSS products like TiDB and DolphinScheduler. We discussed how to achieve data synchronization between TiDB and the AWS Cloud, and how to use DolphineScheduler to orchestrate EMR Serverless jobs.

Try out the solution with your own use case, and share your feedback in the comments.


About the Author

Shiyang Wei is Senior Solutions Architect at Amazon Web Services. He is specializing in cloud system architecture and solution design for the financial industry. Particularly, he focused on big data and machine learning applications in finance, as well as the impact of regulatory compliance on cloud architecture design in the financial sector. He has over 10 years of experience in data domain development and architectural design.

DR 101: Assembling Your Incident Response Team

Post Syndicated from Kari Rivas original https://www.backblaze.com/blog/dr-101-assembling-your-incident-response-team/

A decorative image showing a computer screen with several profiles and a cloud.

A well-defined disaster recovery (DR) plan relies heavily on a coordinated incident response team. Think of your incident response team like a pit crew. It’s easy to assume you’ll have a good race when everything is performing smoothly, but the real test comes when something goes wrong—maybe a tire blows or the engine overheats. In those moments, success isn’t about having the best tools in the garage; it’s about having the right team, working together, to quickly solve problems and get back on track.

When your team is facing a disaster recovery scenario, whether it’s a cyber attack, natural disaster, outage, or data breach, the speed and coordination of your team determines how quickly and how well you can move forward. In this post, I’m breaking down how to assemble a team that can respond with precision, minimize downtime, and keep your organization running smoothly when unexpected issues arise.

Establishing key team members, roles, and hierarchy

The incident response team (IRT) is the backbone of your DR response and is responsible for leading the recovery efforts during a disaster. Here’s a breakdown of possible key IRT roles:

  • Incident commander: Oversees the entire incident response process, making critical decisions and delegating tasks to team members.
  • Technical lead: Provides technical expertise, directing recovery efforts for IT infrastructure and data restoration.
  • Communications lead: Handles external and internal communication, ensuring timely updates for stakeholders and mitigating potential reputational damage.
  • Documentation lead: Maintains the DR runbook, ensuring its accuracy and updating it with post-incident findings.
  • Legal counsel: Provides legal guidance and ensures compliance with relevant regulations during the response and recovery process.

Building redundancy

Building redundancy in your IRT allows you to account for team member absences. This includes IT leadership; don’t assume you’ll be in the office when a disaster happens. Assign backup personnel for critical roles within the team to ensure continuity in the event of unforeseen circumstances.

Establish a clear succession plan for leadership roles within the IRT. This ensures a smooth transition if the primary incident commander or other key personnel become unavailable during a disaster.

Establishing a reporting hierarchy

Clearly define a reporting hierarchy within the IRT, outlining who reports to whom and the escalation process for making critical decisions. A clear chain of command during a crisis prevents confusion and delays that could result in prolonged downtime and increased risks.

The importance of clear communication

A critical component of any DR plan is clear communication to employees and executives regarding their specific roles during a security incident. This ensures that the assigned team leader can coordinate a unified response. Remember to include guidelines about incident escalation, as well as agreed-upon methods of communication (e.g., email, direct messaging, video calls, etc.).

Executive sponsorship: Beyond awareness

Executive buy-in is paramount for a successful DR strategy. While awareness of the impact of ransomware attacks has grown over the years, contextualizing DR plans with historical financial impacts, downtime implications, and reputational risk associated with such attacks can help to communicate why DR is a top-line priority.

Tip: Educating executives

Framing the DR plan in terms of cost avoidance, user downtime minimization, and reputational risk mitigation can resonate better with executives. Quantify the potential financial losses from data breaches and system outages to garner executive support for DR initiatives.

Beyond cell phones: Communication channels

Disasters can disrupt traditional communication methods like cell phone service. Develop alternative communication channels for the IRT, such as designated email threads, satellite phones, or pre-arranged conference call bridges. It is imperative to include this information and contact details in your DR runbook for immediate accessibility during crises.

By establishing a well-defined team structure with clear roles, communication protocols, and redundancy measures, enterprise businesses can ensure a coordinated and efficient response to data disasters. 

A well-prepared team leads to a resilient recovery

Your DR strategy is only as effective as the team behind it. By defining clear roles, building in redundancy, and establishing a reporting hierarchy, IT leaders can eliminate confusion and accelerate recovery efforts. Moreover, securing executive sponsorship and ensuring clear communication strengthens your ability to respond effectively. DR isn’t just about the plan on paper. It’s about how you execute that plan and set your team up for success. 

The post DR 101: Assembling Your Incident Response Team appeared first on Backblaze Blog | Cloud Storage & Cloud Backup

Critical GitHub Attack

Post Syndicated from Bruce Schneier original https://www.schneier.com/blog/archives/2025/03/critical-github-attack.html

This is serious:

A sophisticated cascading supply chain attack has compromised multiple GitHub Actions, exposing critical CI/CD secrets across tens of thousands of repositories. The attack, which originally targeted the widely used “tj-actions/changed-files” utility, is now believed to have originated from an earlier breach of the “reviewdog/action-setup@v1” GitHub Action, according to a report.

[…]

CISA confirmed the vulnerability has been patched in version 46.0.1.

Given that the utility is used by more than 23,000 GitHub repositories, the scale of potential impact has raised significant alarm throughout the developer community.

Three ways to help students learn about the impact of technology

Post Syndicated from Sway Grantham original https://www.raspberrypi.org/blog/three-ways-to-help-students-learn-about-the-impact-of-technology/

As adults, it’s easy for us to see the impact technology has had on society and on our lives. Yet when I tell pupils that, within my lifetime, it wasn’t always illegal to hold your mobile phone to your ear and have a call while driving, they are horrified. They are living in the now and don’t yet have the perspective to allow them to see the change that has happened. 

With the greater understanding we now have of technology and its impact, we can better learn from previous mistakes, make decisions around ethical behaviour (such as whether to use a phone while driving), and critically engage in real-world issues. 

As teachers, allocating some time to this topic throughout the year can seem challenging, but by implementing a few small changes, the benefits might be more than you imagine. Here are three ways you can help your students explore the impact of technology.

1. Change the format of your lessons by stepping away from devices 

As teachers know, some computing lessons work best when students don’t use devices, whether it’s a matter of students designing programs before starting to code them, drawing  maps of their school network, or discussing the implications of bias in AI training models. It’s important that learners recognise that computers are tools — sometimes they allow us to do and achieve great things, but sometimes there are other approaches that are more suitable. 

A group of young people investigate computer hardware together.

Spending time discussing the impact of technology can help learners decide for themselves when technology is an asset, and when it is a burden. Another advantage of changing the format of your computing lessons away from device usage is that they may appeal to a wider range of students. While some students may not be interested in using technology, they may enjoy debating ethics, discussing world events, or finding solutions to real-world problems — all of which can take centre stage in a more discussion-focused computing lesson.     

This approach can also demonstrate to your class that lots of different skill sets are needed in the computing industry, and inspire your learners to consider career paths they might have otherwise dismissed. In addition, open, discussion-based lessons can give your learners food for thought, encouraging them to approach tasks in subsequent lessons with a greater appreciation of broader issues — whether they’re designing a program, deciding what features to build into a website, or how to structure a database. 

2. Connect your lessons to real-world events

Young people exist in an interesting space when it comes to world events. Even if they’re not engaged in current affairs, they’ll probably still encounter a lot of content about what’s happening in the world. They may see snippets of news footage on television, hear adults talking about a big event, or — with so much of their lives now happening online — stumble across trending stories and associated opinions while using social media, apps, and websites.  

Close up of two young people working at a computer.

Young people will often try to make sense of all these bits of information, filling in the blanks. The problem is that if we don’t talk to young people about what they’re hearing, they may fill in the blanks incorrectly. Before you know it, they might be anxious that artificial intelligence will take over the world, or that adults hate TikTok for no reason. 

It’s important to equip young people with the skills to think about real-world events — and developments related to technology — critically and calmly. 

Headlines such as “Why the USA is banning TikTok” or self-help articles with titles like “Why muting people on social media will change your life” could make brilliant focus points for a lesson or activity about the impact of technology. Discussing these kinds of headlines and articles can help your learners consider their own opinions, apply what they know about how technology works, and gain a sense of grounding in our often turbulent world. 

By encouraging your learners to articulate what they know and apply it to real-world situations, you’ll enrich their computing education while also nurturing responsible digital citizens.  

3. Encourage students to have difficult conversations

The role of a computing teacher is often broad. Beyond curriculum and teaching responsibilities, it will usually involve providing tech support (changing ink in printers, for instance) and dealing with safeguarding incidents that have happened between pupils at the weekend. 

Safeguarding is a key part of teaching. Effective safeguarding should include teaching your learners about what to do in difficult scenarios, like when a WhatsApp group goes awry, when an image is shared on social media when it shouldn’t have been, or when a game becomes popular that your learners aren’t old enough to play. 

Computing teachers often have to be prepared with a lesson to deal with safeguarding incidents, such as a WhatsApp group gone awry.

Each of these scenarios is an example of technology’s impact on our lives. It’s important that your learners know how to deal with these scenarios and can have different opinions while talking and listening to each other. Also, if your learners can do these things, it will make things easier in the future if you need to talk to a particular learner about something inappropriate they’ve done.  

By encouraging your learners to have difficult conversations, you’ll practise how to navigate the tension between legality, rules from home, and best-practice advice from external sources. You’ll also have lessons that you can refer back to: “Remember when we were discussing the TikTok ban? How might some of those conversations relate to this situation? What about when we discussed when to block people on games or on social media? Would that be appropriate here?” 

Raising awareness that the impact of technology can enrich lessons

Technology is going to continue to impact the lives of the pupils we work with, whether they can recognise that or not. Increasing their awareness of the impact technology is having, in both positive and negative ways, will enrich your lessons, show that content is relevant to your learners, and help protect them when they have to make their own critical decisions. 

There are suggestions in this article to use with learners of all ages, but if you want more support on how to teach the topic with older learners, we have an online course for educators (helloworld.cc/impactoftech) and a unit of work for 14-year-olds (helloworld.cc/ks4impact).

A version of this article also appears in Hello World issue 24.

The post Three ways to help students learn about the impact of technology appeared first on Raspberry Pi Foundation.

This is the ASUS Ascent GX10 a NVIDIA GB10 Mini PC with 128GB of Memory and 200GbE

Post Syndicated from Patrick Kennedy original https://www.servethehome.com/this-is-the-asus-ascent-gx10-a-nvidia-gb10-mini-pc-with-128gb-of-memory-and-200gbe/

vThis is the ASUS Ascent GX10, a NVIDIA GB10 mini PC with 200GbE RDMA and 10GbE networking, 128GB of LPDDR5x, an Arm CPU, and a Blackwell GPU

The post This is the ASUS Ascent GX10 a NVIDIA GB10 Mini PC with 128GB of Memory and 200GbE appeared first on ServeTheHome.

[$] MM medley: huge page allocation, page promotion, KSM, and BPF

Post Syndicated from corbet original https://lwn.net/Articles/1014220/

As the 2025 Linux
Storage, Filesystem, Memory-Management, and BPF Summit
(LSFMM+BPF)
approaches, the density of memory-management patches on the mailing lists
has increased. Included among those are patches aimed at improving the
reliability and performance of huge-page allocation, implementing page
promotion on tiered-memory systems, adding a different approach to
deduplicating memory, and replacing the BPF memory allocator. Read on for
an overview of each.

Security updates for Thursday

Post Syndicated from jake original https://lwn.net/Articles/1014938/

Security updates have been issued by Debian (php7.4, python-django, and python3.9), Fedora (bluez, iwd, libell, and radare2), Mageia (chromium-browser-stable, mosquitto, tomcat, tomcat packages, and vim), Oracle (firefox, grub2, python3, thunderbird, and webkit2gtk3), Red Hat (fence-agents, php:7.4, and python-jinja2), SUSE (assimp-devel, crane, ffmpeg-4, freetype2, helm, kernel, kured, python-Django, python-Jinja2, python311-Django4, and tomcat), and Ubuntu (alpine, djoser, libxslt, postgresql-9.5, and valkey).

Cloudflare named a leader in Web Application Firewall Solutions in 2025 Forrester report

Post Syndicated from Daniele Molteni original https://blog.cloudflare.com/cloudflare-named-leader-waf-forrester-2025/

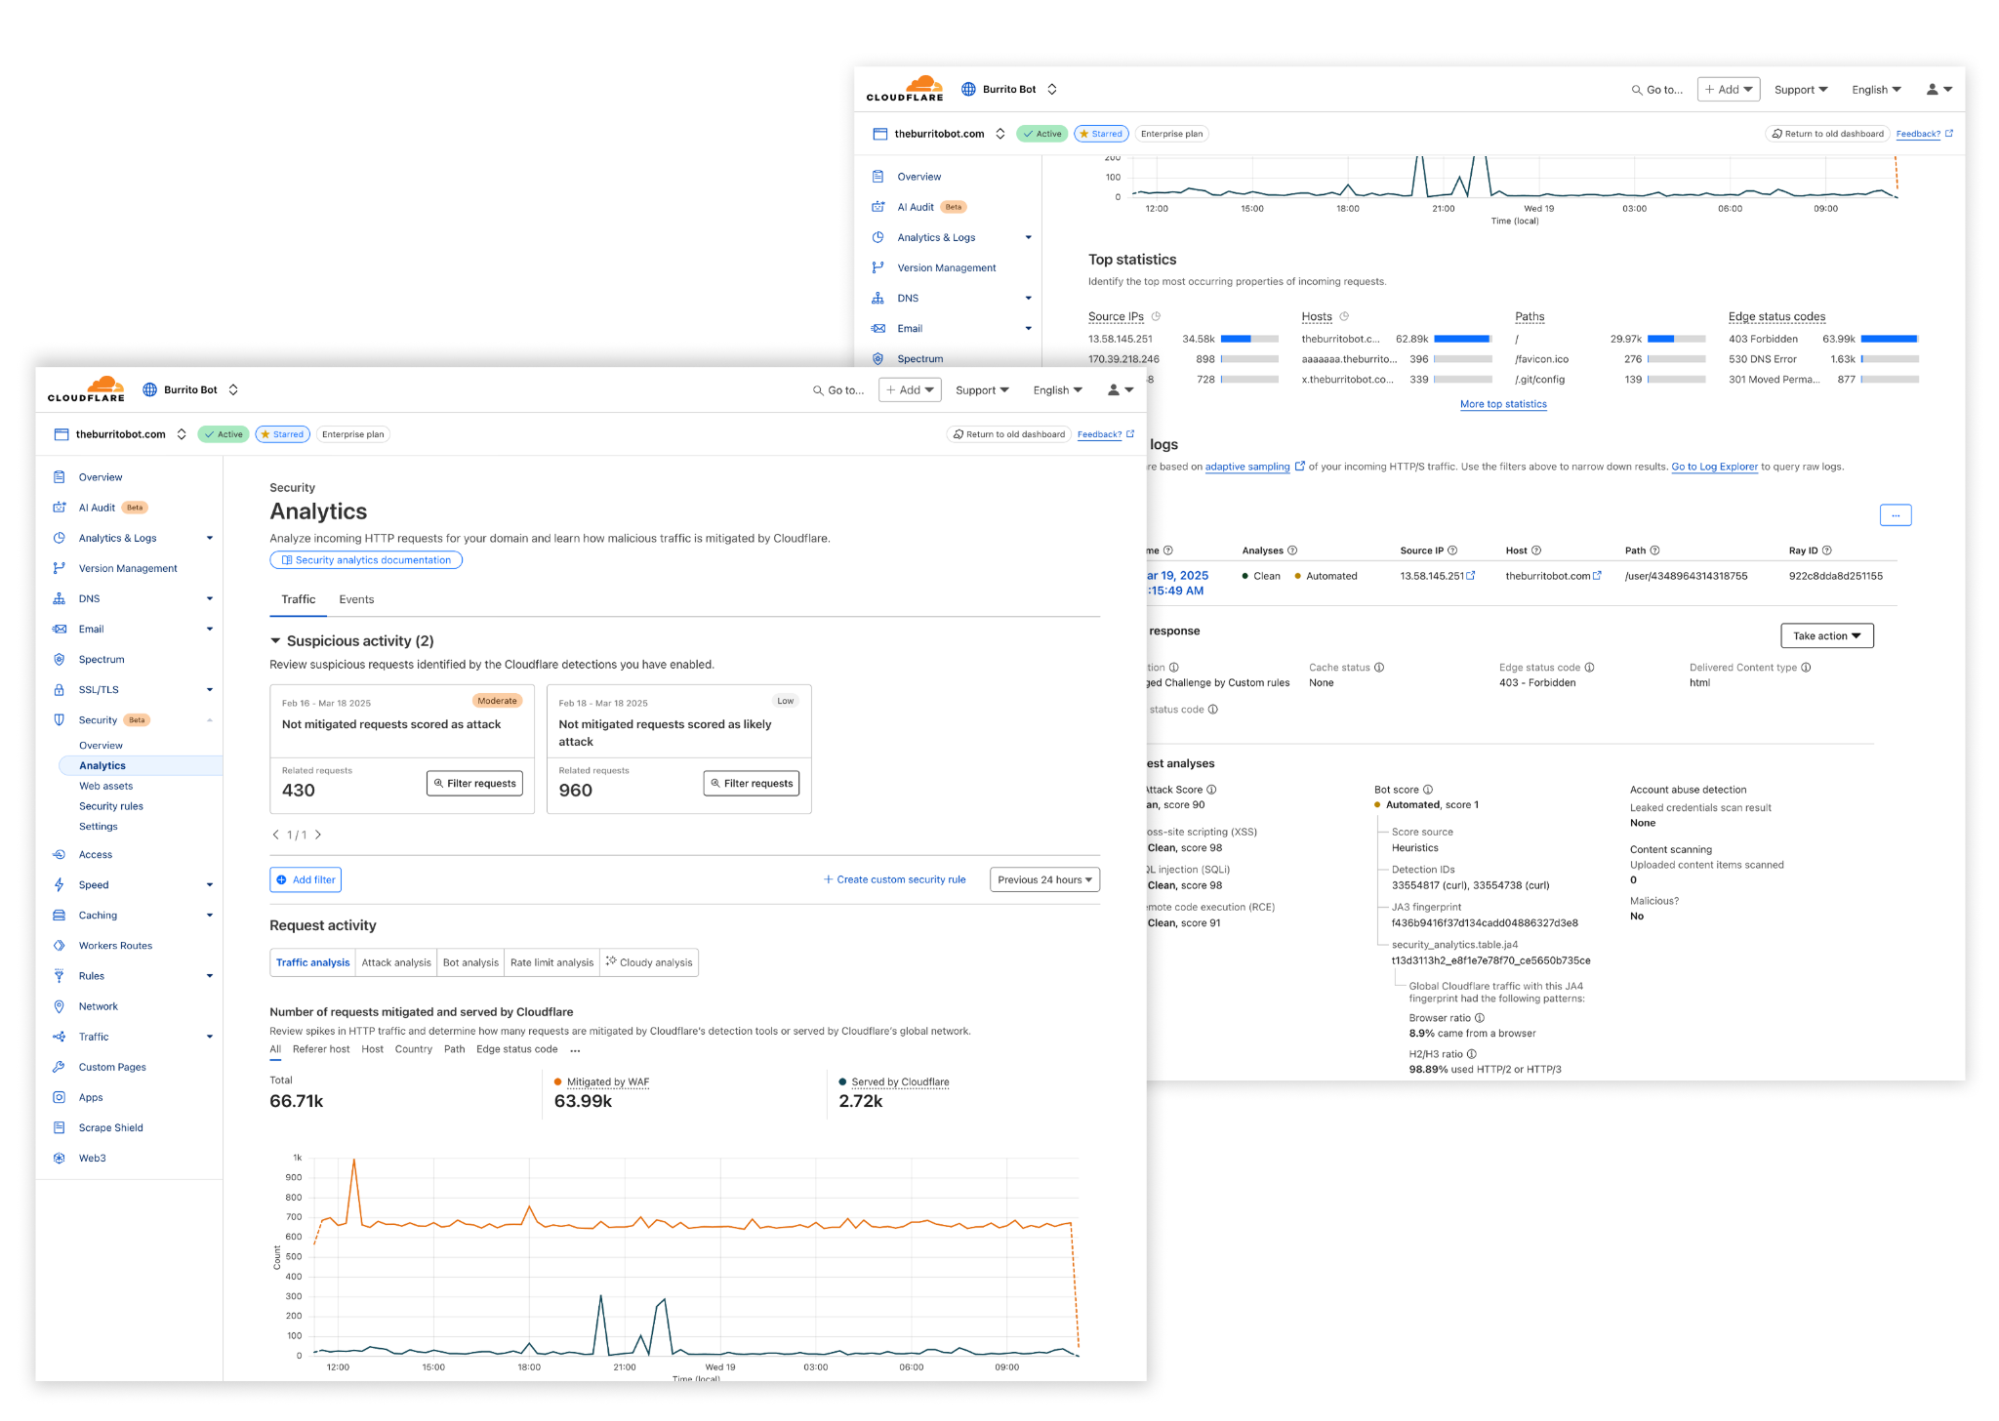
Forrester Research has recognized Cloudflare as a Leader in it’s The Forrester Wave™: Web Application Firewall Solutions, Q1 2025 report. This market analysis helps security and risk professionals select the right solution for their needs. According to Forrester: 

“Cloudflare is a strong option for customers that want to manage an easy-to-use, unified web application protection platform that will continue to innovate.”

In this evaluation, Forrester assessed 10 Web Application Firewall (WAF) vendors across 22 criteria, including product security and vision. We believe this recognition is due to our continued investment in our product offering. Get a complimentary copy of the report here.

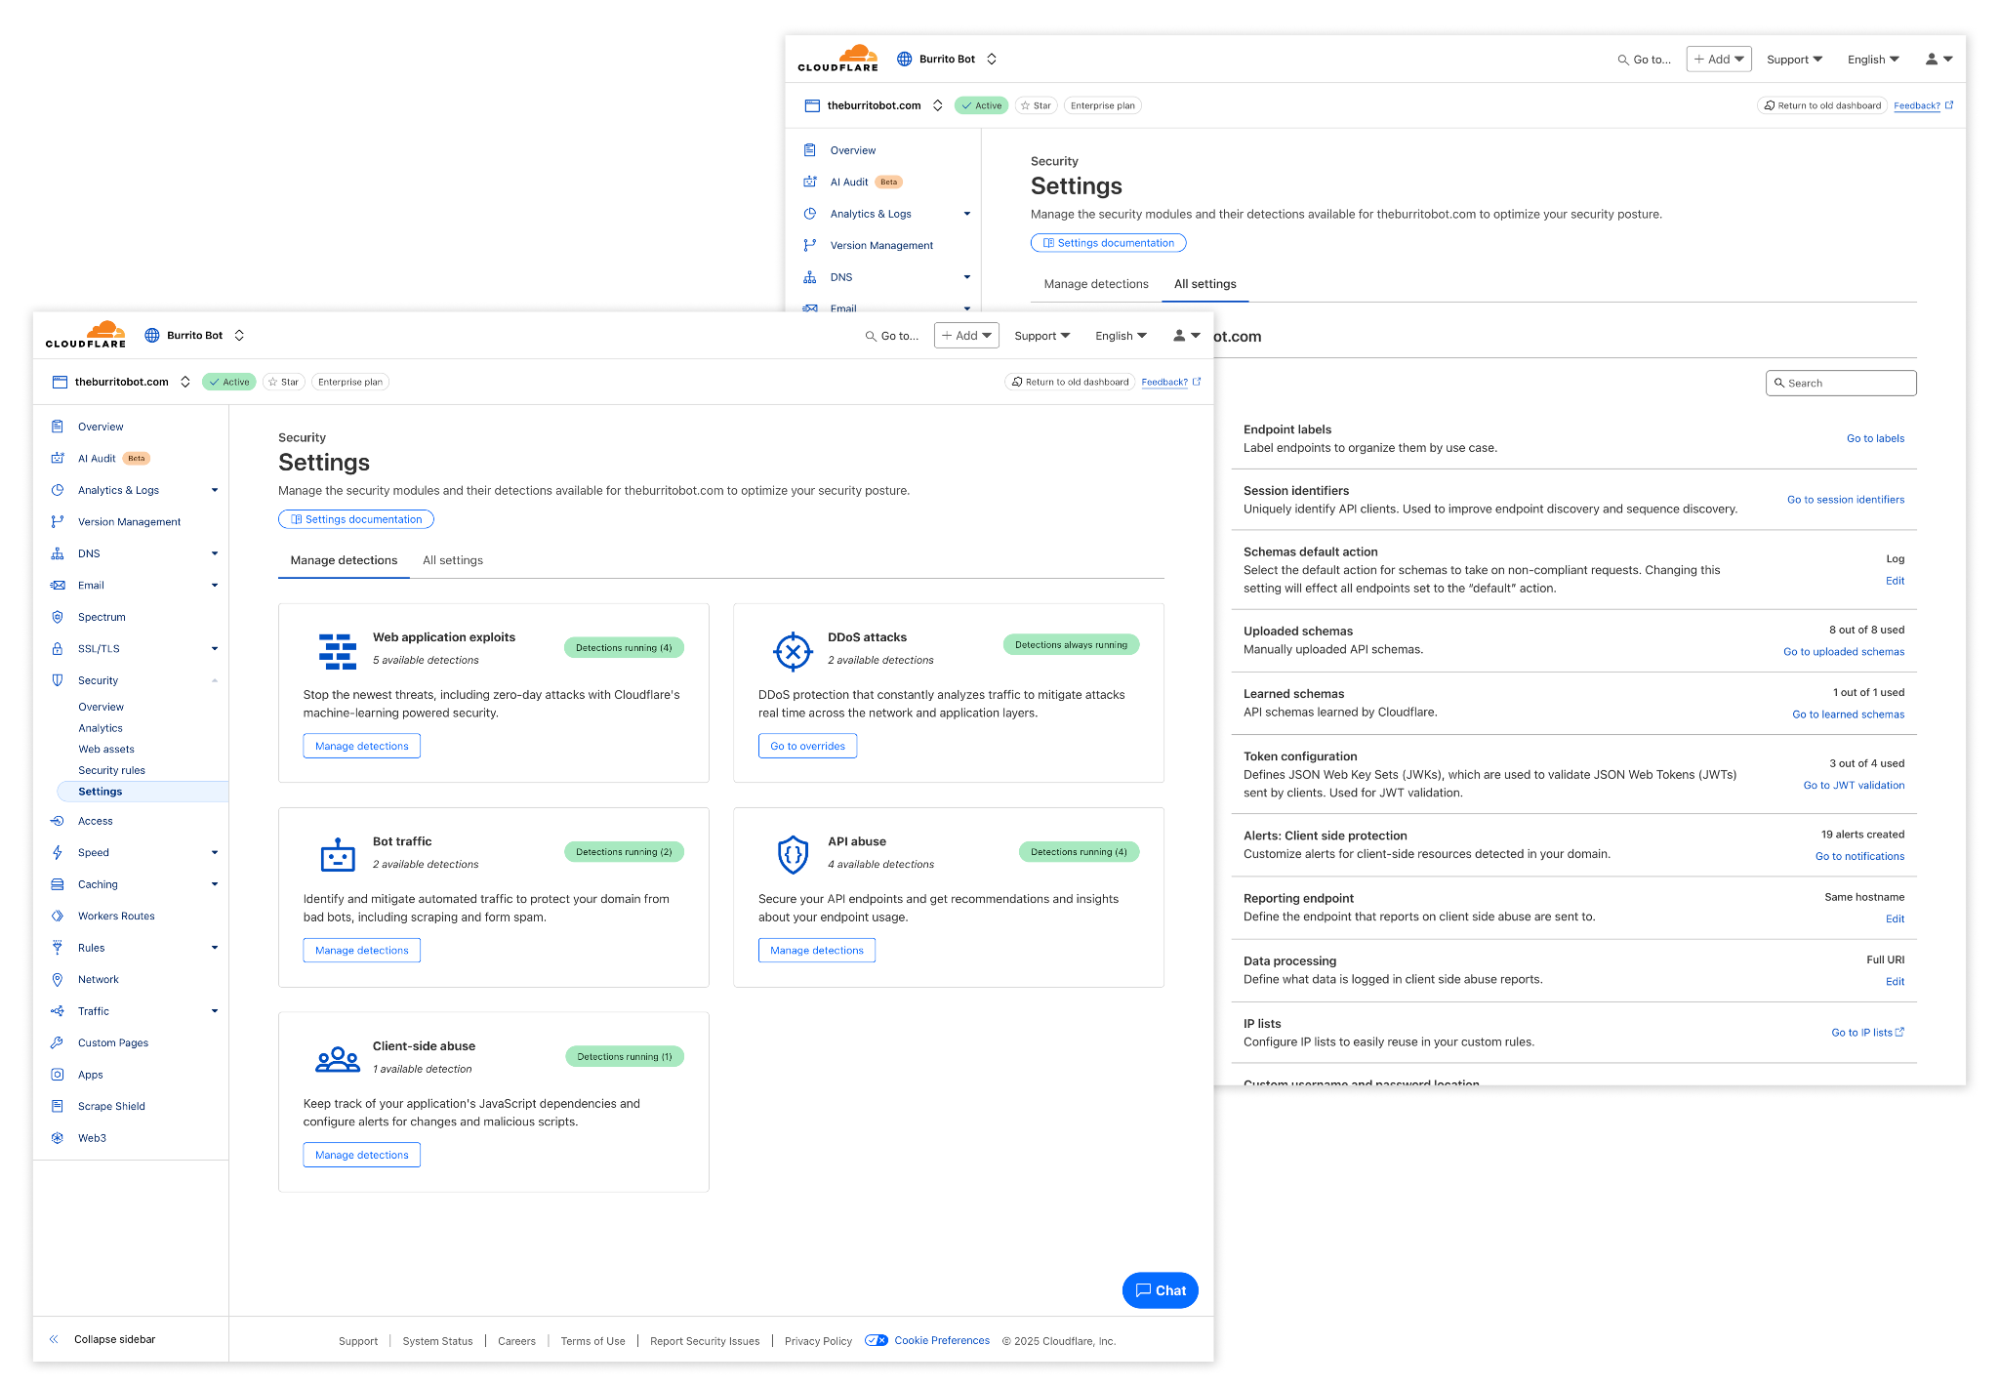
Since introducing our first WAF in 2013, Cloudflare has transformed it into a robust, enterprise-grade Application Security platform. Our fully integrated suite includes WAF, bot mitigation, API security, client-side protection, and DDoS mitigation, all built on our expansive global network. By leveraging AI and machine learning, we deliver industry-leading security while enhancing application performance through our content delivery and optimization solutions.

According to the Forrester report, “Cloudflare stands out with features that help customers work more efficiently.” Unlike other solutions in the market, Cloudflare’s WAF, API Security, bot detection, client-side security, and DDoS protection are natively integrated within a single platform, running on a unified engine. Our integrated solution empowers a seamless user experience and enables advanced threat detection across multiple vectors to meet the most demanding security requirements.

Cloudflare: a standout in Application Security

Forrester’s evaluation of Web Application Firewall solutions is one of the most comprehensive assessments in the industry. We believe this report highlights Cloudflare’s integrated global cloud platform and our ability to deliver enterprise-grade security without added complexity. We don’t just offer a WAF — we provide a flexible, customizable security toolkit designed to address your unique application security challenges.

Cloudflare continuously leads the WAF market through our strategic vision and the breadth of our capabilities. We center our approach on relentless innovation, delivering industry-leading security features, and ensuring a seamless management experience with enterprise processes and tools such as Infrastructure as Code (IaC) and DevOps. Our predictable cadence of major feature releases, powered by annual initiatives like Security Week and Birthday Week, ensures that customers always have access to the latest security advancements.

We believe Forrester also highlighted Cloudflare’s extensive security capabilities, with particular recognition of the significant improvements in our API security offerings.

Cloudflare’s top-ranked criteria

In the report, Cloudflare received the highest possible scores in 15 out of 22 criteria, reinforcing, in our opinion, our commitment to delivering the most advanced, flexible and easy-to-use web application protection in the industry. Some of the key criteria include:

  • Detection models: Advanced AI and machine learning models that continuously evolve to detect new threats.

  • Layer 7 DDoS protection: Industry-leading mitigation of sophisticated application-layer attacks.

  • Rule creation and modification: Simple, easy to use rule creation experience, propagating within seconds globally.

  • Management UI: An intuitive and efficient user interface that simplifies security management.

  • Product security: A robust architecture that ensures enterprise-grade security.

  • Infrastructure-as-code support: Seamless integration with DevOps workflows for automated security policy enforcement.

  • Innovation: A forward-thinking approach to security, consistently pushing the boundaries of what’s possible.

What sets Cloudflare apart?

First, Cloudflare’s WAF goes beyond traditional rule-based protections, offering a comprehensive suite of detection mechanisms to identify attacks and vulnerabilities across web and API traffic while also safeguarding client environments. We leverage AI and machine learning to detect threats such as attacks, automated traffic, anomalies, and compromised JavaScript, among others. Our industry-leading application-layer DDoS protection makes volumetric attacks a thing of the past.

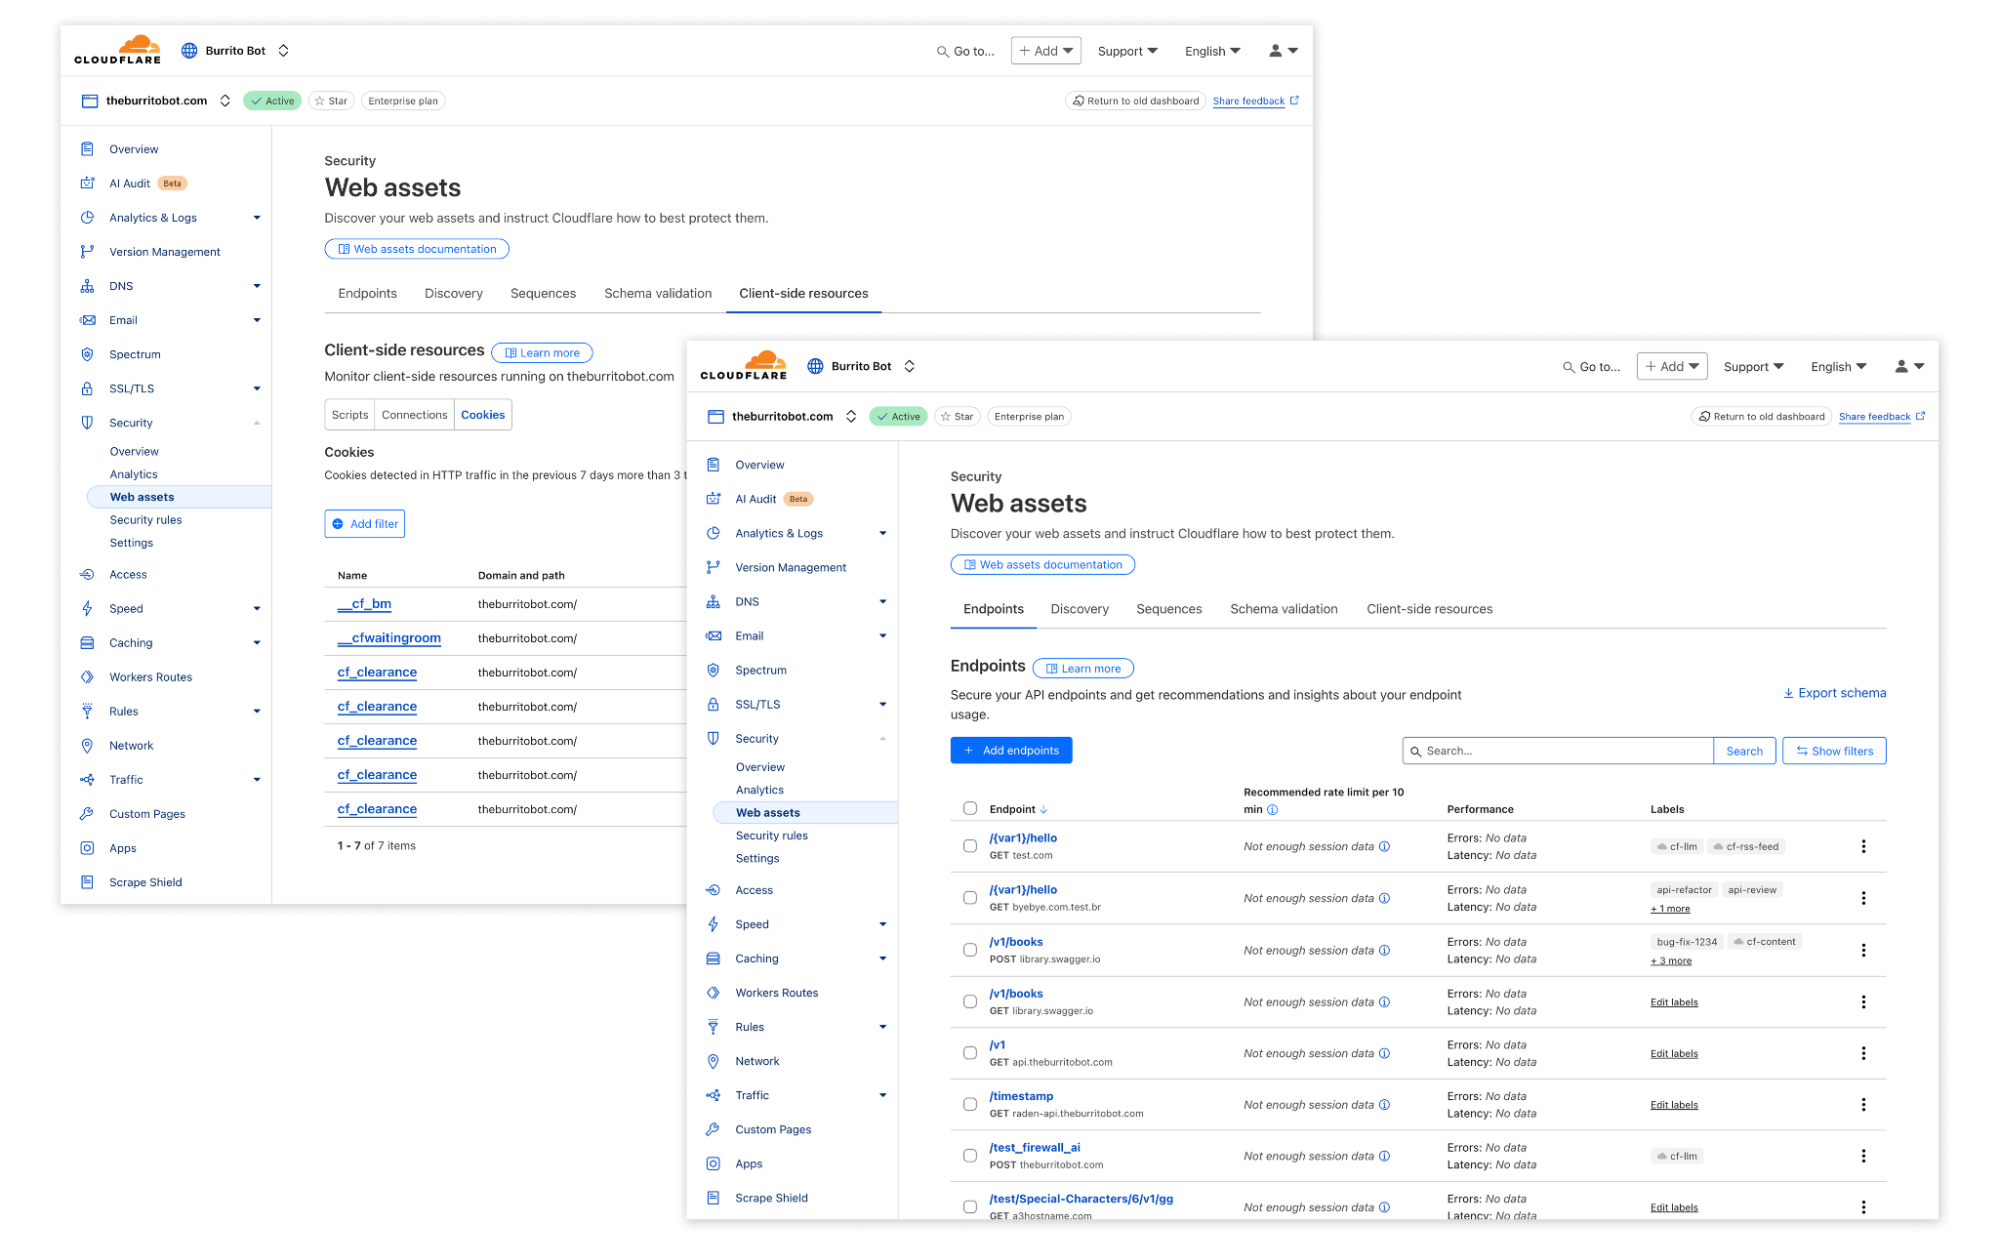
Second, Cloudflare has also made significant strides in API security. Our WAF can be supercharged with features such as: API discovery, schema validation & sequence mitigation, volumetric detection, and JWT authentication. 

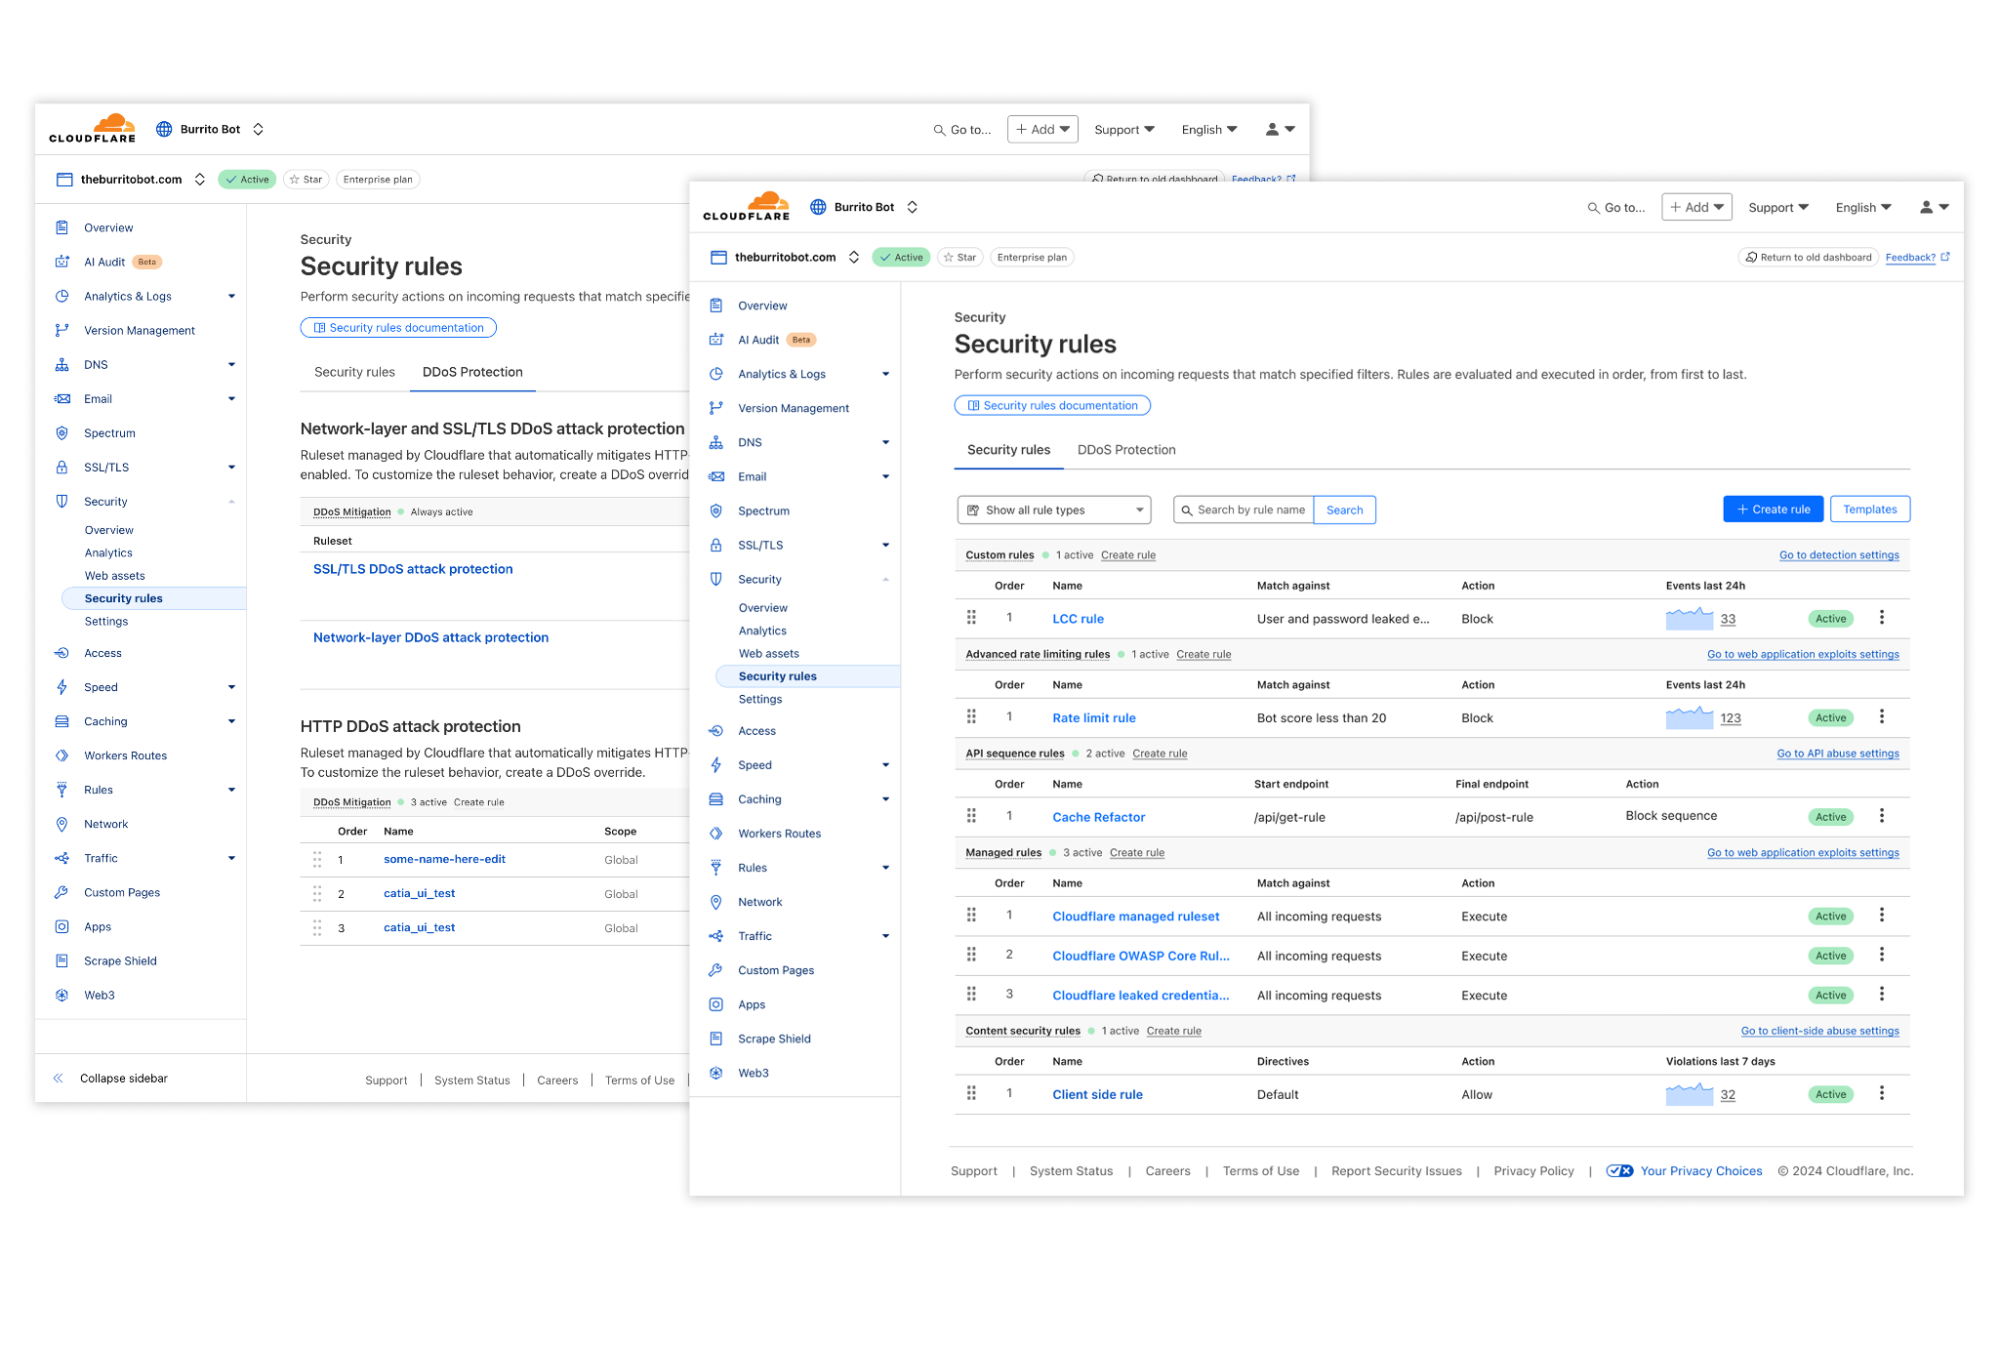
Third, Cloudflare simplifies security management with an intuitive dashboard that is easy to use while still offering powerful configurations for advanced practitioners. All features are Terraform-supported, allowing teams to manage the entire Cloudflare platform as code. With Security Analytics, customers gain a comprehensive view of all traffic, whether mitigated or not, and can run what-if scenarios to test new rules before deployment. This analytic capability ensures that businesses can dynamically adapt their security posture while maintaining high performance. To make security management even more seamless, our AI agent, powered by Natural Language Processing (NLP), helps users craft and refine custom rules and create powerful visualizations within our analytics engine.

Cloudflare: the clear choice for modern security

We are confident that Forrester’s report validates what our customers already know: Cloudflare is a leading WAF vendor, offering unmatched security, innovation, and ease of use. As threats continue to evolve, we remain committed to pushing the boundaries of web security to protect organizations worldwide.

If you’re looking for a powerful, scalable, and easy-to-manage web application firewall, Cloudflare is the best choice for securing your applications, APIs, and infrastructure.

Ready to enhance your security?

Learn more about Cloudflare WAF by creating an account today and see why Forrester has recognized us as a leader in the market. 

Forrester does not endorse any company, product, brand, or service included in its research publications and does not advise any person to select the products or services of any company or brand based on the ratings included in such publications. Information is based on the best available resources. Opinions reflect judgment at the time and are subject to change. For more information, read about Forrester’s objectivity here .

Master architecture decision records (ADRs): Best practices for effective decision-making

Post Syndicated from Christoph Kappey original https://aws.amazon.com/blogs/architecture/master-architecture-decision-records-adrs-best-practices-for-effective-decision-making/

Architecture decision records (ADRs) help you document and communicate important process and architecture decisions in your engineering projects. Based on our experience implementing over 200 ADRs across multiple projects, we’ve developed best practices that can help you streamline your decision-making processes and improve team collaboration.

In this post, you’ll learn:

  • How to implement ADRs in your organization
  • Best practices based on more than 200 ADRs across multiple projects
  • Practical tips for streamlining architectural decision-making
  • Real-world examples from projects with 10 to more than 100 team members

Common challenges in architecture decision-making

Before implementing ADRs, your teams might face these common challenges:

  1. Team alignment – Development teams spend a huge part of their time (20 –30%, based on our project experience of the past 3 years) coordinating with other teams, which can slow down feature deployment and increase costs through repeated architecture refactoring
  2. Design flexibility – Finding the right balance between upfront design and evolving architecture when working with agile and DevOps approaches
  3. Nonfunctional requirements – Making trade-offs between security, maintainability, and scalability requirements
  4. Changing requirements – Adapting architectural decisions to evolving business goals while maintaining system integrity
  5. Knowledge transfer – Onboard new team members efficiently and make sure they follow the team’s current way of working

How to streamline the decision-making process

We base the recommendations in this post on our experience with several projects, working with teams with fewer than 10 team members as well as complex projects with 100 team members across 10 work streams. We embarked on ambitious projects with a green-field start as well as projects covering ongoing development of new features in production. Especially in teams with 100 people contributing to the code base, we faced the challenge of making sure that collaboration was seamless and decision-making consistent.

To address this challenge, we implemented an ADR mechanism, which served as our guiding light throughout the project’s lifecycle. After more than 3 years of following this approach, we’ve amassed a wealth of experience and best practices that we’re excited to share with the software development community. By capturing the context, alternatives considered, and the rationale behind each decision, ADRs foster transparency, knowledge-sharing, and accountability within teams. Our goal is to guide you through the process of writing effective ADRs with the following best practice recommendations:

  1. Keep ADR meetings short and focused – Effective ADR meetings should be concise and time-bound. Aim to keep them 30–45 minutes maximum. This focused approach keeps discussions on track and participants engaged throughout the process.
  2. Embrace the readout meeting style – Adopt the readout meeting style, where participants spend 10–15 minutes reading the ADR document. Encourage attendees to provide written comments on sections, paragraphs, or sentences that require clarification or where they have differing opinions. This approach promotes active engagement and fosters a bias for action and frugality.
  3. Maintain a cross-functional yet lean participant list – Invite representatives from each team that might be affected by the architectural decision but strive to keep the total number of participants below 10. This cross-functional representation provides diverse perspectives while maintaining a lean and efficient decision-making process, aligning with the principles of frugality and bias for action.
  4. Focus on a single decision – Keep ADRs concise by focusing on a single decision. Don’t hesitate to split up decisions if necessary. Concentrating on one decision at a time simplifies the decision-making process so that participants can thoroughly evaluate the impact during readout sessions. This approach aligns with the principles of ownership and customer obsession.
  5. Separate design from decision – Use a separate design document mechanism to explore alternative options thoroughly. Reference these design documents within the ADR, adhering to the principles of invention and simplification.
  6. Address comments and resolve feedback – Actively follow up on comments received during the ADR review process. Resolve all comments, either by incorporating changes or by discussing and reaching a consensus with the comment author. This practice demonstrates a commitment to delivering results and fostering a sense of ownership.
  7. Push for a timely decision – Avoid prolonged discussions and multiple readout meetings. Based on our experience, one to three ADR readouts should be sufficient. If more sessions are required, reevaluate the dependencies and consider reducing the number of invitees or reducing the scope of the ADR. Most of the decisions are two-way door decisions, meaning that they can be changed with little impact in the future. It’s always better to make a decision and try it fast instead of endlessly discussing it. This approach aligns with the AWS principles of working backwards, customer obsession, delivering results, and being right a lot.
  8. Embrace team collaboration – Approving an ADR is a team effort. The author must own the document and gather feedback from all affected teams before finalizing the decision. This practice encourages having backbone, disagreeing and committing, and fostering a collaborative environment.
  9. Maintain and follow the process – Keep ADRs up to date and follow the established process. If an ADR supersedes a previous one, document the change and link the new ADR in the superseded document. Insist on the highest standards by adhering to the defined processes—consider ADRs as a team law.
  10. Centralize ADR storage – Store ADRs in a central location accessible to all project members, regardless of their team affiliation. This practice promotes transparency and makes sure that architectural decisions are readily available to everyone involved.

Implementation tips and success measures

When implementing these practices, we recommend that you start small with a pilot team, create clear templates, and establish review cycles. Defining success measures such as the time to decision, team satisfaction, architecture rework reduction, or cross-team collaboration improvement help to evaluate your decision-making process

Conclusion

By implementing these best practices for ADRs, you’ll streamline your decision-making processes, foster collaboration, and make sure that architectural decisions are well-documented, communicated, and aligned with your organization’s principles and goals. Embrace these practices and witness the positive impact they have on the success of your software projects.

Read the AWS Prescriptive Guidance for an introduction into ADRs and an example ADR or the homepage of ADR GitHub organization.


About the Authors

Pilot light with reserved capacity: How to optimize DR cost using On-Demand Capacity Reservations

Post Syndicated from Antoine Boucherie original https://aws.amazon.com/blogs/architecture/pilot-light-with-reserved-capacity-how-to-optimize-dr-cost-using-on-demand-capacity-reservations/

For digital enterprises to remain competitive, resilience is essential for maintaining reliability and building customer trust. End users expect applications to be available 24 hours a day, leading companies to develop increasingly sophisticated methods to provide continuous operation of critical services. Some companies, such as financial services companies, have to meet regulatory requirements such as Digital Operational Resilience Act (DORA) and are expected to manage the risk of outsourcing critical applications. They must design for high availability and plan for potential impairments. By proactively planning for potential disruptions, they’re not just mitigating risks – they’re building trust and delivering unparalleled value to their customers.

When assessing your own applications, you should define a set of objectives, perform a business impact analysis and a risk assessment. This way, you can estimate the impact to the business if the application isn’t available. This results in categorization of the applications and influence their design according to the AWS resilience lifecycle framework. Each application is given a specific Recovery Point Objective (RPO) and Recovery Time Objective (RTO), depending on its criticality for the business.

Not all applications fall in the most critical category. You allocate resources according to the results of the assessment and make trade-offs when designing applications. For example, you’ll have a more stringent RTO and RPO for—and be willing to spend more time and money on—a critical application than on a less critical application. The challenge becomes how to minimize the risk of breaching a specific RTO while optimizing for resources, such as cost and operational complexity.

At AWS, we provide guidance through the Well-Architected Framework and specifically within the Reliability pillar. Disruption can happen at several levels, and we recommend that you explore and prepare for four types of disruptions in the AWS Resilience Hub: application, infrastructure, Availability Zone, and AWS Region.

We recommend that you use managed services and make sure that all production workloads are designed to take advantage of multiple Availability Zones in AWS Regions. If your application also needs to be protected against the unlikely risk of Regional impairment, you should consider a multi-Region disaster recovery (DR) strategy.

You can select from several DR strategies: backup and restore, pilot light, warm standby, and multi-site active-active:

  • Backup and restore – This strategy might not provide the necessary RPO or RTO required for a highly critical application.
  • Multi-site active-active – This strategy increases significantly the cost and operational complexity of your application.
  • Pilot light – This strategy allows for a RPO or RTO in the tens of minutes by having the data asynchronously copied to the secondary Region and ready to be accessed. However, unlike a warm standby, the application servers aren’t deployed and aren’t ready to serve traffic. The pilot light strategy allows for a lower cost but brings a risk that you might not be able to provision the compute capacity you need when you want to fail over to the secondary Region, especially if you require a specific instance type.

In this post, we explore an intermediate strategy between the pilot light and the warm standby strategies: pilot light with reserved capacity. You can use this strategy to reserve compute capacity in a secondary Region while also limiting cost.

The following diagram illustrates where the pilot light with reserved capacity solution lies in the spectrum of disaster recovery strategies.

spectrum of disaster recovery strategies

Reserving capacity, on demand

On-Demand Capacity Reservations were launched in 2018. They make it possible to reserve capacity in the Availability Zone of your choice without a long-term contract. You have the flexibility to create, modify, or cancel reservations at your discretion. It’s especially well-suited if your application is dependent on a specific instance type or size.

Optimizing the cost of On-Demand Capacity Reservations with a Savings Plan

On-Demand Capacity Reservations is a reservation mechanism and doesn’t require a commitment. However, you can optimize your spending by combining the capacity reservation with an AWS Savings Plan. By using Savings Plans, you can achieve up to a 72% discount, a very significant cost reduction for DR instances that have to stay available all year long.

Optimizing the cost of On-Demand Capacity Reservations by sharing Capacity Reservations

To further optimize the cost, you can use your reserved capacity in another account when you don’t need it for DR.

Here’s an example in which we share On-Demand Capacity Reservations with our development and test account:

We have a three-tier application running in production in a primary AWS Region. This application is composed of a load balancer forwarding traffic to a fleet of application servers running on Amazon Elastic Compute Cloud (Amazon EC2) instances, backed by an Amazon Relational Database Service (Amazon RDS) database. All services used by this application are configured to use multiple Availability Zones in this primary Region.

We use the pilot light strategy, so the application data is being replicated to the disaster recovery environment in a secondary Region using Amazon RDS cross-Region read replicas. However, the load balancer and EC2 services aren’t running in DR to limit cost and operational complexity. Following best practices, each environment is running in a different AWS account.

The following diagram illustrates the pilot light strategy setup for our example.

pilot light strategy setup for our example

To reserve capacity in case of failover to the secondary Region, we create an On-Demand Capacity Reservation in the DR account, according to our baseline compute capacity. Because we don’t need this capacity until we fail over the application from the primary to the secondary Region, we share those On-Demand Capacity Reservations with a development and test account hosting our nonproduction environment in the secondary Region. On-Demand Capacity Reservations are Availability Zone specific (and hence Region specific) and can be shared with either AWS accounts or AWS Organizations using AWS Resource Access Manager (AWS RAM).

Best practices are to share those On-Demand Capacity Reservations with a nonproduction organizational unit (OU) within an organization or to directly share with the account(s) hosting the testing environments (for example, user acceptance testing or preproduction). Those environments are usually very similar to the production account in baseline sizing, in order to perform load and performance testing. This is an important point: you want to be able to retrieve those On-Demand Capacity Reservations when needed without impacting other critical applications.

The following diagram illustrates the Capacity Reservations sharing with the development and test account.

Capacity Reservation sharing with development and test account

If an impairment affects our production environment in the primary Region, we can trigger failover to the secondary Region. To reclaim capacity, we need to terminate the EC2 instances running in our development and test account. Capacity becomes available nearly immediately after these instances are successfully terminated. Separately, we can also stop the sharing of On-Demand Capacity Reservations to make sure that the development and test account can’t consume that capacity again. Know that merely unsharing your reservation without terminating development and test instances might not result in complete or immediate capacity retrieval. This is because when you unshare an On-Demand Capacity Reservation, the instances in the consumer account continue to run, and capacity is only returned to the owner account if additional capacity is available in the Amazon EC2 service on-demand pool.

The following diagram illustrates the failover to the DR environment in a secondary Region.

cancellation of the capacity reservations sharing

Steps

Here is a possible approach to take advantage of On-Demand Capacity Reservations to reduce the application’s total infrastructure cost:

  1. Calculate the baseline compute capacity necessary for the DR environment in the secondary Region in the event of failover, including the compute that might already be running in this secondary Region for data stores (for example, a Kafka broker running on Amazon EC2). How much vCPU and RAM is required or what are the exact EC2 instances necessary to host the whole application in case of failover of the production from the primary to the secondary Region.
  2. Create an On-Demand Capacity Reservation for the exact EC2 instances that the application need as a baseline in the DR account. Capacity Reservation Fleet is also a possible choice to reserve capacity across multiple instance types, which is often the case for Amazon Elastic Kubernetes Service (Amazon EKS) or Amazon Elastic Container Service (Amazon ECS) clusters, for example. Creating a Capacity Reservation Fleet will create multiple Capacity Reservations that can be shared independently. It’s also recommended to apply for Savings Plans on those On-Demand Capacity Reservations to save up to 72%.
  3. Share those On-Demand Capacity Reservations from the DR account to one or several accounts, depending on your need. In our example, we share the On-Demand Capacity Reservations with the development and test account, effectively allowing the development and test environment to use compute capacity that has already been reserved.
  4. In case of impairment in the primary Region, terminate the development and test instances first and then stop the On-Demand Capacity Reservation sharing The DR account will recover those reservations. If you want to keep the development and test instances, you will be charged at the on-demand rate.
  5. Redeploy in an automated manner the application in the DR account on new EC2 instances behind a load balancer.

Benefits

By purchasing On-Demand Capacity Reservations in the DR account, you make sure that you always have Amazon EC2 capacity access when required and for as long as you need it. By sharing those On-Demand Capacity Reservations with another AWS account or organization, you can share the cost of the application’s compute capacity with other environments, reducing your application’s total cost of ownership. The additional cost of the DR instances can even reach zero, if your instances are completely consumed by nonproduction environments such as development and testing.

DR savings over On-Demand
Compute Savings Plan – 1 year, no upfront Around 27% (for example, for m7i instance)
Compute Savings Plan – 3 years, all upfront Up to 66%
Instance Savings Plan – 3 years, all upfront Up to 72%
Reservation shared and consumed 100% by development and test environment Up to 100%

Limits

Although you can reserve DR capacity at a minimal cost using the pilot light with reserved capacity solution, there are some limits to keep in mind.

Firstly, we advise looking at this solution only if the Recovery Time Objective of the application, in case of Regional disruption, is in hours because you need to take into account the time needed to:

  • Detect the impairment in the primary Region.
  • Trigger the failover procedure.
  • Terminate the used instances to retrieve capacity (estimated time in minutes)
  • Stop the On-Demand Capacity Reservations sharing and automatically retrieve them in the DR account (estimated time in minutes).
  • Launch the compute infrastructure with the necessary application software in the DR account. You need to make sure that it matches the On-Demand Capacity Reservations according to the criteria used (open or targeted)

If your application requires a lower RTO, we recommend exploring the warm standby strategy.

Secondly, this strategy can only be used for application servers running EC2 instances and ECS or EKS clusters on EC2 because On-Demand Capacity Reservations aren’t available for managed services such as AWS Fargate or AWS Lambda. For those managed services, we recommend having them up and running like in a warm standby strategy, with a minimum baseline capacity that you’re comfortable with.

Thirdly, it requires some nonproduction development and test usage in the selected secondary Region to use the shared On-Demand Capacity Reservation.

Finally, it’s important to consider that this solution brings some complexity and extra operational work. You should plan well ahead, automate the operational tasks where possible, but most importantly, regularly test that the failover of the application works according to plan. We encourage you to perform your own game days to support your operational resilience.

Deciding whether this strategy is a good fit for your application will ultimately be a decision based on your business and regulatory requirements.

Conclusion

In this post, we explained how to reserve capacity in a secondary Region using On-Demand Capacity Reservations. We highlighted how cost can be optimized using Savings Plans and by sharing reserved capacity with noncritical workloads. We saw how we can recover that capacity for the DR environment, in the event of a disaster, to allow the application to continue to serve end users. We looked at the benefits and limits of the pilot light with reserved capacity solution and the necessary steps to put it in place.


About the Authors

Simplify allowlist management and lock down origin access with Cloudflare Aegis

Post Syndicated from Mia Malden original https://blog.cloudflare.com/aegis-deep-dive/

Today, we’re taking a deep dive into Aegis, Cloudflare’s origin protection product, to help you understand what the product is, how it works, and how to take full advantage of it for locking down access to your origin. We’re excited to announce the availability of Bring Your Own IPs (BYOIP) for Aegis, a customer-accessible Aegis API, and a gradual rollout for observability of Aegis IP utilization.

If you are new to Cloudflare Aegis, let’s take a step back and understand the product’s purpose and security benefits, process, and how it came to be. 

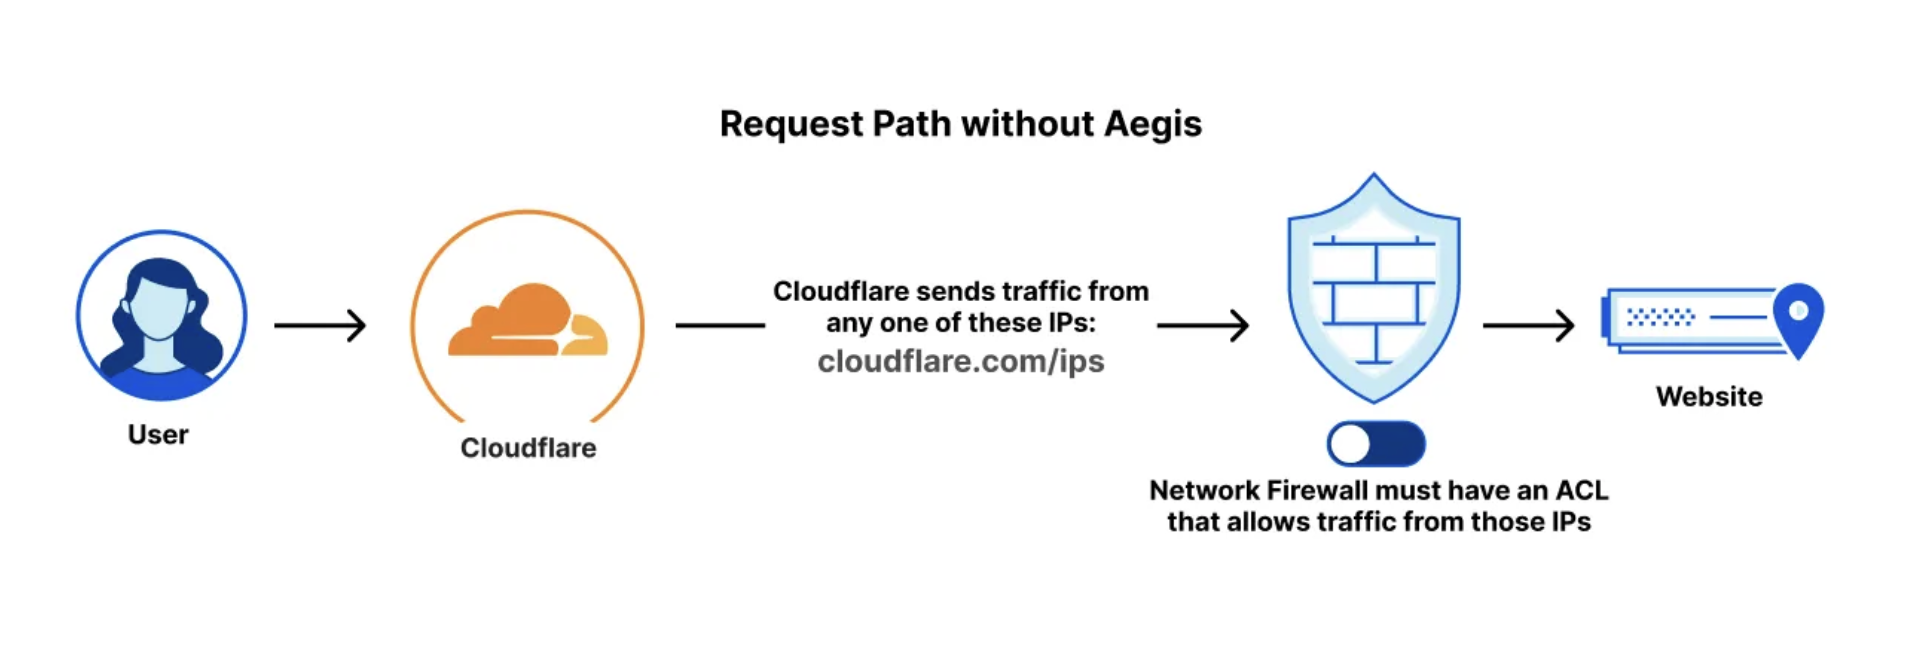
Origin protection then…

Allowlisting a specific set of IP addresses has long existed as one of the simplest ways of restricting access to a server. This firewall mechanism is a starting state that just about every server supports. As we built Cloudflare’s network, one of the first features that customers requested was the ability to restrict access to their origin, so only Cloudflare could make requests to it. Back then, the most natural way to support this was to tell our customers which IP addresses belong to us, so they could allowlist those in their origin firewall. To that end, we have published our IP address ranges, providing an easy configuration to ensure that all traffic accessing your origin comes from Cloudflare’s network.


However, Cloudflare’s IP ranges are used across multiple Cloudflare services and customers, so restricting access to the full list doesn’t necessarily give customers the security benefit they need. With the frequency and scale of IP-based and DDoS attacks every day, origin protection is absolutely paramount. Some customers have the need for more stringent security precautions to ensure that traffic is only coming from Cloudflare’s network and, more specifically, only coming from their zones within Cloudflare.

Origin protection now…

Cloudflare has built out additional services to lock down access to your origin, like authenticated origin pulls (mTLS) and Cloudflare Tunnels, that no longer rely on IP addresses as an indicator of identity. These are part of a global effort towards Zero Trust security: whereas the Internet used to operate under a trust-but-verify model, we aim to operate as nothing is trusted, and everything is verified. 

Having non-ephemeral IP addresses — upon which the firewall allowlist mechanism relies — does not quite fit the Zero Trust system. Although mTLS and similar solutions present a more modern approach to origin security, they aren’t always feasible for customers, depending on their hardware or system architecture. 

We launched Cloudflare Aegis in March 2023 for customers seeking an intermediary security solution. Aegis provides a dedicated IP address, or set of addresses, from which Cloudflare sends requests, allowing you to further lock down your origin’s layer 3 firewall. Aegis also simplifies management by only requiring you to allowlist a small number of IP addresses.


Normally, Cloudflare’s publicly listed IP ranges are used to egress from Cloudflare’s network to the customer origin. With these IP addresses distributed across Cloudflare’s network, the customer traffic can egress from many servers to the customer origin.


With Aegis, a customer does not necessarily have an Aegis IP address on every server if they are using IPv4. That means requests must be routed through Cloudflare’s network to a server where Aegis IP addresses are present before the traffic can egress to the customer origin. 


How requests are routed with Aegis

A few terms, before we begin:

  • Anycast: a technology where each of our data centers “announces” and can handle the same IP address ranges

  • Unicast: a technology where each server is given its own, unique unicast IP address

Dedicated egress Aegis IPs are located in a particular set of specific data centers. This list is handpicked by the customer, in conversation with Cloudflare, to be geographically close to their origin servers for optimal security and performance in tandem. 

Aegis relies on a technology called soft-unicasting, which allows us to share a /32 egress IPv4 amongst many servers, thereby enabling us to spread a single subnet across many data centers. Then, the traffic going back from the origin servers (the return path) is routed to their closest data center. Once in Cloudflare’s network, our in-house L4 XDP-based load balancer, Unimog, ensures that the return packets make it back to the machine that connected to the origin servers at the start.

This supports fast, local, and reliable egress from Cloudflare’s network. With this configuration, we essentially use Anycast at the BGP layer before using an IP and port range to reach a specific machine in the correct data center. Across Cloudflare’s network, we use a significant range of egress IPs to cover all data centers and machines. Since Aegis customers only have a few IPv4 addresses, the range is limited to a few data centers rather than Cloudflare’s entire egress IP range.


The capacity issue

Every IP address has 65,535 ports. A request egresses from exactly one port on the Aegis IP address to exactly one port on the origin IP address. 

Each TCP request consists of a 4-way tuple that contains:

  1. Source IP address

  2. Source port

  3. Destination IP address

  4. Destination port

A UDP request can also consist of a 4-way tuple (if it’s connected) or a 2-way tuple (if it’s unconnected), simply including a bind IP address and port. Aegis supports both TCP and UDP traffic — in either case, the requests rely upon IP:port pairings between the source and destination. 

When a request reaches the origin, it opens a connection, through which data can pass between the source and destination. One source port can sustain multiple connections at a time, only if the destination ip:ports are different. 

Normally at Cloudflare, an IP address establishes connections to a variety of different destination IP ports or addresses to support high traffic volumes. With Aegis, that is no longer the case. The challenge with Aegis IP capacity is exactly that: all the traffic is egressing to the same (or a small set of) origin IP address(es) from the same (or a small set of) source IP address(es). That means Aegis IP addresses have capacity constraints associated with them.

The number of concurrent connections is the number of simultaneous connections for a given 4-way tuple. Between one client and one server, the volume of concurrent connections is inherently limited by the number of ports on an IP address to 65,535 — each source ip:port can only support a single outbound connection per destination IP:port. In practice, that maximum number of concurrent connections is often lower due to assignments of port ranges across many servers and imperfect load distribution. 

For planning purposes, we use an estimate of ~80% of the IP capacity (the volume of concurrent connections a source IP address can support to a destination IP address) to protect against overload, in case of traffic spikes. If every port on an IP address is maintaining a concurrent connection, that address would reach and exceed capacity — it would be overloaded with port usage exhaustion. Requests may then be dropped since no new connections can be established. To build in resiliency, we only plan to support 40k concurrent connections per Aegis IP address per origin.

Aegis with IPv6

Each customer who onboards with Cloudflare Aegis receives two /64 prefixes to be globally allocated and announced. That means, outside of Cloudflare’s China Network, every Cloudflare data center has hundreds or even thousands of addresses reserved for egressing your traffic directly to your origin. Without Aegis, any data center in Cloudflare’s Anycast network can serve as a point of egress – so we built Aegis with IPv6 to preserve that level of resiliency and performance. The sheer scale of IPv6, with its available address space, allows us to cushion Aegis’ capacity to a point far beyond any reasonable concern. Globally allocating and announcing your Aegis IPv6 addresses maintains all of Cloudflare’s functionality as a reverse proxy without inducing additional friction.

Aegis with IPv4

Although using IPv6 with Aegis facilitates the best possible speed and resiliency for your traffic, we recognize the transition from IPv4 to IPv6 can be challenging for some customers. Moreover, some customers prefer Aegis IPv4 for granular control over their traffic’s physical egress locations. Still, IPv4 space is more limited and more expensive — while all Cloudflare Aegis customers simply receive two dedicated /64s for IPv6, enabling Aegis with IPv4 requires a touch more tailoring. When you onboard to Aegis, we work with you to determine the ideal number of IPv4 addresses for your Aegis configuration to maintain optimal performance and resiliency, while also ensuring cost efficiency. 

Naturally, this introduces a bottleneck — whereas every Cloudflare data center can serve as a point of egress with Aegis IPv6, only a small fraction will have that capability with Aegis IPv4. We aim to mitigate this impact by careful provisioning of the IPv4 addresses. 

Now that BYOIP for Aegis is supported, you can also onboard an entire IPv4 /24 prefix or IPv6 /64 for Aegis, allowing for a cost-effective configuration with a much higher volume of capacity.

When we launched Aegis, each IP address was allocated to one data center, requiring at least two IPv4 addresses for appropriate resiliency. To reduce the number of IP addresses necessary in your layer 3 firewall allowlist, and to manage the cost to the customer of leasing IPs, we expanded our Aegis functionality so that one address can be announced from up to four data centers. To do this, we essentially slice the available IP port range into four subsets and provision each at a unique data center. 

A quick refresher: when a request travels through Cloudflare, it first hits our network via an ingress data center. The ingress data center is generally near the eyeball, who is sending the request. Then, the request is routed following BGP – or Argo Smart Routing, when enabled – to an exit, or egress, data center. The exit data center will generally fall in close geographic proximity to the request’s destination, which is the customer origin. This mitigates latency induced by the final hop from Cloudflare’s network to your origin.

With Aegis, the possible exit data centers are limited to the data centers in which an Aegis IP address has been allocated. For IPv6, this is a non-issue, since every data center outside our China Network is covered. With IPv4, however, the exit data centers are limited to a much smaller number (4 x the number of Aegis IPs). Aegis IP addresses are allocated, then, to data centers in close geographic proximity to your origin(s). This maximizes the likelihood that whichever data centers would ordinarily have been selected as the egress data center are already announcing Aegis IP addresses. Theoretically, no extra hop is necessary from the optimal exit data center to an Aegis-enabled data center – they are one and the same. In practice, this cannot be guaranteed 100% of the time because optimal routes are ever-changing. We recommend IPv6 to ensure optimal performance because of this possibility of an extra hop with IPv4.

A brief comparison, to summarize:

Aegis IPv4

Aegis IPv6

Physical points of egress

4 physical data center sites (1-2 cities near origin) per IP address

All 300+ Cloudflare locations (excluding China network)

Capacity

One IPv4 address per 40,000 concurrent connections per origin

Two /64 prefixes for all Aegis customers (>36 quintillion IP addresses)

~50,000x capacity of IPv4 config

Pricing model

Monthly fee based on IPv4 leases or BYOIP for Aegis prefix fees

Included with product purchase or BYOIP for Aegis prefix fees

Now, with Aegis analytics coming soon, customers can monitor and manage their IP address usage by Cloudflare data centers in aggregate. Every Cloudflare data center will now run a service with the sole purpose of calculating and reporting Aegis usage for each origin IP:port at regular intervals. Written to an internal database, these reports will be aggregated and exposed to customers via Cloudflare’s GraphQL Analytics API. Several aggregation functions will be available, such as average usage over a period of time, or total summed usage.

This will allow customers to track their own IP address usage to further optimize the distribution of traffic and addresses across different points of presence for IPv4. Additionally, the improved observability will support customer-created notifications via RSS feeds such that you can design your own notification thresholds for port usage.

How Aegis benefits from connection reuse & coalescence

As we mentioned earlier, requests egress from the source IP address to the destination IP address only when a connection has been established between the two. In early Internet protocols, requests and connections were 1:1. Now, once that connection is open, it can remain open and support hundreds or thousands of requests between that source and destination via connection reuse and connection coalescing. 

Connection reuse, implemented by HTTP/1.1, allows for requests with the same source ip:port and destination IP:port to pass through the same connection to the origin. A “simple” website by modern standards can send hundreds of requests just to load initially; by streamlining these into a single origin connection, connection reuse reduces the latency derived from constantly opening and closing new connections between two endpoints. Still, any request from a different domain would need to create a new, unique connection to communicate with the origin. 

As of HTTP/2, connection coalescing can group requests from different domains into one connection if the requests have the same destination IP address and the server certificate is authoritative for both domains. Depending on the traffic patterns routing from the eyeball to an Aegis IP address, the volume of connection reuse & coalescence can vary. One connection most likely facilitates the traffic of many requests, but each connection requires at least one request to open it in the first place. Therefore, the worst possible ratio between concurrent connections and concurrent requests is 1:1. 

In practice, a 1:1 ratio between connections and requests almost never happens. Connection reuse and connection coalescence are very common but highly variable, due to sporadic traffic patterns. We size our Aegis IP address allocations accordingly, erring on the conservative side to minimize risk of capacity overload. With the proper number of dedicated egress IP addresses and optimal allocation to Cloudflare points of presence, we are able to lock down your origin with IPv4 addresses to block malicious layer 7 traffic and reduce overall load to your origin. 

Connection reuse and coalescence pairs well with Aegis to reduce load on the origin’s side as well. Because a request can be reused if it comes from the same source IP:port and shares a destination IP:port, routing traffic from a reduced number of source IP addresses (Aegis addresses, in this case) to your origin facilitates a smaller number of total connections. Not only does this improve security by limiting open connection access, but also it reduces latency since fewer connections need to be opened. Maintaining fewer connections is also less resource intensive — more connections means more CPU and more memory handling the inbound requests. By reducing the number of connections to the origin through reuse and coalescence, HTTP/2 lowers the overall cost of operation by optimizing resource usage. 

Recap and recommendations

Cloudflare Aegis locks down your origin by restricting access via your origin’s layer 3 firewall. By routing traffic from Cloudflare’s network to your origin through dedicated egress IP addresses, you can ensure that requests coming from Cloudflare are legitimate customer traffic. With a simple flip-switch configuration — allow listing your Aegis IP addresses in your origin’s firewall — you can block excessive noise and bad actors from access. So, to help you take full advantage of Aegis, let’s recap:

  • Concurrent connections can be, at worst, a 1:1 ratio to concurrent requests.

  • Cloudflare bases our IP address usage recommendations on 40,000 concurrent connections to minimize risk of capacity overload.

  • Each Aegis IP address supports an estimated 40,000 concurrent connections per origin IP address.

Additionally, we’re excited to now support:

For customers leasing Cloudflare-owned Aegis IP addresses, the Aegis API will allow you to enable and disable Aegis on zones within your parent account (parent being the account which owns the IP lease). If you deploy your Aegis IP addresses across multiple accounts, you’ll still rely on Cloudflare’s account team to enable and disable Aegis on zones within those additional accounts.

For customers who leverage BYOIP for Aegis, the Aegis API will allow you to enable and disable Aegis on zones within your parent account and within any accounts to which you delegate prefix permissions. We recommend BYOIP for Aegis for improved configurability and cost efficiency. 

BYOIP

Cloudflare-owned IPs

Enable Aegis on zones on parent account

✓

✓

Enable Aegis on zones beyond parent account

✓

✗

Disable Aegis on zones on parent account

✓

✓

Disable Aegis on zones beyond parent account

✓

✗

Access Aegis analytics via the API

✓

✓

With the improved Aegis observability, all Aegis customers will be able to monitor their port usage by IP address, account, zone, and data centers in aggregate via the API. You will also be able to ingest these metrics to configure your own, customizable alerts based on certain port usage thresholds. Alongside the new configurability of Aegis, this visibility will better equip customers to manage their Aegis deployments themselves and alert us to any changes, rather than the other way around.

We also have a few adjacent recommendations to optimize your Aegis configuration. We generally encourage the following best practices for security hygiene for your origin and traffic as well.

  1. IPv6 Compatibility: if your origin(s) support IPv6, you will experience even better resiliency, performance, and availability with your dedicated egress IP addresses at a lower overall cost.

  2. HTTP/2 or HTTP/3 adoption: by supporting connection reuse and coalescence, you will reduce overall load to your origin and latency in the path of your request.

  3. Multi-level origin protection: while Aegis protects your origin at the application level, it pairs well with Access and CNI, Authenticated Origin Pulls, and/or other Cloudflare products to holistically protect, verify, and facilitate your traffic from edge to origin.

If you or your organization want to enhance security and lock down your origin with dedicated egress IP addresses reach out to your account team to onboard today.

Introducing Cloudy, Cloudflare’s AI agent for simplifying complex configurations

Post Syndicated from Alex Dunbrack original https://blog.cloudflare.com/introducing-ai-agent/

It’s a big day here at Cloudflare! Not only is it Security Week, but today marks Cloudflare’s first step into a completely new area of functionality, intended to improve how our users both interact with, and get value from, all of our products.

We’re excited to share a first glance of how we’re embedding AI features into the management of Cloudflare products you know and love. Our first mission? Focus on security and streamline the rule and policy management experience. The goal is to automate away the time-consuming task of manually reviewing and contextualizing Custom Rules in Cloudflare WAF, and Gateway policies in Cloudflare One, so you can instantly understand what each policy does, what gaps they have, and what you need to do to fix them.

Meet Cloudy, Cloudflare’s first AI agent

Our initial step toward a fully AI-enabled product experience is the introduction of Cloudy, the first version of Cloudflare AI agents, assistant-like functionality designed to help users quickly understand and improve their Cloudflare configurations in multiple areas of the product suite. You’ll start to see Cloudy functionality seamlessly embedded into two Cloudflare products across the dashboard, which we’ll talk about below.

And while the name Cloudy may be fun and light-hearted, our goals are more serious: Bring Cloudy and AI-powered functionality to every corner of Cloudflare, and optimize how our users operate and manage their favorite Cloudflare products. Let’s start with two places where Cloudy is now live and available to all customers using the WAF and Gateway products.

WAF Custom Rules

Let’s begin with AI-powered overviews of WAF Custom Rules. For those unfamiliar, Cloudflare’s Web Application Firewall (WAF) helps protect web applications from attacks like SQL injection, cross-site scripting (XSS), and other vulnerabilities. 

One specific feature of the WAF is the ability to create WAF Custom Rules. These allow users to tailor security policies to block, challenge, or allow traffic based on specific attributes or security criteria.

However, for customers with dozens or even hundreds of rules deployed across their organization, it can be challenging to maintain a clear understanding of their security posture. Rule configurations evolve over time, often managed by different team members, leading to potential inefficiencies and security gaps. What better problem for Cloudy to solve?


Powered by Workers AI, today we’ll share how Cloudy will help review your WAF Custom Rules and provide a summary of what’s configured across them. Cloudy will also help you identify and solve issues such as:

  • Identifying redundant rules: Identify when multiple rules are performing the same function, or using similar fields, helping you streamline your configuration.

  • Optimising execution order: Spot cases where rules ordering affects functionality, such as when a terminating rule (block/challenge action) prevents subsequent rules from executing.

  • Analysing conflicting rules: Detect when rules counteract each other, such as one rule blocking traffic that another rule is designed to allow or log.

  • Identifying disabled rules: Highlight potentially important security rules that are in a disabled state, helping ensure that critical protections are not accidentally left inactive.

Cloudy won’t just summarize your rules, either. It will analyze the relationships and interactions between rules to provide actionable recommendations. For security teams managing complex sets of Custom Rules, this means less time spent auditing configurations and more confidence in your security coverage.

Available to all users, we’re excited to show how Cloudflare AI Agents can enhance the usability of our products, starting with WAF Custom Rules. But this is just the beginning.

Cloudflare One Firewall policies


We’ve also added Cloudy to Cloudflare One, our SASE platform, where enterprises manage the security of their employees and tools from a single dashboard.

In Cloudflare Gateway, our Secure Web Gateway offering, customers can configure policies to manage how employees do their jobs on the Internet. These Gateway policies can block access to malicious sites, prevent data loss violations, and control user access, among other things.

But similar to WAF Custom Rules, Gateway policy configurations can become overcomplicated and bogged down over time, with old, forgotten policies that do who-knows-what. Multiple selectors and operators working in counterintuitive ways. Some blocking traffic, others allowing it. Policies that include several user groups, but carve out specific employees. We’ve even seen policies that block hundreds of URLs in a single step. All to say, managing years of Gateway policies can become overwhelming.

So, why not have Cloudy summarize Gateway policies in a way that makes their purpose clear and concise?

Available to all Cloudflare Gateway users (create a free Cloudflare One account here), Cloudy will now provide a quick summary of any Gateway policy you view. It’s now easier than ever to get a clear understanding of each policy at a glance, allowing admins to spot misconfigurations, redundant controls, or other areas for improvement, and move on with confidence.

Built on Workers AI

At the heart of our new functionality is Cloudflare Workers AI (yes, the same version that everyone uses!) that leverages advanced large language models (LLMs) to process vast amounts of information; in this case, policy and rules data. Traditionally, manually reviewing and contextualizing complex configurations is a daunting task for any security team. With Workers AI, we automate that process, turning raw configuration data into consistent, clear summaries and actionable recommendations.

How it works

Cloudflare Workers AI ingests policy and rule configurations from your Cloudflare setup and combines them with a purpose-built LLM prompt. We leverage the same publicly-available LLM models that we offer our customers, and then further enrich the prompt with some additional data to provide it with context. For this specific task of analyzing and summarizing policy and rule data, we provided the LLM:

  • Policy & rule data: This is the primary data itself, including the current configuration of policies/rules for Cloudy to summarize and provide suggestions against.

  • Documentation on product abilities: We provide the model with additional technical details on the policy/rule configurations that are possible with each product, so that the model knows what kind of recommendations are within its bounds.

  • Enriched datasets: Where WAF Custom Rules or CF1 Gateway policies leverage other ‘lists’ (e.g., a WAF rule referencing multiple countries, a Gateway policy leveraging a specific content category), the list item(s) selected must be first translated from an ID to plain-text wording so that the LLM can interpret which policy/rule values are actually being used.

  • Output instructions: We specify to the model which format we’d like to receive the output in. In this case, we use JSON for easiest handling.

  • Additional clarifications: Lastly, we explicitly instruct the LLM to be sure about its output, valuing that aspect above all else. Doing this helps us ensure that no hallucinations make it to the final output.

By automating the analysis of your WAF Custom Rules and Gateway policies, Cloudflare Workers AI not only saves you time but also enhances security by reducing the risk of human error. You get clear, actionable insights that allow you to streamline your configurations, quickly spot anomalies, and maintain a strong security posture—all without the need for labor-intensive manual reviews.

What’s next for Cloudy

Beta previews of Cloudy are live for all Cloudflare customers today. But this is just the beginning of what we envision for AI-powered functionality across our entire product suite.

Throughout the rest of 2025, we plan to roll out additional AI agent capabilities across other areas of Cloudflare. These new features won’t just help customers manage security more efficiently, but they’ll also provide intelligent recommendations for optimizing performance, streamlining operations, and enhancing overall user experience.

We’re excited to hear your thoughts as you get to meet Cloudy and try out these new AI features – send feedback to us at [email protected], or post your thoughts on X, LinkedIn, or Mastodon tagged with #SecurityWeek! Your feedback will help shape our roadmap for AI enhancement, and bring our users smarter, more efficient tooling that helps everyone get more secure.


Watch on Cloudflare TV

Making Application Security simple with a new unified dashboard experience

Post Syndicated from Michael Tremante original https://blog.cloudflare.com/new-application-security-experience/

Over the years, we have framed our Application Security features against market-defined product groupings such as Web Application Firewall (WAF), DDoS Mitigation, Bot Management, API Security (API Shield), Client Side Security (Page Shield), and so forth. This has led to unnecessary artificial separation of what is, under the hood, a well-integrated single platform.

This separation, which has sometimes guided implementation decisions that have led to different systems being built for the same purpose, makes it harder for our users to adopt our features and implement a simple effective security posture for their environment.

Today, following user feedback and our drive to constantly innovate and simplify, we are going back to our roots by breaking these artificial product boundaries and revising our dashboard, so it highlights our strengths. The ultimate goal remains: to make it shockingly easy to secure your web assets.

Introducing a new unified Application Security experience.

If you are a Cloudflare Application Security user, log in to the dashboard today and try out the updated dashboard interface. To make the transition easier, you can toggle between old and new interfaces.


Security, simplified

Modern applications are built using a variety of technologies. Your app might include a web interface and a mobile version, both powered by an API, each with its own unique security requirements. As these technologies increasingly overlap, traditional security categories like Web, API, client-side, and bot protection start to feel artificial and disconnected when applied to real-world application security.

Consider scenarios where you want to secure your API endpoints with proper authentication, or prevent vulnerability scanners from probing for weaknesses. These tasks often require switching between multiple dashboards, creating different policies, and managing disjointed configurations. This fragmented approach not only complicates workflows but also increases the risk of overlooking a critical vulnerability. The result? A security posture that is harder to manage and potentially less effective.

When you zoom out, a pattern emerges. Whether it’s managing bots, securing APIs, or filtering web traffic, these solutions ultimately analyze incoming traffic looking for specific patterns, and the resulting signal is used to perform actions. The primary difference between these tools is the type of signal they generate, such as identifying bots, enforcing authorization, or flagging suspicious requests. 

At Cloudflare, we saw an opportunity to address this complexity by unifying our application security tools into a single platform with one cohesive UI. A unified approach means security practitioners no longer have to navigate multiple interfaces or piece together different security controls. With a single UI, you can configure policies more efficiently, detect threats faster, and maintain consistent protection across all aspects of your application. This simplicity doesn’t just save time, it ensures that your applications remain secure, even as threats evolve.

At the end of the day, attackers won’t care which product you’re using. But by unifying application security, we ensure they’ll have a much harder time finding a way in.

Many products, one common approach

To redefine the experience across Application Security products, we can start by defining three concepts that commonly apply:

  • Web traffic (HTTP/S), which can be generalised even further as “data”

  • Signals and detections, which provide intelligence about the traffic. Can be generalised as “metadata”

  • Security rules that let you combine any signal or detection (metadata), to block, challenge or otherwise perform an action on the web traffic (data)

We can diagram the above as follows:


Using these concepts, all the product groupings that we offer can be converted to different types of signals or detections. All else remains the same. And if we are able to run and generate our signals on all traffic separately from the rule system, therefore generating all the metadata, we get what we call always-on detections, another vital benefit of a single platform approach. Also note that the order in which we generate the signals becomes irrelevant.

In diagram form:


The benefits are twofold. First, problem spaces (such as account takeover or web attacks) become signal groupings, and therefore metadata that can be queried to answer questions about your environment.

For example, let’s take our Bot Management signal, the bot score, and our WAF Attack Score signal, the attack score. These already run as always-on detections at Cloudflare. By combining these two signals and filtering your traffic against them, you can gain powerful insights on who is accessing your application*:


Second, as everything is just a signal, the mitigation layer, driven by the optional rules, becomes detection agnostic. By providing the same signals as fields in a unified rule system, writing high level policies becomes a breeze. And as we said earlier, given the detection is always-on and fully separated from the mitigation rule system, exploring the data can be thought of as a powerful rule match preview engine. No need to deploy a rule in LOG mode to see what it matches!

We can now design a unified user experience that reflects Application Security as a single product.

* note: the example here is simplistic, and the use cases become a lot more powerful once you expand to the full set of potential signals that the platform can generate. Take, for example, our ability to detect file uploads. If you run a job application site, you may want to let crawlers access your site, but you may *not* want crawlers to submit applications on behalf of applicants. By combining the bot score signal with the file upload signal, you can ensure that rule is enforced.

Introducing a unified Application Security experience

As signals are always-on, the user journey can now start from our new overview page where we highlight security suggestions based on your traffic profile and configurations. Alternatively, you can jump straight into analytics where you can investigate your traffic using a combination of all available signals.

When a specific traffic pattern seems malicious, you can jump into the rule system to implement a security policy. As part of our new design, given the simplicity of the navigation, we also took advantage of the opportunity to introduce a new web assets page, where we highlight discovery and attack surface management details.

Of course, reaching the final design required multiple iterations and feedback sessions. To best understand the balance of maintaining flexibility in the UI whilst reducing complexity, we focused on customer tasks to be done and documenting their processes while trying to achieve their intended actions in the dashboard. Reducing navigation items and using clear naming was one element, but we quickly learned that the changes needed to support ease of use for tasks across the platform.

Here is the end result:


To recap, our new dashboard now includes:

  • One overview page where misconfigurations, risks, and suggestions are aggregated

  • Simplified and redesigned security analytics that surfaces security signals from all Application Security capabilities, so you can easily identify and act on any suspicious activity

  • A new web assets page, where you can manage your attack surfaces, helping improve detection relevance

  • A single Security Rules page that provides a unified interface to manage, prioritise, and customise all mitigation rules in your zone, significantly streamlining your security configuration

  • A new settings page where advanced control is based on security needs, not individual products

Let’s dive into each one.

Overview

With the unified security approach, the new overview page aggregates and prioritizes security suggestions across all your web assets, helping you maintain a healthy security posture. The suggestions span from detected (ongoing) attacks if there are any, to risks and misconfigurations to further solidify your protection. This becomes the daily starting point to manage your security posture.


Analytics

Security Analytics and Events have been redesigned to make it easier to analyze your traffic. Suspicious activity detected by Cloudflare is surfaced at the top of the page, allowing you to easily filter and review related traffic. From the Traffic Analytics Sampled Log view, further below in the page, new workflows enable you to take quick action to craft a custom rule or review related security events in context.


Web assets

Web assets is a new concept introduced to bridge your business goals with threat detection capabilities. A web asset is any endpoint, file, document, or other related entity that we normally would act on from a security perspective. Within our new web asset page, you will be able to explore all relevant discovered assets by our system.

With our unified security platform, we are able to rapidly build new use-case driven threat detections. For example, to block automated actions across your e-commerce website, you can instruct Cloudflare’s system to block any fraudulent signup attempts, while allowing verified crawlers to index your product pages. This is made possible by labelling your web assets, which, where possible, is automated by Cloudflare, and then using those labels to power threat detections to protect your assets.


Security rules

The unified Security rules interface brings all mitigation rule types — including WAF custom rules, rate limiting rules, API sequence rules, and client side rules — together in one centralized location, eliminating the need to navigate multiple dashboards.

The new page gives you visibility into how Cloudflare mitigates both incoming traffic and blocks potentially malicious client side resources from loading, making it easier to understand your security posture at a glance. The page allows you to create customised mitigation rules by combining any detection signals, such as Bot Score, Attack Score, or signals from Leaked Credential Checks, enabling precise control over how Cloudflare responds to potential threats.


Settings

Balancing guidance and flexibility was the key driver for designing the new Settings page. As much as Cloudflare guides you towards the optimal security posture through recommendations and alerts, customers that want the flexibility to proactively adjust these settings can find all of them here.


Experience it today

This is the first of many enhancements we plan to make to the Application Security experience in the coming months. To check out the new navigation, log in to the Cloudflare dashboard, click on “Security” and choose “Check it out” when you see the message below. You will still have the option of opting out, if you so prefer.

Let us know what you think either by sharing feedback in our community forum or by providing feedback directly in the dashboard (you will be prompted if you revert to the old design).

Watch on Cloudflare TV

HTTPS-only for Cloudflare APIs: shutting the door on cleartext traffic

Post Syndicated from Suleman Ahmad original https://blog.cloudflare.com/https-only-for-cloudflare-apis-shutting-the-door-on-cleartext-traffic/

Connections made over cleartext HTTP ports risk exposing sensitive information because the data is transmitted unencrypted and can be intercepted by network intermediaries, such as ISPs, Wi-Fi hotspot providers, or malicious actors on the same network. It’s common for servers to either redirect or return a 403 (Forbidden) response to close the HTTP connection and enforce the use of HTTPS by clients. However, by the time this occurs, it may be too late, because sensitive information, such as an API token, may have already been transmitted in cleartext in the initial client request. This data is exposed before the server has a chance to redirect the client or reject the connection.

A better approach is to refuse the underlying cleartext connection by closing the network ports used for plaintext HTTP, and that’s exactly what we’re going to do for our customers.

Today we’re announcing that we’re closing all of the HTTP ports on api.cloudflare.com. We’re also making changes so that api.cloudflare.com can change IP addresses dynamically, in line with on-going efforts to decouple names from IP addresses, and reliably managing addresses in our authoritative DNS. This will enhance the agility and flexibility of our API endpoint management. Customers relying on static IP addresses for our API endpoints will be notified in advance to prevent any potential availability issues.

In addition to taking this first step to secure Cloudflare API traffic, we’ll release the ability for customers to opt-in to safely disabling all HTTP port traffic for their websites on Cloudflare. We expect to make this free security feature available in the last quarter of 2025.

We have consistently advocated for strong encryption standards to safeguard users’ data and privacy online. As part of our ongoing commitment to enhancing Internet security, this blog post details our efforts to enforce HTTPS-only connections across our global network. 

Understanding the problem

We already provide an “Always Use HTTPS” setting that can be used to redirect all visitor traffic on our customers’ domains (and subdomains) from HTTP (plaintext) to HTTPS (encrypted). For instance, when a user clicks on an HTTP version of the URL on the site (http://www.example.com), we issue an HTTP 3XX redirection status code to immediately redirect the request to the corresponding HTTPS version (https://www.example.com) of the page. While this works well for most scenarios, there’s a subtle but important risk factor: What happens if the initial plaintext HTTP request (before the redirection) contains sensitive user information?


Initial plaintext HTTP request is exposed to the network before the server can redirect to the secure HTTPS connection.

Third parties or intermediaries on shared networks could intercept sensitive data from the first plaintext HTTP request, or even carry out a Monster-in-the-Middle (MITM) attack by impersonating the web server.

One may ask if HTTP Strict Transport Security (HSTS) would partially alleviate this concern by ensuring that, after the first request, visitors can only access the website over HTTPS without needing a redirect. While this does reduce the window of opportunity for an adversary, the first request still remains exposed. Additionally, HSTS is not applicable by default for most non-user-facing use cases, such as API traffic from stateless clients. Many API clients don’t retain browser-like state or remember HSTS headers they’ve encountered. It is quite common practice for API calls to be redirected from HTTP to HTTPS, and hence have their initial request exposed to the network.

Therefore, in line with our culture of dogfooding, we evaluated the accessibility of the Cloudflare API (api.cloudflare.com) over HTTP ports (80, and others). In that regard, imagine a client making an initial request to our API endpoint that includes their secret API key. While we outright reject all plaintext connections with a 403 Forbidden response instead of redirecting for API traffic — clearly indicating that “Cloudflare API is only accessible over TLS” — this rejection still happens at the application layer. By that point, the API key may have already been exposed over the network before we can even reject the request. We do have a notification mechanism in place to alert customers and rotate their API keys accordingly, but a stronger approach would be to eliminate the exposure entirely. We have an opportunity to improve!

A better approach to API security

Any API key or token exposed in plaintext on the public Internet should be considered compromised. We can either address exposure after it occurs or prevent it entirely. The reactive approach involves continuously tracking and revoking compromised credentials, requiring active management to rotate each one. For example, when a plaintext HTTP request is made to our API endpoints, we detect exposed tokens by scanning for ‘Authorization’ header values.

In contrast, a preventive approach is stronger and more effective, stopping exposure before it happens. Instead of relying on the API service application to react after receiving potentially sensitive cleartext data, we can preemptively refuse the underlying connection at the transport layer, before any HTTP or application-layer data is exchanged. The preventative approach can be achieved by closing all plaintext HTTP ports for API traffic on our global network. The added benefit is that this is operationally much simpler: by eliminating cleartext traffic, there’s no need for key rotation.


The transport layer carries the application layer data on top.

To explain why this works: an application-layer request requires an underlying transport connection, like TCP or QUIC, to be established first. The combination of a port number and an IP address serves as a transport layer identifier for creating the underlying transport channel. Ports direct network traffic to the correct application-layer process — for example, port 80 is designated for plaintext HTTP, while port 443 is used for encrypted HTTPS. By disabling the HTTP cleartext server-side port, we prevent that transport channel from being established during the initial “handshake” phase of the connection — before any application data, such as a secret API key, leaves the client’s machine.


Both TCP and QUIC transport layer handshakes are a pre-requisite for HTTPS application data exchange on the web.

Therefore, closing the HTTP interface entirely for API traffic gives a strong and visible fast-failure signal to developers that might be mistakenly accessing http://… instead of https://… with their secret API keys in the first request — a simple one-letter omission, but one with serious implications.

In theory, this is a simple change, but at Cloudflare’s global scale, implementing it required careful planning and execution. We’d like to share the steps we took to make this transition.

Understanding the scope

In an ideal scenario, we could simply close all cleartext HTTP ports on our network. However, two key challenges prevent this. First, as shown in the Cloudflare Radar figure below, about 2-3% of requests from “likely human” clients to our global network are over plaintext HTTP. While modern browsers prominently warn users about insecure HTTP connections and offer features to silently upgrade to HTTPS, this protection doesn’t extend to the broader ecosystem of connected devices. IoT devices with limited processing power, automated API clients, or legacy software stacks often lack such safeguards entirely. In fact, when filtering on plaintext HTTP traffic that is “likely automated”, the share rises to over 16%! We continue to see a wide variety of legacy clients accessing resources over plaintext connections. This trend is not confined to specific networks, but is observable globally.

Closing HTTP ports, like port 80, across our entire IP address space would block such clients entirely, causing a major disruption in services. While we plan to cautiously start by implementing the change on Cloudflare’s API IP addresses, it’s not enough. Therefore, our goal is to ensure all of our customers’ API traffic benefits from this change as well.


Breakdown of HTTP and HTTPS for ‘human’ connections

The second challenge relates to limitations posed by the longstanding BSD Sockets API at the server-side, which we have addressed using Tubular, a tool that inspects every connection terminated by a server and decides which application should receive it. Operators historically have faced a challenging dilemma: either listen to the same ports across many IP addresses using a single socket (scalable but inflexible), or maintain individual sockets for each IP address (flexible but unscalable). Luckily, Tubular has allowed us to resolve this using ‘bindings’, which decouples sockets from specific IP:port pairs. This creates efficient pathways for managing endpoints throughout our systems at scale, enabling us to handle both HTTP and HTTPS traffic intelligently without the traditional limitations of socket architecture.

Step 0, then, is about provisioning both IPv4 and IPv6 address space on our network that by default has all HTTP ports closed. Tubular enables us to configure and manage these IP addresses differently than others for our endpoints. Additionally, Addressing Agility and Topaz enable us to assign these addresses dynamically, and safely, for opted-in domains.

Moving from strategy to execution

In the past, our legacy stack would have made this transition challenging, but today’s Cloudflare possesses the appropriate tools to deliver a scalable solution, rather than addressing it on a domain-by-domain basis.

Using Tubular, we were able to bind our new set of anycast IP prefixes to our TLS-terminating proxies across the globe. To ensure that no plaintext HTTP traffic is served on these IP addresses, we extended our global iptables firewall configuration to reject any inbound packets on HTTP ports.

iptables -A INPUT -p tcp -d <IP_ADDRESS_BLOCK> --dport <HTTP_PORT> -j REJECT 
--reject-with tcp-reset

iptables -A INPUT -p udp -d <IP_ADDRESS_BLOCK> --dport <HTTP_PORT> -j REJECT 
--reject-with icmp-port-unreachable

As a result, any connections to these IP addresses on HTTP ports are filtered and rejected at the transport layer, eliminating the need for state management at the application layer by our web proxies.

The next logical step is to update the DNS assignments so that API traffic is routed over the correct IP addresses. In our case, we encoded a new DNS policy for API traffic for the HTTPS-only interface as a declarative Topaz program in our authoritative DNS server:

- name: https_only
 exclusive: true 
 config: |
    (config
      ([traffic_class "API"]
       [ipv4 (ipv4_address “192.0.2.1”)] # Example IPv4 address
       [ipv6 (ipv6_address “2001:DB8::1:1”)] # Example IPv6 address
       [t (ttl 300]))
  match: |
    (= query_domain_class traffic_class)
  response: |
    (response (list ipv4) (list ipv6) t)

The above policy encodes that for any DNS query targeting the ‘API traffic’ class, we return the respective HTTPS-only interface IP addresses. Topaz’s safety guarantees ensure exclusivity, preventing other DNS policies from inadvertently matching the same queries and misrouting plaintext HTTP expected domains to HTTPS-only IPs

api.cloudflare.com is the first domain to be added to our HTTPS-only API traffic class, with other applicable endpoints to follow.

Opting-in your API endpoints

As we said above, we’ve started with api.cloudflare.com and our internal API endpoints to thoroughly monitor any side effects on our own systems before extending this feature to customer domains. We have deployed these changes gradually across all data centers, leveraging Topaz’s flexibility to target subsets of traffic, minimizing disruptions, and ensuring a smooth transition.

To monitor unencrypted connections for your domains, before blocking access using the feature, you can review the relevant analytics on the Cloudflare dashboard. Log in, select your account and domain, and navigate to the “Analytics & Logs” section. There, under the “Traffic Served Over SSL” subsection, you will find a breakdown of encrypted and unencrypted traffic for your site. That data can help provide a baseline for assessing the volume of plaintext HTTP connections for your site that will be blocked when you opt in. After opting in, you would expect no traffic for your site will be served over plaintext HTTP, and therefore that number should go down to zero.


Snapshot of ‘Traffic Served Over SSL’ section on Cloudflare dashboard

Towards the last quarter of 2025, we will provide customers the ability to opt in their domains using the dashboard or API (similar to enabling the Always Use HTTPS feature). Stay tuned!

Wrapping up

Starting today, any unencrypted connection to api.cloudflare.com will be completely rejected. Developers should not expect a 403 Forbidden response any longer for HTTP connections, as we will prevent the underlying connection to be established by closing the HTTP interface entirely. Only secure HTTPS connections will be allowed to be established.

We are also making updates to transition api.cloudflare.com away from its static IP addresses in the future. As part of that change, we will be discontinuing support for non-SNI legacy clients for Cloudflare API specifically — currently, an average of just 0.55% of TLS connections to the Cloudflare API do not include an SNI value. These non-SNI connections are initiated by a small number of accounts. We are committed to coordinating this transition and will work closely with the affected customers before implementing the change. This initiative aligns with our goal of enhancing the agility and reliability of our API endpoints.

Beyond the Cloudflare API use case, we’re also exploring other areas where it’s safe to close plaintext traffic ports. While the long tail of unencrypted traffic may persist for a while, it shouldn’t be forced on every site.

In the meantime, a small step like this can allow us to have a big impact in helping make a better Internet, and we are working hard to reliably bring this feature to your domains. We believe security should be free for all!

На второ четене: „Голямо червено слънце, самотни електрически светлини“

Post Syndicated from original https://www.toest.bg/na-vtoro-chetene-golyamo-cherveno-sluntse-samotni-elektricheski-svetlini/

„Голямо червено слънце, самотни електрически светлини“ от Пламен Антов

На второ четене: „Голямо червено слънце, самотни електрически светлини“

София: изд. „Ерго“, 2019

Позволявам си да напиша тази статия като автор (какъвто всъщност съм, преди да се упражнявам и като рецензент). Не знам дали е „разрешено“, но е неизбежно, когато срещнеш своеобразен литературен близнак в лицето на писателя, за когото ще стане дума. Това припознаване се случи спонтанно, от раз, и върви по линия не толкова на сюжетите, колкото на цялостната нагласа и тоналност; на кръженето около големите, вечни теми; поетичните затишия и чувствеността в езика; реферирането към собствените текстове; предизвикването на читателя и съзнанието, че не си отговорен за удобството му; саботирането на мелодрамата и клишетата (което отнема сантименталността, но не и призрака ѝ); веруюто, че „ако в една идея или мисъл липсва парадоксът, тя е незавършена и невярна“; дори начина, по който две от историите ни (излезли в сборници през същата година) са дотолкова сходни, чак до конкретната сцена, че някой би могъл да ни обвини в плагиатство. Рецензионният поглед е изотвътре, макар и отдалечен, но

радостта автор да срещне и припознае като себе си друг е рядка, особена и плътна.

Запознавам се с творчеството на Пламен Антов чак до неудобство късно, докато той е на литературната сцена отдавна, ала – иска ли питане – изглежда, присъства тихо, ненатрапливо, може би с онова специфично пренебрежение на пътуващия човек от книгата, за която ще стане дума тук: „Голямо червено слънце, самотни електрически светлини“. В края на миналата година „Жанет 45“ издадe и най-новия му сборник, събрал (случайно или не) девет разказа – „Нагоре по реката назад“. Той обединява в един почти митологичен общ разказ истории от далечните му пътувания „в дивото“ и само сенки на сюжети, построени върху архетипни дихотомии, философски разсъждения и напоителни диалози, които разхождат белия културен пътешественик нагоре и назад отвъд западната цивилизация. Силно ви препоръчвам да обърнете внимание и на тази книга.

В „Голямо червено слънце, самотни електрически светлини“ историите също са обединени от пътя и също са автофикционални или дори автобиографични (затова за по-лесно ще наричам героя вътре „автора“), но се случват не из дебрите на далечна Азия и Южна Америка, а в България, по време на пътувания на стоп или с влак. И тук авторът се придвижва в леко абстрактната география, в неназованите градчета, по пътищата между големия град и провинцията, между планините и морето, между голямото червено слънце на свободата и изкуствените електрически светлини на нейното обратно, между невъзможността на природата и неизкоренимостта на цивилизацията – защото „всъщност името изобщо нямаше значение“. Неслучайно всеки път въпросът откъде идва и накъде пътува, отправен към него, остава без ясен отговор.

И тук времето е изведено в скоби или по-скоро авторът се самоизвежда извън него (макар и не така метафизично, както е преминаването между хронологичното и цикличното време в новия му сборник). И тук символично присъства – или по-скоро липсва – часовникът, когато някой друг герой стратегически го попита за часа. Тази неопределеност важи и за времето на самите сюжети; усещането е за флуидност – струва ти се например, че авторът е съвсем млад и пътува през 80-те или 90-те, а после се появява мобилен телефон, докато накрая, в последния разказ, героят съществува в суперпозиция с възрастния си Аз.

Всеки разказ представя някаква среща „по пътя“, и то с различни типове хора.

В някакъв смисъл тези истории са много по-сюжетни и по-социално ангажирани (мразя това леко неточно определение, но не разполагам с по-общопонятно), отколкото новите, които са далеч по-съзерцателни, разсъдителни. (Не, тук съзерцанието далеч не липсва – просто в тях Пламен Антов повече показва, отколкото казва.) Та, авторът среща например пиещи жп работници, деветдесетарски нимфетки, ревниви жени на ръба на нервна криза, бивши любими, избягал престъпник, просяк, пътни работници цигани, хомосексуален пич в мотел, съученици по време на среща на класа, а накрая и изобщо: самия себе си. Момичетата са много. Във всяка история героят по одисеевски копнее, очакван е, отделен е от, съжалява за, пътува към… (и така нататък) едно момиче/жена – на различни възрасти, в различни роли, в различни фази на отношенията, маркиращи и собственото му движение във времето.

И те, и срещите обаче по-скоро не обживяват, а рамкират екзистенциалната самота на героя („космическата ни самота в смъртта“) и тази самота е един от героите в тези разкази, защо не дори главният. Самият автор е отстранен от света, носи известна неприязън, натъртва на своето безразличие, казвайки за себе си:

… все се по-малко гледах да се намесвам в света, все по-малко ме интересуваше той, достатъчно ми беше да бъда само едно невидимо, само едно око невидимо, изпълнено с досада и омерзение.

Или:

Общуването с хората не е моята стихия, аз съм от самотните скитници. Но понякога изведнъж ми става нещо.

Това остава в сила и когато неговите действия го потвърждават, но дори и когато го опровергават. В тези истории например има достатъчно примери за обмен, за даване (цигари, храна, помощ, съчувствие, компания, разговори), но тези дребни жестове се явяват като изключенията, потвърждаващи заблудата, че „малките неща не умират“. Има и вземане в този обмен – от това да те качат по пътя, но най-вече на нечие тяло.

Впрочем цялата книга е пронизана от една смътна, опосредствана, копнежна или неочаквана сексуалност,

която винаги е там. Може би неин е червеният цвят, който се появява на много места (а и на всичко друго, на което можем да го припишем символично).

Та тези срещи са на една самота с друга самота, защото в крайна сметка са просто част от пътя, от преходността му и същевременно от неговата неизменност. От една страна, това са човеколюбиви, протягащи се към другия разкази, написани с на места почти социална чувствителност и дори сантименталност. (Последната, слава богу, веднага подрива или може би дори подиграва себе си, за да не прозвучи евтино, както биваме предупредени в предговора – че тук има „пародии на литературни сюжети и ситуации“.) От друга страна обаче, състои ли се наистина срещата и доколко? Един разказ, в който това е особено видно, е „Самотните електрически светлини“, където отказът на просяка да потвърди присъствието си в носталгичния спомен на приютилия и обгрижилия го герой, оказва съпротива на „сълзливата сантименталност“ на този филмов момент:

И едва сдържах някакъв странен порив да падна на колене пред този непознат, да целуна ръката му и да поискам прошка – със същата сълзлива сантименталност както у Достоевски, само че без капчица религиозен патос, който е по-непоносим от всичко.

Така че срещата е просто забавянето при отминаването, крехкостта на спирането, преди да продължиш. Неслучайно заедно с отсъстващия часовник ,един от другите най-присъстващи символи в историите е цигарата. Героите току си предлагат цигара и пушат заедно, и в нейната краткотрайност, в съскащото ѝ горене-гаснене на вечния студ, в споделената компания на издишания дим е може би смисълът на този повтарящ се мотив.

Онази неопределеност, за която стана дума по-горе, е и по отношение на моралните (и естетическите) координати. Тук те са пресечени, дифузни. И по отношение на разказвача, и по отношение на други герои/постъпки. Самият автор е нюансиран, диалектичен тип, иска ли питане. Във „Влизане в непознат град и излизане“ например сюжетната кулминация го превръща от избавител в насилник (морбидна подигравка на идеята за „спасителя“), а героинята осцилира между жертва и „просеща си“ го изкусителка. Невинността и вината се проникват, мотивацията на действията е противоречива. Бунтът прераства в насилие срещу онази, която в този момент в очите на героя олицетворява еснафското примирение; свеждането на вектора на „пътя“ до кратката затворена отсечка на ежедневното дерзание, конвенционалното примирение и неспособността да зададеш големите, страшните въпроси. Така от красиво и невинно момиче героинята се превръща в „тъпа кукла“, а накрая просто в „нещо, пълно с лайна“.

Подобни преходи има и в „Нощен влак“, и в „Майтап бе, Уили“, и в „Самотните електрически светлини“, и в „Шантав автостоп“. В много разкази отделните жестове на добрина, на протегната ръка биват избавяни от мелодраматичността си именно от замъгления морален фон, от нагласата на героя, от съпътстващите цинични размисли.

На второ четене: „Голямо червено слънце, самотни електрически светлини“

Сходна е ситуацията и по отношение на естетическото. В „Като във филм отпреди новата ера“ онова, което първо е намирал за изключително грозна гледка заедно с нас, ще се разкрие пред автора като „най-красивото нещо на света“ в голотата си. В „Нашата голота“ ще надделее нечовечното, но и небаналното, като реакция пред вестта за смъртта на нечий родител. Еросът отхвърля Танатоса; красотата на един момент на живеене, страст, телесност тук и сега, когато сме „така измамно млади, измамно живи и топли“, отхвърля досадната натрапчивост, неестетичността на смъртта и тленността. Този нетактичен егоизъм отново подрива мелодрамата на момента – той е искрен, жизнеутвърждаващ, справедлив дори.

В предговора към книгата Пламен Антов посочва, че тя е незавършена и в техническия смисъл на думата е така. Но доколкото пътят поражда тези сюжети, да, тази книга е невъзможна за завършване. В крайна сметка дори и пътят да свърши, както си казват героите в „Шантав автостоп“, трябва да започнеш да се връщаш (а това е нов път).

И не съществува никаква утеха, само пътят, само пътят, по който вървиш, тази улица в това безименно, смътно познато или съвсем друго градче, само пътят, който е свобода.

Малко ще е глупаво накрая да обобщя тези разкази и като „хипарски“, макар битническият начин на живот да има доста общо със сюжетната рамка на сборника. (Лично на мен историите ми напомнят и мъничко на Колдуел, и дори на Селинджър). Не върви да ги огранича и до „социални“, никак даже. Те са по малко от всичко, в тях има игра, има закачка с литературни формули и стереотипни образи, има дори авторски нарцисизъм: в „Три“ момичето ще отхвърли героя като реалния автор на книгата, която чете (настоящата, като нас). Има поставени в кавички емоционални изблици, макар и минорни, меланхолични. Има и нещо сурово, момчешко, грубовато. И нещо филмово (честата фраза „звучиш ми като реплика от филм“). И да – онези бегли поетични затишия, словесните пейзажи. Понеже няма начин за завършване на всичко, което казвам, съвсем в духа на тази книга, слагам рязко точката тук.


Активните дарители на „Тоест“ получават постоянна отстъпка в размер нa 20% от коричната цена на всички заглавия от каталога на издателство „Ерго“, както и на няколко други български издателства в рамките на партньорската програма Читателски клуб „Тоест“. За повече информация прочетете на toest.bg/club.

Никой от нас не чете единствено най-новите книги. Тогава защо само за тях се пише? „На второ четене“ е рубрика, в която отваряме списъците с книги, публикувани преди поне година, четем ги и препоръчваме любимите си от тях. Рубриката е част от партньорската програма Читателски клуб „Тоест“. Изборът на заглавия обаче е единствено на авторите – Стефан Иванов и Антония Апостолова, които биха ви препоръчали тези книги и ако имаше как веднъж на две седмици да се разходите с тях в книжарницата.

The collective thoughts of the interwebz