Post Syndicated from corbet original https://lwn.net/Articles/1006486/
Security updates have been issued by Debian (git and openjpeg2), Mageia (virtualbox), SUSE (podman), and Ubuntu (clamav, frr, libreoffice, linux-xilinx-zynqmp, and quagga).
Post Syndicated from corbet original https://lwn.net/Articles/1006486/
Security updates have been issued by Debian (git and openjpeg2), Mageia (virtualbox), SUSE (podman), and Ubuntu (clamav, frr, libreoffice, linux-xilinx-zynqmp, and quagga).
Post Syndicated from David Belson original https://blog.cloudflare.com/q4-2024-internet-disruption-summary/
Cloudflare’s network spans more than 330 cities in over 120 countries, where we interconnect with over 13,000 network providers in order to provide a broad range of services to millions of customers. The breadth of both our network and our customer base provides us with a unique perspective on Internet resilience, enabling us to observe the impact of Internet disruptions at both a local and national level, as well as at a network level.
As we have noted in the past, this post is intended as a summary overview of observed and confirmed disruptions, and is not an exhaustive or complete list of issues that have occurred during the quarter. A larger list of detected traffic anomalies is available in the Cloudflare Radar Outage Center.
In the third quarter we covered quite a few government-directed Internet shutdowns, including many intended to prevent cheating on exams. In the fourth quarter, however, we only observed a single government-directed shutdown, this one related to protests. Terrestrial cable cuts impacted connectivity in two African countries. As we have seen multiple times before, both unexpected power outages and rolling power outages following military action resulted in Internet disruptions. Violent storms and an earthquake predictably caused Internet outages in the affected countries. And unexpected issues with maintenance efforts caused outages at two European providers, while Verizon customers in several US states experienced a brief but unexplained outage.
On October 1, local mobile provider MTN Rwanda (AS36890) published a post on X alerting subscribers of a double fiber cut in Tanzania and Uganda that may impact connection quality. As a result of these fiber cuts, Internet traffic began to drop sharply after 12:45 local time (10:45 UTC), with a full outage visible between 13:15 – 13:30 local time (11:15 – 11:30 UTC). Traffic then began to rapidly recover, recovering to expected levels around 19:00 local time (17:00 UTC). Several hours later, MTN Rwanda published a followup post confirming that all services had been restored.
The African Undersea and Terrestrial Fibre Optic Cables (AfTerFibre) map shows that in addition to connecting with networks to the north and south in Tanzania and Uganda, it appears that connections are also available through networks to the west in the Democratic Republic of the Congo (DRC). However, MTN Rwanda’s upstream providers and/or peers may not be routing traffic through DRC-based networks, meaning that they couldn’t be used as a backup path when the apparently simultaneous fiber cuts occurred.
On November 30, local mobile provider Airtel Niger (AS37531) posted a thread of messages on X apologizing for Internet service disruptions, explaining that (translated) “Indeed, due to a simultaneous interruption on the national optical fiber on the Niamey-Dosso, Niamey-Balleyara exits, our internet services are completely interrupted throughout the territory, beyond our control.” These simultaneous fiber cuts resulted in a near complete outage between 17:30 local time (16:30 UTC) on November 29 until 19:45 local time (18:45 UTC) on November 30.
It seems unusual that the message thread was not posted until after the outage was resolved. It is possible that Airtel Niger themselves had no backup connectivity, and could not post an update until connectivity was restored. Alternately, given that the first post of the thread starts with “[COMMUNIQUÉ IMPORTANT📢]” (“[IMPORTANT PRESS RELEASE 📢 ]”), it is possible that the alert and apology was communicated through more official channels, such as Airtel’s website, in a timely manner, with the thread on X simply a follow-up once Internet services were again available.
Instability in a country’s electrical infrastructure often causes widespread power outages, which, in turn, disrupt Internet connectivity. This happened on October 18 in Cuba, where a post on X from the Ministry of Energy and Mines of Cuba noted (translated) “Following the unexpected departure of the Antonio Guiteras CTE, the National Electricity System was completely disconnected at 11 a.m. today. The Unión Eléctrica is working on its restoration.” The power outage caused Internet traffic within the country to drop by more than half within minutes (15:15 UTC). Connectivity was disrupted for approximately three-and-a-half days, as it returned to expected levels around 23:00 local time on October 21 (03:00 UTC on October 22).
The Ministry posted several status updates on October 19 and 20, covering the work being done to restore power across the country. A final X post on October 22 signaled the end of the power outage, proclaiming (translated) “At 02:44 pm the National Electric System was synchronized.”
Several weeks later, power issues again impacted Internet connectivity in Cuba. On November 6, the Electrical Union of Cuba (Uníon Eléctrica) posted on X that (translated) “14:48 hours. Strong winds caused by the intense Hurricane Rafael, cause the disconnection of the National Electric System. Contingency protocols are applied.” The timing of this post aligns with a sharp decline in traffic observed from Cuba, which fell sharply around 14:30 local time (19:30 UTC). Over the following days, after Hurricane Rafael passed the island, the Uníon Eléctrica posted numerous updates on the restoration of electrical service. Internet traffic appeared to return to expected levels around 13:00 local time (18:00 UTC) on November 9, although full restoration of electrical services took several days longer.
On December 4, Cuba suffered its third nationwide power outage in as many months. Early that morning, the Ministry of Energy and Mines posted on X that (translated) “At 2:08 this morning, the Electrical System, SEN, was disconnected when the Antonio Guiteras thermoelectric plant went out due to the automatic tripping.” The loss of this electrical power due to the failure of this generation plant caused a significant drop in Internet traffic from Cuba, falling approximately 60% as compared to the previous week at just before 02:15 local time (07:15 UTC). Traffic recovered to expected levels almost a day later at around 00:30 local time (05:30 UTC). This timing aligns with a follow-on X post from the Ministry that announced that all units had been synchronized, signaling a restoration of electrical service.
An article published in The Guardian on October 25 noted that “The French Caribbean island of Guadeloupe has been left entirely without power after striking workers seized control of the territory’s power station.” Workers entered the power station’s command room “and caused an emergency shutdown of all the engines”, according to the article. The power outage caused by this “emergency shutdown” resulted in traffic dropping nearly 70% as compared to the previous week at 08:30 local time (12:30 UTC). Although “restored electricity supply for the 230,000 affected households was expected at 3 pm local time (19:00 UTC) at best”, it appears that recovery took significantly longer than expected, as Internet traffic did not return to expected levels until around 22:00 local time on October 26 (02:00 UTC on October 27) . A press release from the government at 11:00 local time (15:00 UTC) on October 26 gave an update on the recovery efforts, noting (translated) “160,000 users have had their electricity restored. The restoration of service for the 70,000 customers still cut off is continuing, with a return to normal expected over the weekend.” It also noted that “76% of Orange subscribers have been able to regain their network connection. 1,800 homes are still without internet.”
Power outages in Kenya resulted in multiple Internet disruptions during both the second and third quarters of 2024. A similar event occurred during the fourth quarter as well. An X post from Kenya Power contained a “Customer Alert” issued at 01:28 local time on December 18 (22:28 UTC on December 17) that informed customers that “We are experiencing a widespread power outage affecting most of the country, except parts of Western and North Rift regions.” This outage caused Internet traffic from the country to drop by over 70% starting just after midnight local time on December 18 (21:00 UTC on December 17). On December 18 at 07:35 local time (04:35 UTC), an update from Kenya Power posted to X reported that power had been restored to all affected areas. Internet traffic from the country had recovered to near expected levels by that time as well.
At 20:30 local time on October 9 (00:30 UTC on October 10), Hurricane Milton made landfall in Florida as a Category 3 storm. Damage from Milton was extensive, including flooding, downed trees and power lines, and damage to homes and businesses. The power outages and other infrastructure damage caused by the storm, coupled with evacuation from impacted areas, resulted in a notable Internet disruption at a state level. As seen in the graph below, peak traffic levels on October 10, after Milton’s arrival, were approximately 40% lower than the preceding days. As recovery and restoration efforts began over the following days, and as evacuees returned to home, school, and work, the state’s Internet traffic began to gradually increase.

This gradual recovery is also visible in the series of maps below, which illustrate cities where Internet traffic was over 50% lower than the same time the prior week, with snapshots taken at 09:00 local time (13:00 UTC) on October 10, 11, and 14. On October 10, over 70 cities had significantly lower traffic, while on October 14, it was just over 10 cities.

On December 14, Cyclone Chido caused significant destruction on the French territory of Mayotte in the Indian Ocean. Power, water, and communications infrastructure were all damaged, as well as homes and public facilities. Over three dozen people were killed, with thousands more injured. With such widespread devastation, Internet traffic from the country was also impacted, as would be expected. Chido made landfall in Mayotte early in the morning on December 14, and traffic dropped sharply around 09:00 local time (06:00 UTC), causing a near-complete Internet outage. After extremely slow growth over the following week, a diurnal pattern is once again visible, with peak traffic levels continuing to gradually increase through the end of the month. As of the third week of January 2025, Mayotte’s Internet traffic continues to slowly increase, but remains well below pre-Chido levels.
A magnitude 7.3 earthquake struck 24 km WNW of Port-Vila, Vanuatu at 17:46 local time (01:47 UTC) on December 17. Internet traffic from the country dropped sharply almost immediately, falling nearly 90% compared to the previous week. A significant drop in announced IPv4 address space was also observed, suggesting that damage from the earthquake took core network provider infrastructure offline as well. Recovery was slow, with Internet traffic not returning to expected levels until around 23:00 local time (12:00 UTC) on December 26.
An editorial published on The Maritime Executive website highlights that Vanuatu is currently reliant on the Interchange Cable Network 1 (ICN1) submarine cable connection to Fiji for international Internet connectivity. The editorial states that “A fire at the cable landing station temporarily interrupted the power supply, disabling internet traffic. The connection was restored 10 days later…” The resolution of the power outage at the cable landing station roughly aligns with traffic returning to expected levels, suggesting that this was a significant driver of the drop in traffic seen from Vanuatu after the earthquake. Starlink’s satellite Internet service provides some nominal redundancy, as the company announced service availability on October 7. The TAMTAM submarine cable, connecting Vanuatu to New Caledonia, is expected to be ready for service in 2026 — once available, it will provide additional redundancy for Internet connectivity.
On October 25 in Mozambique, mobile Internet connectivity across multiple providers was shut down after protests against the re-election of the ruling Frelimo party became violent. Starting around 13:00 local time (11:00 UTC), significant drops in traffic were observed across AS30619 (Telecomiuncacoes de Mocambique), AS37342 (Movitel), and AS37223 (Vodacom). Both Vodacom and Movitel experienced near complete outages almost immediately, while some traffic remained on Telecomiuncacoes de Mocambique until just before 02:00 local time (00:00 UTC) on October 26. Connectivity was restored the morning of October 26, as traffic returned around 08:00 local time (06:00 UTC). However, after connectivity returned, some social media platforms and messaging applications remained unavailable.
Just over a week later, on November 3, subscribers on these mobile networks experienced another Internet shutdown. At around 20:30 local time (18:30 UTC) traffic dropped significantly on each of these networks, with connectivity disrupted for nearly 12 hours before recovering around 08:00 (06:00 UTC) the morning of November 4. Similar shutdowns (“Internet curfews”) were observed November 4-5 and November 6-7 on all three networks, and November 7-8 on Movitel and Vodacom. According to a published report, the country’s Minister of Transport and Communications “admitted that Internet access was restricted in order ‘to avoid the destruction of the country’”, but shifted blame to the impacted services providers, claiming that when they note misuse of their services, they can take the initiative of interrupting the services, as part of their “civil responsibility” to safeguard “the stability and welfare of the population”.
An Internet disruption observed in Syria on November 9 may have been caused by damage from an Israeli airstrike near Aleppo and Idlib reported to have taken place earlier that morning. Internet traffic from the country dropped by about 80% at around 04:00 local time (01:00 UTC), with announced IP address space from the country falling significantly at that time as well. The disruption lasted approximately four hours, with traffic and announced IP address space returning to expected levels around 08:00 local time (05:00 UTC).
Internal analysis of city-level Internet traffic shows a similar disruption in Aleppo, suggesting that it may have been caused by the airstrike.

Russian missile strikes on November 17 targeting electrical power infrastructure in Ukraine resulted in rolling power outages in multiple regions across the country. As we have seen multiple times throughout the nearly three-year-old conflict, these power outages result in disruptions to Internet traffic, impacting both service provider infrastructure and subscriber connectivity.
During the period between 07:30 local time (05:30 UTC) on November 17 and 02:00 local time (00:00 UTC) on November 23, we observed lower Internet traffic as compared to the previous week in Odessa, Zaporizhzhia, Mykolaiv, and Sumy. Traffic in Odessa initially dropped on November 17 by around 50% as compared to the prior week, while on November 18, traffic dropped by over 20% in the other regions. Traffic largely recovered in Odessa by November 21, while the other regions took several additional days.


Similar attacks took place just a few days later, with additional Russian airstrikes again targeting electrical infrastructure in Ukraine. Once again, Ukrainian officials implemented emergency power outages, which impacted Internet traffic in multiple areas across the country. Starting around 07:00 local time (05:00 UTC) on November 28, we observed traffic drop by as much as 65% as compared to the previous week in Kherson Oblast, Mykolaiv, Ternopil Oblast, Rivna, and Lviv. Traffic remained lower over the next several days, but appears to have generally recovered by December 1.


According to the image below, which replaced the homepage of Swiss provider Salt Mobile (AS15796), reported maintenance took the network completely offline early in the morning of December 3.

The outage lasted nearly three hours, with observed traffic at or near zero, between 01:25 and 04:20 local time (00:25 – 03:20 UTC).
A December 10 update from Tusass A/S (AS8818, formerly TeleGreenland) explained why the provider experienced a complete Internet outage between 02:30 and 05:15 local time (04:30 – 07:15 UTC) that morning. The post noted “This happened because preventive maintenance was to be done on the connections in Canada between 02:00 and 06:00 last night, but with a combined fault on our connection to Denmark we lost nationwide connectivity. Fortunately, the fault on the connection to Denmark occurred on land, and therefore easy to repair.” The graphs below show that for the duration of the outage, traffic from the network dropped to zero, no IPv6 address space was announced, and the volume of announced IPv4 address space fell by 94%.
According to Telegeography’s Submarine Cable Map, the Greenland Connect cable system connects Greenland to Newfoundland, Canada. It is possible that the fault on the connection to Denmark may have occurred on the Greenland-to-Iceland segment of the Greenland Connect cable system; the Iceland-to-Denmark connection is made over the DANICE submarine cable.
Very early in the morning of November 12, some subscribers of Verizon’s Fios Internet service experienced a disruption to their Internet connectivity. A post to the Outages mailing list noted that a major multi-state Verizon Fios outage began at 12:28am EST, impacting Virginia, Washington DC, Maryland, and New Jersey, as well as parts of eastern Pennsylvania. Traffic from AS701, the autonomous system used by Verizon for their Fios service, dropped by approximately 30% around 00:30 Eastern time (05:30 UTC). At a state level, traffic from AS701 dropped between 50-70% in Pennsylvania, Delaware, Maryland, and Washington DC.
A subsequent post on the Outages mailing list stated that the outage was resolved everywhere at 3:23am EST (08:23 UTC). Nearly six hours after the outage ended, Verizon Support published a post on X acknowledging the issue, stating “A network issue early this morning disrupted service for some Verizon Fios customers in the Northeast for a short period of time. As soon as the issue was identified, our engineering teams quickly restored the service.” However, they did not provide any information on what ultimately caused the service disruption.
In addition to the outages and disruptions covered above, resilient Internet connectivity meant that two Baltic Sea cable cuts that occurred on November 17 and 18 had minimal impact. Whether accidental or sabotage, the security and resiliency of submarine cable infrastructure continues to be an important topic. The security and resilience of terrestrial cable infrastructure, as well as other critical Internet infrastructure, must also remain top of mind to help speed recovery from storms, earthquakes, military action, and power outages.
The Cloudflare Radar team is constantly monitoring for Internet disruptions, sharing our observations on the Cloudflare Radar Outage Center, via social media, and in posts on blog.cloudflare.com. Follow us on social media at @CloudflareRadar (X), noc.social/@cloudflareradar (Mastodon), and radar.cloudflare.com (Bluesky), or contact us via email.
Post Syndicated from Vicente Forcada original https://www.raspberrypi.org/blog/translating-educational-content-four-key-principles/
As an organisation with global reach, translation and localisation have been part of the Raspberry Pi Foundation’s activities from the start. Code Clubs and educational partners all over the world are helping young people learn about computing in their own language. We’ve already published over 1,900 translated learning resources, covering up to 32 languages, thanks to the work of our talented localisation team and our amazing community of volunteer translators.
English is seen by many as the language of computing, and in many countries, it’s also either the language of education or a language that young people aspire to learn. However, English is, in some instances, a barrier to learning: young people in many communities don’t have enough knowledge of English to use it to learn about digital technologies, or even if they do, the language of communication with other students, teachers, or volunteers may not be English.

In a world where browsers can instantly translate web pages and large language models can power seemingly perfect conversations in virtually any language, it’s easy to assume that translation just happens and that somehow, technology takes care of it. Unfortunately, that’s not the case. Technology is certainly crucial to translation, but there’s much more to it than that. Our approach to translation involves considering design, process, and people to ensure that localised materials truly help young people with their learning journey.
Localisation and translation are similar terms that are often used interchangeably. Localisation normally refers to adapting a product to suit a local market, whereas translation is a subset of localisation that involves changing the language of the text. For instance, localisation includes currencies, measurements, formatting dates and numbers, and contextual references. Meanwhile, translation involves only changing the language of the text, such as from English to French.

At the Raspberry Pi Foundation, we see translation as an enabler. It enables volunteers to reach learners, learners to succeed in their educational goals, and the Foundation to achieve its mission all over the world.
1. Create with localisation in mind
Regardless of whether learning materials are intended for English-speaking or global audiences, it’s important to create and design them with localisation in mind. That way, they can be used in a variety of places, and any piece of content (text, graphics, or illustrations) can be modified to meet the needs of the target audience. Keeping localisation in mind might include allowing space for text expansion, being mindful of any text embedded in graphic elements, and even making sure the context is understandable for a variety of audiences. Making a piece of content localisable at the creation stage is virtually cost-free. Modifying fully built assets to translate them or to use them in other markets can be expensive and extremely time-consuming!
2. Always have user needs and priorities upfront
Before investing in localising or translating any materials, we seek to understand the needs and priorities of our users. In many countries where English is not the usual language of communication, materials in English are a barrier, even if some of the users have a working knowledge of English. Making materials available in local languages directly results in additional reach and enhanced learning outcomes. In other communities where English has a certain status, a more selective approach may be more appropriate. A full translation may not be expected, but translating or adapting elements within them, such as introductions, videos, infographics, or glossaries, can help engage new learners.

3. Maximise the use of technology
While it’s possible to translate with pen and paper, translation is only scalable with the use of technology. Computer-assisted translation tools, translation memories, terminology databases, machine translation, large language models, and so on are all technologies that play their part in making the translation process more efficient and scalable.
At the Foundation, we make use of a variety of translation technologies and also, crucially, work very closely with our content and development teams to integrate their tools and processes into the overall localisation workflow.
4. Take great care of the people
Even with the best technology and the smoothest integrations, there is a human element that is absolutely essential. Our amazing community of volunteers and partners work very closely with learners in their communities. They understand the needs of those learners and have a wealth of information and insights. We work with them to prioritise, translate, review and test the learning materials. They are key to ensuring that our learning materials help our users reach their learning goals.
Thinking about localisation from the moment we start creating learning materials, understanding the needs of users when creating our end goals, maximising the use of technology, and taking good care of our people and partners are the key principles that drive our translation effort.
If you’d like to find out more about translation at the Raspberry Pi Foundation or would like to contribute to the translation of our learning materials, feel free to contact us at [email protected].
A version of this article also appears in Hello World issue 23.
The post Translating educational content: four key principles appeared first on Raspberry Pi Foundation.
Post Syndicated from Bruce Schneier original https://www.schneier.com/blog/archives/2025/01/cisa-under-trump.html
Jen Easterly is out as the Director of CISA. Read her final interview:
There’s a lot of unfinished business. We have made an impact through our ransomware vulnerability warning pilot and our pre-ransomware notification initiative, and I’m really proud of that, because we work on preventing somebody from having their worst day. But ransomware is still a problem. We have been laser-focused on PRC cyber actors. That will continue to be a huge problem. I’m really proud of where we are, but there’s much, much more work to be done. There are things that I think we can continue driving, that the next administration, I hope, will look at, because, frankly, cybersecurity is a national security issue.
If Project 2025 is a guide, the agency will be gutted under Trump:
“Project 2025’s recommendations—essentially because this one thing caused anger—is to just strip the agency of all of its support altogether,” he said. “And CISA’s functions go so far beyond its role in the information space in a way that would do real harm to election officials and leave them less prepared to tackle future challenges.”
In the DHS chapter of Project 2025, Cucinelli suggests gutting CISA almost entirely, moving its core responsibilities on critical infrastructure to the Department of Transportation. It’s a suggestion that Adav Noti, the executive director of the nonpartisan voting rights advocacy organization Campaign Legal Center, previously described to Democracy Docket as “absolutely bonkers.”
“It’s located at Homeland Security because the whole premise of the Department of Homeland Security is that it’s supposed to be the central resource for the protection of the nation,” Noti said. “And that the important functions shouldn’t be living out in siloed agencies.”
Post Syndicated from The Atlantic original https://www.youtube.com/watch?v=YVxZr2WeVUU
Post Syndicated from Александър Нуцов original https://www.toest.bg/bulgaria-v-evropa-i-evropa-sreshtu-sveta-kude-sme-v-tehnologichnoto-sustezanie/

Американският писател и сатирик Кърт Вонегът има особено мнение за технологиите:
Смятам, че романите, които изключват технологиите, изобразяват живота толкова погрешно, колкото погрешно са го изобразявали викторианците, изключвайки секса.
Както в романите, така и в политиката изключването на темата за иновациите и технологиите през 2025 г. изкривява действителността. Политиците ни трябва да разберат, че България не може да си позволи да се превърне в щрауса със заровена в пясъка глава. Защото когато малко по-късно я надигне, щраусът няма да познае света, който е оставил. И няма да може да живее в него. Такъв е темпът на технологиите.
С какво асоциирате думите „технология“ и „иновация“? Моят отговор е бъдеще. Или обещание за бъдеще.
Перифразирайки един известен цитат на компютърния учен Алън Кей, бих казал, че има два начина да взаимодействаме с бъдещето. Реактивен – да го предвидим. И проактивен – да го създадем. Когато си политик, трябва да правиш и двете. Да предвидиш глобалните течения и да създадеш решения в синхрон с визията си за бъдещето. Политик, който изключва иновациите от програмата си, прилича на спринтьор в дълга маратонска надпревара – бяга бързо в началото, но накрая ще изгуби съревнованието.
А колко пъти сме чули политиците ни да говорят за бъдещето с конкретност и как си представят света и България след 10, 20 или 30 години? Или какви решения предлагат сега, така че страната ни да благоденства тогава? Политическото късогледство, слабото лидерство и липсата на разговор и държавническа визия за съвместния ни път като общество създават проблеми в две направления.
Прагматично направление. Гражданският сектор и бизнесът предлагат конкретни решения на конкретни проблеми, които нямат идеология и цвят. Това важи с пълна сила за икономиката, иновациите и технологиите. Докато другите европейски страни и глобални конкуренти действат, България губи ценно време, за да пречупи успоредните прави на растеж с другите страни в Европа и да ги догони по стандарт и качество на живот.
Културно/ценностно направление. Политическото безвремие се е загнездило в съзнанието ни и създава усещане за застой и невъзможност за положителна промяна. Това ражда опасен феномен – България има многовековна история, но по отношение на зрелостта си обществото прилича на първокласник, който чака родителите си да му помогнат за домашното. Налага се разбирането, че българите като общество и като отделни личности не могат да създават стойност и да предлагат решения и политики. Превръщаме се в зрители на една изкривена демокрация, чакайки „спасителя“ да ни покаже пътя. В една добре работеща демокрация обаче гражданите задават пътя на политиците.
В технологичната надпревара участват много състезатели, но три са най-бързите коне – САЩ, Китай и Европейският съюз. Третият обаче изостава. Защо?
За изоставането може да съдим по четири индикатора – пазар, регулации, капитал и кадри.
Първият и вторият са пряко свързани. Очевидно САЩ, Китай и ЕС разполагат с огромни вътрешни пазари. Това е добре, ако планирате да създадете глобален бизнес. Защото от самия старт разполагате с нужния мащаб да разраснете бизнеса си с размах. Имате много възможности, сегменти, ниши, целеви аудитории, на които да пласирате продукта или услугата си, без значение дали продавате на индивидуални (B2C), или на корпоративни клиенти (B2B). Това важи с пълна сила, ако създадете технологична компания в САЩ или в Китай, защото пазарите, освен че са огромни, са и единни.
За да разраснете своя бизнес в ЕС обаче, да отворите филиали и да стъпите на пазарите в 27 страни членки, ще трябва се запознаете с 27 различни законодателства, администрации, регулации, пазари и култури. На една технологична компания т.нар. скалиране (мащабиране) коства значително време за проучване и запознаване с механизмите за регистрация и опериране на бизнес, както и големи разходи за юристи и счетоводители, редица пазарни анализи, сблъскване с културни бариери и т.н.
Същото важи и за инвеститорите – особено за фондовете за рисков капитал (VC) и алтернативните фондове, които инвестират в технологични компании с по-голям шанс за бърз и експоненциален растеж в глобален мащаб. По същите причини те рядко инвестират в компании и пазари извън страната, в която са регистрирани. Защото в нея имат задълбочени познания за пазара и вертикалите по индустрии, познават нормативната рамка, регулациите и инвестиционните процеси. Раздробеността на пазарите създава допълнително предизвикателство пред по-малките по население европейски държави, тъй като сами по себе си не привличат толкова сериозен интерес от големи западни инвеститори (фондове, институционални инвеститори и др.) поради обективно по-скромните размери на пазара.
Друг особено важен проблем е, че институционалните инвеститори, каквито са например пенсионните фондове (втори и трети стълб) в ЕС, инвестират много по-малко и консервативно в технологичния сектор в сравнение със САЩ.
Последният годишен доклад на Atomico за състоянието на иновациите и инвестиционния климат в европейския технологичен сектор показва, че сделките с рисков капитал в Европа (вкл. Великобритания) достигат около 45 млрд. долара през 2024 г. спрямо 47 млрд. долара през 2023-та.
През 2024 г. са сключени малко над 4000 сделки в ранната фаза на развитие на технологичните компании, т.нар. early-stage сделки, на стойност под 15 млн. долара. Това е най-ниското ниво от 2015 г. насам.
По данни от доклада, пенсионните фондове в Европа са удвоили инвестициите си в рисков капитал в периода 2015–2023 г. През 2023 г. те допринасят с 858 млн. долара. Въпреки това Европа изостава драматично от САЩ, където пенсионните фондове са инвестирали около 7,7 млрд. долара във VC фондове през 2023 г. Разликата е почти десетократна.
И въпреки че ЕС разполага с много качествени специалисти и предприемачи, а нагласите на европейците за създаването на собствен бизнес са положителни, Съюзът изостава в надпреварата със САЩ, където условията са по-добри, и с Китай, където моделът стъпва и на сериозна държавна подкрепа.
Какви са последствията? От Европа изтичат успешни технологични компании, основатели и специалисти зад океана заради по-лесното отваряне на бизнес, огромния вътрешен пазар и улеснения достъп до капитал и инвеститори. А ЕС продължава да изостава икономически от своите големи глобални конкуренти.
След няколко звучни шамара Европейската комисия се събуди от летаргията, в която беше изпаднала.
Първият дойде през април 2024 г., след публикуването на доклада на бившия италиански премиер Енрико Лета относно състоянието и мерките за подобряване на единния пазар за устойчива икономика и по-добър стандарт на живот за европейските граждани. Лета отправя предложения в няколко направления:
Вторият шамар дойде няколко месеца по-късно, през септември 2024 г., с доклада на Марио Драги за конкурентоспособността на ЕС. Той идентифицира три области на действие, една от които е пряко свързана с иновациите и технологиите – как да наваксаме изоставането от САЩ и Китай по отношение на иновациите. Драги предлага решения за развитие на стартъп екосистемите, уеднаквяване на законодателната рамка и регулациите, учредяването на ново европейско дружество, което улеснява създаването и скалирането на технологични компании, по-добра рамка за инвестиции, повече средства в научноизследователска и развойна дейност и много други.
Шамарите задействаха политически импулс, така че Урсула фон дер Лайен и Европейската комисия дадоха да се разбере, че ще приоритизират развитието на иновациите и икономиката на ЕС.
Междувременно новата еврокомисарка с ресор „Стартъпи, изследвания и иновации“ Екатерина Захариева създава съвет от успешни предприемачи и експерти, които ще разработват европейски решения за развитие на иновациите.
Великобритания се готви да мобилизира 80 млрд. паунда чрез реформа в пенсионната система и създаването на пенсионни мегафондове за инвестиции в технологичния сектор и икономически растеж.
Германската стартъп асоциация Startup Verband пък публикува своя доклад Innovation Agenda 2030. В него се очертават насоки и мерки пред германското управление за позициониране на страната като лидер в иновациите в Европа и на глобално равнище. Германия планира и т.нар. WIN инициатива с цел да мобилизира 12 млрд. евро от публични и частни източници, като Deutsche Bank, Allianz, Commerzbank, Deutsche Telekom, AXA Deutschland, и застрахователни компании, като HUK Coburg. Парите ще бъдат насочени към технологичната екосистемата в по-високите нива на инвестиционни рундове и в по-мащабни сделки.
Нидерландия, Франция и други страни също обмислят стъпки, чрез които да развържат кесиите със застояли ресурси и така да дадат тласък на икономиките си.
България има шанса да надбяга страните от Централна и Източна Европа, като създаде модерно законодателство за подпомагане на иновациите и стимулиране на индустриите с висока добавена стойност.
Улесняването на частни и институционални инвеститори, като пенсионните фондове, да инвестират и участват по-ефективно в икономиката ни, нужните промени в Закона за насърчаване на инвестициите за привличане на стратегически инвеститори, създаването на механизъм за стимулиране на т.нар. бизнес ангели (частни лица, които инвестират в технологичния сектор) и изработването на виза за дигитални номади са само част от инструментите, които ще ускорят растежа на икономиката ни дългосрочно. Как насърчаваме научноизследователската и развойната дейност (R&D) в иновациите, как насочваме частни и публични инвестиции в дълбоките технологии (deep tech) и модернизираме законодателството, така че научните разработки в университетите да се превръщат в технологични компании (university spin-offs) са други ключови за решаване въпроси.
Решенията и съдържанието по тях ги има. Остава щраусът да не си зарови отново главата в пясъка.
Post Syndicated from Patrick Kennedy original https://www.servethehome.com/deepseek-day-in-ai/
DeepSeek-R1 is out and it has the entire AI infrastructure realm has taken notice. This is a good development for the industry
The post DeepSeek Day in AI appeared first on ServeTheHome.
Post Syndicated from The History Guy: History Deserves to Be Remembered original https://www.youtube.com/watch?v=L_o8udyinic
Post Syndicated from Explosm.net original https://explosm.net/comics/hole
New Cyanide and Happiness Comic
Post Syndicated from Rory Malone original https://blog.cloudflare.com/cloudflare-cbpr-a-global-privacy-first/
Cloudflare proudly leads the way with our approach to data privacy and the protection of personal information, and we’ve been an ardent supporter of the need for the free flow of data across jurisdictional borders. So today, on Data Privacy Day (also known internationally as Data Protection Day), we’re happy to announce that we’re adding our fourth and fifth privacy validations, and this time, they are global firsts! Cloudflare is the first organisation to announce that we have been successfully audited against the brand new Global Cross-Border Privacy Rules (Global CBPRs) for data controllers and the Global Privacy Recognition for Processors (Global PRP). These validations demonstrate our support and adherence to global standards that provide for privacy-respecting data flows across jurisdictions. Organizations that have been successfully audited will be formally certified when the certifications officially launch, which we expect to happen later in 2025.
Our participation in the Global CBPRs and Global PRP joins our roster of privacy validations: we were one of the first cybersecurity organizations to certify to the international privacy standard ISO 27701:2019 when it was published, and in 2022 we also certified to the cloud privacy certification, ISO 27018:2019. In 2023, we added our third privacy validation, undergoing a review by an independent monitoring body in the European Union (EU) and declared to be adherent to the first official GDPR code of conduct — the EU Cloud Code of Conduct.
Taking these privacy certifications together, Cloudflare demonstrates that we are meeting key official privacy validations in 39 jurisdictions around the world, from Australia and Austria to Sweden and the United States. An additional four jurisdictions (United Kingdom, Bermuda, Mauritius, and the Dubai International Finance Centre) are also in the process of joining and recognising the Global CBPR certifications. That’s important for Cloudflare customers as it provides reassurance that the privacy practices we have built are recognised by governments around the world.
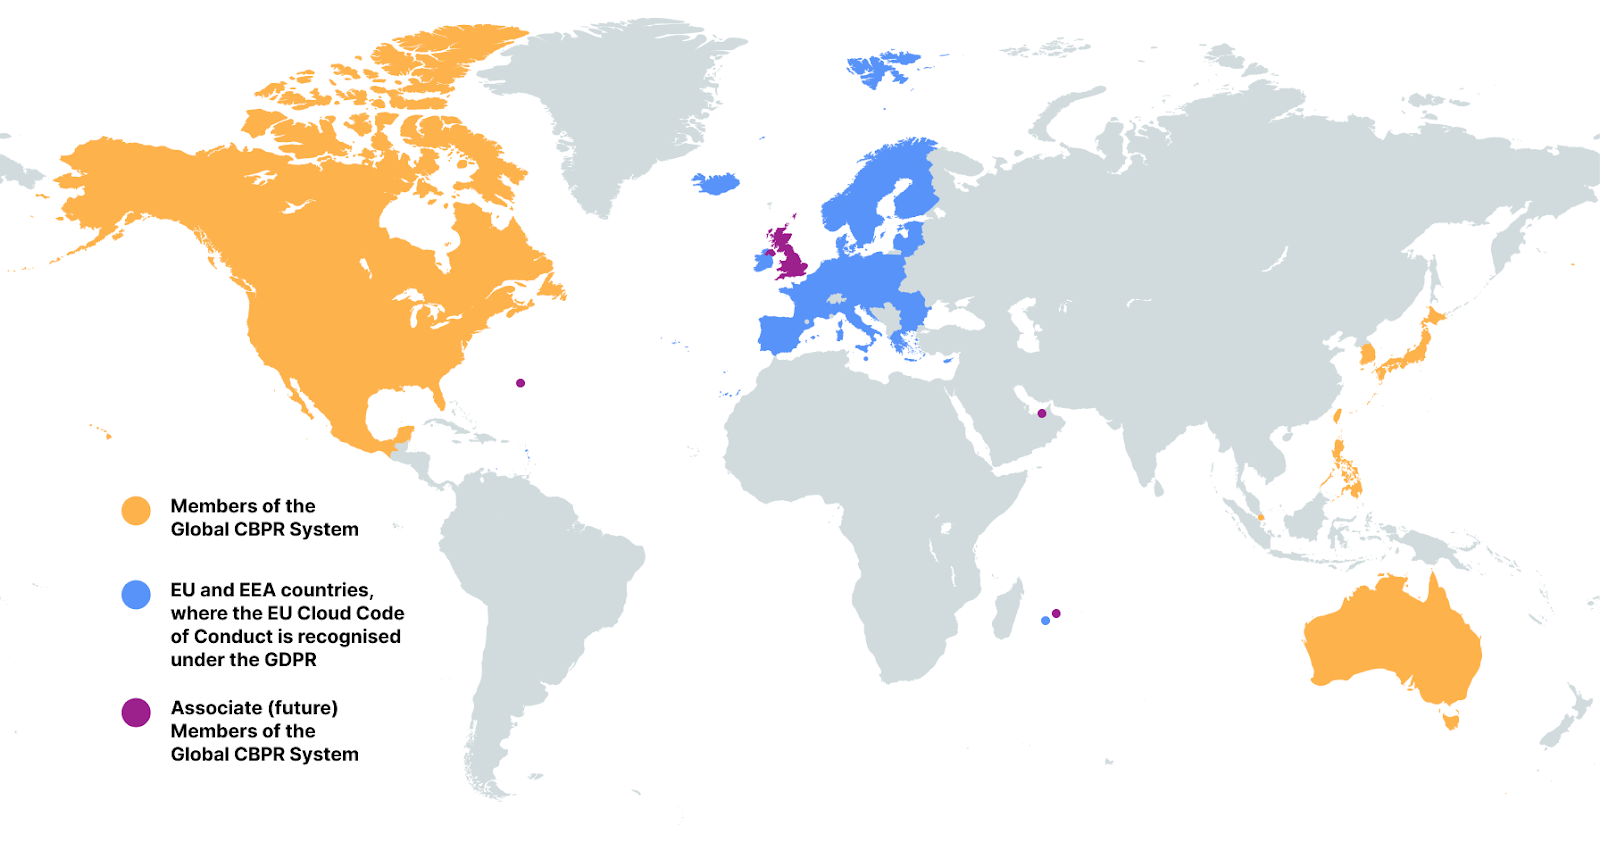
In the last three years, governments across the world have been busy preparing two brand-new international privacy standards. A major milestone was achieved on April 30, 2024 when the Global CBPR System was established. The CBPRs are a voluntary, enforceable, international, accountability-based system that facilitates privacy-respecting data flows among members’ economies. They provide a baseline level of privacy protection for consumers through a set of rules on how to handle people’s personal information. This facilitates the free flow of data by upholding consumer privacy across participating members, despite each jurisdiction having their own individual data protection laws.
The CBPR System was developed by the Global CBPR Forum, an intergovernmental forum between the governments of Australia, Canada, Japan, Republic of Korea, Mexico, Philippines, Singapore, Chinese Taipei, and the United States. The United Kingdom is also an associate member of the CBPR Forum, as are Bermuda, Mauritius, and the Dubai IFC, signifying their intent to join as full members in the future.
Over the last year, we have been busy preparing for the launch of the Global CBPR System. On May 1, 2024 — the very first day after the establishment of the system — Cloudflare applied to join. And we have now achieved the major milestone of successfully completing audits against the requirements, meaning we expect to be the first organization in the world to be newly certified to the Global CBPR system, as well as the related Global Privacy Recognition for Processors, when companies can officially be certified, which is expected later in 2025.

The Global CBPR System contains a detailed list of fifty requirements that organizations must meet in order to be certified under the scheme. The requirements derive from the nine Global CBPR Privacy Principles, which are consistent with the core principles of the Organisation for Economic Co-operation and Development (OECD) Guidelines on the Protection of Privacy and Trans-Border Flows of Personal Data. The fifty requirements cover how organizations should collect, manage, and safeguard personal information in their custody. Organizations must meet every one of the fifty requirements in order to be Global CBPR certified. The nine principles underlying the requirements are:
|
Preventing Harm |
Notice |
Collection Limitation |
|
Uses of Personal Information |
Choice |
Integrity of Personal Information |
|
Security Safeguards |
Access and Correction |
Accountability |
The nine Global CBPR Privacy Principles
The Global CBPR certification covers the handling of personal information controlled by the organization, such as the personal details of customers, employees, and job applicants. For Cloudflare, this also includes network information — our observations about how our global cloud platform handles server, network, or traffic data generated by Cloudflare in the course of providing our services.
The related Global Privacy Recognition for Processors (PRP) certification covers the handling of personal information processed by the organization on behalf of a different organization, usually their customer. The eighteen requirements of the PRP relate to the two privacy principles most relevant when processing this information on behalf of another organization: Security Safeguards and Accountability. For Cloudflare, this covers the processing of data pursuant to the Data Processing Addendum we sign with all of our customers, chiefly, the Customer Content flowing across our network and the Customer Logs generated by those data flows. Organizations must meet every one of the eighteen requirements in order to be Global PRP certified.
As noted, the key requirements of the Global CBPRs and the Global PRP cover the well-known data protection principles of notice, choice, collection limitation (data minimization), the right of data subject access and correction, providing adequate security, preventing harm, integrity of personal information, accountability, and uses of personal information. There are dozens of requirements that cover these principles, so we’ll just touch on a few of them here.
Let’s first look at the principle of notice. One of the more obvious requirements from the CBPRs is question 1:
Do you provide clear and easily accessible statements about your practices and policies that govern the personal information described above (a privacy statement)?
Being transparent about the collection and use of personal information is a key principle of privacy and data protection, and transparency is one of Cloudflare’s core commitments. Documenting our practices and policies in regard to how we use personal information allows individuals to decide if they want to provide their information, and that’s why it’s best practice for the privacy notice to be available and visible at the time the information is being collected. Indeed, this concept of providing notice is clear from Article 13 of the EU’s GDPR. Cloudflare meets this CBPR requirement by providing a clear and accessible privacy notice visible from the footer of each page on our website. We also provide a link to the notice when we collect personal data such as through a form on a webpage.
In terms of how we use personal information, question 8 asks:
Do you limit the use of the personal information you collect (whether directly or through the use of third parties acting on your behalf) as identified in your privacy statement?
It has long been a commitment of Cloudflare’s that we only use the personal information we collect for the purposes of providing the services we offer. Our business is built on providing customers with the tools to protect their network applications and to make them faster, more secure, more reliable, and more private. In our Privacy Policy, we commit that we will “only share or otherwise disclose your personal information as necessary to provide our Services or as otherwise described in this Policy, except in cases where we first provide you with notice and the opportunity to consent.” And we maintain internal documentation (in keeping with the CBPR’s accountability principle) to document the data we are processing and the purposes for which we process it.
Another key set of requirements in both the Global CBPRs and the Global PRP have to do with security safeguards. CBPR requirement question 27 asks:
Describe the physical, technical and administrative safeguards you have implemented to protect personal information against risks such as loss or unauthorized access, destruction, use, modification or disclosure of information or other misuses?
The similar requirement in the Global PRP is question 2:
Describe the physical, technical and administrative safeguards that implement your organization’s information security policy.
Cloudflare has implemented an information security program in accordance with the ISO/IEC 27000 family of standards. Details of Cloudflare’s security program are documented in Annex 2 (“Technical and Organizational Security Measures”) of Cloudflare’s Customer Data Processing Addendum, including the physical, technical and administrative safeguards implemented to protect personal information.
Related to the Accountability principle, question 46 asks:
Do you have mechanisms in place with personal information processors, agents, contractors, or other service providers pertaining to personal information they process on your behalf, to ensure that your obligations to the individual will be met?
When we have vendors who handle any of our, or our customers’, personal information, we require them to sign a Data Processing Addendum with us. This ensures the commitments we make to our customers in our customer agreements in turn flow through to our vendors, including the security requirements — holding them, and us, accountable.
We are excited about the launch of the Global CBPR certifications, expected later in 2025, and we are proud that on this Data Privacy Day, we can yet again demonstrate our commitment to universally held principles for protecting the privacy of personal data.
You can find more about the Global CBPR System, the Global PRP, download a full copy of the requirements, and keep up to date with related news at globalcbpr.org.
For the latest information about our certifications, please visit our Trust Hub. Customers can also find out how to download a copy of Cloudflare’s certifications and reports from the Cloudflare dashboard.

Post Syndicated from Palak Arora original https://aws.amazon.com/blogs/security/announcing-upcoming-changes-to-the-aws-security-token-service-global-endpoint/
AWS launched AWS Security Token Service (AWS STS) in August 2011 with a single global endpoint (https://sts.amazonaws.com), hosted in the US East (N. Virginia) AWS Region. To reduce dependency on a single Region, STS launched AWS STS Regional endpoints (https://sts.{Region_identifier}.{partition_domain}) in February 2015. These Regional endpoints allow you to use STS in the same Region as your workloads, which improves both performance and reliability.
However, many customers and third-party tools continue to call the STS global endpoint, and as a result, these customers don’t get the benefits of STS Regional endpoints. To help improve the resiliency and performance of your applications, we are making changes to the STS global endpoint, with no action required from customers. These changes will be released in the coming weeks.
In this blog post, we discuss the upcoming changes to the STS global endpoint and their benefits, and provide our recommendation on which STS endpoint to use going forward.
The changes being made to the STS global endpoint will help enhance resiliency and improve performance. Today, all the requests to the STS global endpoint are served by the US East (N. Virginia) Region. Starting in early 2025, requests to the STS global endpoint will be automatically served in the same Region as your AWS deployed workloads. For example, if your application calls sts.amazonaws.com from the US West (Oregon) Region, your calls will be served locally in the US West (Oregon) Region instead of being served by the US East (N. Virginia) Region.
With this change, requests to the STS global endpoint will be served locally if your request originated from AWS Regions that are enabled by default.1 However, requests to the STS global endpoint will continue to be served in US East (N. Virginia) Region if your request originated from opt-in Regions or if you used STS from outside AWS, such as in your on-premises network or data centers.
We will gradually roll out this change to AWS Regions that are enabled by default by mid-2025, starting with the Europe (Stockholm) Region.
We’ve taken the following measures to help avoid disruptions to your existing processes:
endpointType and awsServingRegion to clarify which endpoint and Region served the request.sts.amazonaws.com endpoints will have a value of us-east-1 for the aws:RequestedRegion condition key, regardless of which Region served the request.sts.amazonaws.com endpoints will not share a request quota with the Regional STS endpoints. 1. In addition, for your requests to be served locally, your DNS request for sts.amazonaws.com must be handled by an Amazon DNS Server in Amazon Virtual Private Cloud (Amazon VPC).
We continue to recommend that you use the appropriate STS Regional endpoints whenever possible. If you’re using STS from outside AWS, such as in your on-premises networks or data centers, we recommend you use the STS Regional endpoint that is hosted in the same Region as the AWS resource that you need STS credentials to access. If you’re building in opt-in Regions such as Asia Pacific (Hong Kong) or Asia Pacific (Jakarta), we recommend that you use the STS endpoint from the opt-in Region that is hosting your workload. By following the steps in the blog post How to use Regional AWS STS endpoints, you can identify workloads that are still using the global STS endpoint and get insights into how to reconfigure them when required.
If you have feedback about this blog post, submit comments in the Comments section below. If you have questions about this post, contact AWS Support.
Post Syndicated from Omer Yoachimik original https://blog.cloudflare.com/cloudflare-thwarts-over-47-million-cyberthreats-against-jewish-and-holocaust/
January 27 marks the International Holocaust Remembrance Day — a solemn occasion to honor the memory of the six million Jews who perished in the Holocaust, along with countless others who fell victim to the Nazi regime’s campaign of hatred and intolerance. This tragic chapter in human history serves as a stark reminder of the catastrophic consequences of prejudice and extremism.
The United Nations General Assembly designated January 27 — the anniversary of the liberation of Auschwitz-Birkenau — as International Holocaust Remembrance Day. This year, we commemorate the 80th anniversary of the liberation of this infamous extermination camp.
As the world reflects on this dark period, a troubling resurgence of antisemitism underscores the importance of vigilance. This growing hatred has spilled into the digital realm, with cyberattacks increasingly targeting Jewish and Holocaust remembrance and educational websites — spaces dedicated to preserving historical truth and fostering awareness.
For this reason, here at Cloudflare, we began to publish annual reports covering cyberattacks that target these organizations. These cyberattacks include DDoS attacks as well as bot and application attacks. The insights and trends are based on websites protected by Cloudflare. This is our fourth report, and you can view our previous Holocaust Remembrance Day blogs here.
At Cloudflare, we are proud to support these vital organizations through Project Galileo, an initiative providing free security protections to vulnerable groups worldwide. If you or your organization could benefit from this program, consider applying today to help protect these essential platforms and the invaluable work they do.
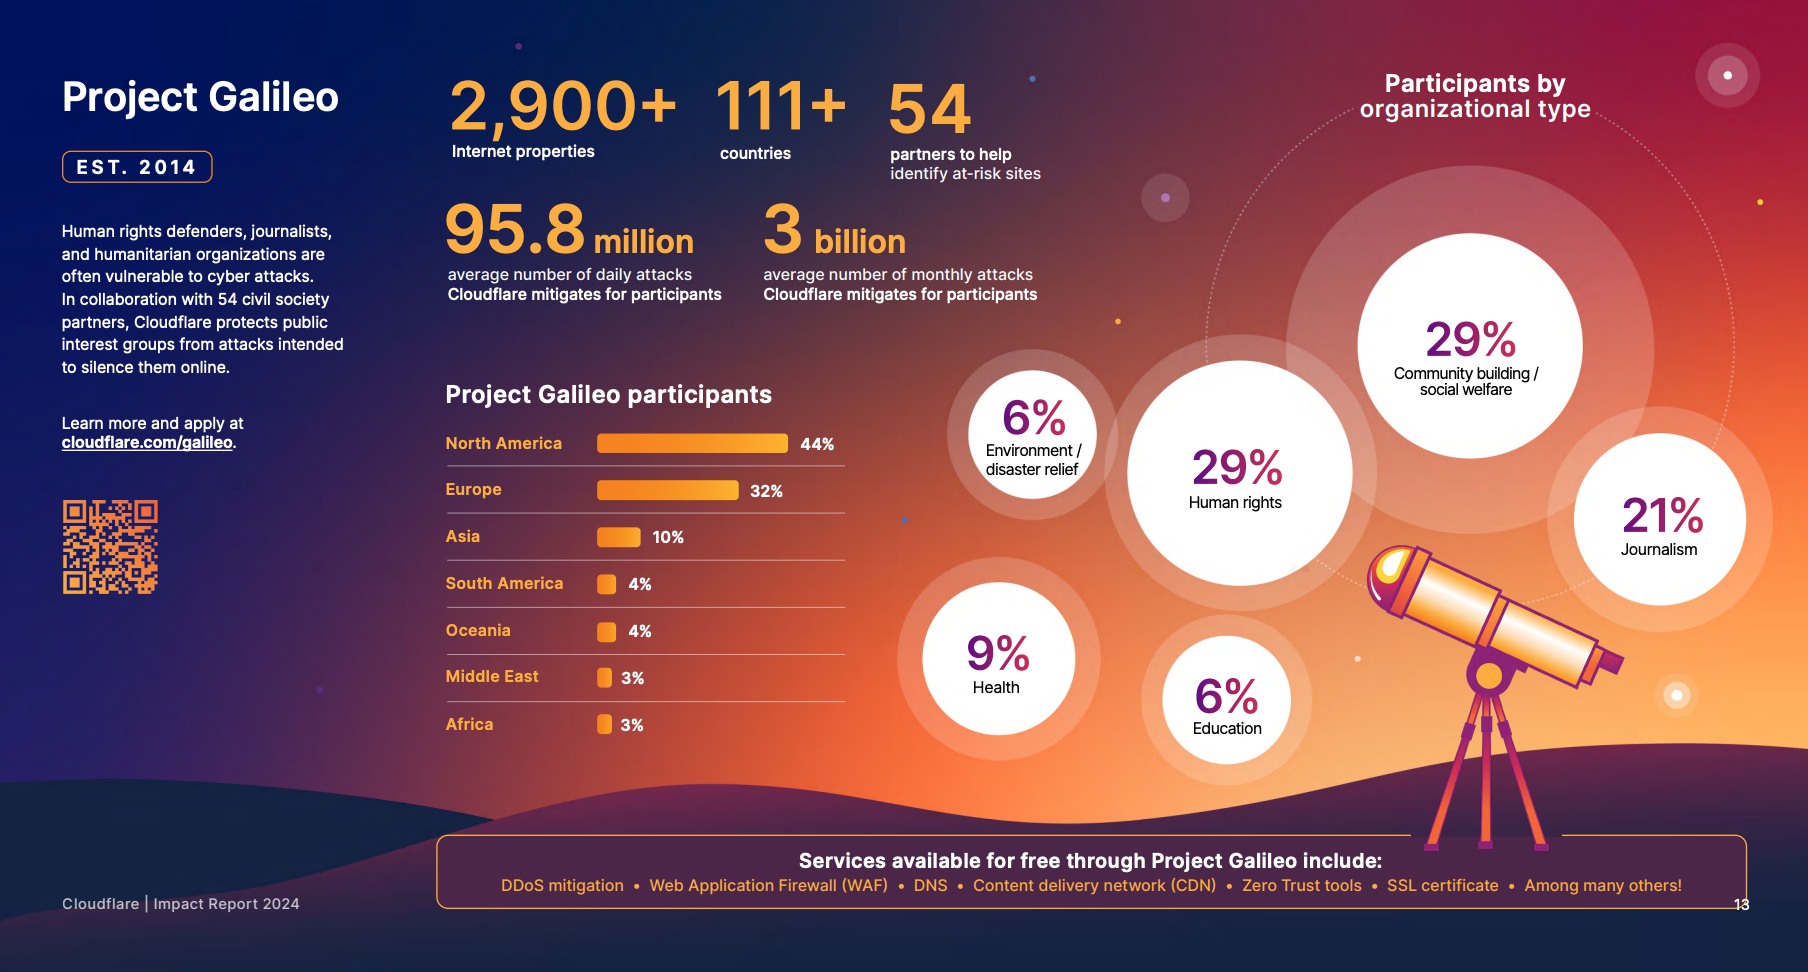
Project Galileo overview. Source: Cloudflare 2024 Impact Report
One of the organizations that we protect through Project Galileo is Muzeon, a museum dedicated to preserving Jewish history in Cluj-Napoca, Romania. Muzeon faced significant cyberattacks that impacted their website’s performance and hindered operations before using Cloudflare.
As part of Project Galileo, Muzeon implemented Cloudflare’s DDoS mitigation, Web Application Firewall (WAF), Managed DNS, and other services. These measures drastically reduced the attacks and allowed Muzeon to focus on its important mission of storytelling and preserving cultural heritage.
Cloudflare’s solutions not only protected their digital infrastructure but also freed up time for Muzeon to expand its interactive exhibits, ensuring they could continue sharing their essential work globally. You can read more about this case study here.
Following the October 7, 2023, Hamas-led attack on Israel, there has been a surge in global antisemitic incidents. In the U.S. alone there have been more than 10,000 antisemitic incidents from October 7, 2023 to September 24, 2024, representing an over 200-percent increase compared to the incidents reported during the same period a year before. As we’ve seen, the digital world is often a mirror to the real world. As a result, it is not surprising that websites dedicated to sharing information about the Holocaust, as well as Jewish memorial and education platforms, are now increasingly being targeted online.
For the years 2020, 2021, and 2022, the number of cyberthreats targeting Holocaust and Jewish educational and memorial websites protected by Cloudflare was, on average, 736,339 malicious HTTP requests annually.
After the October 7 Hamas-led attack, cyberattacks skyrocketed. In 2023, the amount of blocked HTTP requests surged by 872% to 35.7 million compared to 2022. Most of these cyberattacks occurred after October 7, 2023.
In 2024, the number of blocked HTTP requests exceeded 47 million — representing a 30% increase compared to 2023. Over 3 out of every 100 HTTP requests towards Holocaust and Jewish memorial and education websites protected by Cloudflare were malicious and blocked.
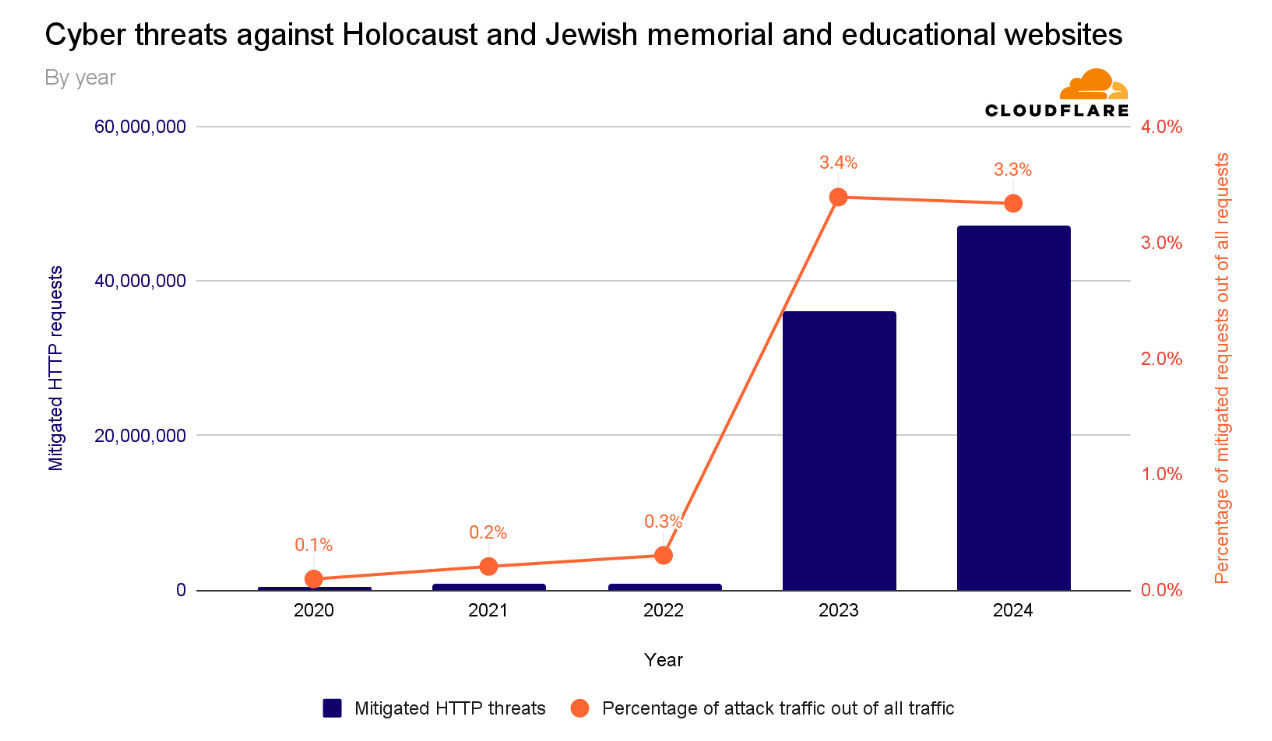
Cyber threats against Holocaust and Jewish memorial and educational websites by year
In the fourth quarter of 2023, the volume of malicious requests exceeded 27 million. Throughout the first three quarters of 2024, we saw a gradual decrease in the quantity of malicious requests. But in the fourth quarter of 2024, cyberattacks spiked by 33%, to 36 million requests, following the one-year anniversary of the October 7 assault.
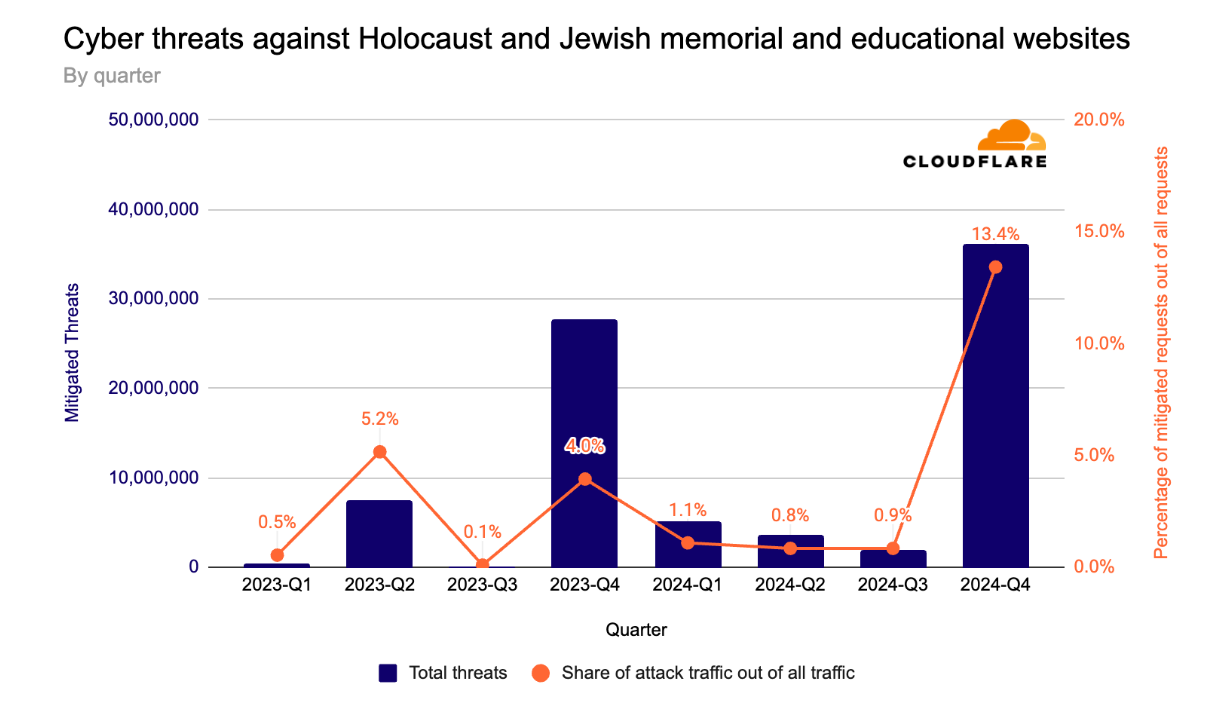
Cyber threats against Holocaust and Jewish memorial and educational websites by quarter
Breaking down the quarters into months, we can see an initial peak in October 2023 after the October 7 Hamas-led attack. The volume of cyberattacks remained elevated during November and December 2023.
Afterward, as we entered 2024, the quantity and percentage of cyberattacks against these websites significantly decreased. In November, over a third (34%) of all requests towards these websites were blocked, with over 36 million requests blocked that month alone.
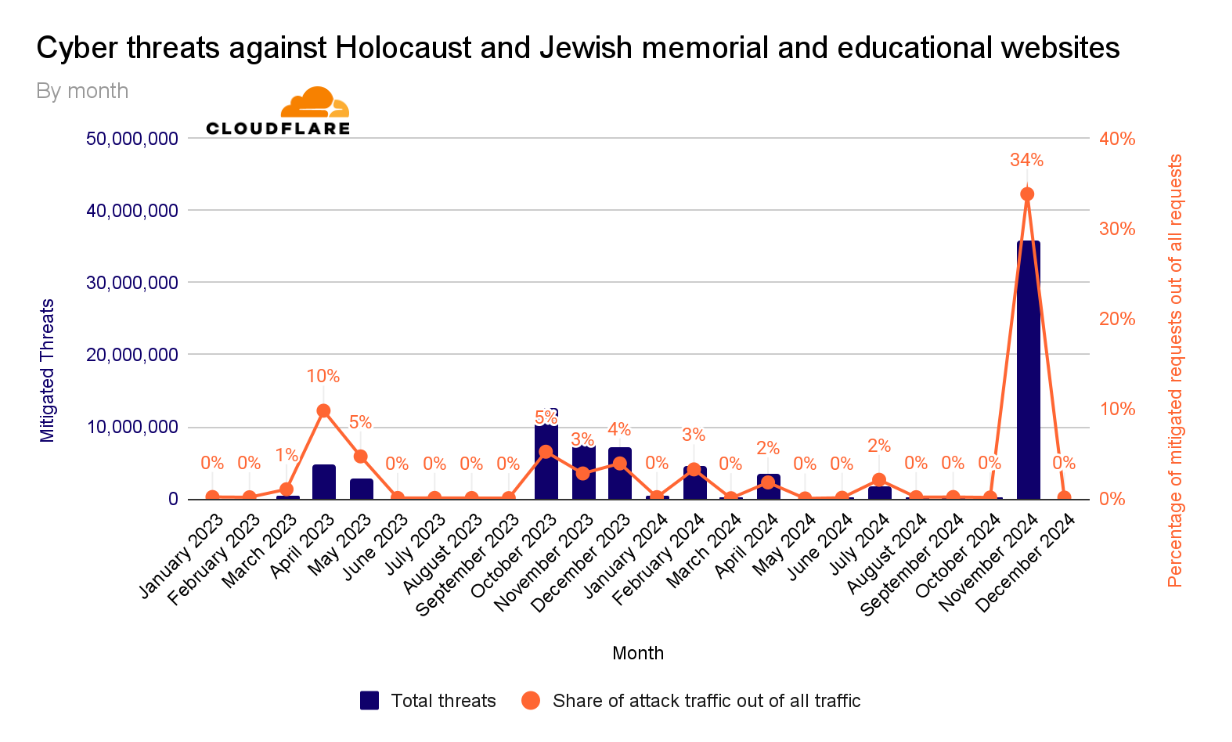
Cyber threats against Holocaust and Jewish memorial and educational websites by month
On the International Holocaust Remembrance Day, we reflect on the importance of standing against both antisemitism and cyber threats — issues that have escalated since the October 7, 2023, Hamas-led attack.
At Cloudflare, we are unwavering in our commitment to create a safer, more inclusive Internet. The rise in antisemitism has made it even more critical to protect educational websites and communities from harmful cyber attacks. We invite everyone to join us in this fight. Even with our free plan, we offer strong security and performance, ensuring that vital resources and websites remain safe and accessible. By working together, we can protect the lessons of history and foster a more secure digital world for all.
Post Syndicated from digiblur DIY original https://www.youtube.com/watch?v=47bbvaCtFWI
Post Syndicated from Carter Spriggs original https://aws.amazon.com/blogs/security/building-a-culture-of-security-aws-partners-with-the-bbc/
Cybersecurity isn’t just about technology—it’s about people. That’s why Amazon Web Services (AWS) partnered with the BBC to explore the human side of cybersecurity in our latest article, The Human Side of Cybersecurity: Building a Culture of Security, available on the BBC website.
In the piece, we spotlight the AWS Security Guardians program and how it helps security enable your business, not slow it down. Through the program, teams are provided tools, resources, and guidance to help address security concerns at every step of development. This enables developers to make the right decisions and embed security deeper in their solutions. Using our approach with their Security Champions initiative, the Commonwealth Bank of Australia shared how the program has helped transform their company culture and give ownership of services and security directly to their teams.
AWS and the Commonwealth Bank sought to understand how they could foster a culture where employees not only understand security, but care about it. They both needed a way to support new technology innovation while reducing security remediation work. This challenge offered both companies an opportunity to try something new with their Security Champions programs, enabling security expertise to be distributed across their respective organizations, which created a scalable solution with measurable results.
Read the full article on the BBC website to discover how AWS and our customers are creating a better environment for our teams, colleagues, customers, and communities.
If you have feedback about this post, submit comments in the Comments section below. If you have questions about this post, contact AWS Support.
Post Syndicated from Tea Jioshvili original https://aws.amazon.com/blogs/security/2024-c5-type-2-attestation-report-available-with-179-services-in-scope/
Amazon Web Services (AWS) is pleased to announce a successful completion of the 2024 Cloud Computing Compliance Controls Catalogue (C5) attestation cycle with 179 services in scope. This alignment with C5 requirements demonstrates our ongoing commitment to adhere to the heightened expectations for cloud service providers. AWS customers in Germany and across Europe can run their applications in the AWS Regions that are in scope of the C5 report with the assurance that AWS aligns with C5 criteria.
The C5 attestation scheme is backed by the German government and was introduced by the Federal Office for Information Security (BSI) in 2016. AWS has adhered to the C5 requirements since their inception. C5 helps organizations demonstrate operational security against common cybersecurity threats when using cloud services.
Independent third-party auditors evaluated AWS for the period of October 1, 2023, through September 30, 2024. The C5 report illustrates the compliance status of AWS for both the basic and additional criteria of C5. Customers can download the C5 report through AWS Artifact, a self-service portal for on-demand access to AWS compliance reports. Sign in to AWS Artifact in the AWS Management Console, or learn more at Getting Started with AWS Artifact.
AWS has added the following 10 services to the current C5 scope:
The following AWS Regions are in scope of the 2024 C5 attestation: Europe (Frankfurt), Europe (Ireland), Europe (London), Europe (Milan), Europe (Paris), Europe (Stockholm), Europe (Spain), Europe (Zurich), and Asia Pacific (Singapore). For up-to-date information, see the C5 page of our AWS Services in Scope by Compliance Program.
AWS strives to continuously bring services into the scope of its compliance programs to help you meet your architectural and regulatory needs. If you have questions or feedback about C5 compliance, reach out to your AWS account team.
To learn more about our compliance and security programs, see AWS Compliance Programs. As always, we value your feedback and questions; reach out to the AWS Compliance team through the Contact Us page.
If you have feedback about this post, submit comments in the Comments section below.
Post Syndicated from Sébastien Stormacq original https://aws.amazon.com/blogs/aws/aws-weekly-roundup-eventbridge-sns-fifo-amazon-corretto-amazon-connect-amazon-bedrock-and-more/
I counted about 40 new launches from AWS since last week – back to our normal rhythm of releases. Services teams are listening to your feedback and developing little (or big) changes that makes your life easier when working with our services. The ability to support multiple sessions in the AWS Console is my favorite one so far in 2025.
But our teams didn’t stop there, let’s look at the last week’s new announcements.
Last week’s launches
Beside the usual Regional expansion (new capabilities that are now available in a new Region), here are the launches that got my attention.
Amazon EventBridge announces direct delivery to cross-account targets – Amazon EventBridge is now able to deliver events to targets in another AWS account directly without having to send them to the default bus in the target account first. This will simplify so many architectures out there! It supports any target that supports resource-based policies, including AWS Lambda, Amazon Simple Queue Service (Amazon SQS), Amazon Simple Notification Service (Amazon SNS), Amazon Kinesis, and Amazon API Gateway.
Amazon Corretto quaterly update – We announced quarterly security and critical updates for Amazon Corretto Long-Term Supported (LTS) and Feature Release (FR) versions of OpenJDK. Corretto 23.0.2, 21.0.6, 17.0.14, 11.0.26, 8u442 are now available for download. Amazon Corretto is a no-cost, multi-platform, production-ready distribution of OpenJDK. You can download the updates from the Corretto home page or just type apt-get or yum update.
High-throughput mode for Amazon SNS FIFO Topics – Amazon SNS now supports high-throughput mode for SNS FIFO topics, with default throughput matching SNS standard topics across all Regions. When you enable high-throughput mode, SNS FIFO topics will maintain order within message group, while reducing the deduplication scope to the message-group level. With this change, you can leverage up to 30K messages per second (MPS) per account by default in US East (N. Virginia) Region, and 9K MPS per account in US West (Oregon) and Europe (Ireland) Regions, and request quota increases for additional throughput in any Region.
Amazon Connect agent workspace now supports audio optimization for Citrix and Amazon WorkSpaces virtual desktops – Amazon Connect agent workspace now supports the ability to redirect audio from Citrix and Amazon WorkSpaces Virtual Desktop Infrastructure (VDI) environments to a customer service agent’s local device. Audio redirection improves voice quality and reduces latency for voice calls handled on virtual desktops, providing a better experience for both end customers and agents.
Amazon Redshift announces support for History Mode for zero-ETL integrations – This new capability enables you to build Type 2 Slowly Changing Dimension (SCD 2) tables on your historical data from databases, out-of-the-box in Amazon Redshift, without writing any code. History mode simplifies the process of tracking and analyzing historical data changes, allowing you to gain valuable insights from your data’s evolution over time.
Finally, Amazon Bedrock has its own set of announcements. First, for anyone investing in retrieval-augmented generation, Bedrock now support multimodal content with Cohere Embed 3 Multilingual and Embed 3 English models. This enables you to create embeddings to not only index text, but also images.
Second, read Luma AI’s Ray2 visual AI model now available in Amazon Bedrock. Luma Ray2 is a large-scale video-generation model capable of creating realistic visuals with fluid, natural movement. With Luma Ray2 in Amazon Bedrock, you can generate production-ready video clips with seamless animations, ultrarealistic details, and logical event sequences with natural language prompts, removing the need for technical prompt engineering. Ray2 currently supports 5- and 9-second video generations with 540p and 720p resolution.
And finally, Amazon Bedrock Flows announces preview of multi-turn conversation support. Amazon Bedrock Flows enables you to link foundation models (FMs), Amazon Bedrock Prompts, Amazon Bedrock Agents, Amazon Bedrock Knowledge Bases, Amazon Bedrock Guardrails and other AWS services together to build and scale pre-defined generative AI workflows. This week, the team announced preview of multi-turn conversation support for agent nodes in Flows. This capability enables dynamic, back-and-forth conversations between users and flows, similar to a natural dialogue.
For a full list of AWS announcements, be sure to keep an eye on the What’s New at AWS page.
Other AWS events
Check your calendar and sign up for upcoming AWS events.
AWS Summits season is starting! I’m already working with the local team to prepare content for the Summits in Paris and London. Summits are free online and in-person events that bring the cloud computing community together to connect, collaborate, and learn about AWS. Stay updated by visiting the official AWS Summit website and sign up for notifications to learn when registration opens for events in your area.
AWS GenAI Lofts are collaborative spaces and immersive experiences that showcase AWS expertise in cloud computing and AI. They provide startups and developers with hands-on access to AI products and services, exclusive sessions with industry leaders, and valuable networking opportunities with investors and peers. Find a GenAI Loft location near you, and don’t forget to register.
Browse all upcoming AWS led in-person and virtual events here.
That’s all for this week. Check back next Monday for another Weekly Roundup!
This post is part of our Weekly Roundup series. Check back each week for a quick roundup of interesting news and announcements from AWS!
Post Syndicated from corbet original https://lwn.net/Articles/1006328/
The DistroWatch
January 27 edition includes this interesting tidbit:
Starting on January 19, 2025 Facebook’s internal policy makers
decided that Linux is malware and labeled groups associated with
Linux as being “cybersecurity threats”. Any posts mentioning
DistroWatch and multiple groups associated with Linux and Linux
discussions have either been shut down or had many of their posts
removed.We’ve been hearing all week from readers who say they can no longer
post about Linux on Facebook or share links to DistroWatch. Some
people have reported their accounts have been locked or limited for
posting about Linux.
One can only hope that this is a mistake that will be resolved soon.
Post Syndicated from jzb original https://lwn.net/Articles/1005655/
The Go language is designed to make it
easy for developers to import other
Go packages and compile everything into a static binary
for simple distribution. Unfortunately, this complicates things for
those who package Go programs for Linux distributions, such as Fedora,
that have guidelines which require dependencies to be packaged
separately. Fedora’s Go special interest
group (SIG) is asking for relief and a loosening of the bundling
guidelines to allow Go packagers to bundle dependencies into the
packages that need them, otherwise known as vendoring. So far, the
participants in the discussion have seemed largely in favor of the
idea.
Post Syndicated from jake original https://lwn.net/Articles/1006261/
Security updates have been issued by AlmaLinux (git-lfs, java-17-openjdk, java-21-openjdk, kernel, and python-jinja2), Debian (git and git-lfs), Fedora (buildah, chromium, containers-common, freeipa, glibc, golang, mediawiki, pam-u2f, podman, and rsync), Mageia (glibc, iperf, openssl, phpmyadmin, and poppler), Oracle (firefox, git-lfs, grafana, java-17-openjdk, java-21-openjdk, kernel, python-jinja2, and redis:6), and SUSE (chromium, go1.22-1.22.11-1.1, go1.23-1.23.5-1.1, go1.24-1.24rc2-1.1, java-11-openjdk, kernel, libopenssl-3-devel, libQt6Bluetooth6, nodejs18, nodejs20, python311-azure-storage-blob, qt6-connectivity, and ruby3.4-rubygem-nokogiri-1.18.2-1.1).
Post Syndicated from Constantin Pan original https://blog.cloudflare.com/how-we-make-sense-of-too-much-data/
Cloudflare’s network provides an enormous array of services to our customers. We collect and deliver associated data to customers in the form of event logs and aggregated analytics. As of December 2024, our data pipeline is ingesting up to 706M events per second generated by Cloudflare’s services, and that represents 100x growth since our 2018 data pipeline blog post.
At peak, we are moving 107 GiB/s of compressed data, either pushing it directly to customers or subjecting it to additional queueing and batching.
All of these data streams power things like Logs, Analytics, and billing, as well as other products, such as training machine learning models for bot detection. This blog post is focused on techniques we use to efficiently and accurately deal with the high volume of data we ingest for our Analytics products. A previous blog post provides a deeper dive into the data pipeline for Logs.
The pipeline can be roughly described by the following diagram.
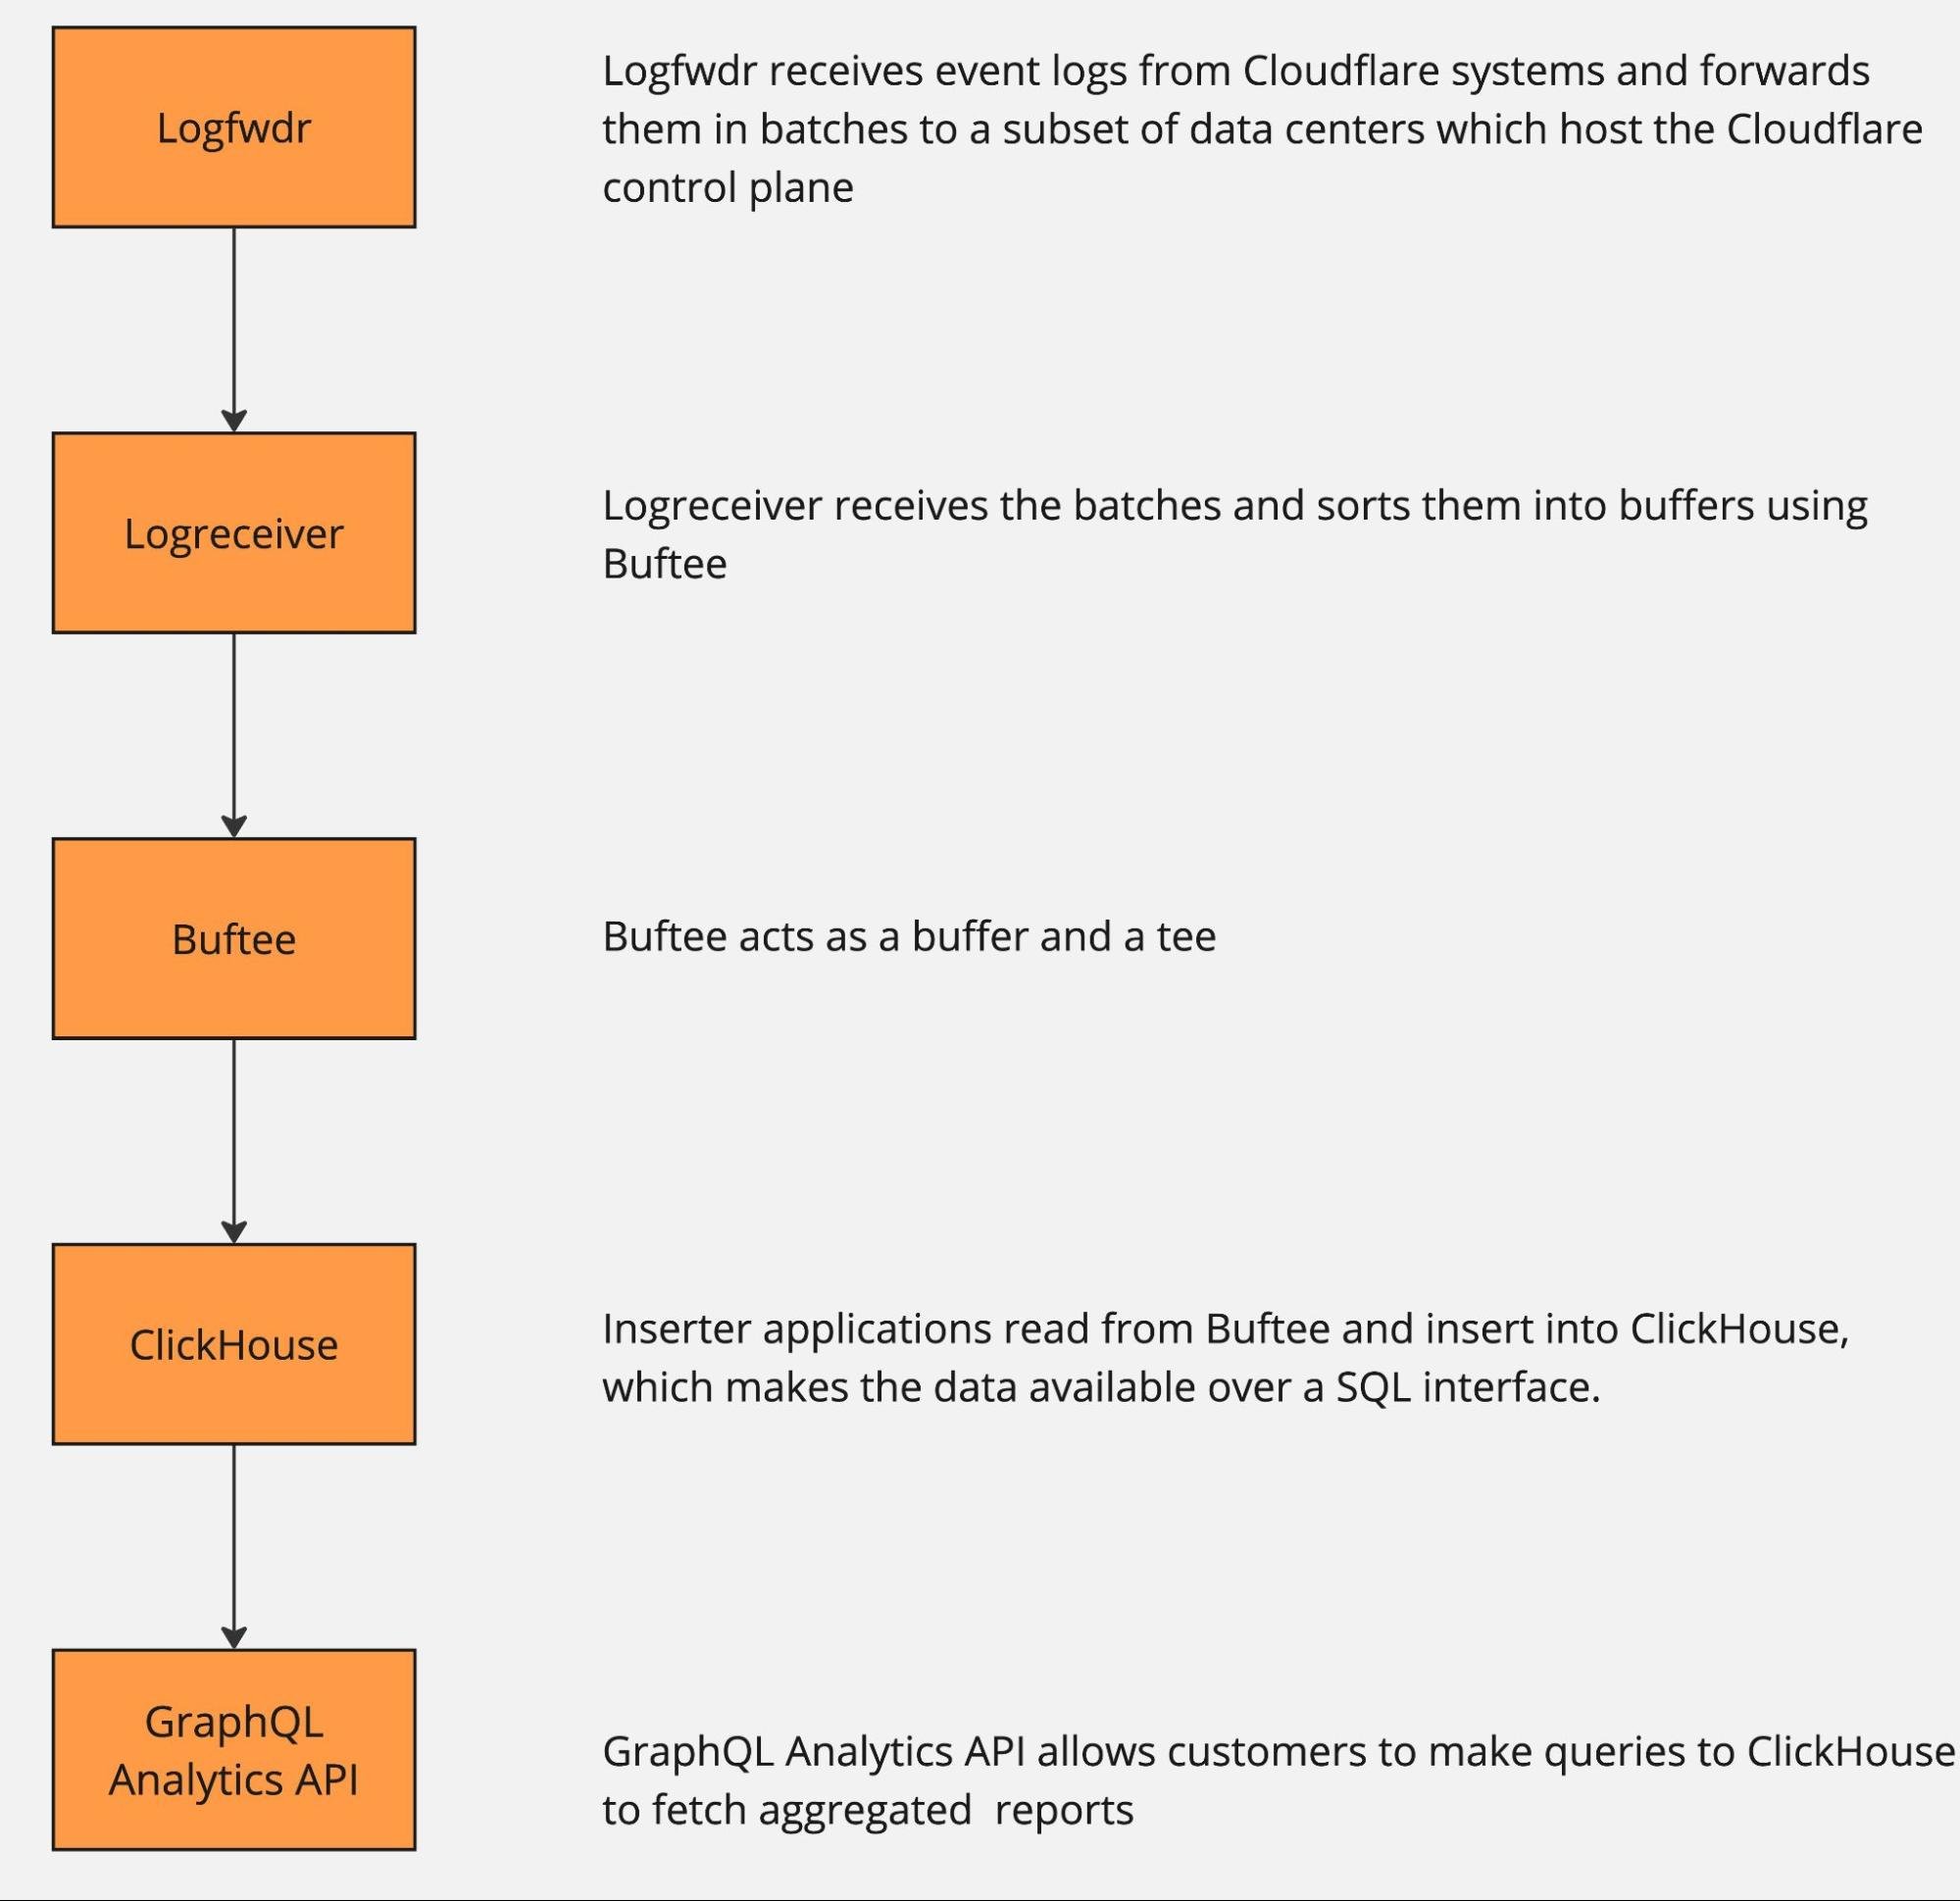
The data pipeline has multiple stages, and each can and will naturally break or slow down because of hardware failures or misconfiguration. And when that happens, there is just too much data to be able to buffer it all for very long. Eventually some will get dropped, causing gaps in analytics and a degraded product experience unless proper mitigations are in place.
How does one retain valuable information from more than half a billion events per second, when some must be dropped? Drop it in a controlled way, by downsampling.
Here is a visual analogy showing the difference between uncontrolled data loss and downsampling. In both cases the same number of pixels were delivered. One is a higher resolution view of just a small portion of a popular painting, while the other shows the full painting, albeit blurry and highly pixelated.

As we noted above, any point in the pipeline can fail, so we want the ability to downsample at any point as needed. Some services proactively downsample data at the source before it even hits Logfwdr. This makes the information extracted from that data a little bit blurry, but much more useful than what otherwise would be delivered: random chunks of the original with gaps in between, or even nothing at all. The amount of “blur” is outside our control (we make our best effort to deliver full data), but there is a robust way to estimate it, as discussed in the next section.
Logfwdr can decide to downsample data sitting in the buffer when it overflows. Logfwdr handles many data streams at once, so we need to prioritize them by assigning each data stream a weight and then applying max-min fairness to better utilize the buffer. It allows each data stream to store as much as it needs, as long as the whole buffer is not saturated. Once it is saturated, streams divide it fairly according to their weighted size.
In our implementation (Go), each data stream is driven by a goroutine, and they cooperate via channels. They consult a single tracker object every time they allocate and deallocate memory. The tracker uses a max-heap to always know who the heaviest participant is and what the total usage is. Whenever the total usage goes over the limit, the tracker repeatedly sends the “please shed some load” signal to the heaviest participant, until the usage is again under the limit.
The effect of this is that healthy streams, which buffer a tiny amount, allocate whatever they need without losses. But any lagging streams split the remaining memory allowance fairly.
We downsample more or less uniformly, by always taking some of the least downsampled batches from the buffer (using min-heap to find those) and merging them together upon downsampling.
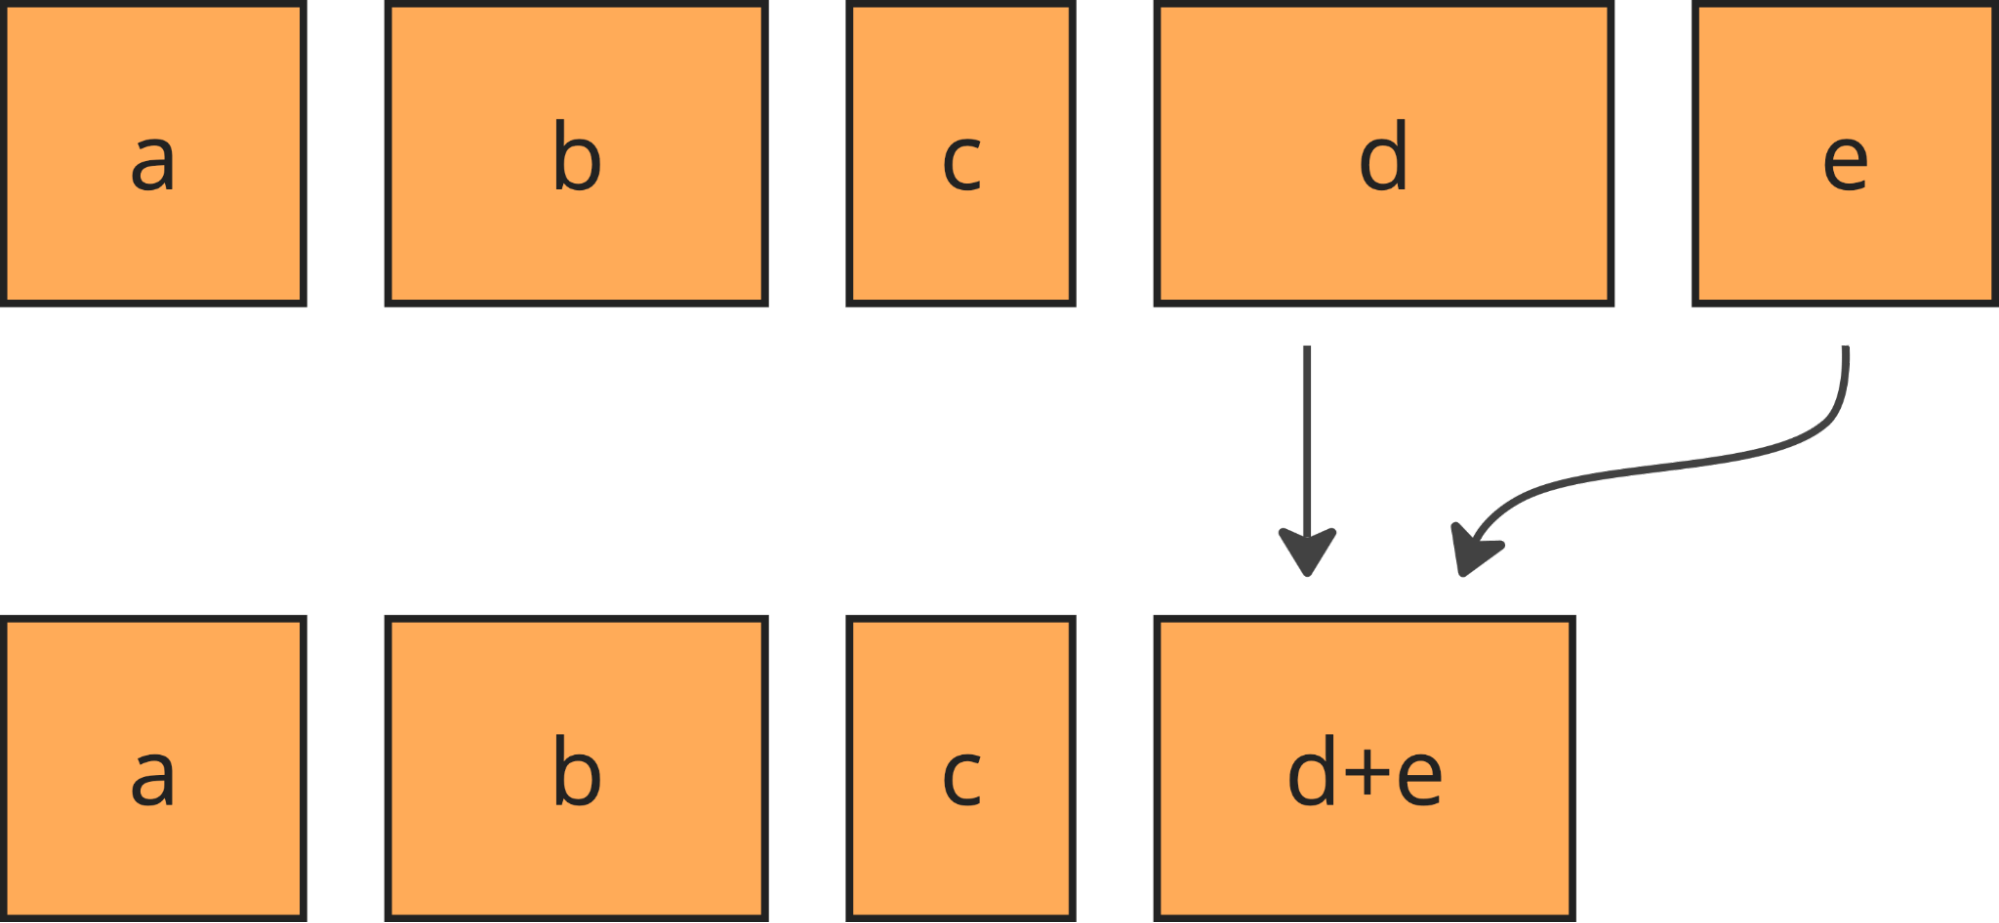
Merging keeps the batches roughly the same size and their number under control.
Downsampling is cheap, but since data in the buffer is compressed, it causes recompression, which is the single most expensive thing we do to the data. But using extra CPU time is the last thing you want to do when the system is under heavy load! We compensate for the recompression costs by starting to downsample the fresh data as well (before it gets compressed for the first time) whenever the stream is in the “shed the load” state.
We called this approach “bottomless buffers”, because you can squeeze effectively infinite amounts of data in there, and it will just automatically be thinned out. Bottomless buffers resemble reservoir sampling, where the buffer is the reservoir and the population comes as the input stream. But there are some differences. First is that in our pipeline the input stream of data never ends, while reservoir sampling assumes it ends to finalize the sample. Secondly, the resulting sample also never ends.
Let’s look at the next stage in the pipeline: Logreceiver. It sits in front of a distributed queue. The purpose of logreceiver is to partition each stream of data by a key that makes it easier for Logpush, Analytics inserters, or some other process to consume.
Logreceiver proactively performs adaptive sampling of analytics. This improves the accuracy of analytics for small customers (receiving on the order of 10 events per day), while more aggressively downsampling large customers (millions of events per second). Logreceiver then pushes the same data at multiple resolutions (100%, 10%, 1%, etc.) into different topics in the distributed queue. This allows it to keep pushing something rather than nothing when the queue is overloaded, by just skipping writing the high-resolution samples of data.
The same goes for Inserters: they can skip reading or writing high-resolution data. The Analytics APIs can skip reading high resolution data. The analytical database might be unable to read high resolution data because of overload or degraded cluster state or because there is just too much to read (very wide time range or very large customer). Adaptively dropping to lower resolutions allows the APIs to return some results in all of those cases.
Okay, we have some downsampled data in the analytical database. It looks like the original data, but with some rows missing. How do we make sense of it? How do we know if the results can be trusted?
Let’s look at the math.
Since the amount of sampling can vary over time and between nodes in the distributed system, we need to store this information along with the data. With each event $x_i$ we store its sample interval, which is the reciprocal to its inclusion probability $\pi_i = \frac{1}{\text{sample interval}}$. For example, if we sample 1 in every 1,000 events, each of the events included in the resulting sample will have its $\pi_i = 0.001$, so the sample interval will be 1,000. When we further downsample that batch of data, the inclusion probabilities (and the sample intervals) multiply together: a 1 in 1,000 sample from a 1 in 1,000 sample is a 1 in 1,000,000 sample of the original population. The sample interval of an event can also be interpreted roughly as the number of original events that this event represents, so in the literature it is known as weight $w_i = \frac{1}{\pi_i}$.
We rely on the Horvitz-Thompson estimator (HT, paper) in order to derive analytics about $x_i$. It gives two estimates: the analytical estimate (e.g. the population total or size) and the estimate of the variance of that estimate. The latter enables us to figure out how accurate the results are by building confidence intervals. They define ranges that cover the true value with a given probability (confidence level). A typical confidence level is 0.95, at which a confidence interval (a, b) tells that you can be 95% sure the true SUM or COUNT is between a and b.
So far, we know how to use the HT estimator for doing SUM, COUNT, and AVG.
Given a sample of size $n$, consisting of values $x_i$ and their inclusion probabilities $\pi_i$, the HT estimator for the population total (i.e. SUM) would be
$$\widehat{T}=\sum_{i=1}^n{\frac{x_i}{\pi_i}}=\sum_{i=1}^n{x_i w_i}.$$
The variance of $\widehat{T}$ is:
$$\widehat{V}(\widehat{T}) = \sum_{i=1}^n{x_i^2 \frac{1 – \pi_i}{\pi_i^2}} + \sum_{i \neq j}^n{x_i x_j \frac{\pi_{ij} – \pi_i \pi_j}{\pi_{ij} \pi_i \pi_j}},$$
where $\pi_{ij}$ is the probability of both $i$-th and $j$-th events being sampled together.
We use Poisson sampling, where each event is subjected to an independent Bernoulli trial (“coin toss”) which determines whether the event becomes part of the sample. Since each trial is independent, we can equate $\pi_{ij} = \pi_i \pi_j$, which when plugged in the variance estimator above turns the right-hand sum to zero:
$$\widehat{V}(\widehat{T}) = \sum_{i=1}^n{x_i^2 \frac{1 – \pi_i}{\pi_i^2}} + \sum_{i \neq j}^n{x_i x_j \frac{0}{\pi_{ij} \pi_i \pi_j}},$$
thus
$$\widehat{V}(\widehat{T}) = \sum_{i=1}^n{x_i^2 \frac{1 – \pi_i}{\pi_i^2}} = \sum_{i=1}^n{x_i^2 w_i (w_i-1)}.$$
For COUNT we use the same estimator, but plug in $x_i = 1$. This gives us:
$$\begin{align}
\widehat{C} &= \sum_{i=1}^n{\frac{1}{\pi_i}} = \sum_{i=1}^n{w_i},\\
\widehat{V}(\widehat{C}) &= \sum_{i=1}^n{\frac{1 – \pi_i}{\pi_i^2}} = \sum_{i=1}^n{w_i (w_i-1)}.
\end{align}$$
For AVG we would use
$$\begin{align}
\widehat{\mu} &= \frac{\widehat{T}}{N},\\
\widehat{V}(\widehat{\mu}) &= \frac{\widehat{V}(\widehat{T})}{N^2},
\end{align}$$
if we could, but the original population size $N$ is not known, it is not stored anywhere, and it is not even possible to store because of custom filtering at query time. Plugging $\widehat{C}$ instead of $N$ only partially works. It gives a valid estimator for the mean itself, but not for its variance, so the constructed confidence intervals are unusable.
In all cases the corresponding pair of estimates are used as the $\mu$ and $\sigma^2$ of the normal distribution (because of the central limit theorem), and then the bounds for the confidence interval (of confidence level ) are:
$$\Big( \mu – \Phi^{-1}\big(\frac{1 + \alpha}{2}\big) \cdot \sigma, \quad \mu + \Phi^{-1}\big(\frac{1 + \alpha}{2}\big) \cdot \sigma\Big).$$
We do not know the N, but there is a workaround: simultaneous confidence intervals. Construct confidence intervals for SUM and COUNT independently, and then combine them into a confidence interval for AVG. This is known as the Bonferroni method. It requires generating wider (half the “inconfidence”) intervals for SUM and COUNT. Here is a simplified visual representation, but the actual estimator will have to take into account the possibility of the orange area going below zero.
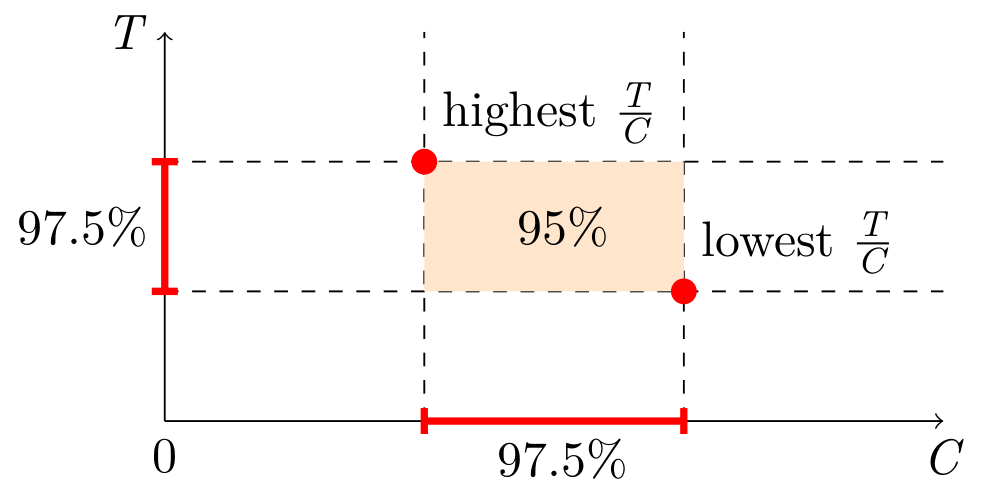
In SQL, the estimators and confidence intervals look like this:
WITH sum(x * _sample_interval)                              AS t,
     sum(x * x * _sample_interval * (_sample_interval - 1)) AS vt,
     sum(_sample_interval)                                  AS c,
     sum(_sample_interval * (_sample_interval - 1))         AS vc,
     -- ClickHouse does not expose the erf⁻¹ function, so we precompute some magic numbers,
     -- (only for 95% confidence, will be different otherwise):
     --   1.959963984540054 = Φ⁻¹((1+0.950)/2) = √2 * erf⁻¹(0.950)
     --   2.241402727604945 = Φ⁻¹((1+0.975)/2) = √2 * erf⁻¹(0.975)
     1.959963984540054 * sqrt(vt) AS err950_t,
     1.959963984540054 * sqrt(vc) AS err950_c,
     2.241402727604945 * sqrt(vt) AS err975_t,
     2.241402727604945 * sqrt(vc) AS err975_c
SELECT t - err950_t AS lo_total,
       t            AS est_total,
       t + err950_t AS hi_total,
       c - err950_c AS lo_count,
       c            AS est_count,
       c + err950_c AS hi_count,
       (t - err975_t) / (c + err975_c) AS lo_average,
       t / c                           AS est_average,
       (t + err975_t) / (c - err975_c) AS hi_average
FROM ...
Construct a confidence interval for each timeslot on the timeseries, and you get a confidence band, clearly showing the accuracy of the analytics. The figure below shows an example of such a band in shading around the line.
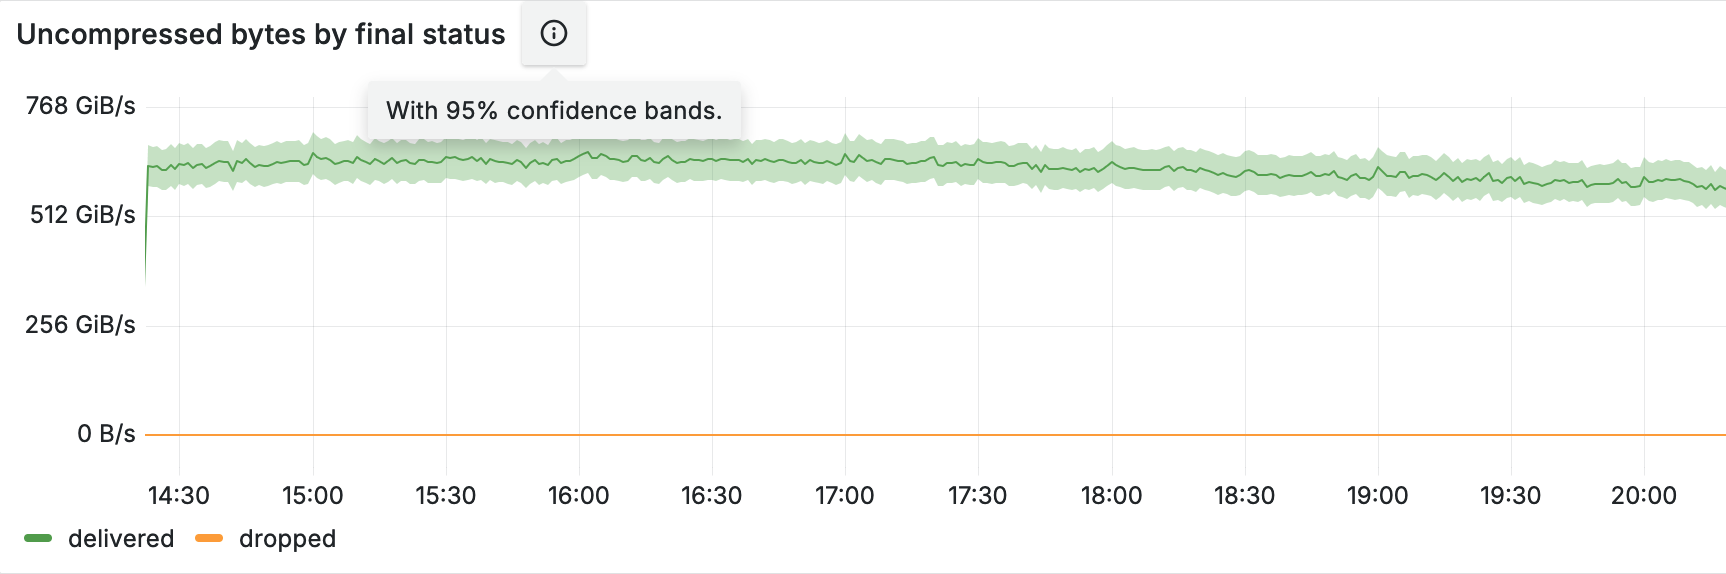
We started using confidence bands on our internal dashboards, and after a while noticed something scary: a systematic error! For one particular website the “total bytes served” estimate was higher than the true control value obtained from rollups, and the confidence bands were way off. See the figure below, where the true value (blue line) is outside the yellow confidence band at all times.
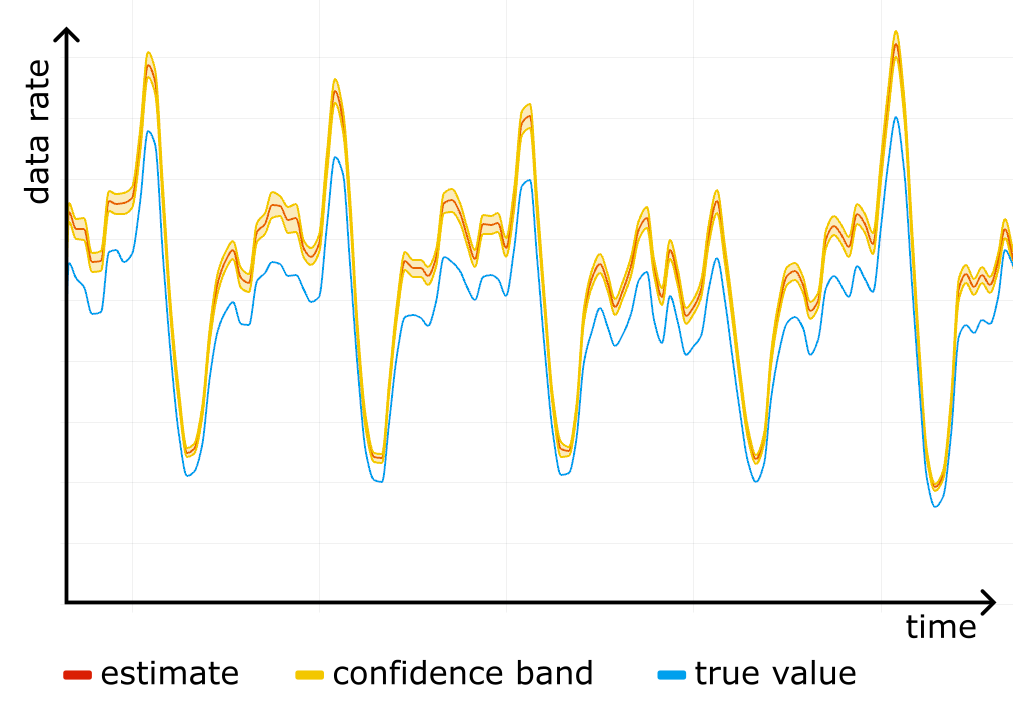
We checked the stored data for corruption, it was fine. We checked the math in the queries, it was fine. It was only after reading through the source code for all of the systems responsible for sampling that we found a candidate for the root cause.
We used simple random sampling everywhere, basically “tossing a coin” for each event, but in Logreceiver sampling was done differently. Instead of sampling randomly it would perform systematic sampling by picking events at equal intervals starting from the first one in the batch.

Why would that be a problem?
There are two reasons. The first is that we can no longer claim $\pi_{ij} = \pi_i \pi_j$, so the simplified variance estimator stops working and confidence intervals cannot be trusted. But even worse, the estimator for the total becomes biased. To understand why exactly, we wrote a short repro code in Python:
import itertools

def take_every(src, period):
    for i, x in enumerate(src):
    if i % period == 0:
        yield x

pattern = [10, 1, 1, 1, 1, 1]
sample_interval = 10 # bad if it has common factors with len(pattern)
true_mean = sum(pattern) / len(pattern)

orig = itertools.cycle(pattern)
sample_size = 10000
sample = itertools.islice(take_every(orig, sample_interval), sample_size)

sample_mean = sum(sample) / sample_size

print(f"{true_mean=} {sample_mean=}")
After playing with different values for pattern and sample_interval in the code above, we realized where the bias was coming from.
Imagine a person opening a huge generated HTML page with many small/cached resources, such as icons. The first response will be big, immediately followed by a burst of small responses. If the website is not visited that much, responses will tend to end up all together at the start of a batch in Logfwdr. Logreceiver does not cut batches, only concatenates them. The first response remains first, so it always gets picked and skews the estimate up.
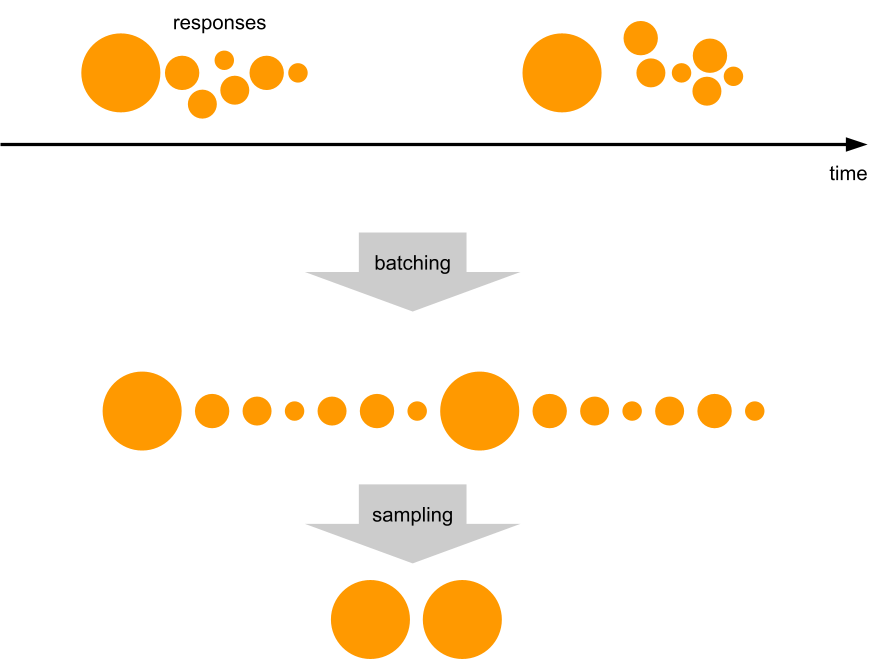
We checked the hypothesis against the raw unsampled data that we happened to have because that particular website was also using one of the Logs products. We took all events in a given time range, and grouped them by cutting at gaps of at least one minute. In each group, we ranked all events by time and looked at the variable of interest (response size in bytes), and put it on a scatter plot against the rank inside the group.
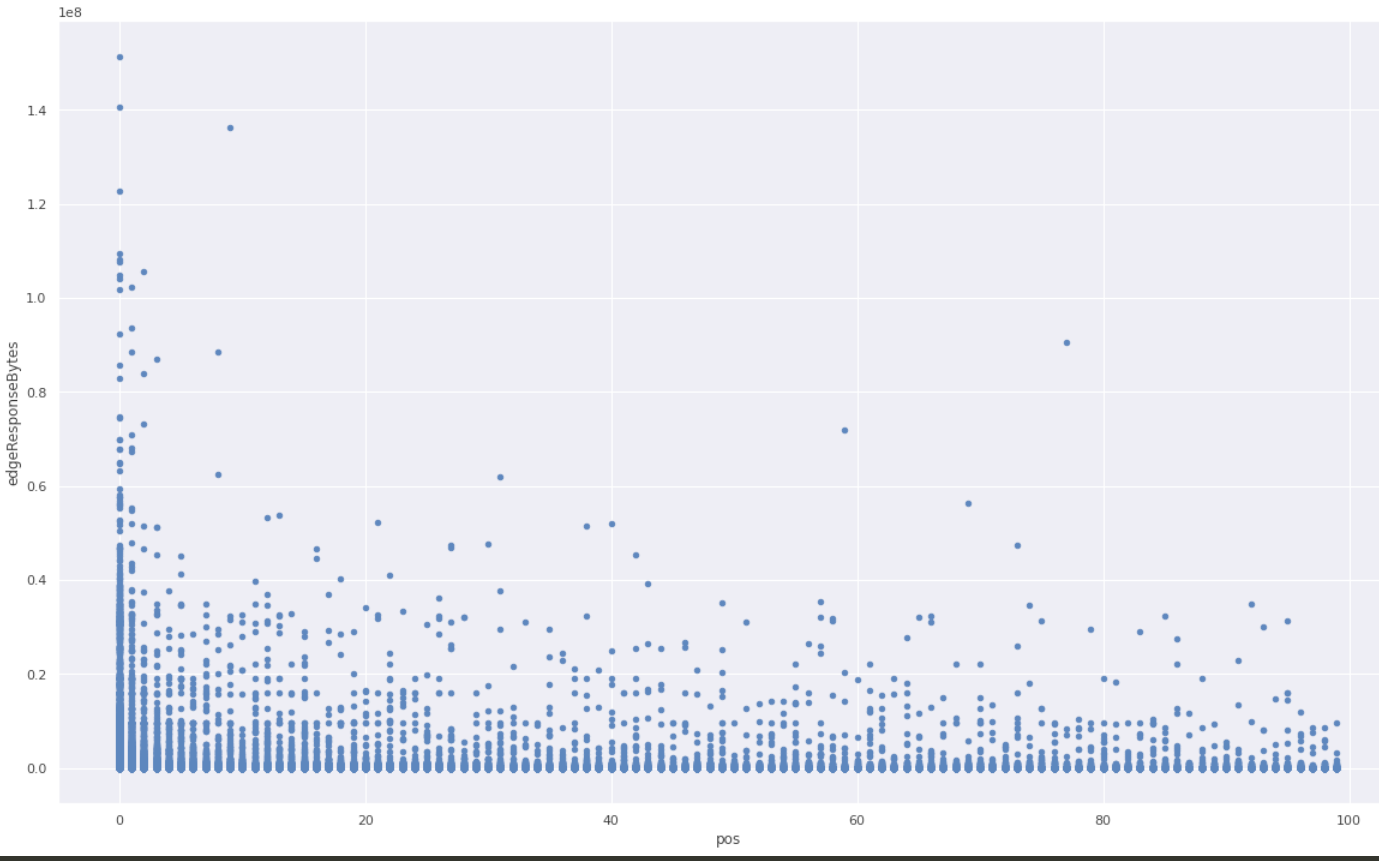
A clear pattern! The first response is much more likely to be larger than average.
We fixed the issue by making Logreceiver shuffle the data before sampling. As we rolled out the fix, the estimation and the true value converged.
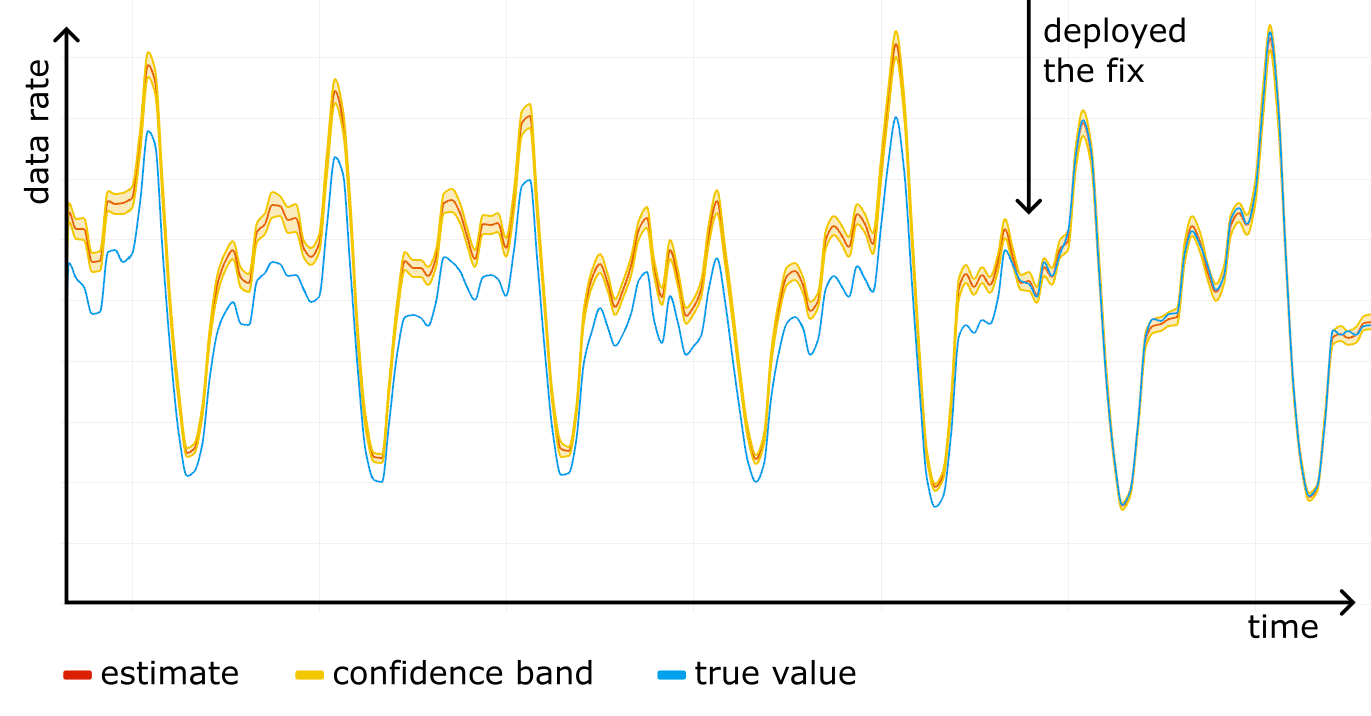
Now, after battle testing it for a while, we are confident the HT estimator is implemented properly and we are using the correct sampling process.
We already power most of our analytics datasets with sampled data. For example, the Workers Analytics Engine exposes the sample interval in SQL, allowing our customers to build their own dashboards with confidence bands. In the GraphQL API, all of the data nodes that have “Adaptive” in their name are based on sampled data, and the sample interval is exposed as a field there as well, though it is not possible to build confidence intervals from that alone. We are working on exposing confidence intervals in the GraphQL API, and as an experiment have added them to the count and edgeResponseBytes (sum) fields on the httpRequestsAdaptiveGroups nodes. This is available under confidence(level: X).
Here is a sample GraphQL query:
query HTTPRequestsWithConfidence(
  $accountTag: string
  $zoneTag: string
  $datetimeStart: string
  $datetimeEnd: string
) {
  viewer {
    zones(filter: { zoneTag: $zoneTag }) {
      httpRequestsAdaptiveGroups(
        filter: {
          datetime_geq: $datetimeStart
          datetime_leq: $datetimeEnd
      }
      limit: 100
    ) {
      confidence(level: 0.95) {
        level
        count {
          estimate
          lower
          upper
          sampleSize
        }
        sum {
          edgeResponseBytes {
            estimate
            lower
            upper
            sampleSize
          }
        }
      }
    }
  }
}
The query above asks for the estimates and the 95% confidence intervals for SUM(edgeResponseBytes) and COUNT. The results will also show the sample size, which is good to know, as we rely on the central limit theorem to build the confidence intervals, thus small samples don’t work very well.
Here is the response from this query:
{
  "data": {
    "viewer": {
      "zones": [
        {
          "httpRequestsAdaptiveGroups": [
            {
              "confidence": {
                "level": 0.95,
                "count": {
                  "estimate": 96947,
                  "lower": "96874.24",
                  "upper": "97019.76",
                  "sampleSize": 96294
                },
                "sum": {
                  "edgeResponseBytes": {
                    "estimate": 495797559,
                    "lower": "495262898.54",
                    "upper": "496332219.46",
                    "sampleSize": 96294
                  }
                }
              }
            }
          ]
        }
      ]
    }
  },
  "errors": null
}
The response shows the estimated count is 96947, and we are 95% confident that the true count lies in the range 96874.24 to 97019.76. Similarly, the estimate and range for the sum of response bytes are provided.
The estimates are based on a sample size of 96294 rows, which is plenty of samples to calculate good confidence intervals.
We have discussed what kept our data pipeline scalable and resilient despite doubling in size every 1.5 years, how the math works, and how it is easy to mess up. We are constantly working on better ways to keep the data pipeline, and the products based on it, useful to our customers. If you are interested in doing things like that and want to help us build a better Internet, check out our careers page.