Post Syndicated from Crosstalk Solutions original https://www.youtube.com/watch?v=Y34BZ8TE5Fk
Introducing the AWS Network Firewall CloudWatch Dashboard
Post Syndicated from Ajinkya Patil original https://aws.amazon.com/blogs/security/introducing-the-aws-network-firewall-cloudwatch-dashboard/
Amazon CloudWatch dashboards are customizable pages in the CloudWatch console that you can use to monitor your resources in a single view. This post focuses on deploying a CloudWatch dashboard that you can use to create a customizable monitoring solution for your AWS Network Firewall firewall. It’s designed to provide deeper insights into your firewall’s performance and security events simplifying security monitoring.
Network Firewall is a managed service that you can use to deploy essential network protections to Amazon Virtual Private Clouds (Amazon VPCs). Network Firewall provides comprehensive logs and metrics through CloudWatch, and we’re expanding its capabilities with this CloudWatch dashboard. This enhancement makes it easier to visualize, analyze, and act on the wealth of data generated by your firewall.
This open source solution streamlines network security monitoring with a user-friendly AWS CloudFormation template that quickly deploys a dedicated monitoring dashboard. This solution incorporates a suite of CloudWatch features—basic monitoring metrics, vended logs, Logs Insights queries, Contributor Insights rules, and the dashboard itself—into a centralized view. Preconfigured widgets provide instant insights into critical areas such as top talkers, protocol distributions, and alert log trends, in addition to HTTP and TLS flow analysis. A consolidated view of key metrics and logs enables faster identification of potential security threats or performance issues. With all of this relevant network firewall data in one place, your team can respond more quickly to emerging security events.
In this blog post, we provide an overview of the dashboard and a step-by-step guide to deploy it in your environment.
Solution overview
The CloudWatch dashboard can be deployed in all AWS Regions where Network Firewall is available today, including the AWS GovCloud (US) Regions and China Regions. While the dashboard comes pre-configured, you can quickly adjust queries, time ranges, and refresh intervals to help meet your specific needs. By default, the dashboard queries firewall flow and alert log events over a 3-hour period, impacting the number of log events scanned. Logs Insights and Contributor Insights widgets showcase the top 10 data points by default, but you can enhance results by modifying queries or adjusting the Top Contributors value, though this might lead to increased costs. You can configure the auto-refresh interval of the widgets to get real-time visibility and optimize costs. See the Amazon CloudWatch Pricing guide for up-to-date free and paid tier pricing considerations.
The dashboard, shown in Figure 1, can be deployed using CloudFormation and includes data and analytics from the following sources:
- Native CloudWatch metrics from the
AWS/NetworkFirewallandAWS/PrivateLinkEndpointsnamespaces - CloudWatch Logs Insights queries that analyze Network Firewall flow and alert logs
- CloudWatch Contributor Insights rules that aggregate data from Network Firewall flow and alert logs.
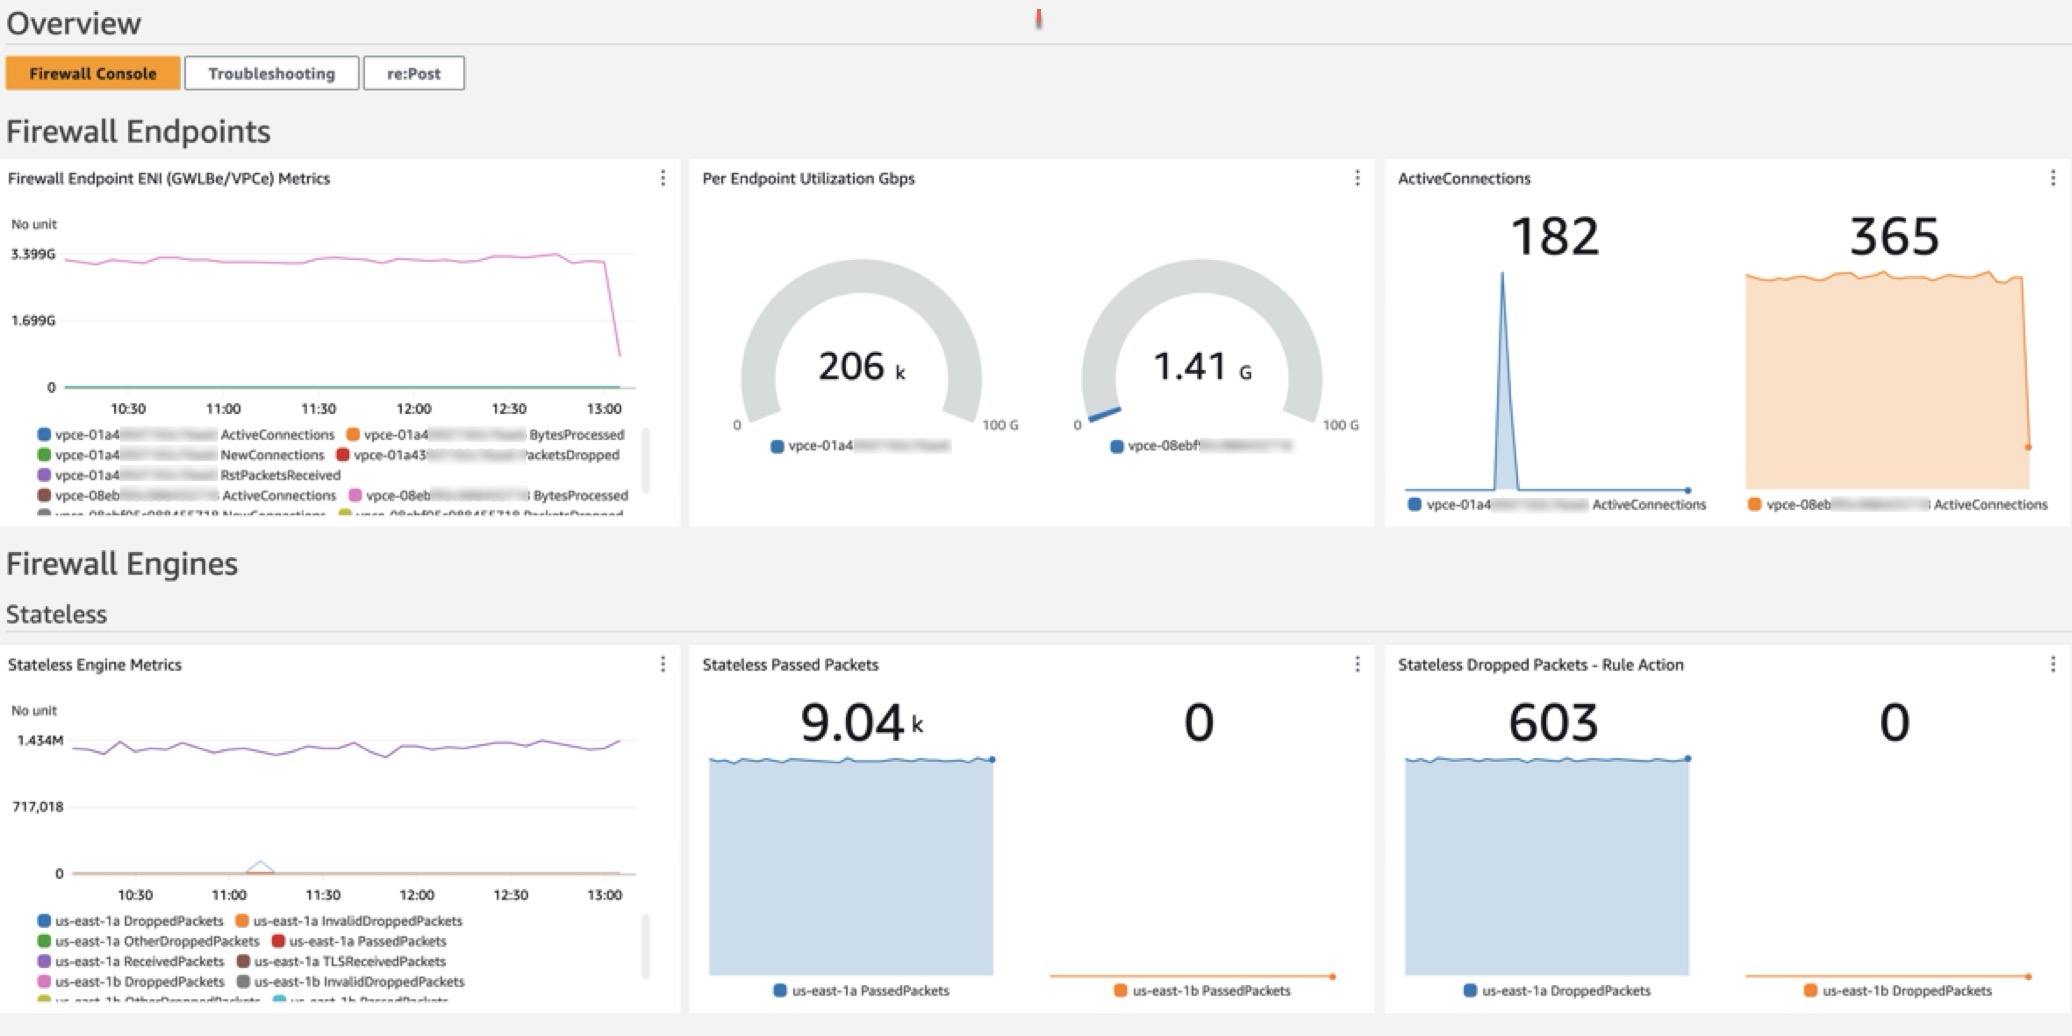
Figure 1: CloudWatch dashboard
Walkthrough
In the dashboard, the Logs Insights and Contributor Insights widgets display the top 10 data points by default. You can edit the Insights queries or change the Top Contributors to a larger value to display more results, as shown in Figure 2.
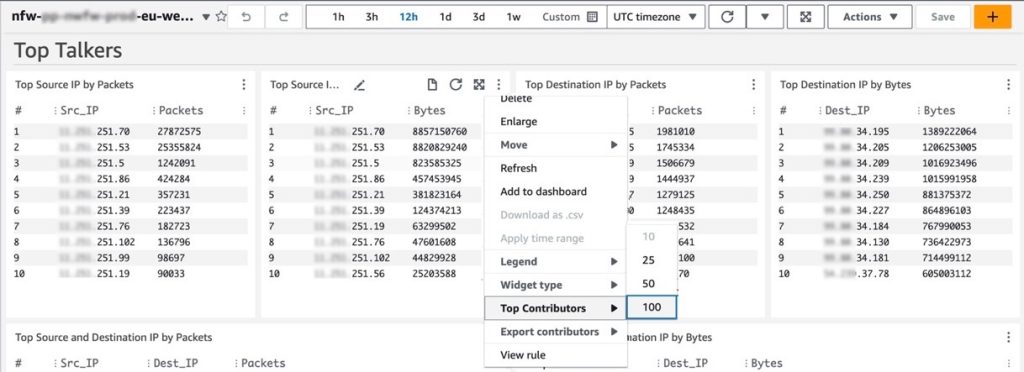
Figure 2: Top Talkers dashboard showing a change to the Top Contributors value
You can also manually refresh the data within a single or multiple widgets, or you can configure the entire dashboard to automatically refresh at a configured time interval as shown in Figure 3. The dashboard won’t automatically refresh the widget data by default.
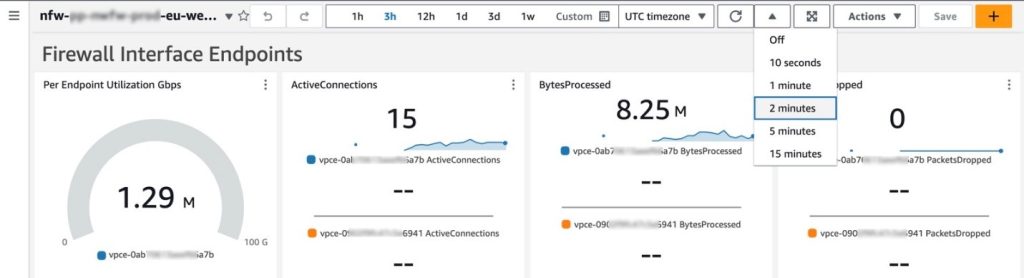
Figure 3: Configuring the dashboard to automatically refresh
Prerequisites
Deploying the Network Firewall CloudWatch Dashboard is straightforward. You will need the following:
- A Network Firewall in your VPC.
- Your Network Firewall must be configured to publish firewall flow and alert logs to two different CloudWatch log groups. For example, firewall flow logs are published to
/my-firewall-flow-logsand alert logs are published to/my-firewall-alert-logs.
If you haven’t deployed Network Firewall in your VPC, you can use one of the available AWS Network Firewall Deployment Architecture templates to create a firewall. After creating a firewall, configure CloudWatch log groups for the firewall flow and alert logs and configure stateful logging as described previously. Fine-tune your firewall policy and rule configuration and make sure that you’re routing traffic symmetrically through the firewall. With the firewall now in the routed path and publishing metrics and log events, you can proceed with this Network Firewall CloudWatch dashboard template.
Deployment
The Network Firewall dashboard CloudFormation template creates a monitoring dashboard for a single Network Firewall firewall. Make sure that you launch this CloudFormation stack in the same AWS Region and account as the firewall, regardless of whether the firewall is set up centrally or in a distributed manner.
To deploy the dashboard:
- Choose Launch Stack for the relevant AWS Region. Make sure that you’re signed in to the appropriate AWS account and Region.
- Region: China

- Region: Gov Cloud
- Region: All other regions supported by AWS Network Firewall
- Region: China
- You will be redirected to the Create stack page in the AWS Management Console for CloudFormation. Make sure that you’re in the correct Region and using the correct template. Choose Next. The following are the Regions and their template names:
- China Region:
nfw-cloudwatch-dashboard-china.yaml - Gov Cloud Region:
nfw-cloudwatch-dashboard-govcloud.yaml - All other Regions:
nfw-cloudwatch-dashboard.yaml
- China Region:

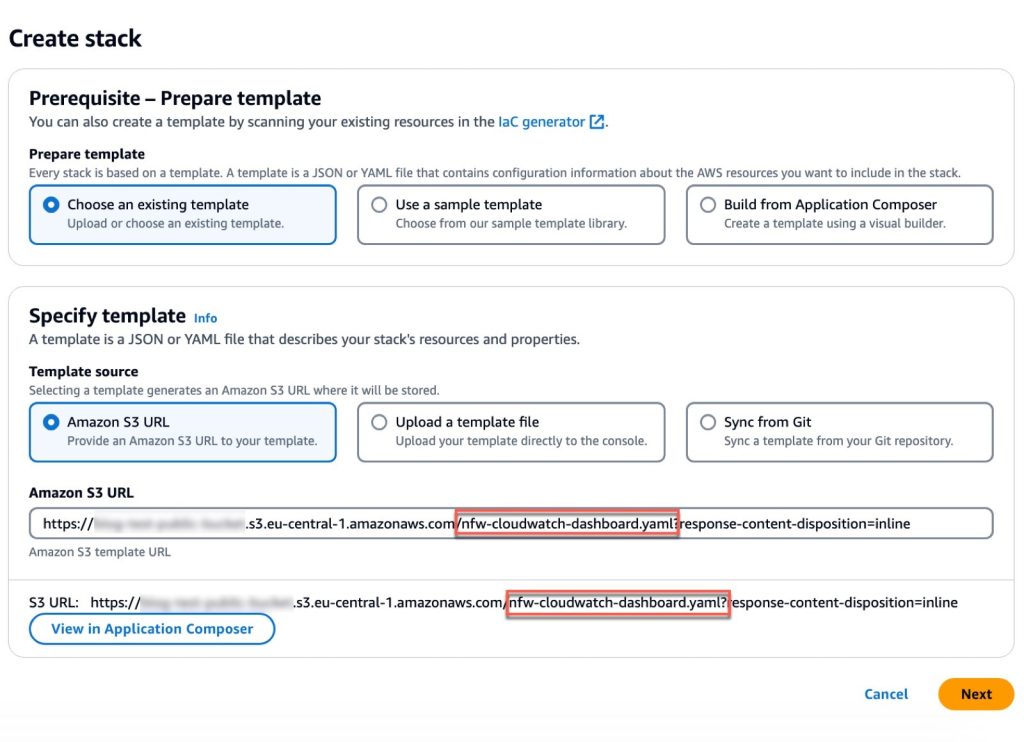
Figure 4: Make sure that you’re using the correct template
When launching the stack, you will need to enter the following parameters:
- Stack name: A descriptive name for this CloudFormation stack. For example,
my-firewall-dashboard. - Firewall name: The firewall name as seen in the Amazon VPC console. In the Amazon VPC console, choose Network Firewall in the navigation pane, then choose Firewalls.
- Firewall subnets: The firewall subnet IDs to which your firewall endpoints are attached. The firewall subnets can be found on the Firewall details tab of your firewall in the Amazon VPC
- Flow log group name: The name of the CloudWatch log group where your firewall flow logs are stored.
- Alert log group name: The name of the CloudWatch log group where your firewall alert logs are stored.
- Contributor Insights rule state: Enable or disable the Contributor Insights rules (the template defaults to enabled). Disabling will stop the rules from scanning log data and displaying results in the Contributor Insights widgets. After the rules are created, you can change the state of one or more Contributor Insights rules from CloudWatch console by choosing Insights from the navigation pane, and then choosing Contributor Insights.
After the stack reaches CREATE_COMPLETE status, go to the Outputs tab and choose the FirewallDashboardURI link to open the new dashboard in the CloudWatch Dashboards console. It might take a few minutes for the Logs Insights and Contributor Insights widgets to start displaying data. For more details about each widget, see the README. If you don’t have log events matching the query parameters in the widgets, some widgets might not show data points.
Troubleshooting
If you encounter issues during or after deployment, review the following:
- Firewall logging is enabled and configured to use CloudWatch instead of Amazon Simple Storage Service (Amazon S3) or Amazon Kinesis.
- Both firewall flow and alert logging are enabled, not just one.
- Log group names are entered correctly; incorrect names will cause widgets to point to invalid data.
- Correct subnets are selected. Incorrect choices can impact the PrivateLink metrics widgets.
- Firewall name is entered correctly. An incorrect name can disrupt metrics widgets, dashboard, and Contributor Insights widget names and break the firewall link.
Cleaning up
You can delete the Network Firewall CloudWatch dashboard and all of the associated resources with a few clicks. Deleting the dashboard will not impact the routing and network traffic inspection performed by the firewall.
- Sign in to the CloudFormation console in the Region where you launched the stack and choose Stacks from the navigation pane.
- Select the Stack name you chose when launching the stack. For example, my-firewall-dashboard.
- Choose Delete.
Conclusion
We encourage you to see for yourself how this new dashboard can enhance your network security management. To get started with the AWS Network Firewall CloudWatch Dashboard, visit our GitHub repository for detailed instructions and the CloudFormation template. For a visual overview of the dashboard and its capabilities, check out our YouTube video.
If you have feedback about this post, submit comments in the Comments section below. If you have questions about this post, contact AWS Support.
Effortlessly Managing Unfinished Large File Uploads with B2 Cloud Storage
Post Syndicated from Bala Krishna Gangisetty original https://www.backblaze.com/blog/effortlessly-managing-unfinished-large-file-uploads-with-b2-cloud-storage/

Digital clutter isn’t just inefficient, it can be costly. And if cleaning up digital clutter in your business operations is one of your New Year’s resolutions for 2025, this post is for you. We’re talking about managing unfinished large file uploads.
One big culprit of digital clutter when it comes to cloud storage is unfinished large files. Managing unfinished large file uploads can be a complex task. If they are not managed well, they can consume space and incur costs without any benefit.
To address this, we’ve introduced a feature in Backblaze B2 Cloud Storage that automatically cancels unfinished large file uploads, saving you both time and money.
The challenge: Unfinished large file uploads
To upload a large file, you break it into smaller parts. You initiate the start notification. Each part is uploaded in parallel, and once all parts are received, a finish notification is sent. Only after the final step does the file become consumable. Sometimes, things don’t go as planned—network hiccups, API timeouts, or user interruptions can leave large file uploads unfinished. The process then likely restarts and completes successfully, but this leaves you with both a complete file and a partially completed file in your cloud storage instance. These unfinished uploads still take up storage space, leading to unnecessary costs.
Previously, users had to manually track down and delete these unfinished uploads. It’s error prone and time-consuming, and not an easy task especially with a large volume of files.
The solution: Canceling unfinished uploads through lifecycle rules
To streamline the process, we’ve added a feature that allows users to automatically cancel these incomplete uploads after a set number of days. By setting lifecycle rules through the B2 Native API, users can now specify how many days an unfinished large file can remain before it’s automatically deleted.
For detailed guidance on configuring this rule, check out our Lifecycle Rules Documentation.
Why it matters
This feature is useful in a variety of scenarios:
- Network failures: If a network interruption prevents the final completion step, the unfinished upload will no longer remain indefinitely. Instead, it will be automatically cleared after the defined period, ensuring you aren’t paying for useless storage.
- User interruptions: If an upload is manually paused or forgotten before completion, lifecycle rules will take care of these fragments, preventing forgotten uploads from lingering in storage.
- Script failures: If your script fails or times out during the upload process, any incomplete files won’t go unnoticed. They’ll be cleared as per your rules, ensuring efficient storage management.
Cost-saving benefits
Unfinished uploads can quickly add up, both in storage usage and costs. By automatically canceling incomplete uploads, users can significantly reduce unnecessary expenses, keeping storage budgets under control. This is especially important for businesses with large-scale data transfers, where managing storage efficiency can have a direct impact on the bottom line.
What’s next?
Most users configure lifecycle rules through the console or Backblaze B2 command line tool (CLI), so we introduced this feature for the B2 Native API to address immediate customer needs while also laying the groundwork for integrating it into the B2 Cloud Storage web console. You can now use this feature via the CLI or B2 Native API. We’re working on adding UI support to make configuration even more accessible. Let us know in the comments if you’re looking for access to this feature via a different user interface.
In the meantime, here are a few steps you can take:
- Implement lifecycle rules: Set rules that fit your upload behavior. Choose a reasonable timeframe to cancel unfinished large file uploads that balances with your cost-management goals.
- Test the feature: Try configuring the lifecycle rule for a few test uploads to make sure it behaves as expected. Monitor how it handles interruptions or failures to ensure it aligns with your needs.
- Monitor storage costs: Check your storage usage and billing before and after setting these rules to understand the impact on costs. Use the feedback to fine-tune your settings.
- Stay tuned for UI updates: Keep an eye out for announcements regarding UI support for this feature. We’re committed to making it as intuitive and accessible as possible.
By leveraging lifecycle rules for unfinished large file uploads, you can maintain a cleaner, more efficient storage environment while saving money. For more details on configuring lifecycle rules, visit our API documentation.
The post Effortlessly Managing Unfinished Large File Uploads with B2 Cloud Storage appeared first on Backblaze Blog | Cloud Storage & Cloud Backup
XikeStor SKS1200-8XGT Review A Cheap 8-port 10Gbase-T Switch
Post Syndicated from Rohit Kumar original https://www.servethehome.com/xikestor-sks1200-8xgt-review-a-cheap-8-port-10gbase-t-switch/
At $199, the 8-port 10GbE XikeStor SKS1200-8XGT switch is one of the cheapest unmanaged 10Gbase-T switches on the market, with caveats
The post XikeStor SKS1200-8XGT Review A Cheap 8-port 10Gbase-T Switch appeared first on ServeTheHome.
Building end-to-end data lineage for one-time and complex queries using Amazon Athena, Amazon Redshift, Amazon Neptune and dbt
Post Syndicated from Nancy Wu original https://aws.amazon.com/blogs/big-data/building-end-to-end-data-lineage-for-one-time-and-complex-queries-using-amazon-athena-amazon-redshift-amazon-neptune-and-dbt/
One-time and complex queries are two common scenarios in enterprise data analytics. One-time queries are flexible and suitable for instant analysis and exploratory research. Complex queries, on the other hand, refer to large-scale data processing and in-depth analysis based on petabyte-level data warehouses in massive data scenarios. These complex queries typically involve data sources from multiple business systems, requiring multilevel nested SQL or associations with numerous tables for highly sophisticated analytical tasks.
However, combining the data lineage of these two query types presents several challenges:
- Diversity of data sources
- Varying query complexity
- Inconsistent granularity in lineage tracking
- Different real-time requirements
- Difficulties in cross-system integration
Moreover, maintaining the accuracy and completeness of lineage information while providing system performance and scalability are crucial considerations. Addressing these challenges requires a carefully designed architecture and advanced technical solutions.
Amazon Athena offers serverless, flexible SQL analytics for one-time queries, enabling direct querying of Amazon Simple Storage Service (Amazon S3) data for rapid, cost-effective instant analysis. Amazon Redshift, optimized for complex queries, provides high-performance columnar storage and massively parallel processing (MPP) architecture, supporting large-scale data processing and advanced SQL capabilities. Amazon Neptune, as a graph database, is ideal for data lineage analysis, offering efficient relationship traversal and complex graph algorithms to handle large-scale, intricate data lineage relationships. The combination of these three services provides a powerful, comprehensive solution for end-to-end data lineage analysis.
In the context of comprehensive data governance, Amazon DataZone offers organization-wide data lineage visualization using Amazon Web Services (AWS) services, while dbt provides project-level lineage through model analysis and supports cross-project integration between data lakes and warehouses.
In this post, we use dbt for data modeling on both Amazon Athena and Amazon Redshift. dbt on Athena supports real-time queries, while dbt on Amazon Redshift handles complex queries, unifying the development language and significantly reducing the technical learning curve. Using a single dbt modeling language not only simplifies the development process but also automatically generates consistent data lineage information. This approach offers robust adaptability, easily accommodating changes in data structures.
By integrating Amazon Neptune graph database to store and analyze complex lineage relationships, combined with AWS Step Functions and AWS Lambda functions, we achieve a fully automated data lineage generation process. This combination promotes consistency and completeness of lineage data while enhancing the efficiency and scalability of the entire process. The result is a powerful and flexible solution for end-to-end data lineage analysis.
Architecture overview
The experiment’s context involves a customer already using Amazon Athena for one-time queries. To better accommodate massive data processing and complex query scenarios, they aim to adopt a unified data modeling language across different data platforms. This led to the implementation of both Athena on dbt and Amazon Redshift on dbt architectures.
AWS Glue crawler crawls data lake information from Amazon S3, generating a Data Catalog to support dbt on Amazon Athena data modeling. For complex query scenarios, AWS Glue performs extract, transform, and load (ETL) processing, loading data into the petabyte-scale data warehouse, Amazon Redshift. Here, data modeling uses dbt on Amazon Redshift.
Lineage data original files from both parts are loaded into an S3 bucket, providing data support for end-to-end data lineage analysis.
The following image is the architecture diagram for the solution.

Some important considerations:
- For implementing dbt modeling on Athena, refer to the dbt-on-aws / athena GitHub repository for experimentation
- For implementing dbt modeling on Amazon Redshift, refer to the dbt-on-aws / redshift GitHub repository for experimentation.
This experiment uses the following data dictionary:
| Source table | Tool | Target table |
imdb.name_basics |
DBT/Athena | stg_imdb__name_basics |
imdb.title_akas |
DBT/Athena | stg_imdb__title_akas |
imdb.title_basics |
DBT/Athena | stg_imdb__title_basics |
imdb.title_crew |
DBT/Athena | stg_imdb__title_crews |
imdb.title_episode |
DBT/Athena | stg_imdb__title_episodes |
imdb.title_principals |
DBT/Athena | stg_imdb__title_principals |
imdb.title_ratings |
DBT/Athena | stg_imdb__title_ratings |
stg_imdb__name_basics |
DBT/Redshift | new_stg_imdb__name_basics |
stg_imdb__title_akas |
DBT/Redshift | new_stg_imdb__title_akas |
stg_imdb__title_basics |
DBT/Redshift | new_stg_imdb__title_basics |
stg_imdb__title_crews |
DBT/Redshift | new_stg_imdb__title_crews |
stg_imdb__title_episodes |
DBT/Redshift | new_stg_imdb__title_episodes |
stg_imdb__title_principals |
DBT/Redshift | new_stg_imdb__title_principals |
stg_imdb__title_ratings |
DBT/Redshift | new_stg_imdb__title_ratings |
new_stg_imdb__name_basics |
DBT/Redshift | int_primary_profession_flattened_from_name_basics |
new_stg_imdb__name_basics |
DBT/Redshift | int_known_for_titles_flattened_from_name_basics |
new_stg_imdb__name_basics |
DBT/Redshift | names |
new_stg_imdb__title_akas |
DBT/Redshift | titles |
new_stg_imdb__title_basics |
DBT/Redshift | int_genres_flattened_from_title_basics |
new_stg_imdb__title_basics |
DBT/Redshift | titles |
new_stg_imdb__title_crews |
DBT/Redshift | int_directors_flattened_from_title_crews |
new_stg_imdb__title_crews |
DBT/Redshift | int_writers_flattened_from_title_crews |
new_stg_imdb__title_episodes |
DBT/Redshift | titles |
new_stg_imdb__title_principals |
DBT/Redshift | titles |
new_stg_imdb__title_ratings |
DBT/Redshift | titles |
int_known_for_titles_flattened_from_name_basics |
DBT/Redshift | titles |
int_primary_profession_flattened_from_name_basics |
DBT/Redshift | |
int_directors_flattened_from_title_crews |
DBT/Redshift | names |
int_genres_flattened_from_title_basics |
DBT/Redshift | genre_titles |
int_writers_flattened_from_title_crews |
DBT/Redshift | names |
| genre_titles | DBT/Redshift | |
names |
DBT/Redshift | |
titles |
DBT/Redshift |
The lineage data generated by dbt on Athena includes partial lineage diagrams, as exemplified in the following images. The first image shows the lineage of name_basics in dbt on Athena. The second image shows the lineage of title_crew in dbt on Athena.


The lineage data generated by dbt on Amazon Redshift includes partial lineage diagrams, as illustrated in the following image.

Referring to the data dictionary and screenshots, it’s evident that the complete data lineage information is highly dispersed, spread across 29 lineage diagrams. Understanding the end-to-end comprehensive view requires significant time. In real-world environments, the situation is often more complex, with complete data lineage potentially distributed across hundreds of files. Consequently, integrating a complete end-to-end data lineage diagram becomes crucial and challenging.
This experiment will provide a detailed introduction to processing and merging data lineage files stored in Amazon S3, as illustrated in the following diagram.

Prerequisites
To perform the solution, you need to have the following prerequisites in place:
- The Lambda function for preprocessing lineage files must have permissions to access Amazon S3 and Amazon Redshift.
- The Lambda function for constructing the directed acyclic graph (DAG) must have permissions to access Amazon S3 and Amazon Neptune.
Solution walkthrough
To perform the solution, follow the steps in the next sections.
Preprocess raw lineage data for DAG generation using Lambda functions
Use Lambda to preprocess the raw lineage data generated by dbt, converting it into key-value pair JSON files that are easily understood by Neptune: athena_dbt_lineage_map.json and redshift_dbt_lineage_map.json.
- To create a new Lambda function in the Lambda console, enter a Function name, select the Runtime (Python in this example), configure the Architecture and Execution role, then click the “Create function” button.

- Open the created Lambda function and on the Configuration tab, in the navigation pane, select Environment variables and choose your configurations. Using Athena on dbt processing as an example, configure the environment variables as follows (the process for Amazon Redshift on dbt is similar):
INPUT_BUCKET:data-lineage-analysis-24-09-22(replace with the S3 bucket path storing the original Athena on dbt lineage files)INPUT_KEY:athena_manifest.json(the original Athena on dbt lineage file)OUTPUT_BUCKET:data-lineage-analysis-24-09-22(replace with the S3 bucket path for storing the preprocessed output of Athena on dbt lineage files)OUTPUT_KEY:athena_dbt_lineage_map.json(the output file after preprocessing the original Athena on dbt lineage file)

- On the Code tab, in the lambda_function.py file, enter the preprocessing code for the raw lineage data. Here’s a code reference using Athena on dbt processing as an example (the process for Amazon Redshift on dbt is similar). The preprocessing code for Athena on dbt’s original lineage file is as follows:
The athena_manifest.json, redshift_manifest.json, and other files used in this experiment can be obtained from the Data Lineage Graph Construction GitHub repository.
Merge preprocessed lineage data and write to Neptune using Lambda functions
- Before processing data with the Lambda function, create a Lambda layer by uploading the required Gremlin plugin. For detailed steps on creating and configuring Lambda Layers, see the AWS Lambda Layers documentation.
Because connecting Lambda to Neptune for constructing a DAG requires the Gremlin plugin, it needs to be uploaded before using Lambda. The Gremlin package can be obtained from the Data Lineage Graph Construction GitHub repository.

- Create a new Lambda function. Choose the function to configure. To the recently created layer, at the bottom of the page, choose Add a layer.

Create another Lambda layer for the requests library, similar to how you created the layer for the Gremlin plugin. This library will be used for HTTP client functionality in the Lambda function.
- Choose the recently created Lambda function to configure. Connect to Neptune through Lambda to merge the two datasets and construct a DAG. On the Code tab, the reference code to execute is as follows:
Create Step Functions workflow
- On the Step Functions console, choose State machines, and then choose Create state machine. On the Choose a template page, select Blank template.

- In the Blank template, choose Code to define your state machine. Use the following example code:
- After completing the configuration, choose the Design tab to view the workflow shown in the following diagram.

Create scheduling rules with Amazon EventBridge
Configure Amazon EventBridge to generate lineage data daily during off-peak business hours. To do this:
- Create a new rule in the EventBridge console with a descriptive name.
- Set the rule type to “Schedule” and configure it to run once daily (using either a fixed rate or the Cron expression “0 0 * * ? *”).
- Select the AWS Step Functions state machine as the target and specify the state machine you created earlier.
Query results in Neptune
- On the Neptune console, select Notebooks. Open an existing notebook or create a new one.

- In the notebook, create a new code cell to perform a query. The following code example shows the query statement and its results:
You can now see the end-to-end data lineage graph information for both dbt on Athena and dbt on Amazon Redshift. The following image shows the merged DAG data lineage graph in Neptune.

You can query the generated data lineage graph for data related to a specific table, such as title_crew.
The sample query statement and its results are shown in the following code example:
The following image shows the filtered results based on title_crew table in Neptune.

Clean up
To clean up your resources, complete the following steps:
- Delete EventBridge rules
- Delete Step Functions state machine
- Delete Lambda functions
- Clean up the Neptune database
- Follow the instructions at Deleting a single object to clean up the S3 buckets
Conclusion
In this post, we demonstrated how dbt enables unified data modeling across Amazon Athena and Amazon Redshift, integrating data lineage from both one-time and complex queries. By using Amazon Neptune, this solution provides comprehensive end-to-end lineage analysis. The architecture uses AWS serverless computing and managed services, including Step Functions, Lambda, and EventBridge, providing a highly flexible and scalable design.
This approach significantly lowers the learning curve through a unified data modeling method while enhancing development efficiency. The end-to-end data lineage graph visualization and analysis not only strengthen data governance capabilities but also offer deep insights for decision-making.
The solution’s flexible and scalable architecture effectively optimizes operational costs and improves business responsiveness. This comprehensive approach balances technical innovation, data governance, operational efficiency, and cost-effectiveness, thus supporting long-term business growth with the adaptability to meet evolving enterprise needs.
With OpenLineage-compatible data lineage now generally available in Amazon DataZone, we plan to explore integration possibilities to further enhance the system’s capability to handle complex data lineage analysis scenarios.
If you have any questions, please feel free to leave a comment in the comments section.
About the authors

Nancy Wu is a Solutions Architect at AWS, responsible for cloud computing architecture consulting and design for multinational enterprise customers. Has many years of experience in big data, enterprise digital transformation research and development, consulting, and project management across telecommunications, entertainment, and financial industries.
 Xu Feng is a Senior Industry Solution Architect at AWS, responsible for designing, building, and promoting industry solutions for the Media & Entertainment and Advertising sectors, such as intelligent customer service and business intelligence. With 20 years of software industry experience, currently focused on researching and implementing generative AI and AI-powered data solutions.
 Xu Da is a Amazon Web Services (AWS) Partner Solutions Architect based out of Shanghai, China. He has more than 25 years of experience in IT industry, software development and solution architecture. He is passionate about collaborative learning, knowledge sharing, and guiding community in their cloud technologies journey.
Accelerate Amazon Redshift secure data use with Satori – Part 2
Post Syndicated from Rohit Vashishtha original https://aws.amazon.com/blogs/big-data/accelerate-amazon-redshift-secure-data-use-with-satori-part-2/
This post is co-written by Adam Gaulding, Solution Architect at Satori.
In this post, we continue from Accelerate Amazon Redshift secure data use with Satori – Part 1, and explain how Satori, an Amazon Redshift Ready partner, simplifies both the user experience of gaining access to data and the admin practice of granting and revoking access to data in Amazon Redshift. Satori enables both just-in-time and self-service access to data.
Solution overview
Satori creates a transparent layer providing visibility and control capabilities that is deployed in front of your existing Redshift data warehouse. When adding a new data store to Satori, a new, Satori-provided URL is generated for the data store, which data consumers use instead of connecting directly.
The following diagram illustrates the solution architecture.

Data consumers don’t have to change how they work with data, such as installing different database drivers, changing their queries, or compromising on features or functionality. Satori is not a data virtualization or database federation solution that abstracts your existing data stores.
Self-service access to data is fully automated. The admin is responsible for setting up the access rules. User access privileges can be preconfigured for automated dataset access. The user can see the datasets that are available to them in their personalized data portal. The user then selects the dataset they want to use and Satori automatically applies the appropriate security, privacy, and compliance requirements.
Just-in-time access to data is also flexible but requires approval from an admin. From the user’s personalized data portal, they can see the available datasets—the only datasets they have self-service access to are already included in their My Data folder. If they see a dataset that they need but don’t have access to, they can request access to this data on-demand. The request is sent to the admin and, based on the user’s credentials, the admin can choose to approve or deny access.
The ability to facilitate and automate access to data provides the following benefits:
- Satori improves the user experience by providing quick access to data. This increases the time-to-value of data and drives innovative decision-making.
- Admins benefit from automating the process, significantly reducing the amount of time spent on granting and revoking access to data.
Prerequisites
Follow the steps outlined in Accelerate Amazon Redshift secure data use with Satori – Part 1 to complete the following prerequisite steps:
- Prepare the data.
- Connect to Amazon Redshift.
- Create a dataset and give Satori control over access to the dataset.
- Optionally, create security policies and revisit the concepts related to secure data access and masking policies.
After you complete the prerequisites, you’re ready to explore self-service and just-in-time access to data.
Self-service access
The following steps explain how to create self-service rules from admin and user perspectives.
Create access request and self-service rules (admin perspective)
After the admin gives Satori control over access to the dataset, they need to first preconfigure the user access rules. Complete the following steps:
- Navigate to the Datasets page and choose User Access Requests.
- In the Self-Service Access section, choose Self-Service Rule.

- Specify the required level of access.
The admin has several options when configuring the access rules. You can set the level of access by user or group, define when it expires, and set revocation rules.

The following screenshot shows the configuration rule for data access requests we created. In this example, the self-service user group has read-only access during the next 30 days that is set to revoke within 7 days if it’s not used.

The following figure shows an example configuration rule to add a user.

The newly created access rule and details are displayed in the list of self-service rules.

The next steps outline the data user view and steps to gain self-service access to data.
Create access request and self-service rules (user perspective)
As a user, complete the following steps:
- Enter the Satori personalized data portal using the Data Portal option on the options menu (three vertical dots).

The data portal will display all available datasets. Any datasets that the user already has self-service access to will appear under My Data, as shown in the following screenshot. All other datasets appear under Available Datasets.

- Choose the desired dataset (in this case,
CustomerDataset) and request immediate access to this dataset by choosing Ask for Access to Dataset.

- For Access Request, choose Self Service.
- For Request Message, enter a reason for the request.
- Choose Request.

Based on the user’s identity, preconfigured access rules match the user to their respective qualifications and authorizations. In this case, the user is automatically granted access to CustomerDataset using the preconfigured self-service rules. The requested dataset appears with Status – Access Granted under My Data.

The preconfigured access rules are applied so that when this user runs their queries, certain sensitive data is redacted.
Now that access is granted, query the data using a SQL editor of your choice. In this post, we use DBeaver to connect to a Redshift cluster using the Satori hostname on the data stores tab.

When you query the data, you will see the security policies applied to the result set at runtime. In the following example, the customer table is displayed with redacted field values based on security policies.

In the following example, the credit_cards table is displayed with masking policies applied to the result values.

Just-in-time access
Just-in-time access is similar to self-service access; the only difference is that it includes an additional step of requesting access from the admin.
Create access request and self-service rules (user perspective)
The user enters the Satori personalized data portal with the same view as shown in the self-service access to data.
If the data that you need isn’t included under My Data but shows under Available Datasets, you can request access to this dataset. For this example, we consider a new user John Doe trying to access CustomerDataset from the available datasets. The process consists of the following steps:
- User John Doe logs in to the Satori portal and finds the Available Datasets section in their data portal.
- The user submits a request for
CustomerDataset.

The request from user John Doe for CustomerDataset stays in Pending Approval status until approved from the admin.

- The admin receives the request from user John Doe through email and portal notifications for dataset requests.
The admin can approve or deny the request and might also designate the level of access and when that access expires.

The following screenshot shows an example email notification.
- The admin can choose View Request in the email and then approve or deny the request on the Satori portal.

- The admin can choose the pencil icon to edit the request before approval and modify the approval conditions.

In this example, the admin modifies a couple of criteria as shown and then approves the request.

Create access request rules (admin perspective)
Users can request access to datasets and the admin can approve or reject those requests, but the admin can also preconfigure the user access rules. Complete the following steps as the admin:
- On the Datasets page, choose User Access Requests.
- Fill out the access request rule.
- Choose Add.

The access request rule creation will be treated as an approval workflow when dataset requests are placed from the data portal.

Dataset requests from users will follow the course of action configured by the admin during access request rules creation. The preconfigured access rules specific to that user are applied so that when this user runs their queries, security policies and masking conditions are applied, and sensitive data is redacted or masked as applicable. The access control is maintained according to the admin settings for both just-in-time access and self-service access.
Clean up
To avoid unintended costs, clean up the resources provisioned as part of Accelerate Amazon Redshift secure data use with Satori – Part 1 or provisioned for this post. Make sure to delete the following resources:
- Redshift cluster or serverless endpoint
- Security group to allow inbound traffic from Satori
- Configurations within your Satori account
Summary
In this post, we described how Satori can help automate secure data access for both data users and admins. The ability to automate this process increases the time-to-value of data for users and reduces the time and resources admins need to allocate for granting and revoking data access.
Satori is available on the AWS Marketplace. To learn more, start a free trial or request a demo meeting.
Amazon Redshift provides comprehensive security and governance features to protect your data, and continues to expand its out-of-the-box capabilities. For the latest features and updates, explore Amazon Redshift What’s New.
About the Authors
 Rohit Vashishtha is a Senior Analytics Specialist Solutions Architect at AWS based in Dallas, Texas. He has over 17 years of experience architecting, building, leading, and maintaining big data platforms. Rohit helps customers modernize their analytic workloads using the breadth of AWS services and ensures that customers get the best price/performance with utmost security and data governance.
 Jagadish Kumar (Jag) is a Senior Specialist Solutions Architect at AWS focused on Amazon OpenSearch Service. He is deeply passionate about Data Architecture and helps customers build analytics solutions at scale on AWS.
 Adam Gaulding is a Solution Architect at Satori. At Satori, Adam is helping customers implement data security controls on databases, data lakes and data warehouses. Adam has been in and around the data space throughout his 20+ year career. He’s worked with companies large and small and prides himself in building creative solutions for technical problems.
Implementing backup for workloads running on AWS Outposts servers
Post Syndicated from aostan original https://aws.amazon.com/blogs/compute/implementing-backup-for-workloads-running-on-aws-outposts-servers/
This post is written by Leonardo Queirolo, Senior Cloud Support Engineer and Tareq Rajabi, Senior Solutions Architect, Hybrid Cloud
AWS Outposts servers provide fully managed AWS infrastructure, services, APIs, and tools to on-premises and edge locations with limited space or small capacity requirements, such as retail stores, branch offices, healthcare provider locations, or factory floors. Outposts servers provide local compute and networking services.
Outposts servers come with internal NVMe SSD instance storage, supporting local storage used for data access and processing on premises, and for launching Amazon Elastic Block Store (Amazon EBS)-backed Amazon Machine Images (AMIs). The data on these volumes persists after an instance reboot but does not persist after an instance termination. In order for data to persist beyond the lifetime of the instance, it is important to back up your data to a persistent AWS storage, such as an Amazon Simple Storage Service (Amazon S3) bucket or an Amazon Elastic Block Store (Amazon EBS) volume.
In this post, we explore several approaches to back up the data stored in the instance storage volumes of your EC2 instances running on an Outposts server to a persistent storage solution from AWS, and explore their benefits and use cases.
Planning for failure
When evaluating a backup strategy, it’s important to understand the failure modes you are looking to recover from. Some examples are ransomware attacks, accidental data deletion, hardware failure, or a wide scale issue impacting the whole facility where your Outposts servers and on-premises devices (such as network switches, storage appliances) reside. These failures come in many forms and are often unplanned and unexpected events. Next, understand what is considered acceptable recovery for your business. For example, what are the Recovery Time Objective (RTO) and Recovery Point Objective (RPO) for your workload running on Outposts servers? These two values, defined by your organization, profile how long a service can be down during recovery and quantify the acceptable amount of data loss, helping you define the appropriate backup strategy.
Scenario 1: Backup to AWS storage in an AWS Region
Backup to an AWS Region enables data redundancy outside of the data center or facility where your Outpost resides, taking advantage of the durability, high availability, and scalability provided natively by the storage in the Region. This approach offers flexibility for restoration to the Region or to an Outposts server in a different edge location if the original data center/facility is impacted by an irrecoverable incident. However, when restoring the data back to an Outposts server, this approach could result in relatively high RTO, depending on the throughput of the service link and the amount of data to restore. In the following sections, we will cover using the AWS Elastic Disaster Recovery (AWS DRS) and an open source solution based on operating system tools and AWS Systems Manager (AWS SSM).
Option 1: AWS Elastic Disaster Recovery (AWS DRS)
You can use AWS DRS to perform a continuous replication of workloads that reside on the Outposts C6id server powered by Intel processors (C6gd are not supported, since only 64-bit operating systems built for the x86 system architecture are supported by AWS DRS) to a staging area subnet in the Region. AWS DRS provides nearly continuous, block-level replication in the Region and creates periodic EBS Snapshots according to the Point in Time (PIT) state schedule for AWS DRS.
The following diagram shows the continuous replication of the data in the instance store volumes through AWS DRS. The PIT EBS Snapshots are used to create Amazon EBS-backed AMIs as a backup of the EC2 instances running on the Outposts server.

Figure 1 – Continuous replication of the Instance Store Volumes data from the instances running Outpost Server to a staging area in the parent region through DRS
Despite AWS DRS not supporting the failback from the Region to Outposts servers, you can use the EBS snapshots taken by AWS DRS to restore the data back to the Outposts server at the desired PIT following the steps described in this post.
Prerequisites
The following prerequisites are required to complete the walkthrough:
- The EC2 instance to restore running on the Outposts server has been added as a source server to AWS DRS by installing the AWS Replication Agent.
- The initial sync has been completed and the data replication status is showing as healthy.
Restore the entire EC2 instance on the same or a different Outposts server
- Use the describe-recovery-snapshots command to list the PIT Snapshots taken by AWS DRS for the source server to restore.
$ aws drs describe-recovery-snapshots --source-server <source-server-id>
2. Based on the time in which you want to restore your data, retrieve the corresponding EBS Snapshots in the output of the command. The following is an example of the output:
{
    "items": [
       {
            "ebsSnapshots": [
                "snap-07bf348d58151a432"
            ],
            "expectedTimestamp": "2024-06-13T16:40:00+00:00",
            "snapshotID": "pit-a4877ff6fa68561bf",
            "sourceServerID": "s-a080ceb10af7275a7",
            "timestamp": "2024-06-13T16:46:56.645979+00:00"
        },
        {
            "ebsSnapshots": [
                "snap-0496020ff7f83486d"
            ],
            "expectedTimestamp": "2024-06-13T16:30:00+00:00",
            "snapshotID": "pit-aece827519e1b0fbb",
            "sourceServerID": "s-a080ceb10af7275a7",
            "timestamp": "2024-06-13T16:37:06.600323+00:00"
        },
        {
            "ebsSnapshots": [
                "snap-0d7ebd23e56346cea"
            ],
            "expectedTimestamp": "2024-06-13T16:20:00+00:00",
            "snapshotID": "pit-a56960f89ff12579e",
            "sourceServerID": "s-a080ceb10af7275a7",
            "timestamp": "2024-06-13T16:27:01.595791+00:00"
        },
…
…
3. Open the Amazon EC2 console. In the navigation pane, choose Snapshots and filter by the Snapshot ID chosen in the previous step: snap-07bf348d58151a432.

4. Choose Actions, Create image from snapshot, and specify the Image name. You can leave the other information as default or customize as desired.
5. To perform the restore, launch a new EC2 instance on the same or a different Outposts server from the Amazon EBS-backed AMI created in the previous step.
Note that since AMIs are downloaded from the Region with every instance launch on Outposts servers, this approach could result in an RTO spanning hours, depending on the throughput of the service link and the size of the local instance storage from which the Snapshot and AMI were taken by AWS DRS. Alternatively, if you need to restore only some files and directories, you can do so by launching the EC2 instance in the Region from the AMI taken in Step 4 and then transferring the desired data from that instance to the source server running on Outposts.
Option 2: Backup to the Region using an open source solution
In addition to AWS DRS, you can use open source solutions and/or operating system (OS) functions to back up data from local instance storage to a Region. Consider this approach when you want a highly-customizable solution for workloads where lack of commercial support is acceptable. The open source solution uses AWS Systems Manager Automation and OS functions to take an Amazon EBS-backed AMI in the Region from a Linux EC2 instance running on your Outposts server. The following diagram provides a high-level overview of the solution.

Figure 2 – Workflow of the open source solution
- The Automation creates a helper instance and a baseline EBS volume attached to it in the Region, using an AWS CloudFormation
- The Automation executes commands on the OS of the EC2 instance running on the Outposts server to perform preliminary checks and start syncing data from the local instance store volume to the baseline EBS volume in the Region.
- The sync continues until the data has been transferred successfully.
- When the sync completes, the Automation takes an EBS Snapshot of the baseline EBS volume and then creates an Amazon EBS-backed AMI from it.
Create the Automation document
- Open the github page of the open source solution backup-outposts-servers-linux-instance.
- Follow the Installation Instructions to create the Systems Manager Automation document.
Back up an EC2 instance running on Outposts server
- After creating the Automation document, follow the Usage Instructions to execute the Automation and initiate the backup.
- Monitor the Execution status in the System Manager Automation console.
Restore the entire EC2 instance on the same or a different Outposts server
- Open the Amazon EC2 console. In the navigation pane, choose AMIs and filter by the AMI names that contain the InstanceId to restore.

2. Select the desired AMI to restore and note its AMI ID.
3. To perform the restore, launch a new EC2 instance on the same or a different Outposts server from the Amazon EBS-backed AMI identified in the previous step.
Considerations for data residency and service link bandwidth
Data residency is a critical consideration for organizations that need to collect and store data in their own data centers for regulatory or compliance reasons. In this case, users cannot back up their data to the Region and need to consider backing up to another on-premises system.
Another consideration is the impact on the service link connectivity when performing backup and restore operations between the Outposts and the Region. When implementing the solutions described in the “Backup to AWS storage in an AWS Region” scenario, both your backup/restore and management/monitoring operations for your Outpost rely on the service link connectivity. Although AWS DRS provides block-level replication, the open source solution we discuss in this post only replicates data, resulting in smaller snapshot sizes for users with lower service link bandwidth requirement.
If you foresee bandwidth constraints for your service link, consider backing up to another on-premises system that is reachable through the local network interface (LNI) of your Outposts server.
Scenario 2: Backup to AWS storage in your on-premises environment
For the preceding reasons, you may need to back up your workload running on Outposts server to a persistent AWS storage system within the same geo political boundary. To do so, you can use an AWS Outposts rack that resides in the same or a different physical location and is reachable through the LNI of your Outposts server.
Outposts rack with Amazon S3 on Outposts allows you to run AWS infrastructure, services, and object storage to your on-premises to meet local data processing and data residency needs while offering the AWS durable storage that can be used to store your backup.
Thanks to this, you can use the same approaches described in the “Backup to AWS storage in an AWS Region” section at a high level to back up your data, while the storage is hosted on the Outposts rack. When evaluating this approach, keep in mind these important considerations for local snapshots.
With this approach, you can store your backup on premises to meet your data residency requirements. This also keeps the network traffic for your backup and restore within your on-premises network, without impacting the service link.
Conclusion
In this post, we showed different approaches to design backup and restore strategies for your workloads running on Outposts servers. Implementing the right approach can help protect your organization’s data against loss or corruption while meeting your performance, RTO, RPO, and data residency needs, with backup destinations ranging from AWS storage in the Region, locally on Outposts rack, or in a hybrid architecture.
Supply-chain attack analysis: Ultralytics (PyPI Blog)
Post Syndicated from jzb original https://lwn.net/Articles/1001909/
The Python Package Index (PyPI) Blog has an analysis
of the compromise of
the ultralytics
project, and what PyPI has learned from this event:
PyPI staff and volunteers do their best to remove malware, but
because the service is open to anyone looking to publish software
there is an unfortunately high amount of abuse. Thankfully most of
this abuse does not have the same widespread impact as a targeted
attack on an already widely-used project.Mike Fiedler, the PyPI Safety and Security Engineer is working on
new systems for reducing the time that malware is available to be
installed on PyPI, through APIs
that security researchers can automatically send reports to and
new “quarantine”
release status to prevent harm while a human investigates the
situation. Expect more in this space in 2025!
When should we require that firmware be free?
Post Syndicated from Matthew Garrett original https://mjg59.dreamwidth.org/70895.html
The distinction between hardware and software has historically been relatively easy to understand – hardware is the physical object that software runs on. This is made more complicated by the existence of programmable logic like FPGAs, but by and large things tend to fall into fairly neat categories if we’re drawing that distinction.
Conversations usually become more complicated when we introduce firmware, but should they? According to Wikipedia, Firmware is software that provides low-level control of computing device hardware
, and basically anything that’s generally described as firmware certainly fits into the “software” side of the above hardware/software binary. From a software freedom perspective, this seems like something where the obvious answer to “Should this be free” is “yes”, but it’s worth thinking about why the answer is yes – the goal of free software isn’t freedom for freedom’s sake, but because the freedoms embodied in the Free Software Definition (and by proxy the DFSG) are grounded in real world practicalities.
How do these line up for firmware? Firmware can fit into two main classes – it can be something that’s responsible for initialisation of the hardware (such as, historically, BIOS, which is involved in initialisation and boot and then largely irrelevant for runtime[1]) or it can be something that makes the hardware work at runtime (wifi card firmware being an obvious example). The role of free software in the latter case feels fairly intuitive, since the interface and functionality the hardware offers to the operating system is frequently largely defined by the firmware running on it. Your wifi chipset is, these days, largely a software defined radio, and what you can do with it is determined by what the firmware it’s running allows you to do. Sometimes those restrictions may be required by law, but other times they’re simply because the people writing the firmware aren’t interested in supporting a feature – they may see no reason to allow raw radio packets to be provided to the OS, for instance. We also shouldn’t ignore the fact that sufficiently complicated firmware exposed to untrusted input (as is the case in most wifi scenarios) may contain exploitable vulnerabilities allowing attackers to gain arbitrary code execution on the wifi chipset – and potentially use that as a way to gain control of the host OS (see this writeup for an example). Vendors being in a unique position to update that firmware means users may never receive security updates, leaving them with a choice between discarding hardware that otherwise works perfectly or leaving themselves vulnerable to known security issues.
But even the cases where firmware does nothing other than initialise the hardware cause problems. A lot of hardware has functionality controlled by registers that can be locked during the boot process. Vendor firmware may choose to disable (or, rather, never to enable) functionality that may be beneficial to a user, and then lock out the ability to reconfigure the hardware later. Without any ability to modify that firmware, the user lacks the freedom to choose what functionality their hardware makes available to them. Again, the ability to inspect this firmware and modify it has a distinct benefit to the user.
So, from a practical perspective, I think there’s a strong argument that users would benefit from most (if not all) firmware being free software, and I don’t think that’s an especially controversial argument. So I think this is less of a philosophical discussion, and more of a strategic one – is spending time focused on ensuring firmware is free worthwhile, and if so what’s an appropriate way of achieving this?
I think there’s two consistent ways to view this. One is to view free firmware as desirable but not necessary. This approach basically argues that code that’s running on hardware that isn’t the main CPU would benefit from being free, in the same way that code running on a remote network service would benefit from being free, but that this is much less important than ensuring that all the code running in the context of the OS on the primary CPU is free. The maximalist position is not to compromise at all – all software on a system, whether it’s running at boot or during runtime, and whether it’s running on the primary CPU or any other component on the board, should be free.
Personally, I lean towards the former and think there’s a reasonably coherent argument here. I think users would benefit from the ability to modify the code running on hardware that their OS talks to, in the same way that I think users would benefit from the ability to modify the code running on hardware the other side of a network link that their browser talks to. I also think that there’s enough that remains to be done in terms of what’s running on the host CPU that it’s not worth having that fight yet. But I think the latter is absolutely intellectually consistent, and while I don’t agree with it from a pragmatic perspective I think things would undeniably be better if we lived in that world.
This feels like a thing you’d expect the Free Software Foundation to have opinions on, and it does! There are two primarily relevant things – the Respects your Freedoms campaign focused on ensuring that certified hardware meets certain requirements (including around firmware), and the Free System Distribution Guidelines, which define a baseline for an OS to be considered free by the FSF (including requirements around firmware).
RYF requires that all software on a piece of hardware be free other than under one specific set of circumstances. If software runs on (a) a secondary processor and (b) within which software installation is not intended after the user obtains the product
, then the software does not need to be free. (b) effectively means that the firmware has to be in ROM, since any runtime interface that allows the firmware to be loaded or updated is intended to allow software installation after the user obtains the product.
The Free System Distribution Guidelines require that all non-free firmware be removed from the OS before it can be considered free. The recommended mechanism to achieve this is via linux-libre, a project that produces tooling to remove anything that looks plausibly like a non-free firmware blob from the Linux source code, along with any incitement to the user to load firmware – including even removing suggestions to update CPU microcode in order to mitigate CPU vulnerabilities.
For hardware that requires non-free firmware to be loaded at runtime in order to work, linux-libre doesn’t do anything to work around this – the hardware will simply not work. In this respect, linux-libre reduces the amount of non-free firmware running on a system in the same way that removing the hardware would. This presumably encourages users to purchase RYF compliant hardware.
But does that actually improve things? RYF doesn’t require that a piece of hardware have no non-free firmware, it simply requires that any non-free firmware be hidden from the user. CPU microcode is an instructive example here. At the time of writing, every laptop listed here has an Intel CPU. Every Intel CPU has microcode in ROM, typically an early revision that is known to have many bugs. The expectation is that this microcode is updated in the field by either the firmware or the OS at boot time – the updated version is loaded into RAM on the CPU, and vanishes if power is cut. The combination of RYF and linux-libre doesn’t reduce the amount of non-free code running inside the CPU, it just means that the user (a) is more likely to hit since-fixed bugs (including security ones!), and (b) has less guidance on how to avoid them.
As long as RYF permits hardware that makes use of non-free firmware I think it hurts more than it helps. In many cases users aren’t guided away from non-free firmware – instead it’s hidden away from them, leaving them less aware that their freedom is constrained. Linux-libre goes further, refusing to even inform the user that the non-free firmware that their hardware depends on can be upgraded to improve their security.
Out of sight shouldn’t mean out of mind. If non-free firmware is a threat to user freedom then allowing it to exist in ROM doesn’t do anything to solve that problem. And if it isn’t a threat to user freedom, then what’s the point of requiring linux-libre for a Linux distribution to be considered free by the FSF? We seem to have ended up in the worst case scenario, where nothing is being done to actually replace any of the non-free firmware running on people’s systems and where users may even end up with a reduced awareness that the non-free firmware even exists.
[1] Yes yes SMM
 comments
Comic for 2024.12.12 – BREAKING NEWS
Post Syndicated from Explosm.net original https://explosm.net/comics/breaking-news
New Cyanide and Happiness Comic
[$] A last look at the 4.19 stable series
Post Syndicated from corbet original https://lwn.net/Articles/1000933/
The release of the 4.19.325 stable
kernel update on December 5 marked the end of an era of sorts.
This kernel had been supported for just over six years since its initial
release in October 2018; over that time, 325 updates were released,
adding 30,109 fixes. Few Linux kernels receive public support for so long;
it is worth taking a look at this kernel’s history to see how it played
out.
Navigating Choppy Waters: Top Security Predictions from Rapid7’s 2025 Webinar
Post Syndicated from Rapid7 original https://blog.rapid7.com/2024/12/12/navigating-choppy-waters-top-security-predictions-from-rapid7s-2025-webinar/

It’s that time of year again — one year is ending and another is set to begin.. And what a year it’s been for the security community! The sheer scale of incidents has left SecOps teams breathless, so thinking about what could be in store next year can be overwhelming.
But there’s no need to panic; despite the disruption, the community has rallied together and risen to the challenge, demonstrating adaptability, collaboration, and resilience. And, most of all, why this industry isn’t for the faint of heart!
Over the last few years, we’ve seen significant interest in our annual Security Predictions webinar. Security teams use the session to take stock of the current year and use the predictions to get a head start on planning for the next.
This year, the webinar was shot in person from Rapid7’s office in Belfast, a city that has emerged as a modern tech innovation hub. From its origins as the shipyards that birthed the Titanic, Belfast’s history is a testament to both ambition and resilience, so it is fitting that this city served as the stage for Rapid7’s annual Security Predictions webinar.
Hosted by industry heavy hitter Brian Honan, CEO of BH Consulting, the webinar brought together Rapid7 security and policy experts Raj Samani, Chief Scientist, and Sabeen Malik, VP of Global Government Affairs and Public Policy.
Looking Back: 2024’s Predictions in Review
Before diving into the future, the panel revisited their predictions for 2024, which focused on three core areas:
1. Increasing risks and regulations will intensify pressure on businesses to navigate evolving demands across a complex global landscape.
Sabeen Malik highlighted that the forecasted rise in cyber regulations materialized, with frameworks like NIS2 and the SEC’s cybersecurity mandates intensifying global compliance demands.
2. Expect a surge in the growth of real-time information sharing within global public-private cyber partnerships.
While strides were made, Raj Samani noted that much of the shared data lacks actionable context, calling for enriched, actionable intelligence that organizations can immediately act upon.
3. The continued use of zero-day vulnerabilities exploited by ransomware groups will compel SOCs to focus on exposure management and validation strategies.
As predicted, ransomware groups continued to exploit zero-day vulnerabilities, a trend exacerbated by their increasing sophistication and access to novel attack vectors.
“2024 was pretty much on the button,” said Brian Honan. “The predictions were accurate, but the challenges they highlighted are far from over.”
2025 could be Iceberg Alley/Visibility as a Life Preserver
Prediction 1: Greater visibility will act as a life preserver for security teams treading water across an increasingly complex attack surface.
Visibility isn’t just a cybersecurity buzzword—it’s the foundation of effective defense. Raj Samani summarized this challenge succinctly: “You can’t protect what you don’t know about.”
In today’s environment, where assets span on-premise systems, cloud services, and third-party integrations, organizations often need help to map their full attack surface. Raj explained how conflicting data from multiple tools complicates this task: “Your endpoint provider says one thing, your VPN provider says another — how do you normalize this information?”
After further discussion, the panellists provided a short, medium and long-term action plan to help defenders strengthen their visibility.
Prediction 2: To thrive in a world where regulatory change is an ongoing concern, SecOps should prepare for both the predictable and the unpredictable.
In cybersecurity, the only constant is change. The panel emphasized the need for agile Security Operations Centers (SOCs) to respond effectively to both expected and unexpected threats.
“This is about moving beyond checkbox exercises,” said Sabeen. “SOC teams must adopt continuous processes and infrastructure to manage a rapidly changing landscape.” She pointed to regulatory frameworks like DORA and NIS2, which mandate real-time monitoring and frequent vulnerability assessments, as drivers of this shift.
The panelists also provided an action plan that prioritizes incident response, real-time threat detection, and continuous vulnerability management to meet evolving compliance and security needs.
Prediction 3: Cybercriminals will increasingly exploit zero-day vulnerabilities, expanding potential entry points and bypassing traditional security measures to deliver more ransomware attacks.
Ransomware remains a dominant threat, evolving as attackers adopt zero-day vulnerabilities to bypass traditional defenses. Raj explained how this shift is lowering the technical barriers for cybercriminals: “Access to zero-days allows even unsophisticated actors to execute devastating attacks.”
The professionalization of ransomware groups further exacerbates the threat. As Sabeen noted, “This is no longer a scattered effort. It’s a highly organized, professional ecosystem, and it’s growing at an unsustainable rate.”
The team outlined an action plan to combat ransomware, including the critical action step of engaging organizational leadership to prioritize cybersecurity investments and ensure board-level awareness of the risks.
“Use this as an opportunity to have meaningful discussions with your board,” Raj advised. “Ransomware is a top concern, and preparation is key.”
Final Thoughts: Staying Resilient in Choppy Waters
While the challenges of 2025 may seem daunting, the panel concluded on a hopeful note. Raj highlighted Rapid7’s commitment to empowering the industry through open-source tools and resources like AttackerKB, Metasploit, and Velociraptor.
“Don’t be overwhelmed,” Raj said. “We’re all in this together, and Rapid7 is here to help with actionable insights and tools that protect what matters most.”
As Brian wrapped up, he reflected on Belfast’s legacy and the lessons it offers. “The Titanic reminds us of both the heights of ambition and the importance of preparation. In cybersecurity, as in life, visibility, adaptability, and resilience are the keys to navigating choppy waters.”
To get a full understanding of what 2025 could bring, watch the Top Cybersecurity Predictions webinar on-demand.
Защо младите ни лекари да се обучават и в чужбина? Разговор с д-р Неда Бакалова
Post Syndicated from Надежда Цекулова original https://www.toest.bg/zashto-mladite-ni-lekari-da-se-obuchavat-i-v-chujbina/

Неда Бакалова е лекарка, специалистка по анестезиология, реанимация и интензивно лечение. Учила е и е специализирала в България, но в последните години работи в болницата в Саутхемптън в Обединеното кралство. Затова в интервюто ще прочетете колко много пъти казва „тук“. Нейното „тук“ е нашето „там“, където има едно по-качествено организирано детско здравеопазване, даващо по-добри резултати.

Неда е един от инициаторите на кампанията „Лекари на бъдещето“, която се организира от Фондация BCause и медийната платформа „Майко Мила“. Това е програма за повишаване на нивото на педиатричната помощ в България, ориентирана към лекари специализанти в различни педиатрични специалности. Целта ѝ е да им помогне да натрупат професионален опит в лечебни заведения в чужбина, който да пренесат на местна почва в името на толкова дълго чаканата качествена промяна на българското детско здравеопазване.
Програмните цели са през 2025 г. да бъдат изпратени петима млади лекари на клинично наблюдение в болници в Европа. Необходимата сума е приблизително 50 000 лв.
Може да дарите на:
Платформата.бг
През benevity – ако сте регистриран служител на компания с профил там.
На номер 17 777 с текст DMS LEKARI.
Вие сте млада лекарка, която вече се е установила в чужбина. Защо се интересувате от обучението на колегите си, които практикуват в България?
Да, аз съм анестезиолог по специалност. От три години работя в кардиореанимацията и кардиохирургията в болницата в Саутхемптън. Преди това в България съм била основно в болница „Света Екатерина“. След пристигането си тук за първи път започнах да се занимавам с детска кардиохирургия. Екипът доста ме подкрепи и продължава да ме подкрепя и обучава. Вече давам упойки на деца в детската кардиохирургия, докато паралелно работя в реанимацията за възрастни и наблюдавам работата на колегите в детската реанимация.
Самата програма „Лекари на бъдещето“ започна с една лична история. Може би не е моя работа да я разказвам, но в общи линии, детенцето на инициаторката, което, за съжаление, миналата година почина, прекара последните си 5–6 месеца в Педиатрията [СБАЛ по детски болести „Проф. Иван Митев“ – б.р.]. Чувахме се често и се налагаше да обяснявам неща, които не ѝ бяха обяснени. И оттам се зароди идеята, че би било хубаво специализантите по педиатрия да придобият някакъв опит извън България, да видят, че медицината може да се прави и по друг начин.
Аз съм била специализант в България и е много тежко.
И всъщност основната идея на тази програма е да се покаже на младите лекари, че не всичко опира до това колко пари или колко ресурси има в системата. Голяма част е организация, мислене.
Нас не ни учат как да говорим с пациентите, как да им осигурим психологическото пространство да минат през преживяването си. И би било полезно да видят как това се прави от лекарите тук.
Кое е различното освен количеството ресурси? Малко е трудно, но може ли да опитате да обясните какво означава „друг начин на мислене“ например?
Няма да е лесно, защото това не засяга само лекарите и тяхното отношение към пациентите, то е двустранно и като че ли по-всеобхватно. Аз също си давам сметка, че съм се променила тук. И обществото е друго, и отношенията между хората са по-различни. За съжаление, ние, българите, не се държим много добре един с друг, което се пренася на всички нива – от медик към пациент, от близки към медици.
Освен това в Англия хората са изключително горди със своята обществена здравна система, тъй като е изцяло финансирана и създадена от данъците им. И въпреки че има доста кусури и доста чакане, цялостното отношение към работещите в здравеопазването е позитивно, има доверие, което много улеснява работата.
В България липсва доверие между пациенти и лекари. Също така няма достатъчно хора в системата, натоварването е огромно. В резултат е много вероятно, като отидеш да говориш с близки и пациенти, да си изнервен, защото си преуморен, а те от своя страна да са подозрителни и да не ти вярват. Как да се срещнете в тези условия?
Тук разговорът, срещата между лекари и пациенти са стимулирани по всякакъв начин. Има стая за близки, където аз мога да седна и да говорим нормално с хората в дискретна среда колкото време е нужно. В България най-често сте изправени в коридор или пред някаква полуотворена врата, често без да можете да изолирате разговора от външни хора.
Затова споменах „начин на мислене“, защото не става само с лични усилия от самата мен. Просто системата вижда и третира отношенията лекар–пациент по друг начин.
В България, освен комуникацията, неглижирани са и дефинирането, и контролът на качеството на медицинската помощ. Обединеното кралство има традиции в създаването на професионални стандарти в медицината. Какво може да научи един млад български лекар за това в една болница като тази в Саутхемптън?
Тук всичко е доста по-прозрачно, за всичко се води статистика и се правят одити. Тази прозрачност е необходима, за да се видят грешките в системата и да се коригират. Ако ти не проследяваш какво всъщност правиш, не водиш никаква статистика или поне не я показваш, ако никой никога не търси отговорност, то качеството със сигурност е по-лошо. В България като цяло нямаме система за това. Тук, примерно, ако си специализант, трябва всяка година да направиш някакъв малък одит на данни в болницата, в която работиш, по някаква тема, която ти избереш. Хората тук имат традиция да проследяват качеството на собствената си работа. Аз лично не съм виждала да се прави в България.
Може ли да дадете пример за читателите, които не се занимават с медицина?
Аз се занимавам с кардиохирургия. Ако отидете на сайта на Дружеството на кардиохирурзите [в Обединеното кралство – б.р.], ще откриете данни болница по болница какви пациенти се оперират, каква е смъртността им, какви са усложненията им. В България такова нещо няма.
Освен това дружествата тук изработват и насоки за клинично поведение. В България би било практично да ползваме европейските, но те също трябва да се преведат и адаптират, което не мисля, че се прави от всички дружества по специалности.
Крайният резултат от всичко е, че тук е трудно да се види някой, който практикува медицината по много по-различен начин от друг. Тоест има някакво общо ниво и общо разбиране какво е добра практика и какво не е.
Колко време ще прекарат лекарите от програмата в болницата в Саутхемптън и до каква степен ще могат да се запознаят с тези процеси, които описвате?
Ще прекарат между 4 и 6 седмици. Първите специалисти ще видят как се вършат нещата в детската реанимация в болницата в Саутхемптън. Там се работи по съвременни протоколи, и то не само от лекарите, но и от сестрите. Например като предаваш пациент, има чеклист какво се прави – определени стъпки, за да се предотвратят човешки грешки. Човешките грешки са част от това, че сме хора, и съществуват винаги, но те могат да бъдат сведени до минимум, когато нещата са стандартизирани и има някакъв ред.
Друг полезен според мен опит за колегите ще бъде да видят взаимоотношенията в отделението. Моят опит с отношенията между специалисти и специализанти от България не е особено позитивен. Тук взаимоотношенията са много по-професионални. Няма обвинения, няма повишаване на тон. Като цяло това води до по-безопасна практика, тъй като, ако някъде стане грешка или трябва да се каже нещо притеснително, не се страхуваш да го кажеш.
От чисто медицинска гледна точка болницата има една интересна дейност – тъй като е регионална болница в Южна Англия, покрива доста голяма зона за транспорт на тежко болни деца в сътрудничество с оксфордската реанимация.
Тук организацията на болниците е горе-долу като в България – съществуват големи многопрофилни болници и малки болници, които са общински. Ако има дете, което е в тежко състояние в по-малък център, това звено се заема със задачата да го премести в големия център. Това всъщност е доста, доста трудна работа. И колегите ще могат да видят как се прави и как се организира.
Ще могат да участват и в курсове за спешна животоспасяваща помощ* на деца. И не на последно място – ще видят на практика как протича комуникацията в реанимацията както с родители, така и с деца.
Кога очаквате първите специализанти от България?
Очакваме през февруари да дойде един човек, а по-късно през годината още двама да минат през тази болница. Междувременно аз работя за връзки и с други реанимации. Желанието ни е да могат да се обучават поне по петима души годишно.
Има ли възможност по някакъв начин да се надгради този опит впоследствие?
Това зависи в голяма степен и от самите лекари, които минават през обучението. В Англия постоянно има обяви за обучения, тук се наричат fellowship. Това е вече работа. Доста чужденци идват по този начин, за да се обучават. Колегите, които са преминали през първоначалния етап като клинични наблюдатели – observership, се ползват с предимство при кандидатстването за позиции за по-сериозни обучения. Освен това, докато са тук, могат да създадат контакти, които да улеснят последващо развитие. Аз лично съм се ангажирала да помагам на колегите в опознаването на стъпките и дори в подготовката на документи при нужда.
Няколко пъти споменахте „детска реанимация“. Само за реаниматори ли е отворено това обучение, или и за лекари, обучаващи се в други тесни детски специалности?
За момента се опитваме да започнем с това. Партнираме си със Специализираната болница по детски болести в София и знаем със сигурност, че ръководството ѝ е готово да подкрепи лекари, работещи в тяхното интензивно отделение, да се включат в обученията. Извън това със сигурност има нужди, а тук има възможности, но ще ни е необходимо време, за да ги развием.
Може би е важно да обясня, че когато един млад лекар е клиничен наблюдател, той не просто се разхожда из болницата и наблюдава. Тук на тези обучения се гледа много сериозно и екипът се ангажира с обучението на младия лекар, затова няма възможност например в реанимацията по едно и също време да има много колеги със статут на клинични наблюдатели. Отделно в болницата в Саутхемптън често идват наблюдатели от други по-малки лечебни заведения от региона.
Как ще се финансират „лекарите на бъдещето“?
Фондация BCause ни подкрепи с организацията на кампанията, вече имаме профили в Платформата.бг и DMS. Необходимо е да се плати такса на болницата, която е над 1000 паунда. Отделно бихме искали да можем да покрием разходите на лекарите за път и престой.
Просто в България има много малко възможности да видиш, че е добре нещата да се правят системно. Дори някой да прави нещо добре, системата ни има много недомислици и не ни позволява да сме консистентни: един път можем да предоставим добра помощ, следващия път – не. И не зависи само от нас. Затова е хубаво да се види цялостната организация на една система, която дава по-добри резултати.
* Emergency life support (англ.) – това понятие обикновено се използва за процедури или мерки, предприемани в критични ситуации за поддържане на жизнените функции на пациента, например реанимация, изкуствена вентилация или сърдечен масаж.
Security updates for Thursday
Post Syndicated from jake original https://lwn.net/Articles/1001863/
Security updates have been issued by Debian (libsoup2.4, python-aiohttp, and upx-ucl), Fedora (iaito, python3.11, python3.9, and radare2), Red Hat (ruby, ruby:2.5, and ruby:3.1), Slackware (mozilla-thunderbird), SUSE (govulncheck-vulndb, nodejs18, nodejs20, and socat), and Ubuntu (ofono and python-tornado).
Акаунтите на GovAlertEu са вече основно в Mastodon и Bluesky
Post Syndicated from Боян Юруков original https://yurukov.net/blog/2024/govalerteu-mastodon-bluesky/
Светлината е най-добрият дезинфектант.
Преди малко повече от десет години се замислих, че ми е трудно да следя какво се случва из родните институции и мога да подобря процеса. Затова създадох система, която да изчита по няколко пъти на ден новини, документи, събития и други и да ги публикува в акаунт в Twitter. С времето източниците на информация се увеличиха на 140 от над 31 различни институции, а акаунтите станаха осем.
Проектът се нарича GovAlertEu и до скоро публикуваше съобщения в неофициални акаунти на няколко институции, включително тези на МВР и Министерски съвет. Акаунтът на МВР стана официален на два пъти – за последно при един от редовните кабинети. След това си върнах контрола над него. Този на Министерски съвет все още е официален и имат достъп до него като автоматизацията за публикуване на новини си остава.
Няколко неща се промениха в последната година. Първо, значително увеличеното количество информация, която публикувам за градоустройството в София, Пловдив и Благоевград, както и интереса към данните и визуализациите създаде натоварване на ресурсите, които използвам. Второ, промени в моделът на работа на Twitter/X като мрежа направи почти невъзможна работата на автоматизирани акаунти като моя без да се плаща значителни суми на месец. Суми, които биха били оправдани единствено за големи компании и astroturf бот мрежи, каквито сякаш са единствените останали там.
Още при първите крачки към затваряне на API достъпа до Twitter започнах да гледам мрежи като Mastodon. Тези дни довърших интеграцията и вече е достъпна за използване. Благодаря на @mapto, че ме насочи към подходящ код, който да използвам.

На адреса m.govalert.eu ще откриете всички акаунти свързани с тази мрежа. Там се публикуват в реално време без ограничения всички новини идващи от институциите. Тази страница е паралелно и портал за ActivityPub протокола, което значи, че може да ги следвате в която и да е Fedi мрежа искате, включително Mastodon. Свързал съм акаунтите пред Fedi Bridge с Bluesky, където съобщенията ще се появяват със забавяне от една до 15 мин.
Линковете към отделните мрежи, включително все още Twitter, ще намерите на самата страница като бутони. В Twitter от началото на годината заради ограниченията ще публикувам единствено препратки към Mastodon с ежедневна статистика колко съобщения са пропуснали следящите там. Като начало това ще се случи за основния акаунт на GovAlertEu, този на МВР и този за градоустройството в София. Този на правителството няма толкова много новини, така че ще остане последен.
Ще забележите, че липсват стари съобщения. В следващата седмица ще генерирам новините поне 4-5 години назад във времето. Искам да развия тази страница като основна за услугата заедно със статистика, индикация кои страници на администрацията са изтрити, изчезнали или променени, както и архивиране на някои от тях. В такива случаи линковете от социалните мрежи ще сочат към архивираната версия.
Също, вижда се, че акаунтът на парламента няма съобщения от известно време. Всъщност, източниците на информация не са 140, а 218 от 47 институции, но една немалка част от тях или са променили сайтовете си значително, или не публикуват вече нужната информация. Предвид смяна на фокуса към градоустройството не съм поддържал тези източници, но с този нов портал ще го направя – един по един ще ги обновя започвайки от страницата на парламента. Тази промяна отваря възможността да разширя значително информацията, която искам да публикувам като до сега въвеждах ограничения заради комуникацията с Twitter.
Моите акаунти в Mastodon и Bluesky ще намерите в линковете под блога ми. Приветствам всякаква обратна връзка и идеи.
The post Акаунтите на GovAlertEu са вече основно в Mastodon и Bluesky first appeared on Блогът на Юруков.
The 1985 Computer Chronicles Christmas Buyer’s Guide 🎄
Post Syndicated from LGR original https://www.youtube.com/watch?v=f1iIU1Vui2M
Android privacy improvements break key attestation
Post Syndicated from Matthew Garrett original https://mjg59.dreamwidth.org/70630.html
Sometimes you want to restrict access to something to a specific set of devices – for instance, you might want your corporate VPN to only be reachable from devices owned by your company. You can’t really trust a device that self attests to its identity, for instance by reporting its MAC address or serial number, for a couple of reasons:
- These aren’t fixed – MAC addresses are trivially reprogrammable, and serial numbers are typically stored in reprogrammable flash at their most protected
- A malicious device could simply lie about them
If we want a high degree of confidence that the device we’re talking to really is the device it claims to be, we need something that’s much harder to spoof. For devices with a TPM this is the TPM itself. Every TPM has an Endorsement Key (EK) that’s associated with a certificate that chains back to the TPM manufacturer. By verifying that certificate path and having the TPM prove that it’s in posession of the private half of the EK, we know that we’re communicating with a genuine TPM[1].
Android has a broadly equivalent thing called ID Attestation. Android devices can generate a signed attestation that they have certain characteristics and identifiers, and this can be chained back to the manufacturer. Obviously providing signed proof of the device identifier is kind of problematic from a privacy perspective, so the short version[2] is that only apps installed using a corporate account rather than a normal user account are able to do this.
But that’s still not ideal – the device identifiers involved included the IMEI and serial number of the device, and those could potentially be used to correlate devices across privacy boundaries since they’re static[3] identifiers that are the same both inside a corporate work profile and in the normal user profile, and also remains static if you move between different employers and use the same phone[4]. So, since Android 12, ID Attestation includes an “Enterprise Specific ID” or ESID. The ESID is based on a hash of device-specific data plus the enterprise that the corporate work profile is associated with. If a device is enrolled with the same enterprise then this ID will remain static, if it’s enrolled with a different enterprise it’ll change, and it just doesn’t exist outside the work profile at all. The other device identifiers are no longer exposed.
But device ID verification isn’t enough to solve the underlying problem here. When we receive a device ID attestation we know that someone at the far end has posession of a device with that ID, but we don’t know that that device is where the packets are originating. If our VPN simply has an API that asks for an attestation from a trusted device before routing packets, we could pass that on to said trusted device and then simply forward the attestation to the VPN server[5]. We need some way to prove that the the device trying to authenticate is actually that device.
The answer to this is key provenance attestation. If we can prove that an encryption key was generated on a trusted device, and that the private half of that key is stored in hardware and can’t be exported, then using that key to establish a connection proves that we’re actually communicating with a trusted device. TPMs are able to do this using the attestation keys generated in the Credential Activation process, giving us proof that a specific keypair was generated on a TPM that we’ve previously established is trusted.
Android again has an equivalent called Key Attestation. This doesn’t quite work the same way as the TPM process – rather than being tied back to the same unique cryptographic identity, Android key attestation chains back through a separate cryptographic certificate chain but contains a statement about the device identity – including the IMEI and serial number. By comparing those to the values in the device ID attestation we know that the key is associated with a trusted device and we can now establish trust in that key.
“But Matthew”, those of you who’ve been paying close attention may be saying, “Didn’t Android 12 remove the IMEI and serial number from the device ID attestation?” And, well, congratulations, you were apparently paying more attention than Google. The key attestation no longer contains enough information to tie back to the device ID attestation, making it impossible to prove that a hardware-backed key is associated with a specific device ID attestation and its enterprise enrollment.
I don’t think this was any sort of deliberate breakage, and it’s probably more an example of shipping the org chart – my understanding is that device ID attestation and key attestation are implemented by different parts of the Android organisation and the impact of the ESID change (something that appears to be a legitimate improvement in privacy!) on key attestation was probably just not realised. But it’s still a pain.
[1] Those of you paying attention may realise that what we’re doing here is proving the identity of the TPM, not the identity of device it’s associated with. Typically the TPM identity won’t vary over the lifetime of the device, so having a one-time binding of those two identities (such as when a device is initially being provisioned) is sufficient. There’s actually a spec for distributing Platform Certificates that allows device manufacturers to bind these together during manufacturing, but I last worked on those a few years back and don’t know what the current state of the art there is
[2] Android has a bewildering array of different profile mechanisms, some of which are apparently deprecated, and I can never remember how any of this works, so you’re not getting the long version
[3] Nominally, anyway. Cough.
[4] I wholeheartedly encourage people not to put work accounts on their personal phones, but I am a filthy hypocrite here
[5] Obviously if we have the ability to ask for attestation from a trusted device, we have access to a trusted device. Why not simply use the trusted device? The answer there may be that we’ve compromised one and want to do as little as possible on it in order to reduce the probability of triggering any sort of endpoint detection agent, or it may be because we want to run on a device with different security properties than those enforced on the trusted device.
comments
“We Live Here Now” and Trump’s Retelling of January 6
Post Syndicated from The Atlantic original https://www.youtube.com/watch?v=w_3poZeejP0
Защо в България вече няма масови протести?
Post Syndicated from Светла Енчева original https://www.toest.bg/zashto-v-bulgaria-veche-nyama-masovi-protesti/

Ако човек не знае нищо за политиката в България и се поразходи вечер по улиците в центъра на София или големите градове, ще си каже, че всичко ни е наред. Заведенията – пълни, площадите – празни (поне откъм протестиращи), хората – видимо доволни, както се пееше в една песен.
А основания за масови протести има. България е в ситуация на институционален полуразпад. Вече три години и половина няма редовно правителство, което да изкара дори една година, да не говорим за пълен мандат. Повечето от т.нар. регулатори (включително Висшият съдебен съвет) са с изтекли мандати, а институции като омбудсмана са без ръководство. Делян Пеевски е завладял не само ДПС, а и върховете на правосъдната система, както и редица общини в страната. Същевременно не спират хибридните атаки от Русия, чиято цел е промяна на геополитическата ориентация на България.
А какви протести бяха…
След разпадането на тоталитарния режим в края на 1989 г. в България на няколко пъти се провеждаха масови протести. И то без да броим многолюдните митинги от декември 1989 г. до началото на 90-те. Ето няколко примера:
Виденовата зима
От 1995 до февруари 1997 г. управляваше правителство на БСП, а премиер беше Жан Виденов. През този период фалираха петнайсетина банки, а инфлацията, особено от 1996 г. нататък, излезе от контрол. Спестяванията на хората се стопиха.
Личен спомен: през лятото на тази година бях студентка. Заради обезценяването на парите реших да закрия детския влог, открит навремето от баба ми. Парите, методично внасяни през цялото ми детство, стигнаха да купя сватбен подарък – един дезодорант и една самобръсначка.
В края на 1996 г. и началото на 1997 г. инфлацията прерасна в хиперинфлация. Ако сутринта забравех да купя макарони, привечер те вече струваха двойно. Заплатите станаха по 5–6 щатски долара. Не за ден, а за месец. В самия край на годината Виденов подаде оставка, но правителството му продължи да действа.
Насред тази ситуация започнаха протести, в които се включиха представители на всякакви групи – от студенти до пенсионери. Въпреки студа уличните шествия продължиха през целия януари и в началото на февруари.
Междувременно на 22 януари встъпи в длъжност президентът Петър Стоянов. По протокол той беше длъжен да връчи мандат за съставяне на правителство отново на БСП, които въпреки протестите напираха да съставят нов кабинет. Вместо направо да приеме папката с имената на новите министри, на 4 февруари Стоянов свика Консултативния съвет за национална сигурност, на който убеди вносителите да оттеглят предложението си.
Така протестът спечели. Въведе се валутен борд, който действа и до ден днешен. Проведоха се избори, спечелени с мнозинство от Обединените демократични сили, и в продължение на четири години управляваше кабинетът на Иван Костов.
#ДАНСwithme
През юни 2013 г. беше сложено началото на масовите протести против правителството на Пламен Орешарски. За да се стигне дотам обаче, роля изиграха едни други протести, заради които първият кабинет на Бойко Борисов падна. Това са т.нар. протести срещу монополите, насочени основно срещу високите цени на тока и срещу електроразпределителните дружества. Демонстрациите в десетки български градове прераснаха в политически. В този период варненецът Пламен Горанов се самоуби, като се запали пред сградата на Общината във Варна.
В резултат Борисов подаде оставка. На предсрочните избори ГЕРБ отново спечели, но Борисов отказа да състави правителство. Така мандатът отиде у БСП, която направи коалиционен кабинет с ДПС, подкрепян от „златния пръст“ на „Атака“.
Едно от първите неща, които новоизбраният премиер Пламен Орешарски направи, беше да предложи от парламентарната трибуна Делян Пеевски за ръководител на Държавната агенция за национална сигурност (ДАНС). Парламентът прие предложението и същата вечер – на 14 юни – започнаха протести, които продължиха повече от година, въпреки че Пеевски подаде оставка още на следващия ден. В тях се включиха и представители на ГЕРБ.
Освен с многохилядните шествия и със случаите на полицейско насилие, протестите срещу Орешарски се запомниха и с някои арт пърформанси (например възстановка на картината на Йожен Дьолакроа „Свободата води народа“). Както и с хаштаговете #ДАНСwithme – заигравка с ДАНС и английската дума за танц, и #КОЙ – защото никой не искаше да даде информация кой първоначално е предложил Пеевски за шеф на ДАНС. Заради този хаштаг и досега думата „кой“ се използва като синоним на Делян Пеевски.
С времето протестните шествия оредяха, но така и не изчезнаха. Пламен Орешарски подаде оставка през август 2014 г.
Протестите от 2020 г.
През 2020 г. на власт беше третото правителство на Борисов. Макар ГЕРБ да участваха в протестите от 2013 г., по време на следващите две управления, в които бяха водеща политическа сила, допуснаха ДПС (включително Пеевски) да дърпа конците както на правителството, така и на правосъдната система.
През юни бяха разпространени компромати, свързани с Бойко Борисов – снимки от спалнята му, на които се виждат пачки с пари, златни кюлчета и пистолет, както и запис, в който глас, приличащ на неговия, отправя заплахи. В края на месеца Антикорупционният фонд публикува първата част от журналистическото разследване „Осемте джуджета“.
За да илюстрират размерите на задкулисната власт и да покажат нагледно необходимостта от правосъдна реформа, през юли 2020 г. представители на партия „Да, България“, предвождани от председателя ѝ Христо Иванов, щурмуваха с лодка т.нар. сараи на почетния председател на ДПС Ахмед Доган в Росенец. Акцията извади наяве факта, че плажът около резиденцията на Доган, макар и държавна собственост, се охранява от служители на Националната служба за охрана и е на практика частен.
Комбинацията от тези събития даде тласък на протести, които също не се разминаха без полицейско насилие. Поради пандемията от COVID-19 те не бяха толкова масови, колкото през 2013 г. Но пак поради нея в тях успяха да се включат много български студенти, учещи в чужбина, които се бяха прибрали в родината заради временната отмяна на присъственото обучение.
Важна роля в протестите изигра и държавният глава Румен Радев, особено след като тежковъоръжени представители на прокуратурата демонстративно нахлуха в Президентството. В протестите, наред с „Демократична България“, се включи и проруската „Възраждане“, както и представители на левицата. Третото правителство на Борисов просъществува до април 2021 г.
Кой с кого и срещу кого?
От 2021 г. до днес последваха седем (досега) парламентарни избори и осем правителства, шест от които служебни. Тежко̀ им на бъдещите ученици, които ще четат за тези времена в учебниците по история!
В началото ситуацията изглеждаше ясна: всички срещу ГЕРБ и ДПС. Под „всички“ се разбираха президентът Румен Радев, новосъздадената пропрезидентска партия на Слави Трифонов „Има такъв народ“ (ИТН), БСП, Демократична България и коалицията „Изправи се! Мутри вън!“ (по-късно „Изправи се БГ! Ние идваме!“), предвождана от Мая Манолова. Въпреки че през 2013 г. Манолова, тогава от БСП, беше заявила, че тя е предложила Пеевски за шеф на ДАНС. После се отрече от думите си.
ИТН спечели изборите по-късно същата година, но абсурдните ѝ предложения за кабинет и не по-малко абсурдното поведение на членовете ѝ наведоха на идеята, че партията на Трифонов всъщност не иска да управлява. Междувременно в първото служебно правителство на Стефан Янев бяха изгрели звездите на Кирил Петков и Асен Василев. Те основаха собствен политически проект – „Продължаваме промяната“ (ПП), и спечелиха следващите избори. Петков стана премиер в коалиционно правителство на ПП, ДБ, БСП и ИТН.
В този период Радев беше на върха на популярността си и бе избран за втори мандат с подкрепата и на ПП. Не след дълго обаче президентът се обърна срещу Петков и Василев. Конфликтът между него и ПП се задълбочи, след като избухна войната на Русия срещу Украйна, защото ПП застанаха на страната на Украйна, а Радев е с проруски позиции.
Правителството на Петков падна през август 2022 г., след като ИТН се обърнаха срещу ПП. Последваха два служебни (и проруски) кабинета на Гълъб Донев. Народното събрание се сдоби с три проруски партии – „Възраждане“, „Български възход“ на бившия служебен премиер Стефан Янев и БСП.
Така вече основната опозиция не беше всички срещу ГЕРБ и ДПС, а Европа срещу Русия.
В тази ситуация ГЕРБ отново започнаха да изглеждат „от добрите“ и логично спечелиха следващите избори. И по-следващите. Тогава ПП, вече в коалиция с ДБ, се видяха принудени да участват в общо правителство с ГЕРБ, обявено като ротационно, за да престане Румен Радев да прокарва собствената си политика чрез служебни кабинети. Затова парламентът гласува и промени в Конституцията, важна част от които беше ограничаване на правомощията на президента.
Съвместното управление на ПП–ДБ и ГЕРБ, наречено „сглобка“ от Лена Бориславова от ПП, си имаше висока цена – легитимирането на ДПС. И в частност на Делян Пеевски. Първоначално това стана уж заради необходимото мнозинство за промените в Конституцията. Скоро обаче Пеевски се лепна за „сглобката“ и се изживяваше като официален неин говорител. А за всички проблеми ГЕРБ и ДПС изкарваха виновни ПП–ДБ. Накрая отказаха на мястото на Николай Денков премиер да стане Мария Габриел, за да се извърши ротацията на правителството. И то падна.
Последваха две служебни правителства на Димитър Главчев, чрез които – заради ограничените правомощия на президента – на практика управляват ГЕРБ и ДПС. Тоест най-вече ДПС, което междувременно се разцепи на лагер на Пеевски и лагер на Доган, а Пеевски използва властта си върху правосъдната система, за да овладее партията. Това доведе до силно манипулирани избори и разнообразни форми на натиск да се гласува за Пеевски.
Покрай всички тези събития Румен Радев отново изглежда „от добрите“. И започнаха да се множат проруски партии като „Величие“ (която за 21 гласа не влезе в последния парламент) и МЕЧ на бившия депутат от ИТН Радостин Василев.
Смисъл, заместен от паралелни реалности
Да обобщим. За няколко години вече почти всеки политически субект в България е бил в различни конфигурации както с останалите, така и срещу тях. Това подкопава доверието не само в съществуващите партии и коалиции, но и във функционирането на парламентарната демокрация.
Съответно изглежда, че масовите протести губят смисъл. За какво да се протестира и в какво би се изразило политическото представителство на един протест? Ако се протестира против корупцията и за правосъдна реформа, е много лесно гражданската енергия да бъде присвоена от проруски сили, както вече се е случвало. Ако се протестира в името на европейската ориентация на България, това може да изглежда като легитимация на „най-големите евроатлантици“ ГЕРБ и ДПС.
Междувременно хората непрекъснато биват облъчвани с послания, които изместват общественото внимание от важните проблеми. Дали ще става дума за компроматни войни, дали полиция, съд и прокуратура ще се използват като бухалки за разправа с „непослушните“ (един от последните такива случаи беше искането на имунитета на Кирил Петков), дали ще са популистки промени в законите като тази за забраната на ЛГБТИ „пропагандата“ в училище – все ще се намери какво.
На всичко отгоре, въпреки че в действията му няма нищо демократично, Делян Пеевски се държи като говорител на демократичната общност в България. Обяснявайки например, че „болната демокрация се лекува само с повече демокрация“, а „най-мощният лек за демокрацията“ са изборите. Спорно е дали подобни твърдения могат да легитимират Пеевски като демократ. По-вероятно е да легитимират в очите на избирателите парламентарната демокрация като нещо „пеевско“.
Какво се задава на хоризонта
Докато парламентарната демокрация буксува, животът някак си върви. Вярно, за пореден път се обсъжда държавен бюджет, без някой да поема ясна политическа отговорност за него. Има риск България да загуби много пари от Плана за възстановяване и устойчивост. Но пък доходите растат, страната дори влезе в Шенген и има шансове да се дореди и до еврозоната. Логично е много хора да си мислят: значи може и без парламентарна демокрация.
Слез малко повече от година изтича вторият мандат на Румен Радев, а той е публичната личност с най-висок рейтинг в България. Ако създаде свой политически проект, много вероятно е той да е печеливш. Особено ако проектът се представи като алтернатива на настоящата неработеща политическа система. Така до установяването на някаква форма на авторитарно управление от путински тип има само една крачка.
Неотдавна Конституционният съд на Румъния отмени президентските избори заради данни за намеса на Русия в тях. Оказва се впрочем, че хибридните атаки в Румъния имат връзка с фирми, регистрирани в България. И че тези фирми сеят пропаганда и тук. За разлика от румънските институции обаче, българските не изглежда да забелязват някакъв проблем.
По същия начин службите за сигурност, прокуратурата и останалите отговорни институции не изглежда да проявяват интерес към темата за българите във Великобритания, разкрити като руски агенти. Дори след информацията, че те са планирали да убият журналиста Христо Грозев, който беше разкрил кой стои зад опита за убийство на руския опозиционер Алексей Навални.
Държавата си направи оглушки и след журналистическо разследване на „Свободна Европа“, разкриващо, че Русия има нелегално консулство в офиса на БСП във Варна.
Не само на държавата – и на обществото не изглежда да му пука
Като стана дума за БСП, след близо месец блокаж за председател на настоящото 51-во Народно събрание беше избрана конституционалистката Наталия Киселова, депутатка от гражданската квота на листата на партията. Тя е била на специализация в Москва в годината, в която Русия анексира Крим. Преди изборите БСП имаше билбордове с послание „Русия е наш приятел“ – въпреки че самата Русия е обявила България за неприятелска държава.
Избирането на Киселова стана с подкрепата на ПП–ДБ. След известни драми коалицията гласува по този начин, за да изолира проруската „Възраждане“. Никой от ПП–ДБ обаче не попита Киселова каква според нея е причината за войната в Украйна. Или чий е Крим. Като председателка на НС тя е един от хората, които Румен Радев би могъл да избере за служебен премиер, ако отново не се стигне до редовен кабинет.
За разлика от българите, грузинците протестират. Причината за гнева им е решението на проруската партия, спечелила изборите, за отлагане на преговорите за присъединяване към ЕС до 2028 г. Също така протестиращите смятат, че изборите са манипулирани, и оспорват резултатите от тях. До тази ситуация се стига след систематични опити на Русия да придърпа Грузия в своята сфера на влияние.
За разлика от Грузия, България вече е в ЕС. Вероятността обаче в страната да се установи недемократичен проруски режим по подобие на този на Виктор Орбан в Унгария изобщо не е за пренебрегване. Притеснително много знаци сочат към подобен сценарий. Ако той се осъществи, тогава вече може да е късно да протестираме.
How can we teach students about AI and data science? Join our 2025 seminar series to learn more about the topic
Post Syndicated from Jane Waite original https://www.raspberrypi.org/blog/how-can-we-teach-students-about-ai-and-data-science-2025-seminar-series/
AI, machine learning (ML), and data science infuse our daily lives, from the recommendation functionality on music apps to technologies that influence our healthcare, transport, education, defence, and more.
What jobs will be affected by AL, ML, and data science remains to be seen, but it is increasingly clear that students will need to learn something about these topics. There will be new concepts to be taught, new instructional approaches and assessment techniques to be used, new learning activities to be delivered, and we must not neglect the professional development required to help educators master all of this.

As AI and data science are incorporated into school curricula and teaching and learning materials worldwide, we ask: What’s the research basis for these curricula, pedagogy, and resource choices?
In 2024, we showcased researchers who are investigating how AI can be leveraged to support the teaching and learning of programming. But in 2025, we look at what should be taught about AI, ML, and data science in schools and how we should teach this.
Our 2025 seminar speakers — so far!
We are very excited that we have already secured several key researchers in the field.
On 21 January, Shuchi Grover will kick off the seminar series by giving an important overview of AI in the K–12 landscape, including developing both AI literacy and AI ethics. Shuchi will provide concrete examples and recently developed frameworks to give educators practical insights on the topic.
Our second session will focus on a teacher professional development (PD) programme to support the introduction of AI in Upper Bavarian schools. Franz Jetzinger from the Technical University of Munich will summarise the PD programme and share how teachers implemented the topic in their classroom, including the difficulties they encountered.
Again from Germany, Lukas Höper from Paderborn University, with Carsten Schulte will describe important research on data awareness and introduce a framework that is likely to be key for learning about data-driven technology. The pair will talk about the Data Awareness Framework and how it has been used to help learners explore, evaluate, and be empowered in looking at the role of data in everyday applications.
Our April seminar will see David Weintrop from the University of Maryland introduce, with his colleagues, a data science curriculum called API Can Code, aimed at high-school students. The group will highlight the strategies needed for integrating data science learning within students’ lived experiences and fostering authentic engagement.
Later in the year, Jesús Moreno-Leon from the University of Seville will help us consider the thorny but essential question of how we measure AI literacy. Jesús will present an assessment instrument that has been successfully implemented in several research studies involving thousands of primary and secondary education students across Spain, discussing both its strengths and limitations.
What to expect from the seminars
Our seminars are designed to be accessible to anyone interested in the latest research about AI education — whether you’re a teacher, educator, researcher, or simply curious. Each session begins with a presentation from our guest speaker about their latest research findings. We then move into small groups for a short discussion and exchange of ideas before coming back together for a Q&A session with the presenter.

Attendees of our 2024 series told us that they valued that the talks “explore a relevant topic in an informative way“, the “enthusiasm and inspiration”, and particularly the small-group discussions because they “are always filled with interesting and varied ideas and help to spark my own thoughts”.
The seminars usually take place on Zoom on the first Tuesday of each month at 17:00–18:30 GMT / 12:00–13:30 ET / 9:00–10:30 PT / 18:00–19:30 CET.
You can find out more about each seminar and the speakers on our upcoming seminar page. And if you are unable to attend one of our talks, you can watch them from our previous seminar page, where you will also find an archive of all of our previous seminars dating back to 2020.
How to sign up
To attend the seminars, please register here. You will receive an email with the link to join our next Zoom call. Once signed up, you will automatically be notified of upcoming seminars. You can unsubscribe from our seminar notifications at any time.
We hope to see you at a seminar soon!
The post How can we teach students about AI and data science? Join our 2025 seminar series to learn more about the topic appeared first on Raspberry Pi Foundation.