We’re pleased to announce the completion of our annual AWS Outsourced Service Provider’s Audit Report (OSPAR) audit cycle on August 7, 2025, based on the newly enhanced version 2.0 guidelines (OSPAR v2.0). AWS is the first global cloud service provider in Singapore to obtain the report using the new OSPAR v2.0 guidelines.
The Association of Banks in Singapore (ABS) established the Guidelines on Control Objectives and Procedures for Outsourced Service Providers (ABS Guidelines) to provide baseline controls criteria that outsourced service providers (OSPs) operating in Singapore should have in place. ABS enhanced the ABS Guidelines to version 2.0, which OSPs—such as AWS—need to comply with for the audit period commencing on or after January 1, 2025. The enhanced ABS Guidelines integrate key elements from the Monetary Authority of Singapore (MAS) regulatory updates on cyber hygiene, technology risk management, and business continuity management, and include new control domains such as data security, cryptography, software application development and management, and business continuity management.
The 2025 OSPAR certification cycle includes the addition of seven new services in scope, bringing the total number of services in scope to 170 in the AWS Asia Pacific (Singapore) Region. Newly added services in scope include the following:
Successfully completing the OSPAR assessment demonstrates that AWS continues to maintain a robust system of controls to meet these guidelines. This underscores our commitment to fulfill the security expectations for cloud service providers set by the financial services industry in Singapore.Customers can use OSPAR to streamline their due diligence processes, thereby reducing the effort and costs associated with compliance. OSPAR remains a core assurance program for our financial services customers because it is closely aligned with local regulatory requirements from MAS.
As always, we’re committed to bringing new services into the scope of our OSPAR program based on your architectural and regulatory needs. If you have questions about the OSPAR report, contact your AWS account team.
If you have feedback about this post, submit comments in the Comments section below.
The UK Bebras Challenge, the nation’s largest computing competition, is back! Schools can enter now for this year’s Challenge, which runs from 10 to 21 November.
Last year, more than 467,000 students from across the UK took part, tackling fun and thought-provoking puzzles that introduce key ideas in computational thinking with no extra preparation needed.
Read on to learn how your school can get involved.
The UK Bebras Challenge is a free-to-enter annual challenge that is designed to spark interest in both computational thinking and computer science among students aged 6 to 19. The 45-minute challenge is accessible to everyone, offering age-appropriate but challenging interactive tasks for students at different levels, including a tailored version for students with severe sight impairments.
The tasks are designed to give every student the opportunity to showcase their potential and all participating students receive a certificate. There are also certificates based on performance within school and gold certificates based on national boundaries. With self-marking tasks and no text-based programming required, it’s easy to have your school participate in the UK Bebras Challenge.
This year, each task’s background section is linked to the Ada Computer Science platform. Teachers and students can now explore detailed explanations of the computing concepts behind the Bebras tasks, along with the computational thinking skills students may use to solve them.
“Bebras provides us with incredibly useful insights and conversations about our students who might otherwise have struggled with accessing traditional CS materials. It’s also a great resource for baseline tests where students may not have studied the curriculum the way we present it.” – Teacher in the UK
“I think the problems are a really great way to promote critical thinking, computational thinking, and logic in general. I have only seen a couple but I am very impressed and excited to share with some of my students. Thanks for what you are doing.” – Teacher in the UK
What does a UK Bebras task look like?
The tasks are inspired by classic computing problems and presented in a fun, age-appropriate way. For example, younger students aged 6 to 8 might solve the mystery of a dancing doll, while older students aged 16 to 19 could take on the challenge of an art theft. Both of these tasks involve the use of data structures.
Here’s a question we ran in 2021 for the Juniors group (ages 10 to 12). Can you solve it?
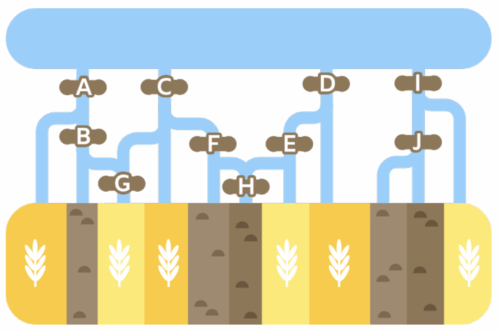
Beaver farmer
Farmer Mert grows wheat in the fields, which contain a symbol in the map below.
He also has stony fields where nothing grows, shown by the symbol.
To save water, Mert only wants to water the wheat fields. He can block the water channels coming from the lake at the spots marked with the letters A to J.
The water will only flow downwards towards the fields and will never flow back towards the lake.
Task
Select the letters to block the water from flowing to the empty fields while still letting it flow to the wheat fields.
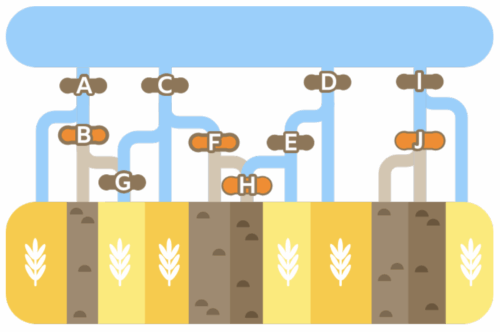
Example answer
The correct answer is that spots labelled B, F, H, and J must be closed, as shown in the following figure:
Explanation
If none of the gates are closed, the water will reach the stony fields. If more gates than shown above are closed, then some wheat fields will get no water. If we review all spots:
A must be open to allow water to flow to field 1.
B has to be closed to avoid watering field 2. It also brings water to field 3, but this field can also get it through C.
C must be open both for field 4 and for field 3, which cannot be watered though A since B is closed.
D must be open for fields 7 and 8.
E must also be open field 7.
F must be closed to prevent water flowing to field 5.
G, if closed, would only prevent field 3 from being watered and so must be open as well.
H must also be closed even if F is also closed, as water can flow from the open D and E.
I must be open for field 11.
J has to be closed to prevent fields 9 and 10 from getting watered.
This Bebras task was developed by the Bebras team in Turkey and refined by members of the international Bebras community.
Did you get it right?
How do I get my school involved?
If you are either a UK school or teach a UK-based curriculum, then visit the UK Bebras website for more information and to register your school.
Once you’ve registered, you’ll get access to the entire UK Bebras back catalogue of questions, allowing you to create custom quizzes for your students to tackle at any time throughout the year. These quizzes are self-marking, and you can download your students’ results to keep track of their progress. The questions are perfect for enrichment activities, end-of-term quizzes, lesson starters, and even full lessons to develop computational thinking skills and promote computing concepts.
A malicious update to @ctrl/tinycolor (2.2M weekly
downloads) was detected on npm as part of a broader supply chain
attack that impacted more than 40 packages spanning multiple
maintainers.
The compromised versions include a function
(NpmModule.updatePackage) that downloads a package
tarball, modifies package.json, injects a local script
(bundle.js), repacks the archive, and republishes it,
enabling automatic trojanization of downstream packages.
Миналата седмица писах за законопроект на ИТН, който цели да вдигне възможната височина на строителство в София на места на 125 метра. Законопроектът е едно изречение и въвежда много странно изключение (на изключението) за имоти по Цариградско шосе. Всъщност, става дума за доста конкретни имоти и така формулирано предложението ме накара да се зачудя кои са те. Именно тях показах в предишната си статия. Както обещах, разгледах и останалите из София, макар там височината да се вдига „само“ с 25%.
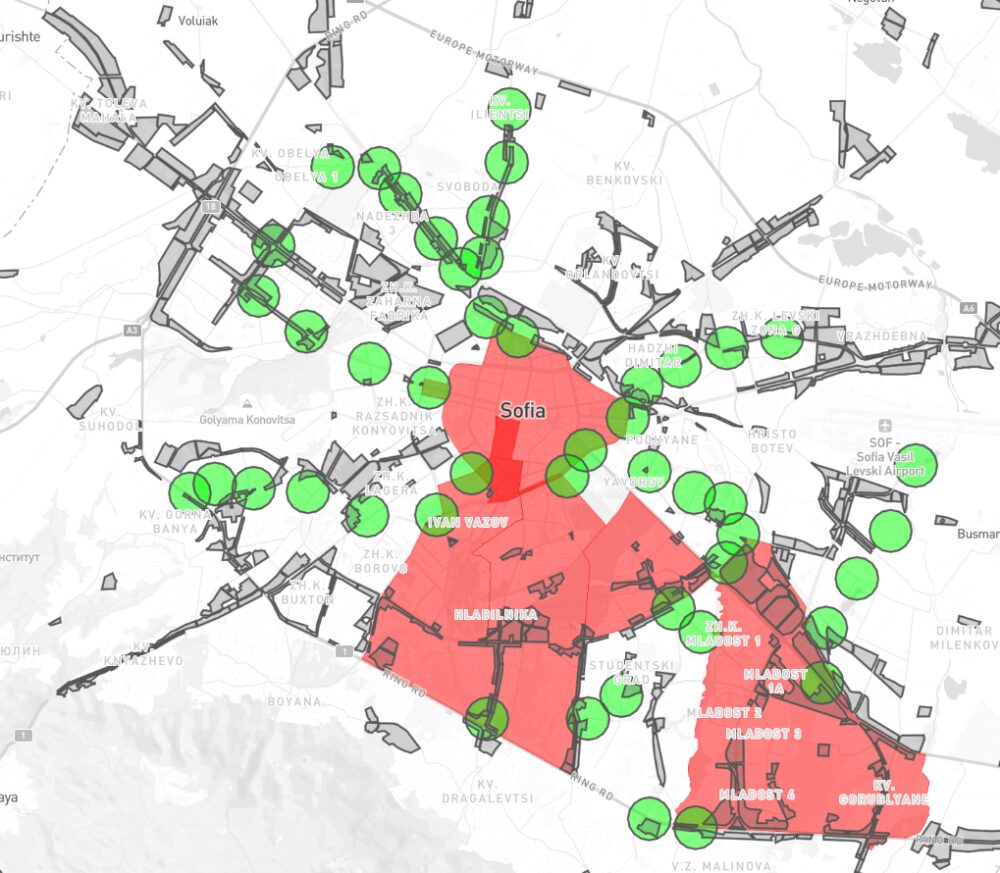
За подробно описание какво предлага предложението на тримата депутати ще намерите в предишната ми статия. Най-общо обаче текстът, който искат да променят сега позволява 100 метра височина в Смф зоните (в сиво) на 400 метра от метростанции (в зелено) изключвайки централната част и четири района (в червено). Тук съм добавил бъдещите метростанции и съм махнал тези изцяло в изключените райони. Те вдигат 100 на 125 и добавят няколко имота в Младост по Цариградско. Ако ви изглежда крайно специфично, това е защото е. Практическата липса на аргументация, това че тримата депутати нямат нищо общо със София и как е формулиран законопроектът ме накара да се разровя.
Първо, ще добавя двете карти, които направих. Те са по подобие на другите ми за държавните имоти за продажба от списъка на Желязков и 3D картата на застрояването на София. Те показват имотите отговарящи на горните критерии, които открих. Изключих общинските и държавните имоти, въпреки че, както се разбра, може да бъдат продадени без много шум. Изключих най-малките под 500 кв. макар би могло да се обединят с други по-големи, за да се застоят високо. Махнах метростанциите, около които няма Смф или не намерих имоти. Остават тези на картата. Възможно е да съм пропуснал някои предвид, че данните за собствеността в КАИС и iSofMap не са непременно актуални все още. Ако натиснете върху парцелите ще намерите последните данни за вид и предназначение според КАИС.
Тази карта показва същите данни, но само с парцелите в обемен вид. В някои от откритите парцели вече има построени сгради и повечето надали ще бъдат съборени, за да се възползва някой от новата височина. Тук виждате състоянието на застрояването до преди две години, тъй като тогава последно е 3D заснемането, което използва. Повече за това тук.
Отделно, размерът на имота и съседните има значение, защото има редица други изисквания като отстояние и разгърната площ. Те могат да се преценят при предложен проект, какъвто сега няма или нямам достъп за всеки от тези имоти. Затова маркирам само онези, които са засегнати по този един параметър обсъждан във внесеното предложение.
Може да отворите двете карти на цял екран тук и тук.
Засегнати райони из цяла София
Първо, в близост до горната част на Цариградско виждаме голям участък, който попада в хипотезата на този законопроект. Тези имоти се намират точно на границата на район Младост. Този най-вляво промени проекта си поне веднъж, а преди месец беше на комисия в НАГ с други предложения. Вдясно виждаме доста отделни сгради и към настоящия момент някои от празните парцели вече са запълнени. Получих дост сигнали за озеленяването там и колко е бутафорно.
Друг интересен парцел е този до районната община в Слатина. Той също попада в описаните критерии и е още на виза за проектиране. Има проект до 75 метра. Над това, както и при другите такива, трябва гласуване в СОС. Спорно е обаче колко има желание да се спират такива проекти, както и дали няма гласуване за подобни сгради да бъде из търгувано за подкрепа за други проекти, в парламента или просто за асансьори. Виждали сме и от трите. Не бих могъл да твърдя такова нещо за конкретния парцел. Давам просто пример за такава възможност след промените. Докато за 8 етажа повече може би не биха се занимавали, за 16 или 50 метра отгоре – биха.
Следващите имоти са малки, но показателни. Един от тях се вижда вече застроен – NV Tower. При нея имаше един интересен казус преди години – осветяваше целия квартал като дискотека нощем. После се оказа, че според отговор на ДНСК артистичното осветление беше незаконно и спряха. Съседният парцел е изцяло жилищна сграда в Смф (уж смесен) имот. Питайте Здравков защо. До тях се виждат няколко частни имота, които са отредени към този момент за многоетажен гараж. Попадат в хипотезата за 125 метра небостъргачи и предвид местоположението изглежда отстоянията им ще достатъчни.
На това кръстовище се вижда метростанцията Г.М. Димитров и това показва ключов проблем с този законопроект. Интересен факт тук е, че сградата отсреща на обсъжданите парцели е построена от инвеститорска компания с едноименна поправка предшестваща и наподобяваща обсъждания законопроект. Живущи в сградата на горни етажи се оплакват отдавна от неприятни вибрации и клатене когато минава метрото. При това говорим са само 50 метрова сграда. Този ефект ще е значително по-голям при по-високо строителство. От това следва, че би трябвало да се намалява етажността, а не да се уличава. Имало е, разбира се, ограничения за т.н. „вибрационна зона“ около метрото, както и изисквания за луфтове и конкретни елементи. За съжаление, според архитекти, доста от тези са отпаднали незнайно как в голяма част от града. Резултатът е видим, както казваше един партиен лозунг.
Продължаваме на юг с незастроени парцели до Студентски парк и Симеоновско шосе. Отново – на границата на районите с ограничения. Някои от тях са застроени, а други се подготвят за това и нямат започната процедура. Тук е полезно да се отбележи скандалната кула, която ще бъде забучена по очертанията на парцела на автокъщата в Студентски парк. Изискванията по ЗУТ и ЗУЗСО са специфично направени, за да са възможни такива опасни неща. А са опасни, защото тази отсечка от пътя е навярно най-опасната в Студентски град. Затова ще бъде отрязано още от парка, за да се направи нов булевард – специално за тази 60 метрова сграда. Очакваме същото за други подобни засегнати от този законопроект, независимо, че вносителите настояват, че промените им не пречат и не засягат никого и няма да има допълнителна тежест или разходи за общината.
Доколкото Черни връх е изключен от списъка, там има други проблеми, включително 215 метровата кула и стената от сгради по горната част от булеварда, някои от които според главния архитект незаконно са настроили етажи, но това е било прието от Здравков и ДНСК. Има обаче няколко парцела от другата страна, където сега има складове и един магазин Фантастико. Някой ден някой може да реши да инвестира там и тази промяна ги засяга.
На запад из Овча купел има няколко парцела, но ще обърна внимание на тези по булевард Цар Борис. Някои са застроени, а други – не. Това ще стане възможно с планираните спирки на метрото стигащи Южната дъга.
В северната част на София има доста имоти, особено до Надежда в индустриалните части. Правят впечатление обаче имотите до и зад гарата. Особени тези от северната част на линията. Там вече има застроени масивни комплекси, но ще има още много. Отстоянията няма да са им проблем и отново ще могат да стигнат 125 метра с малко машинации в СОС.
Новото метро донася този проблем този проблем и в квартал Левски. Някои от отбелязаните парцели са вече застроени, други не са и дори нямат виза за проектиране.
Какво следва?
Утре, 17-ти септември ще има обсъждане на законопроектът в комисия в парламента. Един от вносителите в заместник председател на ИТН в тази комисия. С липсата на аргументи на този проект не виждам как може да мине. В сегашната политическа среда и изтъргуване на лобистки поправки срещу подкрепа за други гласувания – като вето на недоверие – не изключвам да мине през гласуването доста бързо и необезпокоявано.
Ще следим какво ще се случи на комисията утре. Би трябвало да се излъчва на живо и ще разберем дали ще бъдат изнесени някакви аргументи и обяснена липсата на такива към законопроекта или ще бъде задушена всякаква дискусия и критика по темата.
Security updates have been issued by AlmaLinux (kernel and kernel-rt), Debian (node-sha.js and python-django), Fedora (chromium, cups, exiv2, perl-Catalyst-Authentication-Credential-HTTP, perl-Catalyst-Plugin-Session, perl-Plack-Middleware-Session, and qemu), Red Hat (container-tools:rhel8, podman, and udisks2), SUSE (cargo-audit, cargo-c, cargo-packaging, and kernel-devel), and Ubuntu (libcpanel-json-xs-perl, libjson-xs-perl, rubygems, sqlite3, and vim).
Senator Ron Wyden has asked the Federal Trade Commission to investigate Microsoft over its continued use of the RC4 encryption algorithm. The letter talks about a hacker technique called Kerberoasting, that exploits the Kerberos authentication system.
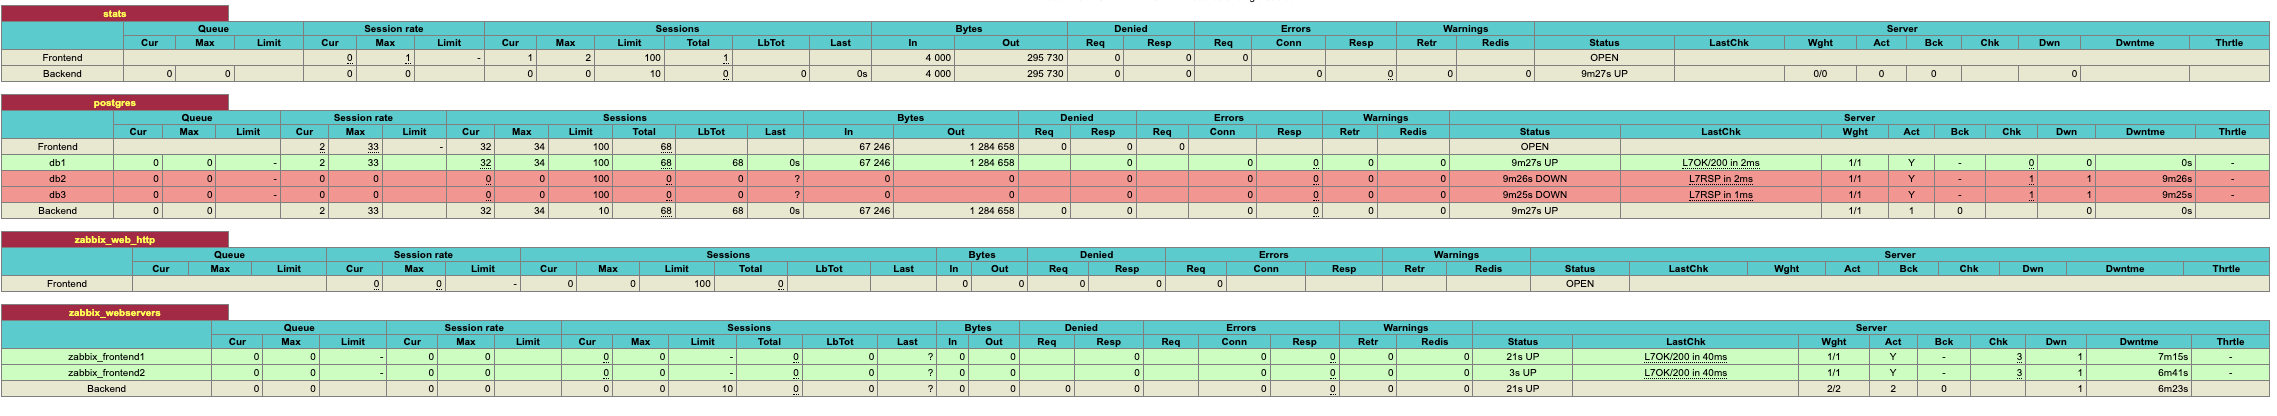
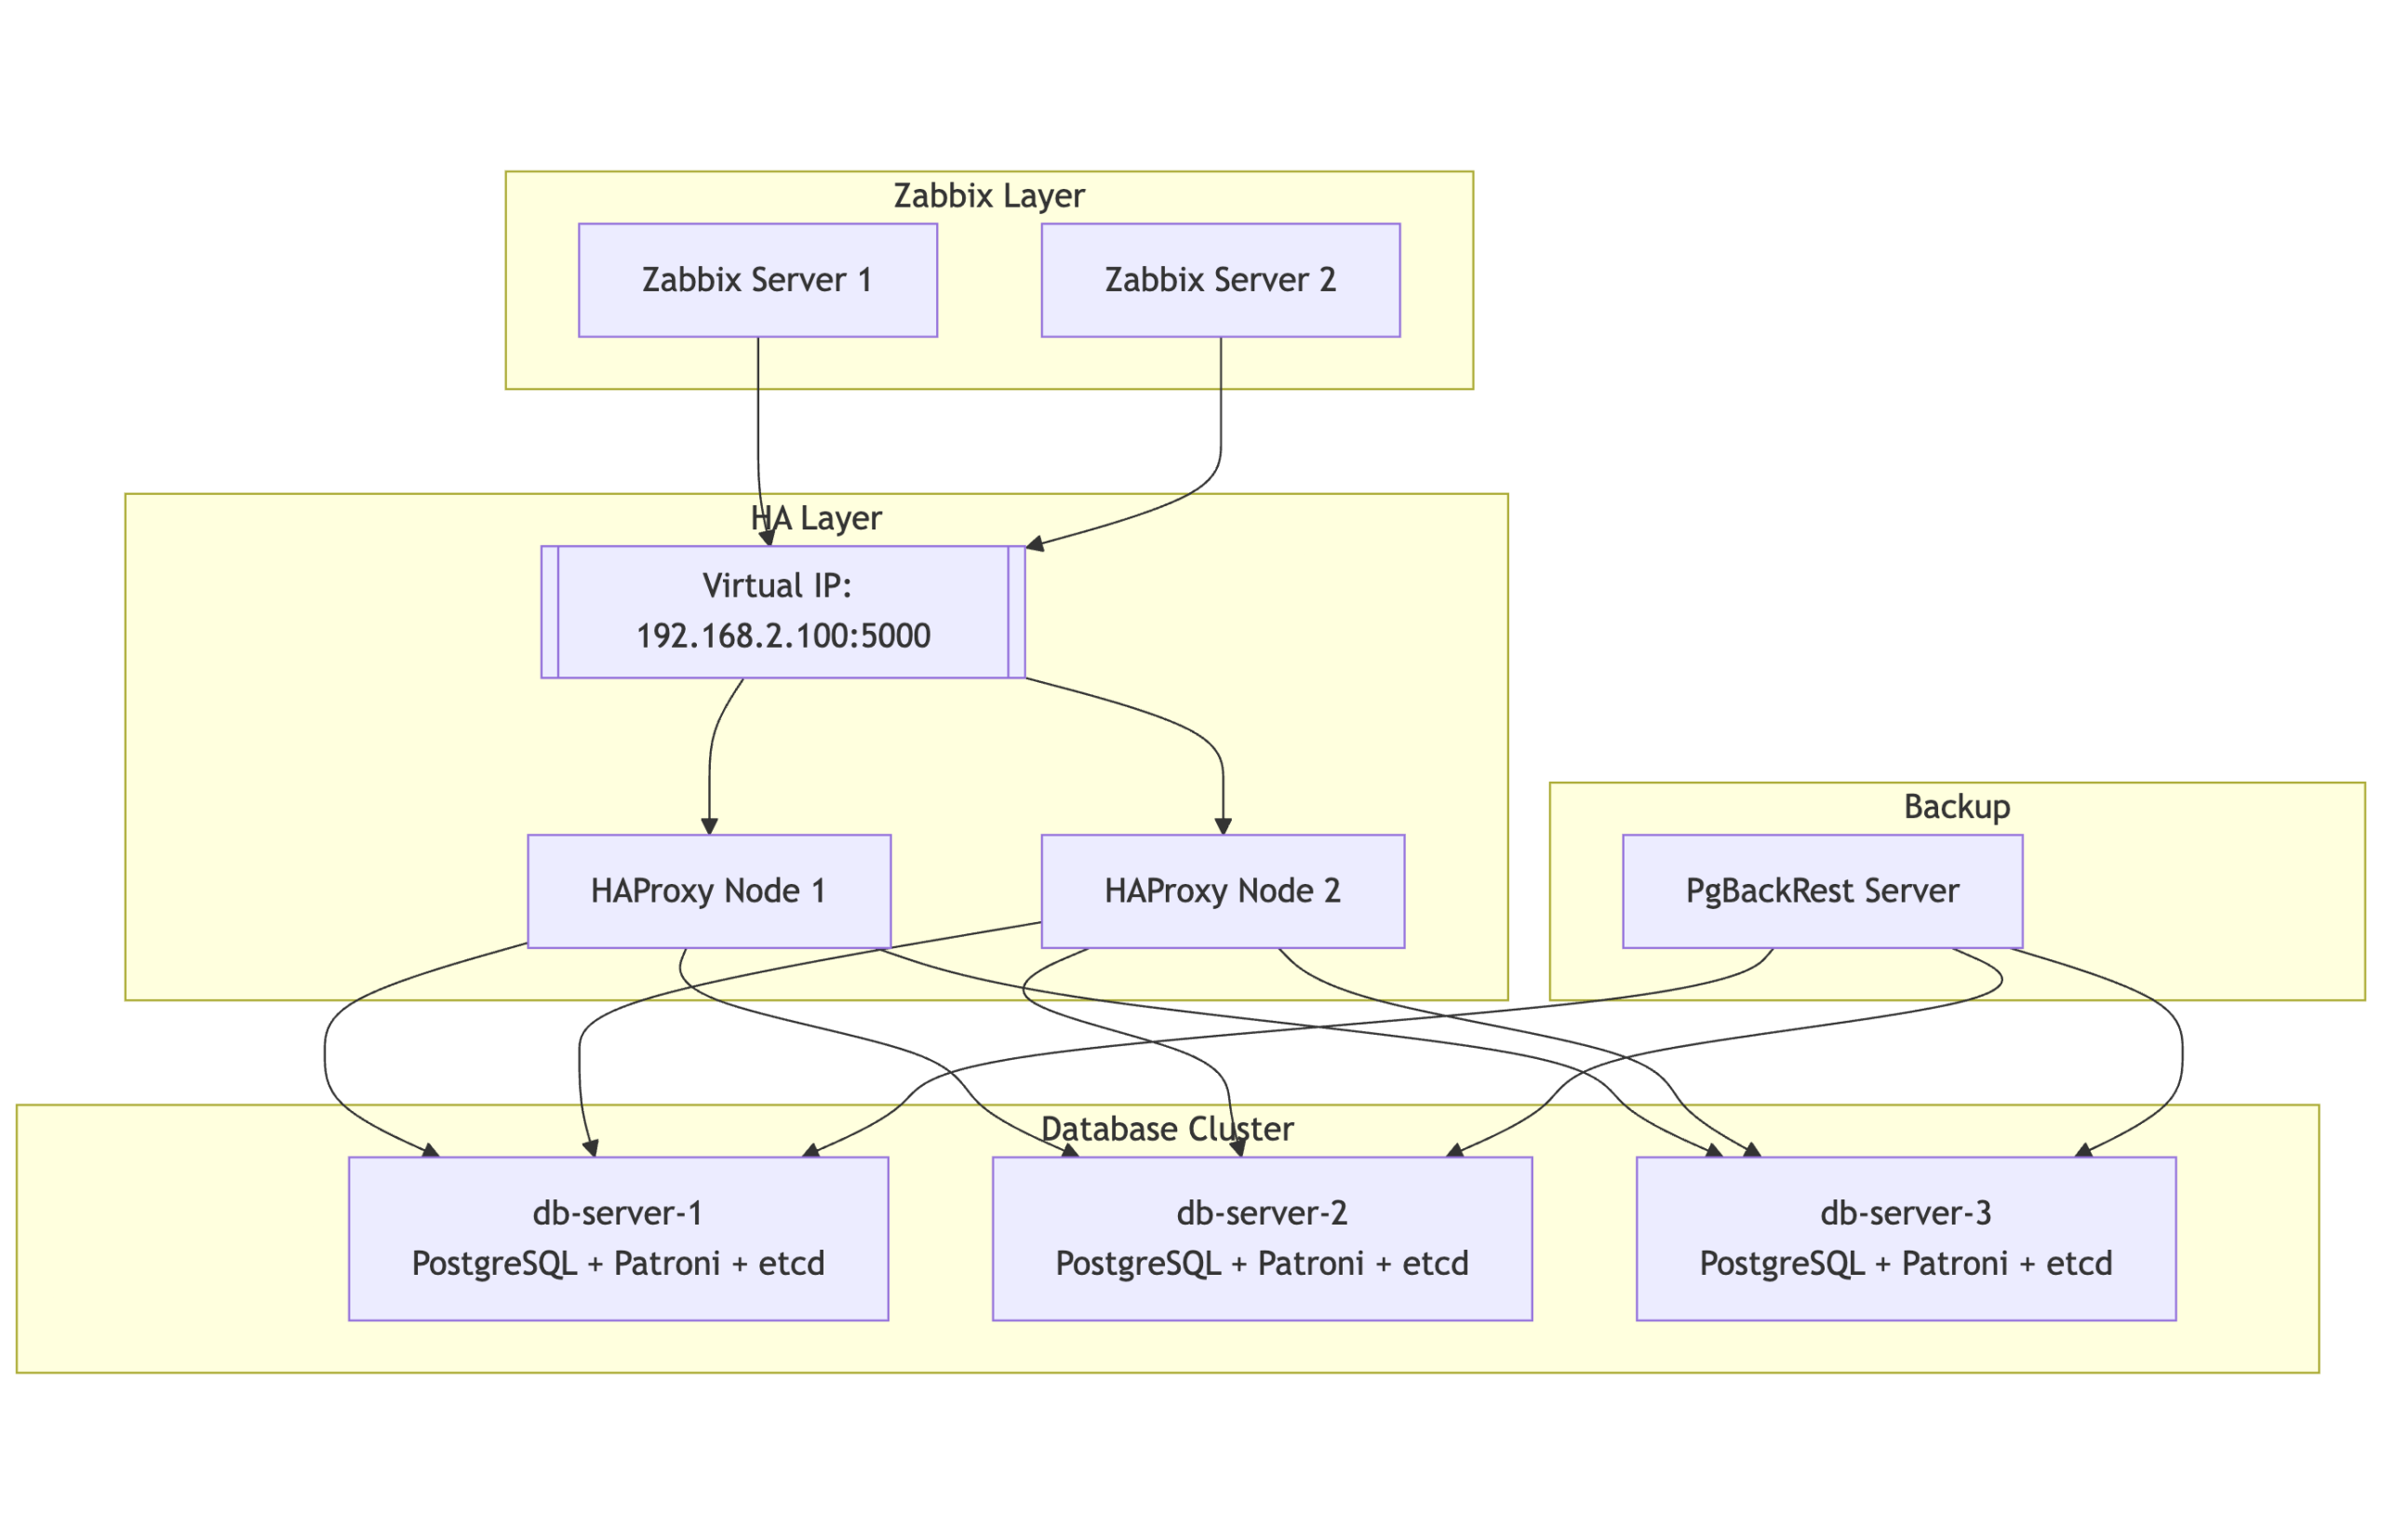
Running a monitoring platform like Zabbix in a production environment demands reliability and resilience. When your monitoring solution is down, you’re flying blind – and for many organizations, that simply isn’t acceptable. This post introduces a robust high-availability (HA) architecture for Zabbix, using PostgreSQL, Patroni, etcd, HAProxy, keepalived and PgBackRest. Built on RHEL 9 or derrivates, this solution combines modern open-source tools to provide automatic failover, load balancing, and seamless monitoring, all while maintaining consistency and performance.
Architecture overview
The HA design consists of multiple layers working in tandem to maintain continuity even during node or service failures:
Database Cluster Layer
2 or more nodes form the PostgreSQL cluster, managed by Patroni and coordinated using etcd. At any given time, one node is the primary (read/write), and the others are hot standbys ready to take over automatically.
Consensus layer
etcd runs on the same nodes and acts as the distributed configuration store and coordination layer for Patroni. It ensures a consistent cluster state and enables safe failover decisions.
Load balancing layer
Two HAProxy nodes provide a single point of entry for all clients (including Zabbix), routing requests to the current PostgreSQL primary. These nodes are monitored and coordinated via Keepalived to maintain a floating Virtual IP (VIP), ensuring seamless failover at the connection layer.
Backup layer
A separate backup server is responsible for running PgBackRest, which handles full and incremental backups, WAL archiving, and Point-In-Time Recovery (PITR). This server communicates securely with all database nodes over SSH.
Monitoring layer
Two Zabbix servers, running in active-passive mode, continuously monitor all layers of this stack including the HAProxy health, Patroni cluster role, and etcd status by accessing the PostgreSQL VIP for backend connectivity.
This multi-tiered setup ensures that no single failure be it a database, load balancer, or monitoring server brings down the monitoring platform.
Why HA matters for Zabbix
Zabbix depends heavily on its PostgreSQL database backend. Every metric, trigger, event, and alert is stored there. If PostgreSQL becomes unavailable, even briefly, data loss or monitoring blind spots can occur. That’s why introducing HA at the database layer is a crucial step when scaling Zabbix for enterprise environments.
While Zabbix itself supports HA at the application level, this architecture ensures that the database backend is also fully fault-tolerant, using modern consensus-based clustering with automatic failover.
Component overview
To achieve HA, we bring together several specialized components, each fulfilling a critical role in the system:
PostgreSQL
The relational database engine used by Zabbix. In this example setup, it runs on three nodes, forming a cluster managed by Patroni.
Patroni
Patroni is the orchestrator for the PostgreSQL cluster. It monitors node health, manages replication, promotes standbys when needed, and ensures only one writable leader exists at any time. Patroni leverages a distributed consensus store in this case, etcd but other DCS’s are possible to coordinate decisions across the cluster.
etcd
etcd is a lightweight and highly available key-value store used by Patroni to maintain the cluster’s state. It stores leader election data, health statuses, and locks. We deploy it as a three-node cluster, co-located with the PostgreSQL nodes for convenience, though this setup can be scaled independently if needed as etcd is very latency prone.
HAProxy
To simplify application connectivity, HAProxy acts as a load balancer in front of the database cluster. It monitors the role of each node using Patroni’s REST API and routes connections to the active primary server. If the leader fails, HAProxy automatically reroutes traffic to the new primary.
Keepalived
Keepalived provides a floating virtual IP address (VIP) across the HAProxy nodes. This VIP allows client systems, such as the Zabbix frontend, to connect to a single stable IP even if one HAProxy node fails.
PgBackRest
To protect the data itself, we use PgBackRest for full and incremental backups, as well as Point-In-Time Recovery (PITR). A dedicated backup server is included to pull and store archive logs and backups securely via SSH.
Zabbix server
Finally, we run two Zabbix servers in active-passive mode. Both are configured to connect to the PostgreSQL cluster through the VIP exposed by HAProxy. The Zabbix frontend is deployed on both nodes as well, ensuring continued accessibility through the load-balanced setup.
Topology at a glance
Here’s a simplified view of the architecture:
2 or more database nodes (PostgreSQL + Patroni + etcd)
Two HAProxy nodes, each configured with Keepalived to manage a floating virtual IP
One backup node for PgBackRest
Two Zabbix servers pointing to the PostgreSQL VIP
All systems are tied together with consistent hostname mappings, time synchronization (Chrony), and service monitoring.
Notes:
PgBackRest is directly connected to all three PostgreSQL nodes, allowing it to archive WAL segments and pull backups regardless of which node is primary.
This design enables full standby backups and supports Point-In-Time Recovery (PITR).
HAProxy ensures Zabbix always talks to the current primary node, while Patroni and etcd handle automatic failover and cluster state management.
Design rationale
This setup prioritizes resilience and self-healing. If any single component fails a database node, a load balancer, or even a monitoring server the system continues to function.
Using Patroni with etcd ensures that failovers are handled automatically, without human intervention. HAProxy ensures client traffic is always routed to the current primary, while Keepalived ensures that this routing layer itself is highly available.
We opted for PgBackRest over simple scripts or base backups because it provides not just efficient incremental backups, but also full WAL archiving and point-in-time recovery, which are invaluable for both disaster recovery and debugging.
Lastly, we chose to integrate Zabbix itself into this HA design, treating it not just as a application but as a fully resilient service able to monitor itself, so to speak.
Real-world considerations
Resource planning: While our nodes run comfortably, scaling this setup to heavy workloads requires careful tuning of memory, I/O, and PostgreSQL parameters.
etcd placement: Although we run etcd co-located with the database nodes in this example, separating etcd onto dedicated infrastructure is ideal for large-scale environments. This avoids resource contention and preserves quorum in extreme failure scenarios.
Monitoring the monitors: Zabbix itself must be monitored. In our setup, each component including etcd, Patroni, and PostgreSQL exposes health endpoints that can be used by Zabbix agents or scripts to generate alerts on replication lag, cluster health, and failover events.
Conclusion
This architecture provides a solid foundation for running Zabbix in a fault-tolerant, production-ready environment. It not only ensures high availability for the database layer but also offers flexibility, observability, and operational safety.
Whether you’re running internal infrastructure monitoring or offering Zabbix as a managed service, adopting this type of HA setup removes single points of failure and gives you peace of mind — all using open-source technologies that are battle-tested and widely supported.
If you need assistance with the migration or want to ensure best practices for scaling and optimizing Zabbix, don’t hesitate to reach out to OICTS. We are a Zabbix Premium Partner operating globally, with offices in the USA, UK, Netherlands, and Belgium, and we’re ready to help you every step of the way.
At Grab, our engineering teams rely on a massive Go monorepo that serves as the backbone for a large portion of our backend services. This repository has been our development foundation for over a decade, but age brought complexity, and size brought sluggishness. What was once a source of unified code became a bottleneck that was slowing down our developers and straining our infrastructure.
A primer on GitLab, Gitaly, and replication
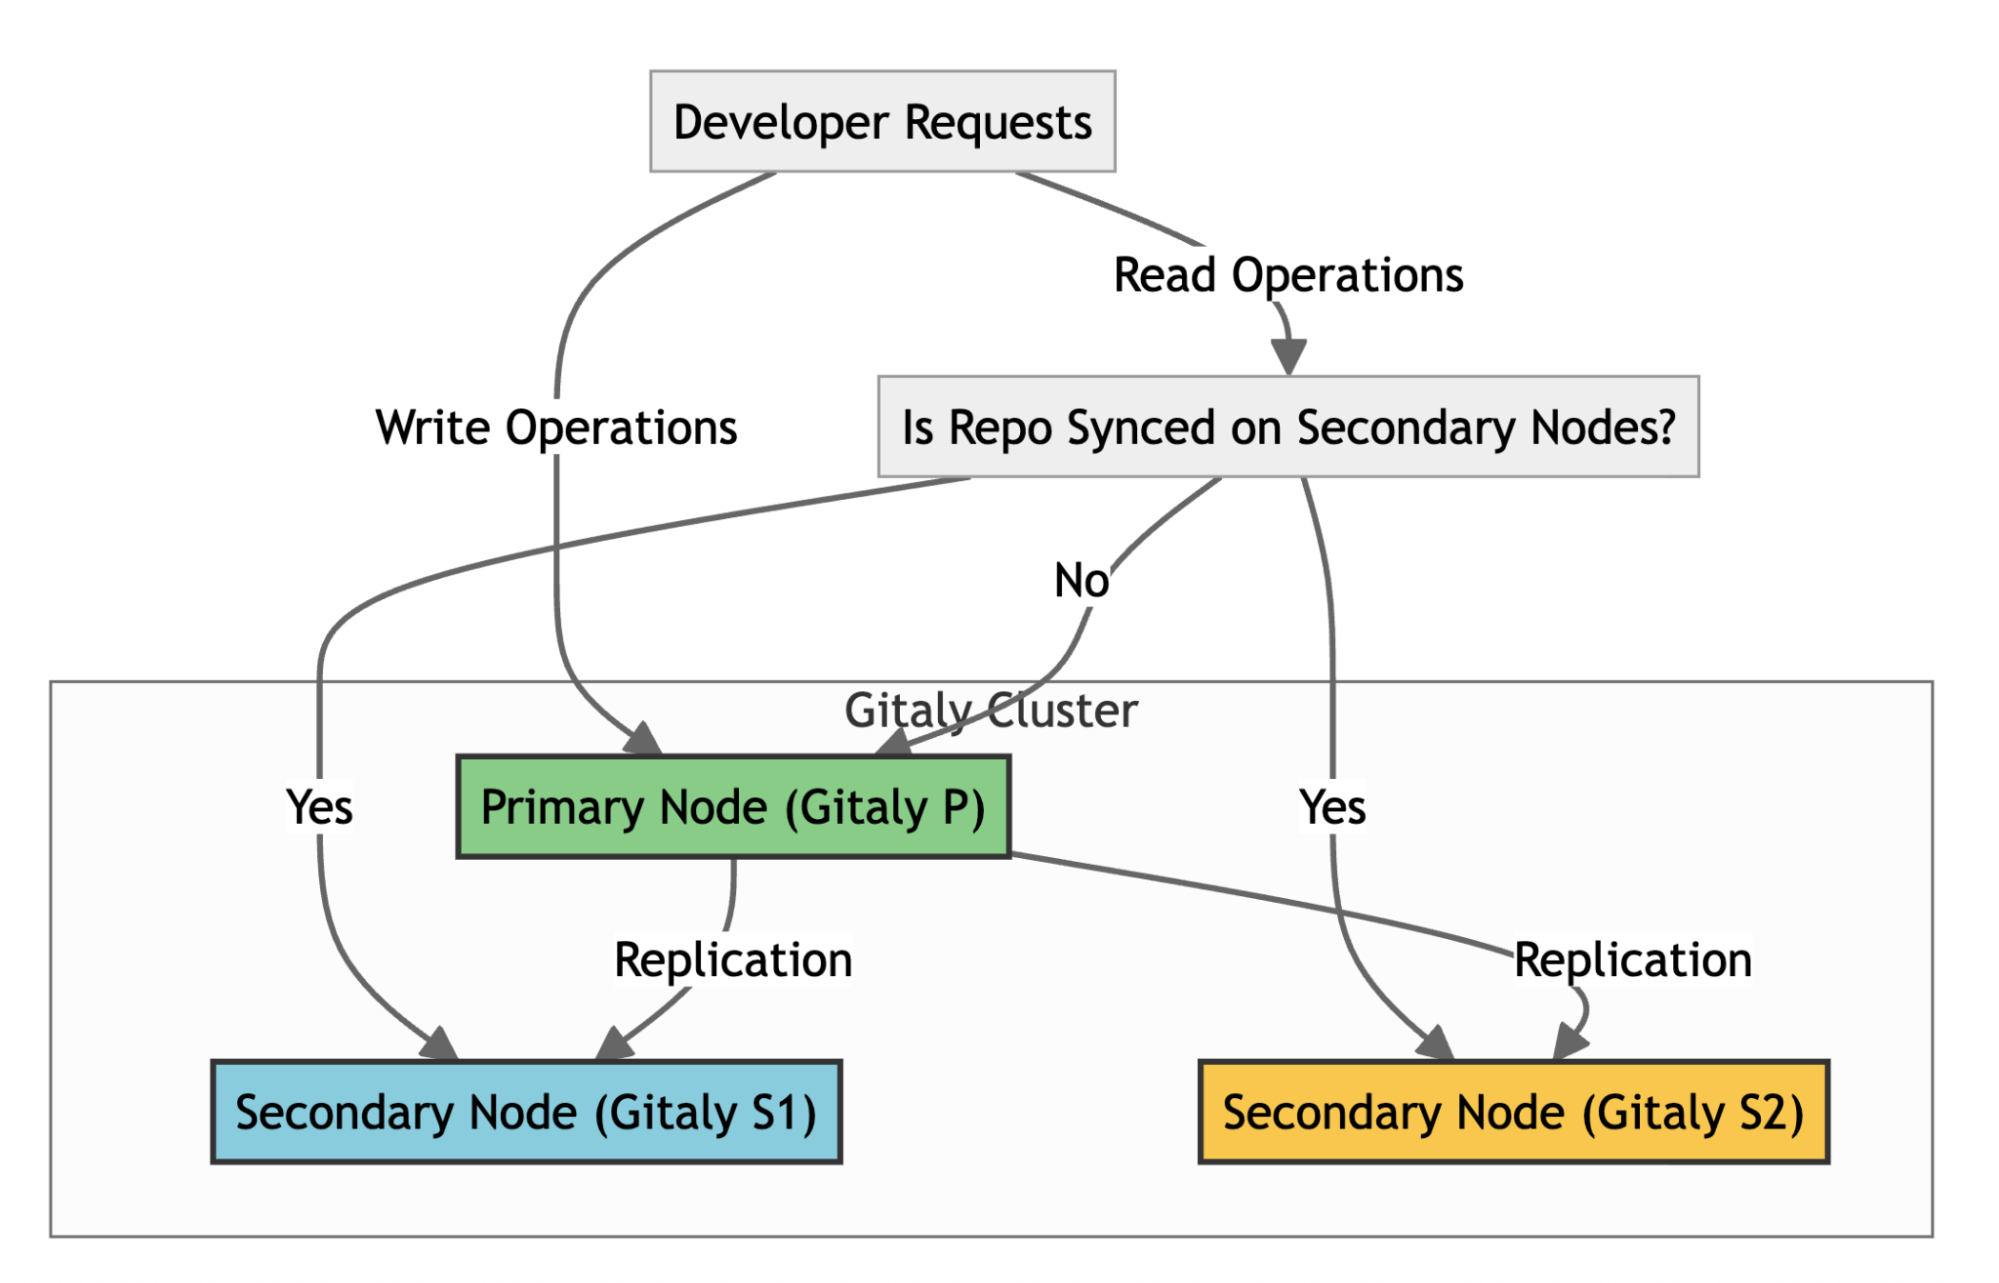
To understand our core problem, it’s helpful to know how GitLab handles repositories at scale. GitLab uses Gitaly, its Git RPC service, to manage all Git operations. In a high-availability setup like ours, we use a Gitaly Cluster with multiple nodes.
Here’s how it works:
Write operations: A primary Gitaly node handles all write operations.
Replication: Data is replicated to secondary nodes.
Read operations: Secondary nodes handle read operations, such as clones and fetches, effectively distributing the load across the cluster.
Failover: If the primary node fails, a secondary node can take over.
For the system to function effectively, replication must be nearly instantaneous. When secondary nodes experience significant delays syncing with the primary—a condition called replication lag—GitLab stops routing read requests to the secondary nodes to ensure data consistency. This forces all traffic back to the primary node, eliminating the benefits of our distributed setup. Figure 1 illustrates the replication architecture of Gitaly nodes.
Figure 1: The replication architecture of Gitaly nodes in a high-availability setup.
The scale of our problem
Our Go monorepo started as a simple repository 11 years ago but ballooned as Grab grew. A Git analysis using the git-sizer utility in early 2025 revealed the shocking scale:
12.7 million commits accumulated over a decade.
22.1 million Git trees consuming 73GB of metadata.
5.16 million blob objects totaling 176GB.
12 million references, mostly leftovers from automated processes.
429,000 commits deep on some branches.
444,000 files in the latest checkout.
This massive size wasn’t just a number—it was crippling our daily operations.
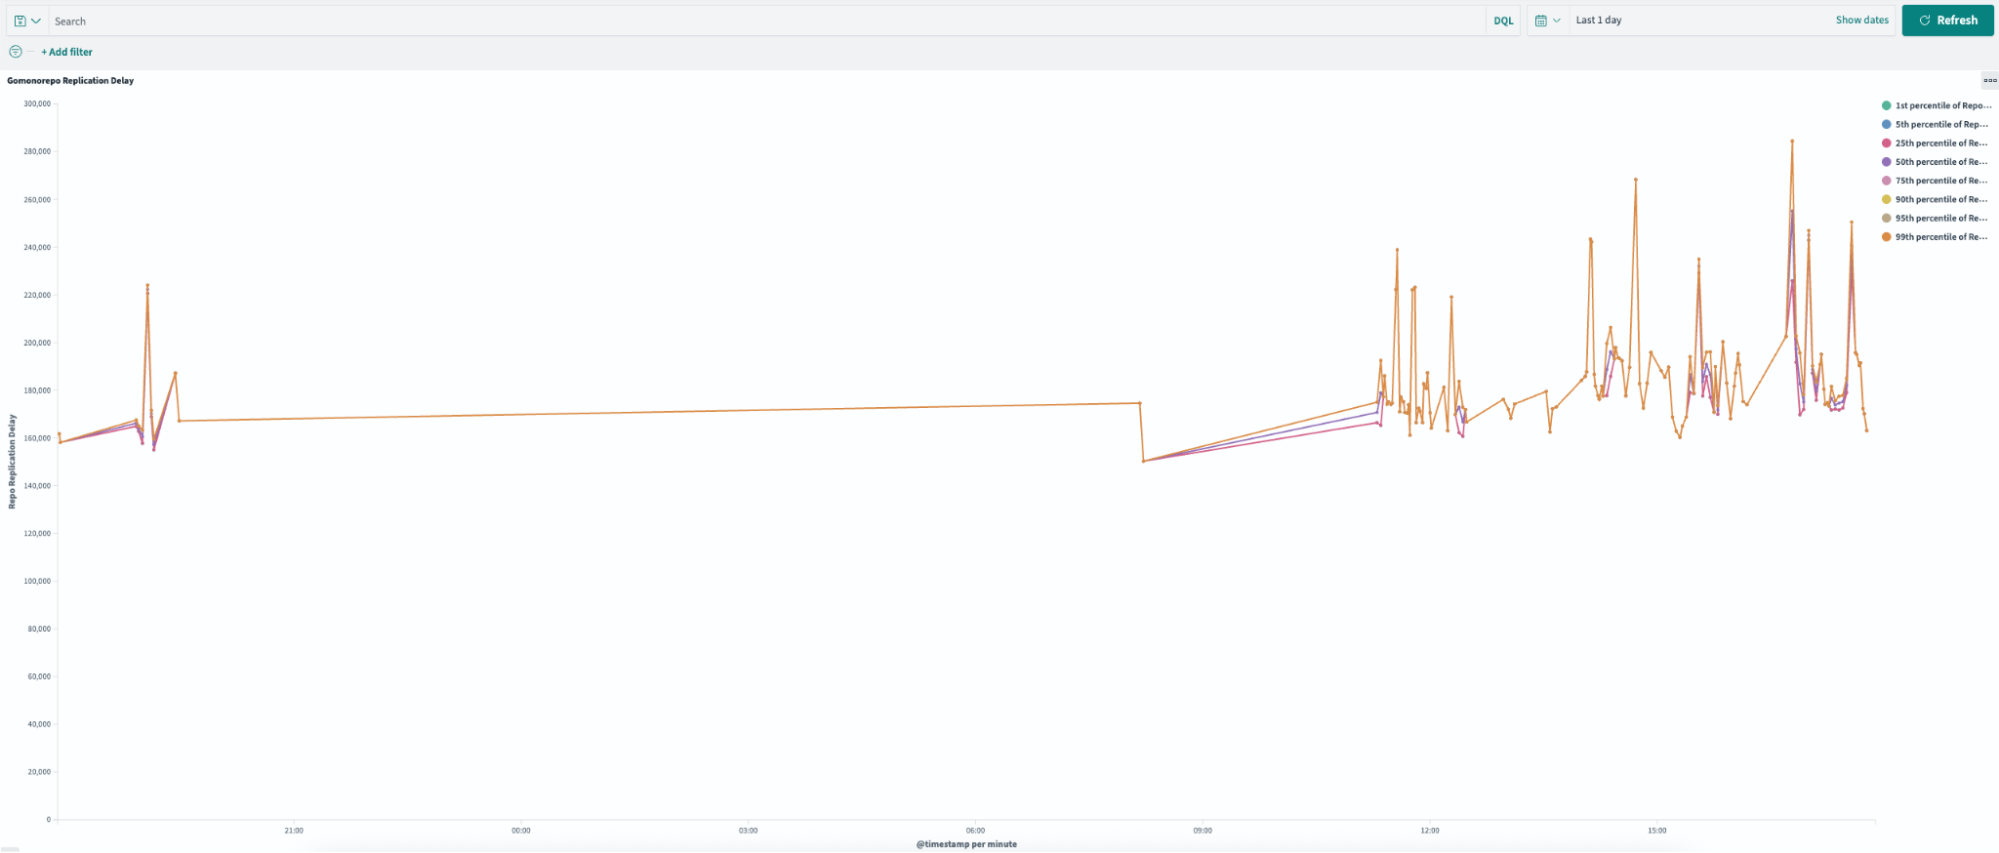
Infrastructure problems
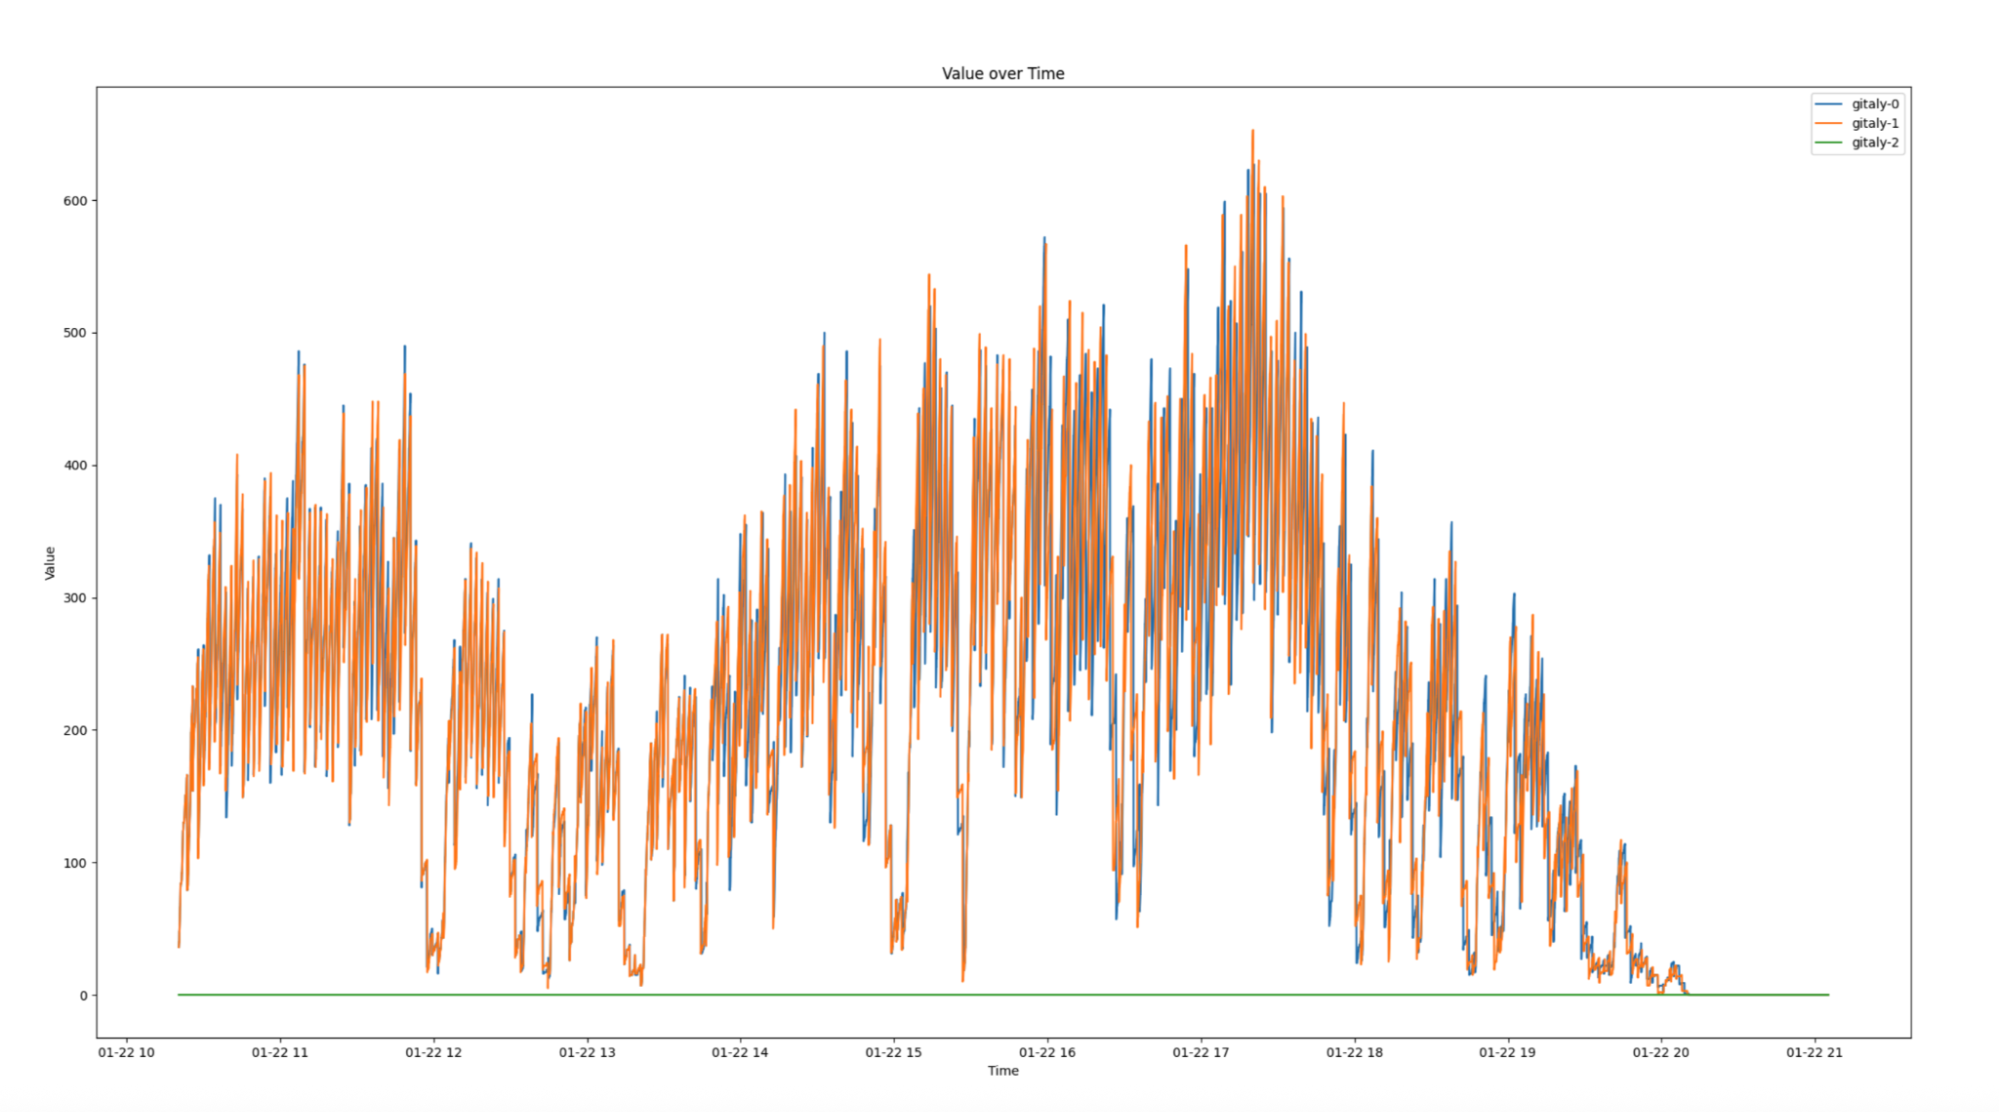
Figure 2: Replication delays of up to four minutes during peak working hours.
In high-availability setups, replication is critical for distributing workloads and ensuring system reliability. However, when replication delays occur, they can severely impact infrastructure performance and create bottlenecks. Figure 2 illustrates replication delays of up to four minutes which caused both secondary nodes, Gitaly S1 (orange) and Gitaly S2 (blue), to lag behind the primary node, Gitaly P (green). As a result, all requests were routed exclusively to the primary node, creating significant performance challenges.
The key issues here are:
Single point of failure: Only one of our three Gitaly nodes could handle the load, creating a bottleneck.
Throttled throughput: The system limits the read capacity to just one-third of the cluster’s potential.
Developer experience issues
The growing size of the monorepo directly impacted developer workflows:
Slow clones: 8+ minutes even on fast networks.
Painful Git operations: Every commit, diff, and blame had to process millions of objects.
CI pipeline overhead: Repository cloning added up 5-8 minutes to every CI job.
Frustrated developers: “Why is this repo so slow?” became a common question.
Operational challenges
The repository’s scale introduced significant operational hurdles:
Storage issues: 250GB of Git data made backups and maintenance cumbersome.
GitLab UI timeouts: The web interface struggled to handle millions of commits and refs, frequently timing out.
Limited CI scalability: Adding more CI runners overloaded the single working node.
All these factors were dragging down developer productivity. It was clear that continuing to let the monorepo grow unchecked wasn’t sustainable. We needed to make the repository leaner and faster, without losing the important history that teams relied on.
Our solution journey
Proof of concept: Validating the theory
Before making any changes, we needed to answer a critical question: “Would trimming repository history solve our replication issues?” Without proof, committing to such a major change felt risky. So we set out to test the idea.
The test setup:
We designed a simple experiment. In our staging environment, we created two repositories:
Full history repository: This repository mirrored the original repository with full history.
Shallow history repository: This repository contained only a single commit history.
Both repositories contained the same number of files and directories. We then simulated production-like load on both of the repositories.
The results:
Full history repository: 160-240 seconds replication delay.
Shallow history repository: 1-2.5 seconds replication delay.
This was nearly a 100x improvement in replication performance.
This proof of concept gave us confidence that history trimming was the right approach and provided baseline performance expectations.
Content preservation strategies: What to keep
Initial strategy: Time-based approach (1-2 years)
Initially, we wanted to keep commits from the last 1-2 years and archive everything else, as this seemed like a reasonable balance between recent history and size reduction. However, when we developed our custom migration script, we discovered it could only process 100 commits per hour, approximately 2,400 commits per day. With millions of commits in the original repository, even keeping 1-2 years of history would take months.
We can only process ~100 commits per hour in batches of 20 to avoid memory limits on GitLab runners.
Each batch takes 2 minutes to process, but requires 10 minutes of cleanup (git gc, git reflog expire) to prevent local disk and memory exhaustion.
This means each batch takes 12 minutes, allowing only 5 batches per hour (60 ÷ 12 = 5), totaling to 100 commits per hour (5 × 20 = 100).
Larger batches increased cleanup time and skipping cleanup caused jobs to crash after 200-300 commits.
The bottleneck wasn’t just the number of commits, it was the 10-minute cleanup process.
Additional constraints discovered:
As we dug deeper, we discovered more obstacles.
Critical dependencies extended beyond two years. Some Go module tags from six years ago were still actively used.
A pure time-based cut would break existing build pipelines.
Development teams needed some recent history for troubleshooting and daily operations.
Revised strategy: Tag-based + recent history
Given the processing speed constraint of 100 commits per hour, we needed to drastically reduce the number of commits while preserving essential functionality. After careful evaluation, we settled on a tag-based approach combined with recent history.
What we decided to keep:
Critical tags: All commits reachable by 2,000+ identified tags, ensuring semantic importance for releases and dependencies.
Recent history: Complete commit history for the last month only addressing stakeholder needs within processing constraints.
Simplified merge commits: Converted complex merge commits into single commits to further reduce processing time.
Why this approach worked:
Time-feasible: Reduced processing time from months to weeks.
Functionally complete: Preserved all tagged releases and recent development context.
Stakeholder satisfaction: Met development teams’ need for recent history.
Massive size reduction: Achieved 99.9% fewer commits while keeping what matters.
The trade-off:
We sacrificed deep historical browsing of 1 to 2 years for practical migration feasibility, while ensuring no critical functionality was lost.
The approach: Use Git’s filter-repo tool with git replace --graft to remove commits older than a specified criteria.
Why it failed:
Complex history: Our repository’s highly non-linear history, with multiple branches and merges, made this approach impractical.
Workflow complexity: The process required numerous git replace --graft commands to account for various branches and dependencies, significantly complicating the workflow.
Risk of inconsistencies: The complexity introduced a high risk of errors and inconsistencies, making this method unsuitable.
History integrity: Resulted in linear sequence instead of preserving original merge structure.
Missing commits: Important merge commits were lost or incorrectly applied.
Method 4: Custom migration script (Success!)
The breakthrough: A sophisticated custom script that could handle our specific requirements and processing constraints. Unlike traditional Git history rewriting tools, our script implements a two-phase chronological processing approach that efficiently handles large-scale repositories.
Phase 1: Bulk migration
In this phase, the script focuses on reconstructing history based on critical tags.
Fetch tags chronologically: Retrieve all tags in the order they were created.
Pre-fetch Large File Storage (LFS) objects: Collect LFS objects for tag-related commits before processing.
Batch processing: Process tags in batches of 20 to optimize memory and network usage. For each tag:
Check for associated LFS objects.
Perform selective LFS fetch if required.
Create a new commit using the original tree hash and metadata.
Embed the original commit hash in the commit message for traceability.
Gracefully handle LFS checkout failures.
Then, push the processed batch of 20 commits to the destination repository, with LFS tolerance.
Cleanup and continue: Perform cleanup operations after each batch and proceed to the next.
Phase 2: Delta migration
This phase integrates recent commits after the cutoff date.
Fetch recent commits: Retrieve all commits created after the cutoff date in chronological order.
Batch processing: Process commits in batches of 20 for efficiency. For each commit:
Check for associated LFS objects.
Perform selective LFS fetch if required.
Recreate the commit with its original metadata.
Embed the original commit hash for resumption tracking in case of interruptions.
Gracefully handle LFS checkout failures.
Then, push the processed batch of commits to the destination repository, with LFS tolerance.
Tag mapping: Map tags to their corresponding new commit hashes.
Push tags: Push related tags pointing to the correct new commits.
Final validation: Validate all LFS objects to ensure completeness.
LFS handling
The script incorporates robust mechanisms to handle Git LFS efficiently.
Configure LFS for incomplete pushes.
Skip LFS download errors when possible.
Retry checkout with LFS smudge skip.
Perform selective LFS object fetching.
Gracefully degrade processing for missing LFS objects.
Key features:
Sequential processing of tags and commits in chronological order.
Resumable operations that could restart from the last processed item if interrupted.
Batch processing to manage memory and network resources efficiently.
Robust error handling for network issues and Git complications.
Maintains repository integrity while simplifying complex merge structures.
Optimized for our specific preservation strategy (tags + recent history).
Implementation: Executing the migration
With our strategy defined (tags + last month), we executed the migration using our custom script. This process involved careful planning, smart processing techniques, and overcoming technical challenges.
Smart processing approach
Our custom script employed several key strategies to ensure efficient and reliable migration:
Sequential tag processing: Replay tags chronologically to maintain logical history.
Resumable operations: The migration could restart from the last processed item if interrupted.
Batch processing: Handle items in manageable groups to prevent resource exhaustion.
Progress tracking: Monitor processing rate and estimated completion time.
Technical challenges solved
The migration addressed several critical technical hurdles.
Large file support: Handled Git LFS objects with incomplete push allowances.
Error handling: Robust retry logic for network issues and Git errors.
Merge commit simplification: Converted complex merge structures to linear commits.
Two-phase migration strategy
The migration was executed in two carefully planned phases.
Phase 1 – Bulk migration: Migrated 95% of tags while keeping the old repo live.
Phase 2 – Delta migration: Performed final synchronization during a maintenance window to migrate recent changes.
Results and impact
Infrastructure transformation
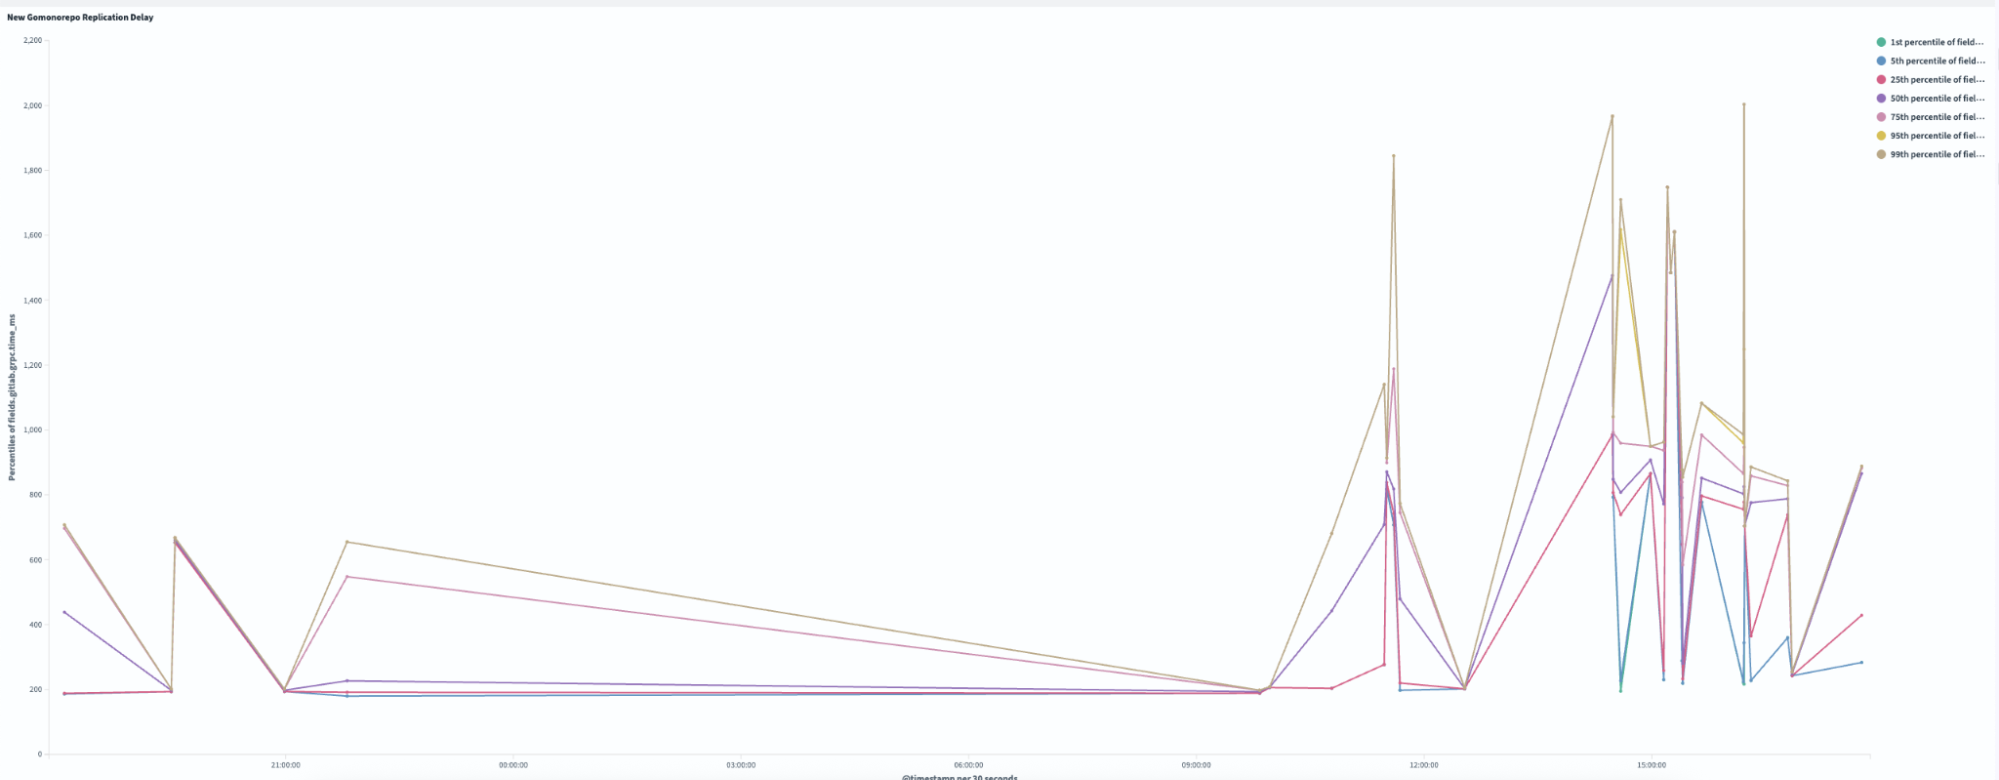
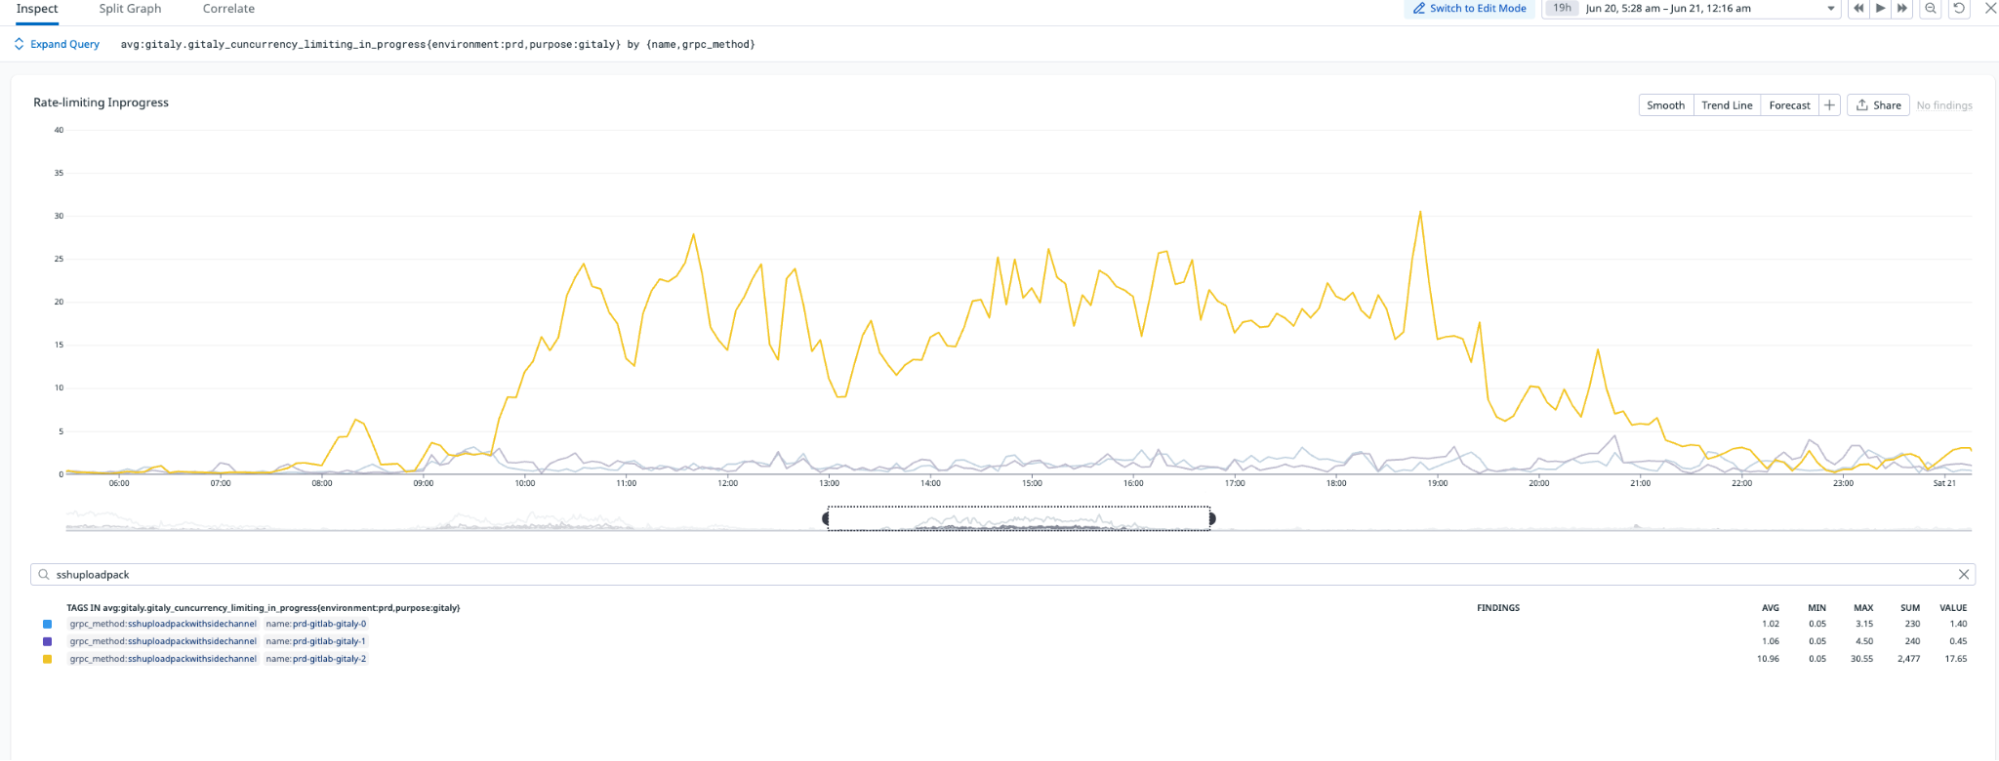
Replication delay, or the time required to sync across all Gitaly nodes, improved by 99.4% following the pruning process. As illustrated in Figures 3 and 4, the new pruned monorepo achieves replication in under ~1.5 seconds on average, compared to ~240 seconds for the old repository. This transformation eliminated the previous single-node bottleneck, enabling read requests to be distributed evenly across all three storage nodes, significantly enhancing system reliability and performance.
Figure 3: In the new pruned monorepo, replication delay ranges from 200 – 2,000 ms.
Figure 4: In the old monorepo, replication delay ranged from 16,000 – 28,000 ms.
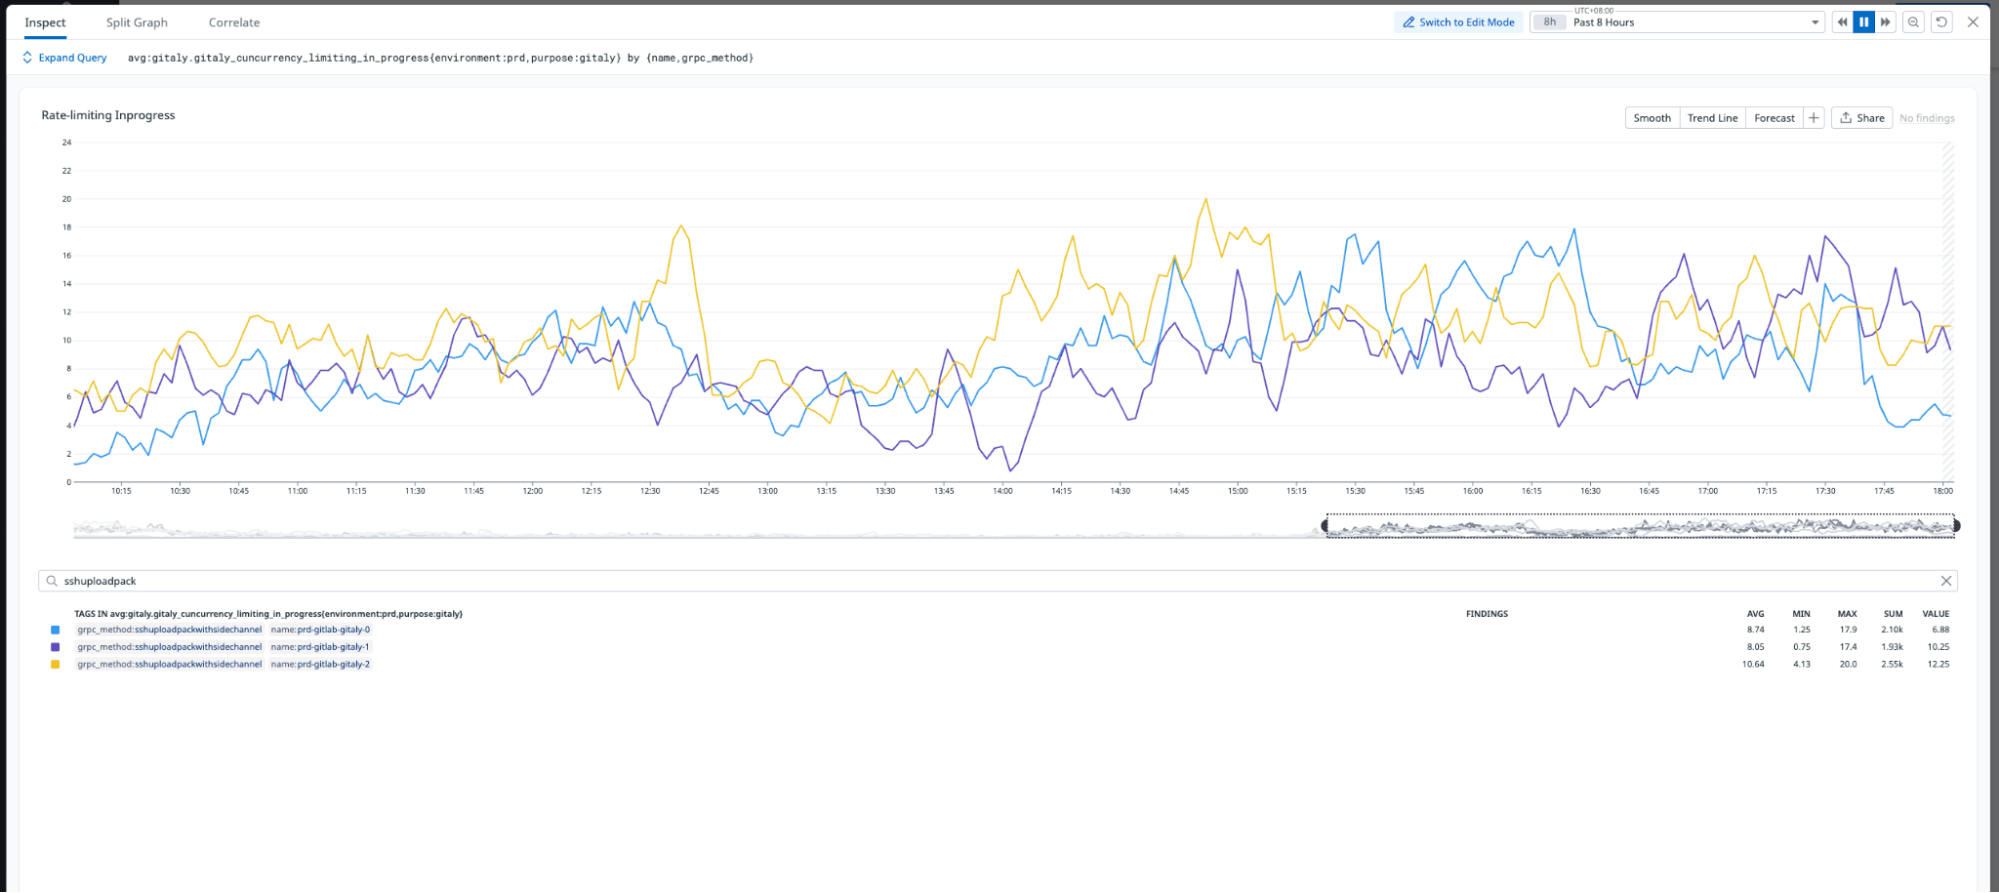
The migration significantly improved load distribution across Gitaly nodes. As shown in Figure 5, the new monorepo leverages all three Gitaly nodes to serve requests, effectively tripling read capacity. Additionally, the migration eliminated the single point of failure that existed in the old monorepo, ensuring greater reliability and scalability.
Figure 5: In the new monorepo, requests are evenly distributed across all three servers, demonstrating improved performance and replication across nodes.
Figure 6: In the old monorepo, requests were served only by a single server during working hours, creating a single point of failure.
Performance improvements
The migration resulted in significant improvements across multiple areas.
Clone time: Reduced from 7.9 minutes to 5.1 minutes, achieving a 36% improvement, making repository cloning faster and more efficient.
Commit count: Achieved a 99.9% reduction, trimming the repository from 13 million commits to just 15.8 thousand commits, drastically simplifying its structure.
References: Reduced by 99.9%, going from 12 million to 9.8 thousand refs, streamlining repository metadata.
Storage: Reduced by 59%, shrinking storage requirements from 214GB to 87GB, optimizing resource usage.
Developer experience
The migration also transformed the developer experience.
Faster Git operations: Commits, diffs, and history commands are noticeably snappier.
Responsive GitLab UI: Web interface no longer times out.
Scalable CI: The system can now safely run 3x more concurrent jobs.
The following table summarizes the key repository metrics, comparing the state of the repository before and after the migration:
Metric
Old Monorepo
New Monorepo
Reduction
Commits
~13,000,000
~15,800
−99.9% (histories squashed)
Git trees
~23,600,000
~2,080,000
−91% (pruned)
Git references
~12,200,000
9,860
−99.9% (cleaned)
Blob storage
214 GiB
86.8 GiB
−59% (smaller packs)
Files in checkout
~444,000
~444,000
~0% (no change)
Latest code size
~9.9 GiB
~8.4 GiB
~−15% (slightly leaner)
Key challenges and lessons learned
Such a large-scale migration wasn’t without its hiccups and lessons. Here are some challenges we faced and what we learned:
Git LFS woes
Initially, GitLab rejected some commits due to missing LFS objects, even old commits that we weren’t keeping. This happened because GitLab’s push hook expected the content of LFS pointers, even if the files weren’t required. To fix this, we had to allow incomplete pushes and skip LFS download errors. We also wrote logic to selectively fetch LFS objects for commits we were keeping. This ensured that any binary assets needed by tagged commits were present in the new repo. The takeaway is that LFS adds complexity to history rewrites – plan for it by adjusting Git LFS settings (e.g., lfs.allowincompletepush) and verifying important large files are carried over.
Pipeline token scoping
Right after the cutover, some CI pipelines failed to access resources. We discovered a GitLab CI/CD pipeline token issue – our new repo’s ID wasn’t in the allowed list for certain secure token scopes. We quickly updated the settings to include the new project, resolving the authorization error. If your CI jobs interact with other projects or use project-scoped tokens, remember to update those references when you migrate repositories.
Commit hash references broke
One of our internal tools was using commit SHA-1 hashes to track deployed versions. Since rewriting history means changing all commit hashes, the tool couldn’t find the expected commits. The solution was to map old hashes to new ones for the tagged releases, or better, to modify the tool to use tag names instead of raw hashes going forward. We learned to communicate early with teams that have any dependency on Git commit IDs or history assumptions. In our case, providing a mapping of old tag→new tag (which were mostly 1-to-1 except for the commit SHA) helped them adjust. In hindsight, using stable identifiers like semantic version tags, is much more robust than relying on commit hashes, which are ephemeral in a rewritten history.
Developer concerns: “Where’s my history?”
A few engineers were concerned when they noticed that the git log in the new repo only showed two years of history. From their perspective, useful historical context seemed gone. We addressed this by pointing them to the archived full-history repo. In fact, we kept the old repository read-only in our GitLab, so anyone can still search the old history if needed (just not in the main repo). Additionally, we received suggestions on making the archive easily accessible or even automate a way to query old commits on demand. From this we learned, if you prune history, ensure there’s a plan to access legacy information for those rare times it’s needed – whether that’s an archive repo, a Git bundle, or a read-only mirror.
Office network bottleneck
Interestingly, after the migration, a few developers in certain offices didn’t feel a huge speed improvement in clones. It turned out their corporate network/VPN was the limiting factor – cloning 8 GiB vs 10 GiB over a slow link is not a night and day difference. This highlighted that we should continue to work with the IT team on improving network performance. The repo is faster, but the environment matters too. We’re using this as an opportunity to improve our office VPN throughput so that the 36% clone improvement is realized by everyone, not just CI machines.
Automation and hardcoded IDs
We had a lot of automation around the monorepo (scripts, webhooks, integrations). Most of these referenced the project by name, which remained the same, so they were fine. However, a few used the project’s numeric ID in the GitLab API, which changed when we created a new repo. Those broke. We had to scan and update some configs to use the new project ID. Our learning here is to audit all external references such as CI configs, deploy scripts, and monitor jobs when migrating repositories. Ideally, use identifiable names instead of IDs, or ensure you’re prepared to update them during the cutover.
Adjusting to new boundaries
Some teams had to adjust their workflows after the prune. For instance, one team was in the habit of digging into 3 to 5 year old commit logs to debug issues. Post-migration, git log doesn’t go back that far in the main repo; they have to consult the archive for that. It’s a cultural shift to not have all history at your fingertips. We held a short information session to explain how to access the archived repo and emphasized the benefits (faster operations) that come with the lean history. After a while, teams embraced the new normal, appreciating the speed and rarely needing the older commits anyway.
In the end, we had zero data loss – all actual code and tags were preserved – and only some minor inconveniences that were resolved within a day or two. The challenges reinforced the importance of thorough testing (our staging dry-runs caught many issues) and cross-team communication when making such a change.
Impact and next steps
This migration transformed our development infrastructure from a bottleneck into a performance enabler. We eliminated the single point of failure, restored confidence in our Git operations, and created a foundation that can support our growing engineering team.
As the next step, we plan to generalize our pruning script to apply the same optimization techniques to other repositories, ensuring consistency and scalability across our infrastructure. Additionally, we will implement continuous performance monitoring to track repository health and proactively address any emerging issues. To prevent future repository bloat, we aim to establish clear best practices and guidelines, empowering teams to maintain efficiency while supporting the growth of our engineering operations.
Conclusion
What started as a performance crisis became one of our most successful infrastructure projects. By focusing on the right problems—infrastructure reliability and performance rather than just size—we achieved dramatic improvements that benefit every developer daily.
The key takeaway is that sometimes the biggest technical challenges require custom solutions, careful planning, and willingness to iterate until you find what works. Our 99% improvement in replication performance is just the beginning of what’s possible when you tackle infrastructure problems systematically.
This migration was completed by Grab Tech Infra DevTools team, involving months of analysis, custom tooling development, and careful production migration of critical infrastructure serving thousands of developers across multiple time zones.
Join us
Grab is a leading superapp in Southeast Asia, operating across the deliveries, mobility and digital financial services sectors. Serving over 800 cities in eight Southeast Asian countries, Grab enables millions of people everyday to order food or groceries, send packages, hail a ride or taxi, pay for online purchases or access services such as lending and insurance, all through a single app. Grab was founded in 2012 with the mission to drive Southeast Asia forward by creating economic empowerment for everyone. Grab strives to serve a triple bottom line – we aim to simultaneously deliver financial performance for our shareholders and have a positive social impact, which includes economic empowerment for millions of people in the region, while mitigating our environmental footprint.
Powered by technology and driven by heart, our mission is to drive Southeast Asia forward by creating economic empowerment for everyone. If this mission speaks to you, join our team today!
Let’s Encrypt has been proud to work with the IETF to maintain ACME as an open standard since we first developed the technology a decade ago. We’re happy to announce that IETF has published our latest addition to the ACME protocol, ACME Renewal Information (ARI), as RFC 9773. ARI helps keep the renewal process reliable during unexpected events affecting certificate validity.
Since the ACME protocol was first published as RFC 8555, the IETF ACME working group has remained active, defining various extensions to the original ACME protocol, initiated either by Let’s Encrypt or by colleagues from other organizations. For example, ACME WG documents have specified how to validate kinds of identifiers other than domain names, making it possible to use ACME to issue certificates for IP addresses, or even in PKIs other than the web PKI.
The publication of RFC 9773 is the culmination of a process that began in September 2021 with the first ARI draft. Along the way, numerous colleagues from Let’s Encrypt and elsewhere (thanked individually at the end of this post) contributed to the ARI specification and helped improve it.
Why implement ARI?
This is a good opportunity to remind our community about ARI and how implementing it can help users. If you’re an ACME client user, you may want to check the documentation for your client to see if it has implemented ARI yet. New functionality like this is a great reason to make sure you’re using up-to-date ACME client software. If you’re a client developer, questions about ARI implementation are welcome in the Community Forum’s Client Dev category.
Sometimes certificate authorities, including Let’s Encrypt, may perform mass revocations of an entire group or category of certificates. This most often happens when someone discovers that a certificate authority has made a mistake in how it validates or issues certificates, or has made a misstatement in how it describes its policies and procedures. In this case, the CA is required to revoke the affected certificates. This may happen through absolutely no fault of the subscribers. For example, in January 2022, we had to revoke approximately two million certificates due to a technical error in our validation processes.
When we have to revoke certificates, we want to make sure that the websites using those certificates don’t experience issues. That means those websites need to re-request issuance and install new certificates. Since CAs are sometimes required to revoke certificates on a 24 hour timeline or a 5 day timeline (depending on the nature of the incident), a process that relies on manual intervention from system administrators won’t reach most websites in time.
ARI allows a certificate authority to advise a client to perform an early renewal of a certificate that the client would have anticipated did not need to be renewed yet, broadly because the CA knows that an early renewal is helpful, or necessary, in particular circumstances. In the mass revocation scenario, this allows ARI-aware clients to avoid outages due to certificate invalidity, because they can replace their certificates even before the revocation occurs.
Of course, we and other certificate authorities work diligently to prevent mass revocation events. We’re encouraging ARI implementation as a form of emergency preparedness that can significantly mitigate the impact of this kind of problem, if and when it happens.
ARI also provides features to reduce the impact of load spikes where too many clients request certificates in a short period of time. Let’s Encrypt doesn’t need to use ARI for this today, because other improvements in popular clients’ renewal practices have already sufficiently smoothed out our load spikes. Even so, this will be a valuable ability for all ACME CAs to have available in the long term to better manage emergencies and disruptions.
On the server side, we added support for the ARI draft specification to our Boulder CA software in late 2021, so the Let’s Encrypt CA has supported ARI for some time. If you are implementing ARI in your own client, the Pebble ACME test-bed also supports ARI so you can test against that implementation.
Thanks
Thanks to all of the people who contributed to this process at the ACME WG and elsewhere, including: Roland Shoemaker and Jacob Hoffman-Andrews for coming up with the initial idea of ARI and for helping me learn the IETF process; Samantha Frank, Matt Holt, Ilari Liusvaara, and Wouter Tinus for contributing client implementations; Freddy Zhang for contributing an independent server implementation; and Rob Stradling, Andrew Ayer, and J.C. Jones for providing meaningful feedback and suggestions that significantly improved this specification.
Finally, our congratulations also to Q Misell for the recent publication of RFC 9799, another ACME WG document that went through the standards process alongside ARI.
Registration for the 2025 Linux Plumbers Conference (Tokyo,
December 11 to 13) is
now open. LPC tickets often sell out quickly, so it would be best not
to delay if you intend to attend.
Organizations often struggle to unify their data ecosystems across multiple platforms and services. The connectivity between Amazon SageMaker and Snowflake’s AI Data Cloud offers a powerful solution to this challenge, so businesses can take advantage of the strengths of both environments while maintaining a cohesive data strategy.
In this post, we demonstrate how you can break down data silos and enhance your analytical capabilities by querying Apache Iceberg tables in the lakehouse architecture of SageMaker directly from Snowflake. With this capability, you can access and analyze data stored in Amazon Simple Storage Service (Amazon S3) through AWS Glue Data Catalog using an AWS Glue Iceberg REST endpoint, all secured by AWS Lake Formation, without the need for complex extract, transform, and load (ETL) processes or data duplication. You can also automate table discovery and refresh using Snowflake catalog-linked databases for Iceberg. In the following sections, we show how to set up this integration so Snowflake users can seamlessly query and analyze data stored in AWS, thereby improving data accessibility, reducing redundancy, and enabling more comprehensive analytics across your entire data ecosystem.
Business use cases and key benefits
The capability to query Iceberg tables in SageMaker from Snowflake delivers significant value across multiple industries:
Financial services – Enhance fraud detection through unified analysis of transaction data and customer behavior patterns
Healthcare – Improve patient outcomes through integrated access to clinical, claims, and research data
Retail – Increase customer retention rates by connecting sales, inventory, and customer behavior data for personalized experiences
Manufacturing – Boost production efficiency through unified sensor and operational data analytics
Telecommunications – Reduce customer churn with comprehensive analysis of network performance and customer usage data
Key benefits of this capability include:
Accelerated decision-making – Reduce time to insight through integrated data access across platforms
Cost optimization – Accelerate time to insight by querying data directly in storage without the need for ingestion
Improved data fidelity – Reduce data inconsistencies by establishing a single source of truth
Enhanced collaboration – Increase cross-functional productivity through simplified data sharing between data scientists and analysts
By using the lakehouse architecture of SageMaker with Snowflake’s serverless and zero-tuning computational power, you can break down data silos, enabling comprehensive analytics and democratizing data access. This integration supports a modern data architecture that prioritizes flexibility, security, and analytical performance, ultimately driving faster, more informed decision-making across the enterprise.
Solution overview
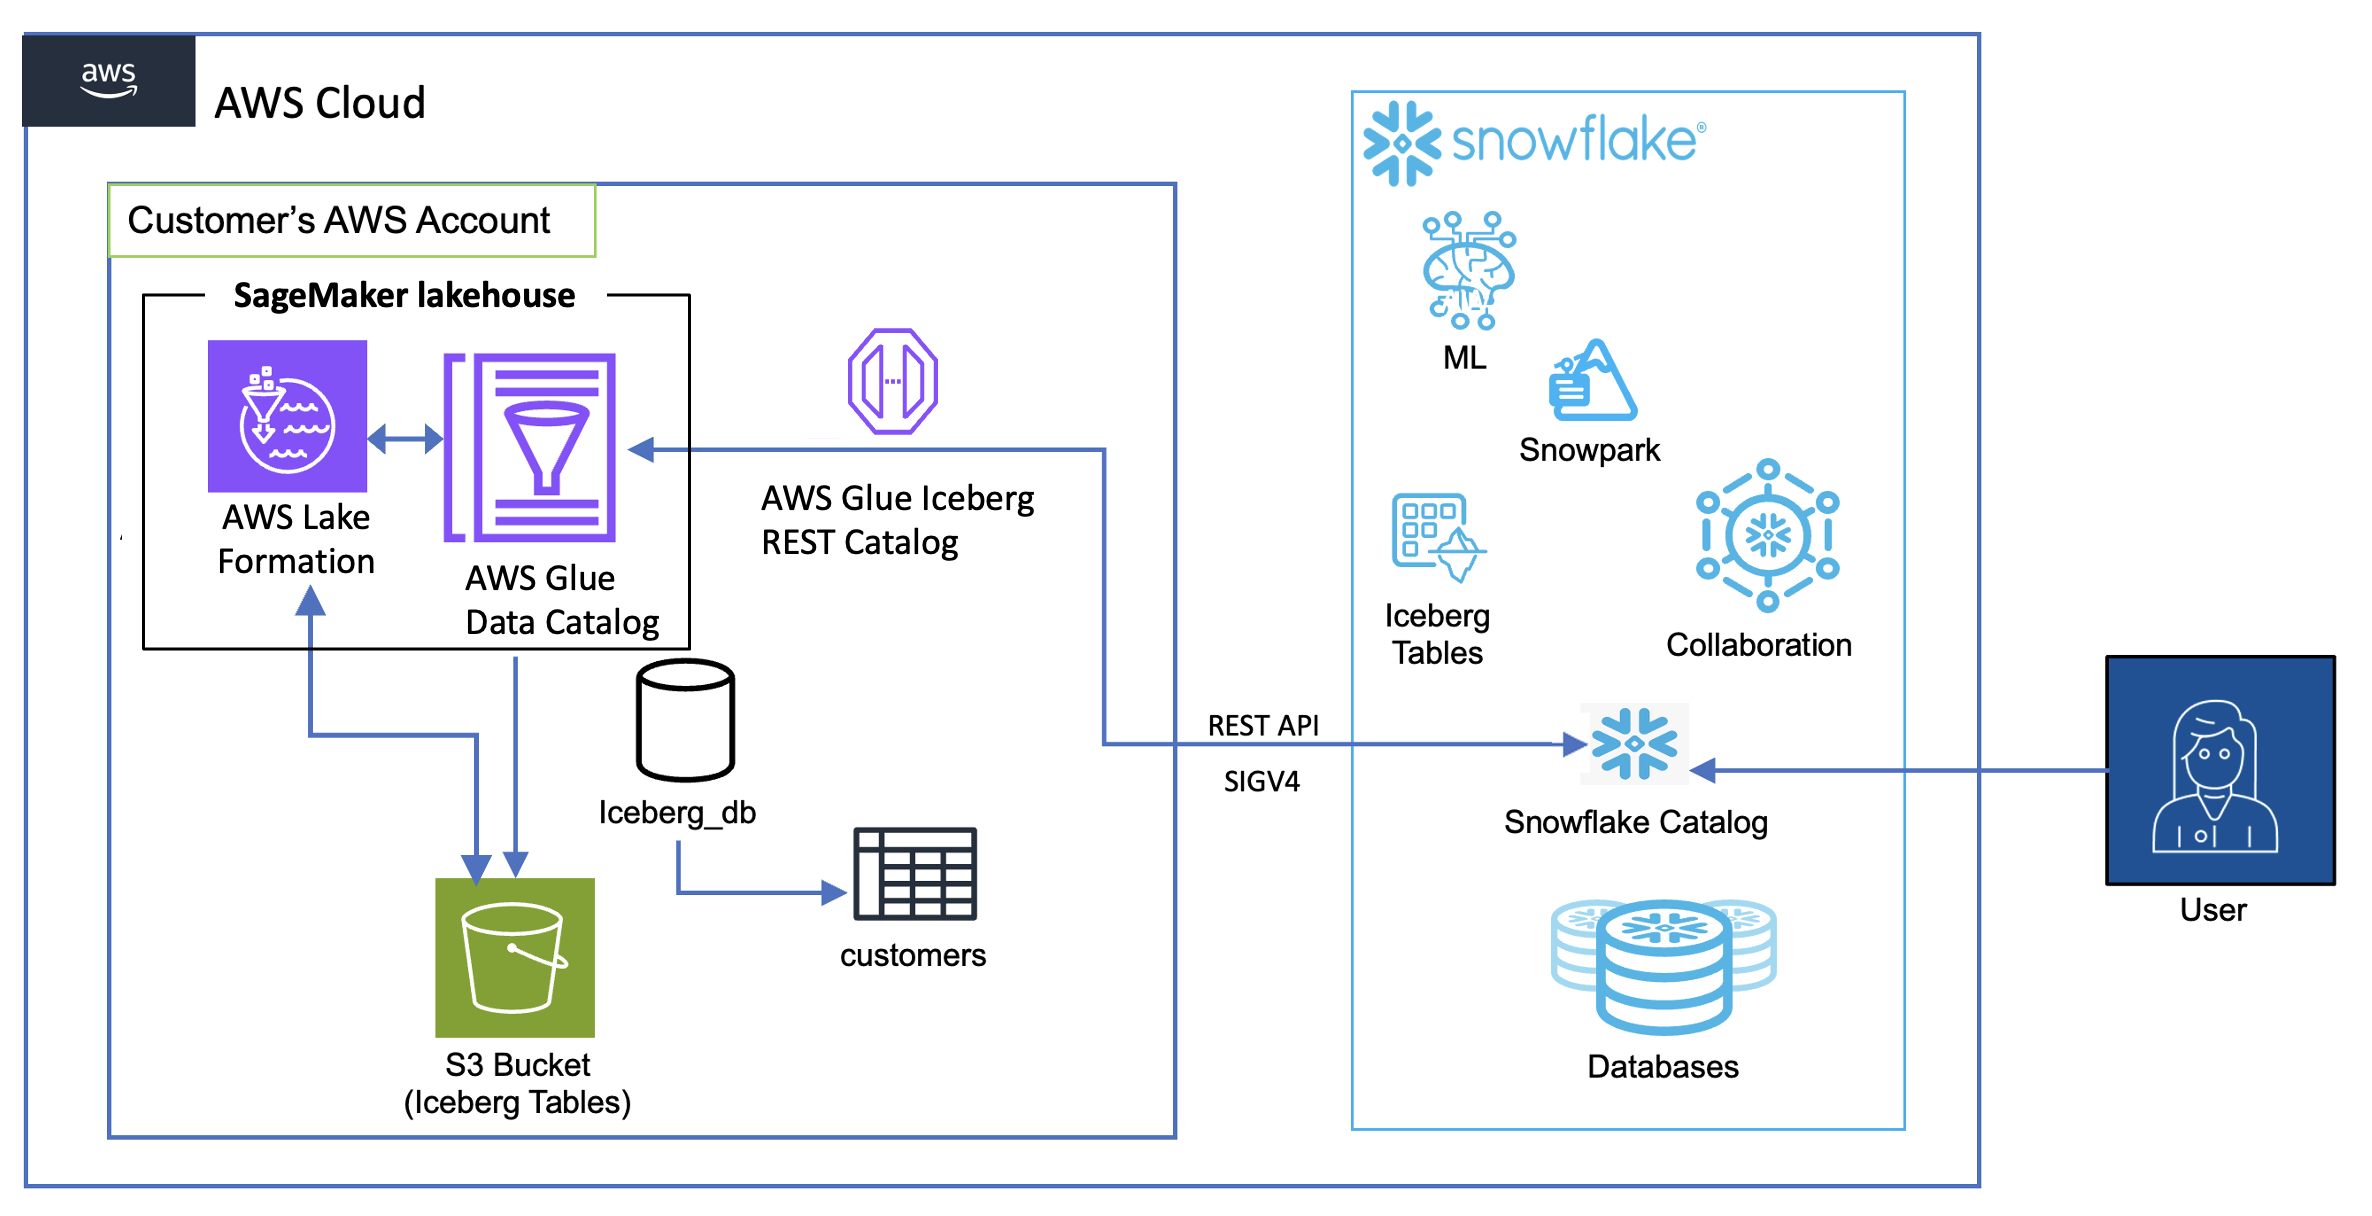
The following diagram shows the architecture for catalog integration between Snowflake and Iceberg tables in the lakehouse.
The workflow consists of the following components:
Data storage and management:
Amazon S3 serves as the primary storage layer, hosting the Iceberg table data
The Data Catalog maintains the metadata for these tables
Lake Formation provides credential vending
Authentication flow:
Snowflake initiates queries using a catalog integration configuration
These credentials are automatically refreshed based on the configured refresh interval
Query flow:
Snowflake users submit queries against the mounted Iceberg tables
The AWS Glue Iceberg REST endpoint processes these requests
Query execution uses Snowflake’s compute resources while reading directly from Amazon S3
Results are returned to Snowflake users while maintaining all security controls
There are four patterns to query Iceberg tables in SageMaker from Snowflake:
Iceberg tables in an S3 bucket using an AWS Glue Iceberg REST endpoint and Snowflake Iceberg REST catalog integration, with credential vending from Lake Formation
Iceberg tables in an S3 bucket using an AWS Glue Iceberg REST endpoint and Snowflake Iceberg REST catalog integration, using Snowflake external volumes to Amazon S3 data storage
Iceberg tables in an S3 bucket using AWS Glue API catalog integration, also using Snowflake external volumes to Amazon S3
In this post, we implement the first of these four access patterns using catalog integration for the AWS Glue Iceberg REST endpoint with Signature Version 4 (SigV4) authentication in Snowflake.
An AWS Identity and Access Management (IAM) role that is a Lake Formation data lake administrator in your AWS account. A data lake administrator is an IAM principal that can register Amazon S3 locations, access the Data Catalog, grant Lake Formation permissions to other users, and view AWS CloudTrail. See Create a data lake administrator for more information.
An existing AWS Glue database named iceberg_db and Iceberg table named customer with data stored in an S3 general purpose bucket with a unique name. To create the table, refer to the table schema and dataset.
A user-defined IAM role that Lake Formation assumes when accessing the data in the aforementioned S3 location to vend scoped credentials (see Requirements for roles used to register locations). For this post, we use the IAM role LakeFormationLocationRegistrationRole.
The solution takes approximately 30–45 minutes to set up. Cost varies based on data volume and query frequency. Use the AWS Pricing Calculator for specific estimates.
Create an IAM role for Snowflake
To create an IAM role for Snowflake, you first create a policy for the role:
On the IAM console, choose Policies in the navigation pane.
Choose Create policy.
Choose the JSON editor and enter the following policy (provide your AWS Region and account ID), then choose Next.
To test the configuration, log in to Snowflake as an admin user and run the following sample query:SELECT * FROM s3iceberg_customer LIMIT 10;
Clean up
To clean up your resources, complete the following steps:
Delete the database and table in AWS Glue.
Drop the Iceberg table, catalog integration, and database in Snowflake:
DROP ICEBERG TABLE iceberg_customer;
DROP CATALOG INTEGRATION glue_irc_catalog_int;
Make sure all resources are properly cleaned up to avoid unexpected charges.
Conclusion
In this post, we demonstrated how to establish a secure and efficient connection between your Snowflake environment and SageMaker to query Iceberg tables in Amazon S3. This capability can help your organization maintain a single source of truth while also letting teams use their preferred analytics tools, ultimately breaking down data silos and enhancing collaborative analysis capabilities.
To further explore and implement this solution in your environment, consider the following resources:
These resources can help you to implement and optimize this integration pattern for your specific use case. As you begin this journey, remember to start small, validate your architecture with test data, and gradually scale your implementation based on your organization’s needs.
Organizations are innovating and growing their cloud presence to deliver better customer experiences and drive business value. To support and protect this growth, organizations can use Amazon GuardDuty, a threat detection service that continuously monitors for malicious activity and unauthorized behavior across your AWS environment. GuardDuty uses artificial intelligence (AI), machine learning (ML), and anomaly detection using both AWS and industry-leading threat intelligence to help protect your AWS accounts, workloads, and data. Building on these foundational capabilities, GuardDuty offers a comprehensive suite of protection plans and the Extended Threat Detection feature.
In this post, we explore how to use these features to provide robust security coverage for your AWS workloads, helping you detect sophisticated threats across your AWS environment.
Understanding GuardDuty protection plans
GuardDuty starts with foundational security monitoring, which analyzes AWS CloudTrail management events, Amazon Virtual Private Cloud (Amazon VPC) Flow Logs, and DNS logs. Building on this foundation, GuardDuty offers several protection plans that extend its threat detection capabilities to additional AWS services and data sources. These protection plans are optional features that analyze data from specific AWS services in your environment to provide enhanced security coverage. GuardDuty offers the flexibility to customize how new accounts inherit protection plans, so you can add coverage for your accounts or select specific accounts based on your security needs. You can enable or disable these protection plans at any time to align with your evolving workload requirements.
Here are the available GuardDuty protection plans and their capabilities:
Detects the potential presence of malware by scanning the Amazon Elastic Block Store (Amazon EBS) volumes associated with your EC2 instances. There is an option to use this feature on-demand.
Monitors AWS Lambda network activity logs, starting with VPC Flow Logs, to detect threats to your Lambda functions. Examples of these potential threats include crypto mining and communicating with malicious servers.
Let’s explore how these protection plans help secure different aspects of your AWS environment.
S3 Protection
S3 Protection extends threat detection capabilities of GuardDuty to your S3 buckets by monitoring object-level API operations. Beyond basic monitoring, it analyzes patterns of behavior to detect sophisticated threats. When a threat actor attempts to exfiltrate data, GuardDuty can detect unusual sequences of API calls, such as ListBucket operations followed by suspicious GetObject requests from unusual locations. It also identifies potential security risks like attempts to disable S3 server access logging or unauthorized changes to bucket policies that could indicate an attempt to make buckets public. For instance, GuardDuty would generate an UnauthorizedAccess finding if it detects these suspicious API calls originating from known malicious IP addresses.
EKS Protection
For containerized workloads, EKS Protection monitors your Amazon EKS clusters’ control plane audit logs for security threats. It’s specifically designed to detect container-based exploits by analyzing Kubernetes audit logs from your EKS clusters. GuardDuty detects scenarios such as containers deployed with suspicious characteristics (like known malicious images), attempted privilege escalation through role binding modifications, and suspicious service account activities that could indicate compromise of your Kubernetes environment. When detecting such activities, GuardDuty would generate a PrivilegeEscalation finding, alerting you to potential unauthorized access attempts within your clusters. For a comprehensive understanding of the tactics, techniques, and procedures (TTPs), see the AWS Threat Technique Catalog.
Runtime Monitoring
Runtime Monitoring provides deeper visibility into potential threats by analyzing runtime behavior in EC2 instances, EKS clusters, and container workloads. This capability detects threats that manifest at the operating system level by monitoring process executions, file system changes, and network connections. GuardDuty can identify defense evasion tactics, execution of suspicious processes, and file access patterns indicating potential malware activity. For example, if a compromised instance attempts to disable security monitoring or creates unusual processes, GuardDuty would generate a Runtime finding indicating potential malicious activity at the OS level.
Malware Protection
Malware Protection offers two distinct capabilities: scanning EBS volumes attached to EC2 instances and scanning objects uploaded to S3 buckets. For EC2 instances, GuardDuty can perform both agentless scan-on-demand and continuous scanning of EBS volumes, detecting both known malware and potentially malicious files using advanced heuristics. For S3, it automatically scans newly uploaded objects, helping protect against malware distribution through your S3 buckets. When malware is detected, GuardDuty generates a Malware finding, specifying whether the threat was found in an EC2 instance or S3 bucket, helping you quickly identify and respond to the threat.
RDS Protection
RDS Protection focuses on database security by analyzing login activity for supported Amazon Aurora databases. It creates behavioral baselines of normal database access patterns and can detect anomalous sign-in attempts that might indicate unauthorized access attempts. This includes detecting unusual sign-in patterns, access from unexpected locations, and potential database compromise attempts. When suspicious database access is detected, GuardDuty generates an RDS finding, alerting you to potential unauthorized access or credential compromise.
Lambda Protection
Lambda Protection monitors your serverless applications by analyzing Lambda function activity through VPC Flow Logs. It can detect threats specific to serverless environments, such as when Lambda functions exhibit signs of compromise through unexpected network connections or potential cryptocurrency mining activity. If a Lambda function attempts to communicate with known malicious IP addresses or shows signs of cryptojacking, GuardDuty will generate a Lambda finding, so you can quickly identify and remediate compromised functions.
Each protection plan adds specialized detection capabilities designed for specific workload types, working together to provide comprehensive threat detection across your AWS environment. By enabling the protection plans relevant to your workloads, you can help make sure that GuardDuty provides targeted security monitoring for your specific use cases
Tailoring GuardDuty protection plans to your workload types
To maximize threat detection coverage, consider enabling all applicable GuardDuty protection plans across your AWS environment. This approach helps provide comprehensive coverage while maintaining cost efficiency, because you’re only charged for active protections on resources that exist in your account. For example, if you don’t use Amazon EKS, you won’t incur charges for EKS Protection even if it’s enabled. This strategy also helps facilitate automatic security coverage if teams deploy new services, without requiring immediate security team intervention. You retain the flexibility to adjust your protection plans at any time as your workload requirements evolve.
Based on AWS security best practices, we offer recommendations for different protection plan combinations aligned with common workload profiles. These recommendations help you understand how different protection plans work together to secure your specific architectures. For Amazon EC2 and Amazon S3 workloads, GuardDuty recommends Foundational, Amazon S3 Protection, and Amazon GuardDuty Malware Protection for Amazon EC2 to detect threats to compute instances, data storage, and AWS Identity and Access Management (IAM) misuse.
Container-heavy environments using Amazon EKS and Amazon ECS benefit from Foundational, Amazon EKS Protection, Amazon GuardDuty Runtime Monitoring, and Amazon GuardDuty Malware Protection for Amazon EC2. These plans work together to monitor container control-plane and runtime for threats and malware.
For serverless-first architectures built on Lambda, GuardDuty suggests Foundational, AWS Lambda Protection, and Amazon S3 Protection (if using Amazon S3 triggers) to identify anomalous function behavior and suspicious traffic patterns.
Data systems using Amazon Aurora or Amazon RDS should consider Foundational, Amazon RDS Protection, Amazon S3 Protection, and Amazon GuardDuty Malware Protection for Amazon S3. This combination helps detect anomalous database sign-ins and potential S3 bucket misuse.
For regulated environments or those implementing zero-trust architectures, enabling all GuardDuty protection plans helps provide comprehensive threat detection coverage that can support your broader security monitoring and compliance program requirements.
For quick reference, here’s what protection plans you should use to actively monitor your different workload types:
Workload profile
Expected security outcomes
Recommended GuardDuty plans
Amazon EC2 and Amazon S3
Detect threats to compute instances, data storage, and IAM misuse
Foundational, Amazon S3 Protection, and Amazon GuardDuty Malware Protection for Amazon EC2
Container-heavy (Amazon EKS, Amazon ECS)
Monitor container control-plane and runtime for threats and malware
Foundational, Amazon EKS Protection, Amazon GuardDuty Runtime Monitoring, and Amazon GuardDuty Malware Protection for Amazon EC2
Serverless-first (AWS Lambda)
Identify anomalous function behavior and suspicious traffic patterns
Foundational, GuardDuty Lambda Protection, GuardDuty S3 Protection (if using Amazon S3 triggers), and GuardDuty Runtime Monitoring for ECS on Fargate
Data system (Amazon Aurora or Amazon RDS)
Detect anomalous database logins and potential S3 bucket misuse
Foundational, Amazon RDS Protection, GuardDuty S3 Protection, and Amazon GuardDuty Malware Protection for Amazon S3
Regulated and Zero-Trust
Comprehensive threat detection to support compliance requirements
All Amazon GuardDuty protection plans
The power of GuardDuty Extended Threat Detection
Building upon these protection plans, GuardDuty offers Extended Threat Detection by default at no additional cost, using AI/ML capabilities to provide improved threat detection for your applications, workloads, and data. This capability correlates security signals to identify active threat sequences, offering a more comprehensive approach to cloud security.
Extended Threat Detection includes a Critical severity level for the most urgent and high-confidence threats based on correlating multiple steps taken by adversaries, such as privilege discovery, API manipulation, persistence activities, and data exfiltration. Integration with the MITRE ATT&CK® framework allows GuardDuty to map observed activities to tactics and techniques, providing context for security teams. To help teams respond quickly, GuardDuty provides specific remediation recommendations based on AWS best practices for each identified threat.
Real-world protection: Extended Threat Detection in action
To understand how GuardDuty protection plans and Extended Threat Detection work together in practice, let’s examine two sophisticated threat scenarios that security teams commonly face: data compromise and container cluster compromise.
Data compromise detection
GuardDuty Extended Threat Detection continuously analyzes and correlates events across multiple protection plans, providing comprehensive visibility when data compromise attempts occur in Amazon S3. For example, in a recent incident, GuardDuty identified a critical severity attack sequence spanning 24 hours. The sequence began with discovery actions through unusual S3 API calls, progressed to defense evasion through CloudTrail modifications, and culminated in potential data exfiltration attempts.
During the discovery phase, S3 Protection detected an IAM role making unusual ListBuckets and GetObject API calls across multiple buckets—a significant deviation from their normal pattern of accessing only specific assigned buckets. Extended Threat Detection then correlated this suspicious activity with subsequent actions from the same IAM role: attempts to disable CloudTrail logging and modify bucket policies (classic signs of defense evasion), followed by the creation of new access keys. This connected sequence of events, all from the same identity, indicated a progressing exploit moving from initial discovery to establishing persistence through credential creation.
Container environment compromise
Protecting containerized environments requires visibility across multiple layers of your Amazon EKS infrastructure. GuardDuty combines signals from EKS control plane (through EKS Protection), container runtime behavior (through Runtime Monitoring), and foundational infrastructure logs to provide comprehensive threat detection for your Kubernetes clusters. For example, EKS Protection detects suspicious activities at the Kubernetes control plane level, such as unusual kubernetes API server authentication attempts or the creation of service accounts with elevated permissions. Runtime Monitoring provides visibility into container behavior, identifying unexpected privileged commands or suspicious file system access. Together with foundational logs, these components provide multi-layer threat detection for your container workloads.
Here’s how these components worked together in detecting an attack sequence: The exploit began when EKS Protection detected unusual Kubernetes API server authentication attempts from a container within the cluster. Runtime Monitoring simultaneously observed commands that deviated from the container’s baseline behavior, such as privilege escalation attempts and unauthorized system calls. As the exploit progressed, GuardDuty detected the creation of a Kubernetes service account with elevated permissions, followed by attempts to mount sensitive host paths to containers.
The scenario then escalated when the compromised Kubernetes Pod established connections to other Pods across namespaces, suggesting lateral movement. GuardDuty Extended Threat Detection correlated these events with the Pod accessing sensitive Kubernetes secrets and AWS credentials stored in Kubernetes ConfigMaps. The final stage revealed the compromised Pod making AWS API calls using stolen credentials, targeting resources outside the cluster’s normal operational scope.
The detection of this multi-stage attack, spanning container exploitation, privilege escalation, and credential theft, demonstrates the power of the correlation capabilities of Extended Threat Detection. Security teams received a single critical finding that mapped the entire exploit sequence to MITRE ATT&CK® tactics, providing clear visibility into the exploit progression and specific remediation steps.
These real-world scenarios illustrate how GuardDuty protection plans work in concert with Extended Threat Detection to provide deep security insights. The combination of targeted protection plans and AI-powered correlation helps security teams identify and respond to sophisticated threats that might otherwise go unnoticed or be difficult to piece together manually.
Conclusion
GuardDuty protection plans, coupled with its built-in Extended Threat Detection feature, offer a powerful suite of managed detections to secure your AWS environment. By tailoring your security strategy to your specific workload types and using AI-powered insights, you can significantly enhance your ability to detect and respond to sophisticated threats. To get started with GuardDuty protection plans and Extended Threat Detection, visit the GuardDuty console. Each protection plan includes a 30-day trial at no additional cost per AWS account and AWS Region, allowing you to evaluate the security coverage for your specific needs. Remember, you can adjust your enabled plans at any time to align with your evolving security requirements and workload changes. By using these capabilities, you can strengthen your organization’s threat detection and response in the face of evolving security risks.
If you have feedback about this post, submit comments in the Comments section below. If you have questions about this post, contact AWS Support.
Brooke Deuson is the developer behind
Trafficking Free Tomorrow, a nonprofit organization that
produces free software to help law enforcement combat human trafficking. She is
a survivor of human trafficking herself.
She spoke at RustConf 2025 about her
mission, and why she chose to write her anti-trafficking software in Rust.
Interestingly, it has nothing to do with Rust’s lifetime-analysis-based memory-safety —
instead, her choice was motivated by the difficulty she faces getting police
departments to actually use her software. The fact that Rust is statically
linked and capable of cross compilation by default makes deploying Rust software
in those environments easier.
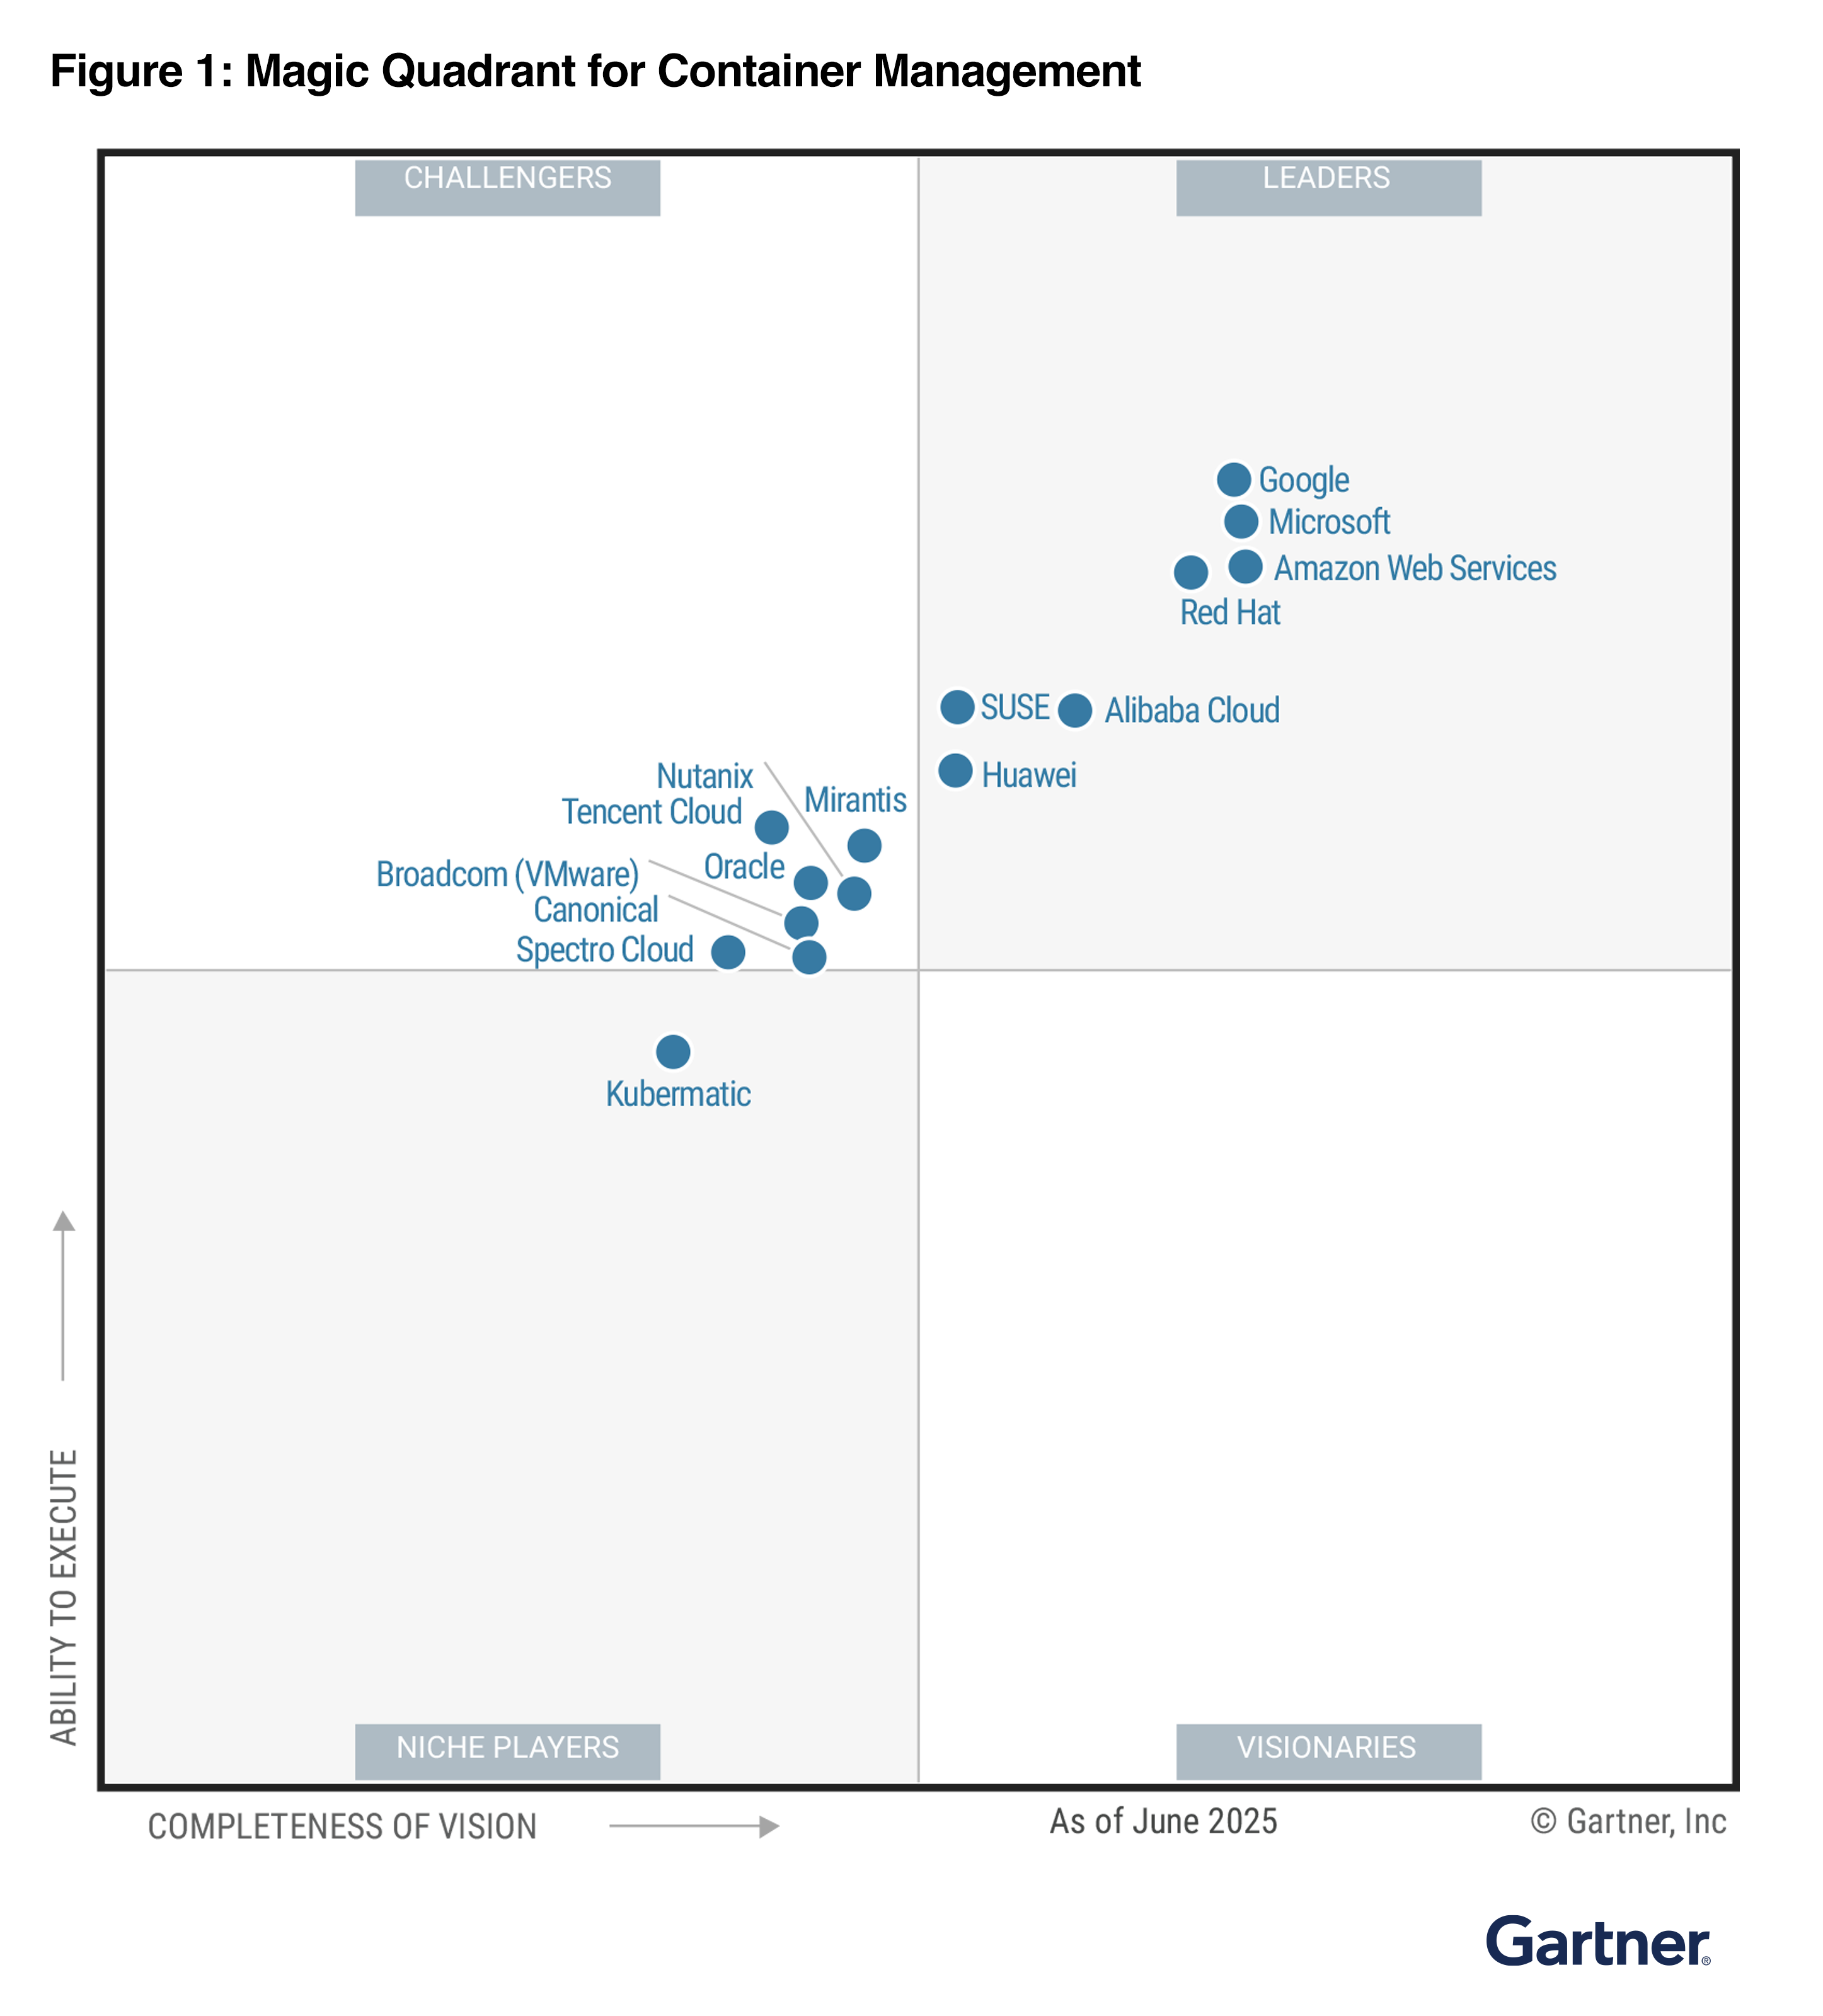
Today, I’m happy to share recent Magic Quadrant reports that named AWS as a Leader in more cloud technology markets: Cloud-Native Application Platforms (aka Cloud Application Platforms) and Container Management.
2025 Gartner Magic Quadrant for Cloud-Native Application Platforms AWS has been named a Leader in the Gartner Magic Quadrant for Cloud-Native Application Platforms for 2 consecutive years. AWS was positioned highest on “Ability to Execute”. Gartner defines cloud-native application platforms as those that provide managed application runtime environments for applications and integrated capabilities to manage the lifecycle of an application or application component in the cloud environment.
The following image is the graphical representation of the 2025 Magic Quadrant for Cloud-Native Application Platforms.
Our comprehensive cloud-native application portfolio—AWS Lambda, AWS App Runner, AWS Amplify, and AWS Elastic Beanstalk—offers flexible options for building modern applications with strong AI capabilities, demonstrated through continued innovation and deep integration across our broader AWS service portfolio.
You can simplify the service selection through comprehensive documentation, reference architectures, and prescriptive guidance available in the AWS Solutions Library, along with AI-powered, contextual recommendations from Amazon Q based on your specific requirements. While AWS Lambda is optimized for AWS to provide the best possible serverless experience, it follows industry standards for serverless computing and supports common programming languages and frameworks. You can find all necessary capabilities within AWS, including advanced features for AI/ML, edge computing, and enterprise integration.
2025 Gartner Magic Quadrant for Container Management In the 2025 Gartner Magic Quadrant for Container Management, AWS has been named as a Leader for three years and was positioned furthest for “Completeness of Vision”. Gartner defines container management as offerings that support the deployment and operation of containerized workloads. This process involves orchestrating and overseeing the entire lifecycle of containers, covering deployment, scaling, and operations, to ensure their efficient and consistent performance across different environments.
The following image is the graphical representation of the 2025 Magic Quadrant for Container Management.
AWS container services offer fully managed container orchestration with AWS native solutions and open-source technologies to focus on providing a wide range of deployment options, from Kubernetes to our native orchestrator.
You can connect on-premises and edge infrastructure back to AWS container services with EKS Hybrid Nodes and ECS Anywhere, or use EKS Anywhere for a fully disconnected Kubernetes experience supported by AWS. With flexible compute and deployment options, you can reduce operational overhead and focus on innovation and drive business value faster.
Gartner does not endorse any vendor, product or service depicted in its research publications and does not advise technology users to select only those vendors with the highest ratings or other designation. Gartner research publications consist of the opinions of Gartner’s research organization and should not be construed as statements of fact. Gartner disclaims all warranties, expressed or implied, with respect to this research, including any warranties of merchantability or fitness for a particular purpose.
GARTNER is a registered trademark and service mark of Gartner and Magic Quadrant is a registered trademark of Gartner, Inc. and/or its affiliates in the U.S. and internationally and are used herein with permission. All rights reserved.
Version
8.0.0 of Varnish Cache
has been released. In addition to a number
of changes to varnishd parameters, the ability to access some
runtime parameters using the Varnish Configuration Language, and other
improvements, 8.0.0 comes with big news; the project is forming an
organization called a forening
that will set out formal governance for the project.
The move also comes with a name change due to legal difficulties in
securing the Varnish Cache name:
The new association and the new project will be named “The Vinyl
Cache Project”, and this release 8.0.0, will be the last under the
“Varnish Cache” name. The next release, in March will be under the new
name, and will include compatility scripts, to make the transition as
smooth as possible for everybody.
I want to make it absolutely clear that this is 100% a mess of my
making: I should have insisted on a firm written agreement about the
name sharing, but I did not.
I will also state for the record, that there are no hard feelings
between Varnish Software and the FOSS project.
Varnish Software has always been, and still is, an important and
valued contributor to the FOSS project, but sometimes even friends can
make a mess of a situation.
The collective thoughts of the interwebz
Manage Consent
To provide the best experiences, we use technologies like cookies to store and/or access device information. Consenting to these technologies will allow us to process data such as browsing behavior or unique IDs on this site. Not consenting or withdrawing consent, may adversely affect certain features and functions.
Functional
Always active
The technical storage or access is strictly necessary for the legitimate purpose of enabling the use of a specific service explicitly requested by the subscriber or user, or for the sole purpose of carrying out the transmission of a communication over an electronic communications network.
Preferences
The technical storage or access is necessary for the legitimate purpose of storing preferences that are not requested by the subscriber or user.
Statistics
The technical storage or access that is used exclusively for statistical purposes.The technical storage or access that is used exclusively for anonymous statistical purposes. Without a subpoena, voluntary compliance on the part of your Internet Service Provider, or additional records from a third party, information stored or retrieved for this purpose alone cannot usually be used to identify you.
Marketing
The technical storage or access is required to create user profiles to send advertising, or to track the user on a website or across several websites for similar marketing purposes.