Tag Archives: Analytics

Configure ADFS Identity Federation with Amazon QuickSight

Post Syndicated from Adeleke Coker original https://aws.amazon.com/blogs/big-data/configure-adfs-identity-federation-with-amazon-quicksight/

Amazon QuickSight Enterprise edition can integrate with your existing Microsoft Active Directory (AD), providing federated access using Security Assertion Markup Language (SAML) to dashboards. Using existing identities from Active Directory eliminates the need to create and manage separate user identities in AWS Identity Access Management (IAM). Federated users assume an IAM role when access is requested through an identity provider (IdP) such as Active Directory Federation Service (AD FS) based on AD group membership. Although, you can connect AD to QuickSight using AWS Directory Service, this blog focuses on federated logon to QuickSight Dashboards.

With identity federation, your users get one-click access to Amazon QuickSight applications using their existing identity credentials. You also have the security benefit of identity authentication by your IdP. You can control which users have access to QuickSight using your existing IdP. Refer to Using identity federation and single sign-on (SSO) with Amazon QuickSight for more information.

In this post, we demonstrate how you can use a corporate email address as an authentication option for signing in to QuickSight. This post assumes you have an existing Microsoft Active Directory Federation Services (ADFS) configured in your environment.

Solution overview

While connecting to QuickSight from an IdP, your users initiate the sign-in process from the IdP portal. After the users are authenticated, they are automatically signed in to QuickSight. After QuickSight checks that they are authorized, your users can access QuickSight.

The following diagram shows an authentication flow between QuickSight and a third-party IdP. In this example, the administrator has set up a sign-in page to access QuickSight. When a user signs in, the sign-in page posts a request to a federation service that complies with SAML 2.0. The end-user initiates authentication from the sign-in page of the IdP. For more information about the authentication flow, see Initiating sign-on from the identity provider (IdP).

QuickSight IdP flow

The solution consists of the following high-level steps:

  1. Create an identity provider.
  2. Create IAM policies.
  3. Create IAM roles.
  4. Configure AD groups and users.
  5. Create a relying party trust.
  6. Configure claim rules.
  7. Configure QuickSight single sign-on (SSO).
  8. Configure the relay state URL for QuickStart.

Prerequisites

The following are the prerequisites to build the solution explained in this post:

  • An existing or newly deployed AD FS environment.
  • An AD user with permissions to manage AD FS and AD group membership.
  • An IAM user with permissions to create IAM policies and roles, and administer QuickSight.
  • The metadata document from your IdP. To download it, refer to Federation Metadata Explorer.

Create an identity provider

To add your IdP, complete the following steps:

  1. On the IAM console, choose Identity providers in the navigation pane.
  2. Choose Add provider.
  3. For Provider type¸ select SAML.
  4. For Provider name, enter a name (for example, QuickSight_Federation).
  5. For Metadata document, upload the metadata document you downloaded as a prerequisite.
  6. Choose Add provider.
  7. Copy the ARN of this provider to use in a later step.

Add IdP in IAM

Create IAM policies

In this step, you create IAM policies that allow users to access QuickSight only after federating their identities. To provide access to QuickSight and also the ability to create QuickSight admins, authors (standard users), and readers, use the following policy examples.

The following code is the author policy:

{
    "Statement": [
        {
            "Action": [
                "quicksight:CreateUser"
            ],
            "Effect": "Allow",
            "Resource": [
                "*"
            ]
        }
    ],
    "Version": "2012-10-17"
}

The following code is the reader policy:

{ 
"Version": "2012-10-17", 
"Statement": [ 
{ 
"Effect": "Allow",
"Action": "quicksight:CreateReader", 
"Resource": "*" 
} 
] 
}

The following code is the admin policy:

{
    "Statement": [
        {
            "Action": [
                "quicksight:CreateAdmin"
            ],
            "Effect": "Allow",
            "Resource": [
                "*"
            ]
        }
    ],
    "Version": "2012-10-17"
}

Create IAM roles

You can configure email addresses for your users to use when provisioning through your IdP to QuickSight. To do this, add the sts:TagSession action to the trust relationship for the IAM role that you use with AssumeRoleWithSAML. Make sure the IAM role names start with ADFS-.

  1. On the IAM console, choose Roles in the navigation pane.
  2. Choose Create new role.
  3. For Trusted entity type, select SAML 2.0 federation.
  4. Choose the SAML IdP you created earlier.
  5. Select Allow programmatic and AWS Management Console access.
  6. Choose Next.
    Create IAM Roles
  7. Choose the admin policy you created, then choose Next.
  8. For Name, enter ADFS-ACCOUNTID-QSAdmin.
  9. Choose Create.
  10. On the Trust relationships tab, edit the trust relationships as follows so you can pass principal tags when users assume the role (provide your account ID and IdP):
{
    "Version": "2012-10-17",
    "Statement": [
        {
            "Effect": "Allow",
            "Principal": {
                "Federated": "arn:aws:iam::ACCOUNTID:saml-provider/Identity_Provider"
            },
            "Action":[ "sts:AssumeRoleWithSAML",
	 "sts:TagSession"],
            "Condition": {
                "StringEquals": {
                    "SAML:aud": "https://signin.aws.amazon.com/saml"
                },
                "StringLike": {
                    "aws:RequestTag/Email": "*"
                }
            }
            }
    ]
}
  1. Repeat this process for the role ADFS-ACCOUNTID-QSAuthor and attach the author IAM policy.
  2. Repeat this process for the role ADFS-ACCOUNTID-QSReader and attach the reader IAM policy.

Configure AD groups and users

Now you need to create AD groups that determine the permissions to sign in to AWS. Create an AD security group for each of the three roles you created earlier. Note that the group name should follow same format as your IAM role names.

One approach for creating the AD groups that uniquely identify the IAM role mapping is by selecting a common group naming convention. For example, your AD groups would start with an identifier, for example AWS-, which will distinguish your AWS groups from others within the organization. Next, include the 12-digit AWS account number. Finally, add the matching role name within the AWS account. You should do this for each role and corresponding AWS account you wish to support with federated access. The following screenshot shows an example of the naming convention we use in this post.

AD Groups

Later in this post, we create a rule to pick up AD groups starting with AWS-, the rule will remove AWS-ACCOUNTID- from AD groups name to match the respective IAM role, which is why we use this naming convention here.

Users in Active Directory can subsequently be added to the groups, providing the ability to assume access to the corresponding roles in AWS. You can add AD users to the respective groups based on your business permissions model. Note that each user must have an email address configured in Active Directory.

Create a relying party trust

To add a relying party trust, complete the following steps:

  1. Open the AD FS Management Console.
  2. Choose (right-click) Relying Party Trusts, then choose Add Relying Party Trust.
    Add Relying Party Trust
  3. Choose Claims aware, then choose Start.
  4. Select Import data about the relying party published online or on a local network.
  5. For Federation metadata address, enter https://signin.aws.amazon.com/static/saml-metadata.xml.
  6. Choose Next.
    ADFS Wizard Data Source
  7. Enter a descriptive display name, for example Amazon QuickSight Federation, then choose Next.
  8. Choose your access control policy (for this post, Permit everyone), then choose Next.
    ADFS Access Control
  9. In the Ready to Add Trust section, choose Next.
    ADFS Ready to Add
  10. Leave the defaults, then choose Close.

Configure claim rules

In this section, you create claim rules that identify accounts, set LDAP attributes, get the AD groups, and match them to the roles created earlier. Complete the following steps to create the claim rules for NameId, RoleSessionName, Get AD Groups, Roles, and (optionally) Session Duration:

  1. Select the relying party trust you just created, then choose Edit Claim Issuance Policy.
  2. Add a rule called NameId with the following parameters:
    1. For Claim rule template, choose Transform an Incoming Claim.
    2. For Claim rule name, enter NameId
    3. For Incoming claim type, choose Windows account name.
    4. For Outgoing claim type, choose Name ID.
    5. For Outgoing name ID format, choose Persistent Identifier.
    6. Select Pass through all claim values.
    7. Choose Finish.
      NameId
  3. Add a rule called RoleSessionName with the following parameters:
    1. For Claim rule template, choose Send LDAP Attributes as Claims.
    2. For Claim rule name, enter RoleSessionName.
    3. For Attribute store, choose Active Directory.
    4. For LDAP Attribute, choose E-Mail-Addresses.
    5. For Outgoing claim type, enter https://aws.amazon.com/SAML/Attributes/RoleSessionName.
    6. Add another E-Mail-Addresses LDAP attribute and for Outgoing claim type, enter https://aws.amazon.com/SAML/Attributes/PrincipalTag:Email.
    7. Choose OK.
      RoleSessionName
  4. Add a rule called Get AD Groups with the following parameters:
    1. For Claim rule template, choose Send Claims Using a Custom Rule.
    2. For Claim rule name, enter Get AD Groups
    3. For Custom Rule, enter the following code:
      c:[Type == "http://schemas.microsoft.com/ws/2008/06/identity/claims/windowsaccountname", Issuer == "AD AUTHORITY"] => add(store = "Active Directory", types = ("http://temp/variable"), query = ";tokenGroups;{0}", param = c.Value);

    4. Choose OK.
      Get AD Groups
  1. Add a rule called Roles with the following parameters:
    1. For Claim rule template, choose Send Claims Using a Custom Rule.
    2. For Claim rule name, enter Roles
    3. For Custom Rule, enter the following code (provide your account ID and IdP):
      c:[Type == "http://temp/variable", Value =~ "(?i)^AWS-ACCOUNTID"]=> issue(Type = "https://aws.amazon.com/SAML/Attributes/Role", Value = RegExReplace(c.Value, "AWS-ACCOUNTID-", "arn:aws:iam:: ACCOUNTID:saml-provider/your-identity-provider-name,arn:aws:iam:: ACCOUNTID:role/ADFS-ACCOUNTID-"));

    4. Choose Finish.Roles

Optionally, you can create a rule called Session Duration. This configuration determines how long a session is open and active before users are required to reauthenticate. The value is in seconds. For this post, we configure the rule for 8 hours.

  1. Add a rule called Session Duration with the following parameters:
    1. For Claim rule template, choose Send Claims Using a Custom Rule.
    2. For Claim rule name, enter Session Duration.
    3. For Custom Rule, enter the following code:
      => issue(Type = "https://aws.amazon.com/SAML/Attributes/SessionDuration", Value = "28800");

    4. Choose Finish.Session Duration

You should be able to see these five claim rules, as shown in the following screenshot.
All Claims Rules

  1. Choose OK.
  2. Run the following commands in PowerShell on your AD FS server:
Set-AdfsProperties -EnableIdPInitiatedSignonPage $true

Set-AdfsProperties -EnableRelayStateForIdpInitiatedSignOn $true
  1. Stop and start the AD FS service from PowerShell:
net stop adfssrv

net start adfssrv

Configure E-mail Syncing

With QuickSight Enterprise edition integrated with an IdP, you can restrict new users from using personal email addresses. This means users can only log in to QuickSight with their on-premises configured email addresses. This approach allows users to bypass manually entering an email address. It also ensures that users can’t use an email address that might differ from the email address configured in Active Directory.

QuickSight uses the preconfigured email addresses passed through the IdP when provisioning new users to your account. For example, you can make it so that only corporate-assigned email addresses are used when users are provisioned to your QuickSight account through your IdP. When you configure email syncing for federated users in QuickSight, users who log in to your QuickSight account for the first time have preassigned email addresses. These are used to register their accounts.

To configure E-mail syncing for federated users in QuickSight, complete the following steps:

  1. Log in to your QuickSight dashboard with a QuickSight administrator account.
  2. Choose the profile icon.
    QuickSight SSO
  3. On the drop-down menu, choose on Manage QuickSight.
  4. In the navigation pane, choose Single sign-on (SSO).
  5. For Email Syncing for Federated Users, select ON, then choose Enable in the pop-up window.
  6. Choose Save.SSO Configuration

Configure the relay state URL for QuickStart

To configure the relay state URL, complete the following steps (revise the input information as needed to match your environment’s configuration):

  1. Use the ADFS RelayState Generator to generate your URL.
  2. For IDP URL String, enter https://ADFSServerEndpoint/adfs/ls/idpinitiatedsignon.aspx.
  3. For Relying Party Identifier, enter urn:amazon:webservices or https://signin.aws.amazon.com/saml.
  4. For Relay State/Target App, enter your authenticated users to access. In this case, it’s https://quicksight.aws.amazon.com.
  5. Choose Generate URL.RelayState Generator
  6. Copy the URL and load it in your browser.

You should be presented with a login to your IdP landing page.

ADFS Logon Page

Make sure the user logging in has an email address attribute configured in Active Directory. A successful login should redirect you to the QuickSight dashboard after authentication. If you’re not redirected to the QuickSight dashboard page, make sure you ran the commands listed earlier after you configured your claim rules.

Summary

In this post, we demonstrated how to configure federated identities to a QuickSight dashboard and ensure that users can only sign in with preconfigured email address in your existing Active Directory.

We’d love to hear from you. Let us know what you think in the comments section.


About the Author

Adeleke Coker is a Global Solutions Architect with AWS. He helps customers globally accelerate workload deployments and migrations at scale to AWS. In his spare time, he enjoys learning, reading, gaming and watching sport events.

How Vanguard made their technology platform resilient and efficient by building cross-Region replication for Amazon Kinesis Data Streams

Post Syndicated from Raghu Boppanna original https://aws.amazon.com/blogs/big-data/how-vanguard-made-their-technology-platform-resilient-and-efficient-by-building-cross-region-replication-for-amazon-kinesis-data-streams/

This is a guest post co-written with Raghu Boppanna from Vanguard. 

At Vanguard, the Enterprise Advice line of business improves investor outcomes through digital access to superior, personalized, and affordable financial advice. They made it possible, in part, by driving economies of scale across the globe for investors with a highly resilient and efficient technical platform. Vanguard opted for a multi-Region architecture for this workload to help protect against impairments of Regional services. For high availability purposes, there is a need to make the data used by the workload available not just in the primary Region, but also in the secondary Region with minimal replication lag. In the event of a service impairment in the primary Region, the solution should be able to fail over to the secondary Region with as little data loss as possible and the ability to resume data ingestion.

Vanguard Cloud Technology Office and AWS partnered to build an infrastructure solution on AWS that met their resilience requirements. The multi-Region solution enables a robust fail-over mechanism, with built-in observability and recovery. The solution also supports streaming data from multiple sources to different Kinesis data streams. The solution is currently being rolled out to the different lines of business teams to improve the resilience posture of their workloads.

The use case discussed here requires Change Data Capture (CDC) to stream data from a remote data source (mainframe DB2) to Amazon Kinesis Data Streams, because the business capability depends on this data. Kinesis Data Streams is a fully managed, massively scalable, durable, and low-cost streaming service that can continuously capture and stream large amounts of data from multiple sources, and makes the data available for consumption within milliseconds. The service is built to be highly resilient and uses multiple Availability Zones to process and store data.

The solution discussed in this post explains how AWS and Vanguard innovated to build a resilient architecture to meet their high availability goals.

Solution overview

The solution uses AWS Lambda to replicate data from Kinesis data streams in the primary Region to a secondary Region. In the event of any service impairment impacting the CDC pipeline, the failover process promotes the secondary Region to primary for the producers and consumers. We use Amazon DynamoDB global tables for replication checkpoints that allows to resume data streaming from the checkpoint and also maintains a primary Region configuration flag that prevents an infinite replication loop of the same data back and forth.

The solution also provides the flexibility for Kinesis Data Streams consumers to use the primary or any secondary Region within the same AWS account.

The following diagram illustrates the reference architecture.

Let’s look at each component in detail:

  1. CDC processor (producer) – In this reference architecture, the producer is deployed on Amazon Elastic Compute Cloud (Amazon EC2) in both the primary and secondary Regions, and is active in the primary Region and on standby mode in the secondary Region. It captures CDC data from the external data source (like a DB2 database as shown in the architecture above), and streams to Kinesis Data Streams in the primary Region. Vanguard uses a 3rd party tool Qlik Replicate as their CDC Processor. It produces a well-formed payload including the DB2 commit timestamp to the Kinesis data stream, in addition to the actual row data from the remote data source. (example-stream-1 in this example). The following code is a sample payload containing only the primary key of the record that changed and the commit timestamp (for simplicity, the rest of the table row data is not shown below):
    {
        "eventSource": "aws:kinesis",
        "kinesis": 
        {
             "ApproximateArrivalTimestamp": "Mon July 18 20:00:00 UTC 2022",
             "SequenceNumber": "49544985256907370027570885864065577703022652638596431874",
             "PartitionKey": "12349999",
             "KinesisSchemaVersion": "1.0",
             "Data": "eyJLZXkiOiAxMjM0OTk5OSwiQ29tbWl0VGltZXN0YW1wIjogIjIwMjItMDctMThUMjA6MDA6MDAifQ=="
        },
        "eventId": "shardId-000000000000:49629136582982516722891309362785181370337771525377097730",
        "invokeIdentityArn": "arn:aws:iam::6243876582:role/kds-crr-LambdaRole-1GZWP67437SD",
        "eventName": "aws:kinesis:record",
        "eventVersion": "1.0",
        "eventSourceARN": "arn:aws:kinesis:us-east-1:6243876582:stream/kds-stream-1/consumer/kds-crr:6243876582",
        "awsRegion": "us-east-1"
    }

    The Base64 decoded value of Data is as follows. The actual Kinesis record would contain the entire row data of the table row that changed, in addition to the primary key and the commit timestamp.

    {"Key": 12349999,"CommitTimestamp": "2022-07-18T20:00:00"}

    The CommitTimestamp in the Data field is used in the replication checkpoint and is critical to accurately track how much of the stream data has been replicated to the secondary Region. The checkpoint can then be used to facilitate a CDC processor (producer) failover and accurately resume producing data from the replication checkpoint timestamp onwards.

    The alternative to using a remote data source CommitTimestamp (if unavailable) is to use the ApproximateArrivalTimestamp (which is the timestamp when the record is actually written to the data stream).

  2. Cross-Region replication Lambda function – The function is deployed to both primary and secondary Regions. It’s set up with an event source mapping to the data stream containing CDC data. The same function can be used to replicate data of multiple streams. It’s invoked with a batch of records from Kinesis Data Streams and replicates the batch to a target replication Region (which is provided via the Lambda configuration environment). For cost considerations, if the CDC data is actively produced into the primary Region only, the reserved concurrency of the function in the secondary Region can be set to zero, and modified during regional failover. The function has AWS Identity and Access Management (IAM) role permissions to do the following:
    • Read and write to the DynamoDB global tables used in this solution, within the same account.
    • Read and write to Kinesis Data Streams in both Regions within the same account.
    • Publish custom metrics to Amazon CloudWatch in both Regions within the same account.
  3. Replication checkpoint – The replication checkpoint uses the DynamoDB global table in both the primary and secondary Regions. It’s used by the cross-Region replication Lambda function to persist the commit timestamp of the last replication record as the replication checkpoint for every stream that is configured for replication. For this post, we create and use a global table called kdsReplicationCheckpoint.
  4. Active Region config – The active Region uses the DynamoDB global table in both primary and secondary Regions. It uses the native cross-Region replication capability of the global table to replicate the configuration. It’s pre-populated with data about which is the primary Region for a stream, to prevent replication back to the primary Region by the Lambda function in the standby Region. This configuration may not be required if the Lambda function in the standby Region has a reserved concurrency set to zero, but can serve as a safety check to avoid infinite replication loop of the data. For this post, we create a global table called kdsActiveRegionConfig and put an item with the following data:
    {
     "stream-name": "example-stream-1",
     "active-region" : "us-east-1"
    }
    
  5. Kinesis Data Streams – The stream to which the CDC processor produces the data. For this post, we use a stream called example-stream-1 in both the Regions, with the same shard configuration and access policies.

Sequence of steps in cross-Region replication

Let’s briefly look at how the architecture is exercised using the following sequence diagram.

The sequence consists of the following steps:

  1. The CDC processor (in us-east-1) reads the CDC data from the remote data source.
  2. The CDC processor (in us-east-1) streams the CDC data to Kinesis Data Streams (in us-east-1).
  3. The cross-Region replication Lambda function (in us-east-1) consumes the data from the data stream (in us-east-1). The enhanced fan-out pattern is recommended for dedicated and increased throughput for cross-Region replication.
  4. The replicator Lambda function (in us-east-1) validates its current Region with the active Region configuration for the stream being consumed, with the help of the kdsActiveRegionConfig DynamoDB global tableThe following sample code (in Java) can help illustrate the condition being evaluated:
    // Fetch the current AWS Region from the Lambda function’s environment
    String currentAWSRegion = System.getenv(“AWS_REGION”);
    // Read the stream name from the first Kinesis Record once for the entire batch being processed. This is done because we are reusing the same Lambda function for replicating multiple streams.
    String currentStreamNameConsumed = kinesisRecord.getEventSourceARN().split(“:”)[5].split(“/”)[1];
    // Build the DynamoDB query condition using the stream name
    Map<String, Condition> keyConditions = singletonMap(“streamName”, Condition.builder().comparisonOperator(EQ).attributeValueList(AttributeValue.builder().s(currentStreamNameConsumed).build()).build());
    // Query the DynamoDB Global Table
    QueryResponse queryResponse = ddbClient.query(QueryRequest.builder().tableName("kdsActiveRegionConfig").keyConditions(keyConditions).attributesToGet(“ActiveRegion”).build());
  5. The function evaluates the response from DynamoDB with the following code:
    // Evaluate the response
    if (queryResponse.hasItems()) {
           AttributeValue activeRegionForStream = queryResponse.items().get(0).get(“ActiveRegion”);
           return currentAWSRegion.equalsIgnoreCase(activeRegionForStream.s());
    }
  6. Depending on the response, the function takes the following actions:
    1. If the response is true, the replicator function produces the records to Kinesis Data Streams in us-east-2 in a sequential manner.
      • If there is a failure, the sequence number of the record is tracked and the iteration is broken. The function returns the list of failed sequence numbers. By returning the failed sequence number, the solution uses the feature of Lambda checkpointing to be able to resume processing of a batch of records with partial failures. This is useful when handling any service impairments, where the function tries to replicate the data across Regions to ensure stream parity and no data loss.
      • If there are no failures, an empty list is returned, which indicates the batch was successful.
    2. If the response is false, the replicator function returns without performing any replication. To reduce the cost of the Lambda invocations, you can set the reserved concurrency of the function in the DR Region (us-east-2) to zero. This will prevent the function from being invoked. When you failover, you can update this value to an appropriate number based on the CDC throughput and set the reserved concurrency of the function in us-east-1 to zero to prevent it from executing unnecessarily.
  7. After all the records are produced to Kinesis Data Streams in us-east-2, the replicator function checkpoints to the kdsReplicationCheckpoint DynamoDB global table (in us-east-1) with the following data:
    { "streamName": "example-stream-1", "lastReplicatedTimestamp": "2022-07-18T20:00:00" }
    
  8. The function returns after successfully processing the batch of records.

Performance considerations

The performance expectations of the solution should be understood with respect to the following factors:

  • Region selection – The replication latency is directly proportional to the distance being traveled by the data, so understand your Region selection
  • Velocity – The incoming velocity of the data or the volume of data being replicated
  • Payload size – The size of the payload being replicated

Monitor the Cross-Region replication

It’s recommended to track and observe the replication as it happens. You can tailor the Lambda function to publish custom metrics to CloudWatch with the following metrics at the end of every invocation. Publishing these metrics to both the primary and secondary Regions helps protect yourself from impairments affecting observability in the primary Region.

  • Throughput – The current Lambda invocation batch size
  • ReplicationLagSeconds – The difference between the current timestamp (after processing all the records) and the ApproximateArrivalTimestamp of the last record that was replicated

The following example CloudWatch metric graph shows the average replication lag was 2 seconds with a throughput of 100 records replicated from us-east-1 to us-east-2.

Common failover strategy

During any impairments impacting the CDC pipeline in the primary Region, business continuity or disaster recovery needs may dictate a pipeline failover to the secondary (standby) Region. This means a couple of things need to be done as part of this failover process:

  • If possible, stop all the CDC tasks in the CDC processor tool in us-east-1.
  • The CDC processor must be failed over to the secondary Region, so that it can read the CDC data from the remote data source while operating out of the standby Region.
  • The kdsActiveRegionConfig DynamoDB global table needs to be updated. For instance, for the stream example-stream-1 used in our example, the active Region is changed to us-east-2:
{
"stream-name": "example-stream-1",
"active-Region" : "us-east-2"
}
  • All the stream checkpoints need to be read from the kdsReplicationCheckpoint DynamoDB global table (in us-east-2), and the timestamps from each of the checkpoints are used to start the CDC tasks in the producer tool in us-east-2 Region. This minimizes the chances of data loss and accurately resumes streaming the CDC data from the remote data source from the checkpoint timestamp onwards.
  • If using reserved concurrency to control Lambda invocations, set the value to zero in the primary Region(us-east-1) and to a suitable non-zero value in the secondary Region(us-east-2).

Vanguard’s multi-step failover strategy

Some of the third-party tools that Vanguard uses have a two-step CDC process of streaming data from a remote data source to a destination. Vanguard’s tool of choice for their CDC processor follows this two-step approach:

  1. The first step involves setting up a log stream task that reads the data from the remote data source and persists in a staging location.
  2. The second step involves setting up individual consumer tasks that read data from the staging location—which could be on Amazon Elastic File System (Amazon EFS) or Amazon FSx, for example—and stream it to the destination. The flexibility here is that each of these consumer tasks can be triggered to stream from different commit timestamps. The log stream task usually starts reading data from the minimum of all the commit timestamps used by the consumer tasks.

Let’s look at an example to explain the scenario:

  • Consumer task A is streaming data from a commit timestamp 2022-07-19T20:00:00 onwards to example-stream-1.
  • Consumer task B is streaming data from a commit timestamp 2022-07-19T21:00:00 onwards to example-stream-2.
  • In this situation, the log stream should read data from the remote data source from the minimum of the timestamps used by the consumer tasks, which is 2022-07-19T20:00:00.

The following sequence diagram demonstrates the exact steps to run during a failover to us-east-2 (the standby Region).

The steps are as follows:

  1. The failover process is triggered in the standby Region (us-east-2 in this example) when required. Note that the trigger can be automated using comprehensive health checks of the pipeline in the primary Region.
  2. The failover process updates the kdsActiveRegionConfig DynamoDB global table with the new value for the Region as us-east-2 for all the stream names.
  3. The next step is to fetch all the stream checkpoints from the kdsReplicationCheckpoint DynamoDB global table (in us-east-2).
  4. After the checkpoint information is read, the failover process finds the minimum of all the lastReplicatedTimestamp.
  5. The log stream task in the CDC processor tool is started in us-east-2 with the timestamp found in Step 4. It begins reading CDC data from the remote data source from this timestamp onwards and persists them in the staging location on AWS.
  6. The next step is to start all the consumer tasks to read data from the staging location and stream to the destination data stream. This is where each consumer task is supplied with the appropriate timestamp from the kdsReplicationCheckpoint table according to the streamName to which the task streams the data.

After all the consumer tasks are started, data is produced to the Kinesis data streams in us-east-2. From there on, the process of cross-Region replication is the same as described earlier – the replication Lambda function in us-east-2 starts replicating data to the data stream in us-east-1.

The consumer applications reading data from the streams are expected to be idempotent to be able to handle duplicates. Duplicates can be introduced in the stream due to many reasons, some of which are called out below.

  • The Producer or the CDC Processor introduces duplicates into the stream while replaying the CDC data during a failover
  • DynamoDB Global Table uses asynchronous replication of data across Regions and if the kdsReplicationCheckpoint table data has a replication lag, the failover process may potentially use an older checkpoint timestamp to replay the CDC data.

Also, consumer applications should checkpoint the CommitTimestamp of the last record that was consumed. This is to facilitate better monitoring and recovery.

Path to maturity: Automated recovery

The ideal state is to fully automate the failover process, reducing time to recover and meeting the resilience Service Level Objective (SLO). However, in most organizations, the decision to fail over, fail back, and trigger the failover requires manual intervention in assessing the situation and deciding the outcome. Creating scripted automation to perform the failover that can be run by a human is a good place to start.

Vanguard has automated all of the steps of failover, but still have humans make the decision on when to invoke it. You can customize the solution to meet your needs and depending on the CDC processor tool you use in your environment.

Conclusion

In this post, we described how Vanguard innovated and built a solution for replicating data across Regions in Kinesis Data Streams to make the data highly available. We also demonstrated a robust checkpoint strategy to facilitate a Regional failover of the replication process when needed. The solution also illustrated how to use DynamoDB global tables for tracking the replication checkpoints and configuration. With this architecture, Vanguard was able to deploy workloads depending on the CDC data to multiple Regions to meet business needs of high availability in the face of service impairments impacting CDC pipelines in the primary Region.

If you have any feedback please leave a comment in the Comments section below.


About the authors

Raghu Boppanna works as an Enterprise Architect at Vanguard’s Chief Technology Office. Raghu specializes in Data Analytics, Data Migration/Replication including CDC Pipelines, Disaster Recovery and Databases. He has earned several AWS Certifications including AWS Certified Security – Specialty & AWS Certified Data Analytics – Specialty.

Parameswaran V Vaidyanathan is a Senior Cloud Resilience Architect with Amazon Web Services. He helps large enterprises achieve the business goals by architecting and building scalable and resilient solutions on the AWS Cloud.

Richa Kaul is a Senior Leader in Customer Solutions serving Financial Services customers. She is based out of New York. She has extensive experience in large scale cloud transformation, employee excellence, and next generation digital solutions. She and her team focus on optimizing value of cloud by building performant, resilient and agile solutions. Richa enjoys multi sports like triathlons, music, and learning about new technologies.

Mithil Prasad is a Principal Customer Solutions Manager with Amazon Web Services. In his role, Mithil works with Customers to drive cloud value realization, provide thought leadership to help businesses achieve speed, agility, and innovation.

Control access to Amazon OpenSearch Service Dashboards with attribute-based role mappings

Post Syndicated from Stefan Appel original https://aws.amazon.com/blogs/big-data/control-access-to-amazon-opensearch-service-dashboards-with-attribute-based-role-mappings/

Federated users of Amazon OpenSearch Service often need access to OpenSearch Dashboards with roles based on their user profiles. OpenSearch Service fine-grained access control maps authenticated users to OpenSearch Search roles and then evaluates permissions to determine how to handle the user’s actions. However, when an enterprise-wide identity provider (IdP) manages the users, the mapping of users to OpenSearch Service roles often needs to happen dynamically based on IdP user attributes. One option to map users is to use OpenSearch Service SAML integration and pass user group information to OpenSearch Service. Another option is Amazon Cognito role-based access control, which supports rule-based or token-based mappings. But neither approach supports arbitrary role mapping logic. For example, when you need to interpret multivalued user attributes to identify a target role.

This post shows how you can implement custom role mappings with an Amazon Cognito pre-token generation AWS Lambda trigger. For our example, we use a multivalued attribute provided over OpenID Connect (OIDC) to Amazon Cognito. We show how you are in full control of the mapping logic and process of such a multivalued attribute for AWS Identity and Access Management (IAM) role lookups. Our approach is generic for OIDC-compatible IdPs. To make this post self-contained, we use the Okta IdP as an example to walk through the setup.

Overview of solution

The provided solution intercepts the OICD-based login process to OpenSearch Dashboards with a pre-token generation Lambda function. The login to OpenSearch Dashboards with a third-party IdP and Amazon Cognito as an intermediary consists of several steps:

  1. First, the initial user request to OpenSearch Dashboard is redirected to Amazon Cognito.
  2. Amazon Cognito redirects the request to the IdP for authentication.
  3. After the user authenticates, the IdP sends the identity token (ID token) back to Amazon Cognito.
  4. Amazon Cognito invokes a Lambda function that modifies the obtained token. We use an Amazon DynamoDB table to perform role mapping lookups. The modified token now contains the IAM role mapping information.
  5. Amazon Cognito uses this role mapping information to map the user to the specified IAM role and provides the role credentials.
  6. OpenSearch Service maps the IAM role credentials to OpenSearch roles and applies fine-grained permission checks.

The following architecture outlines the login flow from a user’s perspective.

Scope of solution

On the backend, OpenSearch Dashboards integrates with an Amazon Cognito user pool and an Amazon Cognito identity pool during the authentication flow. The steps are as follows:

  1. Authenticate and get tokens.
  2. Look up the token attribute and IAM role mapping and overwrite the Amazon Cognito attribute.
  3. Exchange tokens for AWS credentials used by OpenSearch dashboards.

The following architecture shows this backend perspective to the authentication process.

Backend authentication flow

In the remainder of this post, we walk through the configurations necessary for an authentication flow in which a Lambda function implements custom role mapping logic. We provide sample Lambda code for the mapping of multivalued OIDC attributes to IAM roles based on a DynamoDB lookup table with the following structure.

OIDC Attribute Value IAM Role
["attribute_a","attribute_b"] arn:aws:iam::<aws-account-id>:role/<role-name-01>
["attribute_a","attribute_x"] arn:aws:iam::<aws-account-id>:role/<role-name-02>

The high-level steps of the solution presented in this post are as follows:

  1. Configure Amazon Cognito authentication for OpenSearch Dashboards.
  2. Add IAM roles for mappings to OpenSearch Service roles.
  3. Configure the Okta IdP.
  4. Add a third-party OIDC IdP to the Amazon Cognito user pool.
  5. Map IAM roles to OpenSearch Service roles.
  6. Create the DynamoDB attribute-role mapping table.
  7. Deploy and configure the pre-token generation Lambda function.
  8. Configure the pre-token generation Lambda trigger.
  9. Test the login to OpenSearch Dashboards.

Prerequisites

For this walkthrough, you should have the following prerequisites:

  • An AWS account with an OpenSearch Service domain.
  • A third-party IdP that supports OpenID Connect and adds a multivalued attribute in the authorization token. For this post, we use attributes_array as this attribute’s name and Okta as an IdP provider. You can create an Okta Developer Edition free account to test the setup.

Configure Amazon Cognito authentication for OpenSearch Dashboards

The modification of authentication tokens requires you to configure the OpenSearch Service domain to use Amazon Cognito for authentication. For instructions, refer to Configuring Amazon Cognito authentication for OpenSearch Dashboards.

The Lambda function implements custom role mappings by setting the cognito:preferred_role claim (for more information, refer to Role-based access control). For the correct interpretation of this claim, set the Amazon Cognito identity pool to Choose role from token. The Amazon Cognito identity pool then uses the value of the cognito:preferred_role claim to select the correct IAM role. The following screenshot shows the required settings in the Amazon Cognito identity pool that is created during the configuration of Amazon Cognito authentication for OpenSearch Service.

Cognito role mapping configuration

Add IAM roles for mappings to OpenSearch roles

IAM roles used for mappings to OpenSearch roles require a trust policy so that authenticated users can assume them. The trust policy needs to reference the Amazon Cognito identity pool created during the configuration of Amazon Cognito authentication for OpenSearch Service. Create at least one IAM role with a custom trust policy. For instructions, refer to Creating a role using custom trust policies. The IAM role doesn’t require the attachment of a permission policy. For a sample trust policy, refer to Role-based access control.

Configure the Okta IdP

In this section, we describe the configuration steps to include a multivalued attribute_array attribute in the token provided by Okta. For more information, refer to Customize tokens returned from Okta with custom claims. We use the Okta UI to perform the configurations. Okta also provides an API that you can use to script and automate the setup.

The first step is adding the attributes_array attribute to the Okta user profile.

  1. Use Okta’s Profile Editor under Directory, Profile Editor.
  2. Select User (default) and then choose Add Attribute.
  3. Add an attribute with a display name and variable name attributes_array of type string array.

The following screenshot shows the Okta default user profile after the custom attribute has been added.

Okta user profile editor

  1. Next, add attributes_array attribute values to users using Okta’s user management interface under Directory, People.
  2. Select a user and choose Profile.
  3. Choose Edit and enter attribute values.

The following screenshot shows an example of attributes_array attribute values within a user profile.

Okta user attributes array

The next step is adding the attributes_array attribute to the ID token that is generated during the authentication process.

  1. On the Okta console, choose Security, API and select the default authorization server.
  2. Choose Claims and choose Add Claim to add the attributes_array attribute as part of the ID token.
  3. As the scope, enter openid and as the attribute value, enter user.attributes_array.

This references the previously created attribute in a user’s profile.

Add claim to ID token

  1. Next, create an application for the federation with Amazon Cognito. For instructions, refer to How do I set up Okta as an OpenID Connect identity provider in an Amazon Cognito user pool.

The last step assigns the Okta application to Okta users.

  1. Navigate to Directory, People, select a user, and choose Assign Applications.
  2. Select the application you created in the previous step.

Add a third-party OIDC IdP to the Amazon Cognito user pool

We are implementing the role mapping based on the information provided in a multivalued OIDC attribute. The authentication token needs to include this attribute. If you followed the previously described Okta configuration, the attribute is automatically added to the ID token of a user. If you used another IdP, you might have to request the attribute explicitly. For this, add the attribute name to the Authorized scopes list of the IdP in Amazon Cognito.

For instructions on how to set up the federation between a third-party IdP and an Amazon Cognito user pool and how to request additional attributes, refer to Adding OIDC identity providers to a user pool. For a detailed walkthrough for Okta, refer to How do I set up Okta as an OpenID Connect identity provider in an Amazon Cognito user pool.

After requesting the token via OIDC, you need to map the attribute to an Amazon Cognito user pool attribute. For instructions, refer to Specifying identity provider attribute mappings for your user pool. The following screenshot shows the resulting configuration on the Amazon Cognito console.

Amazon Cognito user pool attribute mapping

Map IAM roles to OpenSearch Service roles

Upon login, OpenSearch Service maps users to an OpenSearch Service role based on the IAM role ARN set in the cognito:preferred_role claim by the pre-token generation Lambda trigger. This requires a role mapping in OpenSearch Service. To add such role mappings to IAM backend roles, refer to Mapping roles to users. The following screenshot shows a role mapping on the OpenSearch Dashboards console.

Amazon OpenSearch Service role mappings

Create the attribute-role mapping table

For this solution, we use DynamoDB to store mappings of users to IAM roles. For instructions, refer to Create a table and define a partition key named Key of type String. You need the table name in the subsequent step to configure the Lambda function.

The next step is writing the mapping information into the table. A mapping entry consists of the following attributes:

  • Key – A string that contains attribute values in comma-separated alphabetical order
  • RoleArn – A string with the IAM role ARN to which the attribute value combination should be mapped

For details on how to add data to a DynamoDB table, refer to Write data to a table using the console or AWS CLI.

For example, if the previously configured OIDC attribute attributes_array contains three values, attribute_a, attribute_b, and attribute_c, the entry in the mapping table looks like table line 1 in the following screenshot.

Amazon DynamoDB table with attribute-role mappings

Deploy and configure the pre-token generation Lambda function

A Lambda function implements the custom role mapping logic. The Lambda function receives an Amazon Cognito event as input and extracts attribute information out of it. It uses the attribute information for a lookup in a DynamoDB table and retrieves the value for cognito:preferred_role. Follow the steps in Getting started with Lambda to create a Node.js Lambda function and insert the following source code:

const AWS = require("aws-sdk");
const tableName = process.env.TABLE_NAME;
const unauthorizedRoleArn = process.env.UNAUTHORIZED_ROLE;
const userAttributeArrayName = process.env.USER_POOL_ATTRIBUTE;
const dynamodbClient = new AWS.DynamoDB({apiVersion: "2012-08-10"});
exports.lambdaHandler = handlePreTokenGenerationEvent

async function handlePreTokenGenerationEvent (event, context) {
    var sortedAttributeList = getSortedAttributeList(event);
    var lookupKey = sortedAttributeList.join(',');
    var roleArn = await lookupIAMRoleArn(lookupKey);
    appendResponseWithPreferredRole(event, roleArn);
    return event;
}

function getSortedAttributeList(event) {
    return JSON.parse(event['request']['userAttributes'][userAttributeArrayName]).sort();
}

async function lookupIAMRoleArn(key) {
    var params = {
        TableName: tableName,
        Key: {
          'Key': {S: key}
        },
        ProjectionExpression: 'RoleArn'
      };
    try {
        let item = await dynamodbClient.getItem(params).promise();
        return item['Item']['RoleArn']['S'];
    } catch (e){
        console.log(e);
        return unauthorizedRoleArn; 
    }
}

function appendResponseWithPreferredRole(event, roleArn){
    event.response = {
        'claimsOverrideDetails': {
            'groupOverrideDetails': {
                'preferredRole': roleArn
            }
        }
    };
}

The Lambda function expects three environment variables. Refer to Using AWS Lambda environment variables for instructions to add the following entries:

  • TABLE_NAME – The name of the previously created DynamoDB table. This table is used for the lookups.
  • UNAUTHORIZED_ROLE – The ARN of the IAM role that is used when no mapping is found in the lookup table.
  • USER_POOL_ATTRIBUTE – The Amazon Cognito user pool attribute used for the IAM role lookup. In our example, this attribute is named custom:attributes_array.

The following screenshot shows the final configuration.

AWS Lamba function configuration

The Lambda function needs permissions to access the DynamoDB lookup table. Set permissions as follows: attach the following policy to the Lambda execution role (for instructions, refer to Lambda execution role) and provide the Region, AWS account number, and DynamoDB table name:

{
    "Statement": [
        {
            "Action": [
                "dynamodb:GetItem",
                "dynamodb:Scan",
                "dynamodb:Query",
                "dynamodb:BatchGetItem",
                "dynamodb:DescribeTable"
            ],
            "Resource": [
                "arn:aws:dynamodb:<region>:<accountid>:table/<table>",
                "arn:aws:dynamodb:<region>:<accountid>:table/<table>/index/*"
            ],
            "Effect": "Allow"
        }
    ]
}

The configuration of the Lambda function is now complete.

Configure the pre-token generation Lambda trigger

As final step, add a pre-token generation trigger to the Amazon Cognito user pool and reference the newly created Lambda function. For details, refer to Customizing user pool workflows with Lambda triggers. The following screenshot shows the configuration.

Amazon Cognito pre-token generation trigger configuration

This step completes the setup; Amazon Cognito now maps users to OpenSearch Service roles based on the values provided in an OIDC attribute.

Test the login to OpenSearch Dashboards

The following diagram shows an exemplary login flow and the corresponding screenshots for an Okta user user1 with a user profile attribute attribute_array and value: ["attribute_a", "attribute_b", "attribute_c"].

Testing of solution

Clean up

To avoid incurring future charges, delete the OpenSearch Service domain, Amazon Cognito user pool and identity pool, Lambda function, and DynamoDB table created as part of this post.

Conclusion

In this post, we demonstrated how to set up a custom mapping to OpenSearch Service roles using values provided via an OIDC attribute. We dynamically set the cognito:preferred_role claim using an Amazon Cognito pre-token generation Lambda trigger and a DynamoDB table for lookup. The solution is capable of handling dynamic multivalued user attributes, but you can extend it with further application logic that goes beyond a simple lookup. The steps in this post are a proof of concept. If you plan to develop this into a productive solution, we recommend implementing Okta and AWS security best practices.

The post highlights just one use case of how you can use Amazon Cognito support for Lambda triggers to implement custom authentication needs. If you’re interested in further details, refer to How to Use Cognito Pre-Token Generation trigger to Customize Claims In ID Tokens.


About the Authors

Portrait StefanStefan Appel is a Senior Solutions Architect at AWS. For 10+ years, he supports enterprise customers adopt cloud technologies. Before joining AWS, Stefan held positions in software architecture, product management, and IT operations departments. He began his career in research on event-based systems. In his spare time, he enjoys hiking and has walked the length of New Zealand following Te Araroa.

Portrait ModoodModood Alvi is Senior Solutions Architect at Amazon Web Services (AWS). Modood is passionate about digital transformation and is committed helping large enterprise customers across the globe accelerate their adoption of and migration to the cloud. Modood brings more than a decade of experience in software development, having held various technical roles within companies like SAP and Porsche Digital. Modood earned his Diploma in Computer Science from the University of Stuttgart.

How Ruparupa gained updated insights with an Amazon S3 data lake, AWS Glue, Apache Hudi, and Amazon QuickSight

Post Syndicated from Adrianus Kurnadi original https://aws.amazon.com/blogs/big-data/how-ruparupa-gained-updated-insights-with-an-amazon-s3-data-lake-aws-glue-apache-hudi-and-amazon-quicksight/

This post is co-written with Olivia Michele and Dariswan Janweri P. at Ruparupa.

Ruparupa was built by PT. Omni Digitama Internusa with the vision to cultivate synergy and create a seamless digital ecosystem within Kawan Lama Group that touches and enhances the lives of many.

Ruparupa is the first digital platform built by Kawan Lama Group to give the best shopping experience for household, furniture, and lifestyle needs. Ruparupa’s goal is to help you live a better life, shown by the meaning of the word ruparupa, which means “everything.” We believe that everyone deserves the best, and home is where everything starts.

In this post, we show how Ruparupa implemented an incrementally updated data lake to get insights into their business using Amazon Simple Storage Service (Amazon S3), AWS Glue, Apache Hudi, and Amazon QuickSight. We also discuss the benefits Ruparupa gained after the implementation.

The data lake implemented by Ruparupa uses Amazon S3 as the storage platform, AWS Database Migration Service (AWS DMS) as the ingestion tool, AWS Glue as the ETL (extract, transform, and load) tool, and QuickSight for analytic dashboards.

Amazon S3 is an object storage service with very high scalability, durability, and security, which makes it an ideal storage layer for a data lake. AWS DMS is a database migration tool that supports many relational database management services, and also supports Amazon S3.

An AWS Glue ETL job, using the Apache Hudi connector, updates the S3 data lake hourly with incremental data. The AWS Glue job can transform the raw data in Amazon S3 to Parquet format, which is optimized for analytic queries. The AWS Glue Data Catalog stores the metadata, and Amazon Athena (a serverless query engine) is used to query data in Amazon S3.

AWS Secrets Manager is an AWS service that can be used to store sensitive data, enabling users to keep data such as database credentials out of source code. In this implementation, Secrets Manager is used to store the configuration of the Apache Hudi job for various tables.

Data analytic challenges

As an ecommerce company, Ruparupa produces a lot of data from their ecommerce website, their inventory systems, and distribution and finance applications. The data can be structured data from existing systems, and can also be unstructured or semi-structured data from their customer interactions. This data contains insights that, if unlocked, can help management make decisions to help increase sales and optimize cost.

Before implementing a data lake on AWS, Ruparupa had no infrastructure capable of processing the volume and variety of data formats in a short time. Data had to be manually processed by data analysts, and data mining took a long time. Because of the fast growth of data, it took 1–1.5 hours just to ingest data, which was hundreds of thousands of rows.

The manual process caused inconsistent data cleansing. After the data had been cleansed, some processes were often missing, and all the data had to go through another process of data cleansing.

This long processing time reduced the analytic team’s productivity. The analytic team could only produce weekly and monthly reports. This delay in report frequency impacted delivering important insights to management, and they couldn’t move fast enough to anticipate changes in their business.

The method used to create analytic dashboards was manual and could only produce a few routine reports. The audience of these few reports was limited—a maximum of 20 people from management. Other business units in Kawan Lama Group only consumed weekly reports that were prepared manually. Even the weekly reports couldn’t cover all important metrics, because some metrics were only available in monthly reports.

Initial solution for a real-time dashboard

The following diagram illustrates the initial solution Ruparupa implemented.

Initial solution architecture

Ruparupa started a data initiative within the organization to create a single source of truth within the company. Previously, business users could only get the sales data from the day before, and they didn’t have any visibility to current sales activities in their stores and websites.

To gain trust from business users, we wanted to provide the most updated data in an interactive QuickSight dashboard. We used an AWS DMS replication task to stream real-time change data capture (CDC) updates to an Amazon Aurora MySQL-Compatible Edition database, and built a QuickSight dashboard to replace the static presentation deck.

This pilot dashboard was accepted extremely well by the users, who now had visibility to their current data. However, the data source for the dashboard still resided in an Aurora MySQL database and only covered a single data domain.

The initial design had some additional challenges:

  • Diverse data source – The data source in an ecommerce platform consists of structured, semi-structured, and unstructured data, which requires flexible data storage. The initial data warehouse design in Ruparupa only stored transactional data, and data from other systems including user interaction data wasn’t consolidated yet.
  • Cost and scalability – Ruparupa wanted to build a future-proof data platform solution that could scale up to terabytes of data in the most cost-effective way.

The initial design also had some benefits:

  • Data updates – Data inside the initial data warehouse was delayed by 1 day. This was an improvement over the weekly report, but still not fast enough to make quicker decisions.

This solution only served as a temporary solution; we needed a more complete analytics solution that could serve more complex and larger data sources, faster, and cost-effectively.

Real-time data lake solution

To fulfill their requirements, Ruparupa introduced a mutable data lake, as shown in the following diagram.

Real time data lake solutions architecture

Let’s look at each main component in more detail.

AWS DMS CDC process

To get the real-time data from the source, we streamed the database CDC log using AWS DMS (component 1 in the architecture diagram). The CDC records consist of all inserts, updates, and deletes from the source database. This raw data is stored in the raw layer of the S3 data lake.

An S3 lifecycle policy is used to manage data retention, where the older data is moved to Amazon S3 Glacier.

AWS Glue ETL job

The second S3 data lake layer is the transformed layer, where the data is transformed to an optimized format that is ready for user query. The files are transformed to Parquet columnar format with snappy compression and table partitioning to optimize SQL queries from Athena.

In order to create a mutable data lake that can merge changes from the data source, we introduced an Apache Hudi data lake framework. With Apache Hudi, we can perform upserts and deletes on the transformed layer to keep the data consistent in a reliable manner. With a Hudi data lake, Ruparupa can create a single source of truth for all our data sources quickly and easily. The Hudi framework takes care of the underlying metadata of the updates, making it simple to implement across hundreds of tables in the data lake. We only need to configure the writer output to create a copy-on-write table depending on the access requirements. For the writer, we use an AWS Glue job writer combined with an AWS Glue Hudi connector frrom AWS Marketplace. The additional library from the connector helps AWS Glue understand how to write to Hudi.

An AWS Glue ETL job is used to get the changes from the raw layer and merge the changes in the transformed layer (component 2 in the architecture diagram). With AWS Glue, we are able to create a PySpark job to get the data, and we use the AWS Glue Connector for Apache Hudi to simplify the Hudi library import to the AWS Glue job. With AWS Glue, all the changes from AWS DMS can be merged easily to the Hudi data lake. The jobs are scheduled every hour using a built-in scheduler in AWS Glue.

Secrets Manager is used to store all the related parameters that are required to run the job. Instead of making one transformation job for each table, Ruparupa creates a single generic job that can transform multiple tables by using several parameters. The parameters that give details about the table structure are stored in Secrets Manager and can be retrieved using the name of the table as key. With these custom parameters, Ruparupa doesn’t need to create a job for every table—we can utilize a single job that can ingest the data for all different tables by passing the name of the table to the job.

All the metadata of the tables is stored in the AWS Glue Data Catalog, including the Hudi tables. This catalog is used by the AWS Glue ETL job, Athena query engine, and QuickSight dashboard.

Athena queries

Users can then query the latest data for their report using Athena (component 3 in the architecture diagram). Athena is serverless, so there is no infrastructure to provision or maintain. We can immediately use SQL to query the data lake to create a report or ingest the data to the dashboard.

QuickSight dashboard

Business users can use a QuickSight dashboard to query the data lake (component 4 in the architecture diagram). The existing dashboard is modified to get data from Athena, replacing the previous database. New dashboards were also created to fulfill continuously evolving needs for insights from multiple business units.

QuickSight is also used to notify certain parties when a value is reaching a certain threshold. An email alert is sent to an external notification and messaging platform so it can reach the end-user.

Business results

The data lake implementation in Ruparupa took around 3 months, with an additional month for data validation, before it was considered ready for production. With this solution, management can get the latest information view of their current state up to the last 1 hour. Previously, they could only generate weekly reports—now insights are available 168 times faster.

The QuickSight dashboard, which can be updated automatically, shortens the time required by the analytic team. The QuickSight dashboard now has more content—not only is transactional data reported, but also other metrics like new SKU, operation escalation for free services to customers, and monitoring SLA. Since April 2021 when Ruparupa started their QuickSight pilot, the number of dashboards has increased to around 70 based on requests from business users.

Ruparupa has hired new personnel to join the data analytic team to explore new possibilities and new use cases. The analytic team has grown from just one person to seven to handle new analytic use cases:

  • Merchandising
  • Operations
  • Store manager performance measurement
  • Insights of trending SKUs

Kawan Lama Group also has offline stores besides the ecommerce platform managed by Ruparupa. With the new dashboard, it’s easier to compare transaction data from online and offline stores because they now use the same platform.

The new dashboards also can be consumed by a broader audience, including other business units in Kawan Lama Group. The total users consuming the dashboard increased from just 20 users from management to around 180 users (9 times increase).

Since the implementation, other business units in Kawan Lama Group have increased their trust in the S3 data lake platform implemented by Ruparupa, because the data is more up to date and they can drill down to the SKU level to validate that the data is correct. Other business units can now act faster after an event like a marketing campaign. This data lake implementation has helped increase sales revenue in various business units in Kawan Lama Group.

Conclusion

Implementing a real-time data lake using Amazon S3, Apache Hudi, AWS Glue, Athena, and QuickSight gave Ruparupa the following benefits:

  • Yielded faster insights (hourly compared to weekly)
  • Unlocked new insights
  • Enabled more people in more business units to consume the dashboard
  • Helped business units in Kawan Lama Group act faster and increase sales revenue

If you’re interested in gaining similar benefits, check out Build a Data Lake Foundation with AWS Glue and Amazon S3.

You can also learn how to get started with QuickSight in the Getting Started guide.

Last but not least, you can learn about running Apache Hudi on AWS Glue in Writing to Apache Hudi tables using AWS Glue Custom Connector.


About the Authors

Olivia Michele is a Data Scientist Lead at Ruparupa, where she has worked in a variety of data roles over the past 5 years, including building and integrating Ruparupa data systems with AWS to improve user experience with data and reporting tools. She is passionate about turning raw information into valuable actionable insights and delivering value to the company.

Dariswan Janweri P. is a Data Engineer at Ruparupa. He considers challenges or problems as interesting riddles and finds satisfaction in solving them, and even more satisfaction by being able to help his colleagues and friends, “two birds one stone.” He is excited to be a major player in Indonesia’s technology transformation.

Adrianus Budiardjo Kurnadi is a Senior Solutions Architect at Amazon Web Services Indonesia. He has a strong passion for databases and machine learning, and works closely with the Indonesian machine learning community to introduce them to various AWS Machine Learning services. In his spare time, he enjoys singing in a choir, reading, and playing with his two children.

Nico Anandito is an Analytics Specialist Solutions Architect at Amazon Web Services Indonesia. He has years of experience working in data integration, data warehouses, and big data implementation in multiple industries. He is certified in AWS data analytics and holds a master’s degree in the data management field of computer science.

A hybrid approach in healthcare data warehousing with Amazon Redshift

Post Syndicated from Bindhu Chinnadurai original https://aws.amazon.com/blogs/big-data/a-hybrid-approach-in-healthcare-data-warehousing-with-amazon-redshift/

Data warehouses play a vital role in healthcare decision-making and serve as a repository of historical data. A healthcare data warehouse can be a single source of truth for clinical quality control systems. Data warehouses are mostly built using the dimensional model approach, which has consistently met business needs.

Loading complex multi-point datasets into a dimensional model, identifying issues, and validating data integrity of the aggregated and merged data points are the biggest challenges that clinical quality management systems face. Additionally, scalability of the dimensional model is complex and poses a high risk of data integrity issues.

The data vault approach solves most of the problems associated with dimensional models, but it brings other challenges in clinical quality control applications and regulatory reports. Because data is closer to the source and stored in raw format, it has to be transformed before it can be used for reporting and other application purposes. This is one of the biggest hurdles with the data vault approach.

In this post, we discuss some of the main challenges enterprise data warehouses face when working with dimensional models and data vaults. We dive deep into a hybrid approach that aims to circumvent the issues posed by these two and also provide recommendations to take advantage of this approach for healthcare data warehouses using Amazon Redshift.

What is a dimensional data model?

Dimensional modeling is a strategy for storing data in a data warehouse using dimensions and facts. It optimizes the database for faster data retrieval. Dimensional models have a distinct structure and organize data to provide reports that increase performance.

In a dimensional model, a transaction record is divided either into facts (often numerical), additive transactional data, or dimensions (referential information that gives context to the facts). This categorization of data into facts and dimensions, as well as the entity-relationship framework of the dimensional model, presents complex business processes in a way that is easy for analysts to understand.

A dimensional model in data warehousing is designed for reading, summarizing, and analyzing numerical information such as patient vital stats, lab reading values, counts, and so on. Regardless of the division or use case it is related to, dimensional data models can be used to store data obtained from tracking various processes like patient encounters, provider practice metrics, aftercare surveys, and more.

The majority of healthcare clinical quality data warehouses are built on top of dimensional modeling techniques. The benefit of using dimensional data modeling is that, when data is stored in a data warehouse, it’s easier to persist and extract it.

Although it’s a competent data structure technique, there are challenges in scalability, source tracking, and troubleshooting with the dimensional modeling approach. Tracking and validating the source of aggregated and compute data points is important in clinical quality regulatory reporting systems. Any mistake in regulatory reports may result in a large penalty from regulatory and compliance agencies. These challenges exist because the data points are labeled using meaningless numeric surrogate keys, and any minor error can impair prediction accuracy, and consequently affect the quality of judgments. The ways to countervail these challenges are by refactoring and bridging the dimensions. But that adds data noise over time and reduces accuracy.

Let’s look at an example of a typical dimensional data warehouse architecture in healthcare, as shown in the following logical model.

The following diagram illustrates a sample dimensional model entity-relationship diagram.

This data model contains dimensions and fact tables. You can use the following query to retrieve basic provider and patient relationship data from the dimensional model:

SELECT * FROM Fac_PatientEncounter FP

JOIN Dim_PatientEncounter DP ON FP.EncounterKey = DP.EncounterKey

JOIN Dim_Provider PR ON PR.ProviderKey = FP.ProviderKey

Challenges of dimensional modeling

Dimensional modeling requires data preprocessing before generating a star schema, which involves a large amount of data processing. Any change to the dimension definition results in a lengthy and time-consuming reprocessing of the dimension data, which often results in data redundancy.

Another issue is that, when relying merely on dimensional modeling, analysts can’t assure the consistency and accuracy of data sources. Especially in healthcare, where lineage, compliance, history, and traceability are of prime importance because of the regulations in place.

A data vault seeks to provide an enterprise data warehouse while solving the shortcomings of dimensional modeling approaches. It is a data modeling methodology designed for large-scale data warehouse platforms.

What is a data vault?

The data vault approach is a method and architectural framework for providing a business with data analytics services to support business intelligence, data warehousing, analytics, and data science needs. The data vault is built around business keys (hubs) defined by the company; the keys obtained from the sources are not the same.

Amazon Redshift RA3 instances and Amazon Redshift Serverless are perfect choices for a data vault. And when combined with Amazon Redshift Spectrum, a data vault can deliver more value.

There are three layers to the data vault:

  • Staging
  • Data vault
  • Business vault

Staging involves the creation of a replica of the original data, which is primarily used to aid the process of transporting data from various sources to the data warehouse. There are no restrictions on this layer, and it is typically not persistent. It is 1:1 with the source systems, generally in the same format as that of the sources.

The data vault is based on business keys (hubs), which are defined by the business. All in-scope data is loaded, and auditability is maintained. At the heart of all data warehousing is integration, and this layer contains integrated data from multiple sources built around the enterprise-wide business keys. Although data lakes resemble data vaults, a data vault provides more features of a data warehouse. However, it combines the functionalities of both.

The business vault stores the outcome of business rules, including deduplication, conforming results, and even computations. When results are calculated for two or more data marts, this helps eliminate redundant computation and associated inconsistencies.

Because business vaults still don’t satisfy reporting needs, enterprises create a data mart after the business vault to satisfy dashboarding needs.

Data marts are ephemeral views that can be implemented directly on top of the business and raw vaults. This makes it easy to adapt over time and eliminates the danger of inconsistent results. If views don’t give the required level of performance, the results can be stored in a table. This is the presentation layer and is designed to be requirements-driven and scope-specific subsets of the warehouse data. Although dimensional modeling is commonly used to deliver this layer, marts can also be flat files, .xml files, or in other forms.

The following diagram shows the typical data vault model used in clinical quality repositories.

When the dimensional model as shown earlier is converted into a data vault using the same structure, it can be represented as follows.

Advantages of a data vault

Although any data warehouse should be built within the context of an overarching company strategy, data vaults permit incremental delivery. You can start small and gradually add more sources over time, just like Kimball’s dimensional design technique.

With a data vault, you don’t have to redesign the structure when adding new sources, unlike dimensional modeling. Business rules can be easily changed because raw and business-generated data is kept independent of each other in a data vault.

A data vault isolates technical data reorganization from business rules, thereby facilitating the separation of these potentially tricky processes. Similarly, data cleaning can be maintained separately from data import.

A data vault accommodates changes over time. Unlike a pure dimensional design, a data vault separates raw and business-generated data and accepts changes from both sources.

Data vaults make it easy to maintain data lineage because it includes metadata identifying the source systems. In contrast to dimensional design, where data is cleansed before loading, data vault updates are always gradual, and results are never lost, providing an automatic audit trail.

When raw data is stored in a data vault, historical attributes that weren’t initially available can be added to the presentation area. Data marts can be implemented as views by adding a new column to an existing view.

In data vault 2.0, hash keys eliminate data load dependencies, which allows near-real-time data loading, as well as concurrent data loads of terabytes to petabytes. The process of mastering both entity-relationship modeling and dimensional design takes time and practice, but the process of automating a data vault is easier.

Challenges of a data vault

A data vault is not a one-size-fits-all solution for data warehouses, and it does have a few limitations.

To begin with, when directly feeding the data vault model into a report on one subject area, you need to combine multiple types of data. Due to the incapability of reporting technologies to perform such data processing, this integration can reduce report performance and increase the risk of errors. However, data vault models could improve report performance by incorporating dimensional models or adding additional reporting layers. And for data models that can be directly reported, a dimensional model can be developed.

Additionally, if the data is static or if it comes from a single source, it reduces the efficacy of data vaults. They often negate many benefits of data vaults, and require more business logic, which can be avoided.

The storage requirement for a data vault is also significantly higher. Three separate tables for the same subject area can effectively increase the number of tables by three, and when they are inserts only. If the data is basic, you can achieve the benefits listed here with a simpler dimensional model rather than deploying a data vault.

The following sample query retrieves provider and patient data from a data vault using the sample model we discussed in this section:

SELECT * FROM Lnk_PatientEncounter LP

JOIN Hub_Provider HP ON LP.ProviderKey = HP.ProviderKey

JOIN Dim_Sat_Provider DSP ON HP.ProviderKey = DSP.ProviderKey AND _Current=1

JOIN Hub_Patient Pt ON Pt.PatientEncounterKey = LP.PatientEncounterKey

JOIN Dim_Sat_PatientEncounter DPt ON DPt.PatientEncounterKey = Pt.PatientEncounterKey AND _Current=1

The query involves many joins, which increases the depth and time for the query run, as illustrated in the following chart.

This following table shows that the SQL depth and runtime is proportional, where depth is the number of joins. If the number of joins increase, then the runtime also increases and therefore the cost.

SQL Depth Runtime in Seconds Cost per Query in Seconds
14 80 40,000
12 60 30,000
5 30 15,000
3 25 12,500

The hybrid model addresses major issues raised by the data vault and dimensional model approaches that we’ve discussed in this post, while also allowing improvements in data collection, including IoT data streaming.

What is a hybrid model?

The hybrid model combines the data vault and a portion of the star schema to provide the advantages of both the data vault and dimensional model, and is mainly intended for logical enterprise data warehouses.

The hybrid approach is designed from the bottom up to be gradual and modular, and it can be used for big data, structured, and unstructured datasets. The primary data contains the business rules and enterprise-level data standards norms, as well as additional metadata needed to transform, validate, and enrich data for dimensional approaches. In this model, data processes from left to right provide data vault advantages, and data processes from right to left provide dimensional model advantages. Here, the data vault satellite tables serve as both satellite tables and dimensional tables.

After combining the dimensional and the data vault models, the hybrid model can be viewed as follows.

The following is an example entity-relation diagram of the hybrid model, which consists of a fact table from the dimensional model and all other entities from the data vault. The satellite entity from the data vault plays the dual role. When it’s connected to a data vault, it acts as a sat table, and when connected to a fact table, it acts as a dimension table. To serve this dual purpose, sat tables have two keys: a foreign key to connect with the data vault, and a primary key to connect with the fact table.

The following diagram illustrates the physical hybrid data model.

The following diagram illustrates a typical hybrid data warehouse architecture.

The following query retrieves provider and patient data from the hybrid model:

SELECT * FROM Fac_PatientEncounter FP

JOIN Dim_Sat_Provider DSP ON FP.DimProviderID =DSP.DimProviderID

JOIN Dim_Sat_PatientEncounter DPt ON DPt.DimPatientEncounterID = Pt.DimPatientEncounterID

The number of joins is reduced from five to three by using the hybrid model.

Advantages of using the hybrid model

With this model, structural information is segregated from descriptive information to promote flexibility and avoid re-engineering in the event of a change. It maintains data integrity, allowing organizations to avoid hefty fines when data integrity is compromised.

The hybrid paradigm enables non-data professionals to interact with raw data by allowing users to update or create metadata and data enrichment rules. The hybrid approach simplifies the process of gathering and evaluating datasets for business applications. It enables concurrent data loading and eliminates the need for a corporate vault.

The hybrid model also benefits from the fact that there is no dependency between objects in the data storage. With hybrid data warehousing, scalability is multiplied.

You can build the hybrid model on AWS and take advantage of the benefits of Amazon Redshift, which is a fully managed, scalable cloud data warehouse that accelerates your time to insights with fast, simple, and secure analytics at scale. Amazon Redshift continuously adds features that make it faster, more elastic, and easier to use:

  • Amazon Redshift data sharing enhances the hybrid model by eliminating the need for copying data across departments. It also simplifies the work of keeping the single source of truth, saving memory and limiting redundancy. It enables instant, granular, and fast data access across Amazon Redshift clusters without the need to copy or move it. Data sharing provides live access to data so that users always see the most up-to-date and consistent information as it’s updated in the data warehouse.
  • Redshift Spectrum enables you to query open format data directly in the Amazon Simple Storage Service (Amazon S3) data lake without having to load the data or duplicate your infrastructure, and it integrates well with the data lake.
  • With Amazon Redshift concurrency scaling, you can get consistently fast performance for thousands of concurrent queries and users. It instantly adds capacity to support additional users and removes it when the load subsides, with nothing to manage at your end.
  • To realize the benefits of using a hybrid model on AWS, you can get started today without needing to provision and manage data warehouse clusters using Redshift Serverless. All the related services that Amazon Redshift integrates with (such as Amazon Kinesis, AWS Lambda, Amazon QuickSight, Amazon SageMaker, Amazon EMR, AWS Lake Formation, and AWS Glue) are available to work with Redshift Serverless.

Conclusion

With the hybrid model, data can be transformed and loaded into a target data model efficiently and transparently. With this approach, data partners can research data networks more efficiently and promote comparative effectiveness. And with the several newly introduced features of Amazon Redshift, a lot of heavy lifting is done by AWS to handle your workload demands, and you only pay for what you use.

You can get started with the following steps:

  1. Create an Amazon Redshift RA3 instance for your primary clinical data repository and data marts.
  2. Build a data vault schema for the raw vault and create materialized views for the business vault.
  3. Enable Amazon Redshift data shares to share data between the producer cluster and consumer cluster.
  4. Load the structed and unstructured data into the producer cluster data vault for business use.

About the Authors

Bindhu Chinnadurai is a Senior Partner Solutions Architect in AWS based out of London, United Kingdom. She has spent 18+ years working in everything for large scale enterprise environments. Currently she engages with AWS partner to help customers migrate their workloads to AWS with focus on scalability, resiliency, performance and sustainability. Her expertise is DevSecOps.

 Sarathi Balakrishnan was the Global Partner Solutions Architect, specializing in Data, Analytics and AI/ML at AWS. He worked closely with AWS partner globally to build solutions and platforms on AWS to accelerate customers’ business outcomes with state-of-the-art cloud technologies and achieve more in their cloud explorations. He helped with solution architecture, technical guidance, and best practices to build cloud-native solutions. He joined AWS with over 20 years of large enterprise experience in agriculture, insurance, health care and life science, marketing and advertisement industries to develop and implement data and AI strategies.

Build a data storytelling application with Amazon Redshift Serverless and Toucan

Post Syndicated from Louis Hourcade original https://aws.amazon.com/blogs/big-data/build-a-data-storytelling-application-with-amazon-redshift-serverless-and-toucan/

This post was co-written with Django Bouchez, Solution Engineer at Toucan.

Business intelligence (BI) with dashboards, reports, and analytics remains one of the most popular use cases for data and analytics. It provides business analysts and managers with a visualization of the business’s past and current state, helping leaders make strategic decisions that dictate the future. However, customers continue to ask for better ways to tell stories with their data, and therefore increase the adoption rate of their BI tools.

Most BI tools on the market provide an exhaustive set of customization options to build data visualizations. It might appear as a good idea, but ultimately burdens business analysts that need to navigate through endless possibilities before building a report. Analysts are not graphic designers, and a poorly designed data visualization can hide the insight it’s intended to convey, or even mislead the viewer. To realize more value from your data, you should focus on building data visualizations that tell stories, and are easily understandable by your audience. This is where guided analytics helps. Instead of presenting unlimited options for customization, it intentionally limits choice by enforcing design best practices. The simplicity of a guided experience enables business analysts to spend more time generating actual insight rather than worrying about how to present them.

This post illustrates the concept of guided analytics and shows you how you can build a data storytelling application with Amazon Redshift Serverless and Toucan, an AWS Partner. Toucan natively integrates with Redshift Serverless, which enables you to deploy a scalable data stack in minutes without the need to manage any infrastructure component.

Amazon Redshift is a fully managed cloud data warehouse service that enables you to analyze large amounts of structured and semi-structured data. Amazon Redshift can scale from a few gigabytes to a petabyte-scale data warehouse, and AWS recently announced the global availability of Redshift Serverless, making it one of the best options for storing data and running ad hoc analytics in a scalable and cost-efficient way.

With Redshift Serverless, you can get insights on your data by running standalone SQL queries or by using data visualizations tools such as Amazon QuickSight, Toucan, or other third-party options without having to manage your data warehouse infrastructure.

Toucan is a cloud-based guided analytics platform built with one goal in mind: reduce the complexity of bringing data insights to business users. For this purpose, Toucan provides a no-code and comprehensive user experience at every stage of the data storytelling application, which includes data connection, building the visualization, and distribution on any device.

If you’re in a hurry and want to see what you can do with this integration, check out Shark attacks visualization with AWS & Toucan, where Redshift Serverless and Toucan help in understanding the evolution of shark attacks in the world.

Overview of solution

There are many BI tools in the market, each providing an ever-increasing set of capabilities and customization options to differentiate from the competition. Paradoxically, this doesn’t seem to increase the adoption rate of BI tools in enterprises. With more complex tools, data owners spend time building fancy visuals, and tend to add as much information as possible in their dashboards instead of providing a clear and simple message to business users.

In this post, we illustrate the concept of guided analytics by putting ourselves in the shoes of a data engineer that needs to communicate stories to business users with data visualizations. This fictional data engineer has to create dashboards to understand how shark attacks evolved in the last 120 years. After loading the shark attacks dataset in Redshift Serverless, we guide you in using Toucan to build stories that provide a better understanding of shark attacks through time. With Toucan, you can natively connect to datasets in Redshift Serverless, transform the data with a no-code interface, build storytelling visuals, and publish them for business users. The shark attacks visualization example illustrates what you can achieve by following instructions in this post.

Additionally, we have recorded a video tutorial that explains how to connect Toucan with Redshift Serverless and start building charts.

Solution architecture

The following diagram depicts the architecture of our solution.

Architecture diagram

We use an AWS CloudFormation stack to deploy all the resources you need in your AWS account:

  • Networking components – This includes a VPC, three public subnets, an internet gateway, and a security group to host the Redshift Serverless endpoint. In this post, we use public subnets to facilitate data access from external sources such as Toucan instances. In this case, the data in Redshift Serverless is still protected by the security group that restricts incoming traffic, and by the database credentials. For a production workload, it is recommended to keep traffic in the Amazon network. For that, you can set the Redshift Serverless endpoints in private subnets, and deploy Toucan in your AWS account through the AWS Marketplace.
  • Redshift Serverless components – This includes a Redshift Serverless namespace and workgroup. The Redshift Serverless workspace is publicly accessible to facilitate the connection from Toucan instances. The database name and the administrator user name are defined as parameters when deploying the CloudFormation stack, and the administrator password is created in AWS Secrets Manager. In this post, we use database credentials to connect to Redshift Serverless, but Toucan also supports connection with AWS credentials and AWS Identity and Access Management (IAM) profiles.
  • Custom resources – The CloudFormation stack includes a custom resource, which is an AWS Lambda function that loads shark attacks data automatically in your Redshift Serverless database when the CloudFormation stack is created.
  • IAM roles and permissions – Finally, the CloudFormation stack includes all IAM roles associated with services previously mentioned to interact with other AWS resources in your account.

In the following sections, we provide all the instructions to connect Toucan with your data in Redshift Serverless, and guide you to build your data storytelling application.

Sample dataset

In this post, we use a custom dataset that lists all known shark attacks in the world, starting from 1900. You don’t have to import the data yourself; we use the Amazon Redshift COPY command to load the data when deploying the CloudFormation stack. The COPY command is one the fastest and most scalable methods to load data into Amazon Redshift. For more information, refer to Using a COPY command to load data.

The dataset contains 4,900 records with the following columns:

  • Date
  • Year
  • Decade
  • Century
  • Type
  • Zone_Type
  • Zone
  • Country
  • Activity
  • Sex
  • Age
  • Fatal
  • Time
  • Species
  • href (a PDF link with the description of the context)
  • Case_Number

Prerequisites

For this solution, you should have the following prerequisites:

  • An AWS account. If you don’t have one already, see the instructions in Sign Up for AWS.
  • An IAM user or role with permissions on AWS resources used in this solution.
  • A Toucan free trial to build the data storytelling application.

Set up the AWS resources

You can launch the CloudFormation stack in any Region where Redshift Serverless is available.

  1. Choose Launch Stack to start creating the required AWS resources for this post:

  1. Specify the database name in Redshift Serverless (default is dev).
  2. Specify the administrator user name (default is admin).

You don’t have to specify the database administrator password because it’s created in Secrets Manager by the CloudFormation stack. The secret’s name is AWS-Toucan-Redshift-Password. We use the secret value in subsequent steps.

Test the deployment

The CloudFormation stack takes a few minutes to deploy. When it’s complete, you can confirm the resources were created. To access your data, you need to get the Redshift Serverless database credentials.

  1. On the Outputs tab for the CloudFormation stack, note the name of the Secrets Manager secret.

BDB-2389temp

  1. On the Secrets Manager console, navigate to the Amazon Redshift database secret and choose Retrieve secret value to get the database administrator user name and password.

  1. To make sure your Redshift Serverless database is available and contains the shark attacks dataset, open the Redshift Serverless workgroup on the Amazon Redshift console and choose Query data to access the query editor.
  2. Also note the Redshift Serverless endpoint, which you need to connect with Toucan.

  1. In the Amazon Redshift query editor, run the following SQL query to view the shark attacks data:
SELECT * FROM "dev"."public"."shark_attacks";

Redshift Query Editor v2

Note that you need to change the name of the database in the SQL query if you change the default value when launching the CloudFormation stack.

You have configured Redshift Serverless in your AWS account and uploaded the shark attacks dataset. Now it’s time to use this data by building a storytelling application.

Launch your Toucan free trial

The first step is to access Toucan platform through the Toucan free trial.

Fill the form and complete the signup steps. You then arrive in the Storytelling Studio, in Staging mode. Feel free to explore what has been already created.

Toucan Home page

Connect Redshift Serverless with Toucan

To connect Redshift Serverless and Toucan, complete the following steps:

  1. Choose Datastore at the bottom of the Toucan Storytelling Studio.
  2. Choose Connectors.

Toucan is natively integrated with Redshift Serverless with AnyConnect.

  1. Search for the Amazon Redshift connector, and complete the form with the following information:
    • Name – The name of the connector in Toucan.
    • Host – Your Redshift Serverless endpoint.
    • Port – The listening port of your Amazon Redshift database (5439).
    • Default Database – The name of the database to connect to (dev by default, unless edited in the CloudFormation stack parameters).
    • Authentication Method – The authentication mechanism to connect to Redshift Serverless. In this case, we use database credentials.
    • User – The user name to use for authentication with Redshift Serverless (admin by default, unless edited in the CloudFormation stack parameters).
    • Password – The password to use for authentication with Redshift Serverless (you should retrieve it from Secrets Manager; the secret’s name is AWS-Toucan-Redshift-Password).

Toucan connection

Create a live query

You are now connected to Redshift Serverless. Complete the following steps to create a query:

  1. On the home page, choose Add tile to create a new visualization.

Toucan new tile

  1. Choose the Live Connections tab, then choose the Amazon Redshift connector you created in the previous step.

Toucan Live Connection

The Toucan trial guides you in building your first live query, in which you can transform your data without writing code using the Toucan YouPrep module.

For instance, as shown in the following screenshot, you can use this no-code interface to compute the sum of fatal shark attacks by activities, get the top five, and calculate the percentage of the total.

Toucan query data

Build your first chart

When your data is ready, choose the Tile tab and complete the form that helps you build charts.

For example, you can configure a leaderboard of the five most dangerous activities, and add a highlight for activities with more than 100 attacks.

Choose Save Changes to save your work and go back to the home page.

Toucan chart builder

Publish and share your work

Until this stage, you have been working in working in Staging mode. To make your work available to everyone, you need to publish it into Production.

On the bottom right of the home page, choose the eye icon to preview your work by putting yourself in the shoes of your future end-users. You can then choose Publish to make your work available to all.

Toucan publish

Toucan also offers multiple embedding options to make your charts easier for end-users to access, such as mobile and tablet.

Toucan multi devices

Following these steps, you connected to Redshift Serverless, transformed the data with the Toucan no-code interface, and built data visualizations for business end-users. The Toucan trial guides you in every stage of this process to help you get started.

Redshift Serverless and Toucan guided analytics provide an efficient approach to increase the adoption rate of BI tools by decreasing infrastructure work for data engineers, and by simplifying dashboard understanding for business end-users. This post only covered a small part of what Redshift Serverless and Toucan offer, so feel free to explore other functionalities in the Amazon Redshift Serverless documentation and Toucan documentation.

Clean up

Some of the resources deployed in this post through the CloudFormation template incur costs as long as they’re in use. Be sure to remove the resources and clean up your work when you’re finished in order to avoid unnecessary cost.

On the CloudFormation console, choose Delete stack to remove all resources.

Conclusion

This post showed you how to set up an end-to-end architecture for guided analytics with Redshift Serverless and Toucan.

This solution benefits from the scalability of Redshift Serverless, which enables you to store, transform, and expose data in a cost-efficient way, and without any infrastructure to manage. Redshift Serverless natively integrates with Toucan, a guided analytics tool designed to be used by everyone, on any device.

Guided analytics focuses on communicating stories through data reports. By setting intentional constraints on customization options, Toucan makes it easy for data owners to build meaningful dashboards with a clear and concise message for end-users. It works for both your internal and external customers, on an unlimited number of use cases.

Try it now with our CloudFormation template and a free Toucan trial!


About the Authors


Louis
Louis Hourcade
is a Data Scientist in the AWS Professional Services team. He works with AWS customer across various industries to accelerate their business outcomes with innovative technologies. In his spare time he enjoys running, climbing big rocks, and surfing (not so big) waves.


Benjamin
Benjamin Menuet
is a Data Architect with AWS Professional Services. He helps customers develop big data and analytics solutions to accelerate their business outcomes. Outside of work, Benjamin is a trail runner and has finished some mythic races like the UTMB.


Xavier
Xavier Naunay
is a Data Architect with AWS Professional Services. He is part of the AWS ProServe team, helping enterprise customers solve complex problems using AWS services. In his free time, he is either traveling or learning about technology and other cultures.


Django
Django Bouchez
is a Solution Engineer at Toucan. He works alongside the Sales team to provide support on technical and functional validation and proof, and is also helping R&D demo new features with Cloud Partners like AWS. Outside of work, Django is a homebrewer and practices scuba diving and sport climbing.

How SafeGraph built a reliable, efficient, and user-friendly Apache Spark platform with Amazon EMR on Amazon EKS

Post Syndicated from Nan Zhu original https://aws.amazon.com/blogs/big-data/how-safegraph-built-a-reliable-efficient-and-user-friendly-spark-platform-with-amazon-emr-on-amazon-eks/

This is a guest post by Nan Zhu, Engineering Manager/Software Engineer, SafeGraph, and Dave Thibault, Sr. Solutions Architect – AWS

SafeGraph is a geospatial data company that curates over 41 million global points of interest (POIs) with detailed attributes, such as brand affiliation, advanced category tagging, and open hours, as well as how people interact with those places. We use Apache Spark as our main data processing engine and have over 1,000 Spark applications running over massive amounts of data every day. These Spark applications implement our business logic ranging from data transformation, machine learning (ML) model inference, to operational tasks.

SafeGraph found itself with a less-than-optimal Spark environment with their incumbent Spark vendor. Their costs were climbing. Their jobs would suffer frequent retries from Spot Instance termination. Developers spent too much time troubleshooting and changing job configurations and not enough time shipping business value code. SafeGraph needed to control costs, improve developer iteration speed, and improve job reliability. Ultimately, SafeGraph chose Amazon EMR on Amazon EKS to meet their needs and realized 50% savings relative to their previous Spark managed service vendor.

If building Spark applications for our product is like cutting a tree, having a sharp saw becomes crucial. The Spark platform is the saw. The following figure highlights the engineering workflow when working with Spark, and the Spark platform should support and optimize each action in the workflow. The engineers usually start with writing and building the Spark application code, then submit the application to the computing infrastructure, and finally close the loop by debugging the Spark applications. Additionally, platform and infrastructure teams need to continually operate and optimize the three steps in the engineering workflow.

Figure 1 engineering workflow of Spark applications

There are various challenges involved in each action when building a Spark platform:

  • Reliable dependency management – A complicated Spark application usually brings many dependencies. To run a Spark application, we need to identify all dependencies, resolve any conflicts, pack dependent libraries reliably, and ship them to the Spark cluster. Dependency management is one of the biggest challenges for engineers, especially when they work with PySpark applications.
  • Reliable computing infrastructure – The reliability of the computing infrastructure hosting Spark applications is the foundation of the whole Spark platform. Unstable resource provisioning will not only cause negative impact over engineering efficiency, but it will also increase infrastructure costs due to reruns of the Spark applications.
  • Convenient debugging tools for Spark applications – The debugging tooling plays a key role for engineers to iterate fast on Spark applications. Performant access to the Spark History Server (SHS) is a must for developer iteration speed. Conversely, poor SHS performance slows developers and increases the cost of goods sold for software companies.
  • Manageable Spark infrastructure – A successful Spark platform engineering involves multiple aspects, such as Spark distribution version management, computing resource SKU management and optimization, and more. It largely depends on whether the Spark service vendors provide the right foundation for platform teams to use. The wrong abstraction over distribution version and computing resources, for example, could significantly reduce the ROI of platform engineering.

At SafeGraph, we experienced all of the aforementioned challenges. To resolve them, we explored the marketplace and found that building a new Spark platform on top of EMR on EKS was the solution to our roadblocks. In this post, we share our journey of building our latest Spark platform and how EMR on EKS serves as a robust and efficient foundation for it.

Reliable Python dependency management

One of the biggest challenges for our users to write and build Spark application code is the struggle of managing dependencies reliably, especially for PySpark applications. Most of our ML-related Spark applications are built with PySpark. With our previous Spark service vendor, the only supported way to manage Python dependencies was via a wheel file. Despite its popularity, wheel-based dependency management is fragile. The following figure shows two types of reliability issues faced with wheel-based dependency management:

  • Unpinned direct dependency – If the .whl file doesn’t pinpoint the version of a certain direct dependency, Pandas in this example, it will always pull the latest version from upstream, which may potentially contain a breaking change and take down our Spark applications.
  • Unpinned transitive dependency – The second type of reliability issue is more out of our control. Even though we pinned the direct dependency version when building the .whl file, the direct dependency itself could miss pinpointing the transitive dependencies’ versions (MLFlow in this example). The direct dependency in this case always pulls the latest versions of these transitive dependencies that potentially contain breaking changes and may take down our pipelines.

Figure 2 fragile wheel based dependency management

The other issue we encountered was the unnecessary installation of all Python packages referred by the wheel files for every Spark application initialization. With our previous setup, we needed to run the installation script to install wheel files for every Spark application upon starting even if there is no dependency change. This installation prolongs the Spark application start time from 3–4 minutes to at least 7–8 minutes. The slowdown is frustrating especially when our engineers are actively iterating over changes.

Moving to EMR on EKS enables us to use pex (Python EXecutable) to manage Python dependencies. A .pex file packs all dependencies (including direct and transitive) of a PySpark application in an executable Python environment in the spirit of virtual environments.

The following figure shows the file structure after converting the wheel file illustrated earlier to a .pex file. Compared to the wheel-based workflow, we don’t have transitive dependency pulling or auto-latest version fetching anymore. All versions of dependencies are fixed as x.y.z, a.b.c, and so on when building the .pex file. Given a .pex file, all dependencies are fixed so that we don’t suffer from the slowness or fragility issues in a wheel-based dependency management anymore. The cost of building a .pex file is a one-off cost, too.

Figure 3 PEX file structure

Reliable and efficient resource provisioning

Resource provisioning is the process for the Spark platform to get computing resources for Spark applications, and is the foundation for the whole Spark platform. When building a Spark platform in the cloud, using Spot Instances for cost optimization makes resource provisioning even more challenging. Spot Instances are spare compute capacity available to you at a savings of up to 90% off compared to On-Demand prices. However, when the demand for certain instance types grows suddenly, Spot Instance termination can happen to prioritize meeting those demands. Because of these terminations, we saw several challenges in our earlier version of Spark platform:

  • Unreliable Spark applications – When the Spot Instance termination happened, the runtime of Spark applications got prolonged significantly due to the retried compute stages.
  • Compromised developer experience – The unstable supply of Spot Instances caused frustration among engineers and slowed our development iterations because of the unpredictable performance and low success rate of Spark applications.
  • Expensive infrastructure bill – Our cloud infrastructure bill increased significantly due to the retry of jobs. We had to buy more expensive Amazon Elastic Compute Cloud (Amazon EC2) instances with higher capacity and run in multiple Availability Zones to mitigate issues but in turn paid for the high cost of cross-Availability Zone traffic.

Spark Service Providers (SSPs) like EMR on EKS or other third-party software products serve as the intermediate between users and Spot Instance pools, and play a key role to ensure the sufficient supply of Spot Instances. As shown in the following figure, users launch Spark jobs with job orchestrators, notebooks, or services via SSPs. The SSP implements their internal functionality to access the unused instances in the Spot Instance pool in cloud services like AWS. One of the best practices of using Spot Instances is to diversify instance types (for more information, see Cost Optimization using EC2 Spot Instances). Specifically, there are two key features for a SSP to achieve instance diversification:

  • The SSP should be able to access all types of instances in the Spot Instance pool in AWS
  • The SSP should provide functionality for users to use as many instance types as possible when launching Spark applications

Figure 4 SSP provides the access to the unused instances in Cloud Service Provider

Our last SSP doesn’t provide the expected solution to these two points. They only support a limited set of Spot Instance types and by default, allow only a single Spot Instance type to be selected when launching Spark jobs. As a result, each Spark application only runs with a small capacity of Spot Instances and is vulnerable to Spot Instance terminations.

EMR on EKS uses Amazon Elastic Kubernetes Service (Amazon EKS) for accessing Spot Instances in AWS. Amazon EKS supports all available EC2 instance types, bringing a much higher capacity pool to us. We use the features of Amazon EKS managed node groups and node selectors and taints to assign each Spark application to a node group that is made of multiple instance types. After moving to EMR on EKS, we observed the following benefits:

  • Spot Instance termination was less frequent and our Spark applications’ runtime became shorter and stayed stable.
  • Engineers were able to iterate faster as they saw improvement in the predictability of application behaviors.
  • The infrastructure costs dropped significantly because we no longer needed costly workarounds and, simultaneously, we had a sophisticated selection of instances in each node group of Amazon EKS. We were able to save approximately 50% of computing costs without the workarounds like running in multiple Availability Zones and simultaneously provide the expected level of reliability.

Smooth debugging experience

An infrastructure that supports engineers conveniently debugging the Spark application is critical to close the loop of our engineering workflow. Apache Spark uses event logs to record the activities of a Spark application, such as task start and finish. These events are formatted in JSON and are used by SHS to rerender the UI of Spark applications. Engineers can access SHS to debug task failure reasons or performance issues.

The major challenge for engineers in SafeGraph was the scalability issue in SHS. As shown in the left part of the following figure, our previous SSP forced all engineers to share the same SHS instance. As a result, SHS was under intense resource pressure due to many engineers accessing at the same time for debugging their applications, or if a Spark application had a large event log to be rendered. Prior to moving to EMR on EKS, we frequently experienced either slowness of SHS or SHS crashed completely.

As shown in the following figure, for every request to view Spark history UI, EMR on EKS starts an independent SHS instance container in an AWS-managed environment. The benefit of this architecture is two-fold:

  • Different users and Spark applications won’t compete for SHS resources anymore. Therefore, we never experience slowness or crashes of SHS.
  • All SHS containers are managed by AWS; users don’t need pay additional financial or operational costs to enjoy the scalable architecture.

Figure 5 SHS provisioning architecture in previous SSP and EMR on EKS

Manageable Spark platform

As shown in the engineering workflow, building a Spark platform is not a one-off effort, and platform teams need to manage the Spark platform and keep optimizing each step in the engineer development workflow. The role of the SSP should provide the right facilities to ease operational burden as much as possible. Although there are many types of operational tasks, we focus on two of them in this post: computing resource SKU management and Spark distro version management.

Computing resource SKU management refers to the design and process for a Spark platform to allow users to choose different sizes of computing instances. Such a design and process would largely rely on the relevant functionality implemented from SSPs.

The following figure shows the SKU management with our previous SSP.

Figure 6 (a) Previous SSP: Users have to explicitly specify instance type and availability zone

The following figure shows SKU management with EMR on EKS.

Figure 6 (b) EMR on EKS helps abstracting out instance types from users and make it easy to manage computing SKU

With our previous SSP, job configuration only allowed explicitly specifying a single Spot Instance type, and if that type ran out of Spot capacity, the job switched to On-Demand or fell into reliability issues. This left platform engineers with the choice of changing the settings across the fleet of Spark jobs or risking unwanted surprises for their budget and cost of goods sold.

EMR on EKS makes it much easier for the platform team to manage computing SKUs. In SafeGraph, we embedded a Spark service client between users and EMR on EKS. The Spark service client exposes only different tiers of resources to users (such as small, medium, and large). Each tier is mapped to a certain node group configured in Amazon EKS. This design brings the following benefits:

  • In the case of prices and capacity changes, it’s easy for us to update configurations in node groups and keep it abstracted from users. Users don’t change anything, or even feel it, and continue to enjoy the stable resource provisioning while we keep costs and operational overhead as low as possible.
  • When choosing the right resources for the Spark application, end-users don’t need to do any guess work because it’s easy to choose with simplified configuration.

Improved Spark distro release management is the other benefit we gain from EMR on EKS. Prior to using EMR on EKS, we suffered from the non-transparent release of Spark distro in our SSP. Every 1–2 months, there is a new patched version of Spark distro released to users. These versions are all exposed to users via their UI. This resulted in engineers choosing various versions of distro, some of which hadn’t been tested with our internal tools. It significantly increased the breaking rate of our pipelines, internal systems, and the support burden of platform teams. We expect that the risk from releases of Spark distros should be minimum and transparent to users with an EMR on EKS architecture.

EMR on EKS follows the best practices with a stable base Docker image containing a fixed version of Spark distro. For any change of Spark distro, we have to explicitly rebuild and roll out the Docker image. With EMR on EKS, we can keep a new version of Spark distro hidden from users before testing it with our internal toolings and systems and make a formal release.

Conclusion

In this post, we shared our journey building a Spark platform on top of EMR on EKS. EMR on EKS as the SSP serves as a strong foundation of our Spark platform. With EMR on EKS, we were able to resolve challenges ranging from dependency management, resource provisioning, and debugging experience, and also significantly reduce our computing cost by 50% due to higher availability of Spot Instance types and sizes.

We hope this post could share some insights to the community when choosing the right SSP for your business. Learn more about EMR on EKS, including benefits, features, and how to get started.


About the Authors

Nan Zhu is the engineering lead of the platform team in SafeGraph. He leads the team to build a broad range of infrastructure and internal toolings to improve the reliability, efficiency and productivity of the SafeGraph engineering process, e.g. internal Spark ecosystem, metrics store and CI/CD for large mono repos, etc. He is also involved in multiple open source projects like Apache Spark, Apache Iceberg, Gluten, etc.

Dave Thibault is a Sr. Solutions Architect serving AWS’s independent software vendor (ISV) customers. He’s passionate about building with serverless technologies, machine learning, and accelerating his AWS customers’ business success. Prior to joining AWS, Dave spent 17 years in life sciences companies doing IT and informatics for research, development, and clinical manufacturing groups. He also enjoys snowboarding, plein air oil painting, and spending time with his family.

Automate deployment of an Amazon QuickSight analysis connecting to an Amazon Redshift data warehouse with an AWS CloudFormation template

Post Syndicated from Sandeep Bajwa original https://aws.amazon.com/blogs/big-data/automate-deployment-of-an-amazon-quicksight-analysis-connecting-to-an-amazon-redshift-data-warehouse-with-an-aws-cloudformation-template/

Amazon Redshift is the most widely used data warehouse in the cloud, best suited for analyzing exabytes of data and running complex analytical queries. Amazon QuickSight is a fast business analytics service to build visualizations, perform ad hoc analysis, and quickly get business insights from your data. QuickSight provides easy integration with Amazon Redshift, providing native access to all your data and enabling organizations to scale their business analytics capabilities to hundreds of thousands of users. QuickSight delivers fast and responsive query performance by using a robust in-memory engine (SPICE).

As a QuickSight administrator, you can use AWS CloudFormation templates to migrate assets between distinct environments from development, to test, to production. AWS CloudFormation helps you model and set up your AWS resources so you can spend less time managing those resources and more time focusing on your applications that run in AWS. You no longer need to create data sources or analyses manually. You create a template that describes all the AWS resources that you want, and AWS CloudFormation takes care of provisioning and configuring those resources for you. In addition, with versioning, you have your previous assets, which provides the flexibility to roll back deployments if the need arises. For more details, refer to Amazon QuickSight resource type reference.

In this post, we show how to automate the deployment of a QuickSight analysis connecting to an Amazon Redshift data warehouse with a CloudFormation template.

Solution overview

Our solution consists of the following steps:

  1. Create a QuickSight analysis using an Amazon Redshift data source.
  2. Create a QuickSight template for your analysis.
  3. Create a CloudFormation template for your analysis using the AWS Command Line Interface (AWS CLI).
  4. Use the generated CloudFormation template to deploy a QuickSight analysis to a target environment.

The following diagram shows the architecture of how you can have multiple AWS accounts, each with its own QuickSight environment connected to its own Amazon Redshift data source. In this post, we outline the steps involved in migrating QuickSight assets in the dev account to the prod account. For this post, we use Amazon Redshift as the data source and create a QuickSight visualization using the Amazon Redshift sample TICKIT database.

The following diagram illustrates flow of the high-level steps.

Prerequisites

Before setting up the CloudFormation stacks, you must have an AWS account and an AWS Identity and Access Management (IAM) user with sufficient permissions to interact with the AWS Management Console and the services listed in the architecture.

The migration requires the following prerequisites:

Create a QuickSight analysis in your dev environment

In this section, we walk through the steps to set up your QuickSight analysis using an Amazon Redshift data source.

Create an Amazon Redshift data source

To connect to your Amazon Redshift data warehouse, you need to create a data source in QuickSight. As shown in the following screenshot, you have two options:

  • Auto-discovered
  • Manual connect

QuickSight auto-discovers Amazon Redshift clusters that are associated with your AWS account. These resources must be located in the same Region as your QuickSight account.

For more details, refer to Authorizing connections from Amazon QuickSight to Amazon Redshift clusters.

You can also manually connect and create a data source.

Create an Amazon Redshift dataset

The next step is to create a QuickSight dataset, which identifies the specific data in a data source you want to use.

For this post, we use the TICKIT database created in an Amazon Redshift data warehouse, which consists of seven tables: two fact tables and five dimensions, as shown in the following figure.

This sample database application helps analysts track sales activity for the fictional TICKIT website, where users buy and sell tickets online for sporting events, shows, and concerts.

  1. On the Datasets page, choose New dataset.
  2. Choose the data source you created in the previous step.
  3. Choose Use custom SQL.
  4. Enter the custom SQL as shown in the following screenshot.

The following screenshot shows our completed data source.

Create a QuickSight analysis

The next step is to create an analysis that utilizes this dataset. In QuickSight, you analyze and visualize your data in analyses. When you’re finished, you can publish your analysis as a dashboard to share with others in your organization.

  1. On the All analyses tab of the QuickSight start page, choose New analysis.

The Datasets page opens.

  1. Choose a dataset, then choose Use in analysis.

  1. Create a visual. For more information about creating visuals, see Adding visuals to Amazon QuickSight analyses.

Create a QuickSight template from your analysis

A QuickSight template is a named object in your AWS account that contains the definition of your analysis and references to the datasets used. You can create a template using the QuickSight API by providing the details of the source analysis via a parameter file. You can use templates to easily create a new analysis.

You can use AWS Cloud9 from the console to run AWS CLI commands.

The following AWS CLI command demonstrates how to create a QuickSight template based on the sales analysis you created (provide your AWS account ID for your dev account):

aws quicksight create-template --aws-account-id  <DEVACCOUNT>--template-id QS-RS-SalesAnalysis-Template --cli-input-json file://parameters.json

The parameter.json file contains the following details (provide your source QuickSight user ARN, analysis ARN, and dataset ARN):

{
    "Name": "QS-RS-SalesAnalysis-Temp",
    "Permissions": [
        {"Principal": "<QS-USER-ARN>", 
          "Actions": [ "quicksight:CreateTemplate",
                       "quicksight:DescribeTemplate",                   
                       "quicksight:DescribeTemplatePermissions",
                       "quicksight:UpdateTemplate"         
            ] } ] ,
     "SourceEntity": {
       "SourceAnalysis": {
         "Arn": "<QS-ANALYSIS-ARN>",
         "DataSetReferences": [
           {
             "DataSetPlaceholder": "sales",
             "DataSetArn": "<QS-DATASET-ARN>"
           }
         ]
       }
     },
     "VersionDescription": "1"
    }

You can use the AWS CLI describe-user, describe_analysis, and describe_dataset commands to get the required ARNs.

To upload the updated parameter.json file to AWS Cloud9, choose File from the tool bar and choose Upload local file.

The QuickSight template is created in the background. QuickSight templates aren’t visible within the QuickSight UI; they’re a developer-managed or admin-managed asset that is only accessible via the AWS CLI or APIs.

To check the status of the template, run the describe-template command:

aws quicksight describe-template --aws-account-id <DEVACCOUNT> --template-id "QS-RS-SalesAnalysis-Temp"

The following code shows command output:

Copy the template ARN; we need it later to create a template in the production account.

The QuickSight template permissions in the dev account need to be updated to give access to the prod account. Run the following command to update the QuickSight template. This provides the describe privilege to the target account to extract details of the template from the source account:

aws quicksight update-template-permissions --aws-account-id <DEVACCOUNT> --template-id “QS-RS-SalesAnalysis-Temp” --grant-permissions file://TemplatePermission.json

The file TemplatePermission.json contains the following details (provide your target AWS account ID):

[
  {
    "Principal": "arn:aws:iam::<TARGET ACCOUNT>",
    "Actions": [
      "quicksight:UpdateTemplatePermissions",
      "quicksight:DescribeTemplate"
    ]
  }
]

To upload the updated TemplatePermission.json file to AWS Cloud9, choose the File menu from the tool bar and choose Upload local file.

Create a CloudFormation template

In this section, we create a CloudFormation template containing our QuickSight assets. In this example, we use a YAML formatted template saved on our local machine. We update the following different sections of the template:

  • AWS::QuickSight::DataSource
  • AWS::QuickSight::DataSet
  • AWS::QuickSight::Template
  • AWS::QuickSight::Analysis

Some of the information required to complete the CloudFormation template can be gathered from the source QuickSight account via the describe AWS CLI commands, and some information needs to be updated for the target account.

Create an Amazon Redshift data source in AWS CloudFormation

In this step, we add the AWS::QuickSight::DataSource section of the CloudFormation template.

Gather the following information on the Amazon Redshift cluster in the target AWS account (production environment):

  • VPC connection ARN
  • Host
  • Port
  • Database
  • User
  • Password
  • Cluster ID

You have the option to create a custom DataSourceID. This ID is unique per Region for each AWS account.

Add the following information to the template:

Resources:
  RedshiftBuildQSDataSource:
    Type: 'AWS::QuickSight::DataSource'
    Properties:  
      DataSourceId: "RS-Sales-DW"      
      AwsAccountId: !Sub ${AWS::ACCOUNT ID}
      VpcConnectionProperties:
        VpcConnectionArn: <VPC-CONNECTION-ARN>      
      Type: REDSHIFT   
      DataSourceParameters:
        RedshiftParameters:     
          Host: "<HOST>"
          Port: <PORT>
          Clusterid: "<CLUSTER ID>"
          Database: "<DATABASE>"    
      Name: "RS-Sales-DW"
      Credentials:
        CredentialPair:
          Username: <USER>
          Password: <PASSWORD>
      Permissions:

Create an Amazon Redshift dataset in AWS CloudFormation

In this step, we add the AWS::QuickSight::DataSet section in the CloudFormation template to match the dataset definition from the source account.

Gather the dataset details and run the list-data-sets command to get all datasets from the source account (provide your source dev account ID):

aws quicksight list-data-sets  --aws-account-id <DEVACCOUNT>

The following code is the output:

Run the describe-data-set command, specifying the dataset ID from the previous command’s response:

aws quicksight describe-data-set --aws-account-id <DEVACCOUNT> --data-set-id "<YOUR-DATASET-ID>"

The following code shows partial output:

Based on the dataset description, add the AWS::Quicksight::DataSet resource in the CloudFormation template, as shown in the following code. Note that you can also create a custom DataSetID. This ID is unique per Region for each AWS account.

QSRSBuildQSDataSet:
    Type: 'AWS::QuickSight::DataSet'
    Properties:
      DataSetId: "RS-Sales-DW" 
      Name: "sales" 
      AwsAccountId: !Sub ${AWS::ACCOUNT ID}
      PhysicalTableMap:
        PhysicalTable1:          
          CustomSql:
            SqlQuery: "select sellerid, username, (firstname ||' '|| lastname) as name,city, sum(qtysold) as sales
              from sales, date, users
              where sales.sellerid = users.userid and sales.dateid = date.dateid and year = 2008
              group by sellerid, username, name, city
              order by 5 desc
              limit 10"
            DataSourceArn: !GetAtt RedshiftBuildQSDataSource.Arn
            Name"RS-Sales-DW"
            Columns:
            - Type: INTEGER
              Name: sellerid
            - Type: STRING
              Name: username
            - Type: STRING
              Name: name
            - Type: STRING
              Name: city
            - Type: DECIMAL
              Name: sales                                     
      LogicalTableMap:
        LogicalTable1:
          Alias: sales
          Source:
            PhysicalTableId: PhysicalTable1
          DataTransforms:
          - CastColumnTypeOperation:
              ColumnName: sales
              NewColumnType: DECIMAL
      Permissions:
        - Principal: !Join 
            - ''
            - - 'arn:aws:quicksight:'
              - !Ref QuickSightIdentityRegion
              - ':'
              - !Ref 'AWS::AccountId'
              - ':user/default/'
              - !Ref QuickSightUser
          Actions:
            - 'quicksight:UpdateDataSetPermissions'
            - 'quicksight:DescribeDataSet'
            - 'quicksight:DescribeDataSetPermissions'
            - 'quicksight:PassDataSet'
            - 'quicksight:DescribeIngestion'
            - 'quicksight:ListIngestions'
            - 'quicksight:UpdateDataSet'
            - 'quicksight:DeleteDataSet'
            - 'quicksight:CreateIngestion'
            - 'quicksight:CancelIngestion'
      ImportMode: DIRECT_QUERY

You can specify ImportMode to choose between Direct_Query or Spice.

Create a QuickSight template in AWS CloudFormation

In this step, we add the AWS::QuickSight::Template section in the CloudFormation template, representing the analysis template.

Use the source template ARN you created earlier and add the AWS::Quicksight::Template resource in the CloudFormation template:

QSTCFBuildQSTemplate:
    Type: 'AWS::QuickSight::Template'
    Properties:
      TemplateId: "QS-RS-SalesAnalysis-Temp"
      Name: "QS-RS-SalesAnalysis-Temp"
      AwsAccountId:!Sub ${AWS::ACCOUNT ID}
      SourceEntity:
        SourceTemplate:
          Arn: '<SOURCE-TEMPLATE-ARN>'          
      Permissions:
        - Principal: !Join 
            - ''
            - - 'arn:aws:quicksight:'
              - !Ref QuickSightIdentityRegion
              - ':'
              - !Ref 'AWS::AccountId'
              - ':user/default/'
              - !Ref QuickSightUser
          Actions:
            - 'quicksight:DescribeTemplate'
      VersionDescription: Initial version - Copied over from AWS account.

Create a QuickSight analysis

In this last step, we add the AWS::QuickSight::Analysis section in the CloudFormation template. The analysis is linked to the template created in the target account.

Add the AWS::Quicksight::Analysis resource in the CloudFormation template as shown in the following code:

QSRSBuildQSAnalysis:
    Type: 'AWS::QuickSight::Analysis'
    Properties:
      AnalysisId: 'Sales-Analysis'
      Name: 'Sales-Analysis'
      AwsAccountId:!Sub ${AWS::ACCOUNT ID}
      SourceEntity:
        SourceTemplate:
          Arn: !GetAtt  QSTCFBuildQSTemplate.Arn
          DataSetReferences:
            - DataSetPlaceholder: 'sales'
              DataSetArn: !GetAtt QSRSBuildQSDataSet.Arn
      Permissions:
        - Principal: !Join 
            - ''
            - - 'arn:aws:quicksight:'
              - !Ref QuickSightIdentityRegion
              - ':'
              - !Ref 'AWS::AccountId'
              - ':user/default/'
              - !Ref QuickSightUser
          Actions:
            - 'quicksight:RestoreAnalysis'
            - 'quicksight:UpdateAnalysisPermissions'
            - 'quicksight:DeleteAnalysis'
            - 'quicksight:DescribeAnalysisPermissions'
            - 'quicksight:QueryAnalysis'
            - 'quicksight:DescribeAnalysis'
            - 'quicksight:UpdateAnalysis'      

Deploy the CloudFormation template in the production account

To create a new CloudFormation stack that uses the preceding template via the AWS CloudFormation console, complete the following steps:

  1. On the AWS CloudFormation console, choose Create Stack.
  2. On the drop-down menu, choose with new resources (standard).
  3. For Prepare template, select Template is ready.
  4. For Specify template, choose Upload a template file.
  5. Save the provided CloudFormation template in a .yaml file and upload it.
  6. Choose Next.
  7. Enter a name for the stack. For this post, we use QS-RS-CF-Stack.
  8. Choose Next.
  9. Choose Next again.
  10. Choose Create Stack.

The status of the stack changes to CREATE_IN_PROGRESS, then to CREATE_COMPLETE.

Verify the QuickSight objects in the following table have been created in the production environment.

QuickSight Object Type Object Name (Dev) Object Name ( Prod)
Data Source RS-Sales-DW RS-Sales-DW
Dataset Sales Sales
Template QS-RS-Sales-Temp QS-RS-SalesAnalysis-Temp
Analysis Sales Analysis Sales-Analysis

The following example shows that Sales Analysis was created in the target account.

Conclusion

This post demonstrated an approach to migrate a QuickSight analysis with an Amazon Redshift data source from one QuickSight account to another with a CloudFormation template.

For more information about automating dashboard deployment, customizing access to the QuickSight console, configuring for team collaboration, and implementing multi-tenancy and client user segregation, check out the videos Virtual Admin Workshop: Working with Amazon QuickSight APIs and Admin Level-Up Virtual Workshop, V2 on YouTube.


About the author

Sandeep Bajwa is a Sr. Analytics Specialist based out of Northern Virginia, specialized in the design and implementation of analytics and data lake solutions.

Achieve up to 27% better price-performance for Spark workloads with AWS Graviton2 on Amazon EMR Serverless

Post Syndicated from Karthik Prabhakar original https://aws.amazon.com/blogs/big-data/achieve-up-to-27-better-price-performance-for-spark-workloads-with-aws-graviton2-on-amazon-emr-serverless/

Amazon EMR Serverless is a serverless option in Amazon EMR that makes it simple to run applications using open-source analytics frameworks such as Apache Spark and Hive without configuring, managing, or scaling clusters.

At AWS re:Invent 2022, we announced support for running serverless Spark and Hive workloads with AWS Graviton2 (Arm64) on Amazon EMR Serverless. AWS Graviton2 processors are custom-built by AWS using 64-bit Arm Neoverse cores, delivering a significant leap in price-performance for your cloud workloads.

This post discusses the performance improvements observed while running Apache Spark jobs using AWS Graviton2 on EMR Serverless. We found that Graviton2 on EMR Serverless achieved 10% performance improvement for Spark workloads based on runtime. AWS Graviton2 is offered at a 20% lower cost than the x86 architecture option (see the Amazon EMR pricing page for details), resulting in a 27% overall better price-performance for workloads.

Spark performance test results

The following charts compare the benchmark runtime with and without Graviton2 for a EMR Serverless Spark application (note that the charts are not drawn to scale). We observed up to 10% improvement in total runtime and 8% improvement in geometric mean for the queries compared to x86.

The following table summarizes our results.

Metric Graviton2 x86 %Gain
Total Execution Time (in seconds) 2,670 2,959 10%
Geometric Mean (in seconds) 22.06 24.07 8%

Testing configuration

To evaluate the performance improvements, we use benchmark tests derived from TPC-DS 3 TB scale performance benchmarks. The benchmark consists of 104 queries, and each query is submitted sequentially to an EMR Serverless application. EMR Serverless has automatic and fine-grained scaling enabled by default. Spark provides Dynamic Resource Allocation (DRA) to dynamically adjust the application resources based on the workload, and EMR Serverless uses the signals from DRA to elastically scale workers as needed. For our tests, we chose a predefined pre-initialized capacity that allows the application to scale to default limits. Each application has 1 driver and 100 workers configured as pre-initialized capacity, allowing it to scale to a maximum of 8000 vCPU/60000 GB capacity. When launching the applications, as default we use x86_64 to get baseline numbers and Arm64 for AWS Graviton2, and the application had VPC networking enabled.

The following table summarizes the Spark application configuration.

Number of Drivers Driver Size Number of Executors Executor Size Ephemeral Storage Amazon EMR release label
1 4 vCPUs, 16 GB Memory 100 4 vCPUs, 16 GB Memory 200 G 6.9

Performance test results and cost comparison

Let’s do a cost comparison of the benchmark tests. Because we used 1 driver [4 vCPUs, 16 GB memory] and 100 executors [4 vCPUs, 16 GB memory] for each run, the total capacity used is 4*101=192 vCPUs, 16*101=1616 GB memory, 200*100=20000 GB storage. The following table summarizes the cost.

Test Total time (Seconds) vCPUs Memory (GB) Ephemeral (Storage GB) Cost
x86_64 2,958.82 404 1616 18000 $26.73
Graviton2 2,670.38 404 1616 18000 $19.59

The calculations are as follows:

  • Total vCPU cost = (number of vCPU * per vCPU rate * job runtime in hour)
  • Total GB = (Total GB of memory configured * per GB-hours rate * job runtime in hour)
  • Storage = 20 GB of ephemeral storage is available for all workers by default—you pay only for any additional storage that you configure per worker

Cost breakdown

Let’s look at the cost breakdown for x86:

  • Job runtime – 49.3 minutes = 0.82 hours
  • Total vCPU cost – 404 vCPUs x 0.82 hours job runtime x 0.052624 USD per vCPU = 17.4333 USD
  • Total GB cost – 1,616 memory-GBs x 0.82 hours job runtime x 0.0057785 USD per memory GB = 7.6572 USD
  • Storage cost – 18,000 storage-GBs x 0.82 hours job runtime x 0.000111 USD per storage GB = 1.6386 USD
  • Additional storage – 20,000 GB – 20 GB free tier * 100 workers = 18,000 additional storage GB
  • EMR Serverless total cost (x86): 17.4333 USD + 7.6572 USD + 1.6386 USD = 26.7291 USD

Let’s compare to the cost breakdown for Graviton 2:

  • Job runtime – 44.5 minutes = 0.74 hours
  • Total vCPU cost – 404 vCPUs x 0.74 hours job runtime x 0.042094 USD per vCPU = 12.5844 USD
  • Total GB cost – 1,616 memory-GBs x 0.74 hours job runtime x 0.004628 USD per memory GB = 5.5343 USD
  • Storage cost – 18,000 storage-GBs x 0.74 hours job runtime x 0.000111 USD per storage GB = 1.4785 USD
  • Additional storage – 20,000 GB – 20 GB free tier * 100 workers = 18,000 additional storage GB
  • EMR Serverless total cost (Graviton2): 12.5844 USD + 5.5343 USD + 1.4785 USD = 19.5972 USD

The tests indicate that for the benchmark run, AWS Graviton2 lead to an overall cost savings of 27%.

Individual query improvements and observations

The following chart shows the relative speedup of individual queries with Graviton2 compared to x86.

We see some regression in a few shorter queries, which had little impact on the overall benchmark runtime. We observed better performance gains for long running queries, for example:

  • q67 average 86 seconds for x86, 74 seconds for Graviton2 with 24% runtime performance gain
  • q23a and q23b gained 14% and 16%, respectively
  • q32 regressed by 7%; the difference between average runtime is <500 milliseconds (11.09 seconds for Graviton2 vs. 10.39 seconds for x86)

To quantify performance, we use benchmark SQL derived from TPC-DS 3 TB scale performance benchmarks.

If you’re evaluating migrating your workloads to Graviton2 architecture on EMR Serverless, we recommend testing the Spark workloads based on your real-world use cases. The outcome might vary based on the pre-initialized capacity and number of workers chosen. If you want to run workloads across multiple processor architectures, (for example, test the performance on x86 and Arm vCPUs) follow the walkthrough in the GitHub repo to get started with some concrete ideas.

Conclusion

As demonstrated in this post, Graviton2 on EMR Serverless applications consistently yielded better performance for Spark workloads. Graviton2 is available in all Regions where EMR Serverless is available. To see a list of Regions where EMR Serverless is available, see the EMR Serverless FAQs. To learn more, visit the Amazon EMR Serverless User Guide and sample codes with Apache Spark and Apache Hive.

If you’re wondering how much performance gain you can achieve with your use case, try out the steps outlined in this post and replace with your queries.

To launch your first Spark or Hive application using a Graviton2-based architecture on EMR Serverless, see Getting started with Amazon EMR Serverless.


About the authors

Karthik Prabhakar is a Senior Big Data Solutions Architect for Amazon EMR at AWS. He is an experienced analytics engineer working with AWS customers to provide best practices and technical advice in order to assist their success in their data journey.

Nithish Kumar Murcherla is a Senior Systems Development Engineer on the Amazon EMR Serverless team. He is passionate about distributed computing, containers, and everything and anything about the data.

Amazon EMR Serverless supports larger worker sizes to run more compute and memory-intensive workloads

Post Syndicated from Veena Vasudevan original https://aws.amazon.com/blogs/big-data/amazon-emr-serverless-supports-larger-worker-sizes-to-run-more-compute-and-memory-intensive-workloads/

Amazon EMR Serverless allows you to run open-source big data frameworks such as Apache Spark and Apache Hive without managing clusters and servers. With EMR Serverless, you can run analytics workloads at any scale with automatic scaling that resizes resources in seconds to meet changing data volumes and processing requirements. EMR Serverless automatically scales resources up and down to provide just the right amount of capacity for your application.

We are excited to announce that EMR Serverless now offers worker configurations of 8 vCPUs with up to 60 GB memory and 16 vCPUs with up to 120 GB memory, allowing you to run more compute and memory-intensive workloads on EMR Serverless. An EMR Serverless application internally uses workers to execute workloads. and you can configure different worker configurations based on your workload requirements. Previously, the largest worker configuration available on EMR Serverless was 4 vCPUs with up to 30 GB memory. This capability is especially beneficial for the following common scenarios:

  • Shuffle-heavy workloads
  • Memory-intensive workloads

Let’s look at each of these use cases and the benefits of having larger worker sizes.

Benefits of using large workers for shuffle-intensive workloads

In Spark and Hive, shuffle occurs when data needs to be redistributed across the cluster during a computation. When your application performs wide transformations or reduce operations such as join, groupBy, sortBy, or repartition, Spark and Hive triggers a shuffle. Also, every Spark stage and Tez vertex is bounded by a shuffle operation. Taking Spark as an example, by default, there are 200 partitions for every Spark job defined by spark.sql.shuffle.partitions. However, Spark will compute the number of tasks on the fly based on the data size and the operation being performed. When a wide transformation is performed on top of a large dataset, there could be GBs or even TBs of data that need to be fetched by all the tasks.

Shuffles are typically expensive in terms of both time and resources, and can lead to performance bottlenecks. Therefore, optimizing shuffles can have a significant impact on the performance and cost of a Spark job. With large workers, more data can be allocated to each executor’s memory, which minimizes the data shuffled across executors. This in turn leads to increased shuffle read performance because more data will be fetched locally from the same worker and less data will be fetched remotely from other workers.

Experiments

To demonstrate the benefits of using large workers for shuffle-intensive queries, let’s use q78 from TPC-DS, which is a shuffle-heavy Spark query that shuffles 167 GB of data over 12 Spark stages. Let’s perform two iterations of the same query with different configurations.

The configurations for Test 1 are as follows:

  • Size of executor requested while creating EMR Serverless application = 4 vCPUs, 8 GB memory, 200 GB disk
  • Spark job config:
    • spark.executor.cores = 4
    • spark.executor.memory = 8
    • spark.executor.instances = 48
    • Parallelism = 192 (spark.executor.instances * spark.executor.cores)

The configurations for Test 2 are as follows:

  • Size of executor requested while creating EMR Serverless application = 8 vCPUs, 16 GB memory, 200 GB disk
  • Spark job config:
    • spark.executor.cores = 8
    • spark.executor.memory = 16
    • spark.executor.instances = 24
    • Parallelism = 192 (spark.executor.instances * spark.executor.cores)

Let’s also disable dynamic allocation by setting spark.dynamicAllocation.enabled to false for both tests to avoid any potential noise due to variable executor launch times and keep the resource utilization consistent for both tests. We use Spark Measure, which is an open-source tool that simplifies the collection and analysis of Spark performance metrics. Because we’re using a fixed number of executors, the total number of vCPUs and memory requested are the same for both the tests. The following table summarizes the observations from the metrics collected with Spark Measure.

. Total Time Taken for Query in milliseconds shuffleLocalBlocksFetched shuffleRemoteBlocksFetched shuffleLocalBytesRead shuffleRemoteBytesRead shuffleFetchWaitTime shuffleWriteTime
Test 1 153244 114175 5291825 3.5 GB 163.1 GB 1.9 hr 4.7 min
Test 2 108136 225448 5185552 6.9 GB 159.7 GB 3.2 min 5.2 min

As seen from the table, there is a significant difference in performance due to shuffle improvements. Test 2, with half the number of executors that are twice as large as Test 1, ran 29.44% faster, with 1.97 times more shuffle data fetched locally compared to Test 1 for the same query, same parallelism, and same aggregate vCPU and memory resources. Therefore, you can benefit from improved performance without compromising on cost or job parallelism with the help of large executors. We have observed similar performance benefits for other shuffle-intensive TPC-DS queries such as q23a and q23b.

Recommendations

To determine if the large workers will benefit your shuffle-intensive Spark applications, consider the following:

  • Check the Stages tab from the Spark History Server UI of your EMR Serverless application. For example, from the following screenshot of Spark History Server, we can determine that this Spark job wrote and read 167 GB of shuffle data aggregated across 12 stages, looking at the Shuffle Read and Shuffle Write columns. If your jobs shuffle over 50 GB of data, you may potentially benefit from using larger workers with 8 or 16 vCPUs or spark.executor.cores.

  • Check the SQL / DataFrame tab from the Spark History Server UI of your EMR Serverless application (only for Dataframe and Dataset APIs). When you choose the Spark action performed, such as collect, take, showString, or save, you will see an aggregated DAG for all stages separated by the exchanges. Every exchange in the DAG corresponds to a shuffle operation, and it will contain the local and remote bytes and blocks shuffled, as seen in the following screenshot. If the local shuffle blocks or bytes fetched is much less compared to the remote blocks or bytes fetched, you can rerun your application with larger workers (with 8 or 16 vCPUs or spark.executor.cores) and review these exchange metrics in a DAG to see if there is any improvement.

  • Use the Spark Measure tool with your Spark query to obtain the shuffle metrics in the Spark driver’s stdout logs, as shown in the following log for a Spark job. Review the time taken for shuffle reads (shuffleFetchWaitTime) and shuffle writes (shuffleWriteTime), and the ratio of the local bytes fetched to the remote bytes fetched. If the shuffle operation takes more than 2 minutes, rerun your application with larger workers (with 8 or 16 vCPUs or spark.executor.cores) with Spark Measure to track the improvement in shuffle performance and the overall job runtime.
Time taken: 177647 ms

Scheduling mode = FIFO
Spark Context default degree of parallelism = 192

Aggregated Spark stage metrics:
numStages => 22
numTasks => 10156
elapsedTime => 159894 (2.7 min)
stageDuration => 456893 (7.6 min)
executorRunTime => 28418517 (7.9 h)
executorCpuTime => 20276736 (5.6 h)
executorDeserializeTime => 326486 (5.4 min)
executorDeserializeCpuTime => 124323 (2.1 min)
resultSerializationTime => 534 (0.5 s)
jvmGCTime => 648809 (11 min)
shuffleFetchWaitTime => 340880 (5.7 min)
shuffleWriteTime => 245918 (4.1 min)
resultSize => 23199434 (22.1 MB)
diskBytesSpilled => 0 (0 Bytes)
memoryBytesSpilled => 0 (0 Bytes)
peakExecutionMemory => 1794288453176
recordsRead => 18696929278
bytesRead => 77354154397 (72.0 GB)
recordsWritten => 0
bytesWritten => 0 (0 Bytes)
shuffleRecordsRead => 14124240761
shuffleTotalBlocksFetched => 5571316
shuffleLocalBlocksFetched => 117321
shuffleRemoteBlocksFetched => 5453995
shuffleTotalBytesRead => 158582120627 (147.7 GB)
shuffleLocalBytesRead => 3337930126 (3.1 GB)
shuffleRemoteBytesRead => 155244190501 (144.6 GB)
shuffleRemoteBytesReadToDisk => 0 (0 Bytes)
shuffleBytesWritten => 156913371886 (146.1 GB)
shuffleRecordsWritten => 13867102620

Benefits of using large workers for memory-intensive workloads

Certain types of workloads are memory-intensive and may benefit from more memory configured per worker. In this section, we discuss common scenarios where large workers could be beneficial for running memory-intensive workloads.

Data skew

Data skews commonly occur in several types of datasets. Some common examples are fraud detection, population analysis, and income distribution. For example, when you want to detect anomalies in your data, it’s expected that only less than 1% of the data is abnormal. If you want to perform some aggregation on top of normal vs. abnormal records, 99% of the data will be processed by a single worker, which may lead to that worker running out of memory. Data skews may be observed for memory-intensive transformations like groupBy, orderBy, join, window functions, collect_list, collect_set, and so on. Join types such as BroadcastNestedLoopJoin and Cartesan product are also inherently memory-intensive and susceptible to data skews. Similarly, if your input data is Gzip compressed, a single Gzip file can’t be read by more than one task because the Gzip compression type is unsplittable. When there are a few very large Gzip files in the input, your job may run out of memory because a single task may have to read a huge Gzip file that doesn’t fit in the executor memory.

Failures due to data skew can be mitigated by applying strategies such as salting. However, this often requires extensive changes to the code, which may not be feasible for a production workload that failed due to an unprecedented data skew caused by a sudden surge in incoming data volume. For a simpler workaround, you may just want to increase the worker memory. Using larger workers with more spark.executor.memory allows you to handle data skew without making any changes to your application code.

Caching

In order to improve performance, Spark allows you to cache the data frames, datasets, and RDDs in memory. This enables you to reuse a data frame multiple times in your application without having to recompute it. By default, up to 50% of your executor’s JVM is used to cache the data frames based on the property spark.memory.storageFraction. For example, if your spark.executor.memory is set to 30 GB, then 15 GB is used for cache storage that is immune to eviction.

The default storage level of cache operation is DISK_AND_MEMORY. If the size of the data frame you are trying to cache doesn’t fit in the executor’s memory, a portion of the cache spills to disk. If there isn’t enough space to write the cached data in disk, the blocks are evicted and you don’t get the benefits of caching. Using larger workers allows you to cache more data in memory, boosting job performance by retrieving cached blocks from memory rather than the underlying storage.

Experiments

For example, the following PySpark job leads to a skew, with one executor processing 99.95% of the data with memory-intensive aggregates like collect_list. The job also caches a very large data frame (2.2 TB). Let’s run two iterations of the same job on EMR Serverless with the following vCPU and memory configurations.

Let’s run Test 3 with the previously largest possible worker configurations:

  • Size of executor set while creating EMR Serverless application = 4 vCPUs, 30 GB memory, 200 GB disk
  • Spark job config:
    • spark.executor.cores = 4
    • spark.executor.memory = 27 G

Let’s run Test 4 with the newly released large worker configurations:

  • Size of executor set in while creating EMR Serverless application = 8 vCPUs, 60 GB memory, 200 GB disk
  • Spark job config:
    • spark.executor.cores = 8
    • spark.executor.memory = 54 G

Test 3 failed with FetchFailedException, which resulted due to the executor memory not being sufficient for the job.

Also, from the Spark UI of Test 3, we see that the reserved storage memory of the executors was fully utilized for caching the data frames.

The remaining blocks to cache were spilled to disk, as seen in the executor’s stderr logs:

23/02/06 16:06:58 INFO MemoryStore: Will not store rdd_4_1810
23/02/06 16:06:58 WARN MemoryStore: Not enough space to cache rdd_4_1810 in memory! (computed 134.1 MiB so far)
23/02/06 16:06:58 INFO MemoryStore: Memory use = 14.8 GiB (blocks) + 507.5 MiB (scratch space shared across 4 tasks(s)) = 15.3 GiB. Storage limit = 15.3 GiB.
23/02/06 16:06:58 WARN BlockManager: Persisting block rdd_4_1810 to disk instead.

Around 33% of the persisted data frame was cached on disk, as seen on the Storage tab of the Spark UI.

Test 4 with larger executors and vCores ran successfully without throwing any memory-related errors. Also, only about 2.2% of the data frame was cached to disk. Therefore, cached blocks of a data frame will be retrieved from memory rather than from disk, offering better performance.

Recommendations

To determine if the large workers will benefit your memory-intensive Spark applications, consider the following:

  • Determine if your Spark application has any data skews by looking at the Spark UI. The following screenshot of the Spark UI shows an example data skew scenario where one task processes most of the data (145.2 GB), looking at the Shuffle Read size. If one or fewer tasks process significantly more data than other tasks, rerun your application with larger workers with 60–120 G of memory (spark.executor.memory set anywhere from 54–109 GB factoring in 10% of spark.executor.memoryOverhead).

  • Check the Storage tab of the Spark History Server to review the ratio of data cached in memory to disk from the Size in memory and Size in disk columns. If more than 10% of your data is cached to disk, rerun your application with larger workers to increase the amount of data cached in memory.
  • Another way to preemptively determine if your job needs more memory is by monitoring Peak JVM Memory on the Spark UI Executors tab. If the peak JVM memory used is close to the executor or driver memory, you can create an application with a larger worker and configure a higher value for spark.executor.memory or spark.driver.memory. For example, in the following screenshot, the maximum value of peak JVM memory usage is 26 GB and spark.executor.memory is set to 27 G. In this case, it may be beneficial to use larger workers with 60 GB memory and spark.executor.memory set to 54 G.

Considerations

Although large vCPUs help increase the locality of the shuffle blocks, there are other factors involved such as disk throughput, disk IOPS (input/output operations per second), and network bandwidth. In some cases, more small workers with more disks could offer higher disk IOPS, throughput, and network bandwidth overall compared to fewer large workers. We encourage you to benchmark your workloads against suitable vCPU configurations to choose the best configuration for your workload.

For shuffle-heavy jobs, it’s recommended to use large disks. You can attach up to 200 GB disk to each worker when you create your application. Using large vCPUs (spark.executor.cores) per executor may increase the disk utilization on each worker. If your application fails with “No space left on device” due to the inability to fit shuffle data in the disk, use more smaller workers with 200 GB disk.

Conclusion

In this post, you learned about the benefits of using large executors for your EMR Serverless jobs. For more information about different worker configurations, refer to Worker configurations. Large worker configurations are available in all Regions where EMR Serverless is available.


About the Author

Veena Vasudevan is a Senior Partner Solutions Architect and an Amazon EMR specialist at AWS focusing on big data and analytics. She helps customers and partners build highly optimized, scalable, and secure solutions; modernize their architectures; and migrate their big data workloads to AWS.

How Strategic Blue uses Amazon QuickSight and AWS Cost and Usage Reports to help their customers save millions

Post Syndicated from Frank Contrepois original https://aws.amazon.com/blogs/big-data/how-strategic-blue-uses-amazon-quicksight-and-aws-cost-and-usage-reports-to-help-their-customers-save-millions/

This is a guest post co-written with Frank Contrepois from Strategic Blue.

For over 10 years, Strategic Blue has helped organizations unlock the most value from the cloud by enabling their customers to purchase non-standard commitments. By taking a commodity trading approach to purchasing from AWS, Strategic Blue helps customers purchase commitments for varying lengths of time, such as a 9-month Reserved Instance or an 18-month Savings Plan. Over the years, they’ve been able to help customers save millions by maximizing commitments.

In this post, we share how Strategic Blue uses Amazon QuickSight and AWS Cost and Usage Reports to help their customers save costs.

The challenge

Buying and selling AWS differently means that the cost and usage data available to Strategic Blue on the AWS Management Console only matches what they purchased—not what their customers purchased. In order to accurately bill their customers, Strategic Blue has built a billing system that takes AWS Cost and Usage Reports (CUR) as input and outputs a pro forma CUR that matches what their customers would expect to see. Although the CUR remains a critical source of data, it can have hundreds of columns and millions of rows, making it very difficult for Strategic Blue’s customers to visualize and understand.

Initially, in order to give their customers a way to visualize and understand their spend, Strategic Blue started building a dashboard from scratch using QuickSight, AWS Glue, and Amazon Athena. The idea was to build a dashboard accessible to all of Strategic Blue’s customers (as soon as they were onboarded) that enabled them to see their true cost and usage. QuickSight provides modern interactive dashboards that enable fast time-to-insights and have features that allow for the easy embedding of dashboards into web applications linked to a customer’s single sign-on (SSO) solution. Combined with row-level-security, a dashboard can be pre-filtered to show an individual user’s cost and usage information for only the accounts they are responsible for.

However, figuring out how to accurately show cost and usage insights from the CUR from scratch was a challenge. The amount of work required to decode the raw content of the CUR to build something that matches what you would see in AWS Cost Explorer quickly became overwhelming.

The solution

To help you visualize the treasure trove of data available in a CUR file, AWS created the Cloud Intelligence Dashboards solution. The Cloud Intelligence Dashboards provide a full stack of capabilities, deployed via AWS CloudFormation or other methods, that include six different QuickSight dashboards geared towards helping you optimize your spend on AWS.

Strategic Blue deployed the CUDOS Dashboard (one of the six dashboards available as of this writing) to solve their business case for providing their customers with accurate, comprehensive insights into their cost and usage.

“The Cloud Intelligence Dashboards provided all of the accurate CUR calculations and maintenance we need. This saves us many hours of reverse engineering to keep pace with AWS innovation and changes as their product and billing mechanisms mature.”

– Frank Contrepois, Head of FinOps at Strategic Blue.

The following screenshot shows an example of the dashboard.

Embedding and scaling to all customers

Strategic Blue uses the embedding and row-level security features of QuickSight to scale the dashboards to every customer the moment they are onboarded. By integrating their SSO Amazon Cognito with QuickSight, Strategic Blue is able to provide customers instant access to an instance of CUDOS through a portal as soon as they are onboarded to Strategic Blue’s platform. The row-level security setup managed by administrators within Strategic Blue makes sure that their customers only ever see their own cost and usage data. This helps Strategic Blue offer the protection and security customers expect.

To see the Strategic Blue portal with embedded CUDOS in action, watch the following demo video, or to unlock your savings potential in the cloud, sign up with Strategic Blue now.

Now that CUDOS is embedded into Strategic Blue’s portal, they are able to offer additional value free of charge to their customers. Strategic Blue’s portal uses the customer’s CUDOS dashboard to find opportunities to save and optimize. After the engagement, Strategic Blue will continue to analyze the impact of their customer’s cost optimization measures, reporting back to them what they’ve saved and what additional opportunities there are to further optimize.

Strategic Blue is already seeing an impact. Since enabling an embedded version of CUDOS for every customer and for internal teams, Strategic Blue is seeing a 27% increase in positive feedback for regular meetings, 31% fewer support tickets related to questions about cost, and a move from tactical to strategic FinOps conversations.

The future

Strategic Blue plans to evaluate and embed the rest of the Cloud Intelligence Dashboards, such as the KPI Dashboard to help customers track goals and metrics around cost optimization, and the Trusted Advisor Organizational Dashboard, which helps customers stay on top of underutilized resources as well as operational information such as security and fault tolerance postures. With the foundation in place and QuickSight’s ease of use, Strategic Blue will continue working closely with customers to customize and refine the dashboards to meet specific customer needs, improving and expanding their offerings.

Conclusion

In this post, we covered how Strategic Blue used Cloud Intelligence Dashboards built on QuickSight to help customers get accurate insights into their cloud cost and usage. Strategic Blue’s customers can access stunning and interactive dashboards that can be customized with ease and without the need for technical skills. The comprehensive embedding capabilities, granular row-level-security, and SSO integrations of QuickSight ensure that Strategic Blue is able to provide customers secure and seamless access to their Cloud Intelligence Dashboards.

It’s easy to install Cloud Intelligence Dashboards in your account. Visit Cloud Intelligence Dashboards for details on how to deploy the dashboards today, and let us know how it goes.


About the Authors

Frank Contrepois is the Head of FinOps at Strategic Blue. Frank and his team support a wide range of customers to implement Cloud FinOps including small-and medium-sized organizations, private equity (PE) funds and investors, enterprises and global cloud resellers striking significant deals. He is an AWS APN Ambassador and has several AWS and GCP pro-level certifications. Outside of work, he is a husband, father of two wonderful boys, and co-host of the “What’s new with in Cloud FinOps” podcast.

Aaron Edell is Head of GTM for Customer Cloud Intelligence for Amazon Web Services. He is responsible for building and scaling businesses around Cloud Financial Management, FinOps, and the Well-Architected Cost Optimization pillar. He focuses his GTM efforts on the Cloud Intelligence Dashboards and remains obsessed with helping all customers get better visibility and access to their cost and usage data.

Automate replication of relational sources into a transactional data lake with Apache Iceberg and AWS Glue

Post Syndicated from Luis Gerardo Baeza original https://aws.amazon.com/blogs/big-data/automate-replication-of-relational-sources-into-a-transactional-data-lake-with-apache-iceberg-and-aws-glue/

Organizations have chosen to build data lakes on top of Amazon Simple Storage Service (Amazon S3) for many years. A data lake is the most popular choice for organizations to store all their organizational data generated by different teams, across business domains, from all different formats, and even over history. According to a study, the average company is seeing the volume of their data growing at a rate that exceeds 50% per year, usually managing an average of 33 unique data sources for analysis.

Teams often try to replicate thousands of jobs from relational databases with the same extract, transform, and load (ETL) pattern. There is lot of effort in maintaining the job states and scheduling these individual jobs. This approach helps the teams add tables with few changes and also maintains the job status with minimum effort. This can lead to a huge improvement in the development timeline and tracking the jobs with ease.

In this post, we show you how to easily replicate all your relational data stores into a transactional data lake in an automated fashion with a single ETL job using Apache Iceberg and AWS Glue.

Solution architecture

Data lakes are usually organized using separate S3 buckets for three layers of data: the raw layer containing data in its original form, the stage layer containing intermediate processed data optimized for consumption, and the analytics layer containing aggregated data for specific use cases. In the raw layer, tables usually are organized based on their data sources, whereas tables in the stage layer are organized based on the business domains they belong to.

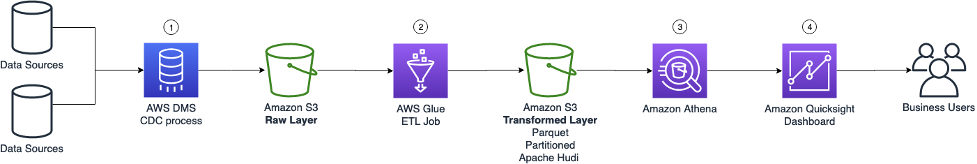
This post provides an AWS CloudFormation template that deploys an AWS Glue job that reads an Amazon S3 path for one data source of the data lake raw layer, and ingests the data into Apache Iceberg tables on the stage layer using AWS Glue support for data lake frameworks. The job expects tables in the raw layer to be structured in the way AWS Database Migration Service (AWS DMS) ingests them: schema, then table, then data files.

This solution uses AWS Systems Manager Parameter Store for table configuration. You should modify this parameter specifying the tables you want to process and how, including information such as primary key, partitions, and the business domain associated. The job uses this information to automatically create a database (if it doesn’t already exist) for every business domain, create the Iceberg tables, and perform the data loading.

Finally, we can use Amazon Athena to query the data in the Iceberg tables.

The following diagram illustrates this architecture.

Solution architecture

This implementation has the following considerations:

  • All tables from the data source must have a primary key to be replicated using this solution. The primary key can be a single column or a composite key with more than one column.
  • If the data lake contains tables that don’t need upserts or don’t have a primary key, you can exclude them from the parameter configuration and implement traditional ETL processes to ingest them into the data lake. That’s outside of the scope of this post.
  • If there are additional data sources that need to be ingested, you can deploy multiple CloudFormation stacks, one to handle each data source.
  • The AWS Glue job is designed to process data in two phases: the initial load that runs after AWS DMS finishes the full load task, and the incremental load that runs on a schedule that applies change data capture (CDC) files captured by AWS DMS. Incremental processing is performed using an AWS Glue job bookmark.

There are nine steps to complete this tutorial:

  1. Set up a source endpoint for AWS DMS.
  2. Deploy the solution using AWS CloudFormation.
  3. Review the AWS DMS replication task.
  4. Optionally, add permissions for encryption and decryption or AWS Lake Formation.
  5. Review the table configuration on Parameter Store.
  6. Perform initial data loading.
  7. Perform incremental data loading.
  8. Monitor table ingestion.
  9. Schedule incremental batch data loading.

Prerequisites

Before starting this tutorial, you should already be familiar with Iceberg. If you’re not, you can get started by replicating a single table following the instructions in Implement a CDC-based UPSERT in a data lake using Apache Iceberg and AWS Glue. Additionally, set up the following:

Set up a source endpoint for AWS DMS

Before we create our AWS DMS task, we need to set up a source endpoint to connect to the source database:

  1. On the AWS DMS console, choose Endpoints in the navigation pane.
  2. Choose Create endpoint.
  3. If your database is running on Amazon RDS, choose Select RDS DB instance, then choose the instance from the list. Otherwise, choose the source engine and provide the connection information either through AWS Secrets Manager or manually.
  4. For Endpoint identifier, enter a name for the endpoint; for example, source-postgresql.
  5. Choose Create endpoint.

Deploy the solution using AWS CloudFormation

Create a CloudFormation stack using the provided template. Complete the following steps:

  1. Choose Launch Stack:
  2. Choose Next.
  3. Provide a stack name, such as transactionaldl-postgresql.
  4. Enter the required parameters:
    1. DMSS3EndpointIAMRoleARN – The IAM role ARN for AWS DMS to write data into Amazon S3.
    2. ReplicationInstanceArn – The AWS DMS replication instance ARN.
    3. S3BucketStage – The name of the existing bucket used for the stage layer of the data lake.
    4. S3BucketGlue – The name of the existing S3 bucket for storing AWS Glue scripts.
    5. S3BucketRaw – The name of the existing bucket used for the raw layer of the data lake.
    6. SourceEndpointArn – The AWS DMS endpoint ARN that you created earlier.
    7. SourceName – The arbitrary identifier of the data source to replicate (for example, postgres). This is used to define the S3 path of the data lake (raw layer) where data will be stored.
  5. Do not modify the following parameters:
    1. SourceS3BucketBlog – The bucket name where the provided AWS Glue script is stored.
    2. SourceS3BucketPrefix – The bucket prefix name where the provided AWS Glue script is stored.
  6. Choose Next twice.
  7. Select I acknowledge that AWS CloudFormation might create IAM resources with custom names.
  8. Choose Create stack.

After approximately 5 minutes, the CloudFormation stack is deployed.

Review the AWS DMS replication task

The AWS CloudFormation deployment created an AWS DMS target endpoint for you. Because of two specific endpoint settings, the data will be ingested as we need it on Amazon S3.

  1. On the AWS DMS console, choose Endpoints in the navigation pane.
  2. Search for and choose the endpoint that begins with dmsIcebergs3endpoint.
  3. Review the endpoint settings:
    1. DataFormat is specified as parquet.
    2. TimestampColumnName will add the column last_update_time with the date of creation of the records on Amazon S3.

AWS DMS endpoint settings

The deployment also creates an AWS DMS replication task that begins with dmsicebergtask.

  1. Choose Replication tasks in the navigation pane and search for the task.

You will see that the Task Type is marked as Full load, ongoing replication. AWS DMS will perform an initial full load of existing data, and then create incremental files with changes performed to the source database.

On the Mapping Rules tab, there are two types of rules:

  • A selection rule with the name of the source schema and tables that will be ingested from the source database. By default, it uses the sample database provided in the prerequisites, dms_sample, and all tables with the keyword %.
  • Two transformation rules that include in the target files on Amazon S3 the schema name and table name as columns. This is used by our AWS Glue job to know to which tables the files in the data lake correspond.

To learn more about how to customize this for your own data sources, refer to Selection rules and actions.

AWS mapping rules

Let’s change some configurations to finish our task preparation.

  1. On the Actions menu, choose Modify.
  2. In the Task Settings section, under Stop task after full load completes, choose Stop after applying cached changes.

This way, we can control the initial load and incremental file generation as two different steps. We use this two-step approach to run the AWS Glue job once per each step.

  1. Under Task logs, choose Turn on CloudWatch logs.
  2. Choose Save.
  3. Wait about 1 minute for the database migration task status to show as Ready.

Add permissions for encryption and decryption or Lake Formation

Optionally, you can add permissions for encryption and decryption or Lake Formation.

Add encryption and decryption permissions

If your S3 buckets used for the raw and stage layers are encrypted using AWS Key Management Service (AWS KMS) customer managed keys, you need to add permissions to allow the AWS Glue job to access the data:

Add Lake Formation permissions

If you’re managing permissions using Lake Formation, you need to allow your AWS Glue job to create your domain’s databases and tables through the IAM role GlueJobRole.

  1. Grant permissions to create databases (for instructions, refer to Creating a Database).
  2. Grant SUPER permissions to the default database.
  3. Grant data location permissions.
  4. If you create databases manually, grant permissions on all databases to create tables. Refer to Granting table permissions using the Lake Formation console and the named resource method or Granting Data Catalog permissions using the LF-TBAC method according to your use case.

After you complete the later step of performing the initial data load, make sure to also add permissions for consumers to query the tables. The job role will become the owner of all the tables created, and the data lake admin can then perform grants to additional users.

Review table configuration in Parameter Store

The AWS Glue job that performs the data ingestion into Iceberg tables uses the table specification provided in Parameter Store. Complete the following steps to review the parameter store that was configured automatically for you. If needed, modify according to your own needs.

  1. On the Parameter Store console, choose My parameters in the navigation pane.

The CloudFormation stack created two parameters:

  • iceberg-config for job configurations
  • iceberg-tables for table configuration
  1. Choose the parameter iceberg-tables.

The JSON structure contains information that AWS Glue uses to read data and write the Iceberg tables on the target domain:

  • One object per table – The name of the object is created using the schema name, a period, and the table name; for example, schema.table.
  • primaryKey – This should be specified for every source table. You can provide a single column or a comma-separated list of columns (without spaces).
  • partitionCols – This optionally partitions columns for target tables. If you don’t want to create partitioned tables, provide an empty string. Otherwise, provide a single column or a comma-separated list of columns to be used (without spaces).
  1. If you want to use your own data source, use the following JSON code and replace the text in CAPS from the template provided. If you’re using the sample data source provided, keep the default settings:
{
    "SCHEMA_NAME.TABLE_NAME_1": {
        "primaryKey": "ONLY_PRIMARY_KEY",
        "domain": "TARGET_DOMAIN",
        "partitionCols": ""
    },
    "SCHEMA_NAME.TABLE_NAME_2": {
        "primaryKey": "FIRST_PRIMARY_KEY,SECOND_PRIMARY_KEY",
        "domain": "TARGET_DOMAIN",
        "partitionCols": "PARTITION_COLUMN_ONE,PARTITION_COLUMN_TWO"
    }
}
  1. Choose Save changes.

Perform initial data loading

Now that the required configuration is finished, we ingest the initial data. This step includes three parts: ingesting the data from the source relational database into the raw layer of the data lake, creating the Iceberg tables on the stage layer of the data lake, and verifying results using Athena.

Ingest data into the raw layer of the data lake

To ingest data from the relational data source (PostgreSQL if you are using the sample provided) to our transactional data lake using Iceberg, complete the following steps:

  1. On the AWS DMS console, choose Database migration tasks in the navigation pane.
  2. Select the replication task you created and on the Actions menu, choose Restart/Resume.
  3. Wait about 5 minutes for the replication task to complete. You can monitor the tables ingested on the Statistics tab of the replication task.

AWS DMS full load statistics

After some minutes, the task finishes with the message Full load complete.

  1. On the Amazon S3 console, choose the bucket you defined as the raw layer.

Under the S3 prefix defined on AWS DMS (for example, postgres), you should see a hierarchy of folders with the following structure:

  • Schema
    • Table name
      • LOAD00000001.parquet
      • LOAD0000000N.parquet

AWS DMS full load objects created on S3

If your S3 bucket is empty, review Troubleshooting migration tasks in AWS Database Migration Service before running the AWS Glue job.

Create and ingest data into Iceberg tables

Before running the job, let’s navigate the script of the AWS Glue job provided as part of the CloudFormation stack to understand its behavior.

  1. On the AWS Glue Studio console, choose Jobs in the navigation pane.
  2. Search for the job that starts with IcebergJob- and a suffix of your CloudFormation stack name (for example, IcebergJob-transactionaldl-postgresql).
  3. Choose the job.

AWS Glue ETL job review

The job script gets the configuration it needs from Parameter Store. The function getConfigFromSSM() returns job-related configurations such as source and target buckets from where the data needs to be read and written. The variable ssmparam_table_values contain table-related information like the data domain, table name, partition columns, and primary key of the tables that needs to be ingested. See the following Python code:

# Main application
args = getResolvedOptions(sys.argv, ['JOB_NAME', 'stackName'])
SSM_PARAMETER_NAME = f"{args['stackName']}-iceberg-config"
SSM_TABLE_PARAMETER_NAME = f"{args['stackName']}-iceberg-tables"

# Parameters for job
rawS3BucketName, rawBucketPrefix, stageS3BucketName, warehouse_path = getConfigFromSSM(SSM_PARAMETER_NAME)
ssm_param_table_values = json.loads(ssmClient.get_parameter(Name = SSM_TABLE_PARAMETER_NAME)['Parameter']['Value'])
dropColumnList = ['db','table_name', 'schema_name','Op', 'last_update_time', 'max_op_date']

The script uses an arbitrary catalog name for Iceberg that is defined as my_catalog. This is implemented on the AWS Glue Data Catalog using Spark configurations, so a SQL operation pointing to my_catalog will be applied on the Data Catalog. See the following code:

catalog_name = 'my_catalog'
errored_table_list = []

# Iceberg configuration
spark = SparkSession.builder \
    .config('spark.sql.warehouse.dir', warehouse_path) \
    .config(f'spark.sql.catalog.{catalog_name}', 'org.apache.iceberg.spark.SparkCatalog') \
    .config(f'spark.sql.catalog.{catalog_name}.warehouse', warehouse_path) \
    .config(f'spark.sql.catalog.{catalog_name}.catalog-impl', 'org.apache.iceberg.aws.glue.GlueCatalog') \
    .config(f'spark.sql.catalog.{catalog_name}.io-impl', 'org.apache.iceberg.aws.s3.S3FileIO') \
    .config('spark.sql.extensions', 'org.apache.iceberg.spark.extensions.IcebergSparkSessionExtensions') \
    .getOrCreate()

The script iterates over the tables defined in Parameter Store and performs the logic for detecting if the table exists and if the incoming data is an initial load or an upsert:

# Iteration over tables stored on Parameter Store
for key in ssm_param_table_values:
    # Get table data
    isTableExists = False
    schemaName, tableName = key.split('.')
    logger.info(f'Processing table : {tableName}')

The initialLoadRecordsSparkSQL() function loads initial data when no operation column is present in the S3 files. AWS DMS adds this column only to Parquet data files produced by the continuous replication (CDC). The data loading is performed using the INSERT INTO command with SparkSQL. See the following code:

sqltemp = Template("""
    INSERT INTO $catalog_name.$dbName.$tableName  ($insertTableColumnList)
    SELECT $insertTableColumnList FROM insertTable $partitionStrSQL
""")
SQLQUERY = sqltemp.substitute(
    catalog_name = catalog_name, 
    dbName = dbName, 
    tableName = tableName,
    insertTableColumnList = insertTableColumnList[ : -1],
    partitionStrSQL = partitionStrSQL)

logger.info(f'****SQL QUERY IS : {SQLQUERY}')
spark.sql(SQLQUERY)

Now we run the AWS Glue job to ingest the initial data into the Iceberg tables. The CloudFormation stack adds the --datalake-formats parameter, adding the required Iceberg libraries to the job.

  1. Choose Run job.
  2. Choose Job Runs to monitor the status. Wait until the status is Run Succeeded.

Verify the data loaded

To confirm that the job processed the data as expected, complete the following steps:

  1. On the Athena console, choose Query Editor in the navigation pane.
  2. Verify AwsDataCatalog is selected as the data source.
  3. Under Database, choose the data domain that you want to explore, based on the configuration you defined in the parameter store. If using the sample database provided, use sports.

Under Tables and views, we can see the list of tables that were created by the AWS Glue job.

  1. Choose the options menu (three dots) next to the first table name, then choose Preview Data.

You can see the data loaded into Iceberg tables. Amazon Athena review initial data loaded

Perform incremental data loading

Now we start capturing changes from our relational database and applying them to the transactional data lake. This step is also divided in three parts: capturing the changes, applying them to the Iceberg tables, and verifying the results.

Capture changes from the relational database

Due to the configuration we specified, the replication task stopped after running the full load phase. Now we restart the task to add incremental files with changes into the raw layer of the data lake.

  1. On the AWS DMS console, select the task we created and ran before.
  2. On the Actions menu, choose Resume.
  3. Choose Start task to start capturing changes.
  4. To trigger new file creation on the data lake, perform inserts, updates, or deletes on the tables of your source database using your preferred database administration tool. If using the sample database provided, you could run the following SQL commands:
UPDATE dms_sample.nfl_stadium_data_upd
SET seatin_capacity=93703
WHERE team = 'Los Angeles Rams' and sport_location_id = '31';

update  dms_sample.mlb_data 
set bats = 'R'
where mlb_id=506560 and bats='L';

update dms_sample.sporting_event 
set start_date  = current_date 
where id=11 and sold_out=0;
  1. On the AWS DMS task details page, choose the Table statistics tab to see the changes captured.
    AWS DMS CDC statistics
  2. Open the raw layer of the data lake to find a new file holding the incremental changes inside every table’s prefix, for example under the sporting_event prefix.

The record with changes for the sporting_event table looks like the following screenshot.

AWS DMS objects migrated into S3 with CDC

Notice the Op column in the beginning identified with an update (U). Also, the second date/time value is the control column added by AWS DMS with the time the change was captured.

CDC file schema on Amazon S3

Apply changes on the Iceberg tables using AWS Glue

Now we run the AWS Glue job again, and it will automatically process only the new incremental files since the job bookmark is enabled. Let’s review how it works.

The dedupCDCRecords() function performs deduplication of data because multiple changes to a single record ID could be captured within the same data file on Amazon S3. Deduplication is performed based on the last_update_time column added by AWS DMS that indicates the timestamp of when the change was captured. See the following Python code:

def dedupCDCRecords(inputDf, keylist):
    IDWindowDF = Window.partitionBy(*keylist).orderBy(inputDf.last_update_time).rangeBetween(-sys.maxsize, sys.maxsize)
    inputDFWithTS = inputDf.withColumn('max_op_date', max(inputDf.last_update_time).over(IDWindowDF))
    
    NewInsertsDF = inputDFWithTS.filter('last_update_time=max_op_date').filter("op='I'")
    UpdateDeleteDf = inputDFWithTS.filter('last_update_time=max_op_date').filter("op IN ('U','D')")
    finalInputDF = NewInsertsDF.unionAll(UpdateDeleteDf)

    return finalInputDF

On line 99, the upsertRecordsSparkSQL() function performs the upsert in a similar fashion to the initial load, but this time with a SQL MERGE command.

Review the applied changes

Open the Athena console and run a query that selects the changed records on the source database. If using the provided sample database, use one the following SQL queries:

SELECT * FROM "sports"."nfl_stadiu_data_upd"
WHERE team = 'Los Angeles Rams' and sport_location_id = 31
LIMIT 1;

Amazon Athena review cdc data loaded

Monitor table ingestion

The AWS Glue job script is coded with simple Python exception handling to catch errors during processing a specific table. The job bookmark is saved after each table finishes processing successfully, to avoid reprocessing tables if the job run is retried for the tables with errors.

The AWS Command Line Interface (AWS CLI) provides a get-job-bookmark command for AWS Glue that provides insight into the status of the bookmark for each table processed.

  1. On the AWS Glue Studio console, choose the ETL job.
  2. Choose the Job Runs tab and copy the job run ID.
  3. Run the following command on a terminal authenticated for the AWS CLI, replacing <GLUE_JOB_RUN_ID> on line 1 with the value you copied. If your CloudFormation stack is not named transactionaldl-postgresql, provide the name of your job on line 2 of the script:
jobrun=<GLUE_JOB_RUN_ID>
jobname=IcebergJob-transactionaldl-postgresql
aws glue get-job-bookmark --job-name jobname --run-id $jobrun

In this solution, when a table processing causes an exception, the AWS Glue job will not fail according to this logic. Instead, the table will be added into an array that is printed after the job is complete. In such scenario, the job will be marked as failed after it tries to process the rest of the tables detected on the raw data source. This way, tables without errors don’t have to wait until the user identifies and solves the problem on the conflicting tables. The user can quickly detect job runs that had issues using the AWS Glue job run status, and identify which specific tables are causing the problem using the CloudWatch logs for the job run.

  1. The job script implements this feature with the following Python code:
# Performed for every table
        try:
            # Table processing logic
        except Exception as e:
            logger.info(f'There is an issue with table: {tableName}')
            logger.info(f'The exception is : {e}')
            errored_table_list.append(tableName)
            continue
        job.commit()
if (len(errored_table_list)):
    logger.info('Total number of errored tables are ',len(errored_table_list))
    logger.info('Tables that failed during processing are ', *errored_table_list, sep=', ')
    raise Exception(f'***** Some tables failed to process.')

The following screenshot shows how the CloudWatch logs look for tables that cause errors on processing.

AWS Glue job monitoring with logs

Aligned with the AWS Well-Architected Framework Data Analytics Lens practices, you can adapt more sophisticated control mechanisms to identify and notify stakeholders when errors appear on the data pipelines. For example, you can use an Amazon DynamoDB control table to store all tables and job runs with errors, or using Amazon Simple Notification Service (Amazon SNS) to send alerts to operators when certain criteria is met.

Schedule incremental batch data loading

The CloudFormation stack deploys an Amazon EventBridge rule (disabled by default) that can trigger the AWS Glue job to run on a schedule. To provide your own schedule and enable the rule, complete the following steps:

  1. On the EventBridge console, choose Rules in the navigation pane.
  2. Search for the rule prefixed with the name of your CloudFormation stack followed by JobTrigger (for example, transactionaldl-postgresql-JobTrigger-randomvalue).
  3. Choose the rule.
  4. Under Event Schedule, choose Edit.

The default schedule is configured to trigger every hour.

  1. Provide the schedule you want to run the job.
  2. Additionally, you can use an EventBridge cron expression by selecting A fine-grained schedule.
    Amazon EventBridge schedule ETL job
  3. When you finish setting up the cron expression, choose Next three times, and finally choose Update Rule to save changes.

The rule is created disabled by default to allow you to run the initial data load first.

  1. Activate the rule by choosing Enable.

You can use the Monitoring tab to view rule invocations, or directly on the AWS Glue Job Run details.

Conclusion

After deploying this solution, you have automated the ingestion of your tables on a single relational data source. Organizations using a data lake as their central data platform usually need to handle multiple, sometimes even tens of data sources. Also, more and more use cases require organizations to implement transactional capabilities to the data lake. You can use this solution to accelerate the adoption of such capabilities across all your relational data sources to enable new business use cases, automating the implementation process to derive more value from your data.


About the Authors

Luis Gerardo BaezaLuis Gerardo Baeza is a Big Data Architect in the Amazon Web Services (AWS) Data Lab. He has 12 years of experience helping organizations in the healthcare, financial and education sectors to adopt enterprise architecture programs, cloud computing, and data analytics capabilities. Luis currently helps organizations across Latin America to accelerate strategic data initiatives.

SaiKiran Reddy AenuguSaiKiran Reddy Aenugu is a Data Architect in the Amazon Web Services (AWS) Data Lab. He has 10 years of experience implementing data loading, transformation, and visualization processes. SaiKiran currently helps organizations in North America to adopt modern data architectures such as data lakes and data mesh. He has experience in the retail, airline, and finance sectors.

Narendra MerlaNarendra Merla is a Data Architect in the Amazon Web Services (AWS) Data Lab. He has 12 years of experience in designing and productionalizing both real-time and batch-oriented data pipelines and building data lakes on both cloud and on-premises environments. Narendra currently helps organizations in North America to build and design robust data architectures, and has experience in the telecom and finance sectors.

How to visualize IAM Access Analyzer policy validation findings with QuickSight

Post Syndicated from Mostefa Brougui original https://aws.amazon.com/blogs/security/how-to-visualize-iam-access-analyzer-policy-validation-findings-with-quicksight/

In this blog post, we show you how to create an Amazon QuickSight dashboard to visualize the policy validation findings from AWS Identity and Access Management (IAM) Access Analyzer. You can use this dashboard to better understand your policies and how to achieve least privilege by periodically validating your IAM roles against IAM best practices. This blog post walks you through the deployment for a multi-account environment using AWS Organizations.

Achieving least privilege is a continuous cycle to grant only the permissions that your users and systems require. To achieve least privilege, you start by setting fine-grained permissions. Then, you verify that the existing access meets your intent. Finally, you refine permissions by removing unused access. To learn more, see IAM Access Analyzer makes it easier to implement least privilege permissions by generating IAM policies based on access activity.

Policy validation is a feature of IAM Access Analyzer that guides you to author and validate secure and functional policies with more than 100 policy checks. You can use these checks when creating new policies or to validate existing policies. To learn how to use IAM Access Analyzer policy validation APIs when creating new policies, see Validate IAM policies in CloudFormation templates using IAM Access Analyzer. In this post, we focus on how to validate existing IAM policies.

Approach to visualize IAM Access Analyzer findings

As shown in Figure 1, there are four high-level steps to build the visualization.

Figure 1: Steps to visualize IAM Access Analyzer findings

Figure 1: Steps to visualize IAM Access Analyzer findings

  1. Collect IAM policies

    To validate your IAM policies with IAM Access Analyzer in your organization, start by periodically sending the content of your IAM policies (inline and customer-managed) to a central account, such as your Security Tooling account.

  2. Validate IAM policies

    After you collect the IAM policies in a central account, run an IAM Access Analyzer ValidatePolicy API call on each policy. The API calls return a list of findings. The findings can help you identify issues, provide actionable recommendations to resolve the issues, and enable you to author functional policies that can meet security best practices. The findings are stored in an Amazon Simple Storage Service (Amazon S3) bucket. To learn about different findings, see Access Analyzer policy check reference.

  3. Visualize findings

    IAM Access Analyzer policy validation findings are stored centrally in an S3 bucket. The S3 bucket is owned by the central (hub) account of your choosing. You can use Amazon Athena to query the findings from the S3 bucket, and then create a QuickSight analysis to visualize the findings.

  4. Publish dashboards

    Finally, you can publish a shareable QuickSight dashboard. Figure 2 shows an example of the dashboard.

    Figure 2: Dashboard overview

    Figure 2: Dashboard overview

Design overview

This implementation is a serverless job initiated by Amazon EventBridge rules. It collects IAM policies into a hub account (such as your Security Tooling account), validates the policies, stores the validation results in an S3 bucket, and uses Athena to query the findings and QuickSight to visualize them. Figure 3 gives a design overview of our implementation.

Figure 3: Design overview of the implementation

Figure 3: Design overview of the implementation

As shown in Figure 3, the implementation includes the following steps:

  1. A time-based rule is set to run daily. The rule triggers an AWS Lambda function that lists the IAM policies of the AWS account it is running in.
  2. For each IAM policy, the function sends a message to an Amazon Simple Queue Service (Amazon SQS) queue. The message contains the IAM policy Amazon Resource Name (ARN), and the policy document.
  3. When new messages are received, the Amazon SQS queue initiates the second Lambda function. For each message, the Lambda function extracts the policy document and validates it by using the IAM Access Analyzer ValidatePolicy API call.
  4. The Lambda function stores validation results in an S3 bucket.
  5. An AWS Glue table contains the schema for the IAM Access Analyzer findings. Athena natively uses the AWS Glue Data Catalog.
  6. Athena queries the findings stored in the S3 bucket.
  7. QuickSight uses Athena as a data source to visualize IAM Access Analyzer findings.

Benefits of the implementation

By implementing this solution, you can achieve the following benefits:

  • Store your IAM Access Analyzer policy validation results in a scalable and cost-effective manner with Amazon S3.
  • Add scalability and fault tolerance to your validation workflow with Amazon SQS.
  • Partition your evaluation results in Athena and restrict the amount of data scanned by each query, helping to improve performance and reduce cost.
  • Gain insights from IAM Access Analyzer policy validation findings with QuickSight dashboards. You can use the dashboard to identify IAM policies that don’t comply with AWS best practices and then take action to correct them.

Prerequisites

Before you implement the solution, make sure you’ve completed the following steps:

  1. Install a Git client, such as GitHub Desktop.
  2. Install the AWS Command Line Interface (AWS CLI). For instructions, see Installing or updating the latest version of the AWS CLI.
  3. If you plan to deploy the implementation in a multi-account environment using Organizations, enable all features and enable trusted access with Organizations to operate a service-managed stack set.
  4. Get a QuickSight subscription to the Enterprise edition. When you first subscribe to the Enterprise edition, you get a free trial for four users for 30 days. Trial authors are automatically converted to month-to-month subscription upon trial expiry. For more details, see Signing up for an Amazon QuickSight subscription, Amazon QuickSight Enterprise edition and the Amazon QuickSight Pricing Calculator.

Note: This implementation works in accounts that don’t have AWS Lake Formation enabled. If Lake Formation is enabled in your account, you might need to grant Lake Formation permissions in addition to the implementation IAM permissions. For details, see Lake Formation access control overview.

Walkthrough

In this section, we will show you how to deploy an AWS CloudFormation template to your central account (such as your Security Tooling account), which is the hub for IAM Access Analyzer findings. The central account collects, validates, and visualizes your findings.

To deploy the implementation to your multi-account environment

  1. Deploy the CloudFormation stack to your central account.

    Important: Do not deploy the template to the organization’s management account; see design principles for organizing your AWS accounts. You can choose the Security Tooling account as a hub account.

    In your central account, run the following commands in a terminal. These commands clone the GitHub repository and deploy the CloudFormation stack to your central account.

    # A) Clone the repository
    git clone https://github.com/aws-samples/visualize-iam-access-analyzer-policy-validation-findings.git
      # B) Switch to the repository's directory cd visualize-iam-access-analyzer-policy-validation-findings
      # C) Deploy the CloudFormation stack to your central security account (hub). For <AWSRegion> enter your AWS Region without quotes. make deploy-hub aws-region=<AWSRegion>

    If you want to send IAM policies from other member accounts to your central account, you will need to make note of the CloudFormation stack outputs for SQSQueueUrl and KMSKeyArn when the deployment is complete.

    make describe-hub-outputs aws-region=<AWSRegion>

  2. Switch to your organization’s management account and deploy the stack sets to the member accounts. For <SQSQueueUrl> and <KMSKeyArn>, use the values from the previous step.
    # Create a CloudFormation stack set to deploy the resources to the member accounts.
      make deploy-members SQSQueueUrl=<SQSQueueUrl> KMSKeyArn=<KMSKeyArn< aws-region=<AWSRegion>

To deploy the QuickSight dashboard to your central account

  1. Make sure that QuickSight is using the IAM role aws-quicksight-service-role.
    1. In QuickSight, in the navigation bar at the top right, choose your account (indicated by a person icon) and then choose Manage QuickSight.
    2. On the Manage QuickSight page, in the menu at the left, choose Security & Permissions.
    3. On the Security & Permissions page, under QuickSight access to AWS services, choose Manage.
    4. For IAM role, choose Use an existing role, and then do one of the following:
      • If you see a list of existing IAM roles, choose the role

        arn:aws:iam::<account-id>:role/service-role/aws-quicksight-service-role.

      • If you don’t see a list of existing IAM roles, enter the IAM ARN for the role in the following format:

        arn:aws:iam::<account-id>:role/service-role/aws-quicksight-service-role.

    5. Choose Save.
  2. Retrieve the QuickSight users.
    # <aws-region> your Quicksight main Region, for example eu-west-1
    # <account-id> The ID of your account, for example 123456789012
    # <namespace-name> Quicksight namespace, for example default.
    # You can list the namespaces by using aws quicksight list-namespaces --aws-account-id <account-id>
      aws quicksight list-users --region <aws-region> --aws-account-id <account-id> --namespace <namespace-name>

  3. Make a note of the user’s ARN that you want to grant permissions to list, describe, or update the QuickSight dashboard. This information is found in the arn element. For example, arn:aws:quicksight:us-east-1:111122223333:user/default/User1
  4. To launch the deployment stack for the QuickSight dashboard, run the following command. Replace <quicksight-user-arn> with the user’s ARN from the previous step.
    make deploy-dashboard-hub aws-region=<AWSRegion> quicksight-user-arn=<quicksight-user-arn>

Publish and share the QuickSight dashboard with the policy validation findings

You can publish your QuickSight dashboard and then share it with other QuickSight users for reporting purposes. The dashboard preserves the configuration of the analysis at the time that it’s published and reflects the current data in the datasets used by the analysis.

To publish the QuickSight dashboard

  1. In the QuickSight console, choose Analyses and then choose access-analyzer-validation-findings.
  2. (Optional) Modify the visuals of the analysis. For more information, see Tutorial: Modify Amazon QuickSight visuals.
  3. Share the QuickSight dashboard.
    1. In your analysis, in the application bar at the upper right, choose Share, and then choose Publish dashboard.
    2. On the Publish dashboard page, choose Publish new dashboard as and enter IAM Access Analyzer Policy Validation.
    3. Choose Publish dashboard. The dashboard is now published.
  4. On the QuickSight start page, choose Dashboards.
  5. Select the IAM Access Analyzer Policy Validation dashboard. IAM Access Analyzer policy validation findings will appear within the next 24 hours.

    Note: If you don’t want to wait until the Lambda function is initiated automatically, you can invoke the function that lists customer-managed policies and inline policies by using the aws lambda invoke AWS CLI command on the hub account and wait one to two minutes to see the policy validation findings:

    aws lambda invoke –function-name access-analyzer-list-iam-policy –invocation-type Event –cli-binary-format raw-in-base64-out –payload {} response.json

  6. (Optional) To export your dashboard as a PDF, see Exporting Amazon QuickSight analyses or dashboards as PDFs.

To share the QuickSight dashboard

  1. In the QuickSight console, choose Dashboards and then choose IAM Access Analyzer Policy Validation.
  2. In your dashboard, in the application bar at the upper right, choose Share, and then choose Share dashboard.
  3. On the Share dashboard page that opens, do the following:
    1. For Invite users and groups to dashboard on the left pane, enter a user email or group name in the search box. Users or groups that match your query appear in a list below the search box. Only active users and groups appear in the list.
    2. For the user or group that you want to grant access to the dashboard, choose Add. Then choose the level of permissions that you want them to have.
  4. After you grant users access to a dashboard, you can copy a link to it and send it to them.

For more details, see Sharing dashboards or Sharing your view of a dashboard.

Your teams can use this dashboard to better understand their IAM policies and how to move toward least-privilege permissions, as outlined in the section Validate your IAM roles of the blog post Top 10 security items to improve in your AWS account.

Clean up

To avoid incurring additional charges in your accounts, remove the resources that you created in this walkthrough.

Before deleting the CloudFormation stacks and stack sets in your accounts, make sure that the S3 buckets that you created are empty. To delete everything (including old versioned objects) in a versioned bucket, we recommend emptying the bucket through the console. Before deleting the CloudFormation stack from the central account, delete the Athena workgroup.

To delete remaining resources from your AWS accounts

  1. Delete the CloudFormation stack from your central account by running the following command. Make sure to replace <AWSRegion> with your own Region.
    make delete-hub aws-region=<AWSRegion>

  2. Delete the CloudFormation stack set instances and stack sets by running the following command using your organization’s management account credentials. Make sure to replace <AWSRegion> with your own Region.
    make delete-stackset-instances aws-region=<AWSRegion>
      # Wait for the operation to finish. You can check its progress on the CloudFormation console.
      make delete-stackset aws-region=<AWSRegion>

  3. Delete the QuickSight dashboard by running the following command using the central account credentials. Make sure to replace <AWSRegion> with your own Region.
    make delete-dashboard aws-region=<AWSRegion>

  4. To cancel your QuickSight subscription and close the account, see Canceling your Amazon QuickSight subscription and closing the account.

Conclusion

In this post, you learned how to validate your existing IAM policies by using the IAM Access Analyzer ValidatePolicy API and visualizing the results with AWS analytics tools. By using the implementation, you can better understand your IAM policies and work to reach least privilege in a scalable, fault-tolerant, and cost-effective way. This will help you identify opportunities to tighten your permissions and to grant the right fine-grained permissions to help enhance your overall security posture.

To learn more about IAM Access Analyzer, see previous blog posts on IAM Access Analyzer.

To download the CloudFormation templates, see the visualize-iam-access-analyzer-policy-validation-findings GitHub repository. For information about pricing, see Amazon SQS pricing, AWS Lambda pricing, Amazon Athena pricing and Amazon QuickSight pricing.

If you have feedback about this post, submit comments in the Comments section below. If you have questions about this post, start a new thread on the AWS Security, Identity, & Compliance re:Post.

Want more AWS Security news? Follow us on Twitter.

Mostefa Brougui

Mostefa Brougui

Mostefa is a Sr. Security Consultant in Professional Services at Amazon Web Services. He works with AWS enterprise customers to design, build, and optimize their security architecture to drive business outcomes.

Tobias Nickl

Tobias Nickl

Tobias works in Professional Services at Amazon Web Services as a Security Engineer. In addition to building custom AWS solutions, he advises AWS enterprise customers on how to reach their business objectives and accelerate their cloud transformation.

Synchronize your Salesforce and Snowflake data to speed up your time to insight with Amazon AppFlow

Post Syndicated from Ramesh Ranganathan original https://aws.amazon.com/blogs/big-data/synchronize-your-salesforce-and-snowflake-data-to-speed-up-your-time-to-insight-with-amazon-appflow/

This post was co-written with Amit Shah, Principal Consultant at Atos.

Customers across industries seek meaningful insights from the data captured in their Customer Relationship Management (CRM) systems. To achieve this, they combine their CRM data with a wealth of information already available in their data warehouse, enterprise systems, or other software as a service (SaaS) applications. One widely used approach is getting the CRM data into your data warehouse and keeping it up to date through frequent data synchronization.

Integrating third-party SaaS applications is often complicated and requires significant effort and development. Developers need to understand the application APIs, write implementation and test code, and maintain the code for future API changes. Amazon AppFlow, which is a low-code/no-code AWS service, addresses this challenge.

Amazon AppFlow is a fully managed integration service that enables you to securely transfer data between SaaS applications, like Salesforce, SAP, Zendesk, Slack, and ServiceNow, and AWS services like Amazon Simple Storage Service (Amazon S3) and Amazon Redshift in just a few clicks. With Amazon AppFlow, you can run data flows at enterprise scale at the frequency you choose—on a schedule, in response to a business event, or on demand.

In this post, we focus on synchronizing your data from Salesforce to Snowflake (on AWS) without writing code. This post walks you through the steps to set up a data flow to address full and incremental data load using an example use case.

Solution overview

Our use case involves the synchronization of the Account object from Salesforce into Snowflake. In this architecture, you use Amazon AppFlow to filter and transfer the data to your Snowflake data warehouse.

You can configure Amazon AppFlow to run your data ingestion in three different ways:

  • On-demand – You can manually run the flow through the AWS Management Console, API, or SDK call.
  • Event-driven – Amazon AppFlow can subscribe and listen to change data capture (CDC) events from the source SaaS application.
  • Scheduled – Amazon AppFlow can run schedule-triggered flows based on a pre-defined schedule rule. With scheduled flows, you can choose either full or incremental data transfer:
    • With full transfer, Amazon AppFlow transfers a snapshot of all records at the time of the flow run from the source to the destination.
    • With incremental transfer, Amazon AppFlow transfers only the records that have been added or changed since the last successful flow run. To determine the incremental delta of your data, AppFlow requires you to specify a source timestamp field to instruct how Amazon AppFlow identifies new or updated records.

We use the on-demand trigger for the initial load of data from Salesforce to Snowflake, because it helps you pull all the records, irrespective of their creation. To then synchronize data periodically with Snowflake, after we run the on-demand trigger, we configure a scheduled trigger with incremental transfer. With this approach, Amazon AppFlow pulls the records based on a chosen timestamp field from the Salesforce Account object periodically, based on the time interval specified in the flow.

The Account_Staging table is created in Snowflake to act as a temporary storage that can be used to identify the data change events. Then the permanent table (Account) is updated from the staging table by running a SQL stored procedure that contains the incremental update logic. The following figure depicts the various components of the architecture and the data flow from the source to the target.

The data flow contains the following steps:

  1. First, the flow is run with on-demand and full transfer mode to load the full data into Snowflake.
  2. The Amazon AppFlow Salesforce connector pulls the data from Salesforce and stores it in the Account Data S3 bucket in CSV format.
  3. The Amazon AppFlow Snowflake connector loads the data into the Account_Staging table.
  4. A scheduled task, running at regular intervals in Snowflake, triggers a stored procedure.
  5. The stored procedure starts an atomic transaction that loads the data into the Account table and then deletes the data from the Account_Staging table.
  6. After the initial data is loaded, you update the flow to capture incremental updates from Salesforce. The flow trigger configuration is changed to scheduled, to capture data changes in Salesforce. This enables Snowflake to get all updates, deletes, and inserts in Salesforce at configured intervals.
  7. The flow uses the configured LastModifiedDate field to determine incremental changes.
  8. Steps 3, 4, and 5 are run again to load the incremental updates into the Snowflake Accounts table.

Prerequisites

To get started, you need the following prerequisites:

  • A Salesforce user account with sufficient privileges to install connected apps. Amazon AppFlow uses a connected app to communicate with Salesforce APIs. If you don’t have a Salesforce account, you can sign up for a developer account.
  • A Snowflake account with sufficient permissions to create and configure the integration, external stage, table, stored procedures, and tasks.
  • An AWS account with access to AWS Identity and Access Management (IAM), Amazon AppFlow, and Amazon S3.

Set up Snowflake configuration and Amazon S3 data

Complete the following steps to configure Snowflake and set up your data in Amazon S3:

  1. Create two S3 buckets in your AWS account: one for holding the data coming from Salesforce, and another for holding error records.

A best practice when creating your S3 bucket is to make sure you block public access to the bucket to ensure your data is not accessible by unauthorized users.

  1. Create an IAM policy named snowflake-access that allows listing the bucket contents and reading S3 objects inside the bucket.

Follow the instructions for steps 1 and 2 in Configuring a Snowflake Storage Integration to Access Amazon S3 to create an IAM policy and role. Replace the placeholders with your S3 bucket names.

  1. Log in to your Snowflake account and create a new warehouse called SALESFORCE and database called SALESTEST.
  2. Specify the format in which data will be available in Amazon S3 for Snowflake to load (for this post, CSV):
USE DATABASE SALESTEST;
CREATE or REPLACE file format my_csv_format
type = csv
field_delimiter = ','
Y skip_header = 1
null_if = ('NULL', 'null')
empty_field_as_null = true
compression = gzip;
  1. Amazon AppFlow uses the Snowflake COPY command to move data using an S3 bucket. To configure this integration, follow steps 3–6 in Configuring a Snowflake Storage Integration to Access Amazon S3.

These steps create a storage integration with your S3 bucket, update IAM roles with Snowflake account and user details, and creates an external stage.

This completes the setup in Snowflake. In the next section, you create the required objects in Snowflake.

Create schemas and procedures in Snowflake

In your Snowflake account, complete the following steps to create the tables, stored procedures, and tasks for implementing the use case:

  1. In your Snowflake account, open a worksheet and run the following DDL scripts to create the Account and Account_staging tables:
CREATE or REPLACE TABLE ACCOUNT_STAGING (
ACCOUNT_NUMBER STRING NOT NULL,
ACCOUNT_NAME STRING,
ACCOUNT_TYPE STRING,
ANNUAL_REVENUE NUMBER,
ACTIVE BOOLEAN NOT NULL,
DELETED BOOLEAN,
LAST_MODIFIED_DATE STRING,
primary key (ACCOUNT_NUMBER)
);

CREATE or REPLACE TABLE ACCOUNT (
ACCOUNT_NUMBER STRING NOT NULL,
ACCOUNT_NAME STRING,
ACCOUNT_TYPE STRING,
ANNUAL_REVENUE NUMBER,
ACTIVE BOOLEAN NOT NULL,
LAST_MODIFIED_DATE STRING,
primary key (ACCOUNT_NUMBER)
);
  1. Create a stored procedure in Snowflake to load data from staging to the Account table:
CREATE or REPLACE procedure sp_account_load( )
returns varchar not null
language sql
as
$$
begin
Begin transaction;
merge into ACCOUNT using ACCOUNT_STAGING
on ACCOUNT.ACCOUNT_NUMBER = ACCOUNT_STAGING.ACCOUNT_NUMBER
when matched AND ACCOUNT_STAGING.DELETED=TRUE then delete
when matched then UPDATE SET
ACCOUNT.ACCOUNT_NAME = ACCOUNT_STAGING.ACCOUNT_NAME,
ACCOUNT.ACCOUNT_TYPE = ACCOUNT_STAGING.ACCOUNT_TYPE,
ACCOUNT.ANNUAL_REVENUE = ACCOUNT_STAGING.ANNUAL_REVENUE,
ACCOUNT.ACTIVE = ACCOUNT_STAGING.ACTIVE,
ACCOUNT.LAST_MODIFIED_DATE = ACCOUNT_STAGING.LAST_MODIFIED_DATE
when NOT matched then
INSERT (
ACCOUNT.ACCOUNT_NUMBER,
ACCOUNT.ACCOUNT_NAME,
ACCOUNT.ACCOUNT_TYPE,
ACCOUNT.ANNUAL_REVENUE,
ACCOUNT.ACTIVE,
ACCOUNT.LAST_MODIFIED_DATE
)
values(
ACCOUNT_STAGING.ACCOUNT_NUMBER,
ACCOUNT_STAGING.ACCOUNT_NAME,
ACCOUNT_STAGING.ACCOUNT_TYPE,
ACCOUNT_STAGING.ANNUAL_REVENUE,
ACCOUNT_STAGING.ACTIVE,
ACCOUNT_STAGING.LAST_MODIFIED_DATE
) ;

Delete from ACCOUNT_STAGING;
Commit;
end;
$$
;

This stored procedure determines whether the data contains new records that need to be inserted or existing records that need to be updated or deleted. After a successful run, the stored procedure clears any data from your staging table.

  1. Create a task in Snowflake to trigger the stored procedure. Make sure that the time interval for this task is more than the time interval configured in Amazon AppFlow for pulling the incremental changes from Salesforce. The time interval should be sufficient for data to be processed.
CREATE OR REPLACE TASK TASK_ACCOUNT_LOAD
WAREHOUSE = SALESFORCE
SCHEDULE = 'USING CRON 5 * * * * America/Los_Angeles'
AS
call sp_account_load();
  1. Provide the required permissions to run the task and resume the task:
show tasks;
  • As soon as task is created it will be suspended state so needs to resume it manually first time
ALTER TASK TASK_ACCOUNT_LOAD RESUME;
  • If the role which is assigned to us doesn’t have proper access to resume/execute task needs to grant execute task privilege to that role
GRANT EXECUTE TASK, EXECUTE MANAGED TASK ON ACCOUNT TO ROLE SYSADMIN;

This completes the Snowflake part of configuration and setup.

Create a Salesforce connection

First, let’s create a Salesforce connection that can be used by AppFlow to authenticate and pull records from your Salesforce instance. On the AWS console, make sure you are in the same Region where your Snowflake instance is running.

  1. On the Amazon AppFlow console, choose Connections in the navigation pane.
  2. From the list of connectors, select Salesforce.
  3. Choose Create connection.
  4. For Connection name, enter a name of your choice (for example, Salesforce-blog).
  5. Leave the rest of the fields as default and choose Continue.
  6. You’re redirected to a sign-in page, where you need to log in to your Salesforce instance.
  7. After you allow Amazon AppFlow access to your Salesforce account, your connection is successfully created.
           

 Create a Snowflake connection

Complete the following steps to create your Snowflake connection:

  1. On the Connections menu, choose Snowflake.
  2. Choose Create connection.
  3. Provide information for the Warehouse, Stage name, and Bucket details fields.
  4. Enter your credential details.

  1. For Region, choose the same Region where Snowflake is running.
  2. For Connection name, name your connection Snowflake-blog.
  3. Leave the rest of the fields as default and choose Connect.

Create a flow in Amazon AppFlow

Now you create a flow in Amazon AppFlow to load the data from Salesforce to Snowflake. Complete the following steps:

  1. On the Amazon AppFlow console, choose Flows in the navigation pane.
  2. Choose Create flow.
  3. On the Specify flow details page, enter a name for the flow (for example, AccountData-SalesforceToSnowflake).
  4. Optionally, provide a description for the flow and tags.
  5. Choose Next.

  1. On the Configure flow page, for Source name¸ choose Salesforce.
  2. Choose the Salesforce connection we created in the previous step (Salesforce-blog).
  3. For Choose Salesforce object, choose Account.
  4. For Destination name, choose Snowflake.
  5. Choose the newly created Snowflake connection.
  6. For Choose Snowflake object, choose the staging table you created earlier (SALESTEST.PUBLIC. ACCOUNT_STAGING).

  1. In the Error handling section, provide your error S3 bucket.
  2. For Choose how to trigger the flow¸ select Run on demand.
  3. Choose Next.

  1. Select Manually map fields to map the fields between your source and destination.
  2. Choose the fields Account Number, Account Name, Account Type, Annual Revenue, Active, Deleted, and Last Modified Date.

  1. Map each source field to its corresponding destination field.
  2. Under Additional settings, leave the Import deleted records unchecked (default setting).

  1. In the Validations section, add validations for the data you’re pulling from Salesforce.

Because the schema for the Account_Staging table in Snowflake database has a NOT NULL constraint for the fields Account_Number and Active, records containing a null value for these fields should be ignored.

  1. Choose Add Validation to configure validations for these fields.
  2. Choose Next.

  1. Leave everything else as default, proceed to the final page, and choose Create Flow.
  2. After the flow is created, choose Run flow.

When the flow run completes successfully, it will bring all records into your Snowflake staging table.

Verify data in Snowflake

The data will be loaded into the Account_staging table. To verify that data is loaded in Snowflake, complete the following steps:

  1. Validate the number of records by querying the ACCOUNT_STAGING table in Snowflake.
  2. Wait for your Snowflake task to run based on the configured schedule.
  3. Verify that all the data is transferred to the ACCOUNT table and the ACCOUNT_STAGING table is truncated.

Configure an incremental data load from Salesforce

Now let’s configure an incremental data load from Salesforce:

  1. On the Amazon AppFlow console, select your flow, and choose Edit.
  2. Go to the Edit configuration step and change to Run flow on schedule.
  3. Set the flow to run every 5 minutes, and provide a start date of Today, with a start time in the future.
  4. Choose Incremental transfer and choose the LastModifiedDate field.
  5. Choose Next.
  6. In the Additional settings section, select Import deleted records.

This ensures that deleted records from the source are also ingested.

  1. Choose Save and then choose Activate flow.

Now your flow is configured to capture all incremental changes.

Test the solution

Log in to your Salesforce account, and edit any record in the Account object.

Within 5 minutes or less, a scheduled flow will pick up your change and write the changed record into your Snowflake staging table and trigger the synchronization process.

You can see the details of the run, including number of records transferred, on the Run History tab of your flow.

Clean up

Clean up the resources in your AWS account by completing the following steps:

  1. On the Amazon AppFlow console, choose Flows in the navigation pane.
  2. From the list of flows, select the flow AccountData-SalesforceToSnowflakeand delete it.
  3. Enter delete to delete the flow.
  4. Choose Connections in the navigation pane.
  5. Choose Salesforce from the list of connectors, select Salesforce-blog, and delete it.
  6. Enter delete to delete the connector.
  7. On the Connections page, choose Snowflake from the list of connectors, select Snowflake-blog, and delete it.
  8. Enter delete to delete the connector.
  9. On the IAM console, choose Roles in the navigation page, then select the role you created for Snowflake and delete it.
  10. Choose Policies in the navigation pane, select the policy you created for Snowflake, and delete it.
  11. On the Amazon S3 console, search for the data bucket you created, choose Empty to delete the objects, then delete the bucket.
  12. Search for the error bucket you created, choose Empty to delete the objects, then delete the bucket.
  13. Clean up resources in your Snowflake account:
  • Delete the task TASK_ACCOUNT_LOAD:
ALTER TASK TASK_ACCOUNT_LOAD SUSPEND;
DROP TASK TASK_ACCOUNT_LOAD;
  • Delete the stored procedure sp_account_load:
DROP procedure sp_account_load();
  • Delete the tables ACCOUNT_STAGING and ACCOUNT:
DROP TABLE ACCOUNT_STAGING;
DROP TABLE ACCOUNT;

Conclusion

In this post, we walked you through how to integrate and synchronize your data from Salesforce to Snowflake using Amazon AppFlow. This demonstrates how you can set up your ETL jobs without having to learn new programming languages by using Amazon AppFlow and your familiar SQL language. This is a proof of concept, but you can try to handle edge cases like failure of Snowflake tasks or understand how incremental transfer works by making multiple changes to a Salesforce record within the scheduled time interval.

For more information on Amazon AppFlow, visit Amazon AppFlow.


About the authors

Ramesh Ranganathan is a Senior Partner Solution Architect at AWS. He works with AWS customers and partners to provide guidance on enterprise cloud adoption, application modernization and cloud native development. He is passionate about technology and enjoys experimenting with AWS Serverless services.

Kamen Sharlandjiev is an Analytics Specialist Solutions Architect and Amazon AppFlow expert. He’s on a mission to make life easier for customers who are facing complex data integration challenges. His secret weapon? Fully managed, low-code AWS services that can get the job done with minimal effort and no coding.

Amit Shah is a cloud based modern data architecture expert and currently leading AWS Data Analytics practice in Atos. Based in Pune in India, he has 20+ years of experience in data strategy, architecture, design and development. He is on a mission to help organization become data-driven.

­­Use fuzzy string matching to approximate duplicate records in Amazon Redshift

Post Syndicated from Sean Beath original https://aws.amazon.com/blogs/big-data/use-fuzzy-string-matching-to-approximate-duplicate-records-in-amazon-redshift/

Amazon Redshift is a fully managed, petabyte-scale data warehouse service in the cloud. Amazon Redshift enables you to run complex SQL analytics at scale and performance on terabytes to petabytes of structured and unstructured data, and make the insights widely available through popular business intelligence (BI) and analytics tools.

It’s common to ingest multiple data sources into Amazon Redshift to perform analytics. Often, each data source will have its own processes of creating and maintaining data, which can lead to data quality challenges within and across sources.

One challenge you may face when performing analytics is the presence of imperfect duplicate records within the source data. Answering questions as simple as “How many unique customers do we have?” can be very challenging when the data you have available is like the following table.

Name Address Date of Birth
Cody Johnson 8 Jeffery Brace, St. Lisatown 1/3/1956
Cody Jonson 8 Jeffery Brace, St. Lisatown 1/3/1956

Although humans can identify that Cody Johnson and Cody Jonson are most likely the same person, it can be difficult to distinguish this using analytics tools. This identification of duplicate records also becomes nearly impossible when working on large datasets across multiple sources.

This post presents one possible approach to addressing this challenge in an Amazon Redshift data warehouse. We import an open-source fuzzy matching Python library to Amazon Redshift, create a simple fuzzy matching user-defined function (UDF), and then create a procedure that weights multiple columns in a table to find matches based on user input. This approach allows you to use the created procedure to approximately identify your unique customers, improving the accuracy of your analytics.

This approach doesn’t solve for data quality issues in source systems, and doesn’t remove the need to have a wholistic data quality strategy. For addressing data quality challenges in Amazon Simple Storage Service (Amazon S3) data lakes and data pipelines, AWS has announced AWS Glue Data Quality (preview). You can also use AWS Glue DataBrew, a visual data preparation tool that makes it easy for data analysts and data scientists to clean and normalize data to prepare it for analytics.

Prerequisites

To complete the steps in this post, you need the following:

The following AWS CloudFormation stack will deploy a new Redshift Serverless endpoint and an S3 bucket for use in this post.

BDB-2063-launch-cloudformation-stack

All SQL commands shown in this post are available in the following notebook, which can be imported into the Amazon Redshift Query Editor V2.

Overview of the dataset being used

The dataset we use is mimicking a source that holds customer information. This source has a manual process of inserting and updating customer data, and this has led to multiple instances of non-unique customers being represented with duplicate records.

The following examples show some of the data quality issues in the dataset being used.

In this first example, all three customers are the same person but have slight differences in the spelling of their names.

id name age address_line1 city postcode state
1 Cody Johnson 80 8 Jeffrey Brace St. Lisatown 2636 South Australia
101 Cody Jonson 80 8 Jeffrey Brace St. Lisatown 2636 South Australia
121 Kody Johnson 80 8 Jeffrey Brace St. Lisatown 2636 South Australia

In this next example, the two customers are the same person with slightly different addresses.

id name age address_line1 city postcode state
7 Angela Watson 59 3/752 Bernard Follow Janiceberg 2995 Australian Capital Territory
107 Angela Watson 59 752 Bernard Follow Janiceberg 2995 Australian Capital Territory

In this example, the two customers are different people with the same address. This simulates multiple different customers living at the same address who should still be recognized as different people.

id name age address_line1 city postcode state
6 Michael Hunt 69 8 Santana Rest St. Jessicamouth 2964 Queensland
106 Sarah Hunt 69 8 Santana Rest St. Jessicamouth 2964 Queensland

Load the dataset

First, create a new table in your Redshift Serverless endpoint and copy the test data into it by doing the following:

  1. Open the Query Editor V2 and log in using the admin user name and details defined when the endpoint was created.
  2. Run the following CREATE TABLE statement:
    create table customer (
        id smallint, 
        urid smallint,
        name varchar(100),
        age smallint,
        address_line1 varchar(200),
        city varchar(100),
        postcode smallint,
        state varchar(100)
    )
    ;

    Screenshot of CREATE TABLE statement for customer table being run successfully in Query Editor V2

  3. Run the following COPY command to copy data into the newly created table:
    copy customer (id, name, age, address_line1, city, postcode, state)
    from ' s3://redshift-blogs/fuzzy-string-matching/customer_data.csv'
    IAM_ROLE default
    FORMAT csv
    REGION 'us-east-1'
    IGNOREHEADER 1
    ;

  4. Confirm the COPY succeeded and there are 110 records in the table by running the following query:
    select count(*) from customer;

    Screenshot showing the count of records in the customer table is 110. Query is run in Query Editor V2

Fuzzy matching

Fuzzy string matching, more formally known as approximate string matching, is the technique of finding strings that match a pattern approximately rather than exactly. Commonly (and in this solution), the Levenshtein distance is used to measure the distance between two strings, and therefore their similarity. The smaller the Levenshtein distance between two strings, the more similar they are.

In this solution, we exploit this property of the Levenshtein distance to estimate if two customers are the same person based on multiple attributes of the customer, and it can be expanded to suit many different use cases.

This solution uses TheFuzz, an open-source Python library that implements the Levenshtein distance in a few different ways. We use the partial_ratio function to compare two strings and provide a result between 1–100. If one of the strings matches perfectly with a portion of the other, the partial_ratio function will return 100.

Weighted fuzzy matching

By adding a scaling factor to each of our column fuzzy matches, we can create a weighted fuzzy match for a record. This is especially useful in two scenarios:

  • We have more confidence in some columns of our data than others, and therefore want to prioritize their similarity results.
  • One column is much longer than the others. A single character difference in a long string will have much less impact on the Levenshtein distance than a single character difference in a short string. Therefore, we want to prioritize long string matches over short string matches.

The solution in this post applies weighted fuzzy matching based on user input defined in another table.

Create a table for weight information

This reference table holds two columns; the table name and the column mapping with weights. The column mapping is held in a SUPER datatype, which allows JSON semistructured data to be inserted and queried directly in Amazon Redshift. For examples on how to query semistructured data in Amazon Redshift, refer to Querying semistructured data.

In this example, we apply the largest weight to the column address_line1 (0.5) and the smallest weight to the city and postcode columns (0.1).

Using the Query Editor V2, create a new table in your Redshift Serverless endpoint and insert a record by doing the following:

  1. Run the following CREATE TABLE statement:
    CREATE TABLE ref_unique_record_weight_map(table_name varchar(100), column_mapping SUPER);

  2. Run the following INSERT statement:
    INSERT INTO ref_unique_record_weight_map VALUES (
        'customer',
        JSON_PARSE('{
        "colmap":[
        {
            "colname": "name",
            "colweight": 0.3
        },
        {
            "colname": "address_line1",
            "colweight": 0.5
        },
        {
            "colname": "city",
            "colweight": 0.1
        },
        {
            "colname": "postcode",
            "colweight": 0.1
        }
        ]
    }')
    );

  3. Confirm the mapping data has inserted into the table correctly by running the following query:
    select * from ref_unique_record_weight_map;

    Screenshot showing the result of querying the ref_unique_record_weight_map table in Query Editor V2

  4. To check all weights for the customer table add up to 1 (100%), run the following query:
    select  cm.table_name, 
            sum(colmap.colweight) as total_column_weight 
    from    ref_unique_record_weight_map cm, cm.column_mapping.colmap colmap 
    where   cm.table_name = 'customer'
    group by cm.table_name;

    Screenshot showing the total weight applied to the customer table is 1.0

User-defined functions

With Amazon Redshift, you can create custom scalar user-defined functions (UDFs) using a Python program. A Python UDF incorporates a Python program that runs when the function is called and returns a single value. In addition to using the standard Python functionality, you can import your own custom Python modules, such as the module described earlier (TheFuzz).

In this solution, we create a Python UDF to take two input values and compare their similarity.

Import external Python libraries to Amazon Redshift

Run the following code snippet to import the TheFuzz module into Amazon Redshift as a new library. This makes the library available within Python UDFs in the Redshift Serverless endpoint. Make sure to provide the name of the S3 bucket you created earlier.

CREATE OR REPLACE LIBRARY thefuzz LANGUAGE plpythonu 
FROM 's3://<your-bucket>/thefuzz.zip' 
IAM_ROLE default;

Create a Python user-defined function

Run the following code snippet to create a new Python UDF called unique_record. This UDF will do the following:

  1. Take two input values that can be of any data type as long as they are the same data type (such as two integers or two varchars).
  2. Import the newly created thefuzz Python library.
  3. Return an integer value comparing the partial ratio between the two input values.
CREATE OR REPLACE FUNCTION unique_record(value_a ANYELEMENT, value_b ANYELEMENT) 
RETURNS INTEGER IMMUTABLE
AS
$$
    from thefuzz import fuzz

    return fuzz.partial_ratio(value_a, value_b)
$$ LANGUAGE plpythonu;

You can test the function by running the following code snippet:

select unique_record('Cody Johnson'::varchar, 'Cody Jonson'::varchar)

The result shows that these two strings are have a similarity value of 91%.

Screenshot showing that using the created function on the Cody Johnson/Cody Jonson name example provides a response of 91

Now that the Python UDF has been created, you can test the response of different input values.

Alternatively, you can follow the amazon-redshift-udfs GitHub repo to install the f_fuzzy_string_match Python UDF.

Stored procedures

Stored procedures are commonly used to encapsulate logic for data transformation, data validation, and business-specific logic. By combining multiple SQL steps into a stored procedure, you can reduce round trips between your applications and the database.

In this solution, we create a stored procedure that applies weighting to multiple columns. Because this logic is common and repeatable regardless of the source table or data, it allows us to create the stored procedure once and use it for multiple purposes.

Create a stored procedure

Run the following code snippet to create a new Amazon Redshift stored procedure called find_unique_id. This procedure will do the following:

  1. Take one input value. This value is the table you would like to create a golden record for (in our case, the customer table).
  2. Declare a set of variables to be used throughout the procedure.
  3. Check to see if weight data is in the staging table created in previous steps.
  4. Build a query string for comparing each column and applying weights using the weight data inserted in previous steps.
  5. For each record in the input table that doesn’t have a unique record ID (URID) yet, it will do the following:
    1. Create a temporary table to stage results. This temporary table will have all potential URIDs from the input table.
    2. Allocate a similarity value to each URID. This value specifies how similar this URID is to the record in question, weighted with the inputs defined.
    3. Choose the closest matched URID, but only if there is a >90% match.
    4. If there is no URID match, create a new URID.
    5. Update the source table with the new URID and move to the next record.

This procedure will only ever look for new URIDs for records that don’t already have one allocated. Therefore, rerunning the URID procedure multiple times will have no impact on the results.

CREATE OR REPLACE PROCEDURE find_unique_id(table_name varchar(100)) AS $$
DECLARE
    unique_record RECORD;
    column_info RECORD;

    column_fuzzy_comparison_string varchar(MAX) := '0.0';
    max_simularity_value decimal(5,2) := 0.0;

    table_check varchar(100);
    temp_column_name varchar(100);
    temp_column_weight decimal(5,2);
    unique_record_id smallint := 0;
BEGIN
    /* 
        Check the ref_unique_record_weight_map table to see if there is a mapping record for the provided table.
        If there is no table, raise an exception
    */
    SELECT INTO table_check cm.table_name from ref_unique_record_weight_map cm where cm.table_name = quote_ident(table_name);
    IF NOT FOUND THEN
        RAISE EXCEPTION 'Input table ''%'' not found in mapping object', table_name;
        RETURN;
    END IF;

    /*
        Build query to be used to compare each column using the mapping record in the ref_unique_record_weight_map table.
        For each column specified in the mapping object, append a weighted comparison of the column
    */
    FOR column_info IN (
        select  colmap.colname::varchar(100) column_name, 
                colmap.colweight column_weight 
        from    ref_unique_record_weight_map cm, cm.column_mapping.colmap colmap 
        where   cm.table_name = quote_ident(table_name)
    ) LOOP
        temp_column_name = column_info.column_name;
        temp_column_weight = column_info.column_weight;
        
        column_fuzzy_comparison_string = column_fuzzy_comparison_string || 
            ' + unique_record(t1.' || 
            temp_column_name || 
            '::varchar, t2.' || 
            temp_column_name || 
            '::varchar)*' || 
            temp_column_weight;
    END LOOP;

    /* Drop temporary table if it exists */
    EXECUTE 'DROP TABLE IF EXISTS #unique_record_table';

    /*
        For each record in the source table that does not have a Unique Record ID (URID):
            1. Create a new temporary table holding all possible URIDs for this record (i.e. all URIDs that have are present). 
                Note: This temporary table will only be present while the simularity check is being calculated
            2. Update each possible URID in the temporary table with it's simularity to the record being checked
            3. Find the most simular record with a URID
                3a. If the most simular record is at least 90% simular, take it's URID (i.e. this is not a unique record, and matches another in the table)
                3b. If there is no record that is 90% simular, create a new URID (i.e. this is a unique record)
            4. Drop the temporary table in preparation for the next record
    */
    FOR unique_record in EXECUTE 'select * from ' || table_name || ' where urid is null order by id asc' LOOP

        RAISE INFO 'test 1';

        /* Create temporary table */
        EXECUTE '
            CREATE TABLE #unique_record_table AS 
            SELECT id, urid, 0.0::decimal(5,2) as simularity_value 
            FROM ' || table_name || '
            where urid is not null
            ';

        /* Update simularity values in temporary table */
        EXECUTE '
            UPDATE #unique_record_table  
            SET simularity_value = round(calc_simularity_value,2)::decimal(5,2)
            FROM (
                SELECT ' || column_fuzzy_comparison_string || ' as calc_simularity_value,
                        t2.id as upd_id
                FROM ' || table_name || ' t1
                INNER JOIN ' || table_name || ' t2
                ON t1.id <> t2.id
                AND t1.id = ' || quote_literal(unique_record.id) || '
                ) t
            WHERE t.upd_id = id
            ';

        /* Find largest simularity value */
        SELECT INTO max_simularity_value simularity_value FROM (
            SELECT  MAX(simularity_value) as simularity_value 
            FROM    #unique_record_table
        );

        /* If there is a >90% similar match, choose it's URID. Otherwise, create a new URID */
        IF max_simularity_value > 90 THEN
            SELECT INTO unique_record_id urid FROM (
                SELECT urid
                FROM #unique_record_table
                WHERE simularity_value = max_simularity_value
            );
        ELSE 
            EXECUTE 'select COALESCE(MAX(urid)+1,1) FROM ' || table_name INTO unique_record_id;
        END IF;
        
        /* Update table with new URID value */
        EXECUTE 'UPDATE ' || table_name || ' SET urid = ' || quote_literal(unique_record_id) || ' WHERE id = ' || quote_literal(unique_record.id);

        /* Drop temporary table and repeat process */
        EXECUTE 'DROP TABLE #unique_record_table';

        max_simularity_value = 0.0;
    END LOOP;

END;
$$ LANGUAGE plpgsql;

Now that the stored procedure has been created, create the unique record IDs for the customer table by running the following in the Query Editor V2. This will update the urid column of the customer table.

CALL find_unique_id('customer'); 
select * from customer;

Screenshot showing the customer table now has values inserted in the URID column

When the procedure has completed its run, you can identify what duplicate customers were given unique IDs by running the following query:

select * 
from customer
where urid in (
    select urid 
    from customer 
    group by urid 
    having count(*) > 1
    )
order by urid asc
;

Screenshot showing the records that have been identified as duplicate records

From this you can see that IDs 1, 101, and 121 have all been given the same URID, as have IDs 7 and 107.

Screenshot showing the result for IDs 1, 101, and 121

Screenshot showing the result for IDs 7, and 107

The procedure has also correctly identified that IDs 6 and 106 are different customers, and they therefore don’t have the same URID.

Screenshot showing the result for IDs 6, and 106

Clean up

To avoid incurring future reoccurring charges, delete all files in the S3 bucket you created. After you delete the files, go to the AWS CloudFormation console and delete the stack deployed in this post. This will delete all created resources.

Conclusion

In this post, we showed one approach to identifying imperfect duplicate records by applying a fuzzy matching algorithm in Amazon Redshift. This solution allows you to identify data quality issues and apply more accurate analytics to your dataset residing in Amazon Redshift.

We showed how you can use open-source Python libraries to create Python UDFs, and how to create a generic stored procedure to identify imperfect matches. This solution is extendable to provide any functionality required, including adding as a regular process in your ELT (extract, load, and transform) workloads.

Test the created procedure on your datasets to investigate the presence of any imperfect duplicates, and use the knowledge learned throughout this post to create stored procedures and UDFs to implement further functionality.

If you’re new to Amazon Redshift, refer to Getting started with Amazon Redshift for more information and tutorials on Amazon Redshift. You can also refer to the video Get started with Amazon Redshift Serverless for information on starting with Redshift Serverless.


About the Author

Sean Beath is an Analytics Solutions Architect at Amazon Web Services. He has experience in the full delivery lifecycle of data platform modernisation using AWS services and works with customers to help drive analytics value on AWS.

Extract data from SAP ERP using AWS Glue and the SAP SDK

Post Syndicated from Siva Manickam original https://aws.amazon.com/blogs/big-data/extract-data-from-sap-erp-using-aws-glue-and-the-sap-sdk/

This is a guest post by Siva Manickam and Prahalathan M from Vyaire Medical Inc.

Vyaire Medical Inc. is a global company, headquartered in suburban Chicago, focused exclusively on supporting breathing through every stage of life. Established from legacy brands with a 65-year history of pioneering breathing technology, the company’s portfolio of integrated solutions is designed to enable, enhance, and extend lives.

At Vyaire, our team of 4,000 pledges to advance innovation and evolve what’s possible to ensure every breath is taken to its fullest. Vyaire’s products are available in more than 100 countries and are recognized, trusted, and preferred by specialists throughout the respiratory community worldwide. Vyaire has 65-year history of clinical experience and leadership with over 27,000 unique products and 370,000 customers worldwide.

Vyaire Medical’s applications landscape has multiple ERPs, such as SAP ECC, JD Edwards, Microsoft Dynamics AX, SAP Business One, Pointman, and Made2Manage. Vyaire uses Salesforce as our CRM platform and the ServiceMax CRM add-on for managing field service capabilities. Vyaire developed a custom data integration platform, iDataHub, powered by AWS services such as AWS Glue, AWS Lambda, and Amazon API Gateway.

In this post, we share how we extracted data from SAP ERP using AWS Glue and the SAP SDK.

Business and technical challenges

Vyaire is working on deploying the field service management solution ServiceMax (SMAX, a natively built on SFDC ecosystem), offering features and services that help Vyaire’s Field Services team improve asset uptime with optimized in-person and remote service, boost technician productivity with the latest mobile tools, and deliver metrics for confident decision-making.

A major challenge with ServiceMax implementation is building a data pipeline between ERP and the ServiceMax application, precisely integrating pricing, orders, and primary data (product, customer) from SAP ERP to ServiceMax using Vyaire’s custom-built integration platform iDataHub.

Solution overview

Vyaire’s iDataHub powered by AWS Glue has been effectively used for data movement between SAP ERP and ServiceMax.

AWS Glue a serverless data integration service that makes it easy to discover, prepare, and combine data for analytics, machine learning (ML), and application development. It’s used in Vyaire’s Enterprise iDatahub Platform for facilitating data movement across different systems, however the focus for this post is to discuss the integration between SAP ERP and Salesforce SMAX.

The following diagram illustrates the integration architecture between Vyaire’s Salesforce ServiceMax and SAP ERP system.

In the following sections, we walk through setting up a connection to SAP ERP using AWS Glue and the SAP SDK through remote function calls. The high-level steps are as follows:

  1. Clone the PyRFC module from GitHub.
  2. Set up the SAP SDK on an Amazon Elastic Compute Cloud (Amazon EC2) machine.
  3. Create the PyRFC wheel file.
  4. Merge SAP SDK files into the PyRFC wheel file.
  5. Test the connection with SAP using the wheel file.

Prerequisites

For this walkthrough, you should have the following:

Clone the PyRFC module from GitHub

For instructions for creating and connecting to an Amazon Linux 2 AMI EC2 instance, refer to Tutorial: Get started with Amazon EC2 Linux instances.

The reason we choose Amazon Linux EC2 is to compile the SDK and PyRFC in a Linux environment, which is compatible with AWS Glue.

At the time of writing this post, AWS Glue’s latest supported Python version is 3.7. Ensure that the Amazon EC2 Linux Python version and AWS Glue Python version are the same. In the following instructions, we install Python 3.7 in Amazon EC2; we can follow the same instructions to install future versions of Python.

  1. In the bash terminal of the EC2 instance, run the following command:
sudo apt install python3.7
  1. Log in to the Linux terminal, install git, and clone the PyRFC module using the following commands:
ssh -i "aws-glue-ec2.pem" [email protected] 
mkdir aws_to_sap 
sudo yum install git 
git clone https://github.com/SAP/PyRFC.git

Set up the SAP SDK on an Amazon EC2 machine

To set up the SAP SDK, complete the following steps:

  1. Download the nwrfcsdk.zip file from a licensed SAP source to your local machine.
  2. In a new terminal, run the following command on the EC2 instance to copy the nwrfcsdk.zip file from your local machine to the aws_to_sap folder.
scp -i "aws-glue-ec2.pem" -r "c:\nwrfcsdk\nwrfcsdk.zip" [email protected]:/home/ec2-user/aws_to_sap/
  1. Unzip the nwrfcsdk.zip file in the current EC2 working directory and verify the contents:

unzip nwrfcsdk.zip

  1. Configure the SAP SDK environment variable SAPNWRFC_HOME and verify the contents:
export SAPNWRFC_HOME=/home/ec2-user/aws_to_sap/nwrfcsdk
ls $SAPNWRFC_HOME

Create the PyRFC wheel file

Complete the following steps to create your wheel file:

  1. On the EC2 instance, install Python modules cython and wheel for generating wheel files using the following command:
pip3 install cython, wheel
  1. Navigate to the PyRFC directory you created and run the following command to generate the wheel file:
python3 setup.py bdist_wheel

Verify that the pyrfc-2.5.0-cp37-cp37m-linux_x86_64.whl wheel file is created as in the following screenshot in the PyRFC/dist folder. Note that you may see a different wheel file name based on the latest PyRFC version on GitHub.

Merge SAP SDK files into the PyRFC wheel file

To merge the SAP SDK files, complete the following steps:

  1. Unzip the wheel file you created:
cd dist
unzip pyrfc-2.5.0-cp37-cp37m-linux_x86_64.whl

  1. Copy the contents of lib (the SAP SDK files) to the pyrfc folder:
cd ..
cp ~/aws_to_sap/nwrfcsdk/lib/* pyrfc

Now you can update the rpath of the SAP SDK binaries using the PatchELF utility, a simple utility for modifying existing ELF executables and libraries.

  1. Install the supporting dependencies (gcc, gcc-c++, python3-devel) for the Linux utility function PatchELF:
sudo yum install -y gcc gcc-c++ python3-devel

Download and install PatchELF:

wget https://download-ib01.fedoraproject.org/pub/epel/7/x86_64/Packages/p/patchelf-0.12-1.el7.x86_64.rpm
sudo rpm -i patchelf-0.12-1.el7.x86_64.rpm

  1. Run patchelf:
find -name '*.so' -exec patchelf --set-rpath '$ORIGIN' {} \;
  1. Update the wheel file with the modified pyrfc and dist-info folders:
zip -r pyrfc-2.5.0-cp37-cp37m-linux_x86_64.whl pyrfc pyrfc-2.5.0.dist-info

  1. Copy the wheel file pyrfc-2.5.0-cp37-cp37m-linux_x86_64.whl from Amazon EC2 to Amazon Simple Storage Service (Amazon S3):
aws s3 cp /home/ec2-user/aws_to_sap/PyRFC/dist/ s3://&lt;bucket_name&gt; /ec2-dump --recursive


Test the connection with SAP using the wheel file

The following is a working sample code to test the connectivity between the SAP system and AWS Glue using the wheel file.

  1. On the AWS Glue Studio console, choose Jobs in the navigation pane.
  2. Select Spark script editor and choose Create.

  1. Overwrite the boilerplate code with the following code on the Script tab:
import os, sys, pyrfc
os.environ['LD_LIBRARY_PATH'] = os.path.dirname(pyrfc.__file__)
os.execv('/usr/bin/python3', ['/usr/bin/python3', '-c', """
    from pyrfc import Connection
    import pandas as pd
    ## Variable declarations
    sap_table = '' # SAP Table Name
    fields = '' # List of fields required to be pulled
    options = '' # the WHERE clause of the query is called "options"
    max_rows = '' # MaxRows
    from_row = '' # Row of data origination
    try:
        # Establish SAP RFC connection
        conn = Connection(ashost='', sysnr='', client='', user='', passwd='') 
        print(f“SAP Connection successful – connection object: {conn}”)
        if conn:
            # Read SAP Table information
            tables = conn.call("RFC_READ_TABLE", QUERY_TABLE=sap_table, DELIMITER='|', FIELDS=fields, OPTIONS=options, ROWCOUNT=max_rows, ROWSKIPS=from_row) 
            # Access specific row & column information from the SAP Data 
            data = tables["DATA"] # pull the data part of the result set
            columns = tables["FIELDS"] # pull the field name part of the result set
            df = pd.DataFrame(data, columns = columns)
            if df:
                print(f“Successfully extracted data from SAP using custom RFC - Printing the top 5 rows: {df.head(5)}”) 
            else:
                print(“No data returned from the request. Please check database/schema details”)
        else:
            print(“Unable to connect with SAP. Please check connection details”)
    except Exception as e:
        print(f“An exception occurred while connecting with SAP system: {e.args}”)
"""])
  1. On the Job details tab, fill in mandatory fields.
  2. In the Advanced properties section, provide the S3 URI of the wheel file in the Job parameters section as a key value pair:
    1. Key--additional-python-modules
    2. Values3://<bucket_name>/ec2-dump/pyrfc-2.5.0-cp37-cp37m-linux_x86_64.whl (provide your S3 bucket name)

  1. Save the job and choose Run.

Verify SAP connectivity

Complete the following steps to verify SAP connectivity:

  1. When the job run is complete, navigate to the Runs tab on the Jobs page and choose Output logs in the logs section.
  2. Choose the job_id and open the detailed logs.
  3. Observe the message SAP Connection successful – connection object: <connection object>, which confirms a successful connection with the SAP system.
  4. Observe the message Successfully extracted data from SAP using custom RFC – Printing the top 5 rows, which confirms successful access of data from the SAP system.

Conclusion

AWS Glue facilitated the data extraction, transformation, and loading process from different ERPs into Salesforce SMAX to improve Vyaire’s products and its related information visibility to service technicians and tech support users.

In this post, you learned how you can use AWS Glue to connect to SAP ERP utilizing SAP SDK remote functions. To learn more about AWS Glue, check out AWS Glue Documentation.


About the Authors

Siva Manickam is the Director of Enterprise Architecture, Integrations, Digital Research & Development at Vyaire Medical Inc. In this role, Mr. Manickam is responsible for the company’s corporate functions (Enterprise Architecture, Enterprise Integrations, Data Engineering) and produce function (Digital Innovation Research and Development).

Prahalathan M is the Data Integration Architect at Vyaire Medical Inc. In this role, he is responsible for end-to-end enterprise solutions design, architecture, and modernization of integrations and data platforms using AWS cloud-native services.

Deenbandhu Prasad is a Senior Analytics Specialist at AWS, specializing in big data services. He is passionate about helping customers build modern data architecture on the AWS Cloud. He has helped customers of all sizes implement data management, data warehouse, and data lake solutions.

Automate schema evolution at scale with Apache Hudi in AWS Glue

Post Syndicated from Subhro Bose original https://aws.amazon.com/blogs/big-data/automate-schema-evolution-at-scale-with-apache-hudi-in-aws-glue/

In the data analytics space, organizations often deal with many tables in different databases and file formats to hold data for different business functions. Business needs often drive table structure, such as schema evolution (the addition of new columns, removal of existing columns, update of column names, and so on) for some of these tables in one business function that requires other business functions to replicate the same. This post focuses on such schema changes in file-based tables and shows how to automatically replicate the schema evolution of structured data from table formats in databases to the tables stored as files in cost-effective way.

AWS Glue is a serverless data integration service that makes it easy to discover, prepare, and combine data for analytics, machine learning (ML), and application development. In this post, we show how to use Apache Hudi, a self-managing database layer on file-based data lakes, in AWS Glue to automatically represent data in relational form and manage their schema evolution at scale using Amazon Simple Storage Service (Amazon S3), AWS Database Migration Service (AWS DMS), AWS Lambda, AWS Glue, Amazon DynamoDB, Amazon Aurora, and Amazon Athena to automatically identify schema evolution and apply it to manage data load at petabyte scale.

Apache Hudi supports ACID transactions and CRUD operations on a data lake. This lays the foundation of a data lake architecture by enabling transaction support and schema evolution and management, decoupling storage from compute, and ensuring support for accessibility through business intelligence (BI) tools. In this post, we implement an architecture to build a transactional data lake built on the aforementioned Hudi features.

Solution overview

This post assumes a scenario where multiple tables are present in a source database, and we want to replicate any schema changes in any of those tables in Apache Hudi tables in the data lake. It uses the native support for Apache Hudi on AWS Glue for Apache Spark.

In this post, the schema evolution of source tables in the Aurora database is captured via the AWS DMS incremental load or change data capture (CDC) mechanism, and the same schema evolution is replicated in Apache Hudi tables stored in Amazon S3. Apache Hudi tables are discovered by the AWS Glue Data Catalog and queried by Athena. An AWS Glue job, supported by an orchestration pipeline using Lambda and a DynamoDB table, takes care of the automated replication of schema evolution in the Apache Hudi tables.

We use Aurora as a sample data source, but any data source that supports Create, Read, Update, and Delete (CRUD) operations can replace Aurora in your use case.

The following diagram illustrates our solution architecture.

The flow of the solution is as follows:

  1. Aurora, as a sample data source, contains a RDBMS table with multiple rows, and AWS DMS does the full load of that data to an S3 bucket (which we call the raw bucket). We expect that you may have multiple source tables, but for demonstration purposes, we only use one source table in this post.
  2. We trigger a Lambda function with the source table name as an event so that the corresponding parameters of the source table are read from DynamoDB. To schedule this operation for specific time intervals, we schedule Amazon EventBridge to trigger the Lambda with the table name as a parameter.
  3. There are many tables in the source database, and we want to run one AWS Glue job for each source table for simplicity in operations. Because we use each AWS Glue job to update each Apache Hudi table, this post uses a DynamoDB table to hold the configuration parameters used by each AWS Glue job for each Apache Hudi table. The DynamoDB table contains each Apache Hudi table name, corresponding AWS Glue job name, AWS Glue job status, load status (full or delta), partition key, record key, and schema to pass to the corresponding table’s AWS Glue Job. The values in the DynamoDB table are static values.
  4. To trigger each AWS Glue job (10 G.1X DPUs) in parallel to run an Apache Hudi specific code to insert data in the corresponding Hudi tables, Lambda passes each Apache Hudi table specific parameters read from DynamoDB to each AWS Glue job. The source data comes from tables in the Aurora source database via AWS DMS with full load and incremental load or CDC.

Create resources with AWS CloudFormation

We provide an AWS CloudFormation template to create the following resources:

  • Lambda and DynamoDB as the data load management orchestrators
  • S3 buckets for the raw, refined zone, and assets for holding code for schema evolution
  • An AWS Glue job to update the Hudi tables and perform schema evolution, both forward- and backward-compatible

The Aurora table and AWS DMS replication instance is not provisioned via this stack. For instructions to set up Aurora, refer to Creating an Amazon Aurora DB cluster.

Launch the following stack and provide your stack name.

eu-west-1

Schema evolution

To access your Aurora database, refer to How do I connect to my Amazon RDS for MySQL instance by using MySQL Workbench. Then complete the following steps:

  1. Create a table named object following the queries in the Aurora database and change its schema so that we can see the schema evolution is reflected at the data lake level:
create database db;
create table db.object ( 
object_name varchar(255),
object_description varchar(255),
new_column_add varchar(255), 
new_field_1 varchar(255), 
object_id int);
insert into object 
values("obj1","Object-1","","",1);

After you create the stacks, some manual steps are needed to prepare the solution end to end.

  1. Create an AWS DMS instance, AWS DMS endpoints, and AWS DMS task with the following configurations:
    • Add dataFormat as Parquet in the target endpoint.
    • Point the target endpoint of AWS DMS to the raw bucket, which is formatted as raw-bucket-<account_number>-<region_name>, and the folder name should be POC.
  2. Start the AWS DMS task.
  3. Create a test event in the HudiLambda Lambda function with the content of the event JSON as POC.db and save it.
  4. Run the Lambda function.

In this post, the schema evolution is reflected through Hudi Hive sync in AWS Glue. You don’t alter queries separately in the data lake.

Now we complete the following steps to change the schema at the source. Trigger the Lambda function after each step to generate a file in the POC/db/object folder within the raw bucket. AWS DMS almost instantly picks up the schema changes and reports to the raw bucket.

  1. Add a column called test_column to the source table object in your Aurora database:
alter table db.object add column test_column int after object_name;
insert into object 
values("obj2",22,"test-2","","",2);
  1. Rename the column new_field_1 to new_field_2 in the source table object:
alter table db.object change new_field_1 new_field_2 varchar(10);
insert into object 
values("obj3",33,"test-3","","new-3",3);

The column new_field_1 is expected to stay in the Hudi table but without any new values being populated to it anymore.

  1. Delete the column new_field_2 from the source table object:
alter table db.object drop column new_field_2;
insert into object 
values("obj4",44,"test-4","",4);

Similar to the previous operation, the column new_field_2 is expected to stay in the Hudi table but without any new values being populated to it anymore.

If you already have AWS Lake Formation data permissions set up in your account, you may encounter permission issues. In that case, grant full permission (Super) to the default database (before triggering the Lambda function) and all tables in the POC.db database (after the load is complete).

Review the results

When the aforementioned run happens after schema changes, the following results are generated in the refined bucket. We can view the Apache Hudi tables with its contents in Athena. To set up Athena, refer to Getting started.

The table and the database are available in the AWS Glue Data Catalog and ready for browsing the schema.

Before the schema change, the Athena results look like the following screenshot.

After you add the column test_column and insert a value in the test_column field in the object table in the Aurora database, the new column (test_column) is reflected in its corresponding Apache Hudi table in the data lake.

The following screenshot shows the results in Athena.

After you rename the column new_field_1 to new_field_2 and insert a value in the new_field_2 field in the object table, the renamed column (new_field_2) is reflected in its corresponding Apache Hudi table in the data lake, and new_field_1 remains in the schema, having no new value populated to the column.

The following screenshot shows the results in Athena.

After you delete the column new_field_2 in the object table and insert or update any values under any columns in the object table, the deleted column (new_field_2) remains in the corresponding Apache Hudi table schema, having no new value populated to the column.

The following screenshot shows the results in Athena.

Clean up

When you’re done with this solution, delete the sample data in the raw and refined S3 buckets and delete the buckets.

Also, delete the CloudFormation stack to remove all the service resources used in this solution.

Conclusion

This post showed how to implement schema evolution with an open-source solution using Apache Hudi in an AWS environment with an orchestration pipeline.

You can explore the different configurations of AWS Glue to change the AWS Glue job structures and implement it for your data analytics and other use cases.


About the Authors

Subhro Bose is a Senior Data Architect in Emergent Technologies and Intelligence Platform in Amazon. He loves solving science problems with emergent technologies such as AI/ML, big data, quantum, and more to help businesses across different industry verticals succeed within their innovation journey. In his spare time, he enjoys playing table tennis, learn theories of environmental economics and explore the best muffins across the city.

Ketan Karalkar is a Big Data Solutions Consultant at AWS. He has nearly 2 decades of experience helping customers design and build data analytics, and database solutions. He believes in using technology as an enabler to solve real life business problems.

Eva Fang is a Data Scientist within Professional Services in AWS. She is passionate about using the technology to provide value to customers and achieve business outcomes. She is based in London, in her spare time, she likes to watch movies and musicals.

Deep dive into the AWS ProServe Hadoop Migration Delivery Kit TCO tool

Post Syndicated from Jiseong Kim original https://aws.amazon.com/blogs/big-data/deep-dive-into-the-aws-proserve-hadoop-migration-delivery-kit-tco-tool/

In the post Introducing the AWS ProServe Hadoop Migration Delivery Kit TCO tool, we introduced the AWS ProServe Hadoop Migration Delivery Kit (HMDK) TCO tool and the benefits of migrating on-premises Hadoop workloads to Amazon EMR. In this post, we dive deep into the tool, walking through all steps from log ingestion, transformation, visualization, and architecture design to calculate TCO.

Solution overview

Let’s briefly visit the HMDK TCO tool’s key features. The tool provides a YARN log collector to connect Hadoop Resource Manager to collect YARN logs. A Python-based Hadoop workload analyzer, called the YARN log analyzer, scrutinizes Hadoop applications. Amazon QuickSight dashboards showcase the results from the analyzer. The same results also accelerate the design of future EMR instances. Additionally, a TCO calculator generates the TCO estimation of an optimized EMR cluster for facilitating the migration.

Now let’s look at how the tool works. The following diagram illustrates the end-to-end workflow.

In the next sections, we walk through the five main steps of the tool:

  1. Collect YARN job history logs.
  2. Transform the job history logs from JSON to CSV.
  3. Analyze the job history logs.
  4. Design an EMR cluster for migration.
  5. Calculate the TCO.

Prerequisites

Before getting started, make sure to complete the following prerequisites:

  1. Clone the hadoop-migration-assessment-tco repository.
  2. Install Python 3 on your local machine.
  3. Have an AWS account with permission on AWS Lambda, QuickSight (Enterprise edition), and AWS CloudFormation.

Collect YARN job history logs

First, you run a YARN log collector, start-collector.sh, on your local machine. This step collects Hadoop YARN logs and places the logs on your local machine. The script connects your local machine with the Hadoop primary node and communicates with Resource Manager. Then it retrieves the job history information (YARN logs from application managers) by calling the YARN ResourceManager application API.

Prior to running the YARN log collector, you need to configure and establish the connection (HTTP: 8088 or HTTPS: 8090; the latter is recommended) to verify the accessibility of YARN ResourceManager and enabled YARN Timeline Server (Timeline Server v1 or later are supported). You may need to define the YARN logs’ collection interval and retention policy. To ensure that you collect consecutive YARN logs, you can use a cron job to schedule the log collector in a proper time interval. For example, for a Hadoop cluster with 2,000 daily applications and the setting yarn.resourcemanager.max-completed-applications set to 1,000, theoretically, you have to run the log collector at least twice to get all the YARN logs. In addition, we recommend collecting at least 7 days of YARN logs for analyzing holistic workloads.

For more details on how to configure and schedule the log collector, refer to the yarn-log-collector GitHub repo.

Transform the YARN job history logs from JSON to CSV

After obtaining YARN logs, you run a YARN log organizer, yarn-log-organizer.py, which is a parser to transform JSON-based logs to CSV files. These output CSV files are the inputs for the YARN log analyzer. The parser also has other capabilities, including sorting events by time, removing dedicates, and merging multiple logs.

For more information on how to use the YARN log organizer, refer to the yarn-log-organizer GitHub repo.

Analyze the YARN job history logs

Next, you launch the YARN log analyzer to analyze the YARN logs in CSV format.

With QuickSight, you can visualize YARN log data and conduct analysis against the datasets generated by pre-built dashboard templates and a widget. The widget automatically creates QuickSight dashboards in the target AWS account, which configured in a CloudFormation template.

The following diagram illustrates the HMDK TCO architecture.

The YARN log analyzer provides four key functionalities:

  1. Upload transformed YARN job history logs in CSV format (for example, cluster_yarn_logs_*.csv) to Amazon Simple Storage Service (Amazon S3) buckets. These CSV files are the outputs from the YARN log organizer.
  2. Create a manifest JSON file (for example, yarn-log-manifest.json) for QuickSight and upload it to the S3 bucket:
    {
        "fileLocations": [ { 
            "URIPrefixes": [
                "s3://emr-tco-date-bucket/yarn-log/demo/logs/"] 
        } ], 
        "globalUploadSettings": { 
            "format": "CSV", 
            "delimiter": ",", 
            "textqualifier": "'", 
            "containsHeader": "true" 
        }
     }

  3. Deploy QuickSight dashboards using a CloudFormation template, which is in YAML format. After deploying, choose the refresh icon until you see the stack’s status as CREATE_COMPLETE. This step creates datasets on QuickSight dashboards in your AWS target account.
  4. On the QuickSight dashboard, you can find insights of the analyzed Hadoop workloads from various charts. These insights help you design future EMR instances for migration acceleration, as demonstrated in the next step.

Design an EMR cluster for migration

The results of the YARN log analyzer help you understand the actual Hadoop workloads on the existing system. This step accelerates designing future EMR instances for migration by using an Excel template. The template contains a checklist for conducting workload analysis and capacity planning:

  • Are the applications running on the cluster being used appropriately with their current capacity?
  • Is the cluster under load at a certain time or not? If so, when is the time?
  • What types of applications and engines (such as MR, TEZ, or Spark) are running on the cluster, and what is the resource usage for each type?
  • Are different jobs’ run cycles (real-time, batch, ad hoc) running in one cluster?
  • Are any jobs running in regular batches, and if so, what are these schedule intervals? (For example, every 10 minutes, 1 hour, 1 day.) Do you have jobs that use a lot of resources during a long time period?
  • Do any jobs need performance improvement?
  • Are any specific organizations or individuals monopolizing the cluster?
  • Are any mixed development and operation jobs operating in one cluster?

After you complete the checklist, you’ll have a better understanding of how to design the future architecture. For optimizing EMR cluster cost effectiveness, the following table provides general guidelines of choosing the proper type of EMR cluster and Amazon Elastic Compute Cloud (Amazon EC2) family.

To choose the proper cluster type and instance family, you need to perform several rounds of analysis against YARN logs based on various criteria. Let’s look at some key metrics.

Timeline

You can find workload patterns based on the number of Hadoop applications run in a time window. For example, the daily or hourly charts “Count of Records by Startedtime” provide the following insights:

  • In daily time series charts, you compare the number of application runs between working days and holidays, and among calendar days. If the numbers are similar, it means the daily utilizations of the cluster are comparable. On the other hand, if the deviation is large, the proportion of ad hoc jobs is significant. You also can figure out the possible weekly or monthly jobs on particular days. In the situation, you can easily see specific days in a week or a month with high workload concentration.
  • In hourly time series charts, you further understand how applications are run in hourly windows. You can find peak and off-peak hours in a day.

Users

The YARN logs contain the user ID of each application. This information helps you understand who submits an application to a queue. Based on the statistics of individual and aggregated application runs per queue and per user, you can determine the existing workload distribution by user. Usually, users at the same team have shared queues. Sometime, multiple teams have shared queues. When designing queues for users, you now have insights to help you design and distribute application workloads that are more balanced across queues than they previously were.

Application types

You can segment workloads based on various application types (such as Hive, Spark, Presto, or HBase) and run engines (such as MR, Spark, or Tez). For the compute-heavy workloads such as MapReduce or Hive-on-MR jobs, use CPU-optimized instances. For memory-intensive workloads such as Hive-on-TEZ, Presto, and Spark jobs, use memory-optimized instances.

ElapsedTime

You can categorize applications by runtime. The embedded CloudFormation template automatically creates an elapsedGroup field in a QuickSight dashboard. This enables a key feature to allow you to observe long-running jobs in one of four charts on QuickSight dashboards. Therefore, you can design tailored future architectures for these large jobs.

The corresponding QuickSight dashboards include four charts. You can drill down each chart, which is associated to one group.

Group
Number
Runtime/Elapsed Time of a Job
1 Less than 10 minutes
2 Between 10 minutes and 30 minutes
3 between 30 minutes and 1 hour
4 Greater than 1 hour

In the chart of Group 4, you can concentrate on scrutinizing large jobs based on various metrics, including user, queue, application type, timeline, resource usage, and so on. Based on this consideration, you may have dedicated queues on a cluster or a dedicated EMR cluster for large jobs. Meanwhile, you may submit small jobs to shared queues.

Resources

Based on resource (CPU, memory) consumption patterns, you choose the right size and family of EC2 instances for performance and cost effectiveness. For compute-intensive applications, we recommend instances of CPU-optimized families. For memory-intensive applications, the memory-optimized instance families are recommended.

In addition, based on the nature of the application workloads and resource utilization over the time, you may choose a persistent or transient EMR cluster, Amazon EMR on EKS, or Amazon EMR Serverless.

After analyzing YARN logs by various metrics, you’re ready to design future EMR architectures. The following table lists examples of proposed EMR clusters. You can find more details in the optimized-tco-calculator GitHub repo.

Calculate TCO

Finally, on your local machine, run tco-input-generator.py to aggregate YARN job history logs on an hourly basis prior to using an Excel template to calculate the optimized TCO. This step is crucial because the results simulate the Hadoop workloads in future EMR instances.

The prerequisite of TCO simulation is to run tco-input-generator.py, which generates hourly aggregated logs. Next, you open an Excel template file to enable macros and provide your inputs in green cells for calculating the TCO. Regarding the input data, you enter the actual data size without replication, and the hardware specifications (vCore, mem) of the Hadoop primary node and data nodes. You also need to select and upload previously generated hourly aggregated logs. After you set the TCO simulation variables, such as Region, EC2 type, Amazon EMR high availability, engine effect, Amazon EC2 and Amazon EBS discount (EDP), Amazon S3 volume discount, local currency rate, and EMR EC2 task/core pricing ratio and price/hour, the TCO simulator automatically calculates the optimum cost of future EMR instances on Amazon EC2. The following screenshots show an example of HMDK TCO results.

For additional information and instructions of HMDK TCO calculations, refer to the optimized-tco-calculator GitHub repo.

Clean up

After you complete all the steps and finish testing, complete the following steps to delete resources to avoid incurring costs:

  1. On the AWS CloudFormation console, choose the stack you created.
  2. Choose Delete.
  3. Choose Delete stack.
  4. Refresh the page until you see the status DELETE_COMPLETE.
  5. On the Amazon S3 console, delete S3 bucket you created.

Conclusion

The AWS ProServe HMDK TCO tool significantly reduces migration planning efforts, which are the time-consuming and challenging tasks of assessing your Hadoop workloads. With the HMDK TCO tool, the assessment usually takes 2–3 weeks. You can also determine the calculated TCO of future EMR architectures. With the HMDK TCO tool, you are able to quickly understand your workloads and resource usage patterns. With the insights generated by the tool, you are equipped to design optimal future EMR architectures. In many use cases, a 1-year TCO of the optimized refactored architecture provides significant cost savings (64–80% reduction) on compute and storage, compared to lift-and-shift Hadoop migrations.

To learn more about accelerating your Hadoop migrations to Amazon EMR and the HMDK CTO tool, refer to the Hadoop Migration Delivery Kit TCO GitHub repo, or reach out to [email protected].


About the authors

Sungyoul Park is a Senior Practice Manager at AWS ProServe. He helps customers innovate their business with AWS Analytics, IoT, and AI/ML services. He has a specialty in big data services and technologies and an interest in building customer business outcomes together.

Jiseong Kim is a Senior Data Architect at AWS ProServe. He mainly works with enterprise customers to help data lake migration and modernization, and provides guidance and technical assistance on big data projects such as Hadoop, Spark, data warehousing, real-time data processing, and large-scale machine learning. He also understands how to apply technologies to solve big data problems and build a well-designed data architecture.

George Zhao is a Senior Data Architect at AWS ProServe. He is an experienced analytics leader working with AWS customers to deliver modern data solutions. He is also a ProServe Amazon EMR domain specialist who enables ProServe consultants on best practices and delivery kits for Hadoop to Amazon EMR migrations. His area of interests are data lakes and cloud modern data architecture delivery.

Kalen Zhang was the Global Segment Tech Lead of Partner Data and Analytics at AWS. As a trusted advisor of data and analytics, she curated strategic initiatives for data transformation, led data and analytics workload migration and modernization programs, and accelerated customer migration journeys with partners at scale. She specializes in distributed systems, enterprise data management, advanced analytics, and large-scale strategic initiatives.

Introducing the AWS ProServe Hadoop Migration Delivery Kit TCO tool

Post Syndicated from George Zhao original https://aws.amazon.com/blogs/big-data/introducing-the-aws-proserve-hadoop-migration-delivery-kit-tco-tool/

When migrating Hadoop workloads to Amazon EMR, it’s often difficult to identify the optimal cluster configuration without analyzing existing workloads by hand. To solve this, we’re introducing the Hadoop migration assessment Total Cost of Ownership (TCO) tool. You now have a Hadoop migration assessment TCO tool within the AWS ProServe Hadoop Migration Delivery Kit (HMDK). The self-serve HMDK TCO tool accelerates the design of new cost-effective Amazon EMR clusters by analyzing the existing Hadoop workload and calculating the total cost of the ownership (TCO) running on the future Amazon EMR system. The Amazon EMR TCO report with the new Amazon EMR design can demonstrate the Amazon EMR migration with detailed cost saving and business benefits.

In this post, we introduce a use case and the functions and components of the tool. We also share case studies to show you the benefits of using the tool. Finally, we show you the technical information to use the tool.

Use case overview

Migrating Hadoop workloads to Amazon EMR accelerates big data analytics modernization, increases productivity, and reduces operational cost. Refactoring coupled compute and storage to a decoupling architecture is a modern data solution. It enables compute such as EMR instances and storage such as Amazon Simple Storage Service (Amazon S3) data lakes to scale. For various Hadoop jobs, customers have bespoke deployment options of fully managed Amazon EMR, Amazon EMR on Amazon EKS, and EMR Serverless. The optimized future EMR cluster yields the same results and values with much lower TCO compared to the source Hadoop cluster. But we need a TCO report to showcase the cost saving details, as shown in the following figure.

Typically, the commencement of a Hadoop migration needs Hadoop experts to spend weeks or even months to assess current Hadoop cluster workloads towards a plan for subsequent migration. This could delay the project from being accepted without a good TCO report.

To accelerate Hadoop migrations and mitigate the workload assessment efforts by SMEs, AWS ProServe created the Hadoop migration assessment TCO tool within the AWS ProServe Hadoop Migration Delivery Kit.

Introduction to the HMDK TCO tool

As a Hadoop migration accelerator, the HMDK TCO tool has three components:

  • YARN log collector – Retrieves the existing workload logs from YARN Resource Manager
  • YARN log analyzer – Provides a deep time-based insight on different aspects of the jobs
  • TCO calculator – Generates a 3-year or 1-year TCO calculated automatically

The self-serve HMDK TCO tool is available for download on GitHub.

Using the tool consists of three steps:

  1. First, the YARN Log collector communicates with the current Hadoop system to retrieve YARN logs.
  2. With the collected YARN logs, the next step is to use the YARN log analyzer and set up the log analyzer stack using AWS CloudFormation. The results of the log analyzer reveal Hadoop workload insights with various views and metrics of the Hadoop applications shown in Amazon QuickSight dashboards, which leads to the design of a future EMR cluster.
  3. Lastly, the TCO calculator generates the TCO report by simulating hourly resource usage of a future EMR cluster. To accelerate Hadoop migration assessment, the TCO report provides crucial information and values for your business stakeholders to make a buy-in decision.

The following diagram illustrates this architecture.

The Hadoop workload insights enable you to design a well-architected EMR cluster to achieve performance and cost-effectiveness in an agile way. For conducting well-architected designs, you need to deliberate between various system specifications of an EMR cluster and multiple cost considerations.

The system specifications are as follows:

  • Number of EMR clusters – Amazon EMR enables you to run multiple elastic clusters in the AWS Cloud to serve the same purpose of a shared static Hadoop cluster on premises
  • Types of EMR cluster (persistent or transient) – Design your system to keep minimum persistent clusters to save cost
  • Instance types and configuration (memory, vCore, and so on) – Choose the right instance for your job
  • Resource allocation for applications and cluster utilization – Based on the on-premises workload analysis, design effective resource allocation and efficient resource utilization in future EMR clusters

The cost considerations are as follows:

  • Latest price list (from thousands of available EC2 instances available) – The HMDK TCO tool makes the price calculation with Amazon Elastic Compute Cloud (Amazon EC2) instance types, configurations, and their prices.
  • Amazon S3 storage cost (standard, Glacier, and so on) – Data replication is no longer required for reliability. You can use tired storage in Amazon S3 for cost savings.

YARN log collector

The HMDK TCO tool enables a simple way to capture Hadoop YARN logs, which include the Hadoop job runs statistics and the corresponding resource usages. The following screenshot is an example of a YARN log.

The tool supports HTTPS protocol to communicate with YARN Resource Manager. The tool transports the JSON YARN logs as the inputs to a Python parser, which converts the YARN logs from JSON to CSV format. The new CSV formatted logs are the standard input files for the YARN log analyzer.

For more information, see the GitHub repo.

YARN log analyzer and optimized design use cases

With the log, we can follow up the steps in the TCO yarn-log-analysis README file to use AWS CloudFormation to set up QuickSight resources.

The HMDK TCO log analyzer generates a QuickSight dashboard on various metrics:

  • Job timeline – How many jobs are running at one time
  • Job user – Breakdown of users and queues
  • Application type and engine type – Breakdown by application types (Spark, Hive, Presto) and run engine type (MapReduce, Spark, Tez)
  • Elapsed time – The time span of completing an application
  • Resources – Memory and CPU

The following screenshot shows an example dashboard.

The QuickSight dashboards exhibit insights based on consecutive YARN logs collected in a long-enough period of time (for example, a 2-week window). The insights from the logs reveal the application types, users, queues, running cadence, time spans, and resource usages. The data also helps you discover daily batch jobs or ad hoc jobs, long-running jobs, and resource consumption. These insights help you design the right clusters, such as transient clusters or baseline permanent clusters, and choose the right EC2 instance for memory- or compute-intensive jobs. With the log analyzer results, the TCO tool automatically calculates the TCO of a future EMR cluster.

Let’s see some real customer use cases in the following sections.

Case 1: Use transient and persistent clusters wisely

For this use case, a customer in the financial sector has an 11-node Hadoop cluster.

The QuickSight timeline dashboard shows the peak time job runs because of the daily batch job. This guides us to design two clusters for fulfilling the existing workloads. When we keep a persistent cluster at a minimal size, we can have the transient EMR cluster to handle the batch style job around the peak time.

Therefore, we designed the clusters to have a persistent cluster with 2 data nodes, while transient nodes can scale from 0–10 between the hours of 1:00 AM and 4:00 AM.

The following figure illustrates this design.

This balanced design using transient and persistent clusters resulted in a cost savings of about 80% compared to a lift-and-shift design.

Case 2: Identify Hadoop queue usage and long-running jobs to design multiple clusters and optimized runs

For our next use case, a company runs 196 nodes using Hadoop 3.1 with jobs like Hive, Spark, and Kafka. The Hadoop default queue and four other queues were used to group various workloads. As illustrated in the following figure, some very long-running jobs are seen in the shared cluster, resulting in queued jobs that have resource competition and unbalanced resource allocation.

The QuickSight user dashboard guides us through the queue usage, the elapsed time dashboard guides us through the long-running jobs, and the resource dashboard guides us through the memory and vCore usage for the jobs.

Therefore, we design a solution to transfer queue jobs to run in separated clusters, and the default queue jobs are split to run in different clusters. By identifying the long-running jobs and understanding the resource needs, we could design a cluster to run such jobs more efficiently.

This design allows the job to run faster and the clusters to be used more efficiently with a cost savings benefit.

Cluster design

The HMDK TCO tool provides a cluster design template like the following example.

Here we have two clusters, one transient and one persistent, to handle the Spark and Tez jobs accordingly. The starting and ending hour for each cluster can be determined from the log analysis. With this cluster design, we can get the hourly workload resource usage forecast. Then the TCO calculator gets all the information needed to generate costs based on the TCO simulation variables you choose.

TCO calculator

The HMDK TCO calculator is a component guiding the EMR cluster design by using the EMR design template. Then it generates the hourly aggregated resource usage forecast using a Python program. The component provides guidelines and an Excel template to input system and cost specification parameters. The component has the logic with a built-in Amazon EMR price list. The 1-year and 3-year TCO cost can be automatically generated by the macro-enabled Excel TCO template.

The following figure shows the details of our HMDK TCO simulation.

The following figures show the TCO report.

TCO tool engagement outcomes

In this section, we share some of the engagement outcomes from customers after using the TCO tool for 1–2 weeks. Additionally, with the TCO tool, we can refactor on-premises Hadoop clusters to EMR clusters utilizing Amazon S3 as a data lake. The modern data solution of migrating to Amazon EMR provides unlimited scalability with operational efficiency and cost savings.

The following table illustrates four case studies of some engagements using the tool.

Case# Case Description Engagement Outcome
1 Pressured by the Hadoop License, they migrated to AWS using Amazon EMR and used Spark for replacing Hive. They designed the new EMR clusters using a balanced design of transient and persistent clusters. They can get job insights through the tool and design the new EMR clusters to fulfill the existing workloads, and expect to achieve 80% cost savings and six times performance enhancement.
2 Their goal was to migrate a Hadoop cluster with over 1,000 nodes from HDFS to Amazon S3 and Hive to Spark, and redesign the cluster using a balanced design of transient and persistent clusters. They can get job insights and redesign the cluster with a 1-year TCO of the optimized redesign architecture expected to have 64% cost savings.
3 Their goal was to migrate to Hadoop 3.1. They transferred the Hadoop queue-based job, which shared the same cluster, to two transient clusters and five persistent clusters with optimized resource usage for each job run, and handled long-running jobs faster. They can get Amazon EMR TCO results quickly in 2 weeks. Customers get insights on their workloads and long-running jobs and get the job done faster and cheaper.
4 Their goal was to migrate from Hive 1 to Spark and design an auto scaling EMR cluster. They can get Amazon EMR TCO results in 1 week. They’re expecting to see 75% cost savings on the redesigned EMR clusters and 10 times on performance improvement.

Conclusion

This post introduced use cases, functions, and components of the HMDK TCO tool. Through the case studies discussed in this post, you learned about real examples of the tool usage and its benefits. The HMDK TCO tool is designed for automating source Hadoop cluster workload assessment with calculated TCO calculation, and it can be done in 2–3 weeks instead of months.

More and more customers are adopting the HMDK TCO tool to accelerate their migration to Amazon EMR.

To dive deep into the HMDK TCO tool, refer to the next post in this series, How AWS ProServe Hadoop TCO tool accelerate Hadoop workload migrations to Amazon EMR.


About the authors

Sungyoul Park is a Senior Practice Manager at AWS ProServe. He helps customers innovate their business with AWS Analytics, IoT, and AI/ML services. He has a specialty in big data services and technologies and an interest in building customer business outcomes together.

Jiseong Kim is a Senior Data Architect at AWS ProServe. He mainly works with enterprise customers to help data lake migration and modernization, and provides guidance and technical assistance on big data projects such as Hadoop, Spark, data warehousing, real-time data processing, and large-scale machine learning. He also understands how to apply technologies to solve big data problems and build a well-designed data architecture.

George Zhao is a Senior Data Architect at AWS ProServe. He is an experienced analytics leader working with AWS customers to deliver modern data solutions. He is also a ProServe Amazon EMR domain specialist who enables ProServe consultants on best practices and delivery kits for Hadoop to Amazon EMR migrations. His area of interests are data lakes and cloud modern data architecture delivery.

Kalen Zhang was the Global Segment Tech Lead of Partner Data and Analytics at AWS. As a trusted advisor of data and analytics, she curated strategic initiatives for data transformation, led data and analytics workload migration and modernization programs, and accelerated customer migration journeys with partners at scale. She specializes in distributed systems, enterprise data management, advanced analytics, and large-scale strategic initiatives.

Introducing MongoDB Atlas metadata collection with AWS Glue crawlers

Post Syndicated from Igor Alekseev original https://aws.amazon.com/blogs/big-data/introducing-mongodb-atlas-metadata-collection-with-aws-glue-crawlers/

For data lake customers who need to discover petabytes of data, AWS Glue crawlers are a popular way to discover and catalog data in the background. This allows users to search and find relevant data from multiple data sources. Many customers also have data in managed operational databases such as MongoDB Atlas and need to combine it with data from Amazon Simple Storage Service (Amazon S3) data lakes to derive insights. AWS Glue crawlers now support MongoDB Atlas, making it simpler for you to understand MongoDB collections’ evolution and extract meaningful insights.

AWS Glue is a serverless data integration service that makes it simple to discover, prepare, move, and integrate data from multiple sources for analytics, machine learning (ML), and application development.

MongoDB Atlas is a developer data service from AWS technology partner MongoDB, Inc. The service combines transactional processing, relevance-based search, real-time analytics, and mobile-to-cloud data synchronization in an integrated architecture.

With today’s launch, you can create and schedule an AWS Glue crawler to crawl MongoDB Atlas. In the crawler setup, you can select MongoDB as a data source. You can then create an AWS Glue connection with MongoDB Atlas and provide the MongoDB Atlas cluster name and credentials. We walk you through this process in this post.

Solution overview

The following architecture illustrates how you can scan a MongoDB Atlas database and collections using AWS Glue.

With each run of the crawler, the crawler inspects specified collections and catalogs information, such as updates or deletes to MongoDB Atlas collections, views, and materialized views in the AWS Glue Data Catalog. In AWS Glue Studio, you can then use the AWS Glue Data Catalog as a source to pull data from MongoDB Atlas and populate an Amazon S3 target. Finally, this job can run and read data from MongoDB Atlas and write the results to Amazon S3, opening up possibilities to integrate with AWS services such as Amazon SageMaker, Amazon QuickSight, and more.

In the following sections, we describe how to create an AWS Glue crawler with MongoDB Atlas as a data source. We then create an AWS Glue connection and provide the MongoDB Atlas cluster information and credentials. Then we specify the MongoDB Atlas database and collections to crawl.

Prerequisites

To follow along with this post, you must have access to MongoDB Atlas and the AWS Management Console. We also assume you have access to a VPC with subnets preconfigured via Amazon Virtual Private Cloud (Amazon VPC). The crawler that we configure later in the post runs in the VPC and connects to MongoDB Atlas via an AWS PrivateLink endpoint.

Set up MongoDB Atlas

To configure MongoDB Atlas, complete the following steps:

  1. Configure a MongoDB cluster on AWS. For instructions, refer to How to Set Up a MongoDB Cluster.
  2. Configure PrivateLink by following the steps described in Connecting Applications Securely to a MongoDB Atlas Data Plane with AWS PrivateLink.

This allows us to simplify our networking architecture and make sure the traffic stays on the AWS network.

Next, we obtain the MongoDB cluster connection string from the Connect UI on the MongoDB Atlas console.

  1. On the MongoDB Atlas console, choose Connect, Private Endpoint, and Connection Method.
  2. Copy the SRV connection string.

We use this SRV connection string in the subsequent steps.

The following screenshot shows that we have loaded a sample collection in MongoDB Atlas, which we crawl over in the next steps. Note that the records in this collection include several arrays as well as nested data.

Set up the MongoDB Atlas connection with AWS Glue

Before we can configure the AWS Glue crawler, we need to create the MongoDB Atlas connection in AWS Glue.

  1. On the AWS Glue Studio console, choose Connectors in the navigation pane.
  2. Choose Create connection.

  1. When filling out the connection details, use the SRV connection string we obtained earlier in MongoDB Atlas.
  2. In the Network options section, the VPC and subnets must correspond to the PrivateLink settings you configured earlier.

Create a MongoDB crawler

After we create the connection, we can create an AWS Glue crawler.

  1. On the AWS Glue console, choose Crawlers in the navigation pane.
  2. Choose Create crawler.

  1. For Name, enter a name.
  2. For the data source, choose the MongoDB Atlas data source we configured earlier and supply the path that corresponds to the MongoDB Atlas database and collection.

  1. Configure your security settings, output, and scheduling.

  1. On the Crawlers page, choose Run crawler.

After the crawler finishes crawling the MongoDB collections, its status shows as Completed.

Review the MongoDB AWS Glue database and table

We can navigate to the AWS Glue Data Catalog to examine the tables that were created by the crawler.

Choose the table to view the schema and other metadata.

Note that the crawler captured nested data as a STRUCT and correctly listed the ARRAY fields.

Import MongoDB Atlas data to Amazon S3

Now we use the MongoDB Atlas-based AWS Glue Data Catalog table to perform a data import without writing code. We use AWS Glue Studio to build boilerplate code quickly. Alternatively, you can build the script in script editor.

  1. On the AWS Glue Studio console, choose Jobs in the navigation pane.
  2. Choose Create job.
  3. Select Visual with a source and target.
  4. Choose the Data Catalog table as the source and Amazon S3 as the target.

  1. In the AWS Glue Studio UI, supply additional parameters such as the S3 bucket name and choose the database and table from the drop-down menus.

  1. Next, review the generated script that is built by AWS Glue Studio. We now need to add a database and collection in the script as follows:
additional_options = {"database": "sample_airbnb","collection": "listingsAndReviews"},

When the ETL job is complete, the extracted data is available on Amazon S3.

  1. On the Amazon S3 console, choose Buckets in the navigation pane.
  2. Choose our bucket and folder containing the extracted files.
  3. Choose a file and on the Actions menu, choose Query with S3 Select to view the contents of the file.

Clean up

To avoid incurring charges for the services used in this walkthrough, complete the following steps to delete your resources:

  1. On the AWS Glue console, choose Crawlers in the navigation pane.
  2. Select your crawler and on the Action menu, choose Delete crawler.
  3. On the AWS Glue Studio console, choose View jobs.
  4. Select the job you created and on the Actions menu, choose Delete job(s).
  5. Return to the AWS Glue console and choose Tables in the navigation pane.
  6. Select your table and choose Delete.
  7. Choose Databases in the navigation pane.
  8. Select your database and choose Delete.
  9. On the Amazon VPC console, choose Endpoints in the navigation pane.
  10. Select the PrivateLink endpoint you created and on the Actions menu, choose Delete VPC endpoints.

Conclusion

In this post, we showed how to set up an AWS Glue crawler to crawl over a MongoDB Atlas collection, gathering metadata and creating table records in the AWS Glue Data Catalog. With the Data Catalog table, we created an ETL process using the AWS Glue Studio UI to extract data from the MongoDB Atlas collection to an S3 bucket without writing a single line of code.

You can try this yourself by configuring an AWS Glue crawler, creating an AWS Glue ETL job with AWS Glue Studio, and launching MongoDB Atlas from a QuickStart or from MongoDB Atlas on AWS Marketplace.

Special thanks to everyone who contributed to this crawler feature launch: Julio Montes de Oca, Mita Gavade, and Alex Prazma.


About the authors

Igor Alekseev is a Senior Partner Solution Architect at AWS in Data and Analytics domain. In his role Igor is working with strategic partners helping them build complex, AWS-optimized architectures. Prior joining AWS, as a Data/Solution Architect he implemented many projects in Big Data domain, including several data lakes in Hadoop ecosystem. As a Data Engineer he was involved in applying AI/ML to fraud detection and office automation.

Sandeep Adwankar is a Senior Technical Product Manager at AWS. Based in the California Bay Area, he works with customers around the globe to translate business and technical requirements into products that enable customers to improve how they manage, secure, and access data.