Tag Archives: AWS Security Hub

Visualize AWS Security Hub Findings using Analytics and Business Intelligence Tools

Post Syndicated from Sujatha Kuppuraju original https://aws.amazon.com/blogs/architecture/visualize-aws-security-hub-findings-using-analytics-and-business-intelligence-tools/

To improve the security posture in your organization, you first must have a comprehensive view of your security, operations, and compliance data. AWS Security Hub gives you a thorough view of your security alerts and security posture across all your AWS accounts. This is shown as Security Hub findings, which are generated from different AWS services and partner products. Security Hub also provides the capability to filter, aggregate, and visualize these findings as Security Hub insights.

Organizations have additional requirements to centralize the Security Hub findings into their existing operational store. They also must connect the findings with other operational data. In this blog, we share two architecture design options, which collect Security Hub findings across Regions. You can make these findings searchable, and build multiple visualization dashboards using analytics and BI Tools in order to gain insights.

Some of the benefits of these architectures:

  • Ability to combine Security Hub findings across Regions and generate a single dashboard view
  • Ability to combine the various security and compliance data into a single centralized dashboard
  • Ability to correlate security and compliance findings with operational data. This can be AWS CloudTrail logs and customer logs for deeper analysis and insights
  • Ability to build a security and compliance scorecard across various dimensions. This is achieved by combining the Security Hub findings and AWS resource inventory generated using an enterprise-wide tagging strategy

Approach to visualize Security Hub findings in multi-account environments

There are four steps involved in this approach, as shown in Figure 1:

Figure 1. Steps involved in improving the visibility of AWS Security Hub findings

Figure 1. Steps involved in improving the visibility of AWS Security Hub findings

  1. Set up your AWS Security Hub administrator account. Designate one of the AWS accounts within your AWS Organizations to be a delegated administrator for Security Hub. This account can manage and receive and findings across member accounts.
  2. Enable AWS Security Hub in member accounts. Enable required security standards, AWS native service integration, and partner integrations in all the member accounts across your AWS Regions.
  3. Export and consolidate findings. For each Region you operate in, collect findings and consolidate across Regions by ingesting the findings to a centralized repository.
  4. Query and visualize insights. Query the findings from the centralized findings repository and build dashboards for visualizations.

Design option one: View Security Hub findings using AWS serverless analytics services

This option, shown in Figure 2, uses Amazon Athena, a serverless, interactive, query service that analyzes data in Amazon Simple Storage Service (S3) using standard SQL. AWS Glue, a serverless, data integration service discovers, prepares, and combines data for analytics, machine learning (ML), and application development is also used. Amazon QuickSight, a scalable, serverless, embeddable, ML-powered, business intelligence (BI) service is used to search and visualize Security Hub findings from multiple accounts and Regions.

Figure 2. Architecture to view Security Hub findings using AWS serverless analytics services

Figure 2. Architecture to view Security Hub findings using AWS serverless analytics services

Architecture overview

  • Designate an AWS account in your AWS Organization as a delegated administrator for Security Hub. This account will publish events to Amazon EventBridge for its own findings, in addition to findings received from member accounts.
  • Configure the EventBridge rule to deliver the Security Hub finding event type into Amazon Kinesis Data Firehose. If you are operating in multiple Regions set up an EventBridge rule and Kinesis Data Firehose in each of those Regions.
  • Set up Kinesis Data Firehose in multiple Regions to deliver data into a Single S3 bucket, which helps to consolidate findings across multiple Regions.
  • Partition the data in your S3-based by account number, Region, date, and other preferred parameters.
  • Use AWS Glue to crawl the S3 bucket and build the schema of the Security Hub findings. This is used by Amazon Athena to query the data. You can create a view in Athena to flatten some of the nested attributes in the Security Hub findings.
  • Build your Amazon QuickSight dashboard using the view created in Athena.

Figure 3 shows a sample dashboard created in QuickSight to view consolidated Security Hub findings across accounts and Regions.

Figure 3. Sample Security Hub findings dashboard created using Amazon QuickSight

Figure 3. Sample Security Hub findings dashboard created using Amazon QuickSight

Design option two: View Security Hub findings using a managed Amazon ES cluster and Kibana

This option, shown in Figure 4, uses a managed Amazon Elasticsearch Service cluster to ingest the findings, and Kibana to search and visualize the findings. Amazon Elasticsearch Service is a fully managed service that allows you to deploy, secure, and run Elasticsearch cost-effectively, and at scale.

Figure 4. Architecture to view Security Hub findings using Amazon ES cluster and Kibana

Figure 4. Architecture to view Security Hub findings using Amazon ES cluster and Kibana

Architecture overview

  • Similar to the previous design option, the Security Hub administrator account publishes events to Amazon EventBridge for findings.
  • Configure the EventBridge rule to deliver the Security Hub finding event type into Amazon Kinesis Data Firehose. If you are operating in multiple Regions, then you must set up an EventBridge rule and Kinesis Data Firehose in each of those Regions.
  • It’s recommended that you set up Kinesis Data Firehose in multiple Regions to deliver data into a central Amazon ES cluster. This serves as a single pane of glass for security findings across these different Regions.
  • Use Kibana, a popular open source visualization tool designed to work with Elasticsearch. You’ll be able to create visualizations and dashboards to analyze and share your findings.

Amazon ES can help you configure rules on the findings to send specialized alerts. When coupled with anomaly detection, Amazon ES can automatically detect anomalies in your findings data using unsupervised machine learning algorithm and alert you in near-real.

Figure 5 shows a sample dashboard created in Kibana to view consolidated Security Hub findings across accounts and Regions in an Elasticsearch cluster.

Figure 5. Sample Security Hub findings dashboard created in Kibana

Figure 5. Sample Security Hub findings dashboard created in Kibana

Conclusion

In this post, we showed you two architectural design options to collect AWS Security Hub findings across multiple AWS Regions in a multi-account AWS environment. These approaches allow you to connect the AWS Security Hub findings with other operational data. This makes it searchable, and will allow you to draw insights and achieve an improved organization-wide security posture. These options use AWS managed and serverless services, which are scalable and configurable for high availability and performance. Make your design choice based on your enterprise needs for search, analytics, and insights visualization options.

Further Reading:

How to automate forensic disk collection in AWS

Post Syndicated from Matt Duda original https://aws.amazon.com/blogs/security/how-to-automate-forensic-disk-collection-in-aws/

In this blog post you’ll learn about a hands-on solution you can use for automated disk collection across multiple AWS accounts. This solution will help your incident response team set up an automation workflow to capture the disk evidence they need to analyze to determine scope and impact of potential security incidents. This post includes AWS CloudFormation templates and all of the required AWS Lambda functions, so you can deploy this solution in your own environment. This post focuses primarily on two sources as the origination of the evidence collection workflow: AWS Security Hub and Amazon GuardDuty.

Why is automating forensic disk collection important?

AWS offers unique scaling capabilities in our compute environments. As you begin to increase your number of compute instances across multiple AWS accounts or organizations, you will find operational aspects of your business that must also scale. One of these critical operational tasks is the ability to quickly gather forensically sound disk and memory evidence during a security event.

During a security event, your incident response (IR) team must be able to collect and analyze evidence quickly while maintaining accuracy for the time period surrounding the event. It is both challenging and time consuming for the IR team to manually collect all of the relevant evidence in a cloud environment, across a large number of instances and accounts. Additionally, manual collection requires time that could otherwise be spent analyzing and responding to an event. Every role assumption, every console click, and every manual trigger required by the IR team, adds time for an attacker to continue to work through systems to meet their objectives.

Indicators of compromise (IoCs) are pieces of data that IR teams often use to identify potential suspicious activity within networks that might need further investigation. These IoCs can include file hashes, domains, IP addresses, or user agent strings. IoCs are used by services such as GuardDuty to help you discover potentially malicious activity in your accounts. For example, when you are alerted that an Amazon Elastic Compute Cloud (Amazon EC2) instance contains one or more IoCs, your IR team must gather a point-in-time copy of relevant forensic data to determine the root cause, and evaluate the likelihood that the finding requires action. This process involves gathering snapshots of any and all attached volumes, a live dump of the system’s memory, a capture of the instance metadata, and any logs that relate to the instance. These sources help your IR team to identify next steps and work towards a root cause.

It is important to take a point-in-time snapshot of an instance as close in time to the incident as possible. If there is a delay in capturing the snapshot, it can alter or make evidence unusable because the data has changed or been deleted. To take this snapshot quickly, you need a way to automate the collection and delivery of potentially hundreds of disk images while ensuring each snapshot is collected in the same way and without creating a bottleneck in the pipeline that could reduce the integrity of the evidence. In this blog post, I explain the details of the automated disk collection workflow, and explain why you might make different design decisions. You can download the solutions in CloudFormation, so that you can deploy this solution and get started on your own forensic automation workflows.

AWS Security Hub provides an aggregated view of security findings across AWS accounts, including findings produced by GuardDuty, when enabled. Security Hub also provides you with the ability to ingest custom or third-party findings, which makes it an excellent starting place for automation. This blog post uses EC2 GuardDuty findings collected into Security Hub as the example, but you can also use the same process to include custom detection events, or alerts from partner solutions such as CrowdStrike, McAfee, Sophos, Symantec, or others.

Infrastructure overview

The workflow described in this post automates the tasks that an IR team commonly takes during the course of an investigation.

Overview of disk collection workflow

The high-level disk collection workflow steps are as follows:

  1. Create a snapshot of each Amazon Elastic Block Store (Amazon EBS) volume attached to suspected instances.
  2. Create a folder in the Amazon Simple Storage Service (Amazon S3) evidence bucket with the original event data.
  3. Launch one Amazon EC2 instance per EBS volume, to be used in streaming a bit-for-bit copy of the EBS snapshot volume. These EC2 instances are launched without SSH key pairs, to help prevent any unintentional evidence corruption and to ensure consistent processing without user interaction. The EC2 instances use third-party tools dc3dd and incrond to trigger and process volumes.
  4. Write all logs from the workflow and instances to Amazon CloudWatch Logs log groups, for audit purposes.
  5. Include all EBS volumes in the S3 evidence bucket as raw image files (.dd), with the metadata from the automated capture process, as well as hashes for validation and verification.

Overview of AWS services used in the workflow

Another way of looking at this high-level workflow is from the service perspective, as shown in Figure 1.

Figure 1: Service workflow for forensic disk collection

Figure 1: Service workflow for forensic disk collection

The workflow in Figure 1 shows the following steps:

  1. A GuardDuty finding is triggered for an instance in a monitored account. This example focuses on a GuardDuty finding, but the initial detection source can also be a custom event, or an event from a third party.
  2. The Security Hub service in the monitored account receives the GuardDuty finding, and forwards it to the Security Hub service in the security account.
  3. The Security Hub service in the security account receives the monitored account’s finding.
  4. The Security Hub service creates an event over Amazon EventBridge for the GuardDuty findings, which is then caught by an EventBridge rule to forward to the DiskForensicsInvoke Lambda function. The following is the example event rule, which is included in the deployment. This example can be expanded or reduced to fit your use-case. By default, the example is set to disabled in CloudFormation. When you are ready to use the automation, you will need to enable it.
    {
      "detail-type": [
        "Security Hub Findings - Imported"
      ],
      "source": [
        "aws.securityhub"
      ],
      "detail": {
        "findings": {
          "ProductFields": {
            "aws/securityhub/SeverityLabel": [
              "CRITICAL",
              "HIGH",
              "MEDIUM"
            ],
            "aws/securityhub/ProductName": [
              "GuardDuty"
            ]
          }
        }
      }
    }
    

  5. The DiskForensicsInvoke Lambda function receives the event from EventBridge, formats the event, and provides the formatted event as input to AWS Step Functions workflow.
  6. The DiskForensicStepFunction workflow includes ten Lambda functions, from initial snapshot to streaming the evidence to the S3 bucket. After the Step Functions workflow enters the CopySnapshot state, it converts to a map state. This allows the workflow to have one thread per volume submitted, and ensures that each volume will be placed in the evidence bucket as quickly as possible without needing to wait for other steps to complete.
    Figure 2: Forensic disk collection Step Function workflow

    Figure 2: Forensic disk collection Step Function workflow

    As shown in Figure 2, the following are the embedded Lambda functions in the DiskForensicStepFunction workflow:

    1. CreateSnapshot – This function creates the initial snapshots for each EBS volume attached to the instance in question. It also records instance metadata that is included with the snapshot data for each EBS volume.
      Required Environmental Variables: ROLE_NAME, EVIDENCE_BUCKET, LOG_GROUP
    2. CheckSnapshot – This function checks to see if the snapshots from the previous step are completed. If not, the function retries with an exponential backoff.
      Required Environmental Variable: ROLE_NAME
    3. CopySnapshot – This function copies the initial snapshot and ensures that it is using the forensics AWS Key Management Service (AWS KMS) key. This key is stored in the security account and will be used throughout the remainder of the process.
      Required Environmental Variables: ROLE_NAME, KMS_KEY
    4. CheckCopySnapshot – This function checks to see if the snapshot from the previous step is completed. If not, the function retries with exponential backoff.
      Required Environmental Variable: ROLE_NAME
    5. ShareSnapshot – This function takes the copied snapshot using the forensics KMS key, and shares it with the security account.
      Required Environmental Variables: ROLE_NAME, SECURITY_ACCOUNT
    6. FinalCopySnapshot – This function copies the shared snapshot into the security account, as the original shared snapshot is still owned by the monitored account. This ensures that a copy is available, in case it has to be referenced for additional processing later.
      Required Environmental Variable: KMS_KEY
    7. FinalCheckSnapshot – This function checks to see if the snapshot from the previous step is completed. If not, the function fails and it retries with an exponential backoff.
    8. CreateVolume – This function creates an EBS Magnetic volume from the snapshot in the previous step. These volumes created use magnetic disks, because they are required for consistent hash results from the dc3dd process. This volume cannot use a solid state drive (SSD), because the hash would be different each time. If the EBS Magnetic volume size is greater than or equal to 500GB, then Amazon EBS switches from using standard EBS Magnetic volumes to Throughput Optimized HDD (st1) volumes.
      Required Environmental Variables: KMS_KEY, SUPPORTED_AZS
    9. RunInstance – This function launches one EC2 instance per volume, to be used in streaming the volume to the S3 bucket. The AMI passed by the environmental variable needs to be created using the provided Amazon EC2 Image Builder pipeline before deploying the environment. This function also passes some user data to the instance, artifact bucket, source volume name, and the incidentID. This information is used by the instance when placing the evidence into the S3 bucket.
      Required Environmental Variables: AMI_ID, INSTANCE_PROFILE_NAME, VPC_ID, SECURITY_GROUP
    10. CreateInstanceWait – This function creates a 30-second wait, to allow the instance some additional time to spin up.
    11. MountForensicVolume – This function checks the CloudWatch log group ForensicDiskReadiness, to see that the incrond service is running on the instance. If the incrond service is running, the function attaches the volume to the instance and then writes the final logs to the S3 bucket and CloudWatch Logs.
      Required Environmental Variable: LOG_GROUP
  7. The instance that is created has pre-built tools and scripts on it from the template below using Image Builder. This instance uses the incrond tool to monitor /dev/disk/by-label for new devices being attached to the instance. After the MountForensicVolume Lambda function attaches the volume to the instance, a file is created in the /dev/disk/by-label directory for the attached volume. The incrond daemon starts the orchestrator script, which calls the collector script. The collector script uses the dc3dd tool to stream the bit-for-bit copy of the volume to S3. After the copy has completed, the image shuts down and is terminated. All logs from the process are sent to the S3 bucket and CloudWatch Logs.

The solution provided in the post includes the CloudFormation templates you need to get started, except for creation the initial EventBridge rule (which is provided in step 4 of the previous section). The solution includes an isolated VPC, subnets, security groups, roles, and more. The VPC provided does not provide any egress through an internet gateway or NAT gateway, and that is the recommended solution. The only connectivity provided is through the S3 gateway VPC endpoint and the CloudWatch Logs interface VPC endpoint (also deployed in the template).

Deploy the CloudFormation templates

To implement the solution outlined in this post, you need to deploy three separate AWS CloudFormation templates in the order described in this section.

diskForensicImageBuilder (security account)

First, you deploy diskForensicImageBuilder in the security account. This template contains the resources and AMIs needed to create and run the Image Builder pipeline that is required to build the collector VM. This pipeline installs the required binaries, and scripts, and updates the system.

Note: diskForensicImageBuilder is configured to use the default VPC and security group. If you have added restrictions or deleted your default VPC, you will need to modify the template.

To deploy the diskForensicImageBuilder template

  1. To open the AWS CloudFormation console pre-loaded with the template, choose the following Launch Stack button.
    Select the Launch Stack button to launch the template
  2. In the AWS CloudFormation console, on the Specify Details page, enter a name for the stack.
  3. Leave all default settings in place, and choose Next to configure the stack options.
  4. Choose Next to review and scroll to the bottom of the page. Select the check box under the Capabilities section, next to of the acknowledgement:
    • I acknowledge that AWS CloudFormation might create IAM resources with custom names.
  5. Choose Create Stack.
  6. After the Image Builder pipeline has been created, on the Image pipelines page, choose Actions and select Run pipeline to manually run the pipeline to create the base AMI.

    Figure 3: Run the new Image Builder pipeline

    Figure 3: Run the new Image Builder pipeline

diskForensics (security account)

Second, you deploy diskForensics in the security account. This is a nested CloudFormation stack containing four CloudFormation templates. The four CloudFormation templates are as follows:

  1. forensicResources – This stack holds all of the foundation for the solution, including the VPC and networking components, the S3 evidence bucket, CloudWatch log groups, and collectorVM instance profile.

    Figure 4: Forensics VPC

    Figure 4: Forensics VPC

  2. forensicFunctions – This stack contains all of the Lambda functions referenced in the Step Functions workflow as well as the role used by the Lambda functions.
  3. forensicStepFunction – This stack contains the Step Functions code, the role used by the Step Functions service, and the CloudWatch log group used by the service. It also contains an Amazon Simple Notification Service (SNS) topic used to alert on pipeline failure.
  4. forensicStepFunctionInvoke – This stack contains the DiskForensicsInvoke Lambda function and the role used by that Lambda function that allows it to call the Step Function workflow.

Note: You need to have the following required variables to continue:

  • ArtifactBucketName
  • ORGID
  • ForensicsAMI

If your accounts are not using AWS Organizations, you can use a dummy string for now. It adds a condition statement to the forensics KMS key that you can update or remove later.

To deploy the diskForensics stack

  1. To open the AWS CloudFormation console pre-loaded with the template, choose the following Launch Stack button.
    Select the Launch Stack button to launch the template
  2. In the AWS CloudFormation console, on the Specify Details page, enter a name for the stack.
  3. For the ORGID field, enter the AWS Organizations ID.

    Note: If you are not using AWS organizations, leave the default string. If you are deploying as multi-account without AWS Organizations, you will need to update the KMS key policy to remove the principalOrgID condition statements, and add the correct principals.

  4. For the ArtifactBucketName field, enter the S3 bucket name you would like to use for your forensic artifacts.

    Important: The ArtifactBucketName must be a globally unique name.

  5. For the ForensicsAMI field, enter the AMI ID for the image that was created by Image Builder.
  6. For the example in this post, leave the default values for all other fields. Customizing these fields allows you to customize this code example for your own purposes.
  7. Choose Next to configure the stack options and leave all default settings in place.
  8. Choose Next to review and scroll to the bottom of the page. Select the two check boxes under the Capabilities section, next to each of the acknowledgements:
    • I acknowledge that AWS CloudFormation might create IAM resources with custom names.
    • I acknowledge that AWS CloudFormation might require the following capability: CAPABILITY_AUTO_EXPAND.
  9. Choose Create Stack.
  10. After the stack has completed provisioning, subscribe to the Amazon SNS topic to receive pipeline alerts.

diskMember (each monitored account)

Third, you deploy diskMember in each monitored account. This stack contains the role and policy that the automation workflow needs to assume, so that it can create the initial snapshots and share the snapshot with the security account. If you are deploying this solution in a single account, you deploy diskMember in the security account.

Important: Ensure that all KMS keys that could be used to encrypt EBS volumes in each monitored account grant this role the ability to CreateGrant, Encrypt, Decrypt, ReEncrypt*, GenerateDataKey*, and Describe key. The default policy grants the permissions in AWS Identity and Access Management (IAM), but any restrictive resource policies could block the ability to create the initial snapshot and decrypt the snapshot when making the copy.

To deploy the diskMember stack

  1. To open the AWS CloudFormation console pre-loaded with the template, choose the following Launch Stack button.
    Select the Launch Stack button to launch the template
    If deploying across multiple accounts, consider using AWS CloudFormation StackSets for simplified multi-account deployment.
  2. In the AWS CloudFormation console, on the Specify Details page, enter a name for the stack.
  3. For the MasterAccountNum field, enter the account number for your security administrator account.
  4. Choose Next to configure the stack options and leave all default settings in place.
  5. Choose Next to review and scroll to the bottom of the page. Select the check box under the Capabilities section, next to the acknowledgement:
    • I acknowledge that AWS CloudFormation might create IAM resources with custom names.
  6. Choose Create Stack.

Test the solution

Next, you can try this solution with an event sample to start the workflow.

To initiate a test run

  1. Copy the following example GuardDuty event. The example uses the AWS Region us-east-1, but you can update the example to use another Region. Be sure to replace the account ID 0123456789012 with the account number of your monitored account, and replace the instance ID i-99999999 with the instance ID you would like to capture.
    {
      “SchemaVersion”: “2018-10-08”,
      “Id”: “arn:aws:guardduty:us-east-1:0123456789012:detector/f2b82a2b2d8d8541b8c6d2c7d9148e14/finding/b0baa737c3bf7309db2a396651fdb500”,
      “ProductArn”: “arn:aws:securityhub:us-east-1::product/aws/guardduty”,
      “GeneratorId”: “arn:aws:guardduty:us-east-1:0123456789012:detector/f2b82a2b2d8d8541b8c6d2c7d9148e14”,
      “AwsAccountId”: “0123456789012”,
      “Types”: [
        “Effects/Resource Consumption/UnauthorizedAccess:EC2-TorClient”
      ],
      “FirstObservedAt”: “2020-10-22T03:52:13.438Z”,
      “LastObservedAt”: “2020-10-22T03:52:13.438Z”,
      “CreatedAt”: “2020-10-22T03:52:13.438Z”,
      “UpdatedAt”: “2020-10-22T03:52:13.438Z”,
      “Severity”: {
        “Product”: 8,
        “Label”: “HIGH”,
        “Normalized”: 60
      },
      “Title”: “EC2 instance i-99999999 is communicating with Tor Entry node.”,
      “Description”: “EC2 instance i-99999999 is communicating with IP address 198.51.100.0 on the Tor Anonymizing Proxy network marked as an Entry node.”,
      “SourceUrl”: “https://us-east-1.console.aws.amazon.com/guardduty/home?region=us-east-1#/findings?macros=current&fId=b0baa737c3bf7309db2a396651fdb500”,
      “ProductFields”: {
        “aws/guardduty/service/action/networkConnectionAction/remotePortDetails/portName”: “HTTP”,
        “aws/guardduty/service/archived”: “false”,
        “aws/guardduty/service/action/networkConnectionAction/remoteIpDetails/organization/asnOrg”: “GeneratedFindingASNOrg”,
        “aws/guardduty/service/action/networkConnectionAction/remoteIpDetails/Geolocation/lat”: “0”,
        “aws/guardduty/service/action/networkConnectionAction/remoteIpDetails/ipAddressV4”: “198.51.100.0”,
        “aws/guardduty/service/action/networkConnectionAction/remoteIpDetails/Geolocation/lon”: “0”,
        “aws/guardduty/service/action/networkConnectionAction/blocked”: “false”,
        “aws/guardduty/service/action/networkConnectionAction/remotePortDetails/port”: “80”,
        “aws/guardduty/service/action/networkConnectionAction/remoteIpDetails/country/countryName”: “GeneratedFindingCountryName”,
        “aws/guardduty/service/serviceName”: “guardduty”,
        “aws/guardduty/service/action/networkConnectionAction/localIpDetails/ipAddressV4”: “10.0.0.23”,
        “aws/guardduty/service/detectorId”: “f2b82a2b2d8d8541b8c6d2c7d9148e14”,
        “aws/guardduty/service/action/networkConnectionAction/remoteIpDetails/organization/org”: “GeneratedFindingORG”,
        “aws/guardduty/service/action/networkConnectionAction/connectionDirection”: “OUTBOUND”,
        “aws/guardduty/service/eventFirstSeen”: “2020-10-22T03:52:13.438Z”,
        “aws/guardduty/service/eventLastSeen”: “2020-10-22T03:52:13.438Z”,
        “aws/guardduty/service/evidence/threatIntelligenceDetails.0_/threatListName”: “GeneratedFindingThreatListName”,
        “aws/guardduty/service/action/networkConnectionAction/localPortDetails/portName”: “Unknown”,
        “aws/guardduty/service/action/actionType”: “NETWORK_CONNECTION”,
        “aws/guardduty/service/action/networkConnectionAction/remoteIpDetails/city/cityName”: “GeneratedFindingCityName”,
        “aws/guardduty/service/resourceRole”: “TARGET”,
        “aws/guardduty/service/action/networkConnectionAction/localPortDetails/port”: “39677”,
        “aws/guardduty/service/action/networkConnectionAction/protocol”: “TCP”,
        “aws/guardduty/service/count”: “1”,
        “aws/guardduty/service/additionalInfo/sample”: “true”,
        “aws/guardduty/service/action/networkConnectionAction/remoteIpDetails/organization/asn”: “-1”,
        “aws/guardduty/service/action/networkConnectionAction/remoteIpDetails/organization/isp”: “GeneratedFindingISP”,
        “aws/guardduty/service/evidence/threatIntelligenceDetails.0_/threatNames.0_”: “GeneratedFindingThreatName”,
        “aws/securityhub/FindingId”: “arn:aws:securityhub:us-east-1::product/aws/guardduty/arn:aws:guardduty:us-east-1:0123456789012:detector/f2b82a2b2d8d8541b8c6d2c7d9148e14/finding/b0baa737c3bf7309db2a396651fdb500”,
        “aws/securityhub/ProductName”: “GuardDuty”,
        “aws/securityhub/CompanyName”: “Amazon”
      },
      “Resources”: [
        {
          “Type”: “AwsEc2Instance”,
          “Id”: “arn:aws:ec2:us-east-1:0123456789012:instance/i-99999999”,
          “Partition”: “aws”,
          “Region”: “us-east-1”,
          “Tags”: {
            “GeneratedFindingInstaceTag7”: “GeneratedFindingInstaceTagValue7”,
            “GeneratedFindingInstaceTag8”: “GeneratedFindingInstaceTagValue8”,
            “GeneratedFindingInstaceTag9”: “GeneratedFindingInstaceTagValue9”,
            “GeneratedFindingInstaceTag1”: “GeneratedFindingInstaceValue1”,
            “GeneratedFindingInstaceTag2”: “GeneratedFindingInstaceTagValue2”,
            “GeneratedFindingInstaceTag3”: “GeneratedFindingInstaceTagValue3”,
            “GeneratedFindingInstaceTag4”: “GeneratedFindingInstaceTagValue4”,
            “GeneratedFindingInstaceTag5”: “GeneratedFindingInstaceTagValue5”,
            “GeneratedFindingInstaceTag6”: “GeneratedFindingInstaceTagValue6”
          },
          “Details”: {
            “AwsEc2Instance”: {
              “Type”: “m3.xlarge”,
              “ImageId”: “ami-99999999”,
              “IpV4Addresses”: [
                “10.0.0.1”,
                “198.51.100.0”
              ],
              “IamInstanceProfileArn”: “arn:aws:iam::0123456789012:example/instance/profile”,
              “VpcId”: “GeneratedFindingVPCId”,
              “SubnetId”: “GeneratedFindingSubnetId”,
              “LaunchedAt”: “2016-08-02T02:05:06Z”
            }
          }
        }
      ],
      “WorkflowState”: “NEW”,
      “Workflow”: {
        “Status”: “NEW”
      },
      “RecordState”: “ACTIVE”
    }
    

  2. Navigate to the DiskForensicsInvoke Lambda function and add the GuardDuty event as a test event.
  3. Choose Test. You should see a success for the invocation.
  4. Navigate to the Step Functions workflow to monitor its progress. When the instances have terminated, all of the artifacts should be in the S3 bucket with additional logs in CloudWatch Logs.

Expected outputs

The forensic disk collection pipeline maintains logs of the actions throughout the process, and uploads the final artifacts to the S3 artifact bucket and CloudWatch Logs. This enables security teams to send forensic collection logs to log aggregation tools or service management tools for additional integrations. The expected outputs of the solution are detailed in the following sections, organized by destination.

S3 artifact outputs

The S3 artifact bucket is the final destination for all logs and the raw disk images. For each security incident that triggers the Step Functions workflow, a new folder will be created with the name of the IncidentID. Included in this folder will be the JSON file that triggered the capture operation, the image (dd) files for the volumes, the capture log, and the resources associated with the capture operation, as shown in Figure 5.

Figure 5: Forensic artifacts in the S3 bucket

Figure 5: Forensic artifacts in the S3 bucket

Forensic Disk Audit log group

The Forensic Disk Audit CloudWatch log group contains a log of where the Step Functions workflow was after creating the initial snapshots in the CreateSnapshot Lambda function. This includes the high-level finding information, as well as the metadata for each snapshot. Also included in this log group is the completed data around each completed disk collection operation, including all associated resources and the location of the forensic evidence in the S3 bucket. The following event is an example log demonstrating a completed capture. Notice all of the metadata provided under captured snapshots. Be sure to update the example to use the correct AWS Region. Replace the account ID 0123456789012 with the account number of your monitored account, and replace the instance ID i-99999999 with the instance ID you would like to capture.

{
  "AwsAccountId": "0123456789012",
  "Types": [
    "Effects/Resource Consumption/UnauthorizedAccess:EC2-TorClient"
  ],
  "FirstObservedAt": "2020-10-22T03:52:13.438Z",
  "LastObservedAt": "2020-10-22T03:52:13.438Z",
  "CreatedAt": "2020-10-22T03:52:13.438Z",
  "UpdatedAt": "2020-10-22T03:52:13.438Z",
  "Severity": {
    "Product": 8,
    "Label": "HIGH",
    "Normalized": 60
  },
  "Title": "EC2 instance i-99999999 is communicating with Tor Entry node.",
  "Description": "EC2 instance i-99999999 is communicating with IP address 198.51.100.0 on the Tor Anonymizing Proxy network marked as an Entry node.",
  "FindingId": "arn:aws:securityhub:us-east-1::product/aws/guardduty/arn:aws:guardduty:us-east-1:0123456789012:detector/f2b82a2b2d8d8541b8c6d2c7d9148e14/finding/b0baa737c3bf7309db2a396651fdb500",
  "Resource": {
    "Type": "AwsEc2Instance",
    "Arn": "arn:aws:ec2:us-east-1:0123456789012:instance/i-99999999",
    "Id": "i-99999999",
    "Partition": "aws",
    "Region": "us-east-1",
    "Details": {
      "AwsEc2Instance": {
        "Type": "m3.xlarge",
        "ImageId": "ami-99999999",
        "IpV4Addresses": [
          "10.0.0.1",
          "198.51.100.0"
        ],
        "IamInstanceProfileArn": "arn:aws:iam::0123456789012:example/instance/profile",
        "VpcId": "GeneratedFindingVPCId",
        "SubnetId": "GeneratedFindingSubnetId",
        "LaunchedAt": "2016-08-02T02:05:06Z"
      }
    }
  },
  "EvidenceBucket": "forensic-artifact-bucket",
  "IncidentID": "b0baa737c3bf7309db2a396651fdb500",
  "CapturedSnapshots": [
    {
      "SourceSnapshotID": "snap-99999999",
      "SourceVolumeID": "vol-99999999",
      "SourceDeviceName": "/dev/xvda",
      "VolumeSize": 100,
      "InstanceID": "i-99999999",
      "FindingID": "arn:aws:securityhub:us-east-1::product/aws/guardduty/arn:aws:guardduty:us-east-1:0123456789012:detector/f2b82a2b2d8d8541b8c6d2c7d9148e14/finding/b0baa737c3bf7309db2a396651fdb500",
      "IncidentID": "b0baa737c3bf7309db2a396651fdb500",
      "AccountID": "0123456789012",
      "Region": "us-east-1",
      "EvidenceBucket": "forensic-artifact-bucket"
    }
  ]
}
{
  "SourceSnapshotID": "snap-99999999",
  "SourceVolumeID": "vol-99999999",
  "SourceDeviceName": "/dev/sdd",
  "VolumeSize": 100,
  "InstanceID": "i-99999999",
  "FindingID": "arn:aws:securityhub:us-east-1::product/aws/guardduty/arn:aws:guardduty:us-east-1:0123456789012:detector/f2b82a2b2d8d8541b8c6d2c7d9148e14/finding/b0baa737c3bf7309db2a396651fdb500",
  "IncidentID": "b0baa737c3bf7309db2a396651fdb500",
  "AccountID": "0123456789012",
  "Region": "us-east-1",
  "EvidenceBucket": "forensic-artifact-bucket",
  "CopiedSnapshotID": "snap-99999998",
  "EncryptionKey": "arn:aws:kms:us-east-1:0123456789012:key/e793cbd3-ce6a-4b17-a48f-7e78984346f2",
  "FinalCopiedSnapshotID": "snap-99999997",
  "ForensicVolumeID": "vol-99999998",
  "VolumeAZ": "us-east-1a",
  "ForensicInstances": [
    "i-99999998"
  ],
  "DiskImageLocation": "s3://forensic-artifact-bucket/b0baa737c3bf7309db2a396651fdb500/disk_evidence/vol-99999999.image.dd"
}

Forensic Disk Capture log group

The Forensic Disk Capture CloudWatch log group contains the logs from the EC2Collector VM. These logs detail the operations taken by the instance, which include when the dc3dd command was executed, what the transfer speed was to the S3 bucket, what the hash of the volume was, and how long the total operation took to complete. The log example in Figure 6 shows the output of the disk capture on the collector instance.

Figure 6: Forensic Disk Capture logs

Figure 6: Forensic Disk Capture logs

Cost and capture times

This solution may save you money over a traditional system that requires bastion hosts (jump boxes) and forensic instances to be readily available. With AWS, you pay only for the individual services you need, for as long as you use them. The cost of this solution is minimal, because charges are only incurred based on the logs or artifacts that you store in CloudWatch or Amazon S3, and the invocation of the Step Functions workflow. Additionally, resources such as the collectorVM are only created and used when needed.

This solution can also save you time. If an analyst was manually working through this workflow, it could take significantly more time than the automated solution. The following are some examples of collection times. You can see that even when the manual workflow time increases, the automated workflow time stays the same, because of how the solution scales.

Scenario 1: EC2 instance with one 8GB volume

  • Automated workflow: 11 minutes
  • Manual workflow: 15 minutes

Scenario 2: EC2 instance with four 8GB volumes

  • Automated workflow: 11 minutes
  • Manual workflow: 1 hour 10 minutes

Scenario 3: Four EC2 instances with one 8GB volume each

  • Automated workflow: 11 minutes
  • Manual workflow: 1 hour 20 minutes

Clean up and delete artifacts

To clean up the artifacts from the solution in this post, first delete all information in your artifact S3 bucket. Then delete the diskForensics stack, followed by the diskForensicImageBuilder stack, and finally the diskMember stack. You must also manually delete any EBS volumes or EBS snapshots created by the pipeline, these are not deleted automatically. You must also manually delete the AMI and images that are created and published by Image Builder.

Considerations

This solution covers EBS volume storage as the target for forensic disk capture. If your instances use Amazon EC2 Instance Stores in your environment, then you cannot snapshot and copy those volumes, because that data is not included in an EC2 snapshot operation. Instead, you should consider running the commands that are included in collector.sh script with AWS Systems Manager. The collector.sh script is included in the Image Builder recipe and uses dc3dd to stream a copy of the volume to Amazon S3.

Conclusion

Having this solution in place across your AWS accounts will enable fast response times to security events, as it helps ensure that forensic artifacts are collected and stored as quickly as possible. Download the .zip file for the solutions in CloudFormation, so that you can deploy this solution and get started on your own forensic automation workflows. For the talks describing this solution, see the video of SEC306 from Re:Invent 2020 and the AWS Online Tech Talk AWS Digital Forensics Automation at Goldman Sachs.

If you have feedback about this post, submit comments in the Comments section below. If you have questions about this post, start a new thread on the Amazon GuardDuty forum or contact AWS Support.

Want more AWS Security how-to content, news, and feature announcements? Follow us on Twitter.

Author

Matt Duda

Matt is a Senior Cloud Security Architect with AWS Professional Services. He has an extensive background in Cyber Security in the Financial Services Sector. He is obsessed with helping customers improve their ability to prevent, prepare, and respond to potential security events in AWS and utilizing automation wherever possible.

Contributor

Special thanks to Logan Bair who made significant contributions to this post.

How to create auto-suppression rules in AWS Security Hub

Post Syndicated from BK Das original https://aws.amazon.com/blogs/security/how-to-create-auto-suppression-rules-in-aws-security-hub/

AWS Security Hub gives you a comprehensive view of your security alerts and security posture across your AWS accounts. With Security Hub, you have a single place that aggregates, organizes, and prioritizes your security alerts, or findings, from multiple AWS services. Security Hub lets you assign workflow statuses to these findings, which are NEW, NOTIFIED, SUPPRESSED, or RESOLVED. These statuses allow you to categorize which findings are open and need your attention.

In this blog post, we show how you can create automated suppression rules for specific types of findings in AWS Security Hub, such as ones that are an accepted risk by design, or have a compensating control. By automatically suppressing these findings that don’t require follow-up action from your security team, you can concentrate on investigating and remediating findings that are not yet resolved.

As an example of a finding that you may want to suppress, suppose that your development environment doesn’t need to have Amazon Virtual Private Cloud (VPC) Flow Logs enabled because it does not contain any sensitive data (that is, it is an accepted risk). However, your production environment must have VPC Flow Logs enabled. You can use this solution to automatically suppress the development environment findings regarding VPC Flow Logs not being enabled. Then, you can focus on responding to and remediating findings regarding the production environment VPC Flow Logs that are not enabled.

This solution uses an Amazon EventBridge rule to evaluate Security Hub findings based on predefined filters. An AWS Lambda function is the target of the rule, and is triggered to perform the suppression. The Lambda function calls the Security Hub BatchUpdateFindings API action to set the finding of interest to the SUPPRESSED status.

Prerequisites

This solution assumes that you have Security Hub and AWS Config enabled in your administrator and member AWS accounts. AWS Config is required to execute the rules that will generate the findings. You will also need to enable the AWS Foundational Security Best Practices standard, because the examples in this post rely on those findings. You should ensure that you have configured your administrator account to aggregate your Security Hub findings from across your AWS accounts.

Solution overview

In Security Hub, the status of an investigation of a finding is tracked using the workflow status attribute. The workflow status for new findings is initially set to NEW. You can change the workflow status of a finding either by selecting it in the AWS Security Hub console, or by automating the change of workflow status by using AWS CLI or Security Hub API. After the owner of the finding’s resource is notified to take action, you can set the workflow status to NOTIFIED. After a finding is remediated, you can set the workflow status to RESOLVED. If the finding is not a concern for your given environment and does not require any action, then you can set the workflow status to SUPPRESSED.

In this solution, we show you how to automatically set the workflow status to SUPPRESSED for expected findings, by using EventBridge event patterns that trigger on Security Hub findings that match your defined criteria. The event pattern can match on fields of the findings such as account number, AWS Region, and Amazon Resource Names (ARNs). The Lambda function triggers on findings that match all defined criteria, and then sets the workflow status to SUPPRESSED for all matched findings using the BatchUpdateFindings Security Hub API action.

Solution architecture


Figure 1: Solution architecture overview

Figure 1: Solution architecture overview

Figure 1 shows the administrator account aggregating the Security Hub findings from the member accounts.

  1. Security Hub generates findings in the member accounts, then forwards the findings to the administrator account to be evaluated.
  2. In the administrator account, Security Hub evaluates every finding (whether generated or forwarded) against EventBridge rules.
  3. If a finding satisfies any of the defined EventBridge rule conditions, EventBridge triggers a Lambda function in the same Region. The EventBridge event bus delivers the finding to the Lambda function.
  4. The Lambda function in the administrator account performs the finding suppression evaluation, and sets the Security Hub workflow status of the finding to SUPPRESSED.

This architecture uses one Lambda function per Region. You can group together multiple suppression rules into the same EventBridge pattern when they apply to the same group of AWS accounts. You can also configure multiple separate EventBridge event patterns when a suppression rule shouldn’t apply to an account.

Implementation

First, we show how to write the EventBridge event pattern. You use the CDK to define the event rule and pattern. The following example code will suppress Security Hub findings that originate in the development accounts for VPC flow logs that aren’t enabled. The solution will filter new findings only.

In the following example, replace <account-id-1> and <account-id-2> with your own information.

event_pattern_obj = events.EventPattern(
            source=["aws.securityhub"],
            detail_type=["Security Hub Findings - Imported"],
            detail= {
                "findings": {
                    "GeneratorId": [
                        "aws-foundational-security-best-practices/v/1.0.0/EC2.6"
                    ],
                    "AwsAccountId": [
                        "<account-id-1>",
                        "<account-id-2>"
                    ],
                    "Workflow": {
                        "Status": [
                            "NEW"
                        ]
                    }
                }
            }
        )

Second, you define the EventBridge rule that will match on the defined pattern.

        vpc_flow_log_dev_account_event_rule = events.Rule(
                    self,
                    'vpc-flow-logs-development-account-eventbridge-rule',
                    description='VPC flow logs in development account finding suppression',
                    rule_name='vpc-flow-logs-development-account-sechub-rule',
                    event_pattern=event_pattern_obj
                    )

Finally, the EventBridge rule triggers the suppression Lambda function.

 vpc_flow_log_dev_account_event_rule.add_target(lambda_targets.LambdaFunction(security_hub_suppression_lambda))

Solution deployment

You can deploy the solution through either the AWS Management Console or the AWS Cloud Development Kit (AWS CDK).

To deploy the solution by using the AWS Management Console

In your security account, launch the template by choosing the following Launch Stack button.
Select the Launch Stack button to launch the template

To deploy the solution by using the AWS CDK

You can find the latest code on GitHub, where you can also contribute to the sample code. The following commands show how to deploy the solution by using the AWS CDK. First, the CDK initializes your environment and uploads the Lambda assets to Amazon Simple Storage Service (Amazon S3). Then, you can deploy the solution to your account. For <account_id>, specify the account number, or comma separated list of account numbers, that you want the suppression rule to apply to.

cdk bootstrap

cdk deploy sechub-finding-suppression --parameters GeneratorIds=<generator_ids> --parameters AccountNumbers=<account_ids>

To test the solution

  1. Create a VPC that does not have flow logs enabled. We have included a test VPC that you can deploy with the following command:
    cdk deploy vpc-test-suppression
    

  2. Verify that the Security Hub finding EC2.6 has been suppressed in the parent account and the target account. You might need to wait a few minutes for the AWS Config recorder to detect the newly created resource and then to manually trigger the following AWS Config rule:
    securityhub-vpc-flow-logs-enabled-* 
    

  3. After verifying the suppression, delete the test VPC you created to test the suppression rule:
    cdk destroy vpc-test-suppression
    

Next steps

You can configure EventBridge rules and patterns to suppress all of your findings that are accepted risk, by design, or that have a compensating control. For example, if you are performing IAM authentication by using Amazon RDS Proxy, you could consider suppressing the control [RDS.10] IAM authentication should be configured for RDS instances. You can also consider creating event patterns that filter based on resource tags, such as filtering VPCs based on tags rather than account numbers for [EC2.6] VPC flow logging should be enabled in all VPCs.

Summary

In this blog post, we showed how you can automatically suppress specific findings by using the Security Hub BatchUpdateFindings API action. We showed you how to configure EventBridge patterns and rules in order to trigger a Lambda function that calls this API action to suppress your expected findings. After you follow the steps in this blog post for automatic Security Hub suppression, your console view in Security Hub will only show findings that are not suppressed.

If you have feedback about this post, submit comments in the Comments section below.

Want more AWS Security how-to content, news, and feature announcements? Follow us on Twitter.

Author

BK Das

BK works as a Senior Security Architect with AWS Professional Services. He love to solve security problems for his customers, and help them feel comfortable within AWS. Outside of work, BK loves to play computer games, and go on long drives.

Author

Josh Joy

Josh is a Senior Security Consultant with the AWS Global Security Practice, a part of our Worldwide Professional Services Organization. Josh helps customers improve their security posture as they migrate their most sensitive workloads to AWS. Josh enjoys diving deep and working backwards in order to help customers achieve positive outcomes.

Author

Moumita Saha

Moumita is a Security Consultant with AWS Professional Services working to help enterprise customers secure their workloads in the cloud. She assists customers in secure cloud migration, designing automated solutions to protect against cyber threats in the cloud. She is passionate about cyber security, data privacy, and new, emerging cloud-security technologies.

Building an end-to-end Kubernetes-based DevSecOps software factory on AWS

Post Syndicated from Srinivas Manepalli original https://aws.amazon.com/blogs/devops/building-an-end-to-end-kubernetes-based-devsecops-software-factory-on-aws/

DevSecOps software factory implementation can significantly vary depending on the application, infrastructure, architecture, and the services and tools used. In a previous post, I provided an end-to-end DevSecOps pipeline for a three-tier web application deployed with AWS Elastic Beanstalk. The pipeline used cloud-native services along with a few open-source security tools. This solution is similar, but instead uses a containers-based approach with additional security analysis stages. It defines a software factory using Kubernetes along with necessary AWS Cloud-native services and open-source third-party tools. Code is provided in the GitHub repo to build this DevSecOps software factory, including the integration code for third-party scanning tools.

DevOps is a combination of cultural philosophies, practices, and tools that combine software development with information technology operations. These combined practices enable companies to deliver new application features and improved services to customers at a higher velocity. DevSecOps takes this a step further by integrating and automating the enforcement of preventive, detective, and responsive security controls into the pipeline.

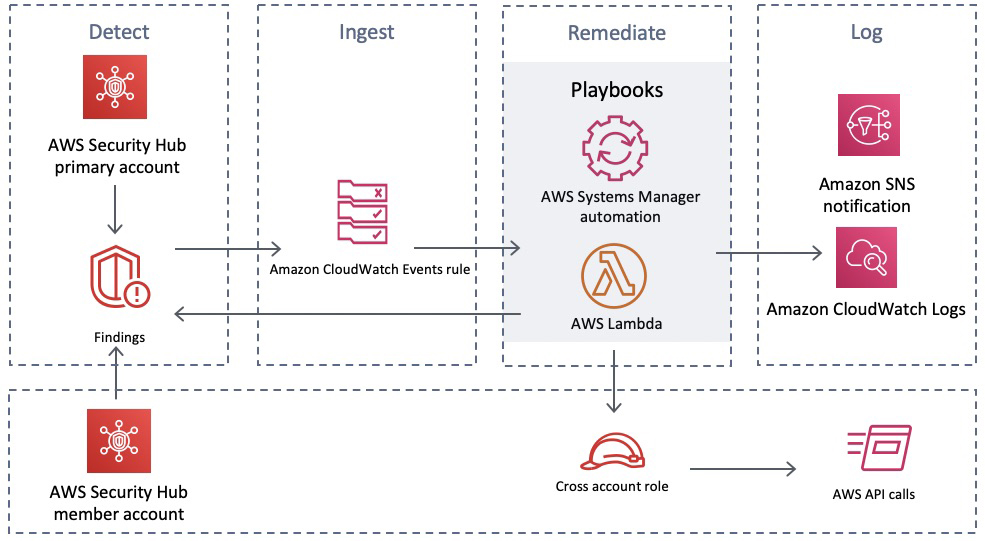
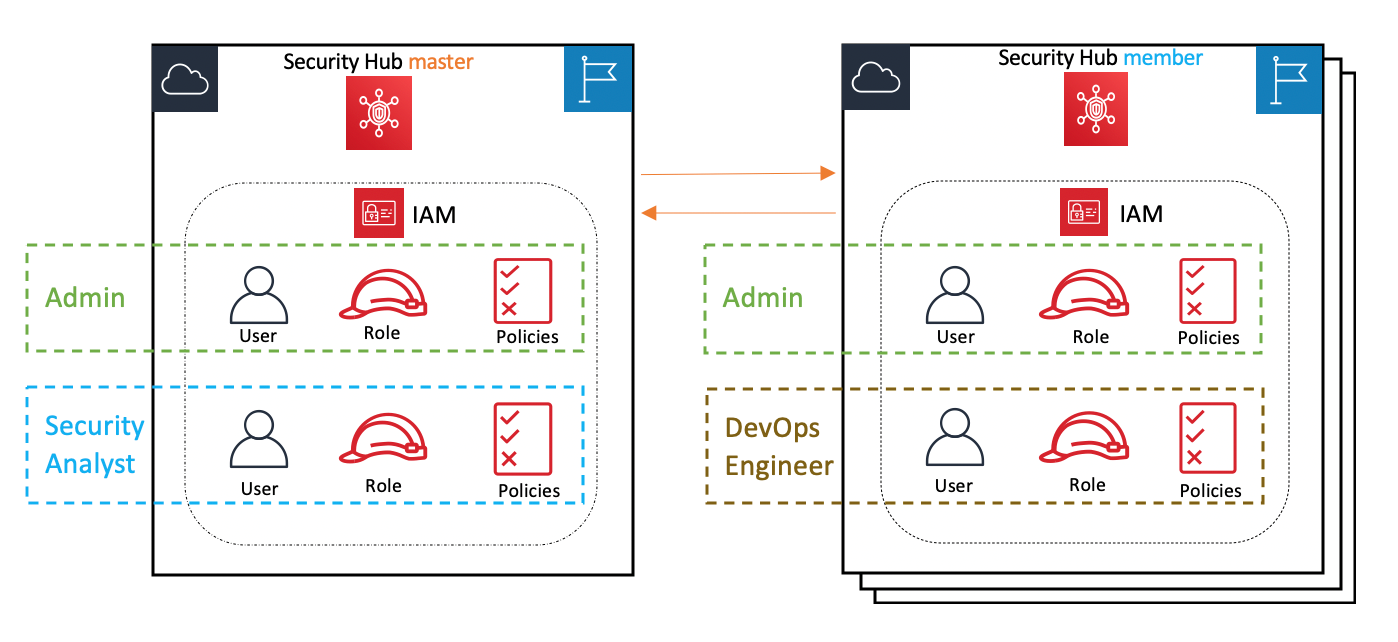
In a DevSecOps factory, security needs to be addressed from two aspects: security of the software factory, and security in the software factory. In this architecture, we use AWS services to address the security of the software factory, and use third-party tools along with AWS services to address the security in the software factory. This AWS DevSecOps reference architecture covers DevSecOps practices and security vulnerability scanning stages including secret analysis, SCA (Software Composite Analysis), SAST (Static Application Security Testing), DAST (Dynamic Application Security Testing), RASP (Runtime Application Self Protection), and aggregation of vulnerability findings into a single pane of glass.

The focus of this post is on application vulnerability scanning. Vulnerability scanning of underlying infrastructure such as the Amazon Elastic Kubernetes Service (Amazon EKS) cluster and network is outside the scope of this post. For information about infrastructure-level security planning, refer to Amazon Guard Duty, Amazon Inspector, and AWS Shield.

You can deploy this pipeline in either the AWS GovCloud (US) Region or standard AWS Regions. All listed AWS services are authorized for FedRamp High and DoD SRG IL4/IL5.

Security and compliance

Thoroughly implementing security and compliance in the public sector and other highly regulated workloads is very important for achieving an ATO (Authority to Operate) and continuously maintain an ATO (c-ATO). DevSecOps shifts security left in the process, integrating it at each stage of the software factory, which can make ATO a continuous and faster process. With DevSecOps, an organization can deliver secure and compliant application changes rapidly while running operations consistently with automation.

Security and compliance are shared responsibilities between AWS and the customer. Depending on the compliance requirements (such as FedRamp or DoD SRG), a DevSecOps software factory needs to implement certain security controls. AWS provides tools and services to implement most of these controls. For example, to address NIST 800-53 security controls families such as access control, you can use AWS Identity Access and Management (IAM) roles and Amazon Simple Storage Service (Amazon S3) bucket policies. To address auditing and accountability, you can use AWS CloudTrail and Amazon CloudWatch. To address configuration management, you can use AWS Config rules and AWS Systems Manager. Similarly, to address risk assessment, you can use vulnerability scanning tools from AWS.

The following table is the high-level mapping of the NIST 800-53 security control families and AWS services that are used in this DevSecOps reference architecture. This list only includes the services that are defined in the AWS CloudFormation template, which provides pipeline as code in this solution. You can use additional AWS services and tools or other environmental specific services and tools to address these and the remaining security control families on a more granular level.

# NIST 800-53 Security Control Family – Rev 5 AWS Services Used (In this DevSecOps Pipeline)
1 AC – Access Control

AWS IAM, Amazon S3, and Amazon CloudWatch are used.

AWS::IAM::ManagedPolicy
AWS::IAM::Role
AWS::S3::BucketPolicy
AWS::CloudWatch::Alarm

2 AU – Audit and Accountability

AWS CloudTrail, Amazon S3, Amazon SNS, and Amazon CloudWatch are used.

AWS::CloudTrail::Trail
AWS::Events::Rule
AWS::CloudWatch::LogGroup
AWS::CloudWatch::Alarm
AWS::SNS::Topic

3 CM – Configuration Management

AWS Systems Manager, Amazon S3, and AWS Config are used.

AWS::SSM::Parameter
AWS::S3::Bucket
AWS::Config::ConfigRule

4 CP – Contingency Planning

AWS CodeCommit and Amazon S3 are used.

AWS::CodeCommit::Repository
AWS::S3::Bucket

5 IA – Identification and Authentication

AWS IAM is used.

AWS:IAM:User
AWS::IAM::Role

6 RA – Risk Assessment

AWS Config, AWS CloudTrail, AWS Security Hub, and third party scanning tools are used.

AWS::Config::ConfigRule
AWS::CloudTrail::Trail
AWS::SecurityHub::Hub
Vulnerability Scanning Tools (AWS/AWS Partner/3rd party)

7 CA – Assessment, Authorization, and Monitoring

AWS CloudTrail, Amazon CloudWatch, and AWS Config are used.

AWS::CloudTrail::Trail
AWS::CloudWatch::LogGroup
AWS::CloudWatch::Alarm
AWS::Config::ConfigRule

8 SC – System and Communications Protection

AWS KMS and AWS Systems Manager are used.

AWS::KMS::Key
AWS::SSM::Parameter
SSL/TLS communication

9 SI – System and Information Integrity

AWS Security Hub, and third party scanning tools are used.

AWS::SecurityHub::Hub
Vulnerability Scanning Tools (AWS/AWS Partner/3rd party)

10 AT – Awareness and Training N/A
11 SA – System and Services Acquisition N/A
12 IR – Incident Response Not implemented, but services like AWS Lambda, and Amazon CloudWatch Events can be used.
13 MA – Maintenance N/A
14 MP – Media Protection N/A
15 PS – Personnel Security N/A
16 PE – Physical and Environmental Protection N/A
17 PL – Planning N/A
18 PM – Program Management N/A
19 PT – PII Processing and Transparency N/A
20 SR – SupplyChain Risk Management N/A

Services and tools

In this section, we discuss the various AWS services and third-party tools used in this solution.

CI/CD services

For continuous integration and continuous delivery (CI/CD) in this reference architecture, we use the following AWS services:

  • AWS CodeBuild – A fully managed continuous integration service that compiles source code, runs tests, and produces software packages that are ready to deploy.
  • AWS CodeCommit – A fully managed source control service that hosts secure Git-based repositories.
  • AWS CodeDeploy – A fully managed deployment service that automates software deployments to a variety of compute services such as Amazon Elastic Compute Cloud (Amazon EC2), AWS Fargate, AWS Lambda, and your on-premises servers.
  • AWS CodePipeline – A fully managed continuous delivery service that helps you automate your release pipelines for fast and reliable application and infrastructure updates.
  • AWS Lambda – A service that lets you run code without provisioning or managing servers. You pay only for the compute time you consume.
  • Amazon Simple Notification Service – Amazon SNS is a fully managed messaging service for both application-to-application (A2A) and application-to-person (A2P) communication.
  • Amazon S3 – Amazon S3 is storage for the internet. You can use Amazon S3 to store and retrieve any amount of data at any time, from anywhere on the web.
  • AWS Systems Manager Parameter Store – Parameter Store provides secure, hierarchical storage for configuration data management and secrets management.

Continuous testing tools

The following are open-source scanning tools that are integrated in the pipeline for the purpose of this post, but you could integrate other tools that meet your specific requirements. You can use the static code review tool Amazon CodeGuru for static analysis, but at the time of this writing, it’s not yet available in AWS GovCloud and currently supports Java and Python.

  • Anchore (SCA and SAST) – Anchore Engine is an open-source software system that provides a centralized service for analyzing container images, scanning for security vulnerabilities, and enforcing deployment policies.
  • Amazon Elastic Container Registry image scanning – Amazon ECR image scanning helps in identifying software vulnerabilities in your container images. Amazon ECR uses the Common Vulnerabilities and Exposures (CVEs) database from the open-source Clair project and provides a list of scan findings.
  • Git-Secrets (Secrets Scanning) – Prevents you from committing sensitive information to Git repositories. It is an open-source tool from AWS Labs.
  • OWASP ZAP (DAST) – Helps you automatically find security vulnerabilities in your web applications while you’re developing and testing your applications.
  • Snyk (SCA and SAST) – Snyk is an open-source security platform designed to help software-driven businesses enhance developer security.
  • Sysdig Falco (RASP) – Falco is an open source cloud-native runtime security project that detects unexpected application behavior and alerts on threats at runtime. It is the first runtime security project to join CNCF as an incubation-level project.

You can integrate additional security stages like IAST (Interactive Application Security Testing) into the pipeline to get code insights while the application is running. You can use AWS partner tools like Contrast Security, Synopsys, and WhiteSource to integrate IAST scanning into the pipeline. Malware scanning tools, and image signing tools can also be integrated into the pipeline for additional security.

Continuous logging and monitoring services

The following are AWS services for continuous logging and monitoring used in this reference architecture:

Auditing and governance services

The following are AWS auditing and governance services used in this reference architecture:

  • AWS CloudTrail – Enables governance, compliance, operational auditing, and risk auditing of your AWS account.
  • AWS Config – Allows you to assess, audit, and evaluate the configurations of your AWS resources.
  • AWS Identity and Access Management – Enables you to manage access to AWS services and resources securely. With IAM, you can create and manage AWS users and groups, and use permissions to allow and deny their access to AWS resources.

Operations services

The following are the AWS operations services used in this reference architecture:

  • AWS CloudFormation – Gives you an easy way to model a collection of related AWS and third-party resources, provision them quickly and consistently, and manage them throughout their lifecycles, by treating infrastructure as code.
  • Amazon ECR – A fully managed container registry that makes it easy to store, manage, share, and deploy your container images and artifacts anywhere.
  • Amazon EKS – A managed service that you can use to run Kubernetes on AWS without needing to install, operate, and maintain your own Kubernetes control plane or nodes. Amazon EKS runs up-to-date versions of the open-source Kubernetes software, so you can use all of the existing plugins and tooling from the Kubernetes community.
  • AWS Security Hub – Gives you a comprehensive view of your security alerts and security posture across your AWS accounts. This post uses Security Hub to aggregate all the vulnerability findings as a single pane of glass.
  • AWS Systems Manager Parameter Store – Provides secure, hierarchical storage for configuration data management and secrets management. You can store data such as passwords, database strings, Amazon Machine Image (AMI) IDs, and license codes as parameter values.

Pipeline architecture

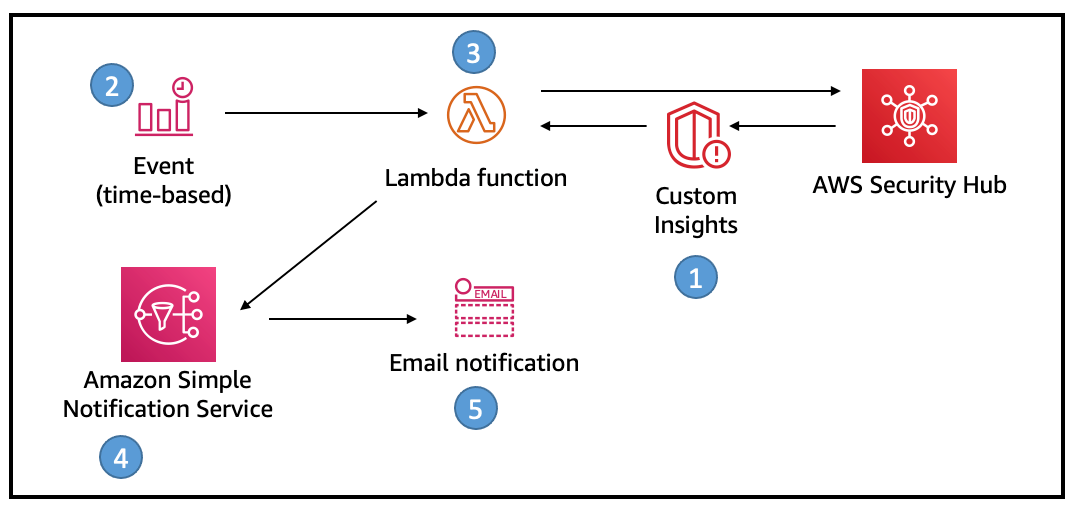
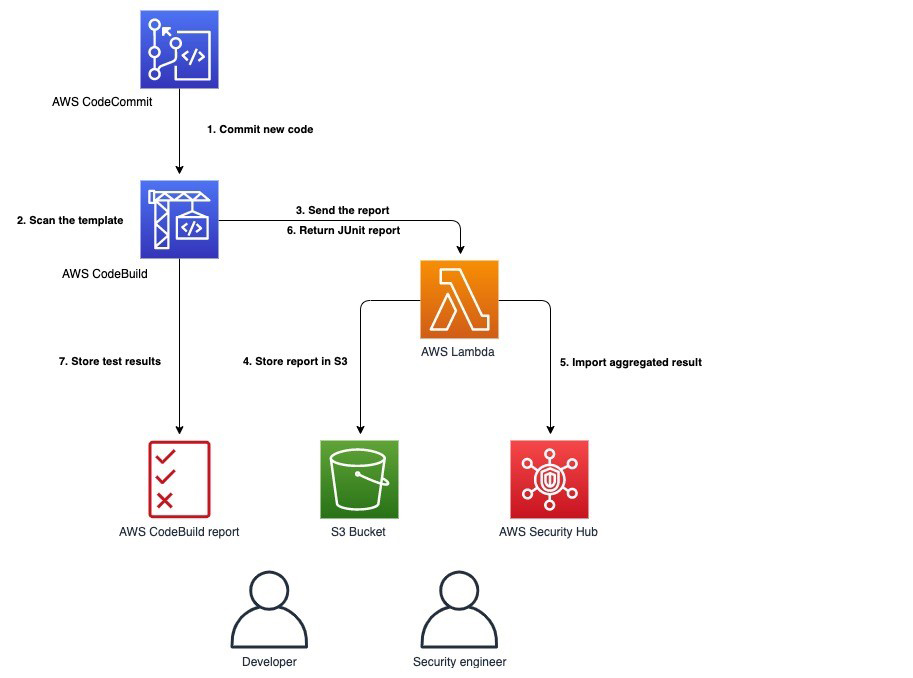
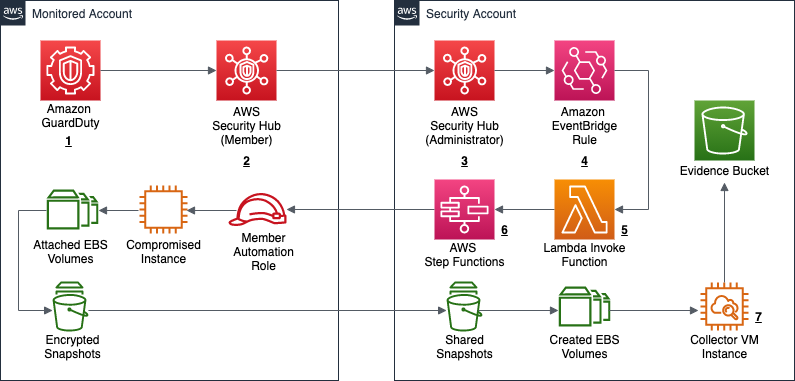
The following diagram shows the architecture of the solution. We use AWS CloudFormation to describe the pipeline as code.

Containers devsecops pipeline architecture

Kubernetes DevSecOps Pipeline Architecture

The main steps are as follows:

    1. When a user commits the code to CodeCommit repository, a CloudWatch event is generated, which triggers CodePipeline to orchestrate the events.
    2. CodeBuild packages the build and uploads the artifacts to an S3 bucket.
    3. CodeBuild scans the code with git-secrets. If there is any sensitive information in the code such as AWS access keys or secrets keys, CodeBuild fails the build.
    4. CodeBuild creates the container image and perform SCA and SAST by scanning the image with Snyk or Anchore. In the provided CloudFormation template, you can pick one of these tools during the deployment. Please note, CodeBuild is fully enabled for a “bring your own tool” approach.
      • (4a) If there are any vulnerabilities, CodeBuild invokes the Lambda function. The function parses the results into AWS Security Finding Format (ASFF) and posts them to Security Hub. Security Hub helps aggregate and view all the vulnerability findings in one place as a single pane of glass. The Lambda function also uploads the scanning results to an S3 bucket.
      • (4b) If there are no vulnerabilities, CodeBuild pushes the container image to Amazon ECR and triggers another scan using built-in Amazon ECR scanning.
    5. CodeBuild retrieves the scanning results.
      • (5a) If there are any vulnerabilities, CodeBuild invokes the Lambda function again and posts the findings to Security Hub. The Lambda function also uploads the scan results to an S3 bucket.
      • (5b) If there are no vulnerabilities, CodeBuild deploys the container image to an Amazon EKS staging environment.
    6. After the deployment succeeds, CodeBuild triggers the DAST scanning with the OWASP ZAP tool (again, this is fully enabled for a “bring your own tool” approach).
      • (6a) If there are any vulnerabilities, CodeBuild invokes the Lambda function, which parses the results into ASFF and posts it to Security Hub. The function also uploads the scan results to an S3 bucket (similar to step 4a).
    7. If there are no vulnerabilities, the approval stage is triggered, and an email is sent to the approver for action via Amazon SNS.
    8. After approval, CodeBuild deploys the code to the production Amazon EKS environment.
    9. During the pipeline run, CloudWatch Events captures the build state changes and sends email notifications to subscribed users through Amazon SNS.
    10. CloudTrail tracks the API calls and sends notifications on critical events on the pipeline and CodeBuild projects, such as UpdatePipeline, DeletePipeline, CreateProject, and DeleteProject, for auditing purposes.
    11. AWS Config tracks all the configuration changes of AWS services. The following AWS Config rules are added in this pipeline as security best practices:
      1. CODEBUILD_PROJECT_ENVVAR_AWSCRED_CHECK – Checks whether the project contains environment variables AWS_ACCESS_KEY_ID and AWS_SECRET_ACCESS_KEY. The rule is NON_COMPLIANT when the project environment variables contain plaintext credentials. This rule ensures that sensitive information isn’t stored in the CodeBuild project environment variables.
      2. CLOUD_TRAIL_LOG_FILE_VALIDATION_ENABLED – Checks whether CloudTrail creates a signed digest file with logs. AWS recommends that the file validation be enabled on all trails. The rule is noncompliant if the validation is not enabled. This rule ensures that pipeline resources such as the CodeBuild project aren’t altered to bypass critical vulnerability checks.

Security of the pipeline is implemented using IAM roles and S3 bucket policies to restrict access to pipeline resources. Pipeline data at rest and in transit is protected using encryption and SSL secure transport. We use Parameter Store to store sensitive information such as API tokens and passwords. To be fully compliant with frameworks such as FedRAMP, other things may be required, such as MFA.

Security in the pipeline is implemented by performing the Secret Analysis, SCA, SAST, DAST, and RASP security checks. Applicable AWS services provide encryption at rest and in transit by default. You can enable additional controls on top of these wherever required.

In the next section, I explain how to deploy and run the pipeline CloudFormation template used for this example. As a best practice, we recommend using linting tools like cfn-nag and cfn-guard to scan CloudFormation templates for security vulnerabilities. Refer to the provided service links to learn more about each of the services in the pipeline.

Prerequisites

Before getting started, make sure you have the following prerequisites:

  • An EKS cluster environment with your application deployed. In this post, we use PHP WordPress as a sample application, but you can use any other application.
  • Sysdig Falco installed on an EKS cluster. Sysdig Falco captures events on the EKS cluster and sends those events to CloudWatch using AWS FireLens. For implementation instructions, see Implementing Runtime security in Amazon EKS using CNCF Falco. This step is required only if you need to implement RASP in the software factory.
  • A CodeCommit repo with your application code and a Dockerfile. For more information, see Create an AWS CodeCommit repository.
  • An Amazon ECR repo to store container images and scan for vulnerabilities. Enable vulnerability scanning on image push in Amazon ECR. You can enable or disable the automatic scanning on image push via the Amazon ECR
  • The provided buildspec-*.yml files for git-secrets, Anchore, Snyk, Amazon ECR, OWASP ZAP, and your Kubernetes deployment .yml files uploaded to the root of the application code repository. Please update the Kubernetes (kubectl) commands in the buildspec files as needed.
  • A Snyk API key if you use Snyk as a SAST tool.
  • The Lambda function uploaded to an S3 bucket. We use this function to parse the scan reports and post the results to Security Hub.
  • An OWASP ZAP URL and generated API key for dynamic web scanning.
  • An application web URL to run the DAST testing.
  • An email address to receive approval notifications for deployment, pipeline change notifications, and CloudTrail events.
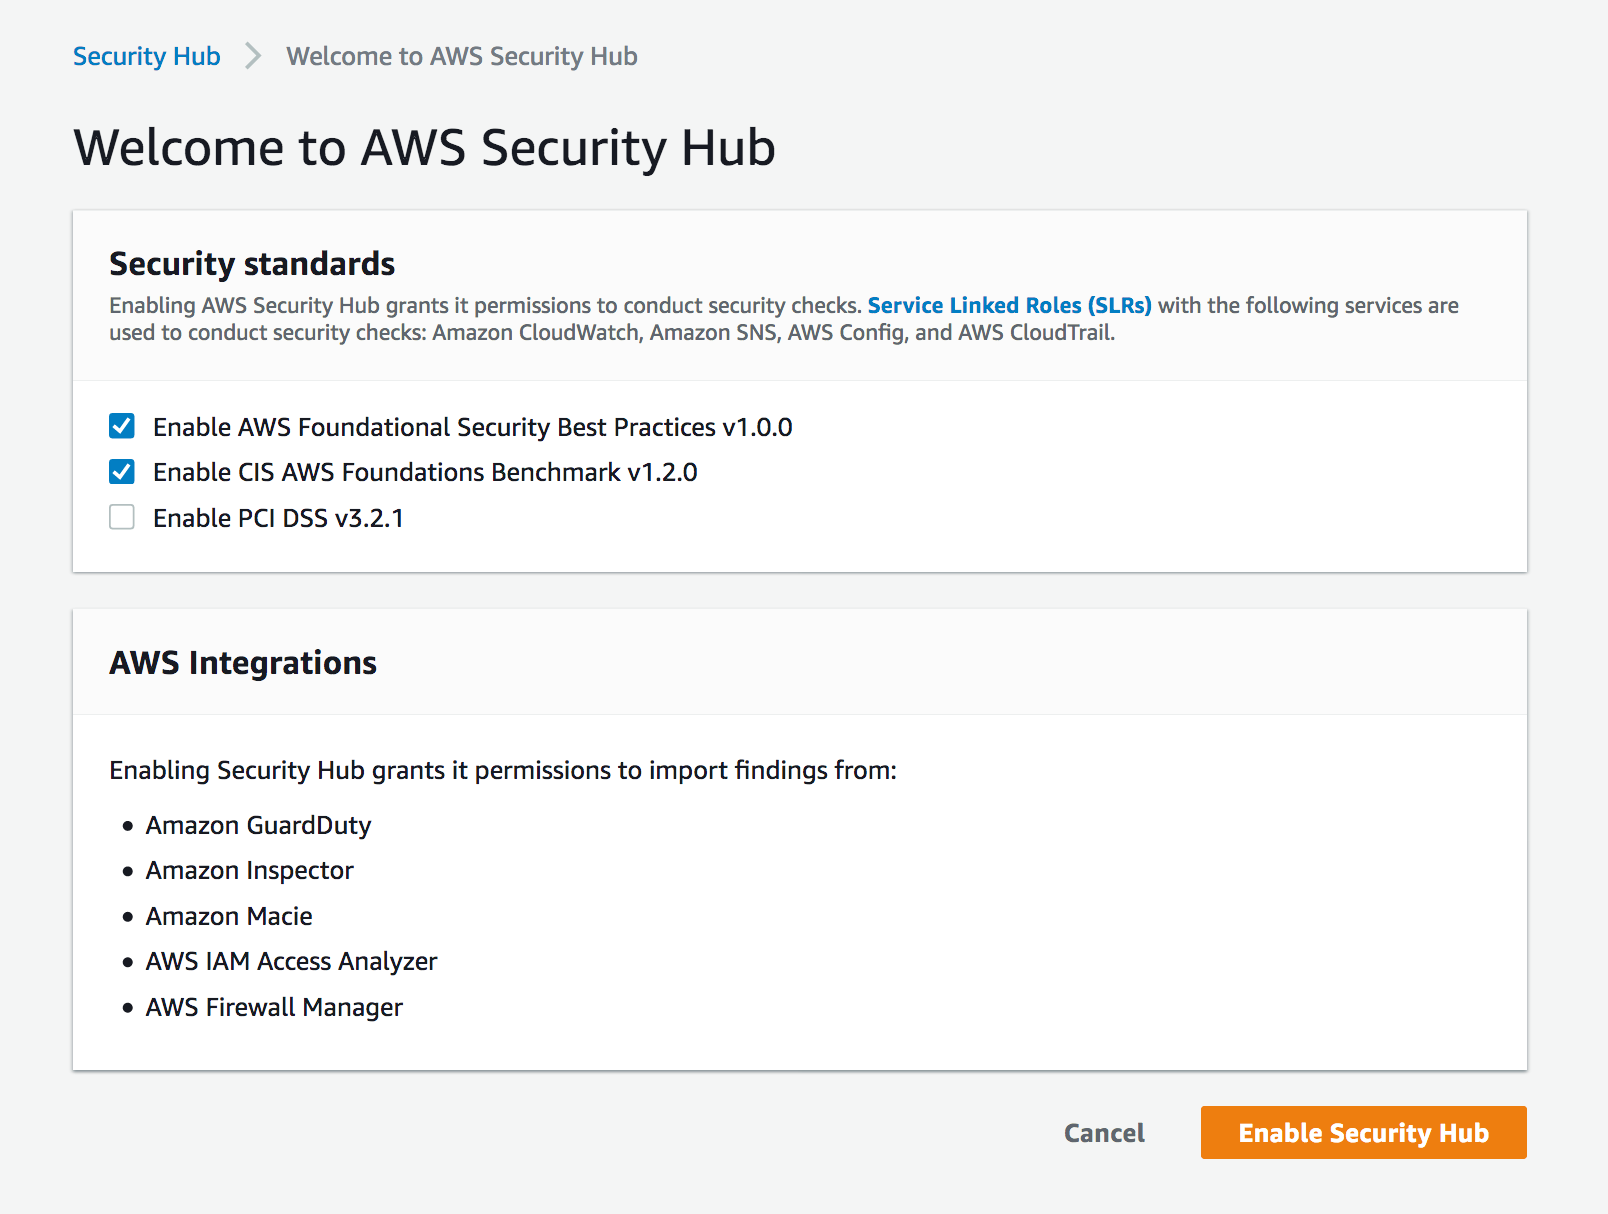
  • AWS Config and Security Hub services enabled. For instructions, see Managing the Configuration Recorder and Enabling Security Hub manually, respectively.

Deploying the pipeline

To deploy the pipeline, complete the following steps:

  1. Download the CloudFormation template and pipeline code from the GitHub repo.
  2. Sign in to your AWS account if you have not done so already.
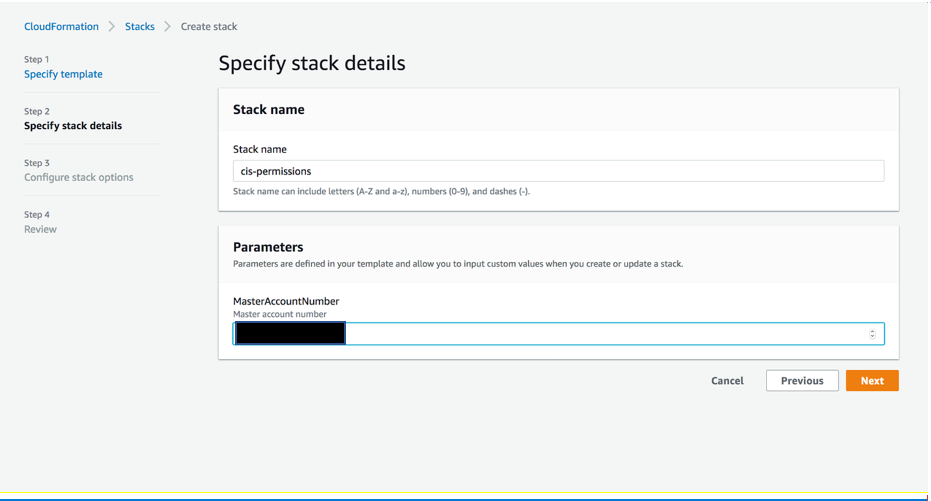
  3. On the CloudFormation console, choose Create Stack.
  4. Choose the CloudFormation pipeline template.
  5. Choose Next.
  6. Under Code, provide the following information:
    1. Code details, such as repository name and the branch to trigger the pipeline.
    2. The Amazon ECR container image repository name.
  7. Under SAST, provide the following information:
    1. Choose the SAST tool (Anchore or Snyk) for code analysis.
    2. If you select Snyk, provide an API key for Snyk.
  8. Under DAST, choose the DAST tool (OWASP ZAP) for dynamic testing and enter the API token, DAST tool URL, and the application URL to run the scan.
  9. Under Lambda functions, enter the Lambda function S3 bucket name, filename, and the handler name.
  10. For STG EKS cluster, enter the staging EKS cluster name.
  11. For PRD EKS cluster, enter the production EKS cluster name to which this pipeline deploys the container image.
  12. Under General, enter the email addresses to receive notifications for approvals and pipeline status changes.
  13. Choose Next.
  14. Complete the stack.
  15. After the pipeline is deployed, confirm the subscription by choosing the provided link in the email to receive notifications.
Pipeline-CF-Parameters.png

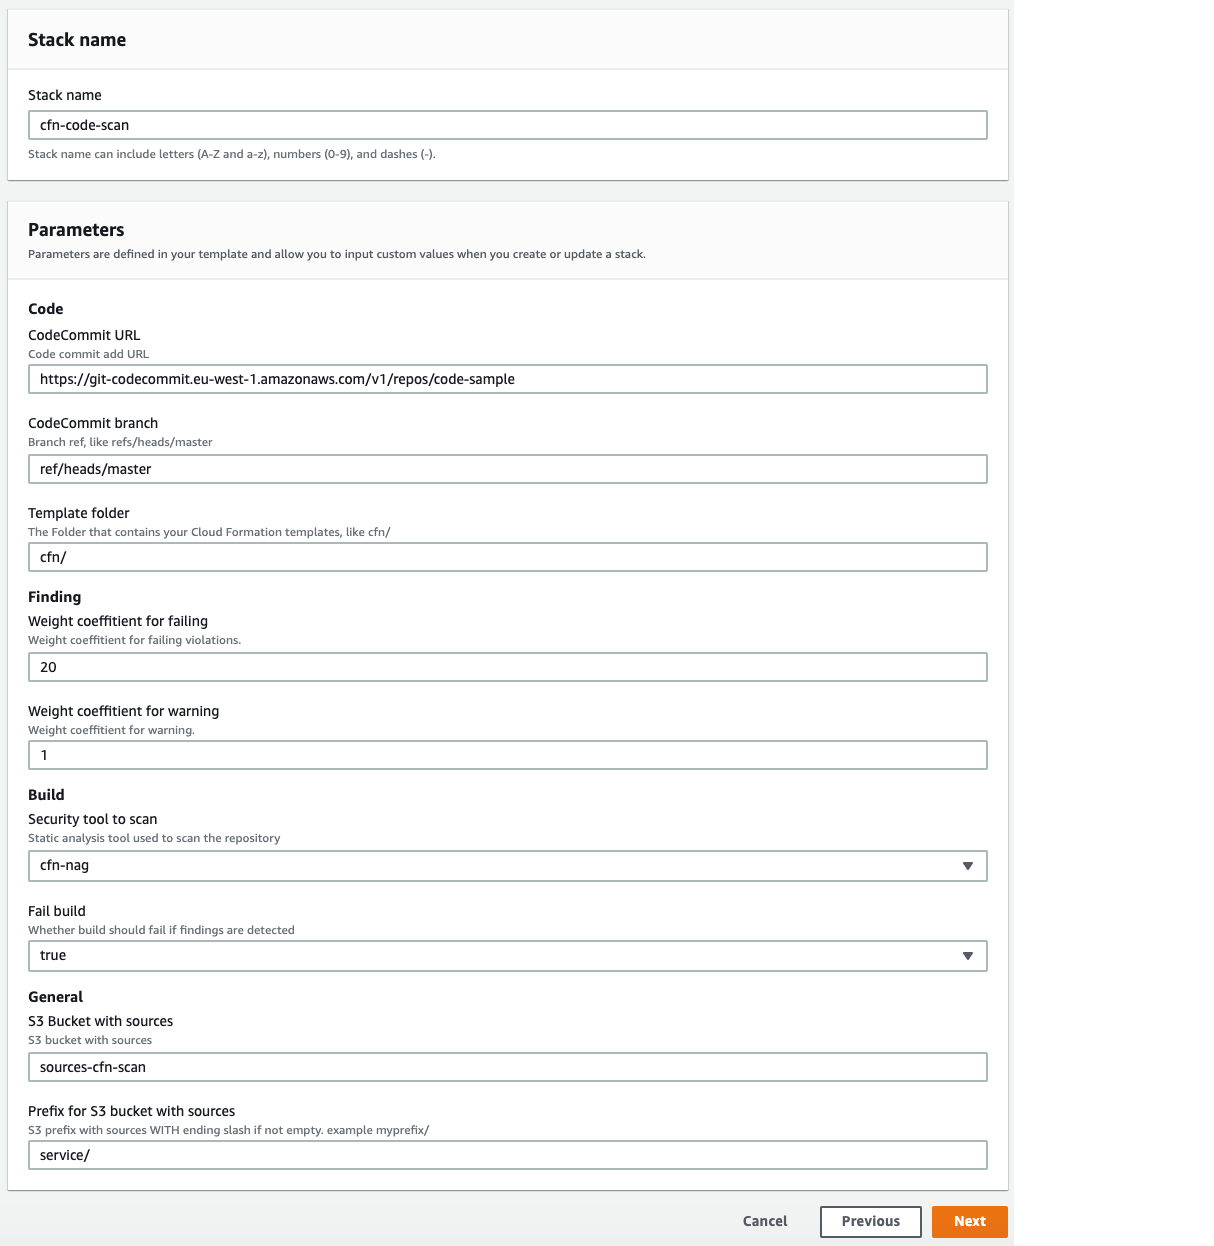
Pipeline CloudFormation Parameters

The provided CloudFormation template in this post is formatted for AWS GovCloud. If you’re setting this up in a standard Region, you have to adjust the partition name in the CloudFormation template. For example, change ARN values from arn:aws-us-gov to arn:aws.

Running the pipeline

To trigger the pipeline, commit changes to your application repository files. That generates a CloudWatch event and triggers the pipeline. CodeBuild scans the code and if there are any vulnerabilities, it invokes the Lambda function to parse and post the results to Security Hub.

When posting the vulnerability finding information to Security Hub, we need to provide a vulnerability severity level. Based on the provided severity value, Security Hub assigns the label as follows. Adjust the severity levels in your code based on your organization’s requirements.

  • 0 – INFORMATIONAL
  • 1–39 – LOW
  • 40– 69 – MEDIUM
  • 70–89 – HIGH
  • 90–100 – CRITICAL

The following screenshot shows the progression of your pipeline.

DevSecOps-Pipeline.png

DevSecOps Kubernetes CI/CD Pipeline


Secrets analysis scanning

In this architecture, after the pipeline is initiated, CodeBuild triggers the Secret Analysis stage using git-secrets and the buildspec-gitsecrets.yml file. Git-Secrets looks for any sensitive information such as AWS access keys and secret access keys. Git-Secrets allows you to add custom strings to look for in your analysis. CodeBuild uses the provided buildspec-gitsecrets.yml file during the build stage.

SCA and SAST scanning

In this architecture, CodeBuild triggers the SCA and SAST scanning using Anchore, Snyk, and Amazon ECR. In this solution, we use the open-source versions of Anchore and Snyk. Amazon ECR uses open-source Clair under the hood, which comes with Amazon ECR for no additional cost. As mentioned earlier, you can choose Anchore or Snyk to do the initial image scanning.

Scanning with Anchore

If you choose Anchore as a SAST tool during the deployment, the build stage uses the buildspec-anchore.yml file to scan the container image. If there are any vulnerabilities, it fails the build and triggers the Lambda function to post those findings to Security Hub. If there are no vulnerabilities, it proceeds to next stage.

Anchore-lambda-codesnippet.png

Anchore Lambda Code Snippet

Scanning with Snyk

If you choose Snyk as a SAST tool during the deployment, the build stage uses the buildspec-snyk.yml file to scan the container image. If there are any vulnerabilities, it fails the build and triggers the Lambda function to post those findings to Security Hub. If there are no vulnerabilities, it proceeds to next stage.

Snyk-lambda-codesnippet.png

Snyk Lambda Code Snippet

Scanning with Amazon ECR

If there are no vulnerabilities from Anchore or Snyk scanning, the image is pushed to Amazon ECR, and the Amazon ECR scan is triggered automatically. Amazon ECR lists the vulnerability findings on the Amazon ECR console. To provide a single pane of glass view of all the vulnerability findings and for easy administration, we retrieve those findings and post them to Security Hub. If there are no vulnerabilities, the image is deployed to the EKS staging cluster and next stage (DAST scanning) is triggered.

ECR-lambda-codesnippet.png

ECR Lambda Code Snippet


DAST scanning with OWASP ZAP

In this architecture, CodeBuild triggers DAST scanning using the DAST tool OWASP ZAP.

After deployment is successful, CodeBuild initiates the DAST scanning. When scanning is complete, if there are any vulnerabilities, it invokes the Lambda function, similar to SAST analysis. The function parses and posts the results to Security Hub. The following is the code snippet of the Lambda function.

Zap-lambda-codesnippet.png

Zap Lambda Code Snippet

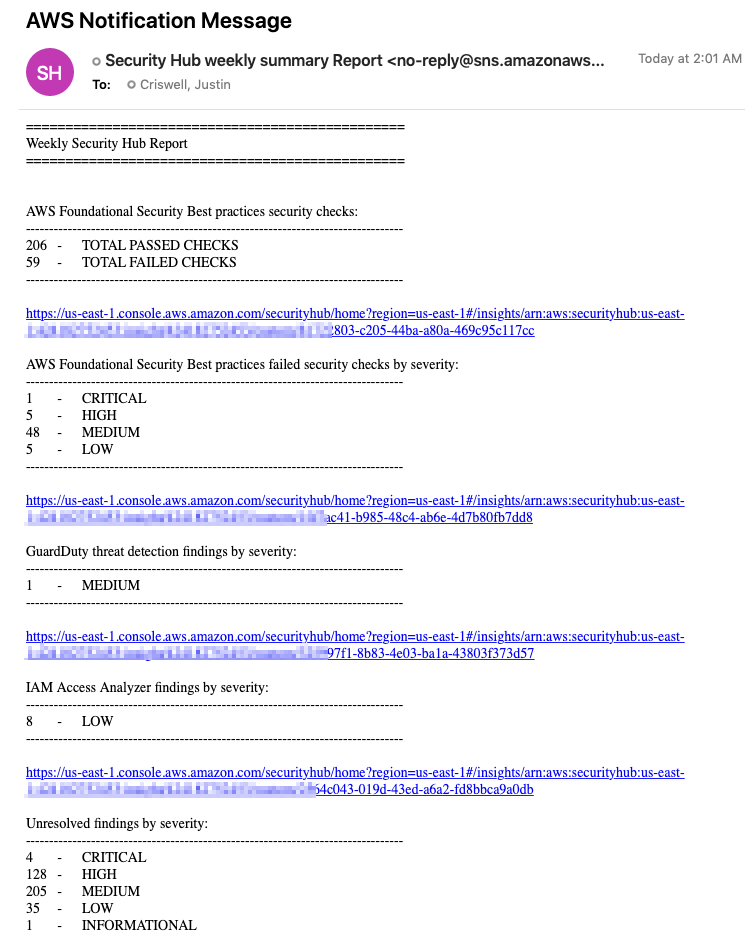
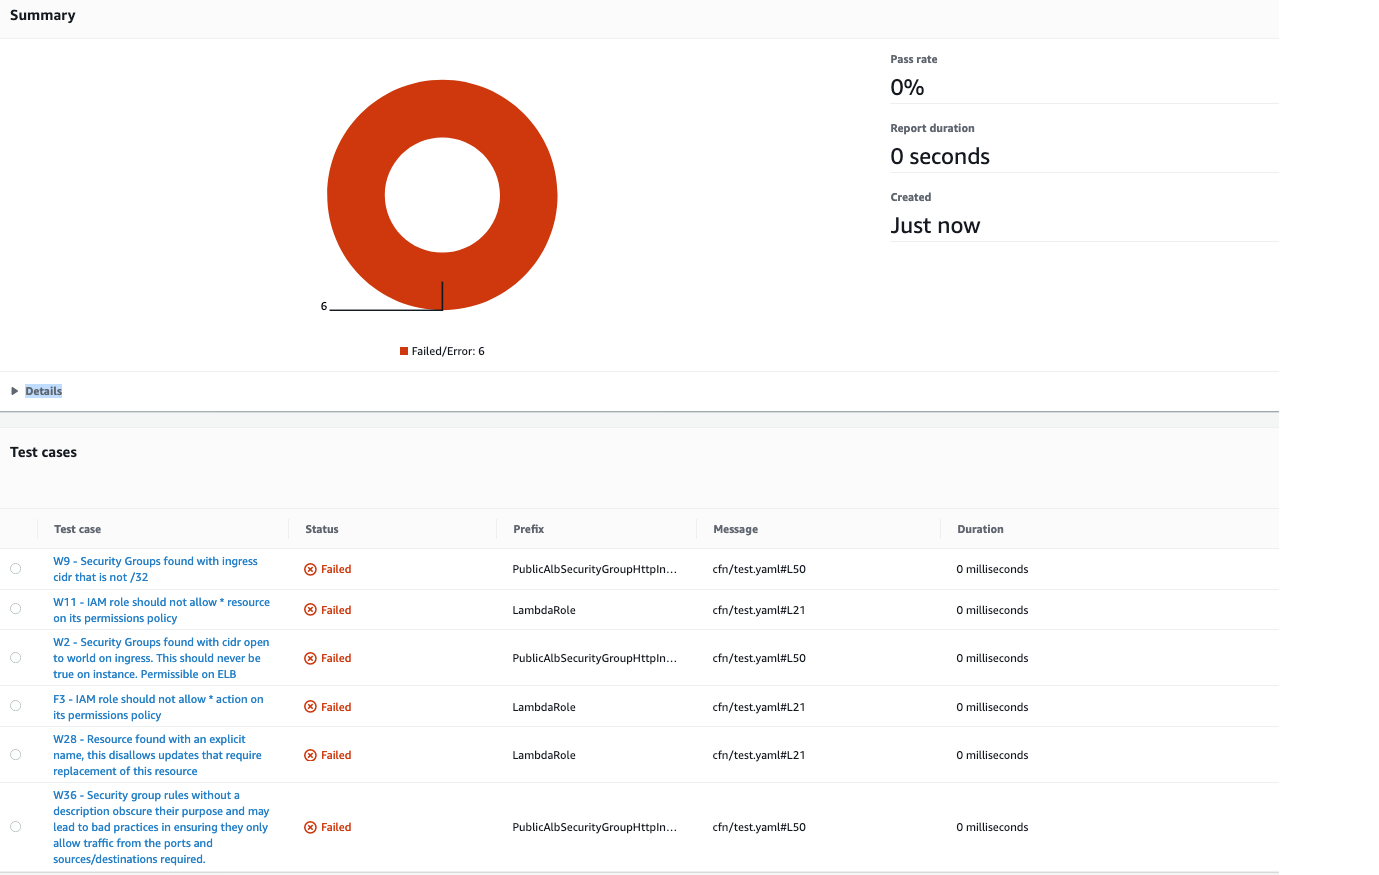
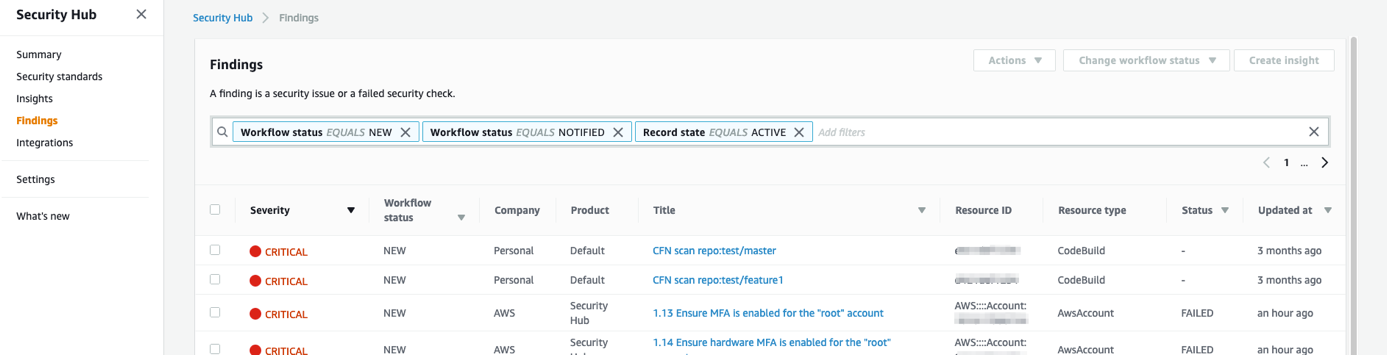
The following screenshot shows the results in Security Hub. The highlighted section shows the vulnerability findings from various scanning stages.

SecurityHub-vulnerabilities.png

Vulnerability Findings in Security Hub

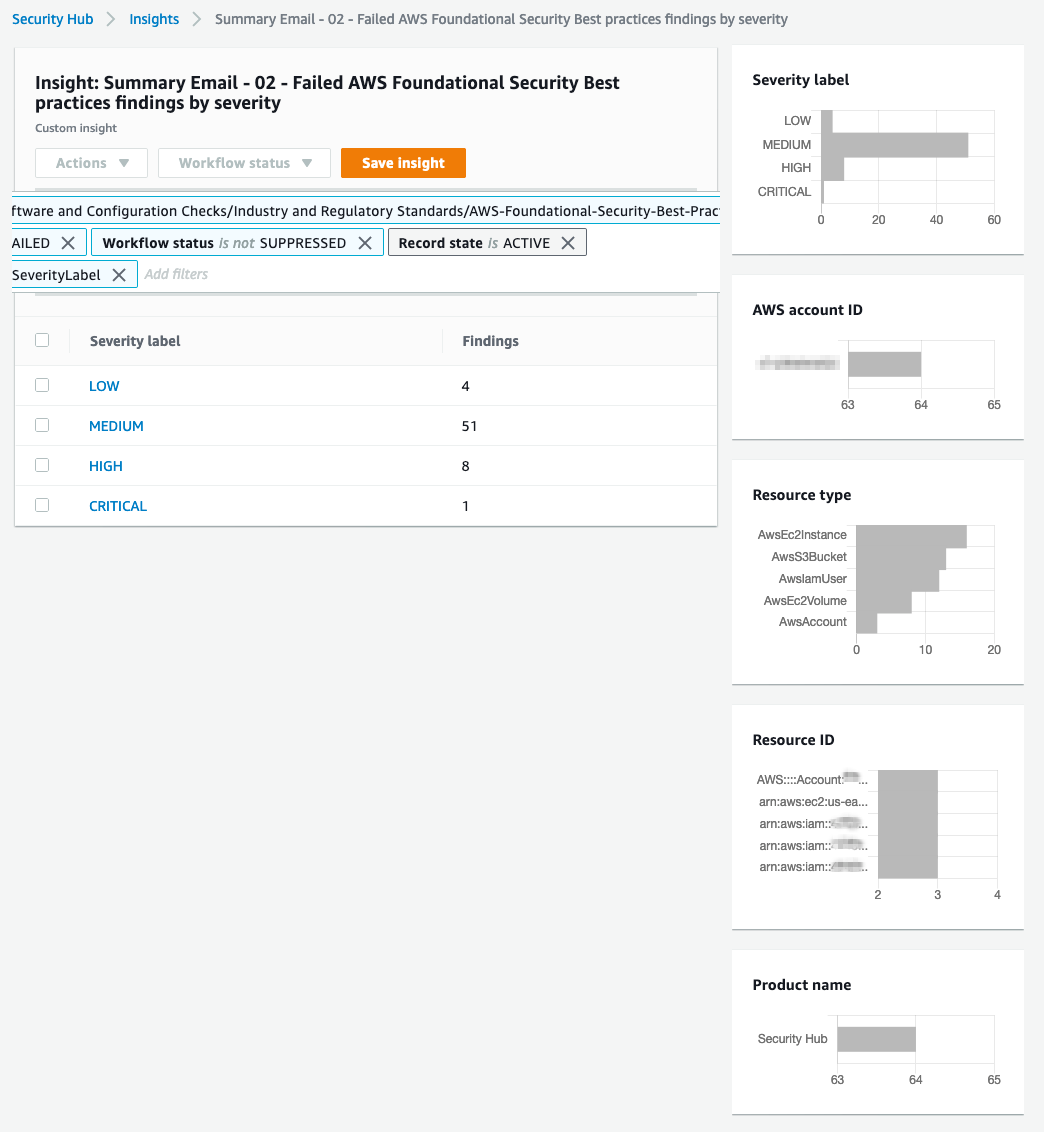
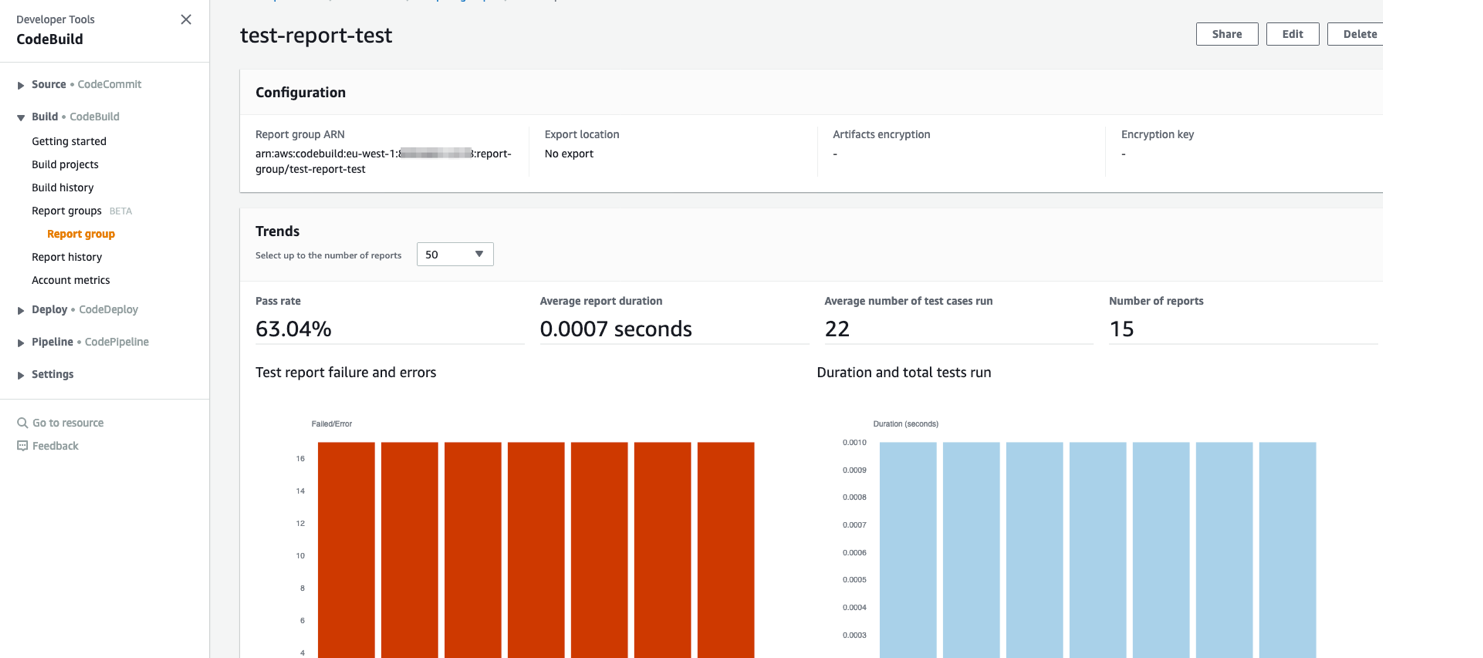
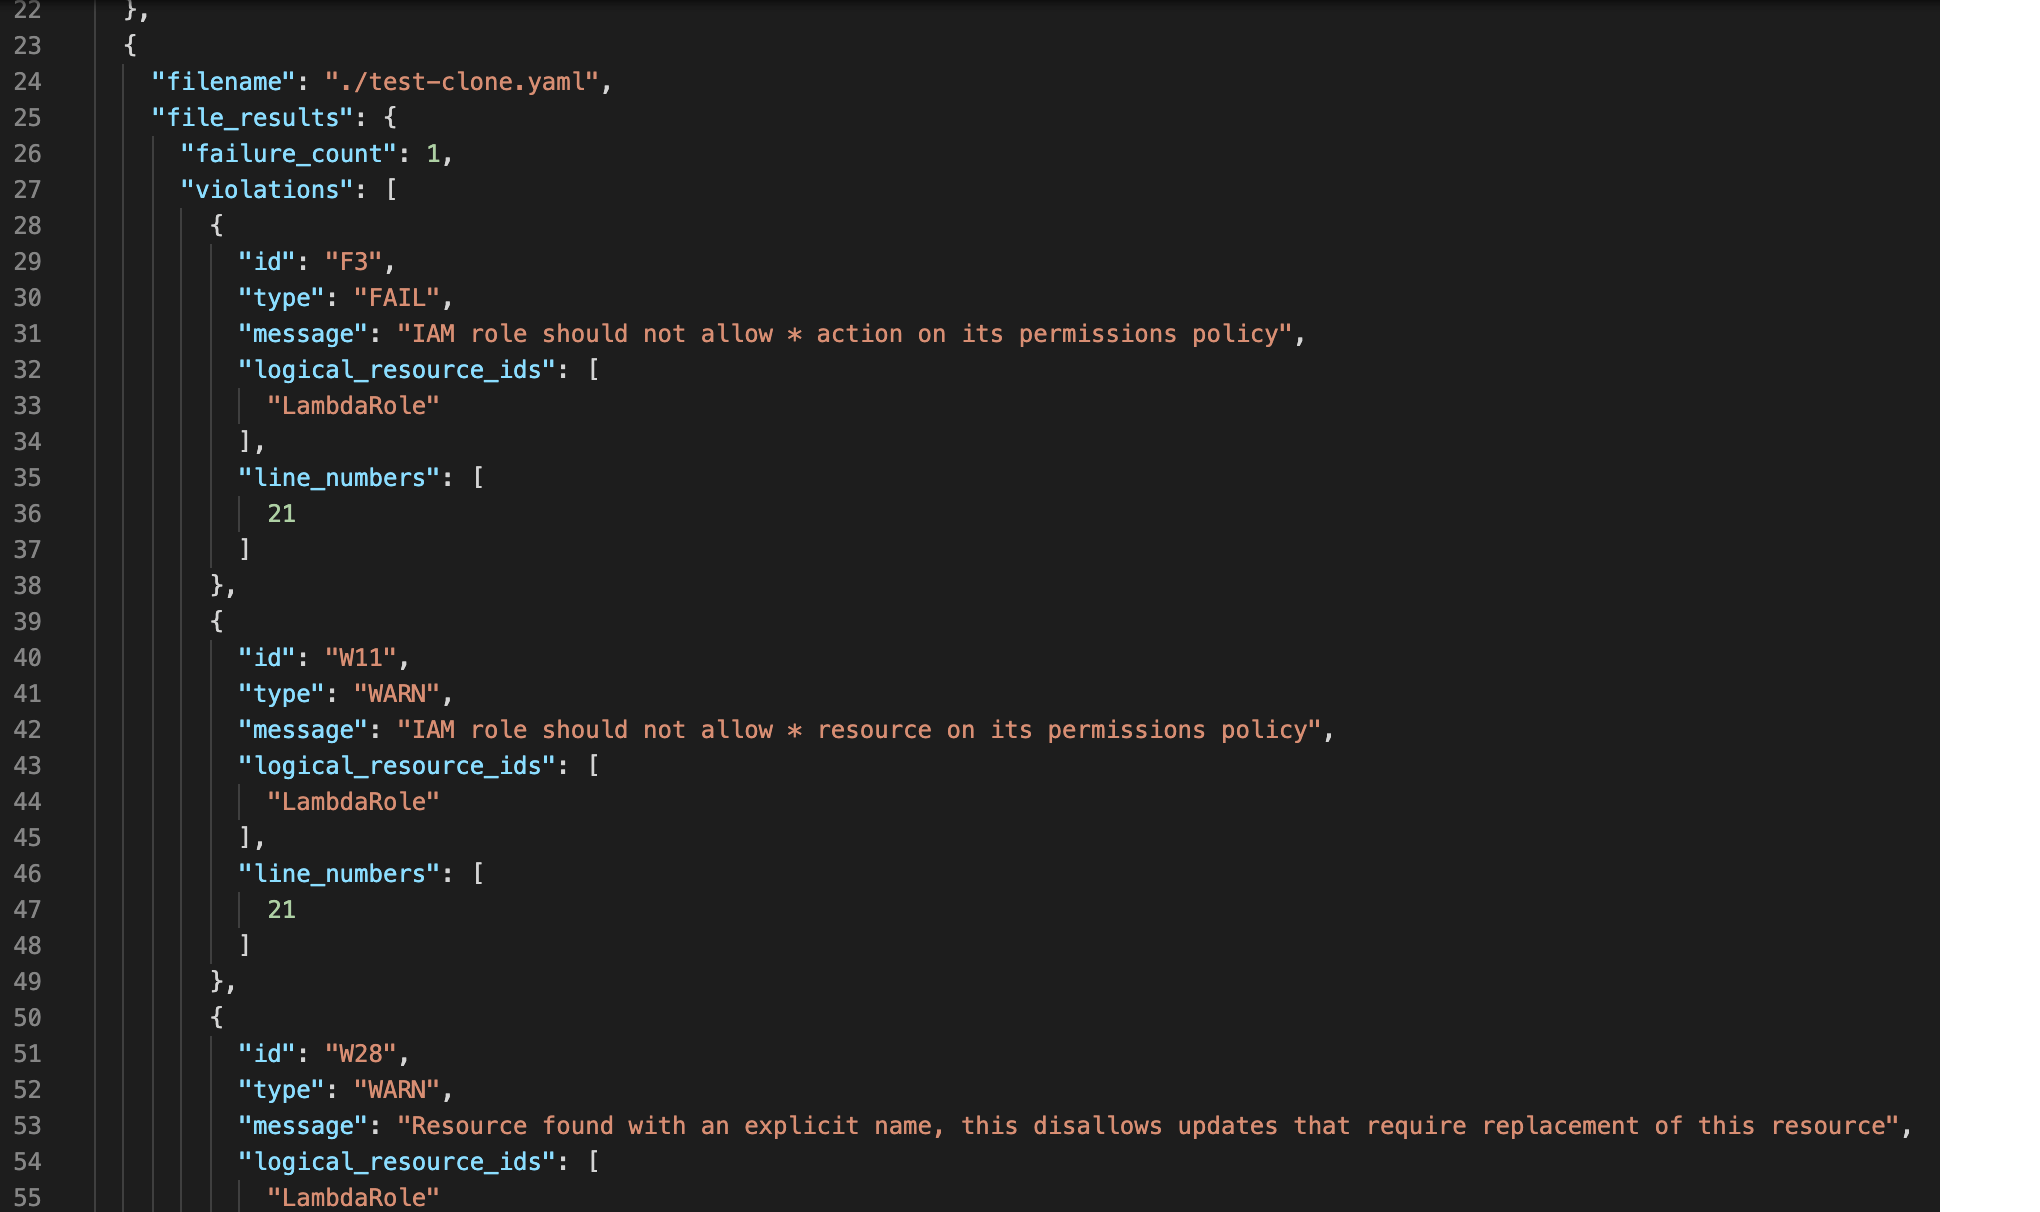
We can drill down to individual resource IDs to get the list of vulnerability findings. For example, if we drill down to the resource ID of SASTBuildProject*, we can review all the findings from that resource ID.

Anchore-Vulnerability.png

SAST Vulnerabilities in Security Hub


If there are no vulnerabilities in the DAST scan, the pipeline proceeds to the manual approval stage and an email is sent to the approver. The approver can review and approve or reject the deployment. If approved, the pipeline moves to next stage and deploys the application to the production EKS cluster.

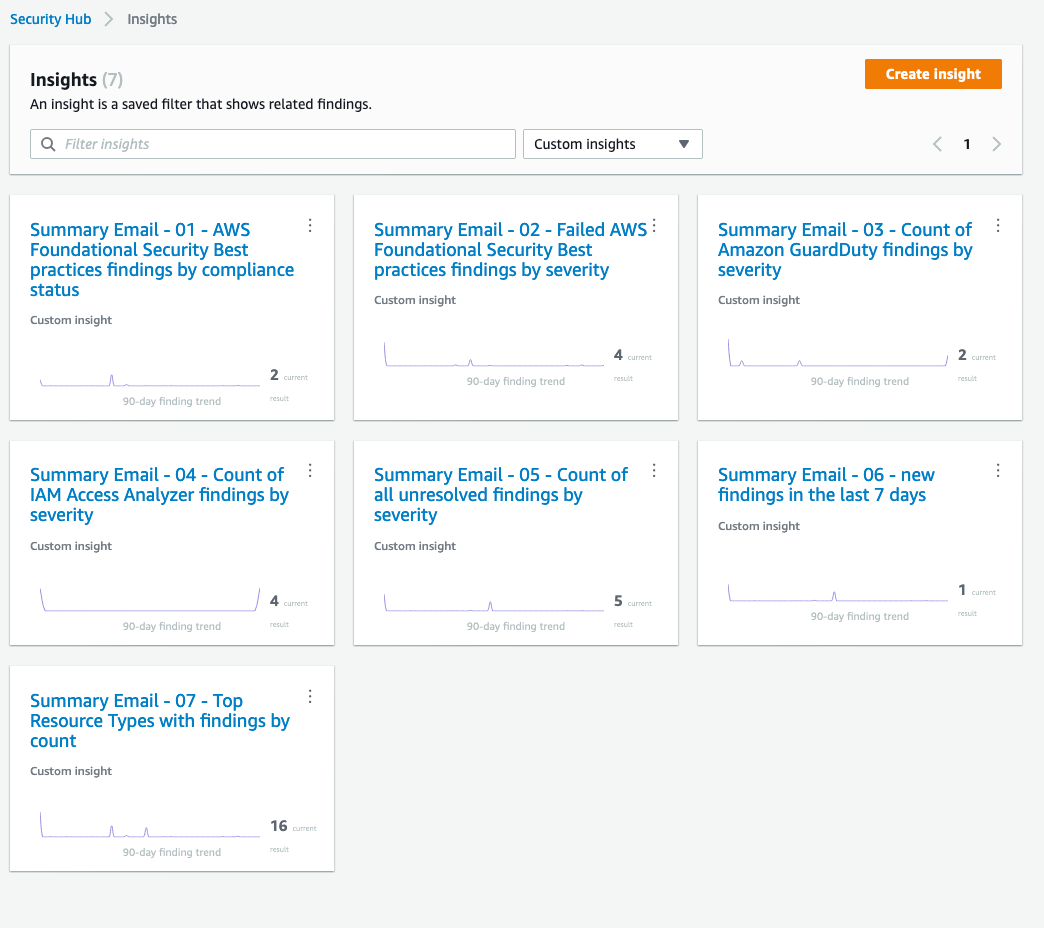
Aggregation of vulnerability findings in Security Hub provides opportunities to automate the remediation. For example, based on the vulnerability finding, you can trigger a Lambda function to take the needed remediation action. This also reduces the burden on operations and security teams because they can now address the vulnerabilities from a single pane of glass instead of logging into multiple tool dashboards.

Along with Security Hub, you can send vulnerability findings to your issue tracking systems such as JIRA, Systems Manager SysOps, or can automatically create an incident management ticket. This is outside the scope of this post, but is one of the possibilities you can consider when implementing DevSecOps software factories.

RASP scanning

Sysdig Falco is an open-source runtime security tool. Based on the configured rules, Falco can detect suspicious activity and alert on any behavior that involves making Linux system calls. You can use Falco rules to address security controls like NIST SP 800-53. Falco agents on each EKS node continuously scan the containers running in pods and send the events as STDOUT. These events can be then sent to CloudWatch or any third-party log aggregator to send alerts and respond. For more information, see Implementing Runtime security in Amazon EKS using CNCF Falco. You can also use Lambda to trigger and automatically remediate certain security events.

The following screenshot shows Falco events on the CloudWatch console. The highlighted text describes the Falco event that was triggered based on the default Falco rules on the EKS cluster. You can add additional custom rules to meet your security control requirements. You can also trigger responsive actions from these CloudWatch events using services like Lambda.

Falco alerts in CloudWatch

Falco alerts in CloudWatch

Cleanup

This section provides instructions to clean up the DevSecOps pipeline setup:

  1. Delete the EKS cluster.
  2. Delete the S3 bucket.
  3. Delete the CodeCommit repo.
  4. Delete the Amazon ECR repo.
  5. Disable Security Hub.
  6. Disable AWS Config.
  7. Delete the pipeline CloudFormation stack.

Conclusion

In this post, I presented an end-to-end Kubernetes-based DevSecOps software factory on AWS with continuous testing, continuous logging and monitoring, auditing and governance, and operations. I demonstrated how to integrate various open-source scanning tools, such as Git-Secrets, Anchore, Snyk, OWASP ZAP, and Sysdig Falco for Secret Analysis, SCA, SAST, DAST, and RASP analysis, respectively. To reduce operations overhead, I explained how to aggregate and manage vulnerability findings in Security Hub as a single pane of glass. This post also talked about how to implement security of the pipeline and in the pipeline using AWS Cloud-native services. Finally, I provided the DevSecOps software factory as code using AWS CloudFormation.

To get started with DevSecOps on AWS, see AWS DevOps and the DevOps blog.

Srinivas Manepalli is a DevSecOps Solutions Architect in the U.S. Fed SI SA team at Amazon Web Services (AWS). He is passionate about helping customers, building and architecting DevSecOps and highly available software systems. Outside of work, he enjoys spending time with family, nature and good food.

How to import AWS IoT Device Defender audit findings into Security Hub

Post Syndicated from Joaquin Manuel Rinaudo original https://aws.amazon.com/blogs/security/how-to-import-aws-iot-device-defender-audit-findings-into-security-hub/

AWS Security Hub provides a comprehensive view of the security alerts and security posture in your accounts. In this blog post, we show how you can import AWS IoT Device Defender audit findings into Security Hub. You can then view and organize Internet of Things (IoT) security findings in Security Hub together with findings from other integrated AWS services, such as Amazon GuardDuty, Amazon Inspector, Amazon Macie, AWS Identity and Access Management (IAM) Access Analyzer, AWS Systems Manager, and more. You will gain a centralized security view across both enterprise and IoT types of workloads, and have an aggregated view of AWS IoT Device Defender audit findings. This solution can support AWS Accounts managed by AWS Organizations.

In this post, you’ll learn how the integration of IoT security findings into Security Hub works, and you can download AWS CloudFormation templates to implement the solution. After you deploy the solution, every failed audit check will be recorded as a Security Hub finding. The findings within Security Hub provides an AWS IoT Device Defender finding severity level and direct link to the AWS IoT Device Defender console so that you can take possible remediation actions. If you address the underlying findings or suppress the findings by using the AWS IoT Device Defender console, the solution function will automatically archive any related findings in Security Hub when a new audit occurs.

Solution scope

For this solution, we assume that you are familiar with how to set up an IoT environment and set up AWS IoT Device Defender. To learn more how to set up your environment, see the AWS tutorials, such as Getting started with AWS IoT Greengrass and Setting up AWS IoT Device Defender

The solution is intended for AWS accounts with fewer than 10,000 findings per scan. If AWS IoT Device Defender has more than 10,000 findings, the limit of 15 minutes for the duration of the serverless AWS Lambda function might be exceeded, depending on the network delay, and the function will fail.

The solution is designed for AWS Regions where AWS IoT Device Defender, serverless Lambda functionality and Security Hub are available; for more information, see AWS Regional Services. The China (Beijing) and China (Ningxia) Regions and the AWS GovCloud (US) Regions are excluded from the solution scope.

Solution overview

The templates that we provide here will provision an Amazon Simple Notification Service (Amazon SNS) topic notifying you when the AWS IoT Device Defender report is ready, and a Lambda function that imports the findings from the report into Security Hub. Figure 1 shows the solution architecture.
 

Figure 1: Solution architecture

Figure 1: Solution architecture

The solution workflow is as follows:

  1. AWS IoT Device Defender performs an audit of your environment. You should set up a regular audit as described in Audit guide: Enable audit checks.
  2. AWS IoT Device Defender sends an SNS notification with a summary of the audit report.
  3. A Lambda function named import-iot-defender-findings-to-security-hub is triggered by the SNS topic.
  4. The Lambda function gets the details of the findings from AWS IoT Device Defender.
  5. The Lambda function imports the new findings to Security Hub and archives the previous report findings. An example of findings in Security Hub is shown in Figure 2.
     
    Figure 2: Security Hub findings example

    Figure 2: Security Hub findings example

Prerequisites

  • You must have Security Hub turned on in the Region where you’re deploying the solution.
  • You must also have your IoT environment set, see step by step tutorial at Getting started with AWS IoT Greengrass
  • You must also have AWS IoT Device Defender audit checks turned on. Learn how to configure recurring audit checks across all your IoT devices by using this tutorial.

Deploy the solution

You will need to deploy the solution once in each AWS Region where you want to integrate IoT security findings into Security Hub.

To deploy the solution

  1. Choose Launch Stack to launch the AWS CloudFormation console with the prepopulated CloudFormation demo template.

    Select the Launch Stack button to launch the template

    Additionally, you can download the latest solution code from GitHub.

  2. (Optional) In the CloudFormation console, you are presented with the template parameters before you deploy the stack. You can customize these parameters or keep the defaults:
    • S3 bucket with sources: This bucket contains all the solution sources, such as the Lambda function and templates. You can keep the default text if you’re not customizing the sources.
    • Prefix for S3 bucket with sources: The prefix for all the solution sources. You can keep the default if you’re not customizing the sources.
  3. Go to the AWS IoT Core console and set up an SNS alert notification parameter for the audit report. To do this, in the left navigation pane of the console, under Defend, choose Settings, and then choose Edit to edit the SNS alert. The SNS topic is created by the solution stack and named iot-defender-report-notification.
     
    Figure 3: SNS alert settings for AWS IoT Device Defender

    Figure 3: SNS alert settings for AWS IoT Device Defender

Test the solution

To test the solution, you can simulate an “AWS IoT policies are overly permissive” finding by creating an insecure policy.

To create an insecure policy

  1. Go to the AWS IoT Core console. In the left navigation pane, under Secure, choose Policies.
  2. Choose Create. For Name, enter InsecureIoTPolicy.
  3. For Action, select iot:*. For Resources, enter *. Choose Allow statement, and then choose Create.

Next, run a new IoT security audit by choosing IoT Core > Defend > Audit > Results > Create and selecting the option Run audit now (Once).

After the audit is finished, you’ll see audit reports in the AWS IoT Core console, similar to the ones shown in Figure 4. One of the reports shows that the IoT policies are overly permissive. The same findings are also imported into Security Hub as shown in Figure 2.
 

Figure 4: AWS IoT Device Defender report

Figure 4: AWS IoT Device Defender report

Troubleshooting

To troubleshoot the solution, use the Amazon CloudWatch Logs of the Lambda function import-iot-defender-findings-to-security-hub. The solution can fail if:

  • Security Hub isn’t turned on in your Region
  • Service control policies (SCPs) are preventing access to AWS IoT Device Defender audit reports
  • The wrong SNS topic is configured in the AWS IoT Device Defender settings
  • The Lambda function times out because there are more than 10,000 findings

To find these issues, go to the CloudWatch console, choose Log Group, and then choose /aws/lambda/import-iot-defender-findings-to-security-hub.

Conclusion

In this post, you’ve learned how to integrate AWS IoT Device Defender audit findings with Security Hub to gain a centralized view of security findings across both your enterprise and IoT workloads. If you have more questions about IoT, you can reach out to the AWS IoT forum, and if you have questions about Security Hub, visit the AWS Security Hub forum. If you need AWS experts to help you plan, build, or optimize your infrastructure, contact AWS Professional Services.

If you have feedback about this post, submit comments in the Comments section below.

Want more AWS Security how-to content, news, and feature announcements? Follow us on Twitter.

Author

Joaquin Manuel Rinaudo

Joaquin is a Senior Security Architect with AWS Professional Services. He is passionate about building solutions that help developers improve their software quality. Prior to AWS, he worked across multiple domains in the security industry, from mobile security to cloud and compliance related topics. In his free time, Joaquin enjoys spending time with family and reading science-fiction novels.

Author

Vesselin Tzvetkov

Vesselin is a Senior Security Architect at AWS Professional Services and is passionate about security architecture and engineering innovative solutions. Outside of technology, he likes classical music, philosophy, and sports. He holds a Ph.D. in security from TU-Darmstadt and a M.S. in electrical engineering from Bochum University in Germany.

How ERGO implemented an event-driven security remediation architecture on AWS

Post Syndicated from Adam Sikora original https://aws.amazon.com/blogs/architecture/how-ergo-implemented-an-event-driven-security-remediation-architecture-on-aws/

ERGO is one of the major insurance groups in Germany and Europe. Within the ERGO Group, ERGO Technology & Services S.A. (ET&S), a part of ET&SM holding, has competencies in digital transformation, know-how in creating and implementing complex IT systems with focus on the quality of solutions and a portfolio aligned with the entire value chain of the insurance market.

Business Challenge and Solution

ERGO has a multi-account AWS environment where each project team subscribes to a set of AWS accounts that conforms to workload requirements and security best practices. As ERGO began its cloud journey, CIS Foundations Benchmark Standard was used as the key indicator for measuring compliance. The report showed significant room for security posture improvements. ERGO was looking for a solution that could enable the management of security events at scale. At the same time, they needed to centralize the event response and remediation in near-real time. The goal was to improve the CIS compliance metric and overall security posture.

Architecture

ERGO uses AWS Organizations to centrally govern the multi-account AWS environment. Integration of AWS Security Hub with AWS Organizations enables ERGO to designate ERGO’s Security Account as the Security Hub administrator/primary account. Other organization accounts are automatically registered as Security Hub member accounts to send events to the Security Account.

An important aspect of the workflow is to maintain segregation of duties and separation of environments. ERGO uses two separate AWS accounts to implement automatic finding remediation:

  • Security Account – this is the primary account with Security Hub where security alerts (findings) from all the AWS accounts of the project are gathered.
  • Service Account – this is the account that can take action on target project (member) AWS accounts. ERGO uses AWS Lambda functions to run remediation actions through AWS Identity and Access Management (IAM) permissions, VPC resources actions, and more.

Within the Security Account, AWS Security Hub serves as the event aggregation solution that gathers multi-account findings from AWS services such as Amazon GuardDuty. ERGO was able to centralize the security findings. But they still needed to develop a solution that routed the filtered, actionable events to the Service Account. The solution had to automate the response to these events based on ERGO’s security policy. ERGO built this solution with the help of Amazon CloudWatch, AWS Step Functions, and AWS Lambda.

ERGO used the integration of AWS Security Hub with Amazon CloudWatch to send all the security events to CloudWatch. The filtering logic of events was managed at two levels. At the first level, ERGO used CloudWatch Events rules that match event patterns to refine the types of events ERGO wanted to focus on.

The second level of filtering logic was more nuanced and related to the remediation action ERGO wanted to take on a detected event. ERGO chose AWS Step Functions to build a workflow that enabled them to further filter the events, in addition to matching them to the suitable remediation action.

Choosing AWS Step Functions enabled ERGO to orchestrate multiple steps. They could also respond to errors in the overall workflow. For example, one of the issues that ERGO encountered was the sporadic failure of the Archival Lambda function. This was due to the Security Hub API Rate Throttling.

ERGO evaluated several workarounds to deal with this situation. They considered using the automatic retries capability of the AWS SDK to make the API call in the Archival function. However, the built-in mechanism was not sufficient in this case. Another option for dealing with rate limit was to throttle the Archival Lambda functions by applying a low reserved concurrency. Another possibility was to batch the events to be SUPPRESSED and process them as one batch at a time. The benefit was in making a single API call at a time, over several parameters.

After much consideration, ERGO decided to use the “retry on error” mechanism of the Step Function to circumvent this problem. This allowed ERGO to manage the error handling directly in the workflow logic. It wasn’t necessary to change the remediation and archival logic of the Lambda functions. This was a huge advantage. Writing and maintaining error handling logic in each one of the Lambda functions would have been time-intensive and complicated.

Additionally, the remediation actions had to be configured and run from the Service Account. That means the Step Function in the Security Account had to trigger a cross-account resource. ERGO had to find a way to integrate the Remediation Lambda in the Service Account with the state machine of the Security Account. ERGO achieved this integration using a Proxy Lambda in the Security Account.

The Proxy Lambda resides in the Security Account and is initiated by the Step Function. It takes as its argument, the function name and function version to start the Remediation function in the service account.

The Remediation functions in the Service Account have permission to take action on Project accounts. As the next step, the Remediation function is invoked on the impacted accounts. This is filtered by the Step Function, which passes the Account ID to Proxy Lambda, which in turn passes this argument to Remediation Lambda. The Remediation function runs the actions on the Project accounts and returns the output to the Proxy Lambda. This is then passed back to the Step Function.

The role that Lambda assumes using the AssumeRole mechanism, is an Organization Level role. It is deployed on every account and has proper permission to perform the remediation.

ERGO Architecture

Figure 1. Technical Solution implementation

  1. Security Hub service in ERGO Project accounts sends security findings to Administrative Account.
  2. Findings are aggregated and sent to CloudWatch Events for filtering.
  3. CloudWatch rules invoke Step Functions as the target. Step Functions process security events based on the event type and treatment required as per CIS Standards.
  4. For events that need to be suppressed without any dependency on the Project Accounts, the Step Function invokes a Lambda function to archive the findings.
  5. For events that need to be executed on the Project accounts, a Step Function invokes a Proxy Lambda with required parameters.
  6. Proxy Lambda in turn, invokes a cross-account Remediation function in Service Account. This has the permissions to run actions in Project accounts.
  7. Based on the event type, corresponding remediation action is run on the impacted Project Account.
  8. Remediation function passes the execution result back to Proxy Lambda to complete the Security event workflow.

Failed remediations are manually resolved in exceptional conditions.

Summary

By implementing this event-driven solution, ERGO was able to increase and maintain automated compliance with CIS AWS Foundation Benchmark Standard to about 95%. The remaining findings were evaluated on case basis, per specific Project requirements. This measurable improvement in ERGO compliance posture was achieved with an end-to-end serverless workflow. This offloaded any on-going platform maintenance efforts from the ERGO cloud security team. Working closely with our AWS account and service teams, ERGO will continue to evaluate and make improvements to our architecture.

How to set up a recurring Security Hub summary email

Post Syndicated from Justin Criswell original https://aws.amazon.com/blogs/security/how-to-set-up-a-recurring-security-hub-summary-email/

AWS Security Hub provides a comprehensive view of your security posture in Amazon Web Services (AWS) and helps you check your environment against security standards and best practices. In this post, we’ll show you how to set up weekly email notifications using Security Hub to provide account owners with a summary of the existing security findings to prioritize, new findings, and links to the Security Hub console for more information.

When you enable Security Hub, it collects and consolidates findings from AWS security services that you’re using, such as intrusion detection findings from Amazon GuardDuty, vulnerability scans from Amazon Inspector, Amazon Simple Storage Service (Amazon S3) bucket policy findings from Amazon Macie, publicly accessible and cross-account resources from IAM Access Analyzer, and resources lacking AWS WAF coverage from AWS Firewall Manager. Security Hub also consolidates findings from integrated AWS Partner Network (APN) security solutions.

Cloud security processes can differ from traditional on-premises security in that security is often decentralized in the cloud. With traditional on-premises security operations, security alerts are typically routed to centralized security teams operating out of security operations centers (SOCs). With cloud security operations, it’s often the application builders or DevOps engineers who are best situated to triage, investigate, and remediate the security alerts. This integration of security into DevOps processes is referred to as DevSecOps, and as part of this approach, centralized security teams look for additional ways to proactively engage application account owners in improving the security posture of AWS accounts.

This solution uses Security Hub custom insights, AWS Lambda, and the Security Hub API. A custom insight is a collection of findings that are aggregated by a grouping attribute, such as severity or status. Insights help you identify common security issues that might require remediation action. Security Hub includes several managed insights, or you can create your own custom insights. Amazon SNS topic subscribers will receive an email, similar to the one shown in Figure 1, that summarizes the results of the Security Hub custom insights.

Figure 1: Example email with a summary of security findings for an account

Figure 1: Example email with a summary of security findings for an account

Solution overview

This solution assumes that Security Hub is enabled in your AWS account. If it isn’t enabled, set up the service so that you can start seeing a comprehensive view of security findings across your AWS accounts.

A recurring Security Hub summary email provides recipients with a proactive communication that summarizes the security posture and any recent improvements within their AWS accounts. The email message contains the following sections:

Here’s how the solution works:

  1. Seven Security Hub custom insights are created when you first deploy the solution.
  2. An Amazon CloudWatch time-based event invokes a Lambda function for processing.
  3. The Lambda function gets the results of the custom insights from Security Hub, formats the results for email, and sends a message to Amazon SNS.
  4. Amazon SNS sends the email notification to the address you provided during deployment.
  5. The email includes the summary and links to the Security Hub UI so that the recipient can follow the remediation workflow.

Figure 2 shows the solution workflow.

Figure 2: Solution overview, deployed through AWS CloudFormation

Figure 2: Solution overview, deployed through AWS CloudFormation

Security Hub custom insight

The finding results presented in the email are summarized by Security Hub custom insights. A Security Hub insight is a collection of related findings. Each insight is defined by a group by statement and optional filters. The group by statement indicates how to group the matching findings, and identifies the type of item that the insight applies to. For example, if an insight is grouped by resource identifier, then the insight produces a list of resource identifiers. The optional filters narrow down the matching findings for the insight. For example, you might want to see only the findings from specific providers or findings associated with specific types of resources. Figure 3 shows the seven custom insights that are created as part of deploying this solution.

Figure 3: Custom insights created by the solution

Figure 3: Custom insights created by the solution

Sample custom insight

Security Hub offers several built-in managed (default) insights. You can’t modify or delete managed insights. You can view the custom insights created as part of this solution in the Security Hub console under Insights, by selecting the Custom Insights filter. From the email, follow the link for “Summary Email – 02 – Failed AWS Foundational Security Best Practices” to see the summarized finding counts, as well as graphs with related data, as shown in Figure 4.

Figure 4: Detail view of the email titled “Summary Email – 02 – Failed AWS Foundational Security Best Practices”

Figure 4: Detail view of the email titled “Summary Email – 02 – Failed AWS Foundational Security Best Practices”

Let’s evaluate the filters that create this custom insight:

Filter setting Filter results
Type is “Software and Configuration Checks/Industry and Regulatory Standards/AWS-Foundational-Security-Best-Practices” Captures all current and future findings created by the security standard AWS Foundational Security Best Practices.
Status is FAILED Captures findings where the compliance status of the resource doesn’t pass the assessment.
Workflow Status is not SUPPRESSED Captures findings where Security Hub users haven’t updated the finding to the SUPPRESSED status.
Record State is ACTIVE Captures findings that represent the latest assessment of the resource. Security Hub automatically archives control-based findings if the associated resource is deleted, the resource does not exist, or the control is disabled.
Group by SeverityLabel Creates the insight and populates the counts.

Solution artifacts

The solution provided with this blog post consists of two files:

  1. An AWS CloudFormation template named security-hub-email-summary-cf-template.json.
  2. A zip file named sec-hub-email.zip for the Lambda function that generates the Security Hub summary email.

In addition to the Security Hub custom insights as discussed in the previous section, the solution also deploys the following artifacts:

  1. An Amazon Simple Notification Service (Amazon SNS) topic named SecurityHubRecurringSummary and an email subscription to the topic.
    Figure 5: SNS topic created by the solution

    Figure 5: SNS topic created by the solution

    The email address that subscribes to the topic is captured through a CloudFormation template input parameter. The subscriber is notified by email to confirm the subscription, and after confirmation, the subscription to the SNS topic is created.

    Figure 6: SNS email subscription

    Figure 6: SNS email subscription

  2. Two Lambda functions:
    1. A Lambda function named *-CustomInsightsFunction-* is used only by the CloudFormation template to create the custom Insights.
    2. A Lambda function named SendSecurityHubSummaryEmail queries the custom insights from the Security Hub API and uses the insights’ data to create the summary email message. The function then sends the email message to the SNS topic.

      Figure 7: Example of Lambda functions created by the solution

      Figure 7: Example of Lambda functions created by the solution

  3. Two IAM roles for the Lambda functions provide the following rights, respectively:
    1. The minimum rights required to create insights and to create CloudWatch log groups and logs.
      {
          "Version": "2012-10-17",
          "Statement": [
              {
                  "Action": [
                      "logs:CreateLogGroup",
                      "logs:CreateLogStream",
                      "logs:PutLogEvents"
                  ],
                  "Resource": "arn:aws:logs:*:*:*",
                  "Effect": "Allow"
              },
              {
                  "Action": [
                      "securityhub:CreateInsight"
                  ],
                  "Resource": "*",
                  "Effect": "Allow"
              }
          ]
      }
      

    2. The minimum rights required to query Security Hub insights and to send email messages to the SNS topic named SecurityHubRecurringSummary.
      {
          "Version": "2012-10-17",
          "Statement": [
              {
                  "Action": "sns:Publish",
                  "Resource": "arn:aws:sns:[REGION]:[ACCOUNT-ID]:SecurityHubRecurringSummary",
                  "Effect": "Allow"
              }
          ]
      } ,
      {
          "Version": "2012-10-17",
          "Statement": [
              {
                  "Effect": "Allow",
                  "Action": [
                      "securityhub:Get*",
                      "securityhub:List*",
                      "securityhub:Describe*"
                  ],
                  "Resource": "*"
              }
          ]
      }             
      

  4. A CloudWatch scheduled event named SecurityHubSummaryEmailSchedule for invoking the Lambda function that generates the summary email. The default schedule is every Monday at 8:00 AM GMT. This schedule can be overwritten by using a CloudFormation input parameter. Learn more about creating Cron expressions.

    Figure 8: Example of CloudWatch schedule created by the solution

    Figure 8: Example of CloudWatch schedule created by the solution

Deploy the solution

The following steps demonstrate the deployment of this solution in a single AWS account and Region. Repeat these steps in each of the AWS accounts that are active with Security Hub, so that the respective application owners can receive the relevant data from their accounts.

To deploy the solution

  1. Download the CloudFormation template security-hub-email-summary-cf-template.json and the .zip file sec-hub-email.zip from https://github.com/aws-samples/aws-security-hub-summary-email.
  2. Copy security-hub-email-summary-cf-template.json and sec-hub-email.zip to an S3 bucket within your target AWS account and Region. Copy the object URL for the CloudFormation template .json file.
  3. On the AWS Management Console, open the service CloudFormation. Choose Create Stack with new resources.

    Figure 9: Create stack with new resources

    Figure 9: Create stack with new resources

  4. Under Specify template, in the Amazon S3 URL textbox, enter the S3 object URL for the file security-hub-email-summary-cf-template.json that you uploaded in step 1.

    Figure 10: Specify S3 URL for CloudFormation template

    Figure 10: Specify S3 URL for CloudFormation template

  5. Choose Next. On the next page, under Stack name, enter a name for the stack.

    Figure 11: Enter stack name

    Figure 11: Enter stack name

  6. On the same page, enter values for the input parameters. These are the input parameters that are required for this CloudFormation template:
    1. S3 Bucket Name: The S3 bucket where the .zip file for the Lambda function (sec-hub-email.zip) is stored.
    2. S3 key name (with prefixes): The S3 key name (with prefixes) for the .zip file for the Lambda function.
    3. Email address: The email address of the subscriber to the Security Hub summary email.
    4. CloudWatch Cron Expression: The Cron expression for scheduling the Security Hub summary email. The default is every Monday 8:00 AM GMT. Learn more about creating Cron expressions.
    5. Additional Footer Text: Text that will appear at the bottom of the email message. This can be useful to guide the recipient on next steps or provide internal resource links. This is an optional parameter; leave it blank for no text.
    Figure 12: Enter CloudFormation parameters

    Figure 12: Enter CloudFormation parameters

  7. Choose Next.
  8. Keep all defaults in the screens that follow, and choose Next.
  9. Select the check box I acknowledge that AWS CloudFormation might create IAM resources, and then choose Create stack.

Test the solution

You can send a test email after the deployment is complete. To do this, navigate to the Lambda console and locate the Lambda function named SendSecurityHubSummaryEmail. Perform a manual invocation with any event payload to receive an email within a few minutes. You can repeat this procedure as many times as you wish.

Conclusion

We’ve outlined an approach for rapidly building a solution for sending a weekly summary of the security posture of your AWS account as evaluated by Security Hub. This solution makes it easier for you to be diligent in reviewing any outstanding findings and to remediate findings in a timely way based on their severity. You can extend the solution in many ways, including:

  1. Add links in the footer text to the remediation workflows, such as creating a ticket for ServiceNow or any Security Information and Event Management (SIEM) that you use.
  2. Add links to internal wikis for workflows like organizational exceptions to vulnerabilities or other internal processes.
  3. Extend the solution by modifying the custom insights content, email content, and delivery frequency.

To learn more about how to set up and customize Security Hub, see these additional blog posts.

If you have feedback about this post, submit comments in the Comments section below. If you have any questions about this post, start a thread on the AWS Security Hub forum.

Want more AWS Security how-to content, news, and feature announcements? Follow us on Twitter.

Author

Justin Criswell

Justin is a Senior Security Specialist Solutions Architect at AWS. His background is in cloud security and customer success. Today, he is focused on helping enterprise AWS customers adopt and operationalize AWS Security Services to increase visibility and reduce risk.

Author

Kavita Mahajan

Kavita is a Senior Partner Solutions Architect at AWS. She has a background in building software systems for the financial sector, specifically insurance and banking. Currently, she is focused on helping AWS partners develop capabilities, grow their practices, and innovate on the AWS platform to deliver the best possible customer experience.

How to deploy the AWS Solution for Security Hub Automated Response and Remediation

Post Syndicated from Ramesh Venkataraman original https://aws.amazon.com/blogs/security/how-to-deploy-the-aws-solution-for-security-hub-automated-response-and-remediation/

In this blog post I show you how to deploy the Amazon Web Services (AWS) Solution for Security Hub Automated Response and Remediation. The first installment of this series was about how to create playbooks using Amazon CloudWatch Events, AWS Lambda functions, and AWS Security Hub custom actions that you can run manually based on triggers from Security Hub in a specific account. That solution requires an analyst to directly trigger an action using Security Hub custom actions and doesn’t work for customers who want to set up fully automated remediation based on findings across one or more accounts from their Security Hub master account.

The solution described in this post automates the cross-account response and remediation lifecycle from executing the remediation action to resolving the findings in Security Hub and notifying users of the remediation via Amazon Simple Notification Service (Amazon SNS). You can also deploy these automated playbooks as custom actions in Security Hub, which allows analysts to run them on-demand against specific findings. You can deploy these remediations as custom actions or as fully automated remediations.

Currently, the solution includes 10 playbooks aligned to the controls in the Center for Internet Security (CIS) AWS Foundations Benchmark standard in Security Hub, but playbooks for other standards such as AWS Foundational Security Best Practices (FSBP) will be added in the future.

Solution overview

Figure 1 shows the flow of events in the solution described in the following text.

Figure 1: Flow of events

Figure 1: Flow of events

Detect

Security Hub gives you a comprehensive view of your security alerts and security posture across your AWS accounts and automatically detects deviations from defined security standards and best practices.

Security Hub also collects findings from various AWS services and supported third-party partner products to consolidate security detection data across your accounts.

Ingest

All of the findings from Security Hub are automatically sent to CloudWatch Events and Amazon EventBridge and you can set up CloudWatch Events and EventBridge rules to be invoked on specific findings. You can also send findings to CloudWatch Events and EventBridge on demand via Security Hub custom actions.

Remediate

The CloudWatch Event and EventBridge rules can have AWS Lambda functions, AWS Systems Manager automation documents, or AWS Step Functions workflows as the targets of the rules. This solution uses automation documents and Lambda functions as response and remediation playbooks. Using cross-account AWS Identity and Access Management (IAM) roles, the playbook performs the tasks to remediate the findings using the AWS API when a rule is invoked.

Log

The playbook logs the results to the Amazon CloudWatch log group for the solution, sends a notification to an Amazon Simple Notification Service (Amazon SNS) topic, and updates the Security Hub finding. An audit trail of actions taken is maintained in the finding notes. The finding is updated as RESOLVED after the remediation is run. The security finding notes are updated to reflect the remediation performed.

Here are the steps to deploy the solution from this GitHub project.

  • In the Security Hub master account, you deploy the AWS CloudFormation template, which creates an AWS Service Catalog product along with some other resources. For a full set of what resources are deployed as part of an AWS CloudFormation stack deployment, you can find the full set of deployed resources in the Resources section of the deployed AWS CloudFormation stack. The solution uses the AWS Service Catalog to have the remediations available as a product that can be deployed after granting the users the required permissions to launch the product.
  • Add an IAM role that has administrator access to the AWS Service Catalog portfolio.
  • Deploy the CIS playbook from the AWS Service Catalog product list using the IAM role you added in the previous step.
  • Deploy the AWS Security Hub Automated Response and Remediation template in the master account in addition to the member accounts. This template establishes AssumeRole permissions to allow the playbook Lambda functions to perform remediations. Use AWS CloudFormation StackSets in the master account to have a centralized deployment approach across the master account and multiple member accounts.

Deployment steps for automated response and remediation

This section reviews the steps to implement the solution, including screenshots of the solution launched from an AWS account.

Launch AWS CloudFormation stack on the master account

As part of this AWS CloudFormation stack deployment, you create custom actions to configure Security Hub to send findings to CloudWatch Events. Lambda functions are used to provide remediation in response to actions sent to CloudWatch Events.

Note: In this solution, you create custom actions for the CIS standards. There will be more custom actions added for other security standards in the future.

To launch the AWS CloudFormation stack

  1. Deploy the AWS CloudFormation template in the Security Hub master account. In your AWS console, select CloudFormation and choose Create new stack and enter the S3 URL.
  2. Select Next to move to the Specify stack details tab, and then enter a Stack name as shown in Figure 2. In this example, I named the stack SO0111-SHARR, but you can use any name you want.
     
    Figure 2: Creating a CloudFormation stack

    Figure 2: Creating a CloudFormation stack

  3. Creating the stack automatically launches it, creating 21 new resources using AWS CloudFormation, as shown in Figure 3.
     
    Figure 3: Resources launched with AWS CloudFormation

    Figure 3: Resources launched with AWS CloudFormation

  4. An Amazon SNS topic is automatically created from the AWS CloudFormation stack.
  5. When you create a subscription, you’re prompted to enter an endpoint for receiving email notifications from Amazon SNS as shown in Figure 4. To subscribe to that topic that was created using CloudFormation, you must confirm the subscription from the email address you used to receive notifications.
     
    Figure 4: Subscribing to Amazon SNS topic

    Figure 4: Subscribing to Amazon SNS topic

Enable Security Hub

You should already have enabled Security Hub and AWS Config services on your master account and the associated member accounts. If you haven’t, you can refer to the documentation for setting up Security Hub on your master and member accounts. Figure 5 shows an AWS account that doesn’t have Security Hub enabled.
 

Figure 5: Enabling Security Hub for first time

Figure 5: Enabling Security Hub for first time

AWS Service Catalog product deployment

In this section, you use the AWS Service Catalog to deploy Service Catalog products.

To use the AWS Service Catalog for product deployment

  1. In the same master account, add roles that have administrator access and can deploy AWS Service Catalog products. To do this, from Services in the AWS Management Console, choose AWS Service Catalog. In AWS Service Catalog, select Administration, and then navigate to Portfolio details and select Groups, roles, and users as shown in Figure 6.
     
    Figure 6: AWS Service Catalog product

    Figure 6: AWS Service Catalog product

  2. After adding the role, you can see the products available for that role. You can switch roles on the console to assume the role that you granted access to for the product you added from the AWS Service Catalog. Select the three dots near the product name, and then select Launch product to launch the product, as shown in Figure 7.
     
    Figure 7: Launch the product

    Figure 7: Launch the product

  3. While launching the product, you can choose from the parameters to either enable or disable the automated remediation. Even if you do not enable fully automated remediation, you can still invoke a remediation action in the Security Hub console using a custom action. By default, it’s disabled, as highlighted in Figure 8.
     
    Figure 8: Enable or disable automated remediation

    Figure 8: Enable or disable automated remediation

  4. After launching the product, it can take from 3 to 5 minutes to deploy. When the product is deployed, it creates a new CloudFormation stack with a status of CREATE_COMPLETE as part of the provisioned product in the AWS CloudFormation console.

AssumeRole Lambda functions

Deploy the template that establishes AssumeRole permissions to allow the playbook Lambda functions to perform remediations. You must deploy this template in the master account in addition to any member accounts. Choose CloudFormation and create a new stack. In Specify stack details, go to Parameters and specify the Master account number as shown in Figure 9.
 

Figure 9: Deploy AssumeRole Lambda function

Figure 9: Deploy AssumeRole Lambda function

Test the automated remediation

Now that you’ve completed the steps to deploy the solution, you can test it to be sure that it works as expected.

To test the automated remediation

  1. To test the solution, verify that there are 10 actions listed in Custom actions tab in the Security Hub master account. From the Security Hub master account, open the Security Hub console and select Settings and then Custom actions. You should see 10 actions, as shown in Figure 10.
     
    Figure 10: Custom actions deployed

    Figure 10: Custom actions deployed

  2. Make sure you have member accounts available for testing the solution. If not, you can add member accounts to the master account as described in Adding and inviting member accounts.
  3. For testing purposes, you can use CIS 1.5 standard, which is to require that the IAM password policy requires at least one uppercase letter. Check the existing settings by navigating to IAM, and then to Account Settings. Under Password policy, you should see that there is no password policy set, as shown in Figure 11.
     
    Figure 11: Password policy not set

    Figure 11: Password policy not set

  4. To check the security settings, go to the Security Hub console and select Security standards. Choose CIS AWS Foundations Benchmark v1.2.0. Select CIS 1.5 from the list to see the Findings. You will see the Status as Failed. This means that the password policy to require at least one uppercase letter hasn’t been applied to either the master or the member account, as shown in Figure 12.
     
    Figure 12: CIS 1.5 finding

    Figure 12: CIS 1.5 finding

  5. Select CIS 1.5 – 1.11 from Actions on the top right dropdown of the Findings section from the previous step. You should see a notification with the heading Successfully sent findings to Amazon CloudWatch Events as shown in Figure 13.
     
    Figure 13: Sending findings to CloudWatch Events

    Figure 13: Sending findings to CloudWatch Events

  6. Return to Findings by selecting Security standards and then choosing CIS AWS Foundations Benchmark v1.2.0. Select CIS 1.5 to review Findings and verify that the Workflow status of CIS 1.5 is RESOLVED, as shown in Figure 14.
     
    Figure 14: Resolved findings

    Figure 14: Resolved findings

  7. After the remediation runs, you can verify that the Password policy is set on the master and the member accounts. To verify that the password policy is set, navigate to IAM, and then to Account Settings. Under Password policy, you should see that the account uses a password policy, as shown in Figure 15.
     
    Figure 15: Password policy set

    Figure 15: Password policy set

  8. To check the CloudWatch logs for the Lambda function, in the console, go to Services, and then select Lambda and choose the Lambda function and within the Lambda function, select View logs in CloudWatch. You can see the details of the function being run, including updating the password policy on both the master account and the member account, as shown in Figure 16.
     
    Figure 15: Lambda function log

    Figure 16: Lambda function log

Conclusion

In this post, you deployed the AWS Solution for Security Hub Automated Response and Remediation using Lambda and CloudWatch Events rules to remediate non-compliant CIS-related controls. With this solution, you can ensure that users in member accounts stay compliant with the CIS AWS Foundations Benchmark by automatically invoking guardrails whenever services move out of compliance. New or updated playbooks will be added to the existing AWS Service Catalog portfolio as they’re developed. You can choose when to take advantage of these new or updated playbooks.

If you have feedback about this post, submit comments in the Comments section below. If you have questions about this post, start a new thread on the AWS Security Hub forum or contact AWS Support.

Want more AWS Security how-to content, news, and feature announcements? Follow us on Twitter.

Author

Ramesh Venkataraman

Ramesh is a Solutions Architect who enjoys working with customers to solve their technical challenges using AWS services. Outside of work, Ramesh enjoys following stack overflow questions and answers them in any way he can.

Aligning IAM policies to user personas for AWS Security Hub

Post Syndicated from Vaibhawa Kumar original https://aws.amazon.com/blogs/security/aligning-iam-policies-to-user-personas-for-aws-security-hub/

AWS Security Hub provides you with a comprehensive view of your security posture across your accounts in Amazon Web Services (AWS) and gives you the ability to take action on your high-priority security alerts. There are several different user personas that use Security Hub, and they typically require different AWS Identity and Access Management (IAM) permissions. Those personas include: a security administrator; a security analyst or engineer on a central security team or in a Cloud Center of Excellence; and a Developer Operations (DevOps) engineer or application builder who is the primary owner of an AWS account. In this post, we show how to deploy sample IAM policies for these three personas.

The first persona, a security administrator or cloud system administrator (sysadmin), is responsible for setting up and configuring Security Hub, and they typically need access to all of the Security Hub APIs to do this work. As part of this work, the sysadmin enables Security Hub on various accounts and Regions, decides which standards and controls should be enabled on which accounts, enables product integrations, creates insights, sets up custom actions and automated remediations, and configures IAM policies for other users.

The second persona, a security analyst or engineer using Security Hub, is part of a central security team, often part of a Cloud Center of Excellence. We often see that cloud security efforts are centralized in Cloud Centers of Excellence within a company. These security analysts or engineers typically have access to the master account in Security Hub and can view and take action on findings from any of the connected member accounts. They typically are not configuring Security Hub, so they don’t need permissions to do so.

The third persona is a DevOps engineer or application builder. This user needs the ability to view findings and take action only on the findings associated with their account. For cloud workloads, security is often decentralized down to these users. Security Hub enables them to take more proactive responsibility for the security of their own account by directly viewing and taking action on findings in their account. They typically don’t need permissions to set up and configure Security Hub, because that is done by a central sysadmin.

Overview

The following reference architecture presents an overview of a Security Hub master-member account structure and three personas: a security administrator, a security analyst/engineer, and a DevOps engineer.
 

Figure 1: Reference architecture

Figure 1: Reference architecture

In this blog post, we show how you can create and use the following AWS managed and customer managed IAM policies to support these three personas:

  • The sysadmin persona needs permissions to configure and manage Security Hub, account memberships, insights, and integrations, and to create remediations and take actions and perform record and workflow updates. The AWS managed IAM policy called AWSSecurityHubFullAccess provides the permissions for this persona. An IAM user or role with these permissions can deploy and configure Security Hub in master and member accounts. They can also update findings. The sysadmin also requires permissions to configure AWS Config and Amazon CloudWatch event rules to set up automated responses and remediations.
  • The security analyst persona needs permissions to read, list, and describe findings, standards, controls, and products; to update findings; and to create and update insights for Security Hub resources in the master account. The AWS managed IAM policy called AWSSecurityHubReadOnlyAccess provides the permissions needed for read, list, and describe actions, and a customer managed policy will be attached to give permissions to create and update insights and to update findings.
  • The DevOps engineer persona needs the same permissions as the security analyst persona, but they will only have the ability to access their own Security Hub member AWS account(s) and won’t have access to the master account.

Depending on your specific use case, you might want to provide additional permissions to the security analyst and DevOps engineer personas. For example, you might want to also grant them permissions to create custom actions by using the UpdateActionTarget API. In that case, you should also ensure that they have appropriate permissions to create CloudWatch event rules. You can also restrict these personas to only be able to update certain fields in findings (for example, only update workflow status but not severity) by using IAM context keys.

Prerequisites

You must have already enabled Security Hub with one account as master and other associated accounts as members. You will use the following AWS services:

Implementation

To create the required customer managed policies and associate them to users and roles, you will perform these tasks, described in more detail later in this section:

  1. Create a customer managed policy and associate it with the user and role for the security analyst persona in the Security Hub master account, along with the AWSSecurityHubReadOnlyAccess AWS managed policy.
  2. Create a customer managed policy and associate it with the user and role for the DevOps persona in the Security Hub member account, along with the AWSSecurityHubReadOnlyAccess AWS managed policy.
  3. Create a sysadmin user and role and associate it with the AWS managed policy for AWSSecurityHubFullAccess, along with AWS Config and CloudWatch event rule permissions in the Security Hub master account.

The following policy JSON script is for those two customer managed policies.

Security Hub - Security Analyst policy 
MasterCustomer Managed Policy:
{
    "Version": "2012-10-17",
    "Statement": [
        {
            "Sid": "SecurityAnalystMasterCMP",
            "Effect": "Allow",
            "Action": [
                "securityhub:UpdateInsight",
                "securityhub:CreateInsight",
	  			"securityhub:BatchUpdateFindings"
            ],
            "Resource": "*"
        }
    ]
}

Security Hub – DevOps Engineer policy: 
MemberCustomer Managed Policy:
{
    "Version": "2012-10-17",
    "Statement": [
        {
            "Sid": "DevOpsMemberCMP",
            "Effect": "Allow",
            "Action": [
                "securityhub:UpdateInsight",
                "securityhub:CreateInsight",
                "securityhub:BatchUpdateFindings"
            ],
            "Resource": "*"
        }
    ]
}

Step 1: Create the user and role for the security analyst persona

First, create a customer managed policy and associate it with the user and role for the security analyst persona in the Security Hub master account, along with the AWSSecurityHubReadOnlyAccess AWS managed policy.

To create the IAM policy, user, and role (console method)

  1. Sign in to the AWS Management Console in the Security Hub master account and open the IAM console.
  2. In the IAM console navigation pane, choose Policies, and then choose Create Policies.
  3. Choose the JSON tab.
  4. Copy the Security Hub – Security Analyst policy JSON shown earlier in this section, and paste it into the visual editor. When you are finished, choose Review policy.
  5. On the Review policy page, enter a name and a description (optional) for the policy that you’re creating. Review the policy summary to see the permissions that are granted by your policy. Then choose Create policy to save your work.
  6. Follow the instructions in the AWS Identity and Access Management User Guide to create a user and role, and attach the policy you just created.
  7. In the IAM console navigation pane, choose the user or role (or both) that you just created, and on the Permissions tab, choose Add Permissions.
  8. Choose the permissions category Attach existing policies directly to filter and select the managed policy AWSSecurityHubReadOnlyAccess. Review the permissions and then choose Add permissions.
  9. Save all the changes and try using the user and role after few minutes.

Step 2: Create the user and role for the DevOps persona

Next, create a customer managed policy and associate it with the user and role for the DevOps persona in the Security Hub member account, along with the AWSSecurityHubReadOnlyAccess AWS managed policy.

To create the IAM policy, user, and role (console method)

  1. Sign in to the AWS Management Console in the Security Hub member account and open the IAM console.
  2. In the IAM console navigation pane, choose Policies and then choose Create Policies.
  3. Choose the JSON tab.
  4. Copy the Security Hub – DevOps Engineer policy JSON shown earlier in this section, and paste it into the visual editor. When you are finished, choose Review policy.
  5. On the Review policy page, enter a name and a description (optional) for the policy that you are creating. Review the policy summary to see the permissions that are granted by your policy. Then choose Create policy to save your work.
  6. Follow the instructions in the AWS Identity and Access Management User Guide to create a user and role, and attach the policy you just created.
  7. In the IAM console navigation pane, choose the user or role (or both) that you just created, and on the Permissions tab, choose Add Permissions.
  8. Choose the permissions category Attach existing policies directly to filter and select the managed policy AWSSecurityHubReadOnlyAccess. Review the permissions and then choose Add permissions.
  9. Save all the changes and try using the user and role after few minutes.

Step 3: Create the user and role for the sysadmin persona

Next, create a user and role for the sysadmin persona and associate it with the AWS managed policies AWSSecurityHubFullAccess, CloudWatchEventsFullAccess, and full access to AWS Config in the Security Hub master account.

To create the IAM user and role (console method)

  1. Sign in to the AWS Management Console in the Security Hub member account and open the IAM console.
  2. Follow the instructions in the AWS Identity and Access Management User Guide to create a user and role.
  3. In the IAM console navigation pane, choose the user or role (or both) that you just created, and on the Permissions tab, choose Add Permissions.
  4. Choose the permissions category Attach existing policies directly to filter and select managed policies, and attach the managed policies AWSSecurityHubFullAccess and CloudWatchEventsFullAccess.
  5. Create another policy to grant full access to AWS Config as described in the AWS Config Developer Guide, and attach the policy to the user or role. Review the permissions, and choose Add permissions.
  6. Save all the changes and try using the user and role after few minutes.

Test the users and roles in the Security Hub master and member accounts

Finally, test the three users and roles that you created for the respective personas in the preceding steps.

To test the users and roles

  1. Security analyst user and role:
    1. Sign in to the AWS Management Console in the master account and open Security Hub.
    2. Make sure that Security Hub UI features (such as the Summary, Security Standard, Insights, Findings, and Integrations) are rendered so that the Security Analyst can view them.
    3. Navigate to a finding and change the workflow status as described in the topic Setting the workflow status for findings.
  2. DevOps engineer user and role:
    1. Sign in to the AWS Management Console in the member account and open Security Hub.
    2. Make sure that Security Hub UI features (such as the Summary, Security Standard, Insights, Findings, and Integrations) are rendered so that the DevOps Engineer can view them.
    3. Create a custom insight for the member account and other attribute groupings.
  3. Sysadmin user and role:
    1. Sign in to the AWS Management Console in the master or member account, and open Security Hub.
    2. Try admin-related operations such as create a custom action, invite another account, and so on.

Adding policy conditions

You might want to further restrict the permissions for the security analyst and DevOps personas. IAM policies for Security Hub’s BatchUpdateFindings API enable you to specify conditions to prevent a user from making any update to a specific finding field. The following example disallows setting the Workflow Status field to Suppressed.

{
	"Sid": "CMPCondition",
	"Effect": "Deny",
	"Action": "securityhub:BatchUpdateFindings",
	"Resource": "*",
	"Condition": {
		"StringEquals": {
			"securityhub:ASFFSyntaxPath/Workflow.Status": "SUPPRESSED"
		}
	}
}

Summary

In this post, we showed you how to align AWS managed and customer managed IAM policies to different user personas, so that you can allow different users to access Security Hub with least privilege permissions. Security Hub enables both central security teams and individual DevOps engineers to understand and improve the security posture of the AWS accounts in their organization.

If you have feedback about this post, submit comments in the Comments section below. If you have questions about this post, start a new thread on the AWS Security Hub forum or contact AWS Support.

Want more AWS Security how-to content, news, and feature announcements? Follow us on Twitter.

Author

Vaibhawa Kumar

Vaibhawa is a Cloud Infra Architect with AWS Professional Services. He helps customers on their cloud journey of critical workloads to the AWS cloud with infrastructure security and automations. In his free time, you can find him spending time with family, sports, and cooking.

Author

Sanjay Patel

Sanjay is a Senior Cloud Application Architect with AWS Professional Services. He has a diverse background in software design, enterprise architecture, and API integrations. He has helped AWS customers automate infrastructure security. He enjoys working with AWS customers to identify and implement the best fit solution.

Author

Ely Kahn

Ely is the Principal Product Manager for AWS Security Hub. Before his time at AWS, Ely was a co-founder for Sqrrl, a security analytics startup that AWS acquired and is now Amazon Detective. Earlier, Ely served in a variety of positions in the federal government, including Director of Cybersecurity at the National Security Council in the White House.

Integrating AWS CloudFormation security tests with AWS Security Hub and AWS CodeBuild reports

Post Syndicated from Vesselin Tzvetkov original https://aws.amazon.com/blogs/security/integrating-aws-cloudformation-security-tests-with-aws-security-hub-and-aws-codebuild-reports/

The concept of infrastructure as code, by using pipelines for continuous integration and delivery, is fundamental for the development of cloud infrastructure. Including code quality and vulnerability scans in the pipeline is essential for the security of this infrastructure as code. In one of our previous posts, How to build a CI/CD pipeline for container vulnerability scanning with Trivy and AWS Security Hub, you learned how to scan containers to efficiently identify Common Vulnerabilities and Exposures (CVEs) and work with your developers to address them.

In this post, we’ll continue this topic, and also introduce a method for integrating open source tools that find potentially insecure patterns in your AWS CloudFormation templates with both AWS Security Hub and AWS CodeBuild reports. We’ll be using Stelligent’s open source tool CFN-Nag. We also show you how you can extend the solution to use AWS CloudFormation Guard (currently in preview).

One reason to use this integration is that it gives both security and development teams visibility into potential security risks, and resources that are insecure or non-compliant to your company policy, before they’re deployed.

Solution benefit and deliverables

In this solution, we provide you with a ready-to-use template for performing scanning of your AWS CloudFormation templates by using CFN-Nag. This tool has more than 140 predefined patterns, such as AWS Identity and Access Management (IAM) rules that are too permissive (wildcards), security group rules that are too permissive (wildcards), access logs that aren’t enabled, or encryption that isn’t enabled. You can additionally define your own rules to match your company policy as described in the section later in this post, by using custom profiles and exceptions, and suppressing false positives.

Our solution enables you to do the following:

  • Integrate CFN-Nag in a CodeBuild project, scanning the infrastructure code for more than 140 possible insecure patterns, and classifying them as warnings or a failing test.
  • Learn how to integrate AWS CloudFormation Guard (CFN-Guard). You need to define your scanning rules in this case.
  • Generate CodeBuild reports, so that developers can easily identify failed security tests. In our sample, the build process fails if any critical findings are identified.
  • Import to Security Hub the aggregated finding per code branch, so that security professionals can easily spot vulnerable code in repositories and branches. For every branch, we import one aggregated finding.
  • Store the original scan report in an Amazon Simple Storage Service (Amazon S3) bucket for auditing purposes.

Note: in this solution, the AWS CloudFormation scanning tools won’t scan your application code that is running at AWS Lambda functions, Amazon Elastic Container Service (Amazon ECS), or Amazon Elastic Compute Cloud (Amazon EC2) instances.

Architecture

Figure 1 shows the architecture of the solution. The main steps are as follows:

  1. Your pipeline is triggered when new code is pushed to CodeCommit (which isn’t part of the template) to start a new build.
  2. The build process scans the AWS CloudFormation templates by using the cfn_nag_scan or cfn-guard command as defined by the build job.
  3. A Lambda function is invoked, and the scan report is sent to it.
  4. The scan report is published in an S3 bucket via the Lambda function.
  5. The Lambda function aggregates the findings report per repository and git branch and imports the report to Security Hub. The Lambda function also suppresses any previous findings related to this current repo and branch. The severity of the finding is calculated by the number of findings and a weight coefficient that depends on whether the finding is designated as warning or critical.
  6. Finally, the Lambda function generates the CodeBuild test report in JUnit format and returns it to CodeBuild. This report only includes information about any failed tests.
  7. CodeBuild creates a new test report from the new findings under the SecurityReports test group.
Figure 1: Solution architecture

Figure 1: Solution architecture

Walkthrough

To get started, you need to set up the sample solution that scans one of your repositories by using CFN-Nag or CFN-Guard.

To set up the sample solution

  1. Log in to your AWS account if you haven’t done so already. Choose Launch Stack to launch the AWS CloudFormation console with the prepopulated AWS CloudFormation demo template. Choose Next.

    Select the Launch Stack button to launch the templateAdditionally, you can find the latest code on GitHub.

  2. Fill in the stack parameters as shown in Figure 2:
    • CodeCommitBranch: The name of the branch to be monitored, for example refs/heads/master.
    • CodeCommitUrl: The clone URL of the CodeCommit repo that you want to monitor. It must be in the same Region as the stack being launched.
    • TemplateFolder: The folder in your repo that contains the AWS CloudFormation templates.
    • Weight coefficient for failing: The weight coefficient for a failing violation in the template.
    • Weight coefficient for warning: The weight coefficient for a warning in the template.
    • Security tool: The static analysis tool that is used to analyze the templates (CFN-Nag or CFN-Guard).
    • Fail build: Whether to fail the build when security findings are detected.
    • S3 bucket with sources: This bucket contains all sources, such as the Lambda function and templates. You can keep the default text if you’re not customizing the sources.
    • Prefix for S3 bucket with sources: The prefix for all objects. You can keep the default if you’re not customizing the sources.
Figure 2: AWS CloudFormation stack

Figure 2: AWS CloudFormation stack

View the scan results

After you execute the CodeBuild project, you can view the results in three different ways depending on your preferences: CodeBuild report, Security Hub, or the original CFN-Nag or CFN-Guard report.

CodeBuild report

In the AWS Management Console, go to CodeBuild and choose Report Groups. You can find the report you are interested in under SecurityReports. Both failures and warnings are represented as failed tests and are prefixed with W(Warning) or F(Failure), respectively, as shown in Figure 3. Successful tests aren’t part of the report because they aren’t provided by CFN-Nag reports.

Figure 3: AWS CodeBuild report

Figure 3: AWS CodeBuild report

In the CodeBuild navigation menu, under Report groups, you can see an aggregated view of all scans. There you can see a historical view of the pass rate of your tests, as shown in Figure 4.

Figure 4: AWS CodeBuild Group

Figure 4: AWS CodeBuild Group

Security Hub findings

In the AWS Management Console, go to Security Hub and select the Findings view. The aggregated finding per branch has the title CFN scan repo:name:branch with Company Personal and Product Default. The name and branch are placeholders for the repo and branch name. There is one active finding per repo and branch. All previous reports for this repo and branch are suppressed, so that by default you see only the last ones. If necessary, you can see the previous reports by removing the selection filter in the Security Hub finding console. Figure 5 shows an example of the Security Hub findings.

Figure 5: Security Hub findings

Figure 5: Security Hub findings

Original scan report

Lastly, you can find the original scan report in the S3 bucket aws-sec-build-reports-hash. You can also find a reference to this object in the associated Security Hub finding source URL. The S3 object key is constructed as follows.


cfn-nag-report/repo:source_repository/branch:branch_short/cfn-nag-createdAt.json

where source_repository is the name of the repository, branch_short is the name of the branch, and createdAt is the report date.

The following screen capture shows a sample view of the content.

Figure 6: CFN_NAG report sample

Figure 6: CFN_NAG report sample

Security Hub severity and weight coefficients

The Lambda function aggregates CFN-Nag findings to one Security Hub finding per branch and repo. We consider that in this way you get the best visibility without losing orientation in too many findings if you have a large code base.

The Security Hub finding severity is calculated as follows:

  • CFN-Nag critical findings are weighted (multiplied) by 20 and the warnings by 1.
  • The sum of all CFN-Nag findings multiplied by their weighted coefficient results in the severity of the Security Hub finding.

The severity label or normalized severity (from 0 to 100) (see AWS Security Finding Format (ASFF) for more information) is calculated from the summed severity. We implemented the following convention:

  • If the severity is more than 100 points, the label is set as CRITICAL (100).
  • If the severity is lower than 100, the normalized severity and label are mapped as described in AWS Security Finding Format (ASFF).

Your company might have a different way to calculate the severity. If you want to adjust the weight coefficients, change the stack parameter. If you want to adjust the mapping of the CFN-Nag findings to Security hub severity, then you’ll need to adapt the Lambda’s calculateSeverity Python function.

Using custom profiles and exceptions, and suppressing false positives

You can customize CFN-Nag to use a certain rule set by including the specific list of rules to apply (called a profile) within the repository. Customizing rule sets is useful because developers or applications might have different security considerations or risk profiles in specific applications. Additionally the operator might prefer to exclude rules that are prone to introducing false positives.

To add a custom profile, you can modify the cfn_nag_scan command specified in the CodeBuild buildspec.yml file. Use the –profile-path command argument to point to the file that contains the list of rules to use, as shown in the following code sample.


cfn_nag_scan --fail-on-warnings –profile-path .cfn_nag.profile  --input-path  ${TemplateFolder} -o json > ./report/cfn_nag.out.json

Where .cfn_nag.profile file contains one rule identifier per line:


F2
F3
F5
W11

You can find the full list of available rules using cfn_nag_rules command.

You can also choose instead to use a global deny list of rules, or directly suppress findings per resource by using Metadata tags in each AWS CloudFormation resource. For more information, see the CFN-Nag GitHub repository.

Integrating with AWS CloudFormation Guard

The integration with AWS CloudFormation Guard (CFN-Guard) follows the same architecture pattern as CFN-Nag. The ImportToSecurityHub Lambda function can process both CFN-Nag and CFN-Guard results to import to Security Hub and generate a CodeBuild report.

To deploy the CFN-Guard tool

  1. In the AWS Management Console, go to CloudFormation, and then choose Update the previous stack deployed.
  2. Choose Next, and then change the SecurityTool parameter to cfn-guard.
  3. Continue to navigate through the console and deploy the stack.

This creates a new buildspec.yml file that uses the cfn-guard command line interface (CLI) to scan all AWS CloudFormation templates in the source repository. The scans use an example rule set found in the CFN-Guard repository.

You can choose to generate the rule set for the AWS CloudFormation templates that are required by the scanning engine and add the rule set to your repository as described on the GitHub page for AWS CloudFormation Guard. The rule set must reflect your company security policy. This can be one set for all templates, or dependent on the security profile of the application.

You can use your own rule set by modifying the cfn-guard –rule_path parameter to point to a file from within your repository, as follows.


cfn-guard --rule_set .cfn_guard.ruleset --template  "$template" > ./report/template_report

Troubleshooting

If the build report fails, you can find the CloudBuild run logs in the CodeBuild Build history. The build will fail if critical security findings are detected in the templates.

Additionally, the Lambda function execution logs can be found in the CloudWatch Log group aws/lambda/ImportToSecurityHub.

Summary

In this post, you learned how to scan the AWS CloudFormation templates for resources that are potentially insecure or not compliant to your company policy in a CodeBuild project, import the findings to Security Hub, and generate CodeBuild test reports. Integrating this solution to your pipelines can help multiple teams within your organization detect potential security risks in your infrastructure code before its deployed to your AWS environments. If you would like to extend the solution further and need support, contact AWS professional services or an Amazon Partner Network (APN) Partner. If you have technical questions, please use the AWS Security Hub or AWS CodeBuild forums.

If you have feedback about this post, submit comments in the Comments section below.

Want more AWS Security how-to content, news, and feature announcements? Follow us on Twitter.

Author

Vesselin Tzvetkov

Vesselin is senior security consultant at AWS Professional Services and is passionate about security architecture and engineering innovative solutions. Outside of technology, he likes classical music, philosophy, and sports. He holds a Ph.D. in security from TU-Darmstadt and a M.S. in electrical engineering from Bochum University in Germany.

Author

Joaquin Manuel Rinaudo

Joaquin is a Senior Security Consultant with AWS Professional Services. He is passionate about building solutions that help developers improve their software quality. Prior to AWS, he worked across multiple domains in the security industry, from mobile security to cloud and compliance related topics. In his free time, Joaquin enjoys spending time with family and reading science-fiction novels.