Tag Archives: Customer Solutions

How fEMR Delivers Cryptographically Secure and Verifiable Medical Data with Amazon QLDB

Post Syndicated from Patrick Gryczka original https://aws.amazon.com/blogs/architecture/how-femr-delivers-cryptographically-secure-and-verifiable-emr-medical-data-with-amazon-qldb/

This post was co-written by Team fEMR’s President & Co-founder, Sarah Draugelis; CTO, Andy Mastie; Core Team Engineer & Fennel Labs Co-founder, Sean Batzel; Patrick Gryczka, AWS Solutions Architect; Mithil Prasad, AWS Senior Customer Solutions Manager.

Team fEMR is a non-profit organization that created a free, open-source Electronic Medical Records system for transient medical teams.  Their system has helped bring aid and drive data driven communication in disaster relief scenarios and low resource settings around the world since 2014.  In the past year, Team fEMR integrated Amazon Quantum Ledger Database (QLDB) as their HIPAA compliant database solution to address their need for data integrity and verifiability.

When delivering aid to at risk communities and within challenging social and political environments, data veracity is a critical issue.  Patients need to trust that their data is confidential and following an appropriate chain of ownership.  Aid organizations meanwhile need to trust the demographic data provided to them to appropriately understand the scope of disasters and verify the usage of funds. Amazon QLDB is backed by an immutable append-only journal.  This journal is verifiable, making it easier for Team fEMR to engage in external audits and deliver a trusted and verifiable EMR solution. The teams that use the new fEMR system are typically working or volunteering in post-disaster environments, refugee camps, or in other mobile clinics that offer pre-hospital care.

In this blog post, we explore how Team fEMR leveraged Amazon QLDB and other AWS Managed Services to enable their relief efforts.

Background

Before the use of an electronic record keeping system, these teams often had to use paper records, which would easily be lost or destroyed. The new fEMR system allows the clinician to look up the patient’s history of illness, in order to provide the patient with a seamless continuity of care between clinic visits. Additionally, the collection of health data on a more macroscopic level allows researchers and data scientists to monitor for disease. This is- an especially important aspect of mobile medicine in a pandemic world.

The fEMR system has been deployed worldwide since 2014. In the original design, the system functioned solely in an on-premises environment. Clinicians were able to attach their own devices to the system, and have access to the EMR functionality and medical records. While the need for a standalone solution continues to exist for environments without data coverage and connectivity, demand for fEMR has increased rapidly and outpaced deployment capabilities as well as hardware availability. To solve for real-time deployment and scalability needs, Team fEMR migrated fEMR to the cloud and developed a HIPAA-compliant and secure architecture using Amazon QLDB.

As part of their cloud adoption strategy, Team fEMR decided to procure more managed services, to automate operational tasks and to optimize their resources.

Architecture showing how How fEMR Delivers Cryptographically Secure and Verifiable EMR Medical Data with Amazon QLDB

Figure 1 – Architecture showing How fEMR Delivers Cryptographically Secure and Verifiable EMR Medical Data with Amazon QLDB

The team built the preceding architecture using a combination of the following AWS managed services:

1. Amazon Quantum Ledger Database (QLDB) – By using QLDB, Team fEMR were able to build an unfalsifiable, HIPAA compliant, and cryptographically verifiable record of medical histories, as well as for clinic pharmacy usage and stocking.

2. AWS Elastic Beanstalk – Team fEMR uses Elastic Beanstalk to deploy and run their Django front end and application logic.  It allows their agile development team to focus on development and feature delivery, by offloading the operational work of deployment, patching, and scaling.

3. Amazon Relational Database Service (RDS) – Team fEMR uses RDS for ad-hoc search, reporting, and analytics, whereas QLDB is not optimized for the specific requirement.

4. Amazon ElastiCache – Team fEMR uses Amazon ElastiCache to cache user session data to provide near real-time response times.

Data Security considerations

Data Security was a key consideration when building the fEMR EHR solution. End users of the solution are often working in environments with at-risk populations. That is, patients who may be fleeing persecution from their home country, or may be at risk due to discriminatory treatment. It is therefore imperative to secure their data. QLDB as a data storage mechanism provides a cryptographically secure history of all changes to data. This has the benefit of improved visibility and auditability and is invaluable in situations where medical data needs to be as tamper-evident as possible.

Using Auto Scaling to minimize operational effort

When Team fEMR engages with disaster relief, they deal with ambiguity around both when events may occur and at what scale their effects may be felt.  By leveraging managed services like QLDB, RDS, and Elastic Beanstalk, Team fEMR was able to minimize the time their technical team spent on systems operations.  Instead, they can focus optimizing and improving their technology architectures.

Use of Infrastructure as Code to enable fast global deployment

With Infrastructure as Code, Team fEMR was able to create repeatable deployments. They utilized AWS CloudFormation to deploy their Elasticache, RDS, QLDB, and Elastic Beanstalk environment.  Elastic Beanstalk was used to further automate the deployment of infrastructure for their Django stack. Repeatability of deployment enables the team to have the flexibility they need to deploy in certain regions due to geographic and data sovereignty requirements.

Optimizing the architecture

The team found that simultaneous writing into two databases could cause inconsistencies if a write succeeds in one database and fails in the other. In addition, it puts the burden of identifying errors and rolling back updates on the application. Therefore, an improvement planned for this architecture is to stream successful transactions from Amazon QLDB to Amazon RDS using Amazon Kinesis Data Streams. This service provides them a way to replicate data from Amazon QLDB to Amazon RDS, and any other databases or dashboards. QLDB remains as as their System of Record.

Figure 2 - Optimized Architecture using Amazon Kinesis Data Streams

Figure 2 – Optimized Architecture using Amazon Kinesis Data Streams

Conclusion

As a result of migrating their system to the cloud, Team fEMR was able to deliver their EMR system with less operational overhead and instead focus on bringing their solution to the communities that need it.  By using Amazon QLDB, Team fEMR was able to make their solution easier to audit and enabled more trust in their work with at-risk populations.

To learn more about Team fEMR, you can read about their efforts on their organization’s website, and explore their Open Source contributions on GitHub.

For hands on experience with Amazon QLDB you can reference our QLDB Workshops and explore our QLDB Developer Guide.

Deep dive into NitroTPM and UEFI Secure Boot support in Amazon EC2

Post Syndicated from Neelay Thaker original https://aws.amazon.com/blogs/compute/deep-dive-into-nitrotpm-and-uefi-secure-boot-support-in-amazon-ec2/

Contributed by Samartha Chandrashekar, Principal Product Manager Amazon EC2

At re:Invent 2021, we announced NitroTPM, a Trusted Platform Module (TPM) 2.0 and Unified Extensible Firmware Interface (UEFI) Secure Boot support in Amazon EC2. In this blog post, we’ll share additional details on how these capabilities can help further raise the security bar of EC2 deployments.

A TPM is a security device to gather and attest system state, store and generate cryptographic data, and prove platform identity. Although TPMs are traditionally discrete chips or firmware modules, their adaptation on AWS as NitroTPM preserves their security properties without affecting the agility and scalability of EC2. NitroTPM makes it possible to use TPM-dependent applications and Operating System (OS) capabilities in EC2 instances. It conforms to the TPM 2.0 specification, which makes it easy to migrate existing on-premises workloads that use TPM functionalities to EC2.

Unified Extensible Firmware Interface (UEFI) Secure Boot is a feature of UEFI that builds on EC2’s long-standing secure boot process and provides additional defense-in-depth that helps you secure software from threats that persist across reboots. It ensures that EC2 instances run authentic software by verifying the digital signature of all boot components, and halts the boot process if signature verification fails. When used with UEFI Secure Boot, NitroTPM can verify the integrity of software that boots and runs in the EC2 instance. It can measure instance properties and components as evidence that unaltered software in the correct order was used during boot. Features such as “Measured Boot” in Windows, Linux Unified Key Setup (LUKS) and dm-verity in popular Linux distributions can use NitroTPM to further secure OS launches from malware with administrative that attempt to persist across reboots.

NitroTPM derives its root-of-trust from the Nitro Security Chip and performs the same functions as a physical/discrete TPM. Similar to discrete TPMs, an immutable private and public Endorsement Key (EK) is set up inside the NitroTPM by AWS during instance creation. NitroTPM can serve as a “root-of-trust” to verify the provenance of software in the instance (e.g., NitroTPM’s EKCert as the basis for SSL certificates). Sensitive information protected by NitroTPM is made available only if the OS has booted correctly (i.e., boot measurements match expected values). If the system is tampered, keys are not released since the TPM state is different, thereby ensuring protection from malware attempting to hijack the boot process. NitroTPM can protect volume encryption keys used by full-disk encryption utilities (such as dm-crypt and BitLocker) or private keys for certificates.

NitroTPM can be used for attestation, a process to demonstrate that an EC2 instance meets pre-defined criteria, thereby allowing you to gain confidence in its integrity. It can be used to authenticate an instance requesting access to a resource (such as a service or a database) to be contingent on its health state (e.g., patching level, presence of mandated agents, etc.). For example, a private key can be “sealed” to a list of measurements of specific programs allowed to “unseal”. This makes it suited for use cases such as digital rights management to gate LDAP login, and database access on attestation. Access to AWS Key Management Service (KMS) keys to encrypt/decrypt data accessed by the instance can be made to require affirmative attestation of instance health. Anti-malware software (e.g., Windows Defender) can initiate remediation actions if attestation fails.

NitroTPM uses Platform Configuration Registers (PCR) to store system measurements. These do not change until the next boot of the instance. PCR measurements are computed during the boot process before malware can modify system state or tamper with the measuring process. These values are compared with pre-calculated known-good values, and secrets protected by NitroTPM are released only if the sequences match. PCRs are recalculated after each reboot, which ensures protection against malware aiming to hijack the boot process or persist across reboots. For example, if malware overwrites part of the kernel, measurements change, and disk decryption keys sealed to NitroTPM are not unsealed. Trust decisions can also be made based on additional criteria such as boot integrity, patching level, etc.

The workflow below shows how UEFI Secure Boot and NitroTPM work to ensure system integrity during OS startup.

workflow

To get started, you’ll need to register an Amazon Machine Image (AMI) of an Operating System that supports TPM 2.0 and UEFI Secure Boot using the register-image primitive via the CLI, API, or console. Alternatively, you can use pre-configured AMIs from AWS for both Windows and Linux to launch EC2 instances with TPM and Secure Boot. The screenshot below shows a Windows Server 2019 instance on EC2 launched with NitroTPM using its inbox TPM 2.0 drivers to recognize a TPM device.

NitroTPM and UEFI Secure Boot enables you to further raise the bar in running their workloads in a secure and trustworthy manner. We’re excited for you to try out NitroTPM when it becomes publicly available in 2022. Contact [email protected] for additional information.

Increasing McGraw-Hill’s Application Throughput with Amazon SQS

Post Syndicated from Vikas Panghal original https://aws.amazon.com/blogs/architecture/increasing-mcgraw-hills-application-throughput-with-amazon-sqs/

This post was co-authored by Vikas Panghal, Principal Product Mgr – Tech, AWS and Nick Afshartous, Principal Data Engineer at McGraw-Hill

McGraw-Hill’s Open Learning Solutions (OL) allow instructors to create online courses using content from various sources, including digital textbooks, instructor material, open educational resources (OER), national media, YouTube videos, and interactive simulations. The integrated assessment component provides instructors and school administrators with insights into student understanding and performance.

McGraw-Hill measures OL’s performance by observing throughput, which is the amount of work done by an application in a given period. McGraw-Hill worked with AWS to ensure OL continues to run smoothly and to allow it to scale with the organization’s growth. This blog post shows how we reviewed and refined their original architecture by incorporating Amazon Simple Queue Service (Amazon SQS). to achieve better throughput and stability.

Reviewing the original Open Learning Solutions architecture

Figure 1 shows the OL original architecture, which works as follows:

  1. The application makes a REST call to DMAPI. DMAPI is an API layer over the Datamart. The call results in a row being inserted in a job requests table in Postgres.
  2. A monitoring process called Watchdog periodically checks the database for pending requests.
  3. Watchdog spins up an Apache Spark on Databricks (Spark) cluster and passes up to 10 requests.
  4. The report is processed and output to Amazon Simple Storage Service (Amazon S3).
  5. Report status is set to completed.
  6. User can view report.
  7. The Databricks clusters shut down.
Original OL architecture

Figure 1. Original OL architecture

To help isolate longer running reports, we separated requests that have up to five schools (P1) from those having more than five (P2) by allocating a different pool of clusters. Each of the two groups can have up to 70 clusters running concurrently.

Challenges with original architecture

There are several challenges inherent in this original architecture, and we concluded that this architecture will fail under heavy load.

It takes 5 minutes to spin up a Spark cluster. After processing up to 10 requests, each cluster shuts down. Pending requests are processed by new clusters. This results in many clusters continuously being cycled.

We also identified a database resource contention problem. In testing, we couldn’t process 142 reports out of 2,030 simulated reports within the allotted 4 hours. Furthermore, the architecture cannot be scaled out beyond 70 clusters for the P1 and P2 pools. This is because adding more clusters will increase the number of database connections. Other production workloads on Postgres would also be affected.

Refining the architecture with Amazon SQS

To address the challenges with the existing architecture, we rearchitected the pipeline using Amazon SQS. Figure 2 shows the revised architecture. In addition to inserting a row to the requests table, the API call now inserts the job request Id into one of the SQS queues. The corresponding SQS consumers are embedded in the Spark clusters.

New OL architecture with Amazon SQS

Figure 2. New OL architecture with Amazon SQS

The revised flow is as follows:

  1. An API request results in a job request Id being inserted into one of the queues and a row being inserted into the requests table.
  2. Watchdog monitors SQS queues.
  3. Pending requests prompt Watchdog to spin up a Spark cluster.
  4. SQS consumer consumes the messages.
  5. Report data is processed.
  6. Report files output to Amazon S3
  7. Job status is updated in the requests table.
  8. Report can be viewed in the application.

After deploying the Amazon SQS architecture, we reran the previous load of 2,030 reports with a configuration ceiling of up to five Spark clusters. This time all reports were completed within the 4-hour time limit, including the 142 reports that timed out previously. Not only did we achieve better throughput and stability, but we did so by running far fewer clusters.

Reducing the number of clusters reduced the number of concurrent database connections that access Postgres. Unlike the original architecture, we also now have room to scale by adding more clusters and consumers. Another benefit of using Amazon SQS is a more loosely coupled architecture. The Watchdog process now only prompts Spark clusters to spin up, whereas previously it had to extract and pass job requests Ids to the Spark job.

Consumer code and multi-threading

The following code snippet shows how we consumed the messages via Amazon SQS and performed concurrent processing. Messages are consumed and submitted to a thread pool that utilizes Java’s ThreadPoolExecutor for concurrent processing. The full source is located on GitHub.

/**
  * Main Consumer run loop performs the following steps:
  *   1. Consume messages
  *   2. Convert message to Task objects
  *   3. Submit tasks to the ThreadPool
  *   4. Sleep based on the configured poll interval.
  */
 def run(): Unit = {
   while (!this.shutdownFlag) {
     val receiveMessageResult = sqsClient.receiveMessage(new  
                                           ReceiveMessageRequest(queueURL)
       .withMaxNumberOfMessages(threadPoolSize))
     val messages = receiveMessageResult.getMessages
     val tasks = getTasks(messages.asScala.toList)

     threadPool.submitTasks(tasks, sqsConfig.requestTimeoutMinutes)
     Thread.sleep(sqsConfig.pollIntervalSeconds * 1000)
   }

   threadPool.shutdown()
 }

Kafka versus Amazon SQS

We also considered routing the report requests via Kafka, because Kafka is part of our analytics platform. However, Kafka is not a queue, it is a publish-subscribe streaming system with different operational semantics. Unlike queues, Kafka messages are not removed by the consumer. Publish-subscribe semantics can be useful for data processing scenarios. In other words, it can be used in cases where it’s required to reprocess data or to transform data in different ways using multiple independent consumers.

In contrast, for performing tasks, the intent is to process a message exactly once. There can be multiple consumers, and with queue semantics, the consumers work together to pull messages off the queue. Because report processing is a type of task execution, we decided that SQS queue semantics better fit the use case.

Conclusion and future work

In this blog post, we described how we reviewed and revised a report processing pipeline by incorporating Amazon SQS as a messaging layer. Embedding SQS consumers in the Spark clusters resulted in fewer clusters and more efficient cluster utilization. This, in turn, reduced the number of concurrent database connections accessing Postgres.

There are still some improvements that can be made. The DMAPI call currently inserts the report request into a queue and the database. In case of an error, it’s possible for the two to become out of sync. In the next iteration, we can have the consumer insert the request into the database. Hence, the DMAPI call would only insert the SQS message.

Also, the Java ThreadPoolExecutor API being used in the source code exhibits the slow poke problem. Because the call to submit the tasks is synchronous, it will not return until all tasks have completed. Here, any idle threads will not be utilized until the slowest task has completed. There’s an opportunity for improved throughput by using a thread pool that allows idle threads to pick up new tasks.

Ready to get started? Explore the source code illustrating how to build a multi-threaded AWS SQS consumer.

Looking for more architecture content? AWS Architecture Center provides reference architecture diagrams, vetted architecture solutions, Well-Architected best practices, patterns, icons, and more!

Ibotta builds a self-service data lake with AWS Glue

Post Syndicated from Erik Franco original https://aws.amazon.com/blogs/big-data/ibotta-builds-a-self-service-data-lake-with-aws-glue/

This is a guest post co-written by Erik Franco at Ibotta.

Ibotta is a free cash back rewards and payments app that gives consumers real cash for everyday purchases when they shop and pay through the app. Ibotta provides thousands of ways for consumers to earn cash on their purchases by partnering with more than 1,500 brands and retailers.

At Ibotta, we process terabytes of data every day. Our vision is to allow for these datasets to be easily used by data scientists, decision-makers, machine learning engineers, and business intelligence analysts to provide business insights and continually improve the consumer and saver experience. This strategy of data democratization has proven to be a key pillar in the explosive growth Ibotta has experienced in recent years.

This growth has also led us to rethink and rebuild our internal technology stacks. For example, as our datasets began to double in size every year combined with complex, nested JSON data structures, it became apparent that our data warehouse was no longer meeting the needs of our analytics teams. To solve this, Ibotta adopted a data lake solution. The data lake proved to be a huge success because it was a scalable, cost-effective solution that continued to fulfill the mission of data democratization.

The rapid growth that was the impetus for the transition to a data lake has now also forced upstream engineers to transition away from the monolith architecture to a microservice architecture. We now use event-driven microservices to build fault-tolerant and scalable systems that can react to events as they occur. For example, we have a microservice in charge of payments. Whenever a payment occurs, the service emits a PaymentCompleted event. Other services may listen to these PaymentCompleted events to trigger other actions, such as sending a thank you email.

In this post, we share how Ibotta built a self-service data lake using AWS Glue. AWS Glue is a serverless data integration service that makes it easy to discover, prepare, and combine data for analytics, machine learning, and application development.

Challenge: Fitting flexible, semi-structured schemas into relational schemas

The move to an event-driven architecture, while highly valuable, presented several challenges. Our analytics teams use these events for use cases where low-latency access to real-time data is expected, such as fraud detection. These real-time systems have fostered a new area of growth for Ibotta and complement well with our existing batch-based data lake architecture. However, this change presented two challenges:

  • Our events are semi-structured and deeply nested JSON objects that don’t translate well to relational schemas. Events are also flexible in nature. This flexibility allows our upstream engineering teams to make changes as needed and thereby allows Ibotta to move quickly in order to capitalize on market opportunities. Unfortunately, this flexibility makes it very difficult to keep schemas up to date.
  • Adding to these challenges, in the last 3 years, our analytics and platform engineering teams have doubled in size. Our data processing team, however, has stayed the same size largely due to difficulty in hiring qualified data engineers who possess specialized skills in developing scalable pipelines and industry demand. This meant that our data processing team couldn’t keep up with the requests from our analytics teams to onboard new data sources.

Solution: A self-service data lake

To solve these issues, we decided that it wasn’t enough for the data lake to provide self-service data consumption features. We also needed self-service data pipelines. These would provide both the platform engineering and analytics teams with a path to make their data available within the data lake and with minimal to no data engineering intervention necessary. The following diagram illustrates our self-service data ingestion pipeline.

The pipeline includes the following components:

  1. Ibotta data stakeholders – Our internal data stakeholders wanted the capability to automatically onboard datasets. This user base includes platform engineers, data scientists, and business analysts.
  2. Configuration file – Our data stakeholders update a YAML file with specific details on what dataset they need to onboard. Sources for these datasets include our enterprise microservices.
  3. Ibotta enterprise microservices – Microservices make up the bulk of our Ibotta platform. Many of these microservices utilize events to asynchronously communicate important information. These events are also valuable for deriving analytics insights.
  4. Amazon Kinesis – After the configuration file is updated, data is immediately streamed to Amazon Kinesis. Amazon Kinesis makes it easy to collect, process, and analyze real-time, streaming data so you can get timely insights and react quickly to new information. Streaming the data through Kinesis Data Streams and Kinesis Data Firehose gives us the flexibility to analyze the data in real time while also allowing us to store the data in Amazon Simple Storage Service (Amazon S3).
  5. Ibotta self-service data pipeline – This is the starting point of our data processing. We use Apache Airflow to orchestrate our pipelines once every hour.
  6. Amazon S3 raw data – Our data lands in Amazon S3 without any transformation. The complex nature of the JSON is retained for future processing or validation.
  7. AWS Glue – Our goal now is to take the complex nested JSON and create a simpler structure. AWS Glue provides a set of built-in transforms that we use to process this data. One of the transforms is Relationalize—an AWS Glue transform that takes semi-structured data and transforms it into a format that can be more easily analyzed by engines like Presto. This feature means that our analytics teams can continue to use the analytics engines they’re comfortable with and thereby lessen the impact of transitioning from relational data sources to semi-structured event data sources. The Relationalize function can flatten nested structures and create multiple dynamic frames. We use 80 lines of code to convert any JSON-based microservice message to a consumable table. We have provided this code base here as a reference and not for reuse.
    // Convert to a DynamicFrame and relationalize
       // Convert it back to DataFrame
       val dynamicFrame: DynamicFrame = DynamicFrame(df, glueContext)
       val dynamicFrameCollection: Seq[DynamicFrame] = dynamicFrame.relationalize(rootTableName = glueSourceTable,
         stagingPath = glueTempStorage,
         options = JsonOptions.empty)
       val relationalizedDF: Dataset[Row] = removeColumnDotNotationRelationalize(dynamicFrameCollection(0).toDF())
       // Get rid of dot-notation and repartition it
       val repartitionedDF: Dataset[Row] = relationalizedDF.repartition(finalRepartitionValue.toInt)
       // Write it out
       repartitionedDF
         .write
         .mode("overwrite")
         .option("compression", "snappy")
         .parquet(glueRelationalizeOutputS3Path)

  8. Amazon S3 curated – We then store the relationalized structures as Parquet format in Amazon S3.
  9. AWS Glue crawler – AWS Glue crawlers allow us to automatically discover schema and catalogs in the AWS Glue Data Catalog. This feature is a core component of our self-service data pipelines because it removes the requirement of having a data engineer manually create or update the schemas. Previously, if a change needed to occur, it flowed through a communication path that included platform engineers, data engineers, and analytics. AWS Glue crawlers effectively remove the data engineers from this communication path. This means new datasets or changes to datasets are made available quickly within the data lake. It also frees up our data engineers to continue working on improvements to our self-service data pipelines and other data paved roadmap features.
  10. AWS Glue Data Catalog – A common problem in growing data lakes is that the datasets can become harder and harder to work with. A common reason for this is a lack of discoverability of data within the data lake as well as a lack of clear understanding of what the datasets are conveying. The AWS Glue Catalog is a feature that works in conjunction with AWS Glue crawlers to provide data lake users with searchable metadata for different data lake datasets. As AWS Glue crawlers discover new datasets or updates, they’re recorded into the Data Catalog. You can then add descriptions at the table or fields levels for these datasets. This cuts down on the level of tribal knowledge that exists between various data lake consumers and makes it easy for these users to self-serve from the data lake.
  11. End-user data consumption – The end-users are the same as our internal stakeholders called out in Step 1.

Benefits

The AWS Glue capabilities we described make it a core component of building our self-service data pipelines. When we initially adopted AWS Glue, we saw a three-fold decrease in our OPEX costs as compared to our previous data pipelines. This was further enhanced when AWS Glue moved to per-second billing. To date, AWS Glue has allowed us to realize a five-fold decrease in OPEX costs. Also, AWS Glue requires little to no manual intervention to ingest and process our over 200 complex JSON objects. This allows Ibotta to utilize AWS Glue each day as a key component in providing actionable data to the organization’s growing analytics and platform engineering teams.

We took away the following learnings in building self-service data platforms:

Conclusion and next steps

With the self-service data lake we have established, our business teams are realizing the benefits of speed and agility. As next steps, we’re going to improve our self-service pipeline with the following features:

  • AWS Glue streaming – Use AWS Glue streaming for real-time relationalization. With AWS Glue streaming, we can simplify our self-service pipelines by potentially getting rid of our orchestration layer while also getting data into the data lake sooner.
  • Support for ACID transactions – Implement data formats in the data lake that allow for ACID transactions. A benefit of this ACID layer is the ability to merge streaming data into data lake datasets.
  • Simplify data transport layers – Unify the data transport layers between the upstream platform engineering domains and the data domain. From the time we first implemented an event-driven architecture at Ibotta to today, AWS has offered new services such as Amazon EventBridge and Amazon Managed Streaming for Apache Kafka (Amazon MSK) that have the potential to simplify certain facets of our self-service and data pipelines.

We hope that this blog post will inspire your organization to build a self-service data lake using serverless technologies to accelerate your business goals.


About the Authors

Erik Franco is a Data Architect at Ibotta and is leading Ibotta’s implementation of its next-generation data platform. Erik enjoys fishing and is an avid hiker. You can often find him hiking one of the many trails in Colorado with his lovely wife Marlene and wonderful dog Sammy.

Shiv Narayanan is Global Business Development Manager for Data Lakes and Analytics solutions at AWS. He works with AWS customers across the globe to strategize, build, develop and deploy modern data platforms. Shiv loves music, travel, food and trying out new tech.

Matt Williams is a Senior Technical Account Manager for AWS Enterprise Support. He is passionate about guiding customers on their cloud journey and building innovative solutions for complex problems. In his spare time, Matt enjoys experimenting with technology, all things outdoors, and visiting new places.

Using AWS security services to protect against, detect, and respond to the Log4j vulnerability

Post Syndicated from Marshall Jones original https://aws.amazon.com/blogs/security/using-aws-security-services-to-protect-against-detect-and-respond-to-the-log4j-vulnerability/

January 7, 2022: The blog post has been updated to include using Network ACL rules to block potential log4j-related outbound traffic.

January 4, 2022: The blog post has been updated to suggest using WAF rules when correct HTTP Host Header FQDN value is not provided in the request.

December 31, 2021: We made a minor update to the second paragraph in the Amazon Route 53 Resolver DNS Firewall section.

December 29, 2021: A paragraph under the Detect section has been added to provide guidance on validating if log4j exists in an environment.

December 23, 2021: The GuardDuty section has been updated to describe new threat labels added to specific finding to give log4j context.

December 21, 2021: The post includes more info about Route 53 Resolver DNS query logging.

December 20, 2021: The post has been updated to include Amazon Route 53 Resolver DNS Firewall info.

December 17, 2021: The post has been updated to include using Athena to query VPC flow logs.

December 16, 2021: The Respond section of the post has been updated to include IMDSv2 and container mitigation info.

This blog post was first published on December 15, 2021.


Overview

In this post we will provide guidance to help customers who are responding to the recently disclosed log4j vulnerability. This covers what you can do to limit the risk of the vulnerability, how you can try to identify if you are susceptible to the issue, and then what you can do to update your infrastructure with the appropriate patches.

The log4j vulnerability (CVE-2021-44228, CVE-2021-45046) is a critical vulnerability (CVSS 3.1 base score of 10.0) in the ubiquitous logging platform Apache Log4j. This vulnerability allows an attacker to perform a remote code execution on the vulnerable platform. Version 2 of log4j, between versions 2.0-beta-9 and 2.15.0, is affected.

The vulnerability uses the Java Naming and Directory Interface (JNDI) which is used by a Java program to find data, typically through a directory, commonly a LDAP directory in the case of this vulnerability.

Figure 1, below, highlights the log4j JNDI attack flow.

Figure 1. Log4j attack progression

Figure 1. Log4j attack progression. Source: GovCERT.ch, the Computer Emergency Response Team (GovCERT) of the Swiss government

As an immediate response, follow this blog and use the tool designed to hotpatch a running JVM using any log4j 2.0+. Steve Schmidt, Chief Information Security Officer for AWS, also discussed this hotpatch.

Protect

You can use multiple AWS services to help limit your risk/exposure from the log4j vulnerability. You can build a layered control approach, and/or pick and choose the controls identified below to help limit your exposure.

AWS WAF

Use AWS Web Application Firewall, following AWS Managed Rules for AWS WAF, to help protect your Amazon CloudFront distribution, Amazon API Gateway REST API, Application Load Balancer, or AWS AppSync GraphQL API resources.

  • AWSManagedRulesKnownBadInputsRuleSet esp. the Log4JRCE rule which helps inspects the request for the presence of the Log4j vulnerability. Example patterns include ${jndi:ldap://example.com/}.
  • AWSManagedRulesAnonymousIpList esp. the AnonymousIPList rule which helps inspect IP addresses of sources known to anonymize client information.
  • AWSManagedRulesCommonRuleSet, esp. the SizeRestrictions_BODY rule to verify that the request body size is at most 8 KB (8,192 bytes).

You should also consider implementing WAF rules that deny access, if the correct HTTP Host Header FQDN value is not provided in the request. This can help reduce the likelihood of scanners that are scanning the internet IP address space from reaching your resources protected by WAF via a request with an incorrect Host Header, like an IP address instead of an FQDN. It’s also possible to use custom Application Load Balancer listener rules to achieve this.

If you’re using AWS WAF Classic, you will need to migrate to AWS WAF or create custom regex match conditions.

Have multiple accounts? Follow these instructions to use AWS Firewall Manager to deploy AWS WAF rules centrally across your AWS organization.

Amazon Route 53 Resolver DNS Firewall

You can use Route 53 Resolver DNS Firewall, following AWS Managed Domain Lists, to help proactively protect resources with outbound public DNS resolution. We recommend associating Route 53 Resolver DNS Firewall with a rule configured to block domains on the AWSManagedDomainsMalwareDomainList, which has been updated in all supported AWS regions with domains identified as hosting malware used in conjunction with the log4j vulnerability. AWS will continue to deliver domain updates for Route 53 Resolver DNS Firewall through this list.

Also, you should consider blocking outbound port 53 to prevent the use of external untrusted DNS servers. This helps force all DNS queries through DNS Firewall and ensures DNS traffic is visible for GuardDuty inspection. Using DNS Firewall to block DNS resolution of certain country code top-level domains (ccTLD) that your VPC resources have no legitimate reason to connect out to, may also help. Examples of ccTLDs you may want to block may be included in the known log4j callback domains IOCs.

We also recommend that you enable DNS query logging, which allows you to identify and audit potentially impacted resources within your VPC, by inspecting the DNS logs for the presence of blocked outbound queries due to the log4j vulnerability, or to other known malicious destinations. DNS query logging is also useful in helping identify EC2 instances vulnerable to log4j that are responding to active log4j scans, which may be originating from malicious actors or from legitimate security researchers. In either case, instances responding to these scans potentially have the log4j vulnerability and should be addressed. GreyNoise is monitoring for log4j scans and sharing the callback domains here. Some notable domains customers may want to examine log activity for, but not necessarily block, are: *interact.sh, *leakix.net, *canarytokens.com, *dnslog.cn, *.dnsbin.net, and *cyberwar.nl. It is very likely that instances resolving these domains are vulnerable to log4j.

AWS Network Firewall

Customers can use Suricata-compatible IDS/IPS rules in AWS Network Firewall to deploy network-based detection and protection. While Suricata doesn’t have a protocol detector for LDAP, it is possible to detect these LDAP calls with Suricata. Open-source Suricata rules addressing Log4j are available from corelight, NCC Group, from ET Labs, and from CrowdStrike. These rules can help identify scanning, as well as post exploitation of the log4j vulnerability. Because there is a large amount of benign scanning happening now, we recommend customers focus their time first on potential post-exploitation activities, such as outbound LDAP traffic from their VPC to untrusted internet destinations.

We also recommend customers consider implementing outbound port/protocol enforcement rules that monitor or prevent instances of protocols like LDAP from using non-standard LDAP ports such as 53, 80, 123, and 443. Monitoring or preventing usage of port 1389 outbound may be particularly helpful in identifying systems that have been triggered by internet scanners to make command and control calls outbound. We also recommend that systems without a legitimate business need to initiate network calls out to the internet not be given that ability by default. Outbound network traffic filtering and monitoring is not only very helpful with log4j, but with identifying other classes of vulnerabilities too.

Network Access Control Lists

Customers may be able to use Network Access Control List rules (NACLs) to block some of the known log4j-related outbound ports to help limit further compromise of successfully exploited systems. We recommend customers consider blocking ports 1389, 1388, 1234, 12344, 9999, 8085, 1343 outbound. As NACLs block traffic at the subnet level, careful consideration should be given to ensure any new rules do not block legitimate communications using these outbound ports across internal subnets. Blocking ports 389 and 88 outbound can also be helpful in mitigating log4j, but those ports are commonly used for legitimate applications, especially in a Windows Active Directory environment. See the VPC flow logs section below to get details on how you can validate any ports being considered.

Use IMDSv2

Through the early days of the log4j vulnerability researchers have noted that, once a host has been compromised with the initial JDNI vulnerability, attackers sometimes try to harvest credentials from the host and send those out via some mechanism such as LDAP, HTTP, or DNS lookups. We recommend customers use IAM roles instead of long-term access keys, and not store sensitive information such as credentials in environment variables. Customers can also leverage AWS Secrets Manager to store and automatically rotate database credentials instead of storing long-term database credentials in a host’s environment variables. See prescriptive guidance here and here on how to implement Secrets Manager in your environment.

To help guard against such attacks in AWS when EC2 Roles may be in use — and to help keep all IMDS data private for that matter — customers should consider requiring the use of Instance MetaData Service version 2 (IMDSv2). Since IMDSv2 is enabled by default, you can require its use by disabling IMDSv1 (which is also enabled by default). With IMDSv2, requests are protected by an initial interaction in which the calling process must first obtain a session token with an HTTP PUT, and subsequent requests must contain the token in an HTTP header. This makes it much more difficult for attackers to harvest credentials or any other data from the IMDS. For more information about using IMDSv2, please refer to this blog and documentation. While all recent AWS SDKs and tools support IMDSv2, as with any potentially non-backwards compatible change, test this change on representative systems before deploying it broadly.

Detect

This post has covered how to potentially limit the ability to exploit this vulnerability. Next, we’ll shift our focus to which AWS services can help to detect whether this vulnerability exists in your environment.

Figure 2. Log4j finding in the Inspector console

Figure 2. Log4j finding in the Inspector console

Amazon Inspector

As shown in Figure 2, the Amazon Inspector team has created coverage for identifying the existence of this vulnerability in your Amazon EC2 instances and Amazon Elastic Container Registry Images (Amazon ECR). With the new Amazon Inspector, scanning is automated and continual. Continual scanning is driven by events such as new software packages, new instances, and new common vulnerability and exposure (CVEs) being published.

For example, once the Inspector team added support for the log4j vulnerability (CVE-2021-44228 & CVE-2021-45046), Inspector immediately began looking for this vulnerability for all supported AWS Systems Manager managed instances where Log4j was installed via OS package managers and where this package was present in Maven-compatible Amazon ECR container images. If this vulnerability is present, findings will begin appearing without any manual action. If you are using Inspector Classic, you will need to ensure you are running an assessment against all of your Amazon EC2 instances. You can follow this documentation to ensure you are creating an assessment target for all of your Amazon EC2 instances. Here are further details on container scanning updates in Amazon ECR private registries.

GuardDuty

In addition to finding the presence of this vulnerability through Inspector, the Amazon GuardDuty team has also begun adding indicators of compromise associated with exploiting the Log4j vulnerability, and will continue to do so. GuardDuty will monitor for attempts to reach known-bad IP addresses or DNS entries, and can also find post-exploit activity through anomaly-based behavioral findings. For example, if an Amazon EC2 instance starts communicating on unusual ports, GuardDuty would detect this activity and create the finding Behavior:EC2/NetworkPortUnusual. This activity is not limited to the NetworkPortUnusual finding, though. GuardDuty has a number of different findings associated with post exploit activity, such as credential compromise, that might be seen in response to a compromised AWS resource. For a list of GuardDuty findings, please refer to this GuardDuty documentation.

To further help you identify and prioritize issues related to CVE-2021-44228 and CVE-2021-45046, the GuardDuty team has added threat labels to the finding detail for the following finding types:

Backdoor:EC2/C&CActivity.B
If the IP queried is Log4j-related, then fields of the associated finding will include the following values:

  • service.additionalInfo.threatListName = Amazon
  • service.additionalInfo.threatName = Log4j Related

Backdoor:EC2/C&CActivity.B!DNS
If the domain name queried is Log4j-related, then the fields of the associated finding will include the following values:

  • service.additionalInfo.threatListName = Amazon
  • service.additionalInfo.threatName = Log4j Related

Behavior:EC2/NetworkPortUnusual
If the EC2 instance communicated on port 389 or port 1389, then the associated finding severity will be modified to High, and the finding fields will include the following value:

  • service.additionalInfo.context = Possible Log4j callback
Figure 3. GuardDuty finding with log4j threat labels

Figure 3. GuardDuty finding with log4j threat labels

Security Hub

Many customers today also use AWS Security Hub with Inspector and GuardDuty to aggregate alerts and enable automatic remediation and response. In the short term, we recommend that you use Security Hub to set up alerting through AWS Chatbot, Amazon Simple Notification Service, or a ticketing system for visibility when Inspector finds this vulnerability in your environment. In the long term, we recommend you use Security Hub to enable automatic remediation and response for security alerts when appropriate. Here are ideas on how to setup automatic remediation and response with Security Hub.

VPC flow logs

Customers can use Athena or CloudWatch Logs Insights queries against their VPC flow logs to help identify VPC resources associated with log4j post exploitation outbound network activity. Version 5 of VPC flow logs is particularly useful, because it includes the “flow-direction” field. We recommend customers start by paying special attention to outbound network calls using destination port 1389 since outbound usage of that port is less common in legitimate applications. Customers should also investigate outbound network calls using destination ports 1388, 1234, 12344, 9999, 8085, 1343, 389, and 88 to untrusted internet destination IP addresses. Free-tier IP reputation services, such as VirusTotal, GreyNoise, NOC.org, and ipinfo.io, can provide helpful insights related to public IP addresses found in the logged activity.

Note: If you have a Microsoft Active Directory environment in the captured VPC flow logs being queried, you might see false positives due to its use of port 389.

Validation with open-source tools

With the evolving nature of the different log4j vulnerabilities, it’s important to validate that upgrades, patches, and mitigations in your environment are indeed working to mitigate potential exploitation of the log4j vulnerability. You can use open-source tools, such as aws_public_ips, to get a list of all your current public IP addresses for an AWS Account, and then actively scan those IPs with log4j-scan using a DNS Canary Token to get notification of which systems still have the log4j vulnerability and can be exploited. We recommend that you run this scan periodically over the next few weeks to validate that any mitigations are still in place, and no new systems are vulnerable to the log4j issue.

Respond

The first two sections have discussed ways to help prevent potential exploitation attempts, and how to detect the presence of the vulnerability and potential exploitation attempts. In this section, we will focus on steps that you can take to mitigate this vulnerability. As we noted in the overview, the immediate response recommended is to follow this blog and use the tool designed to hotpatch a running JVM using any log4j 2.0+. Steve Schmidt, Chief Information Security Officer for AWS, also discussed this hotpatch.

Figure 4. Systems Manager Patch Manager patch baseline approving critical patches immediately

Figure 4. Systems Manager Patch Manager patch baseline approving critical patches immediately

AWS Patch Manager

If you use AWS Systems Manager Patch Manager, and you have critical patches set to install immediately in your patch baseline, your EC2 instances will already have the patch. It is important to note that you’re not done at this point. Next, you will need to update the class path wherever the library is used in your application code, to ensure you are using the most up-to-date version. You can use AWS Patch Manager to patch managed nodes in a hybrid environment. See here for further implementation details.

Container mitigation

To install the hotpatch noted in the overview onto EKS cluster worker nodes AWS has developed an RPM that performs a JVM-level hotpatch which disables JNDI lookups from the log4j2 library. The Apache Log4j2 node agent is an open-source project built by the Kubernetes team at AWS. To learn more about how to install this node agent, please visit the this Github page.

Once identified, ECR container images will need to be updated to use the patched log4j version. Downstream, you will need to ensure that any containers built with a vulnerable ECR container image are updated to use the new image as soon as possible. This can vary depending on the service you are using to deploy these images. For example, if you are using Amazon Elastic Container Service (Amazon ECS), you might want to update the service to force a new deployment, which will pull down the image using the new log4j version. Check the documentation that supports the method you use to deploy containers.

If you’re running Java-based applications on Windows containers, follow Microsoft’s guidance here.

We recommend you vend new application credentials and revoke existing credentials immediately after patching.

Mitigation strategies if you can’t upgrade

In case you either can’t upgrade to a patched version, which disables access to JDNI by default, or if you are still determining your strategy for how you are going to patch your environment, you can mitigate this vulnerability by changing your log4j configuration. To implement this mitigation in releases >=2.10, you will need to remove the JndiLookup class from the classpath: zip -q -d log4j-core-*.jar org/apache/logging/log4j/core/lookup/JndiLookup.class.

For a more comprehensive list about mitigation steps for specific versions, refer to the Apache website.

Conclusion

In this blog post, we outlined key AWS security services that enable you to adopt a layered approach to help protect against, detect, and respond to your risk from the log4j vulnerability. We urge you to continue to monitor our security bulletins; we will continue updating our bulletins with our remediation efforts for our side of the shared-responsibility model.

Given the criticality of this vulnerability, we urge you to pay close attention to the vulnerability, and appropriately prioritize implementing the controls highlighted in this blog.

If you have feedback about this post, submit comments in the Comments section below.

Want more AWS Security news? Follow us on Twitter.

Marshall Jones

Marshall is a Worldwide Security Specialist Solutions Architect at AWS. His background is in AWS consulting and security architecture, focused on a variety of security domains including edge, threat detection, and compliance. Today, he is focused on helping enterprise AWS customers adopt and operationalize AWS security services to increase security effectiveness and reduce risk.

Syed Shareef

Syed is a Senior Security Solutions Architect at AWS. He works with large financial institutions to help them achieve their business goals with AWS, whilst being compliant with regulatory and security requirements.

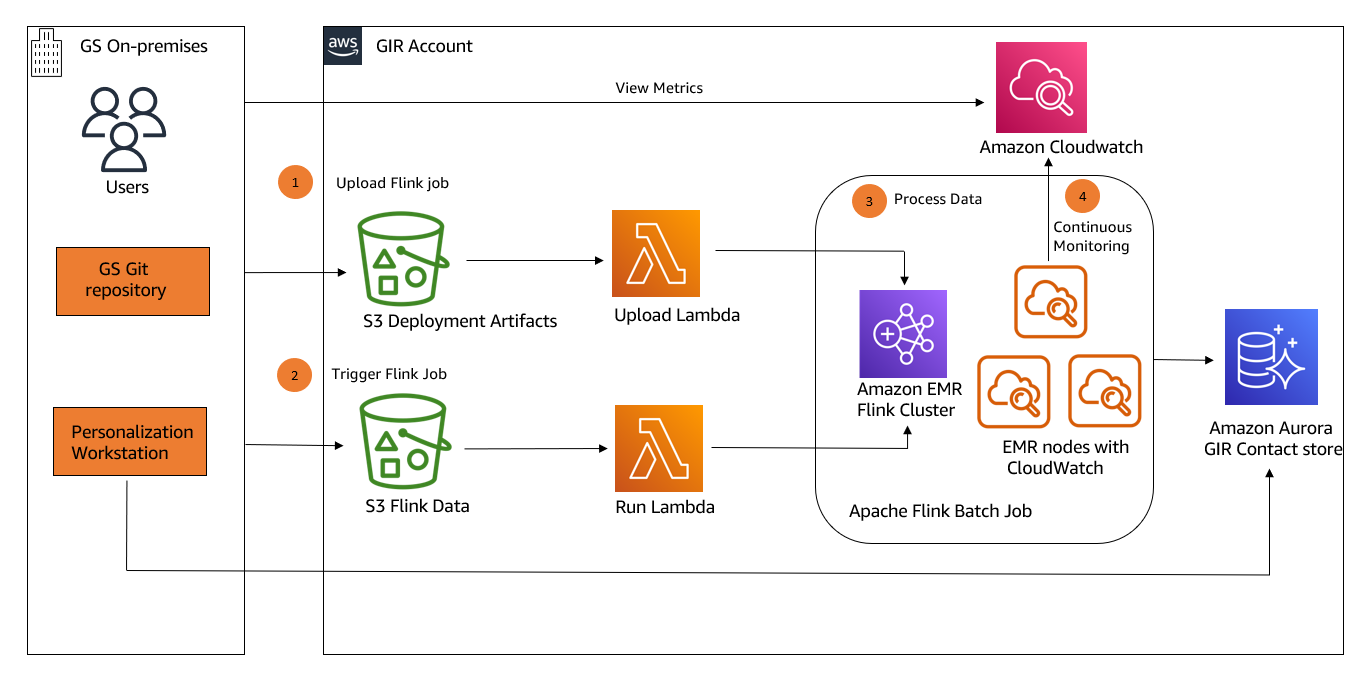
How Goldman Sachs built persona tagging using Apache Flink on Amazon EMR

Post Syndicated from Balasubramanian Sakthivel original https://aws.amazon.com/blogs/big-data/how-goldman-sachs-built-persona-tagging-using-apache-flink-on-amazon-emr/

The Global Investment Research (GIR) division at Goldman Sachs is responsible for providing research and insights to the firm’s clients in the equity, fixed income, currency, and commodities markets. One of the long-standing goals of the GIR team is to deliver a personalized experience and relevant research content to their research users. Previously, in order to customize the user experience for their various types of clients, GIR offered a few distinct editions of their research site that were provided to users based on broad criteria. However, GIR did not have any way to create a personally curated content flow at the individual user level. To provide this functionality, GIR wanted to implement a system to actively filter the content that is recommended to their users on a per-user basis, keyed on characteristics such as the user’s job title or working region. Having this kind of system in place would both improve the user experience and simplify the workflows of GIR’s research users, by reducing the amount of time and effort required to find the research content that they need.

The first step towards achieving this is to directly classify GIR’s research users based on their profiles and readership. To that end, GIR created a system to tag users with personas. Each persona represents a type or classification that individual users can be tagged with, based on certain criteria. For example, GIR has a series of personas for classifying a user’s job title, and a user tagged with the “Chief Investment Officer” persona will have different research content highlighted and have a different site experience compared to one that is tagged with the “Corporate Treasurer” persona. This persona-tagging system can both efficiently carry out the data operations required for tagging users, as well as have new personas created as needed to fit use cases as they emerge.

In this post, we look at how GIR implemented this system using Amazon EMR.

Challenge

Given the number of contacts (i.e., millions) and the growing number of publications maintained in GIR’s research data store, creating a system for classifying users and recommending content is a scalability challenge. A newly created persona could potentially apply to almost every contact, in which case a tagging operation would need to be performed on several million data entries. In general, the number of contacts, the complexity of the data stored per contact, and the amount of criteria for personalization can only increase. To future-proof their workflow, GIR needed to ensure that their solution could handle the processing of large amounts of data as an expected and frequent case.

GIR’s business goal is to support two kinds of workflows for classification criteria: ad hoc and ongoing. An ad hoc criteria causes users that currently fit the defining criteria condition to immediately get tagged with the required persona, and is meant to facilitate the one-time tagging of specific contacts. On the other hand, an ongoing criteria is a continuous process that automatically tags users with a persona if a change to their attributes causes them to fit the criteria condition. The following diagram illustrates the desired personalization flow:

In the rest of this post, we focus on the design and implementation of GIR’s ad hoc workflow.

Apache Flink on Amazon EMR

To meet GIR’s scalability demands, they determined that Amazon EMR was the best fit for their use case, being a managed big data platform meant for processing large amounts of data using open source technologies such as Apache Flink. Although GIR evaluated a few other options that addressed their scalability concerns (such as AWS Glue), GIR chose Amazon EMR for its ease of integration into their existing systems and possibility to be adapted for both batch and streaming workflows.

Apache Flink is an open source big data distributed stream and batch processing engine that efficiently processes data from continuous events. Flink offers exactly-once guarantees, high throughput and low latency, and is suited for handling massive data streams. Also, Flink provides many easy-to-use APIs and mitigates the need for the programmer to worry about failures. However, building and maintaining a pipeline based on Flink comes with operational overhead and requires considerable expertise, in addition to provisioning physical resources.

Amazon EMR empowers users to create, operate, and scale big data environments such as Apache Flink quickly and cost-effectively. We can optimize costs by using Amazon EMR managed scaling to automatically increase or decrease the cluster nodes based on workload. In GIR’s use case, their users need to be able to trigger persona-tagging operations at any time, and require a predictable completion time for their jobs. For this, GIR decided to launch a long-running cluster, which allows multiple Flink jobs to be submitted simultaneously to the same cluster.

Ad hoc persona-tagging infrastructure and workflow

The following diagram illustrates the architecture of GIR’s ad hoc persona-tagging workflow on the AWS Cloud.

This is a broad overview, and the specifics of networking and security between components are out of scope for this post.

At a high level, we can discuss GIR’s workflow in four parts:

  1. Upload the Flink job artifacts to the EMR cluster.
  2. Trigger the Flink job.
  3. Within the Flink job, transform and then store user data.
  4. Continuous monitoring.

You can interact with Flink on Amazon EMR via the Amazon EMR console or the AWS Command Line Interface (AWS CLI). After launching the cluster, GIR used the Flink API to interact with and submit work to the Flink application. The Flink API provided a bit more functionality and was much easier to invoke from an AWS Lambda application.

The end goal of the setup is to have a pipeline where GIR’s internal users can freely make requests to update contact data (which in this use case is tagging or untagging contacts with various personas), and then have the updated contact data uploaded back to the GIR contact store.

Upload the Flink job artifacts to Amazon EMR

GIR has a GitLab project on-premises for managing the contents of their Flink job. To trigger the first part of their workflow and deploy a new version of the Flink job onto the cluster, a GitLab pipeline is run that first creates a .zip file containing the Flink job JAR file, properties, and config files.

The preceding diagram depicts the sequence of events that occurs in the job upload:

  1. The GitLab pipeline is manually triggered when a new Flink job should be uploaded. This transfers the .zip file containing the Flink job to an Amazon Simple Storage Service (Amazon S3) bucket on the GIR AWS account, labeled as “S3 Deployment artifacts”.
  2. A Lambda function (“Upload Lambda”) is triggered in response to the create event from Amazon S3.
  3. The function first uploads the Flink job JAR to the Amazon EMR Flink cluster, and retrieves the application ID for the Flink session.
  4. Finally, the function uploads the application properties file to a specific S3 bucket (“S3 Flink Job Properties”).

Trigger the Flink job

The second part of the workflow handles the submission of the actual Flink job to the cluster when job requests are generated. GIR has a user-facing web app called Personalization Workbench that provides the UI for carrying out persona-tagging operations. Admins and internal Goldman Sachs users can construct requests to tag or untag contacts with personas via this web app. When a request is submitted, a data file is generated that contains the details of the request.

The steps of this workflow are as follows:

  1. Personalization Workstation submits the details of the job request to the Flink Data S3 bucket, labeled as “S3 Flink data”.
  2. A Lambda function (“Run Lambda”) is triggered in response to the create event from Amazon S3.
  3. The function first reads the job properties file uploaded in the previous step to get the Flink job ID.
  4. Finally, the function makes an API call to run the required Flink job.

Process data

Contact data is processed according to the persona-tagging requests, and the transformed data is then uploaded back to the GIR contact store.

The steps of this workflow are as follows:

  1. The Flink job first reads the application properties file that was uploaded as part of the first step.
  2. Next, it reads the data file from the second workflow that contains the contact and persona data to be updated. The job then carries out the processing for the tagging or untagging operation.
  3. The results are uploaded back to the GIR contact store.
  4. Finally, both successful and failed requests are written back to Amazon S3.

Continuous monitoring

The final part of the overall workflow involves continuous monitoring of the EMR cluster in order to ensure that GIR’s tagging workflow is stable and that the cluster is in a healthy state. To ensure that the highest level of security is maintained with their client data, GIR wanted to avoid unconstrained SSH access to their AWS resources. Being constrained from accessing the EMR cluster’s primary node directly via SSH meant that GIR initially had no visibility into the EMR primary node logs or the Flink web interface.

By default, Amazon EMR archives the log files stored on the primary node to Amazon S3 at 5-minute intervals. Because this pipeline serves as a central platform for processing many ad hoc persona-tagging requests at a time, it was crucial for GIR to build a proper continuous monitoring system that would allow them to promptly diagnose any issues with the cluster.

To accomplish this, GIR implemented two monitoring solutions:

  • GIR installed an Amazon CloudWatch agent onto every node of their EMR cluster via bootstrap actions. The CloudWatch agent collects and publishes Flink metrics to CloudWatch under a custom metric namespace, where they can be viewed on the CloudWatch console. GIR configured the CloudWatch agent configuration file to capture relevant metrics, such as CPU utilization and total running EMR instances. The result is an EMR cluster where metrics are emitted to CloudWatch at a much faster rate than waiting for periodic S3 log flushes.
  • They also enabled the Flink UI in read-only mode by fronting the cluster’s primary node with a network load balancer and establishing connectivity from the Goldman Sachs on-premises network. This change allowed GIR to gain direct visibility into the state of their running EMR cluster and in-progress jobs.

Observations, challenges faced, and lessons learned

The personalization effort marked the first-time adoption of Amazon EMR within GIR. To date, hundreds of personalization criteria have been created in GIR’s production environment. In terms of web visits and clickthrough rate, site engagement with GIR personalized content has gradually increased since the implementation of the persona-tagging system.

GIR faced a few noteworthy challenges during development, as follows:

Restrictive security group rules

By default, Amazon EMR creates its security groups with rules that are less restrictive, because Amazon EMR can’t anticipate the specific custom settings for ingress and egress rules required by individual use cases. However, proper management of the security group rules is critical to protect the pipeline and data on the cluster. GIR used custom-managed security groups for their EMR cluster nodes and included only the needed security group rules for connectivity, in order to fulfill this stricter security posture.

Custom AMI

There were challenges in ensuring that the required packages were available when using custom Amazon Linux AMIs for Amazon EMR. As part of Goldman Sachs development SDLC controls, any Amazon Elastic Compute Cloud (Amazon EC2) instances on Goldman Sachs-owned AWS accounts are required to use internal Goldman Sachs-created AMIs. When GIR began development, the only compliant AMI that was available under this control was a minimal AMI based on the publicly available Amazon Linux 2 minimal AMI (amzn2-ami-minimal*-x86_64-ebs). However, Amazon EMR recommends using the full default Amazon 2 Linux AMI because it has all the necessary packages pre-installed. This resulted in various start up errors with no clear indication of the missing libraries.

GIR worked with AWS support to identify and resolve the issue by comparing the minimal and full AMIs, and installing the 177 missing packages individually (see the appendix for the full list of packages). In addition, various AMI-related files had been set to read-only permissions by the Goldman Sachs internal AMI creation process. Restoring these permissions to full read/write access allowed GIR to successfully start up their cluster.

Stalled Flink jobs

During GIR’s initial production rollout, GIR experienced an issue where their EMR cluster failed silently and caused their Lambda functions to time out. On further debugging, GIR found this issue to be related to an Akka quarantine-after-silence timeout setting. By default, it was set to 48 hours, causing the clusters to refuse more jobs after that time. GIR found a workaround by setting the value of akka.jvm-exit-on-fatal-error to false in the Flink config file.

Conclusion

In this post, we discussed how the GIR team at Goldman Sachs set up a system using Apache Flink on Amazon EMR to carry out the tagging of users with various personas, in order to better curate content offerings for those users. We also covered some of the challenges that GIR faced with the setup of their EMR cluster. This represents an important first step in providing GIR’s users with complete personalized content curation based on their individual profiles and readership.

Acknowledgments

The authors would like to thank the following members of the AWS and GIR teams for their close collaboration and guidance on this post:

  • Elizabeth Byrnes, Managing Director, GIR
  • Moon Wang, Managing Director, GIR
  • Ankur Gurha, Vice President, GIR
  • Jeremiah O’Connor, Solutions Architect, AWS
  • Ley Nezifort, Associate, GIR
  • Shruthi Venkatraman, Analyst, GIR

About the Authors

Balasubramanian Sakthivel is a Vice President at Goldman Sachs in New York. He has more than 16 years of technology leadership experience and worked on many firmwide entitlement, authentication and personalization projects. Bala drives the Global Investment Research division’s client access and data engineering strategy, including architecture, design and practices to enable the lines of business to make informed decisions and drive value. He is an innovator as well as an expert in developing and delivering large scale distributed software that solves real world problems, with demonstrated success envisioning and implementing a broad range of highly scalable platforms, products and architecture.

Victor Gan is an Analyst at Goldman Sachs in New York. Victor joined the Global Investment Research division in 2020 after graduating from Cornell University, and has been responsible for developing and provisioning cloud infrastructure for GIR’s user entitlement systems. He is focused on learning new technologies and streamlining cloud systems deployments.

Manjula Nagineni is a Solutions Architect with AWS based in New York. She works with major Financial service institutions, architecting, and modernizing their large-scale applications while adopting AWS cloud services. She is passionate about designing big data workloads cloud-natively. She has over 20 years of IT experience in Software Development, Analytics and Architecture across multiple domains such as finance, manufacturing and telecom.


Appendix

GIR ran the following command to install the missing AMI packages:

yum install -y libevent.x86_64 python2-botocore.noarch \

device-mapper-event-libs.x86_64 bind-license.noarch libwebp.x86_64 \

sgpio.x86_64 rsync.x86_64 perl-podlators.noarch libbasicobjects.x86_64 \

langtable.noarch sssd-client.x86_64 perl-Time-Local.noarch dosfstools.x86_64 \

attr.x86_64 perl-macros.x86_64 hwdata.x86_64 gpm-libs.x86_64 libtirpc.x86_64 \

device-mapper-persistent-data.x86_64 libconfig.x86_64 setserial.x86_64 \

rdate.x86_64 bc.x86_64 amazon-ssm-agent.x86_64 virt-what.x86_64 zip.x86_64 \

lvm2-libs.x86_64 python2-futures.noarch perl-threads.x86_64 \

dmraid-events.x86_64 bridge-utils.x86_64 mdadm.x86_64 ec2-net-utils.noarch \

kbd.x86_64 libtiff.x86_64 perl-File-Path.noarch quota-nls.noarch \

libstoragemgmt-python.noarch man-pages-overrides.x86_64 python2-rsa.noarch \

perl-Pod-Usage.noarch psacct.x86_64 libnl3-cli.x86_64 \

libstoragemgmt-python-clibs.x86_64 tcp_wrappers.x86_64 yum-utils.noarch \

libaio.x86_64 mtr.x86_64 teamd.x86_64 hibagent.noarch perl-PathTools.x86_64 \

libxml2-python.x86_64 dmraid.x86_64 pm-utils.x86_64 \

amazon-linux-extras-yum-plugin.noarch strace.x86_64 bzip2.x86_64 \

perl-libs.x86_64 kbd-legacy.noarch perl-Storable.x86_64 perl-parent.noarch \

bind-utils.x86_64 libverto-libevent.x86_64 ntsysv.x86_64 yum-langpacks.noarch \

libjpeg-turbo.x86_64 plymouth-core-libs.x86_64 perl-threads-shared.x86_64 \

kernel-tools.x86_64 bind-libs-lite.x86_64 screen.x86_64 \

perl-Text-ParseWords.noarch perl-Encode.x86_64 libcollection.x86_64 \

xfsdump.x86_64 perl-Getopt-Long.noarch man-pages.noarch pciutils.x86_64 \

python2-s3transfer.noarch plymouth-scripts.x86_64 device-mapper-event.x86_64 \

json-c.x86_64 pciutils-libs.x86_64 perl-Exporter.noarch libdwarf.x86_64 \

libpath_utils.x86_64 perl.x86_64 libpciaccess.x86_64 hunspell-en-US.noarch \

nfs-utils.x86_64 tcsh.x86_64 libdrm.x86_64 awscli.noarch cryptsetup.x86_64 \

python-colorama.noarch ec2-hibinit-agent.noarch usermode.x86_64 rpcbind.x86_64 \

perl-File-Temp.noarch libnl3.x86_64 generic-logos.noarch python-kitchen.noarch \

words.noarch kbd-misc.noarch python-docutils.noarch hunspell-en.noarch \

dyninst.x86_64 perl-Filter.x86_64 libnfsidmap.x86_64 kpatch-runtime.noarch \

python-simplejson.x86_64 time.x86_64 perl-Pod-Escapes.noarch \

perl-Pod-Perldoc.noarch langtable-data.noarch vim-enhanced.x86_64 \

bind-libs.x86_64 boost-system.x86_64 jbigkit-libs.x86_64 binutils.x86_64 \

wget.x86_64 libdaemon.x86_64 ed.x86_64 at.x86_64 libref_array.x86_64 \

libstoragemgmt.x86_64 libteam.x86_64 hunspell.x86_64 python-daemon.noarch \

dmidecode.x86_64 perl-Time-HiRes.x86_64 blktrace.x86_64 bash-completion.noarch \

lvm2.x86_64 mlocate.x86_64 aws-cfn-bootstrap.noarch plymouth.x86_64 \

parted.x86_64 tcpdump.x86_64 sysstat.x86_64 vim-filesystem.noarch \

lm_sensors-libs.x86_64 hunspell-en-GB.noarch cyrus-sasl-plain.x86_64 \

perl-constant.noarch libini_config.x86_64 python-lockfile.noarch \

perl-Socket.x86_64 nano.x86_64 setuptool.x86_64 traceroute.x86_64 \

unzip.x86_64 perl-Pod-Simple.noarch langtable-python.noarch jansson.x86_64 \

pystache.noarch keyutils.x86_64 acpid.x86_64 perl-Carp.noarch GeoIP.x86_64 \

python2-dateutil.noarch systemtap-runtime.x86_64 scl-utils.x86_64 \

python2-jmespath.noarch quota.x86_64 perl-HTTP-Tiny.noarch ec2-instance-connect.noarch \

vim-common.x86_64 libsss_idmap.x86_64 libsss_nss_idmap.x86_64 \

perl-Scalar-List-Utils.x86_64 gssproxy.x86_64 lsof.x86_64 ethtool.x86_64 \

boost-date-time.x86_64 python-pillow.x86_64 boost-thread.x86_64 yajl.x86_64

ConexED uses Amazon QuickSight to empower its institutional partners by unifying and curating powerful insights using engagement data

Post Syndicated from Michael Gorham original https://aws.amazon.com/blogs/big-data/conexed-uses-amazon-quicksight-to-empower-its-institutional-partners-by-unifying-and-curating-powerful-insights-using-engagement-data/

This post was co-written with Michael Gorham, Co-Founder and CTO of ConexED.

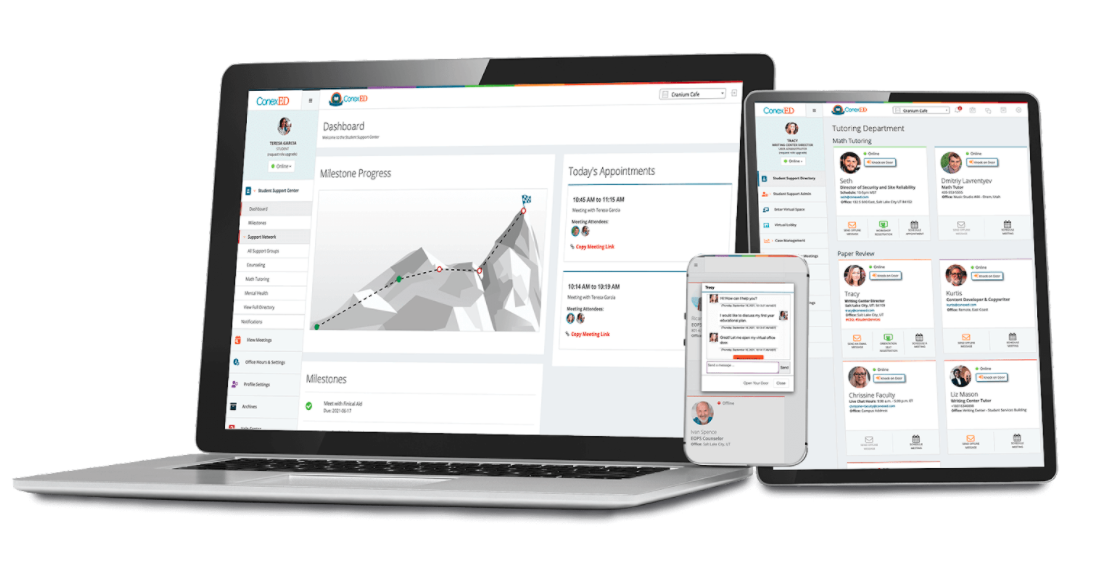
ConexED is one of the country’s fastest-growing EdTech companies designed specifically for education to enhance the student experience and elevate student success. Founded as a startup in 2008 to remove obstacles that hinder student persistence and access to student services, ConexED provides advisors, counselors, faculty, and staff in all departments across campus the tools necessary to meet students where they are.

ConexED offers a student success and case management platform, HUB Kiosk – Queuing System, and now a business intelligence (BI) dashboard powered by Amazon QuickSight to empower its institutional partners.

ConexED strives to make education more accessible by providing tools that make it easy and convenient for all students to connect with the academic support services that are vital to their success in today’s challenging and ever-evolving educational environment. ConexED’s student- and user-friendly interface makes online academic communications intuitive and as personalized as face-to-face encounters, while also making on-campus meetings as streamlined, and well reported as online meetings.

One of the biggest obstacles facing school administrators is getting meaningful data quickly so that informed, data-driven decisions can be made. Reporting can be time-consuming, so they are often generated infrequently, which leads to outdated data. In addition, reporting often lacks customization and data is typically captured in spreadsheets, which doesn’t provide a visual representation of the information that is easy to interpret. ConnexED has always offered robust reporting features, but the problem was that in providing this kind of data for our partners, our development team was spending more than half its time creating custom reporting for the constantly increasing breadth of data the ConexED system generates.

Every new feature we built requires at least two or three new reports – and therefore more of our development team’s time. After we implemented QuickSight, not only can ConexED’s development team focus all its energies on creating competitive features to accelerate the rollout of new product features, but also the reporting and data visualization are now features our customers can control and customize. QuickSight features such as drill-down filtering, predictive forecasting, and aggregation insights have given us the competitive edge that our customers expect from a modern, cloud-based solution.

New technology enables strategic planning

With QuickSight, we’re able to focus on building customer-facing solutions that capture data rather than spending a large portion of our development time solving data visualization and custom report problems. Our development team no longer has to spend its time creating reports for all the data generated, and our customers don’t need to wait. Partnering with QuickSight has enabled ConexED to develop its business intelligence dashboard, which is designed to create operational efficiencies, identify opportunities, and empower institutions by uniting critical data insights to cross-campus student support services. The QuickSight data used in ConexED’s BI dashboard analyzes collected information in real time, allowing our partners to properly project trends in the coming school year using predictive analytics to improve staff efficiency, enhance the student experience, and increase rates of retention and graduation.

The following image demonstrates heat mapping, which displays the recurring days and times when student requests for support services are most frequent, with the busiest hour segments appearing more saturated in color. This enables leadership to utilize staff efficiently so that students have the support services they need when they need it on their pathway to graduation. ConexED’s BI dashboard powered by QuickSight makes this kind of information possible so that our partners can plan strategically.

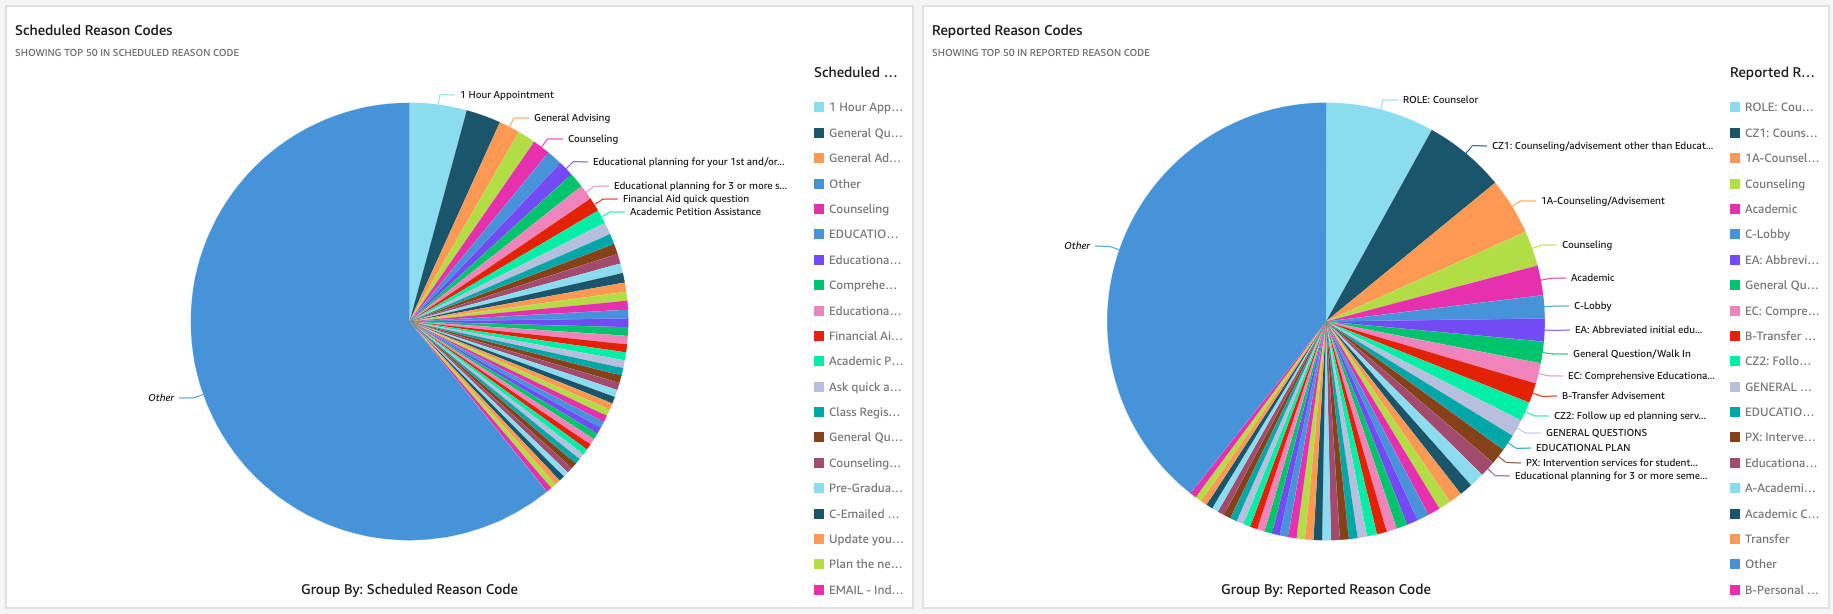
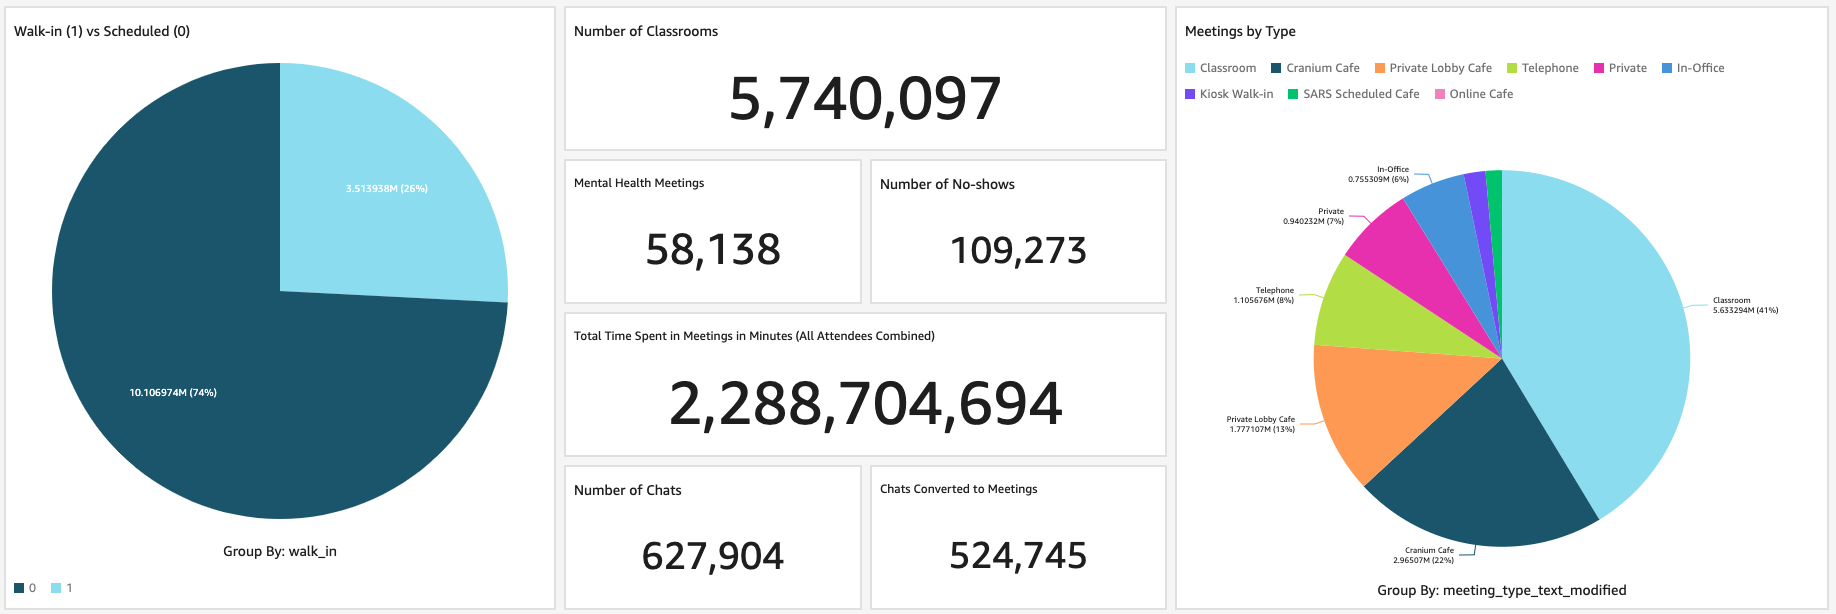
QuickSight dashboards allow our customers to drill down on the data to glean even more insights of what is happening on their campus. In the following example, the pie chart depicts a whole-campus view of meetings by department, but leadership can choose one of the colored segments to drill down further for more information about a specific department. Whatever the starting point, leadership now has the ability to access more specific, real-time data to understand what’s happening on their campus or any part of it.

Dashboards provide data visualization

Our customers have been extremely impressed with our QuickSight dashboards because they provide data visualizations that make the information easier to comprehend and parse. The dynamic, interactive nature of the dashboards allows ConexED’s partners to go deeper into the data with just a click of the mouse, which immediately generates new data based on what was clicked and therefore new visuals.

With QuickSight, not only can we programmatically display boiler-plate dashboards based on role type, but we can also allow our clients to branch off these dashboards and customize the reporting to their liking. The development team is now able to move quickly to build interesting features that ingest data and provide insightful visualizations and reports on the gathered data easily. ConexED’s BI dashboard powered by QuickSight enables leadership at our partner institutions to understand how users engage with support services on their campus – when they meet, why they meet, how they meet – so that they can make informed decisions to improve student engagement and services.

The right people with the right information

In education, giving the right level of data access to the right people is essential. With intuitive row- and column-level security and anonymous tagging in QuickSight, the ConexED development team was able to quickly build visualizations that correctly display partitioned data to thousands of different users with varying levels of access across our client base.

At ConexED, student success is paramount, and with QuickSight powering our BI dashboard, the right people get the right data, and our institutional customers can now easily analyze vast amounts of data to identify trends in student acquisition, retention, and completion rates. They can also solve student support staffing allocation problems and improve the student experience at their institutions.

QuickSight does the heavy lifting

The ability to securely pull and aggregate data from disparate sources with very little setup work has given ConexED a head start on the predictive analytics space in the EdTech market. Now building visualizations is intuitive, insightful, and fun. In fact, the development team even built in only 1 day an internal QuickSight dashboard to view our own customers’ QuickSight usage. The data visualization combinations are seemingly endless and infinitely valuable to our customers.

ConexED’s partnership with AWS has enabled us to use QuickSight to drive our BI dashboard and provide our customers with the power and information needed for today’s dynamic modern student support services teams.


About the Author

Michael Gorham is Co-Founder and CTO of ConexED. Michael is a multidisciplinary software architect with over 20 years’ experience

Open source hotpatch for Apache Log4j vulnerability

Post Syndicated from Steve Schmidt original https://aws.amazon.com/blogs/security/open-source-hotpatch-for-apache-log4j-vulnerability/

At Amazon Web Services (AWS), security remains our top priority. As we addressed the Apache Log4j vulnerability this weekend, I’m pleased to note that our team created and released a hotpatch as an interim mitigation step. This tool may help you mitigate the risk when updating is not immediately possible.

It’s important that you review, patch, or mitigate this vulnerability as soon as possible. We still recommend that you update Log4j to version 2.15 as a mitigation, but we know that can take some time, depending on your resources. To take immediate action, we recommend that you implement this newly created tool to hotpatch your Log4j deployments. A huge thanks to the Amazon Corretto team for spending days, nights, and the weekend to write, harden, and ship this code. This tool is available now at GitHub.

Caveats

As with all open source software, you’re using this at your own risk. Note that the hotpatch has been tested with JDK8 and JDK11 on Linux. On JDK17, only the static agent mode works. A full list of caveats can be found in the README.

Want more AWS Security how-to content, news, and feature announcements? Follow us on Twitter.

Steve Schmidt

Steve is Vice President and Chief Information Security Officer for AWS. His duties include leading product design, management, and engineering development efforts focused on bringing the competitive, economic, and security benefits of cloud computing to business and government customers. Prior to AWS, he had an extensive career at the Federal Bureau of Investigation, where he served as a senior executive and section chief. He currently holds 11 patents in the field of cloud security architecture. Follow Steve on Twitter.

SEEK Asia modernizes search with CI/CD and Amazon OpenSearch Service

Post Syndicated from Fabian Tan original https://aws.amazon.com/blogs/big-data/seek-asia-modernizes-search-with-ci-cd-and-amazon-opensearch-service/

This post was written in collaboration with Abdulsalam Alshallah (Salam), Software Architect, and Hans Roessler, Principal Software Engineer at SEEK Asia.

SEEK is a market leader in online employment marketplaces with deep and rich insights into the future of work. As a global business, SEEK has a presence in Australia, New Zealand, Hong Kong, Southeast Asia, Brazil and Mexico and its websites attract over 400 million visits per year. SEEK Asia’s business operates across seven countries and includes leading portal brands such as jobsdb.com and jobstreet.com and leverages data and technology to create innovative solutions for candidates and hirers.

In this post, we share how SEEK Asia modernized their search-based system with a continuous integration and continuous delivery (CI/CD) pipeline and Amazon OpenSearch Service (successor to Amazon Elasticsearch Service).

Challenges associated with a self-managed search system

SEEK Asia provides a search-based system that enables employers to manage interactions between hirers and candidates. Although the system was already on AWS, it was a self-managed system running on Amazon Elastic Compute Cloud (Amazon EC2) with limited automation.

The self-managed system posed several challenges:

  • Slower release cycles – Deploying new configurations or new field mappings into the Elasticsearch cluster was a high-risk activity because changes affected the stability of the system. The little automation on both the self-managed cluster and workflows led to slower release cycles.
  • Higher operational overhead – Sizing the cluster to deliver greater performance, while managing cost effectively, was the other challenge. As with every other distributed system, even with sizing guidance, identifying the appropriate number of shards per node and the number of nodes to meet performance requirements still required some amount of trial and error, turning the exercise into a tedious and time-consuming activity. This consequently also led to slower release cycles. To overcome this challenge, in many occasions, oversizing the cluster became the quickest way to achieve the desired time to market, at the expense of cost.

Further challenges the team faced with self-managing their own Elasticsearch cluster included keeping up with new security patches, and minor and major platform upgrades.

Automating search delivery with Amazon OpenSearch Service

SEEK Asia knew that automation would the key to solving the challenges of their existing search service. Automating the undifferentiated heavy lifting would enable them to deliver more value to their customers quickly and improve staff productivity.

With the problems defined, the team set out to solve the challenges by automating the following:

  • Search infrastructure deployment
  • Search A/B testing infrastructure deployment
  • Redeployment of search infrastructure for any new infrastructure configuration (such as security patches or platform upgrades) and index mapping updates

The key services enabling the automation would be Amazon OpenSearch Service and establishing a search infrastructure CI/CD pipeline.

Architecture overview

The following diagram illustrates the architecture of the SEEK infrastructure and CI/CD pipeline with Amazon OpenSearch Service.

The workflow includes the following steps:

  1. Before the workflow kicks off, an existing Amazon OpenSearch Service cluster with a live feeder hydrates it. The live feeder is a serverless application built on Amazon Simple Queue Service (Amazon SQS) via Amazon Simple Notification Service (Amazon SNS) and AWS Lambda. Amazon SQS queues documents for processing, Amazon SNS enables data fanout (if required), and a Lambda function is invoked to process messages in the SQS queue to import data into Amazon OpenSearch Service. The feeder receives live updates for changes that need to be reflected on the cluster. Write concurrency to Amazon OpenSearch Service is managed by limiting the number of concurrent Lambda function invocations.
  2. The Amazon OpenSearch Service index mapping is version controlled in SEEK’s Git repository. Whenever an update to the index mapping is committed, the CI/CD pipeline kicks off a new Amazon OpenSearch Service cluster provisioning workflow.
  3. As part of the workflow, a new data hydration initialization feeder is deployed. The initialization feeder construct is similar to the live feeder, with one additional component: a script that runs within the CI/CD pipeline to calculate the number of batches required to hydrate the newly provisioned Amazon OpenSearch Service cluster up to a specific timestamp. The feeder systems were designed to achieve idempotency processing. This meant unique identifiers (UIDs) from the source data stores are reused for each document, and duplicated documents update an existing document with the exact same values.
  4. At the same time as Step 3, an Amazon OpenSearch Service cluster is deployed. To accelerate the initial data hydration process temporarily, the new cluster may be sized two or three times larger against sizing guidance with shard replicas and index refresh interval disabled until the hydration process is complete. The existing Amazon OpenSearch Service cluster remains as is, which means that two clusters are running concurrently.
  5. The script inspects the number of documents the source data store has and groups the documents by batch sizes. SEEK identified that 1,000 documents per batch provided the optimal ingestion import time, after running numerous experiments.
  6. Each batch is represented as one message and is queued into Amazon SQS via Amazon SNS. Every message that lands in Amazon SQS invokes a Lambda function. The Lambda function queries a separate data store, builds the document, and loads it into Amazon OpenSearch Service. The more messages that go into the queue, the more functions are invoked. To create baselines that allowed for further indexing optimization, the team took the following configurations into consideration and reiterated to achieve higher ingestion performance:
    1. Memory of the Lambda function
    2. Size of batch
    3. Size of each document in the batch
    4. Size of cluster (memory, vCPU, and number of primary shards)
  7. With the initialization feeder running, new documents are streamed to the cluster until it is synced with the data source. Eventually, the newly provisioned Amazon OpenSearch Service cluster catches up and is in the same state as the existing cluster. The hydration is complete when there are no remaining messages in the SQS queue.
  8. The initialization feeder is deleted and the Amazon OpenSearch Service cluster is downsized automatically to complete the deployment workflow, with replica shards created and the index refresh interval configured.
  9. Live search traffic is routed to the newly provisioned cluster when A/B testing is enabled via the API layer built on Application Load Balancer, Amazon Elastic Container Service (Amazon ECS), and Amazon CloudFront. The API layer decouples the client interface from the backend implementation that runs on Amazon OpenSearch Service.

Improved time to market and other outcomes

With Amazon OpenSearch Service, SEEK was able to automate an entire cluster, complete with Kibana, in a secure, managed environment. If testing didn’t produce the desired results, the team could change the dimensions of the cluster horizontally or vertically using different instance offerings within minutes. This enabled them to perform stress tests quickly to identify the sweet spot between performance and cost of the workload.

“By integrating Amazon OpenSearch Service with our existing CI/CD tools, we’re able to fully automate our search function deployments, which accelerated software delivery time,” says Abdulsalam Alshallah, APAC Software Architect. “The newly found confidence in the modern stack, alongside improved engineering practices, allowed us to mitigate the risk of changes—improving our time to market by 89% with zero impact to uptime.”

With the adoption of Amazon OpenSearch Service, other teams also saw improvements, including the following:

  • Common Vulnerability and Exposure (CVE) has dropped to zero with Amazon OpenSearch Service handling the underlying hardware security updates on SEEK’s behalf, improving their security posture
  • Improved availability with the Amazon OpenSearch Service Availability Zone awareness feature

Conclusion

Amazon OpenSearch Service managed capabilities has helped SEEK Asia to improve customer experience with speed and automation. By removing the undifferentiated heavy lifting, teams can deploy changes quickly to their search engines, allowing customers to get the latest search features faster and ultimately contributing to the SEEK purpose of helping people live more productive working lives and organisations succeed.

To learn more about Amazon OpenSearch Service, see Amazon OpenSearch Service features, the Developer Guide, or Introducing OpenSearch.


About the Authors

Fabian Tan is a Principal Solutions Architect at Amazon Web Services. He has a strong passion for software development, databases, data analytics and machine learning. He works closely with the Malaysian developer community to help them bring their ideas to life.

Hans Roessler is a Principal Software Architect at SEEKAsia. He is excited about new technologies and upgrading legacy to newer stacks. Always staying in touch with the latest technologies is one of his passions.

Abdulsalam Alshallah (Salam) is a Software architect at SEEK, Previously a Lead Cloud Architect for SEEKAsia, Salam has always been excited about new technologies, Cloud, Serverless & DevOps, in addition to his passion of eliminating wasted time/effort & resources; He is also one of the leaders of AWS User Group Malaysia.

Lucerna Health uses Amazon QuickSight embedded analytics to help healthcare customers uncover new insights

Post Syndicated from David Atkins original https://aws.amazon.com/blogs/big-data/lucerna-health-uses-amazon-quicksight-embedded-analytics-to-help-healthcare-customers-uncover-new-insights/

This is a guest post by Lucerna Health. Founded in 2018, Lucerna Health is a data technology company that connects people and data to deliver value-based care (VBC) results and operational transformation.

At Lucerna Health, data is at the heart of our business. Every day, we use clinical, sales, and operational data to help healthcare providers and payers grow and succeed in the value-based care (VBC) environment. Through our HITRUST CSF® certified Healthcare Data Platform, we support payer-provider integration, health engagement, database marketing, and VBC operations.

As our business grew, we found that faster real-time analysis and reporting capabilities through our platform were critical to success. However, that was a challenge for our data analytics team, which was busier than ever developing our proprietary data engine and data model. No matter how many dashboards we built, we knew we could never keep up with user demand with our previous BI solutions. We needed a more scalable technology that could grow as our customer base continued to expand.

In this post, we will outline how Amazon QuickSight helped us overcome these challenges.

Embedding analytics with QuickSight

We had a rising demand for business intelligence (BI) from our customers, and we needed a better tool to help us keep pace that met our security requirements and was part of a comprehensive business associate contract (BAA) and met HIPAA and other privacy standards. We were using several other BI solutions internally for impromptu analysis and reporting, but we realized we needed a fully embedded solution to provide more automation and an integrated experience within our Healthcare Data Platform. After trying out a different solution, we discovered it wasn’t cost-effective for us. That’s when we turned our attention to AWS.

Three years ago, we decided to go all-in on AWS, implementing a range of AWS services for compute, storage, and networking. Today, each of the building blocks we have in our IT infrastructure run on AWS. For example, we use Amazon Redshift, AWS Glue, and Amazon EMR for our Spark data pipelines, data lake, and data analytics. Because of our all-in approach, we were pleased to find that AWS had a BI platform called QuickSight. QuickSight is a powerful and cost-effective BI service that offers a strong feature set including self-service BI capabilities and interactive dashboards, and we liked the idea of continuing to be all-in on AWS by implementing this service.

One of the QuickSight’s features we were most excited about was its ability to embed analytics deep within our Healthcare Data Platform. With this solution’s embedded analytics software, we were able to integrate QuickSight dashboards directly into our own platform. For example, we offer our customers a portal where they can register a new analytical dashboard through our user interface. That interface connects to the QuickSight application programming interface (API) to enable embedding in a highly configurable and secure way.

With this functionality, our customers can ingest and visualize complex healthcare data, such as clinical data from electronic medical record (EMR) systems, eligibility and claims, CRM and digital interactions data. Our Insights data model is projected into Quicksight’s high performance in memory calculation engine enabling high performance analysis on massive datasets.

Creating a developer experience for customers

We have also embedded the QuickSight console into our platform. Through this approach, our healthcare data customers can build their own datasets and quickly share that data with a wider group of users through our platform. This gives our customers a developer experience that enables them to customize and share analytical reports with their colleagues. With only a few clicks, users can aggregate and compare data from their sales and EMR solutions.

QuickSight has also improved collaboration for our own teams when it comes to custom reports. In the past, teams could only do monthly or specialized reports, spending a lot of time building them, downloading them as PDFs, and sending them out to clients as slides. It was a time-consuming and inefficient way to share data. Now, our users can get easy access to data from previously siloed sources, and then simply publish reports and share access to that data immediately.

Helping healthcare providers uncover new insights

Because healthcare providers now have centralized data at their fingertips, they can make faster and more strategic decisions. For instance, management teams can look at dashboards on our platform to see updated demand data to plan more accurate staffing models. We’ve also created patient and provider data models that provide a 360-degree view of patient and payer data, increasing visibility. Additionally, care coordinators can reprioritize tasks and take action if necessary because they can view gaps in care through the dashboards. Armed with this data, care coordinators can work to improve the patient experience at the point of care.

Building and publishing reports twice as fast

QuickSight is a faster BI solution than anything we’ve used before. We can now craft a new dataset, apply permissions to it, build out an analysis, and publish and share it in a report twice as fast as we could before. The solution also gives our developers a better overall experience. For rapid development and deployment at scale, QuickSight performs extremely well at a very competitive price.

Because QuickSight is a serverless solution, we no longer need to worry about our BI overhead. With our previous solution, we had a lot of infrastructure, maintenance, and licensing costs. We have eliminated those challenges by implementing QuickSight. This is a key benefit because we’re an early stage company and our lean product development team can now focus on innovation instead of spinning up servers.

As our platform has become more sophisticated over the past few years, QuickSight has introduced vast number of great features for data catalog management, security, ML integrations, and look/feel that has really improved on our original solution’s BI capabilities. We look forward to continuing to use this powerful tool to help our customers get more out of their data.


About the Authors

David Atkins is the Co-Founder & Chief Operating Officer at Lucerna Health. Before co-founding Lucnera Health in 2018, David held multiple leadership roles in healthcare organizations, including spending six years at Centen Corporation as the Corporate Vice President of Enterprise Data and Analytic Solutions. Additionally, he served as the Provider Network Management Director at Anthem. When he isn’t spending time with his family, he can be found on the ski slopes or admiring his motorcycle, which he never rides.

Adriana Murillo is the Co-Founder & Chief Marketing Officer at Lucerna Health. Adriana has been involved in the healthcare industry for nearly 20 years. Before co-founding Lucerna Health, she founded Andes Unite, a marketing firm primarily serving healthcare provider organizations and health insurance plans. In addition, Adriana held leadership roles across market segment leadership, product development, and multicultural marketing at not-for-profit health solutions company Florida Blue. Adriana is a passionate cook who loves creating recipes and cooking for her family.

How to automate AWS Managed Microsoft AD scaling based on utilization metrics

Post Syndicated from Dennis Rothmel original https://aws.amazon.com/blogs/security/how-to-automate-aws-managed-microsoft-ad-scaling-based-on-utilization-metrics/

AWS Directory Service for Microsoft Active Directory (AWS Managed Microsoft AD), provides a fully managed service for Microsoft Active Directory (AD) in the AWS cloud. When you create your directory, AWS deploys two domain controllers in separate Availability Zones that are exclusively yours for high availability. For use cases requiring even higher resilience and performance, in a specific Region or during specific hours, AWS Managed Microsoft AD allows you to scale by deploying additional domain controllers to meet your needs. These domain controllers can help load-balance, increase overall performance, or simply provide additional nodes to protect against temporary availability issues. AWS Managed Microsoft AD allows you to define the correct number of domain controllers for your directory based on your individual use case.

This post will walk you through how to automate scaling in AWS Managed Microsoft AD using utilization metrics from your directory. You’ll do this using Amazon CloudWatch Alarms, SNS notifications, and a Lambda function to increase the number of domain controllers in your directory based on utilization peaks.

Simplified directory scaling

AWS Managed Microsoft AD has now simplified this directory scaling process by integrating with Amazon CloudWatch metrics. This new integration enables you to:

  1. Analyze your directory to identify expected average and peak directory utilization
  2. Scale your directory based on utilization data to adequately address the expected load
  3. Automate the addition of domain controllers to handle unexpected load.

Integration is available for both domain controller utilization metrics such as CPU, Memory, Disk and Network, and for AD-specific metrics, such as LDAP searches, binds, DNS queries, and Directory reads/writes. Analyzing this data over time to identify expected average and peak utilization on your directory can help you deploy additional domain controllers in Regions that need them. Once you’ve established this utilization baseline, you can deploy additional domain controllers to service this load, and configure alarms for anything exceeding this baseline.

Solution overview

In this example, our AWS Managed Microsoft AD has the default two domain controllers; once your utilization threshold is reached, you’ll add one additional domain controller (domain controller 3 in the diagram) to cover this additional load. 

Figure 1: Solution overview

Figure 1: Solution overview

To create a CloudWatch Alarm with SNS topic notifications

  1. In the AWS Console, navigate to CloudWatch
  2. Choose Metrics to see the Browse Metrics panel
  3. Choose the Directory Service namespace, then choose AWS Managed Microsoft AD.
  4. In the Directory ID column, select your directory and check search for this only.
  5. From the Metric Category column, select Processor from Metric Category and check add to search. This view will show the processor utilization for your directory.
  6.  

    Figure 2. Processor utilization metrics

    Figure 2. Processor utilization metrics

  7. To see the average utilization across all domain controllers, choose Add Math, then All Functions, then AVG to create a metric math expression for average CPU utilization across all domain controllers.
  8.  

    Figure 3. Adding a math function to compute average

    Figure 3. Adding a math function to compute average

  9. Next, choose the Graphed Metrics tab in the CloudWatch metrics console, select the newly created expression, then select the bell icon from the Actions column to create a CloudWatch alarm based on this metric.
  10. Figure 4. Create a CloudWatch Alarm using Metric Math Expression

    Figure 4. Create a CloudWatch Alarm using Metric Math Expression

  11. Configure the threshold alarm to trigger when CPU utilization exceeds 70%.
  12.  In the Metrics section, under Period, choose 1 Hour.
     In the Conditions section, under Threshold Type, choose Static. Under Define the alarm condition, choose Greater than threshold. Under Define the threshold value, enter 70. See Figure 5 for an image of how alarm parameters should look on your screen. Choose Next to Configure actions. 

    Figure 5. Configure the alarm parameters

    Figure 5. Configure the alarm parameters

  13. On the Configure actions screen, configure the actions using the parameters listed below to send an email notification when the alarm state is triggered. See Figure 6 for an image of how email notifications are configured.
  14.   In the Notification section, set Alarm state trigger to In alarm.   Set Select an SNS topic to Create topic.  Fill in the name of the alarm in the Create a new topic field, and add the email where notifications should be sent to the Email endpoints that will receive notification field. An email address is required to create the SNS topic and you should use an email address that’s accessible by your operations team. This SNS topic will be used to trigger the Lambda automation described in a later section. Note: make a note of the SNS topic name you chose; you will use it later when creating the Lambda function in the To create an AWS Lambda function to automate scale out procedure below. 

    Figure 6. Create SNS topic and email notification

    Figure 6. Create SNS topic and email notification

  15. In the Alarm name field, provide a name for the alarm. You can optionally also add an Alarm description. Choose Next.
  16. Review your configuration, and choose Create alarm to create the alarm.

Once you’ve completed these steps, you will now have an alarm implemented for when domain controller CPU utilization exceeds an average of 70% across both domain controllers. This will trigger an SNS topic when your directory is experiencing a heavy load, which will be used to start the Lambda automation and will send an informational email notification. In the next section, we’ll configure an AWS Lambda function to automate the addition of a domain controller based on this SNS topic.

For additional details on CloudWatch Alarms, please see the Amazon CloudWatch documentation.

To create an AWS Lambda function to automate scale out

The sample Lambda function shown below checks the number of domain controllers in this Region, and increases that by adding one additional domain controller. This procedure describes how to configure the IAM role required for this Lambda function, then how to deploy the Lambda function to execute when the alarm is triggered to automatically add a domain controller when your load exceeds your typical usage baseline.

Note: For additional details on Lambda creation, please see the AWS Lambda documentation.

To automate scale-out using AWS Lambda

  1. In the AWS Console, navigate to IAM and choose Policies, then choose Create Policy.
  2. Choose the JSON tab, and create a new IAM role using the policy provided in JSON below.
  3. For more details on this configuration, see the AWS Directory Service documentation.

    Sample policy


    {
    	"Version":"2012-10-17",
    	"Statement":[
    	{
    		"Effect":"Allow",
    		"Action":[
    			"ds:DescribeDomainControllers",
    			"ds:UpdateNumberOfDomainControllers",
    			"ec2:DescribeSubnets",
    			"ec2:DescribeVpcs",
    			"ec2:CreateNetworkInterface",
    			"ec2:DescribeNetworkInterfaces",
    			"ec2:DeleteNetworkInterface"
    		],
    		"Resource":"*"
    	}
    	]
    }
    

  4. Choose Next:Tags to add tags (optional) before choosing Next:Review.
  5. On the Create Policy screen, provide a name in the Name field. You can optionally also add a description. Choose Create policy to complete creating the new policy.
  6.  
    Note: make a note of the policy name you chose; you will use it later when updating the execution role for the Lambda function.  

    Figure 7. Provide a name to create the IAM policy

    Figure 7. Provide a name to create the IAM policy

  7. In the AWS Console, navigate to Lambda and choose Create Function
  8. On the Create Function screen, select Author from Scratch and provide a Name, then choose Create Function.
  9. Figure 8. Create a Lambda function

    Figure 8. Create a Lambda function

  10. Once created, on the Lambda function’s page, choose the Configuration tab, then choose Permissions from the sidebar and choose the execution role name linked under Role name. This will open the IAM console in another tab, preloaded to your Lambda execution role.
  11.  

    Figure 9: Select the Execution Role

    Figure 9: Select the Execution Role

  12. On the execution role screen, choose Attach policies and select the IAM policy you’ve just created (e.g. DirectoryService-DCNumber Update). On the Attach Permissions screen, choose Attach policy to complete updating the execution role. Once completed this step, you may close this tab and return the previous browser tab.
  13.  

    Figure 10. Select and attach the IAM policy

    Figure 10. Select and attach the IAM policy

  14. On the Lambda function screen, choose the Configuration tab, then choose Triggers from the sidebar.
  15. On the Add Trigger screen, choose the pulldown under Trigger configuration and select SNS. On the SNS topic box, select the SNS topic you created in Step 9 of the To create a CloudWatch Alarm with SNS topic notifications procedure above. Then choose Add to complete the trigger configuration.
  16. On the Lambda function screen, choose the Configuration tab, then choose Environment variables from the sidebar.
  17. On the Environment variables card, click Edit.
  18. On the Edit environment variables screen, choose Add environment variables and use the Key “DIRECTORY_ID” and the Value will be the directory ID for you AWS Managed Microsoft AD.
  19.  

    Figure 11. The "Edit environment variables" screen

    Figure 11. The “Edit environment variables” screen

  20. On the Lambda function screen, choose the Code tab to open the in-browser code editor experience inside the Code source card. Paste in the sample Lambda function code given below to complete the implementation.
  21.  

    Figure 12. Paste sample code to complete the Lambda function setup

    Figure 12. Paste sample code to complete the Lambda function setup

Sample Lambda function code

The sample Lambda function given below automates adding another domain controller to your directory. When your CloudWatch alarm triggers, you will receive a notification email, and an additional domain controller will be deployed to provide the added capacity to support the increase in directory usage.

Note: The example code contains a variable for the maximum number of domain controllers (maxDcNum), to prevent you from over provisioning in the event of a missed configuration. This value is set to 3 for this blog post’s example and can be increased to suit your use case. 

import json
import boto3

maxDcNum = 10
minDcNum = 2
region   = "us-east-1"
dsId = "d-906752246f"

ds = boto3.client('ds', region_name=region)

def lambda_handler(event, context):
    
    ## get the current number of domain controllers
    dcs = ds.describe_domain_controllers(DirectoryId = dsId)

    DomainControllers = dcs["DomainControllers"]
    
    DCcount = len(DomainControllers)
    print(">>> Current number of DCs:" + str(DCcount))

    #increase the number of DCs
    if DCcount < maxDcNum:
        NewDCnumber = DCcount + 1 
        response = ds.update_number_of_domain_controllers(DirectoryId = dsId, DesiredNumber =  NewDCnumber);    

        return {
            'statusCode': 200,
            'body': json.dumps("New DC number will be " + str(NewDCnumber))
        }
    else:
        return {
            'statusCode': 200,
            'body': json.dumps("Max number of DCs reached. The number of DCs is" + str(DCcount))
        }

Note: When testing this Lambda function, remember that this will increase the number of domain controllers for your directory in that Region. If the additional domain controller is not needed, please reduce the count after the test to avoid costs for an additional domain controller. The same principles used in this article to automate the addition of domain controllers can be applied to automate the reduction of domain controllers and you should consider automating the reduction to optimize for resilience, performance and cost.

Conclusion

In this post, you’ve implemented alarms based on thresholds in Domain Controller utilization using AWS CloudWatch and automation to increase the number of domain controllers using AWS Lambda functions. This solution helps to cost-effectively improve resilience and performance of your directory, by scaling your directory based on historical load patterns.

To learn more about using AWS Managed Microsoft AD, visit the AWS Directory Service documentation. For general information and pricing, see the AWS Directory Service home page. If you have comments about this blog post, submit a comment in the Comments section below. If you have implementation or troubleshooting questions, start a new thread on the Directory Service forum or contact AWS Support.

Want more AWS Security news? Follow us on Twitter.

Author

Dennis Rothmel

Dennis is a Sr. Product Manager from AWS Identity with a passion for modernization and automation. He has worked globally across Asia Pacific, Europe, and America, and enjoys the travel, languages, cultures and foods that come with global working.

Author

Vladimir Provorov

Vladimir is a Product Solutions Architect from AWS Identity focused on Workforce Identity and Directory Service. He works on developing new features to make Enterprise Identity simpler and more scalable. He is excited to travel and explore the world with his family.

Accelo uses Amazon QuickSight to accelerate time to value in delivering embedded analytics to professional services businesses

Post Syndicated from Mahlon Duke original https://aws.amazon.com/blogs/big-data/accelo-uses-amazon-quicksight-to-accelerate-time-to-value-in-delivering-embedded-analytics-to-professional-services-businesses/

This is a guest post by Accelo. In their own words, “Accelo is the leading cloud-based platform for managing client work, from prospect to payment, for professional services companies. Each month, tens of thousands of Accelo users across 43 countries create more than 3 million activities, log 1.2 million hours of work, and generate over $140 million in invoices.”

Imagine driving a car with a blacked-out windshield. It sounds terrifying, but it’s the way things are for most small businesses. While they look into the rear-view mirror to see where they’ve been, they lack visibility into what’s ahead of them. The lack of real-time data and reliable forecasts leaves critical decisions like investment, hiring, and resourcing to “gut feel.” An industry survey conducted by Accelo shows 67% of senior leaders don’t have visibility into team utilization, and 54% of them can’t track client project budgets, much less profitability.

Professional services businesses generate most of their revenue directly from billable work they do for clients every day. Because no two clients, projects, or team members are the same, real-time and actionable insight is paramount to ensure happy clients and a successful, profitable business. A big part of the problem is that many businesses are trying to manage their client work with a cocktail of different, disconnected systems. No wonder KPMG found that 56% of CEOs have little confidence in the integrity of the data they’re using for decision-making.

Accelo’s mission is to solve this problem by giving businesses an integrated system to manage all their client work, from prospect to payment. By combining what have historically been disparate parts of the business—CRM, sales, project management, time tracking, client support, and billing—Accelo becomes the single source of truth for your business’s most important data.

Even with a trustworthy, automated and integrated system, decision makers still need to harness the data so they see what’s in front of them and can anticipate for the future. Accelo devoted all our resources and expertise to building a complete client work management platform, made up of essential products to achieve the greatest profitability. We recognized that in order to make the platform most effective, users needed to be empowered with the strongest analytics and actionable insights for strategic decision making. This drove us to seek out a leading BI solution that could seamlessly integrate with our platform and create the greatest user experience. Our objective was to ensure that Accelo users had access to the best BI tool without requiring them to spend more of their valuable time learning yet another tool – not to mention another login. We needed a powerful embedded analytics solution.

We evaluated dozens of leading BI and embedded reporting solutions, and Amazon QuickSight was the clear winner. In this post, we discuss why, and how QuickSight accelerated our time to value in delivering embedded analytics to our users.

Data drives insights

Even today, many organizations track their work manually. They extract data from different systems that don’t talk to each other, and manually manipulate it in spreadsheets, which wastes time and introduces the kinds of data integrity problems that cause CEOs to lose their confidence. As companies grow, these manual and error-prone approaches don’t scale with them, and the sheer level of effort required to keep data up to date can easily result in leaders just giving up.

With this in mind, Accelo’s embedded analytics solution was built from the ground up to grow with us and with our users. As a part of the AWS family, QuickSight eliminated one of the biggest hurdles for embedded analytics through its SPICE storage system. SPICE enables us to create unlimited, purpose-built datasets that are hosted in Amazon’s dynamic storage infrastructure. These smaller datasets load more quickly than your typical monolithic database, and can be updated as often as we need, all at an affordable per-gigabyte rate. This allows us to provide real-time analytics to our users swiftly, accurately, and economically.

“Being able to rely on Accelo to tell us everything about our projects saves us a lot of time, instead of having to go in and download a lot of information to create a spreadsheet to do any kind of analysis,” says Katherine Jonelis, Director of Operations, MHA Consulting. “My boss loves the dashboards. He loves just being able to look at that and instantly know, ‘Here’s where we are.’”

In addition to powering analytics for our users, QuickSight also helps our internal teams identify and track vital KPIs, which historically has been done via third-party apps. These metrics can cover anything, from calculating the effective billable rate across hundreds of projects and thousands of time entries, to determining how much time is left for the team to finish their tasks profitably and on budget. Because the reports are embedded directly in Accelo, which already houses all the data, it was easy for our team to adapt to the new reports and require minimal training.

Integrated vs. embedded

One of the most important factors in our evaluation of BI platforms was the time to value. We asked ourselves two questions: How long would it take to have the solution up and running, and how long would it take for our users to see value from it?

While there are plenty of powerful third-party, integrated BI products out there, they often require a complete integration, adding authentication and configuration on top of basic data extraction and transformations. This makes them an unattractive option, especially in an increasingly security-focused landscape. Meanwhile, most of the embedded products we evaluated required a time to launch that numbered in the months—spending time on infrastructure, data sources, and more. And that’s without considering the infrastructure and engineering costs of ongoing maintenance. One key benefit that propels QuickSight above other products is that it allowed us to reduce that setup time from months to weeks, and completely eliminated any configuration work for the end-user. This is possible thanks to built-in tools like native connections for AWS data sources, row-level security for datasets, and a simple user provisioning process.

Developer hours can be expensive, and are always in high demand. Even in a responsive and agile development environment like Accelo’s, development work still requires lead time before it can be scheduled and completed. Engineering resources are also finite—if they’re working on one thing today, something else is probably going into the backlog. QuickSight enables us to eliminate this bottleneck by shifting the task of managing these analytics from developers to data analysts. We used QuickSight to easily create datasets and reports, and placed a simple API call to embed them for our clients so they can start using them instantly. Now we’re able to quickly respond to our users’ ever-changing needs without requiring developers. That further improves the speed and quality of our data by using both the analysts’ general expertise with data visualization and their unique knowledge of Accelo’s schema. Today, all of Accelo’s reports are created and deployed through QuickSight. We’re able to accommodate dozens of custom requests each month for improvements—major and minor—without ever needing to involve a developer.

Implementation and training were also key considerations during our evaluation. Our customers are busy running their businesses. The last thing they want is to get trained on a new tool, not to mention the typically high cost associated with implementation. As a turnkey solution that requires no configuration and minimal education, QuickSight was the clear winner.

Delivering value in an agile environment

It’s no secret that employees dislike timesheets and would rather spend time working with their clients. For many services companies, logged time is how they bill their clients and get paid. Therefore, it’s vital that employees log all their hours. To make that process as painless as possible, Accelo offers several tools that minimize the amount of work it takes an employee to log their time. For example, the Auto Scheduling tool automatically builds out employees’ schedules based on the work they’re assigned, and logs their time with a single click. Inevitably, however, someone always forgets to log their time, leading to lost revenue.

To address this issue, Accelo built the Missing Time report, which pulls hundreds of thousands of time entries, complex work schedules, and even holiday and PTO time together to offer answers to these questions: Who hasn’t logged their time? How much time is missing? And from what time period?

Every business needs to know whether they’re profitable. Professional services businesses are unique in that profitability is tied directly to their individual clients and the relationships with them. Some clients may generate high revenues but require so much extra maintenance that they become unprofitable. On the other hand, low-profile clients that don’t require a lot of attention can significantly contribute to the business’s bottom line. By having all the client data under one roof, these centralized and embedded reports can provide visibility into your budgets, time entries, work status, and team utilization. This makes it possible to make real-time, data-driven actions without having to spend all day to get the data.

Summary

Clean and holistic data fosters deep insights that can lead to higher margins and profits. We’re excited to partner with AWS and QuickSight to provide professional services businesses with real-time insights into their operations so they can become truly data driven, effortlessly. Learn more about Accelo, and Amazon QuickSight Embedded Analytics!


About the Authors

Mahlon Duke, Accelo Product Manager of BI and Data.

Geoff McQueen, Accelo Founder and CEO.

How GE Aviation built cloud-native data pipelines at enterprise scale using the AWS platform

Post Syndicated from Alcuin Weidus original https://aws.amazon.com/blogs/big-data/how-ge-aviation-built-cloud-native-data-pipelines-at-enterprise-scale-using-the-aws-platform/

This post was co-written with Alcuin Weidus, Principal Architect from GE Aviation.

GE Aviation, an operating unit of GE, is a world-leading provider of jet and turboprop engines, as well as integrated systems for commercial, military, business, and general aviation aircraft. GE Aviation has a global service network to support these offerings.

From the turbosupercharger to the world’s most powerful commercial jet engine, GE’s history of powering the world’s aircraft features more than 90 years of innovation.

In this post, we share how GE Aviation built cloud-native data pipelines at enterprise scale using the AWS platform.

A focus on the foundation

At GE Aviation, we’ve been invested in the data space for many years. Witnessing the customer value and business insights that could be extracted from data at scale has propelled us forward. We’re always looking for new ways to evolve, grow, and modernize our data and analytics stack. In 2019, this meant moving from a traditional on-premises data footprint (with some specialized AWS use cases) to a fully AWS Cloud-native design. We understood the task was challenging, but we were committed to its success. We saw the tremendous potential in AWS, and were eager to partner closely with a company that has over a decade of cloud experience.

Our goal from the outset was clear: build an enterprise-scale data platform to accelerate and connect the business. Using the best of cloud technology would set us up to deliver on our goal and prioritize performance and reliability in the process. From an early point in the build, we knew that if we wanted to achieve true scale, we had to start with solid foundations. This meant first focusing on our data pipelines and storage layer, which serve as the ingest point for hundreds of source systems. Our team chose Amazon Simple Storage Service (Amazon S3) as our foundational data lake storage platform.

Amazon S3 was the first choice as it provides an optimal foundation for a data lake store delivering virtually unlimited scalability and 11 9s of durability. In addition to its scalable performance, it has ease-of-use features, native encryption, and access control capabilities. Equally important, Amazon S3 integrates with a broad portfolio of AWS services, such as Amazon Athena, the AWS Glue Data Catalog, AWS Glue ETL (extract, transform, and load) Amazon Redshift, Amazon Redshift Spectrum, and many third-party tools, providing a growing ecosystem of data management tools.

How we started

The journey started with an internal hackathon that brought cross-functional team members together. We organized around an initial design and established an architecture to start the build using serverless patterns. A combination of Amazon S3, AWS Glue ETL, and the Data Catalog were central to our solution. These three services in particular aligned to our broader strategy to be serverless wherever possible and build on top of AWS services that were experiencing heavy innovation in the way of new features.

We felt good about our approach and promptly got to work.

Solution overview

Our cloud data platform built on Amazon S3 is fed from a combination of enterprise ELT systems. We have an on-premises system that handles change data capture (CDC) workloads and another that works more in a traditional batch manner.

Our design has the on-premises ELT systems dropping files into an S3 bucket set up to receive raw data for both situations. We made the decision to standardize our processed data layer into Apache Parquet format for our cataloged S3 data lake in preparation for more efficient serverless consumption.

Our enterprise CDC system can already land files natively in Parquet; however, our batch files are limited to CSV, so the landing of CSV files triggers another serverless process to convert these files to Parquet using AWS Glue ETL.

The following diagram illustrates this workflow.

When raw data is present and ready in Apache Parquet format, we have an event-triggered solution that processes the data and loads it to another mirror S3 bucket (this is where our users access and consume the data).

Pipelines are developed to support loading at a table level. We have specific AWS Lambda functions to identify schema errors by comparing each file’s schema against the last successful run. Another function validates that a necessary primary key file is present for any CDC tables.

Data partitioning and CDC updates

When our preprocessing Lambda functions are complete, the files are processed in one of two distinct paths based on the table type. Batch table loads are by far the simpler of the two and are handled via a single Lambda function.

For CDC tables, we use AWS Glue ETL to load and perform the updates against our tables stored in the mirror S3 bucket. The AWS Glue job uses Apache Spark data frames to combine historical data, filter out deleted records, and union with any records inserted. For our process, updates are treated as delete-then-insert. After performing the union, the entire dataset is written out to the mirror S3 bucket in a newly created bucket partition.

The following diagram illustrates this workflow.

We write data into a new partition for each table load, so we can provide read consistency in a way that makes sense to our consuming business partners.

Building the Data Catalog

When each Amazon S3 mirror data load is complete, another separate serverless branch is triggered to handle catalog management.

The branch updates the location property within the catalog for pre-existing tables, indicating each newly added partition. When loading a table for the first time, we trigger a series of purpose-built Lambda functions to create the AWS Glue Data Catalog database (only required when it’s an entirely new source schema), create an AWS Glue crawler, start the crawler, and delete the crawler when it’s complete.

The following diagram illustrates this workflow.

These event-driven design patterns allow us to fully automate the catalog management piece of our architecture, which became a big win for our team because it lowered the operational overhead associated with onboarding new source tables. Every achievement like this mattered because it realized the potential the cloud had to transform how we build and support products across our technology organization.

Final implementation architecture and best practices

The solution evolved several times throughout the development cycle, typically due to learning something new in terms of serverless and cloud-native development, and further working with AWS Solutions Architect and AWS Professional Services teams. Along the way, we’ve discovered many cloud-native best practices and accelerated our serverless data journey to AWS.

The following diagram illustrates our final architecture.

We strategically added Amazon Simple Queue Service (Amazon SQS) between purpose-built Lambda functions to decouple the architecture. Amazon SQS gave our system a level of resiliency and operational observability that otherwise would have been a challenge.

Another best practice arose from using Amazon DynamoDB as a state table to help ensure our entire serverless integration pattern was writing to our mirror bucket with ACID guarantees.

On the topic of operational observability, we use Amazon EventBridge to capture and report on operational metadata like table load status, time of the last load, and row counts.

Bringing it all together

At the time of writing, we’ve had production workloads running through our solution for the better part of 14 months.

Production data is integrated from more than 30 source systems at present and totals several hundred tables. This solution has given us a great starting point for building our cloud data ecosystem. The flexibility and extensibility of AWS’s many services have been key to our success.

Appreciation for the AWS Glue Data Catalog has been an essential element. Without knowing it at the time we started building a data lake, we’ve been embracing a modern data architecture pattern and organizing around our transactionally consistent and cataloged mirror storage layer.

The introduction of a more seamless Apache Hudi experience within AWS has been a big win for our team. We’ve been busy incorporating Hudi into our CDC transaction pipeline and are thrilled with the results. We’re able to spend less time writing code managing the storage of our data, and more time focusing on the reliability of our system. This has been critical in our ability to scale. Our development pipeline has grown beyond 10,000 tables and more than 150 source systems as we approach another major production cutover.

Looking ahead, we’re intrigued by the potential for AWS Lake Formation goverened tables to further accelerate our momentum and management of CDC table loads.

Conclusion

Building our cloud-native integration pipeline has been a journey. What started as an idea and has turned into much more in a brief time. It’s hard to appreciate how far we’ve come when there’s always more to be done. That being said, the entire process has been extraordinary. We built deep and trusted partnerships with AWS, learned more about our internal value statement, and aligned more of our organization to a cloud-centric way of operating.

The ability to build solutions in a serverless manner opens up many doors for our data function and, most importantly, our customers. Speed to delivery and the pace of innovation is directly related to our ability to focus our engineering teams on business-specific problems while trusting a partner like AWS to do the heavy lifting of data center operations like racking, stacking, and powering servers. It also removes the operational burden of managing operating systems and applications with managed services. Finally, it allows us to focus on our customers and business process enablement rather than on IT infrastructure.

The breadth and depth of data and analytics services on AWS make it possible to solve our business problems by using the right resources to run whatever analysis is most appropriate for a specific need. AWS Data and Analytics has deep integrations across all layers of the AWS ecosystem, giving us the tools to analyze data using any approach quickly. We appreciate AWS’s continual innovation on behalf of its customers.


About the Authors

Alcuin Weidus is a Principal Data Architect for GE Aviation. Serverless advocate, perpetual data management student, and cloud native strategist, Alcuin is a data technology leader on a team responsible for accelerating technical outcomes across GE Aviation. Connect him on Linkedin.

Suresh Patnam is a Sr Solutions Architect at AWS; He works with customers to build IT strategy, making digital transformation through the cloud more accessible, focusing on big data, data lakes, and AI/ML. In his spare time, Suresh enjoys playing tennis and spending time with his family. Connect him on LinkedIn.

IBM Hackathon Produces Innovative Sustainability Solutions on AWS

Post Syndicated from Dhana Vadivelan original https://aws.amazon.com/blogs/architecture/ibm-hackathon-produces-innovative-sustainability-solutions-on-aws/

This post was co-authored by Dhana Vadivelan, Senior Manager, Solutions Architecture, AWS; Markus Graulich, Chief Architect AI EMEA, IBM Consulting; and Vlad Zamfirescu, Senior Solutions Architect, IBM Consulting

Our consulting partner, IBM, organized the “Sustainability Applied 2021” hackathon in September 2021. This three-day event aimed to generate new ideas, create reference architecture patterns using AWS Cloud services, and produce sustainable solutions.

This post highlights four reference architectures that were developed during the hackathon. These architectures show you how IBM hack teams used AWS services to resolve real-world sustainability challenges. We hope these architectures inspire you to help address other sustainability challenges with your own solutions.

IBM sustainability hackathon

Any sustainability research requires acquiring and analyzing large sustainability datasets, such as weather, climate, water, agriculture, and satellite imagery. This requires large storage capacity and often takes a considerable amount of time to complete.

The Amazon Sustainability Data Initiative (ASDI) provides innovators and researchers with sustainability datasets and tools to develop solutions. These datasets are publicly available to anyone on the Registry of Open Data on AWS.

In the hackathon, IBM hack teams used these sample datasets and open APIs from The Weather Company (an IBM business) to develop solutions for sustainability challenges.

Architecture 1: Biocapacity digital twin solution

The hack team “Biohackers” addressed biocapacity, which refers to a biologically productive area’s (cropland, forest, and fishing grounds) ability to generate renewable resources and to absorb its spillover waste. Countries consume 1.7 global hectares per person of Earth’s total biocapacity; this means we consume more resources than are available on this planet.

To help solve this problem, the team created a digital twin architecture (Figure 1) to virtually represent biocapacity information in various conditions:

Biocapacity digital twin solution on AWS

Figure 1. Biocapacity digital twin solution on AWS

This solution provides precise information on current biocapacity and predicts the future biocapacity status at country, region, and city levels. The Biohackers aim to help governments, businesses, and individuals identify options to improve the supply of available renewable resources and increase awareness of the supply and demand.

Architecture 2: Local emergency communication system

Team “Sustainable Force 99,” worked to better understand natural disasters, which have tripled over recent years. Their solution aims to predict natural disasters by analyzing the geographical spread of contributing factors like extreme weather due to climate change, wildfires, and deforestation. Then it communicates clear instructions to people who are potentially in danger.

Their solution (Figure 2) uses the Amazon SageMaker AI prediction model and combines The Weather Company data with Amazon S3, Amazon DynamoDB, and Serverless on AWS technologies and communicates with the public by:

  • Providing voice and chat communication channels using Amazon Connect, Amazon Lex, and Amazon Pinpoint.
  • Broadcasting alerts across smartphones and speakers in towns to provide information to people about upcoming natural disasters.
  • Allowing individuals to notify emergency services of their circumstances.
Local emergency communication system

Figure 2. Local emergency communication system

This communication helps governments and local authorities identify and communicate safe relocation options during disasters and connect with nearby relocation assistance teams.

Architecture 3: Intelligent satellite image processing

Team “Green Fire” examined how to reduce environmental problems caused by wildfires.

Many forest service organizations already use predictive tools to provide intelligence to fire services authorities using satellite imaging. The satellites can detect and capture images of wildfires. However, it can take hours to process these images and transmit and analyze the information, which can mean the subsequent coordination and mobilization of emergency services can be challenging.

To help improve fire rescue and other emergency services coordination and real-time situational awareness, Green Fire created a serverless application architecture (Figure 3):

  • The drone images, external data feeds from AWS Open Data Registry, and the datasets from The Weather Company are stored in Amazon S3 for processing.
  • AWS Lambda processes the images and resizes the data, and the outputs are stored in DynamoDB.
  • Rekognition labels the drone images that identify geographical risks and fire hazards. This allows emergency services to identify potential risks, and they can further model the potential spread of the wildfire and identify options to suppress it.
  • Lambda integrates the API layer between the web user interface and DynamoDB so users can access the application from a web browser/mobile device (mobile application developed using AWS Amplify). Amazon Cognito authenticates users and controls user access.
Intelligent image processing

Figure 3. Intelligent image processing

The team expects this solution to help prevent loss of human lives, save approximately 10% of yearly spend, and reduce CO2 emissions globally between 1.75 to 13.5 billion metric tons of carbon.

Architecture 4: Machine-learning-based solution to predict bee colonies at risk

Variations in vegetation, rising temperatures, and use of pesticide are significantly destroying habitats and creating inhospitable conditions for many species of bees. Over the last decade, beehives in the US and Europe have suffered hive losses of at least 30%.

To encourage the adoption of sustainable agriculture, it is important to safeguard bee colonies. The “I BEE GREEN” team developed a device that contains sensors that monitor beehive health, such as temperature, humidity, air pollutants, beehive acoustic signals, and the number of bees:

  • AWS IoT Core for LoRaWAN connects wireless sensor devices that use the LoRaWAN protocol for low-power, long-range comprehensive area network connectivity.
  • The sensor and weather data (from AWS Open Data Registry/The Weather Company) are loaded in Amazon S3 and transformed using AWS Glue.
  • Once the data is processed and ready to be consumed, it is stored on the AWS S3 bucket.
  • SageMaker consumes this data and generates forecasts such as estimated bee population and mortality rates, probability of infectious diseases and their spread, and the effect of the environment on beehive health.
  • The forecasts are presented in a dashboard using AWS QuickSight and are based on historical data, current data, and trends.

The information this solution generates can be used for several use cases, including:

  • Offering agricultural organizations information on how climate change impacts bee colonies and influences their business performance
  • Contributing to beekeepers’ understanding of the best environment to safeguard bee biodiversity and when to pollinate crops
  • Educating farmers on sustainable methods of agriculture that reduces threat to bees

The I BEE GREEN device automatically counts when bees are entering or exiting the hive. Using this, farmers can assess a hive’s acoustic signal, temperature, humidity, the presence of pollutants, classify them as normal or abnormal, and forecast the potential risk of abnormal mortality. The I BEE GREEN team aims for their device to deploy quickly, with minimal instructions anyone can implement.

Machine-learning-based architecture to predict bee colonies at risk

Figure 4. Machine-learning-based architecture to predict bee colonies at risk

Conclusion

In this blog post, we showed you how IBM hackathon teams used AWS technologies to solve sustainability-related challenges.

Ready to make your own? Visit our sustainability page to learn more about AWS services and features that encourage innovation to solve real-world sustainability challenges. Read more sustainability use cases on the AWS Public Sector Blog.

Create a serverless event-driven workflow to ingest and process Microsoft data with AWS Glue and Amazon EventBridge

Post Syndicated from Venkata Sistla original https://aws.amazon.com/blogs/big-data/create-a-serverless-event-driven-workflow-to-ingest-and-process-microsoft-data-with-aws-glue-and-amazon-eventbridge/

Microsoft SharePoint is a document management system for storing files, organizing documents, and sharing and editing documents in collaboration with others. Your organization may want to ingest SharePoint data into your data lake, combine the SharePoint data with other data that’s available in the data lake, and use it for reporting and analytics purposes. AWS Glue is a serverless data integration service that makes it easy to discover, prepare, and combine data for analytics, machine learning, and application development. AWS Glue provides all the capabilities needed for data integration so that you can start analyzing your data and putting it to use in minutes instead of months.

Organizations often manage their data on SharePoint in the form of files and lists, and you can use this data for easier discovery, better auditing, and compliance. SharePoint as a data source is not a typical relational database and the data is mostly semi structured, which is why it’s often difficult to join the SharePoint data with other relational data sources. This post shows how to ingest and process SharePoint lists and files with AWS Glue and Amazon EventBridge, which enables you to join other data that is available in your data lake. We use SharePoint REST APIs with a standard open data protocol (OData) syntax. OData advocates a standard way of implementing REST APIs that allows for SQL-like querying capabilities. OData helps you focus on your business logic while building RESTful APIs without having to worry about the various approaches to define request and response headers, query options, and so on.

AWS Glue event-driven workflows

Unlike a traditional relational database, SharePoint data may or may not change frequently, and it’s difficult to predict the frequency at which your SharePoint server generates new data, which makes it difficult to plan and schedule data processing pipelines efficiently. Running data processing frequently can be expensive, whereas scheduling pipelines to run infrequently can deliver cold data. Similarly, triggering pipelines from an external process can increase complexity, cost, and job startup time.

AWS Glue supports event-driven workflows, a capability that lets developers start AWS Glue workflows based on events delivered by EventBridge. The main reason to choose EventBridge in this architecture is because it allows you to process events, update the target tables, and make information available to consume in near-real time. Because frequency of data change in SharePoint is unpredictable, using EventBridge to capture events as they arrive enables you to run the data processing pipeline only when new data is available.

To get started, you simply create a new AWS Glue trigger of type EVENT and place it as the first trigger in your workflow. You can optionally specify a batching condition. Without event batching, the AWS Glue workflow is triggered every time an EventBridge rule matches, which may result in multiple concurrent workflows running. AWS Glue protects you by setting default limits that restrict the number of concurrent runs of a workflow. You can increase the required limits by opening a support case. Event batching allows you to configure the number of events to buffer or the maximum elapsed time before firing the particular trigger. When the batching condition is met, a workflow run is started. For example, you can trigger your workflow when 100 files are uploaded in Amazon Simple Storage Service (Amazon S3) or 5 minutes after the first upload. We recommend configuring event batching to avoid too many concurrent workflows, and optimize resource usage and cost.

To illustrate this solution better, consider the following use case for a wine manufacturing and distribution company that operates across multiple countries. They currently host all their transactional system’s data on a data lake in Amazon S3. They also use SharePoint lists to capture feedback and comments on wine quality and composition from their suppliers and other stakeholders. The supply chain team wants to join their transactional data with the wine quality comments in SharePoint data to improve their wine quality and manage their production issues better. They want to capture those comments from the SharePoint server within an hour and publish that data to a wine quality dashboard in Amazon QuickSight. With an event-driven approach to ingest and process their SharePoint data, the supply chain team can consume the data in less than an hour.
Overview of solution

In this post, we walk through a solution to set up an AWS Glue job to ingest SharePoint lists and files into an S3 bucket and an AWS Glue workflow that listens to S3 PutObject data events captured by AWS CloudTrail. This workflow is configured with an event-based trigger to run when an AWS Glue ingest job adds new files into the S3 bucket. The following diagram illustrates the architecture.

To make it simple to deploy, we captured the entire solution in an AWS CloudFormation template that enables you to automatically ingest SharePoint data into Amazon S3. SharePoint uses ClientID and TenantID credentials for authentication and uses Oauth2 for authorization.

The template helps you perform the following steps:

  1. Create an AWS Glue Python shell job to make the REST API call to the SharePoint server and ingest files or lists into Amazon S3.
  2. Create an AWS Glue workflow with a starting trigger of EVENT type.
  3. Configure CloudTrail to log data events, such as PutObject API calls to CloudTrail.
  4. Create a rule in EventBridge to forward the PutObject API events to AWS Glue when they’re emitted by CloudTrail.
  5. Add an AWS Glue event-driven workflow as a target to the EventBridge rule. The workflow gets triggered when the SharePoint ingest AWS Glue job adds new files to the S3 bucket.

Prerequisites

For this walkthrough, you should have the following prerequisites:

Configure SharePoint server authentication details

Before launching the CloudFormation stack, you need to set up your SharePoint server authentication details, namely, TenantID, Tenant, ClientID, ClientSecret, and the SharePoint URL in AWS Systems Manager Parameter Store of the account you’re deploying in. This makes sure that no authentication details are stored in the code and they’re fetched in real time from Parameter Store when the solution is running.

To create your AWS Systems Manager parameters, complete the following steps:

  1. On the Systems Manager console, under Application Management in the navigation pane, choose Parameter Store.
    systems manager
  2. Choose Create Parameter.
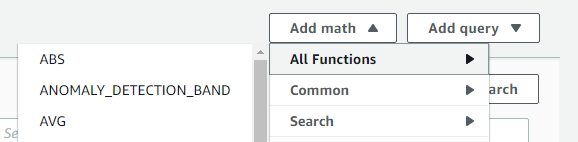
  3. For Name, enter the parameter name /DATALAKE/GlueIngest/SharePoint/tenant.
  4. Leave the type as string.
  5. Enter your SharePoint tenant detail into the value field.
  6. Choose Create parameter.
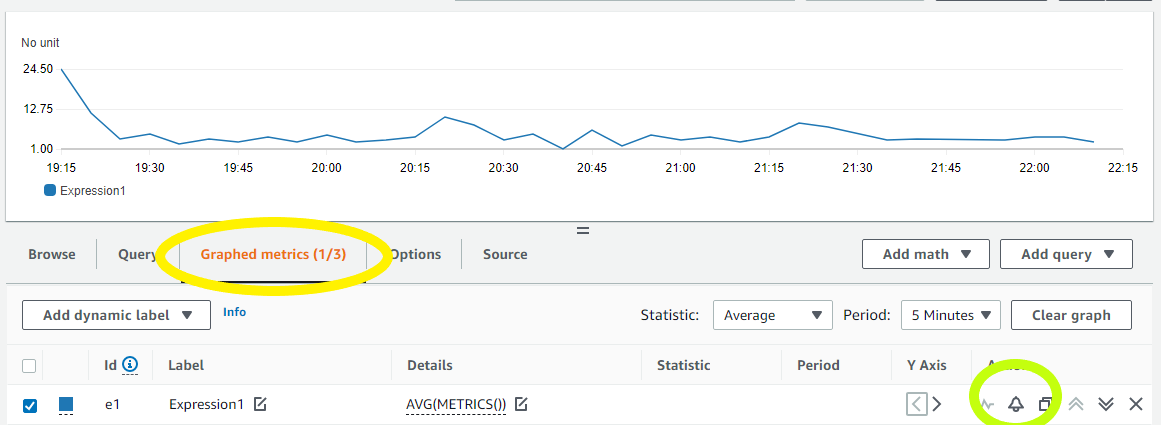
  7. Repeat these steps to create the following parameters:
    1. /DataLake/GlueIngest/SharePoint/tenant
    2. /DataLake/GlueIngest/SharePoint/tenant_id
    3. /DataLake/GlueIngest/SharePoint/client_id/list
    4. /DataLake/GlueIngest/SharePoint/client_secret/list
    5. /DataLake/GlueIngest/SharePoint/client_id/file
    6. /DataLake/GlueIngest/SharePoint/client_secret/file
    7. /DataLake/GlueIngest/SharePoint/url/list
    8. /DataLake/GlueIngest/SharePoint/url/file

Deploy the solution with AWS CloudFormation

For a quick start of this solution, you can deploy the provided CloudFormation stack. This creates all the required resources in your account.

The CloudFormation template generates the following resources:

  • S3 bucket – Stores data, CloudTrail logs, job scripts, and any temporary files generated during the AWS Glue extract, transform, and load (ETL) job run.
  • CloudTrail trail with S3 data events enabled – Enables EventBridge to receive PutObject API call data in a specific bucket.
  • AWS Glue Job – A Python shell job that fetches the data from the SharePoint server.
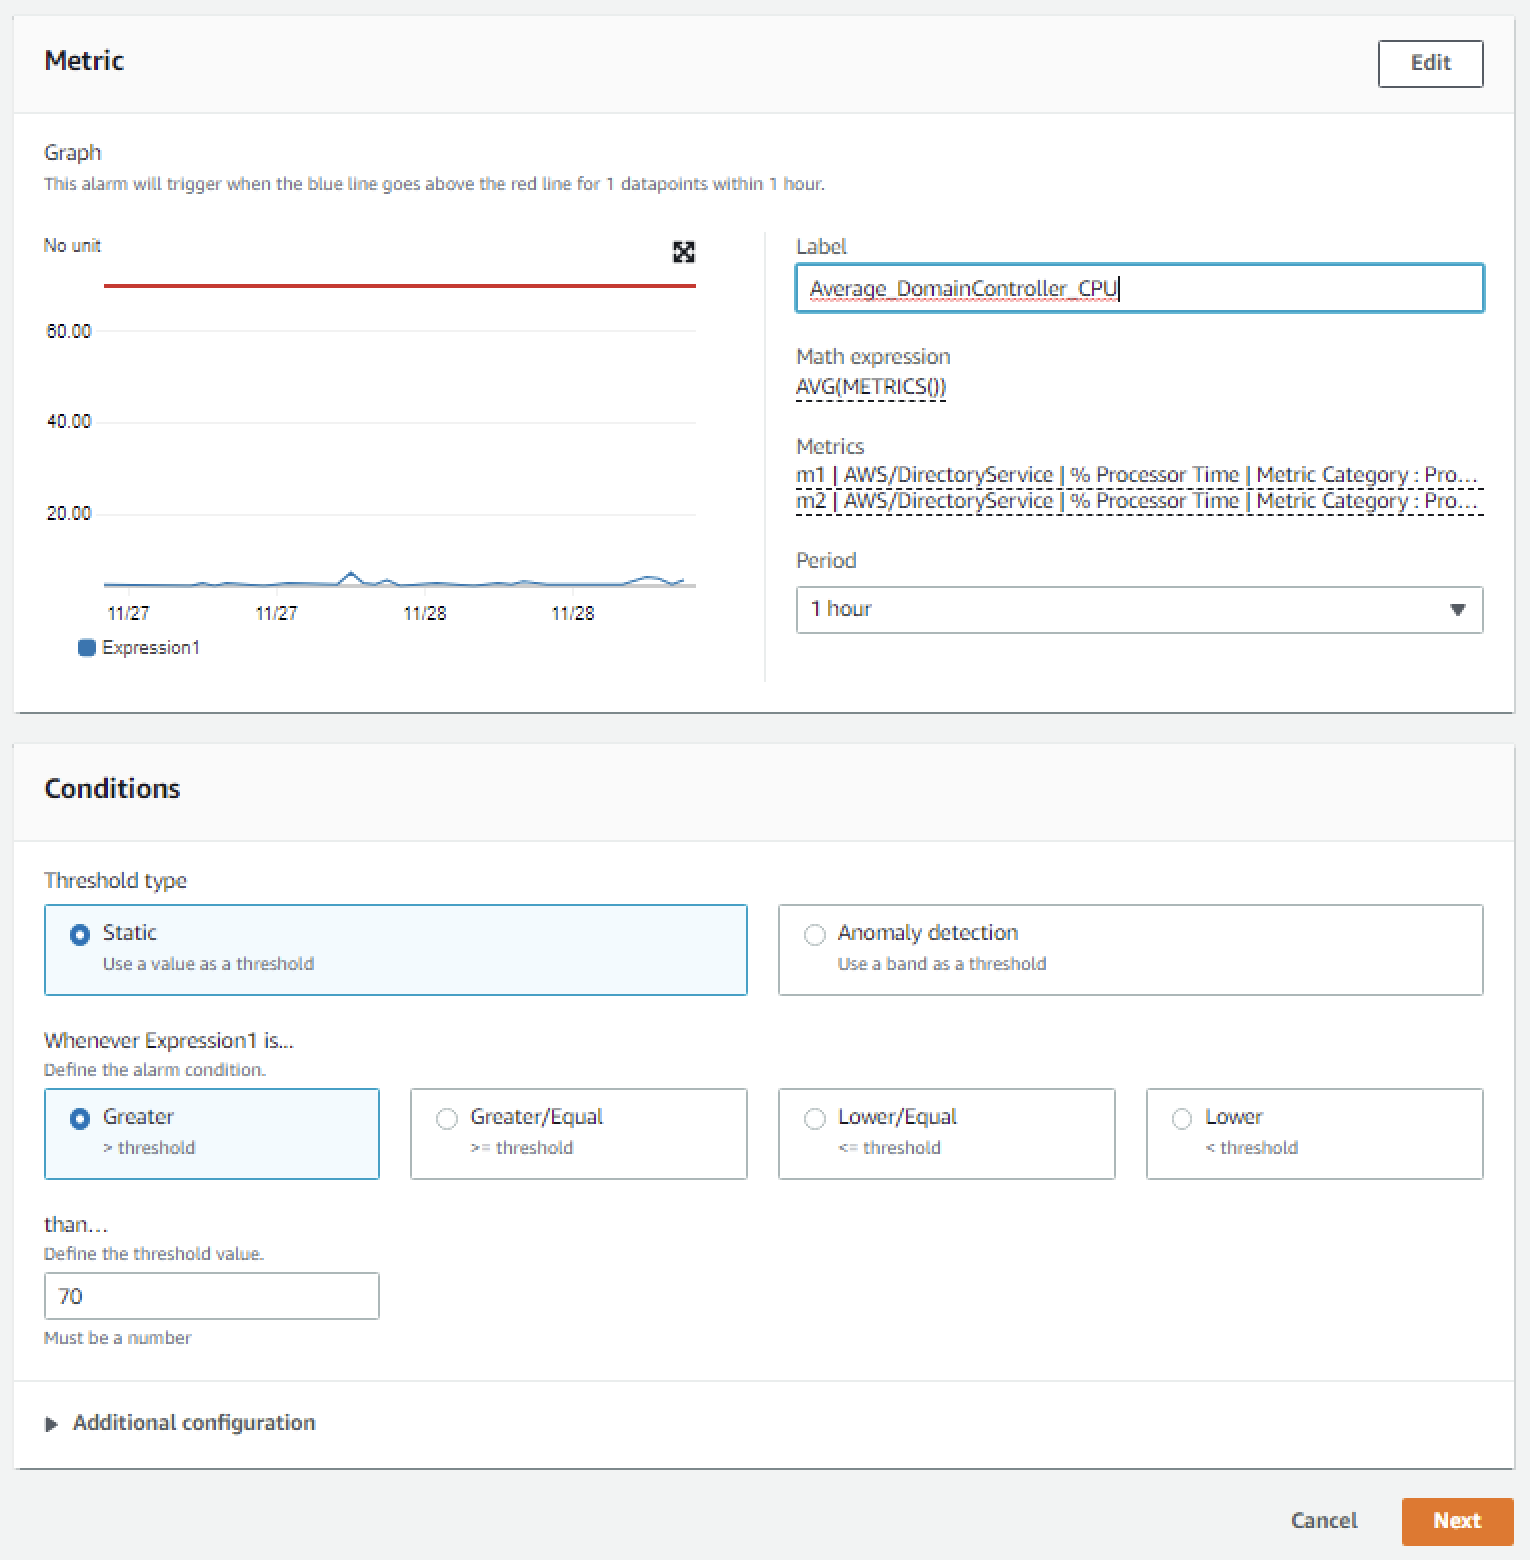
  • AWS Glue workflow – A data processing pipeline that is comprised of a crawler, jobs, and triggers. This workflow converts uploaded data files into Apache Parquet format.
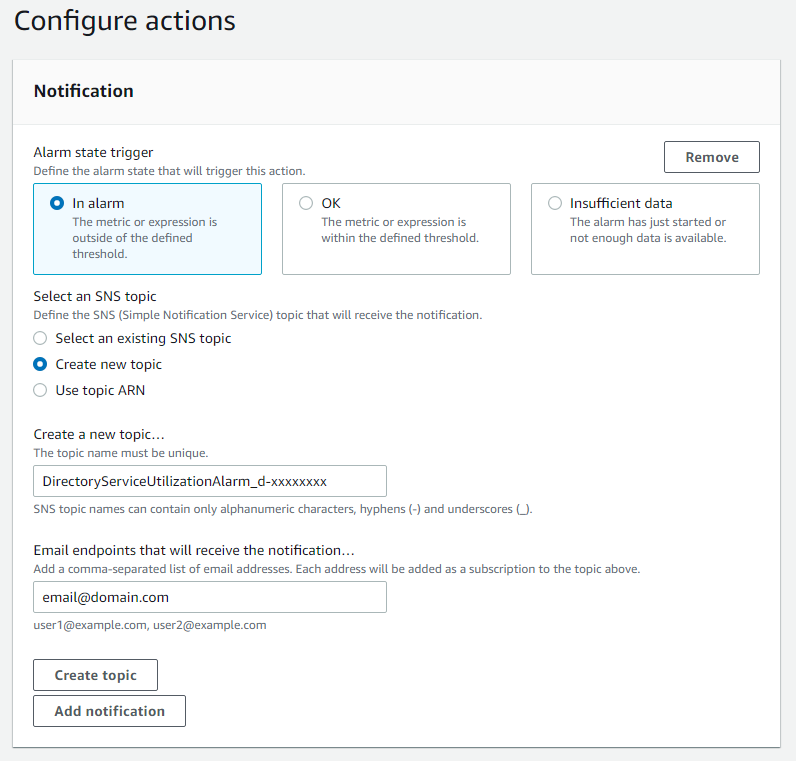
  • AWS Glue database – The AWS Glue Data Catalog database that holds the tables created in this walkthrough.
  • AWS Glue table – The Data Catalog table representing the Parquet files being converted by the workflow.
  • AWS Lambda function – The AWS Lambda function is used as an AWS CloudFormation custom resource to copy job scripts from an AWS Glue-managed GitHub repository and an AWS Big Data blog S3 bucket to your S3 bucket.
  • IAM roles and policies – We use the following AWS Identity and Access Management (IAM) roles:
    • LambdaExecutionRole – Runs the Lambda function that has permission to upload the job scripts to the S3 bucket.
    • GlueServiceRole – Runs the AWS Glue job that has permission to download the script, read data from the source, and write data to the destination after conversion.
    • EventBridgeGlueExecutionRole – Has permissions to invoke the NotifyEvent API for an AWS Glue workflow.
    • IngestGlueRole – Runs the AWS Glue job that has permission to ingest data into the S3 bucket.

To launch the CloudFormation stack, complete the following steps:

  1. Sign in to the AWS CloudFormation console.
  2. Choose Launch Stack:
  3. Choose Next.
  4. For pS3BucketName, enter the unique name of your new S3 bucket.
  5. Leave pWorkflowName and pDatabaseName as the default.

cloud formation 1

  1. For pDatasetName, enter the SharePoint list name or file name you want to ingest.
  2. Choose Next.

cloud formation 2

  1. On the next page, choose Next.
  2. Review the details on the final page and select I acknowledge that AWS CloudFormation might create IAM resources.
  3. Choose Create.

It takes a few minutes for the stack creation to complete; you can follow the progress on the Events tab.

You can run the ingest AWS Glue job either on a schedule or on demand. As the job successfully finishes and ingests data into the raw prefix of the S3 bucket, the AWS Glue workflow runs and transforms the ingested raw CSV files into Parquet files and loads them into the transformed prefix.

Review the EventBridge rule

The CloudFormation template created an EventBridge rule to forward S3 PutObject API events to AWS Glue. Let’s review the configuration of the EventBridge rule:

  1. On the EventBridge console, under Events, choose Rules.
  2. Choose the rule s3_file_upload_trigger_rule-<CloudFormation-stack-name>.
  3. Review the information in the Event pattern section.

event bridge

The event pattern shows that this rule is triggered when an S3 object is uploaded to s3://<bucket_name>/data/SharePoint/tablename_raw/. CloudTrail captures the PutObject API calls made and relays them as events to EventBridge.

  1. In the Targets section, you can verify that this EventBridge rule is configured with an AWS Glue workflow as a target.

event bridge target section

Run the ingest AWS Glue job and verify the AWS Glue workflow is triggered successfully

To test the workflow, we run the ingest-glue-job-SharePoint-file job using the following steps:

  1. On the AWS Glue console, select the ingest-glue-job-SharePoint-file job.

glue job

  1. On the Action menu, choose Run job.

glue job action menu

  1. Choose the History tab and wait until the job succeeds.

glue job history tab

You can now see the CSV files in the raw prefix of your S3 bucket.

csv file s3 location

Now the workflow should be triggered.

  1. On the AWS Glue console, validate that your workflow is in the RUNNING state.

glue workflow running status

  1. Choose the workflow to view the run details.
  2. On the History tab of the workflow, choose the current or most recent workflow run.
  3. Choose View run details.

glue workflow visual

When the workflow run status changes to Completed, let’s check the converted files in your S3 bucket.

  1. Switch to the Amazon S3 console, and navigate to your bucket.

You can see the Parquet files under s3://<bucket_name>/data/SharePoint/tablename_transformed/.

parquet file s3 location

Congratulations! Your workflow ran successfully based on S3 events triggered by uploading files to your bucket. You can verify everything works as expected by running a query against the generated table using Amazon Athena.

Sample wine dataset

Let’s analyze a sample red wine dataset. The following screenshot shows a SharePoint list that contains various readings that relate to the characteristics of the wine and an associated wine category. This is populated by various wine tasters from multiple countries.

redwine dataset

The following screenshot shows a supplier dataset from the data lake with wine categories ordered per supplier.

supplier dataset

We process the red wine dataset using this solution and use Athena to query the red wine data and supplier data where wine quality is greater than or equal to 7.

athena query and results

We can visualize the processed dataset using QuickSight.

Clean up

To avoid incurring unnecessary charges, you can use the AWS CloudFormation console to delete the stack that you deployed. This removes all the resources you created when deploying the solution.

Conclusion

Event-driven architectures provide access to near-real-time information and help you make business decisions on fresh data. In this post, we demonstrated how to ingest and process SharePoint data using AWS serverless services like AWS Glue and EventBridge. We saw how to configure a rule in EventBridge to forward events to AWS Glue. You can use this pattern for your analytical use cases, such as joining SharePoint data with other data in your lake to generate insights, or auditing SharePoint data and compliance requirements.


About the Author

Venkata Sistla is a Big Data & Analytics Consultant on the AWS Professional Services team. He specializes in building data processing capabilities and helping customers remove constraints that prevent them from leveraging their data to develop business insights.

How Roche democratized access to data with Google Sheets and Amazon Redshift Data API

Post Syndicated from Dr. Yannick Misteli original https://aws.amazon.com/blogs/big-data/how-roche-democratized-access-to-data-with-google-sheets-and-amazon-redshift-data-api/

This post was co-written with Dr. Yannick Misteli, João Antunes, and Krzysztof Wisniewski from the Roche global Platform and ML engineering team as the lead authors.

Roche is a Swiss multinational healthcare company that operates worldwide. Roche is the largest pharmaceutical company in the world and the leading provider of cancer treatments globally.

In this post, Roche’s global Platform and machine learning (ML) engineering team discuss how they used Amazon Redshift data API to democratize access to the data in their Amazon Redshift data warehouse with Google Sheets (gSheets).

Business needs

Go-To-Market (GTM) is the domain that lets Roche understand customers and create and deliver valuable services that meet their needs. This lets them get a better understanding of the health ecosystem and provide better services for patients, doctors, and hospitals. It extends beyond health care professionals (HCPs) to a larger Healthcare ecosystem consisting of patients, communities, health authorities, payers, providers, academia, competitors, etc. Data and analytics are essential to supporting our internal and external stakeholders in their decision-making processes through actionable insights.

For this mission, Roche embraced the modern data stack and built a scalable solution in the cloud.

Driving true data democratization requires not only providing business leaders with polished dashboards or data scientists with SQL access, but also addressing the requirements of business users that need the data. For this purpose, most business users (such as Analysts) leverage Excel—or gSheet in the case of Roche—for data analysis.

Providing access to data in Amazon Redshift to these gSheets users is a non-trivial problem. Without a powerful and flexible tool that lets data consumers use self-service analytics, most organizations will not realize the promise of the modern data stack. To solve this problem, we want to empower every data analyst who doesn’t have an SQL skillset with a means by which they can easily access and manipulate data in the applications that they are most familiar with.

The Roche GTM organization uses the Redshift Data API to simplify the integration between gSheets and Amazon Redshift, and thus facilitate the data needs of their business users for analytical processing and querying. The Amazon Redshift Data API lets you painlessly access data from Amazon Redshift with all types of traditional, cloud-native, and containerized, serverless web service-based applications and event-driven applications. Data API simplifies data access, ingest, and egress from languages supported with AWS SDK, such as Python, Go, Java, Node.js, PHP, Ruby, and C++ so that you can focus on building applications as opposed to managing infrastructure. The process they developed using Amazon Redshift Data API has significantly lowered the barrier for entry for new users without needing any data warehousing experience.

Use-Case

In this post, you will learn how to integrate Amazon Redshift with gSheets to pull data sets directly back into gSheets. These mechanisms are facilitated through the use of the Amazon Redshift Data API and Google Apps Script. Google Apps Script is a programmatic way of manipulating and extending gSheets and the data that they contain.

Architecture

It is possible to include publicly available JS libraries such as JQuery-builder provided that Apps Script is natively a cloud-based Javascript platform.

The JQuery builder library facilitates the creation of standard SQL queries via a simple-to-use graphical user interface. The Redshift Data API can be used to retrieve the data directly to gSheets with a query in place. The following diagram illustrates the overall process from a technical standpoint:

Even though AppsScript is, in fact, Javascript, the AWS-provided SDKs for the browser (NodeJS and React) cannot be used on the Google platform, as they require specific properties that are native to the underlying infrastructure. It is possible to authenticate and access AWS resources through the available API calls. Here is an example of how to achieve that.

You can use an access key ID and a secret access key to authenticate the requests to AWS by using the code in the link example above. We recommend following the least privilege principle when granting access to this programmatic user, or assuming a role with temporary credentials. Since each user will require a different set of permissions on the Redshift objects—database, schema, and table—each user will have their own user access credentials. These credentials are safely stored under the AWS Secrets Manager service. Therefore, the programmatic user needs a set of permissions that enable them to retrieve secrets from the AWS Secrets Manager and execute queries against the Redshift Data API.

Code example for AppScript to use Data API

In this section, you will learn how to pull existing data back into a new gSheets Document. This section will not cover how to parse the data from the JQuery-builder library, as it is not within the main scope of the article.

<script src="https://cdn.jsdelivr.net/npm/jQuery-QueryBuilder/dist/js/query-builder.standalone.min.js"></script>    
  1. In the AWS console, go to Secrets Manager and create a new secret to store the database credentials to access the Redshift Cluster: username and password. These will be used to grant Redshift access to the gSheets user.
  2. In the AWS console, create a new IAM user with programmatic access, and generate the corresponding Access Key credentials. The only set of policies required for this user is to be able to read the secret created in the previous step from the AWS Secrets Manager service and to query the Redshift Data API.

    Below is the policy document:

    {
      "Version": "2012-10-17",
      "Statement": [
        {
          "Sid": "VisualEditor0",
          "Effect": "Allow",
          "Action": [
            "secretsmanager:GetSecretValue",
            "secretsmanager:DescribeSecret"
          ],
          "Resource": "arn:aws:secretsmanager:*::secret:*"
        },
        {
          "Sid": "VisualEditor1",
          "Effect": "Allow",
          "Action": "secretsmanager:ListSecrets",
          "Resource": "*"
        },
        {
          "Sid": "VisualEditor2",
          "Effect": "Allow",
          "Action": "redshift-data:*",
          "Resource": "arn:aws:redshift:*::cluster:*"
        }
      ]
    }

  3. Access the Google Apps Script console. Create an aws.gs file with the code available here. This will let you perform authenticated requests to the AWS services by providing an access key and a secret access key.
  4. Initiate the AWS variable providing the access key and secret access key created in step 3.
    AWS.init("<ACCESS_KEY>", "<SECRET_KEY>");

  5. Request the Redshift username and password from the AWS Secrets Manager:
    function runGetSecretValue_(secretId) {
     
      var resultJson = AWS.request(
        	getSecretsManagerTypeAWS_(),
        	getLocationAWS_(),
        	'secretsmanager.GetSecretValue',
        	{"Version": getVersionAWS_()},
        	method='POST',
        	payload={          
          	"SecretId" : secretId
        	},
        	headers={
          	"X-Amz-Target": "secretsmanager.GetSecretValue",
          	"Content-Type": "application/x-amz-json-1.1"
        	}
      );
     
      Logger.log("Execute Statement result: " + resultJson);
      return JSON.parse(resultJson);
     
    }

  6. Query a table using the Amazon Redshift Data API:
    function runExecuteStatement_(sql) {
     
      var resultJson = AWS.request(
        	getTypeAWS_(),
        	getLocationAWS_(),
        	'RedshiftData.ExecuteStatement',
        	{"Version": getVersionAWS_()},
        	method='POST',
        	payload={
          	"ClusterIdentifier": getClusterIdentifierReshift_(),
          	"Database": getDataBaseRedshift_(),
          	"DbUser": getDbUserRedshift_(),
          	"Sql": sql
        	},
        	headers={
          	"X-Amz-Target": "RedshiftData.ExecuteStatement",
          	"Content-Type": "application/x-amz-json-1.1"
        	}
      ); 
     
      Logger.log("Execute Statement result: " + resultJson); 

  7. The result can then be displayed as a table in gSheets:
    function fillGsheet_(recordArray) { 
     
      adjustRowsCount_(recordArray);
     
      var rowIndex = 1;
      for (var i = 0; i < recordArray.length; i++) {  
           
    	var rows = recordArray[i];
    	for (var j = 0; j < rows.length; j++) {
      	var columns = rows[j];
      	rowIndex++;
      	var columnIndex = 'A';
         
      	for (var k = 0; k < columns.length; k++) {
           
        	var field = columns[k];       
        	var value = getFieldValue_(field);
        	var range = columnIndex + rowIndex;
        	addToCell_(range, value);
     
        	columnIndex = nextChar_(columnIndex);
     
      	}
     
    	}
     
      }
     
    }

  8. Once finished, the Apps Script can be deployed as an Addon that enables end-users from an entire organization to leverage the capabilities of retrieving data from Amazon Redshift directly into their spreadsheets. Details on how Apps Script code can be deployed as an Addon can be found here.

How users access Google Sheets

  1. Open a gSheet, and go to manage addons -> Install addon:
  2. Once the Addon is successfully installed, select the Addon menu and select Redshift Synchronization. A dialog will appear prompting the user to select the combination of database, schema, and table from which to load the data.
  3. After choosing the intended table, a new panel will appear on the right side of the screen. Then, the user is prompted to select which columns to retrieve from the table, apply any filtering operation, and/or apply any aggregations to the data.
  4. Upon submitting the query, app scripts will translate the user selection into a query that is sent to the Amazon Redshift Data API. Then, the returned data is transformed and displayed as a regular gSheet table:

Security and Access Management

In the scripts above, there is a direct integration between AWS Secrets Manager and Google Apps Script. The scripts above can extract the currently-authenticated user’s Google email address. Using this value and a set of annotated tags, the script can appropriately pull the user’s credentials securely to authenticate the requests made to the Amazon Redshift cluster. Follow these steps to set up a new user in an existing Amazon Redshift cluster. Once the user has been created, follow these steps for creating a new AWS Secrets Manager secret for your cluster. Make sure that the appropriate tag is applied with the key of “email” along with the corresponding user’s Google email address. Here is a sample configuration that is used for creating Redshift groups, users, and data shares via the Redshift Data API:

connection:
 redshift_super_user_database: dev
 redshift_secret_name: dev_
 redshift_cluster_identifier: dev-cluster
 redshift_secrets_stack_name: dev-cluster-secrets
 environment: dev
 aws_region: eu-west-1
 tags:
   - key: "Environment"
 	value: "dev"
users:
 - name: user1
   email: [email protected]
 data_shares:
 - name: test_data_share
   schemas:
 	- schema1
   redshift_namespaces:
 	- USDFJIL234234WE
group:
 - name: readonly
   users:
 	- user1
   databases:
 	- database: database1
   	exclude-schemas:
     	- public
     	- pg_toast
     	- catalog_history
   	include-schemas:
     	- schema1
   	grant:
     	- select

Operational Metrics and Improvement

Providing access to live data that is hosted in Redshift directly to the business users and enabling true self-service decrease the burden on platform teams to provide data extracts or other mechanisms to deliver up-to-date information. Additionally, by not having different files and versions of data circulating, the business risk of reporting different key figures or KPI can be reduced, and an overall process efficiency can be achieved.

The initial success of this add-on in GTM led to the extension of this to a broader audience, where we are hoping to serve hundreds of users with all of the internal and public data in the future.

Conclusion

In this post, you learned how to create new Amazon Redshift tables and pull existing Redshift tables into a Google Sheet for business users to easily integrate with and manipulate data. This integration was seamless and demonstrated how easy the Amazon Redshift Data API makes integration with external applications, such as Google Sheets with Amazon Redshift. The outlined use-cases above are just a few examples of how the Amazon Redshift Data API can be applied and used to simplify interactions between users and Amazon Redshift clusters.


About the Authors

Dr. Yannick Misteli is leading cloud platform and ML engineering teams in global product strategy (GPS) at Roche. He is passionate about infrastructure and operationalizing data-driven solutions, and he has broad experience in driving business value creation through data analytics.

João Antunes is a Data Engineer in the Global Product Strategy (GPS) team at Roche. He has a track record of deploying Big Data batch and streaming solutions for the telco, finance, and pharma industries.

Krzysztof Wisniewski is a back-end JavaScript developer in the Global Product Strategy (GPS) team at Roche. He is passionate about full-stack development from the front-end through the back-end to databases.

Matt Noyce is a Senior Cloud Application Architect at AWS. He works together primarily with Life Sciences and Healthcare customers to architect and build solutions on AWS for their business needs.

Debu Panda, a Principal Product Manager at AWS, is an industry leader in analytics, application platform, and database technologies, and has more than 25 years of experience in the IT world. Debu has published numerous articles on analytics, enterprise Java, and databases and has presented at multiple conferences such as re:Invent, Oracle Open World, and Java One. He is lead author of the EJB 3 in Action (Manning Publications 2007, 2014) and Middleware Management (Packt).

How Viasat scaled their big data applications by migrating to Amazon EMR

Post Syndicated from Manoj Gundawar original https://aws.amazon.com/blogs/big-data/how-viasat-scaled-their-big-data-applications-by-migrating-to-amazon-emr/

This post is co-written with Manoj Gundawar from Viasat.

Viasat is a satellite internet service provider based in Carlsbad, CA, with operations across the United States and worldwide. Viasat’s ambition is to be the first truly global, scalable, broadband service provider with a mission to deliver connections that can change the world. Viasat operates across three main business segments: satellite services, commercial networks, and government systems, providing high-speed satellite broadband services and secure networking systems.

In this post, we discuss how migrating our on-premises big data workloads to Amazon EMR helped us achieve a fully managed cloud-native solution and freed us from the constraints of our legacy on-premises solution, so we can focus on business innovation with a lower TCO.

Challenge with the legacy big data environment

Viasat’s big data application, Usage Data Mart, is a high-volume, low-latency Hadoop-based solution that ingests internet usage data from a multitude of source systems. It curates and aggregates with data from other sources, and provides the data in an optimized system to support high-volume access to reporting and web interfaces. This critical application processes over 1.3 billion internet usage records per day, sourced from various upstream systems. Viasat customer support representatives use this data through APIs and reports to assist end-users on any queries regarding their internet usage. Various internal teams and customers also use data for usage accounting, tracking, compliance, and billing purposes.

The Usage Data Mart was previously implemented in an on-premises footprint of over 40 nodes with three independent clusters all running a commercial distribution of Hadoop to process our big data work load. The legacy Hadoop environment required three times the data replication to achieve high availability, which resulted in a large infrastructure footprint. In this architecture, we had a data ingestion cluster to ingest data from a Kafka streaming service, MySQL, and Oracle databases. We had extract, transform, and load (ETL) jobs for each data source and data domains or models, and most of the ETL jobs filter, curate, canonicalize, and aggregate data (by specific keys) using MapReduce framework and load in HBase as well as in HDFS or Amazon Simple Storage Service (Amazon S3) in Apache Parquet format. We used HBase to provide on-demand query and aggregation of data via REST APIs that used HBase coprocessors to apply aggregation and other business logic. Our independent reporting cluster queried Parquet files on HDFS and Amazon S3 with Apache Drill to generate a few dozen periodic reports. We had separated HBase and ETL clusters from reporting clusters to avoid any resource contention.

Our legacy environment had challenges at various levels:

  • Hardware – As the hardware aged, we encountered hardware failures on a regular basis. Expiring warranties on hardware and faulty component replacement increased operational risk. The burden of managing the hardware replacement and servers failing to restart after maintenance imposed a serious risk to the business, which made maintenance unpredictable and time-consuming.
  • Software – Yearly software license renewal costs and engineering efforts involved with software version upgrades to keep it on a supported version added operational complexity. Moreover, the commercial Hadoop distribution that we were running reached end of life in 2020.
  • Scaling – We needed to scale on-premises hardware to meet growing business needs during additional satellite launches that required forecasting and capacity planning. Delays in procurement and shipment of hardware affected project timelines. Finally, increasing data usage and customer adoption of this portal presented serious scaling challenges for Viasat.

How migration to Amazon EMR helped solve this challenge

Viasat evaluated a few alternatives to modernize big data applications and determined that Amazon EMR would be the right platform for our requirements. The separate compute and storage architecture of Amazon EMR helped us address our challenges. The following are some of the key benefits we realized with migration to AWS:

  • Storage – Amazon EMR supports HBase on Amazon S3, where Amazon S3 is used as persistent storage for the HBase cluster and allows us to scale our compute needs independently of storage. It also allows us to easily decommission HBase clusters, test upgrades, and optimizes our total cost of ownership. For guidelines and best practices, see Migrating to Apache HBase on Amazon S3 on Amazon EMR.
  • DNS records – Because it’s so easy for us to provision new HBase clusters, we needed a way to maintain DNS records to make the cluster easily accessible. We use a simple AWS Lambda function to update DNS records during EMR cluster boot up. The DNS records are stored in our custom DNS service and we use a custom API to update the records.
  • Customization – Amazon EMR allows you to customize existing software on the cluster as well as install additional software. We use Apache Drill for reporting and, with EMR bootstrap actions, we were able to install Apache Drill on all the nodes of the reporting cluster to provide us with distributed reporting using Parquet files generated with a MapReduce job. Because our reporting uses different query patterns than the data in the HBase cluster, the Parquet files are written with a different partition optimized for reporting. We increased the default bucket size from approximately 8 MB to 16 MB and pointed Amazon EMR to private Amazon S3 endpoints to avoid traffic going through an external firewall, which increased performance.

The following diagram depicts the process we followed for migration to Amazon EMR.

Viasat successfully migrated our on-premises big data applications to Amazon EMR in May 2021, following a lift-and-shift approach to move the big data workload to the cloud with minimal changes. Although we have an experienced big data team, we used AWS Infrastructure Event Management (IEM) to support queries on fine-tuning the Amazon EMR infrastructure within the migration timeline.

The following diagram outlines our new architecture. With this new architecture, we can process the same workloads with 50% of the compute footprint and approximately 50% of the costs compared to our on-premises clusters and still meet our SLAs.

Conclusion

With the new data platform, we can ingest additional data sources so that our analysts and customer service teams can gain insights and improve customer experience. As Viasat is launching new satellites and growing business in multiple new countries, we’re looking to stand up this solution in new AWS Regions (closest to the host country) and scale it as needed.

Questions or feedback? Send an email to [email protected].


About the Authors

Manoj Gundawar is a product owner at Viasat. He builds product roadmap, provides architecture guidance and manages full software development life cycle to build high quality product/software with minimal TCO. He is passionate about delighting the customers by providing innovating solutions, leveraging technology, agile methodology and continues improvement mindset.

Archana Srinivasan is a Technical Account Manager within Enterprise Support at Amazon Web Services. Archana helps AWS customers leverage Enterprise Support entitlements to solve complex operational challenges and accelerate their cloud adoption.

Kiran Guduguntla is a WW Go-to-Market Specialist for Amazon EMR at AWS. He works with AWS customers across the globe to strategize, build, develop and deploy modern Big Data solutions. He is passionate about working with customers and helping them in their cloud journey. Kiran loves music, travel, food and watching football.

Automated security and compliance remediation at HDI

Post Syndicated from Uladzimir Palkhouski original https://aws.amazon.com/blogs/devops/automated-security-and-compliance-remediation-at-hdi/

with Dr. Malte Polley (HDI Systeme AG – Cloud Solutions Architect)

At HDI, one of the biggest European insurance group companies, we use AWS to build new services and capabilities and delight our customers. Working in the financial services industry, the company has to comply with numerous regulatory requirements in the areas of data protection and FSI regulations such as GDPR, German Supervisory Requirements for IT (VAIT) and Supervision of Insurance Undertakings (VAG). The same security and compliance assessment process in the cloud supports development productivity and organizational agility, and helps our teams innovate at a high pace and meet the growing demands of our internal and external customers.

In this post, we explore how HDI adopted AWS security and compliance best practices. We describe implementation of automated security and compliance monitoring of AWS resources using a combination of AWS and open-source solutions. We also go through the steps to implement automated security findings remediation and address continuous deployment of new security controls.

Background

Data analytics is the key capability for understanding our customers’ needs, driving business operations improvement, and developing new services, products, and capabilities for our customers. We needed a cloud-native data platform of virtually unlimited scale that offers descriptive and prescriptive analytics capabilities to internal teams with a high innovation pace and short experimentation cycles. One of the success metrics in our mission is time to market, therefore it’s important to provide flexibility to internal teams to quickly experiment with new use cases. At the same time, we’re vigilant about data privacy. Having a secure and compliant cloud environment is a prerequisite for every new experiment and use case on our data platform.

Cloud security and compliance implementation in the cloud is a shared effort between the Cloud Center of Competence team (C3), the Network Operation Center (NoC), and the product and platform teams. The C3 team is responsible for new AWS account provisioning, account security, and compliance baseline setup. Cross-account networking configuration is established and managed by the NoC team. Product teams are responsible for AWS services configuration to meet their requirements in the most efficient way. Typically, they deploy and configure infrastructure and application stacks, including the following:

We were looking for security controls model that would allow us to continuously monitor infrastructure and application components set up by all the teams. The model also needed to support guardrails that allowed product teams to focus on new use case implementation, but also inherited the security and compliance best practices promoted and ensured within our company.

Security and compliance baseline definition

We started with the AWS Well-Architected Framework Security Pillar whitepaper, which provides implementation guidance on the essential areas of security and compliance in the cloud, including identity and access management, infrastructure security, data protection, detection, and incident response. Although all five elements are equally important for implementing enterprise-grade security and compliance in the cloud, we saw an opportunity to improve controls of on-premises environments by automating detection and incident response elements. The continuous monitoring of AWS infrastructure and application changes complemented by the automated incident response of the security baseline helps us foster security best practices and allows for a high innovation pace. Manual security reviews are no longer required to asses security posture.

Our security and compliance controls framework is based on GDPR and several standards and programs, including ISO 27001, C5. Translation of the controls framework into the security and compliance baseline definition in the cloud isn’t always straightforward, so we use a number of guidelines. As a starting point, we use CIS Amazon Web Services benchmarks, because it’s a prescriptive recommendation and its controls cover multiple AWS security areas, including identity and access management, logging and monitoring configuration, and network configuration. CIS benchmarks are industry-recognized cyber security best practices and recommendations that cover a wide range of technology families, and are used by enterprise organizations around the world. We also apply GDPR compliance on AWS recommendations and AWS Foundational Security Best Practices, extending controls recommended by CIS AWS Foundations Benchmarks in multiple control areas: inventory, logging, data protection, access management, and more.

Security controls implementation

AWS provides multiple services that help implement security and compliance controls:

  • AWS CloudTrail provides a history of events in an AWS account, including those originating from command line tools, AWS SDKs, AWS APIs, or the AWS Management Console. In addition, it allows exporting event history for further analysis and subscribing to specific events to implement automated remediation.
  • AWS Config allows you to monitor AWS resource configuration, and automatically evaluate and remediate incidents related to unexpected resources configuration. AWS Config comes with pre-built conformance pack sample templates designed to help you meet operational best practices and compliance standards.
  • Amazon GuardDuty provides threat detection capabilities that continuously monitor network activity, data access patterns, and account behavior.

With multiple AWS services to use as building blocks for continuous monitoring and automation, there is a strong need for a consolidated findings overview and unified remediation framework. This is where AWS Security Hub comes into play. Security Hub provides built-in security standards and controls that make it easy to enable foundational security controls. Then, Security Hub integrates with CloudTrail, AWS Config, GuardDuty, and other AWS services out of the box, which eliminates the need to develop and maintain integration code. Security Hub also accepts findings from third-party partner products and provides APIs for custom product integration. Security Hub significantly reduces the effort to consolidate audit information coming from multiple AWS-native and third-party channels. Its API and supported partner products ecosystem gave us confidence that we can adhere to changes in security and compliance standards with low effort.

While AWS provides a rich set of services to manage risk at the Three Lines Model, we were looking for wider community support in maintaining and extending security controls beyond those defined by CIS benchmarks and compliance and best practices recommendations on AWS. We came across Prowler, an open-source tool focusing on AWS security assessment and auditing and infrastructure hardening. Prowler implements CIS AWS benchmark controls and has over 100 additional checks. We appreciated Prowler providing checks that helped us meet GDPR and ISO 27001 requirements, specifically. Prowler delivers assessment reports in multiple formats, which makes it easy to implement reporting archival for future auditing needs. In addition, Prowler integrates well with Security Hub, which allows us to use a single service for consolidating security and compliance incidents across a number of channels.

We came up with the solution architecture depicted in the following diagram.

Automated remediation solution architecture HDI

Automated remediation solution architecture HDI

Let’s look closely into the most critical components of this solution.

Prowler is a command line tool that uses the AWS Command Line Interface (AWS CLI) and a bash script. Individual Prowler checks are bash scripts organized into groups by compliance standard or AWS service. By supplying corresponding command line arguments, we can run Prowler against a specific AWS Region or multiple Regions at the same time. We can run Prowler in multiple ways; we chose to run it as an AWS Fargate task for Amazon Elastic Container Service (Amazon ECS). Fargate is a serverless compute engine that runs Docker-compatible containers. ECS Fargate tasks are scheduled tasks that make it easy to perform periodic assessments of an AWS account and export findings. We configured Prowler to run every 7 days in every account and Region it’s deployed into.

Security Hub acts as a single place for consolidating security findings from multiple sources. When Security Hub is enabled in a given Region, CIS AWS Foundations Benchmark and Foundational Security Best Practices standards are enabled as well. Enabling these standards also configures integration with AWS Config and Guard Duty. Integration with Prowler requires enabling product integration on the Security Hub side by calling the EnableImportFindingsForProduct API action for a given product. Because Prowler supports integration with Security Hub out of the box, posting security findings is a matter of passing the right command line arguments: -M json-asff to format reports as AWS Security Findings Format and -S to ship findings to Security Hub.

Automated security findings remediation is implemented using AWS Lambda functions and the AWS SDK for Python (Boto3). The remediation function can be triggered in two ways: automatically in response to a new security finding, or by a security engineer from the Security Hub findings page. In both cases, the same Lambda function is used. Remediation functions implement security standards in accordance with recommendations, whether they’re CIS AWS Foundations Benchmark and Foundational Security Best Practices standards, or others.

The exact activities performed depend on the security findings type and its severity. Examples of activities performed include deleting non-rotated AWS Identity and Access Management (IAM) access keys, enabling server-side encryption for S3 buckets, and deleting unencrypted Amazon Elastic Block Store (Amazon EBS) volumes.

To trigger the Lambda function, we use Amazon EventBridge, which makes it easy to build an event-driven remediation engine and allows us to define Lambda functions as targets for Security Hub findings and custom actions. EventBridge allows us to define filters for security findings and therefore map finding types to specific remediation functions. Upon successfully performing security remediation, each function updates one or more Security Hub findings by calling the BatchUpdateFindings API and passing the corresponding finding ID.

The following example code shows a function enforcing an IAM password policy:

import boto3
import os
import logging
from botocore.exceptions import ClientError

iam = boto3.client("iam")
securityhub = boto3.client("securityhub")

log_level = os.environ.get("LOG_LEVEL", "INFO")
logging.root.setLevel(logging.getLevelName(log_level))
logger = logging.getLogger(__name__)


def lambda_handler(event, context, iam=iam, securityhub=securityhub):
    """Remediate findings related to cis15 and cis11.

    Params:
        event: Lambda event object
        context: Lambda context object
        iam: iam boto3 client
        securityhub: securityhub boto3 client
    Returns:
        No returns
    """
    finding_id = event["detail"]["findings"][0]["Id"]
    product_arn = event["detail"]["findings"][0]["ProductArn"]
    lambda_name = os.environ["AWS_LAMBDA_FUNCTION_NAME"]
    try:
        iam.update_account_password_policy(
            MinimumPasswordLength=14,
            RequireSymbols=True,
            RequireNumbers=True,
            RequireUppercaseCharacters=True,
            RequireLowercaseCharacters=True,
            AllowUsersToChangePassword=True,
            MaxPasswordAge=90,
            PasswordReusePrevention=24,
            HardExpiry=True,
        )
        logger.info("IAM Password Policy Updated")
    except ClientError as e:
        logger.exception(e)
        raise e
    try:
        securityhub.batch_update_findings(
            FindingIdentifiers=[{"Id": finding_id, "ProductArn": product_arn},],
            Note={
                "Text": "Changed non compliant password policy",
                "UpdatedBy": lambda_name,
            },
            Workflow={"Status": "RESOLVED"},
        )
    except ClientError as e:
        logger.exception(e)
        raise e

A key aspect in developing remediation Lambda functions is testability. To quickly iterate through testing cycles, we cover each remediation function with unit tests, in which necessary dependencies are mocked and replaced with stub objects. Because no Lambda deployment is required to check remediation logic, we can test newly developed functions and ensure reliability of existing ones in seconds.

Each Lambda function developed is accompanied with an event.json document containing an example of an EventBridge event for a given security finding. A security finding event allows us to verify remediation logic precisely, including deletion or suspension of non-compliant resources or a finding status update in Security Hub and the response returned. Unit tests cover both successful and erroneous remediation logic. We use pytest to develop unit tests, and botocore.stub and moto to replace runtime dependencies with mocks and stubs.

Automated security findings remediation

The following diagram illustrates our security assessment and automated remediation process.

Automated remediation flow HDI

The workflow includes the following steps:

  1. An existing Security Hub integration performs periodic resource audits. The integration posts new security findings to Security Hub.
  2. Security Hub reports the security incident to the company’s centralized Service Now instance by using the Service Now ITSM Security Hub integration.
  3. Security Hub triggers automated remediation:
    1. Security Hub triggers the remediation function by sending an event to EventBridge. The event has a source field equal to aws.securityhub, with the filter ID corresponding to the specific finding type and compliance status as FAILED. The combination of these fields allows us to map the event to a particular remediation function.
    2. The remediation function starts processing the security finding event.
    3. The function calls the UpdateFindings Security Hub API to update the security finding status upon completing remediation.
    4. Security Hub updates the corresponding security incident status in Service Now (Step 2)
  4. Alternatively, the security operations engineer resolves the security incident in Service Now:
    1. The engineer reviews the current security incident in Service Now.
    2. The engineer manually resolves the security incident in Service Now.
    3. Service Now updates the finding status by calling the UpdateFindings Security Hub API. Service Now uses the AWS Service Management Connector.
  5. Alternatively, the platform security engineer triggers remediation:
    1. The engineer reviews the currently active security findings on the Security Hub findings page.
    2. The engineer triggers remediation from the security findings page by selecting the appropriate action.
    3. Security Hub triggers the remediation function by sending an event with the source aws.securityhub to EventBridge. The automated remediation flow continues as described in the Step 3.

Deployment automation

Due to legal requirements, HDI uses the infrastructure as code (IaC) principle while defining and deploying AWS infrastructure. We started with AWS CloudFormation templates defined as YAML or JSON format. The templates are static by nature and define resources in a declarative way. We figured out that as our solution complexity grows, the CloudFormation templates also grow in size and complexity, because all the resources deployed have to be explicitly defined. We wanted a solution to increase our development productivity and simplify infrastructure definition.

The AWS Cloud Development Kit (AWS CDK) helped us in two ways:

  • The AWS CDK provides ready-to-use building blocks called constructs. These constructs include pre-configured AWS services following best practices. For example, a Lambda function always gets an IAM role with an IAM policy to be able to write logs to CloudWatch Logs.
  • The AWS CDK allows us to use high-level programming languages to define configuration of all AWS services. Imperative definition allows us to build our own abstractions and reuse them to achieve concise resource definition.

We found that implementing IaC with the AWS CDK is faster and less error-prone. At HDI, we use Python to build application logic and define AWS infrastructure. The imperative nature of the AWS CDK is truly a turning point in fulfilling legal requirements and achieving high developer productivity at the same time.

One of the AWS CDK constructs we use is AWS CDK pipeline. This construct creates a customizable continuous integration and continuous delivery (CI/CD) pipeline implemented with AWS CodePipeline. The source action is based on AWS CodeCommit. The synth action is responsible for creating a CloudFormation template from the AWS CDK project. The synth action also runs unit tests on remediations functions. The pipeline actions are connected via artifacts. Lastly, the AWS CDK pipeline constructs offer a self-mutating feature, which allows us to maintain the AWS CDK project as well as the pipeline in a single code repository. Changes of the pipeline definition as well as automated remediation solutions are deployed seamlessly. The actual solution deployment is also implemented as a CI/CD stage. Stages can be eventually deployed in cross-Region and cross-account patterns. To use cross-account deployments, the AWS CDK provides a bootstrap functionality to create a trust relationship between AWS accounts.

The AWS CDK project is broken down to multiple stacks. To deploy the CI/CD pipeline, we run the cdk deploy cicd-4-securityhub command. To add a new Lambda remediation function, we must add remediation code, optional unit tests, and finally the Lambda remediation configuration object. This configuration object defines the Lambda function’s environment variables, necessary IAM policies, and external dependencies. See the following example code of this configuration:

prowler_729_lambda = {
    "name": "Prowler 7.29",
    "id": "prowler729",
    "description": "Remediates Prowler 7.29 by deleting/terminating unencrypted EC2 instances/EBS volumes",
    "policies": [
        _iam.PolicyStatement(
            effect=_iam.Effect.ALLOW,
            actions=["ec2:TerminateInstances", "ec2:DeleteVolume"],
            resources=["*"])
        ],
    "path": "delete_unencrypted_ebs_volumes",
    "environment_variables": [
        {"key": "ACCOUNT_ID", "value": core.Aws.ACCOUNT_ID}
    ],
    "filter_id": ["prowler-extra729"],
 }

Remediation functions are organized in accordance with the security and compliance frameworks they belong to. The AWS CDK code iterates over remediation definition lists and synthesizes corresponding policies and Lambda functions to be deployed later. Committing Git changes and pushing them triggers the CI/CD pipeline, which deploys the newly defined remediation function and adjusts the configuration of Prowler.

We are working on publishing the source code discussed in this blog post.

Looking forward

As we keep introducing new use cases in the cloud, we plan to improve our solution in the following ways:

  • Continuously add new controls based on our own experience and improving industry standards
  • Introduce cross-account security and compliance assessment by consolidating findings in a central security account
  • Improve automated remediation resiliency by introducing remediation failure notifications and retry queues
  • Run a Well-Architected review to identify and address possible areas of improvement

Conclusion

Working on the solution described in this post helped us improve our security posture and meet compliancy requirements in the cloud. Specifically, we were able to achieve the following:

  • Gain a shared understanding of security and compliance controls implementation as well as shared responsibilities in the cloud between multiple teams
  • Speed up security reviews of cloud environments by implementing continuous assessment and minimizing manual reviews
  • Provide product and platform teams with secure and compliant environments
  • Lay a foundation for future requirements and improvement of security posture in the cloud

The content and opinions in this post are those of the third-party author and AWS is not responsible for the content or accuracy of this post.

About the Authors

Malte Polley - Cloud Solutions Architect

Malte Polley – Cloud Solutions Architect

Dr. Malte Polley

Dr. Malte Polley is a Cloud Solutions Architect of Modern Data Platform (MDP) at HDI Germany. MDP focuses on DevSecOps practices applied to data analytics and provides secure and compliant environment for every data product at HDI Germany. As a cloud enthusiast Malte runs AWS Hannover user group. When not working, Malte enjoys hiking with his family and improving his backyard vegetable garden.

Uladzimir Palkhouski - Sr. Solutions Architect

Uladzimir Palkhouski – Sr. Solutions Architect

Uladzimir Palkhouski

Uladzimir Palkhouski is a Sr. Solutions Architect at Amazon Web Services. Uladzimir supports German financial services industry customers on their cloud journey. He helps finding practical forward looking solutions to complex technical and business challenges.

How NortonLifelock built a serverless architecture for real-time analysis of their VPN usage metrics

Post Syndicated from Madhu Nunna original https://aws.amazon.com/blogs/big-data/how-nortonlifelock-built-a-serverless-architecture-for-real-time-analysis-of-their-vpn-usage-metrics/

This post presents a reference architecture and optimization strategies for building serverless data analytics solutions on AWS using Amazon Kinesis Data Analytics. In addition, this post shows the design approach that the engineering team at NortonLifeLock took to build out an operational analytics platform that processes usage data for their VPN services, consuming petabytes of data across the globe on a daily basis.

NortonLifeLock is a global cybersecurity and internet privacy company that offers services to millions of customers for device security, and identity and online privacy for home and family. NortonLifeLock believes the digital world is only truly empowering when people are confident in their online security. NortonLifeLock has been an AWS customer since 2014.

For any organization, the value of operational data and metrics decreases with time. This lost value can equate to lost revenue and wasted resources. Real-time streaming analytics helps capture this value and provide new insights that can create new business opportunities.

AWS offers a rich set of services that you can use to provide real-time insights and historical trends. These services include managed Hadoop infrastructure services on Amazon EMR as well as serverless options such as Kinesis Data Analytics and AWS Glue.

Amazon EMR also supports multiple programming options for capturing business logic, such as Spark Streaming, Apache Flink, and SQL.

As a customer, it’s important to understand organizational capabilities, project timelines, business requirements, and AWS service best practices in order to define an optimal architecture from performance, cost, security, reliability, and operational excellence perspectives (the five pillars of the AWS Well-Architected Framework).

NortonLifeLock is taking a methodical approach to real-time analytics on AWS while using serverless technology to deliver on key business drivers such as time to market and total cost of ownership. In addition to NortonLifeLock’s implementation, this post provides key lessons learned and best practices for rapid development of real-time analytics workloads.

Business problem

NortonLifeLock offers a VPN product as a freemium service to users. Therefore, they need to enforce usage limits in real time to stop freemium users from using the service when their usage is over the limit. The challenge for NortonLifeLock is to do this in a reliable and affordable fashion.

NortonLifeLock runs its VPN infrastructure in almost all AWS Regions. Migrating to AWS from smaller hosting vendors has greatly improved user experience and VPN edge server performance, including a reduction in connection latency, time to connect and connection errors, faster upload and download speed, and more stability and uptime for VPN edge servers.

VPN usage data is collected by VPN edge servers and uploaded to backend stats servers every minute and persisted in backend databases. The usage information serves multiple purposes:

  • Displaying how much data a device has consumed for the past 30 days.
  • Enforcing usage limits on freemium accounts. When a user exhausts their free quota, that user is unable to connect through VPN until the next free cycle.
  • Analyzing usage data by the internal business intelligence (BI) team based on time, marketing campaigns, and account types, and using this data to predict future growth, ability to retain users, and more.

Design challenge

NortonLifeLock had the following design challenges:

  • The solution must be able to simultaneously satisfy both real-time and batch analysis.
  • The solution must be economical. NortonLifeLock VPN has hundreds of thousands of concurrent users, and if a user’s usage information is persisted as it comes in, it results in tens of thousands of reads and writes per second and tens of thousands of dollars a month in database costs.

Solution overview

NortonLifeLock decided to split storage into two parts by storing usage data in Amazon DynamoDB for real-time access and in Amazon Simple Storage Service (Amazon S3) for analysis, which addresses real-time enforcement and BI needs. Kinesis Data Analytics aggregates and loads data to Amazon S3 and DynamoDB. With Amazon Kinesis Data Streams and AWS Lambda as consumers of Kinesis Data Analytics, the implementation of user and device-level aggregations was simplified.

To keep costs down, user usage data was aggregated by the hour and persisted in DynamoDB. This spread hundreds of thousands of writes over an hour and reduced DynamoDB cost by 30 times.

Although increasing aggregation might not be an option for other problem domains, it’s acceptable in this case because it’s not necessary to be precise to the minute for user usage, and it’s acceptable to calculate and enforce the usage limit every hour.

The following diagram illustrates the high-level architecture. The solution is broken into three logical parts:

  • End-users – Real-time queries from devices to display current usage information (how much data is used daily)
  • Business analysts – Query historical usage information through Amazon Athena to extract business insights
  • Usage limit enforcement – Usage data ingestion and aggregation in real time

The solution has the following workflow:

  1. Usage data is collected by a VPN edge server and sends it to the backend service through Application Load Balancer.
  2. A single usage data record sent by the VPN edge server contains usage data for many users. A stats splitter splits the message into individual usage stats per user and forwards the message to Kinesis Data Streams.
  3. Usage data is consumed by both the legacy stats processor and the new Apache Flink application developed and deployed on Kinesis Data Analytics.
  4. The Apache Flink application carries out the following tasks:
    1. Aggregate device usage data hourly and send the aggregated result to Amazon S3 and the outgoing Kinesis data stream, which is picked up by a Lambda function that persists the usage data in DynamoDB.
    2. Aggregate device usage data daily and send the aggregated result to Amazon S3.
    3. Aggregate account usage data hourly and forward the aggregated results to the outgoing data stream, which is picked up by a Lambda function that checks if account usage is over the limit for that account. If account usage is over the limit, the function forwards the account information to another Lambda function, via Amazon Simple Queue Service (Amazon SQS), to cut off access on that account.

Design journey

NortonLifeLock needed a solution that was capable of real-time streaming and batch analytics. Kinesis Data Analysis fits this requirement because of the following key features:

  • Real-time streaming and batch analytics for data aggregation
  • Fully managed with a pay-as-you-go model
  • Auto scaling

NortonLifeLock needed Kinesis Data Analytics to do the following:

  • Aggregate customer usage data per device hourly and send results to Kinesis Data Streams (ultimately to DynamoDB) and the data lake (Amazon S3)
  • Aggregate customer usage data per account hourly and send results to Kinesis Data Streams (ultimately to DynamoDB and Lambda, which enforces usage limit)
  • Aggregate customer usage data per device daily and send results to the data lake (Amazon S3)

The legacy system processes usage data from an incoming Kinesis data stream, and they plan to use Kinesis Data Analytics to consume and process production data from the same stream. As such, NortonLifeLock started with SQL applications on Kinesis Data Analytics.

First attempt: Kinesis Data Analytics for SQL

Kinesis Data Analytics with SQL provides a high-level SQL-based abstraction for real-time stream processing and analytics. It’s configuration driven and very simple to get started. NortonLifeLock was able to create a prototype from scratch, get to production, and process the production load in less than 2 weeks. The solution met 90% of the requirements, and there were alternates for the remaining 10%.

However, they started to receive “read limit exceeded” alerts from the source data stream, and the legacy application was read throttled. With Amazon Support’s help, they traced the issues to the drastic reversal of the Kinesis Data Analytics MillisBehindLatest metric in Kinesis record processing. This was correlated to the Kinesis Data Analytics auto scaling events and application restarts, as illustrated by the following diagram. The highlighted areas show the correlation between spikes due to autoscaling and reversal of MillisBehindLatest metrics.

Here’s what happened:

  • Kinesis Data Analytics for SQL scaled up KPU due to load automatically, and the Kinesis Data Analytics application was restarted (part of scaling up).
  • Kinesis Data Analytics for SQL supports the at least once delivery model and uses checkpoints to ensure no data loss. But it doesn’t support taking a snapshot and restoring from the snapshot after a restart. For more details, see Delivery Model for Persisting Application Output to an External Destination.
  • When the Kinesis Data Analytics for SQL application was restarted, it needed to reprocess data from the beginning of the aggregation window, resulting in a very large number of duplicate records, which led to a dramatic increase in the Kinesis Data Analytics MillisBehindLatest metric.
  • To catch up with incoming data, Kinesis Data Analytics started re-reading from the Kinesis data stream, which led to over-consumption of read throughput and the legacy application being throttled.

In summary, Kinesis Data Analytics for SQL’s duplicates record processing on restarts, no other means to eliminate duplicates, and limited ability to control auto scaling led to this issue.

Although they found Kinesis Data Analytics for SQL easy to get started, these limitations demanded other alternatives. NortonLifeLock reached out to the Kinesis Data Analytics team and discussed the following options:

  • Option 1 – AWS was planning to release a new service, Kinesis Data Analytics Studio for SQL, Python, and Scala, which addresses these limitations. But this service was still a few months away (this service is now available, launched May 27, 2021).
  • Option 2 – The alternative was to switch to Kinesis Data Analytics for Apache Flink, which also provides the necessary tools to address all their requirements.

Second attempt: Kinesis Data Analytics for Apache Flink

Apache Flink has a comparatively steep learning curve (we used Java for streaming analytics instead of SQL), and it took about 4 weeks to build the same prototype, deploy it to Kinesis Data Analytics, and test the application in production. NortonLifeLock had to overcome a few hurdles, which we document in this section along with the lessons learned.

Challenge 1: Too many writes to outgoing Kinesis data stream

The first thing they noticed was that the write threshold on the outgoing Kinesis data stream was greatly exceeded. Kinesis Data Analytics was attempting to write 10 times the amount of expected data to the data stream, with 95% of data throttled.

After a lengthy investigation, it turned out that having too much parallelism in the Kinesis Data Analytics application led to this issue. They had followed default recommendations and set parallelism to 12 and it scaled up to 16. This means that every hour, 16 separate threads were attempting to write to the destination data stream simultaneously, leading to massive contention and writes throttled. These threads attempted to retry continuously, until all records were written to the data stream. This resulted in 10 times the amount of data processing attempted, even though only one tenth of the writes eventually succeeded.

The solution was to reduce parallelism to 4 and disable auto scaling. In the preceding diagram, the percentage of throttled records dropped to 0 from 95% after they reduced parallelism to 4 in the Kinesis Data Analytics application. This also greatly improved KPU utilization and reduced Kinesis Data Analytics cost from $50 a day to $8 a day.

Challenge 2: Use Kinesis Data Analytics sink aggregation

After tuning parallelism, they still noticed occasional throttling by Kinesis Data Streams because of the number of records being written, not record size. To overcome this, they turned on Kinesis Data Analytics sink aggregation to reduce the number of records being written to the data stream, and the result was dramatic. They were able to reduce the number of writes by 1,000 times.

Challenge 3: Handle Kinesis Data Analytics Flink restarts and the resulting duplicate records

Kinesis Data Analytics applications restart because of auto scaling or recovery from application or task manager crashes. When this happens, Kinesis Data Analytics saves a snapshot before shutdown and automatically reloads the latest snapshot and picks up where the work was left off. Kinesis Data Analytics also saves a checkpoint every minute so no data is lost, guaranteeing exactly-once processing.

However, when the Kinesis Data Analytics application shut down in the middle of sending results to Kinesis Data Streams, it doesn’t guarantee exactly-once data delivery. In fact, Flink only guarantees at least once delivery to Kinesis Data Analytics sink, meaning that Kinesis Data Analytics guarantees to send a record at least once, which leads to duplicate records sent when Kinesis Data Analytics is restarted.

How were duplicate records handled in the outgoing data stream?

Because duplicate records aren’t handled by Kinesis Data Analytics when sinks do not have exactly-once semantics, the downstream application must deal with the duplicate records. The first question you should ask is whether it’s necessary to deal with the duplicate records. Maybe it’s acceptable to tolerate duplicate records in your application? This, however, is not an option for NortonLifeLock, because no user wants to have their available usage taken twice within the same hour. So, logic had to be built in the application to handle duplicate usage records.

To deal with duplicate records, you can employ a strategy in which the application saves an update timestamp along with the user’s latest usage. When a record comes in, the application reads existing daily usage and compares the update timestamp against the current time. If the difference is less than a configured window (50 minutes if the aggregation window is 60 minutes), the application ignores the new record because it’s a duplicate. It’s acceptable for the application to potentially undercount vs. overcount user usage.

How were duplicate records handled in the outgoing S3 bucket?

Kinesis Data Analytics writes temporary files in Amazon S3 before finalizing and removing them. When Kinesis Data Analytics restarts, it attempts to write new S3 files, and potentially leaves behind temporary S3 files because of restart. Because Athena ignores all temporary S3 files, no further is action needed. If your BI tools take temporary S3 files into consideration, you have to configure the Amazon S3 lifecycle policy to clean up temporary S3 files after a certain time.

Conclusion

NortonLifelock has been successfully running a Kinesis Data Analytics application in production since May 2021. It provides several key benefits. VPN users can now keep track of their usage in near-real time. BI analysts can get timely insights that are used for targeted sales and marketing campaigns, and upselling features and services. VPN usage limits are enforced in near-real time, thereby optimizing the network resources. NortonLifelock is saving tens of thousands of dollars each month with this real-time streaming analytics solution. And this telemetry solution is able to keep up with petabytes of data flowing through their global VPN service, which is seeing double-digit monthly growth.

To learn more about Kinesis Data Analytics and getting started with serverless streaming solutions on AWS, please see Developer Guide for Studio, the easiest way to build Apache Flink applications in SQL, Python, Scala in a notebook interface.


About the Authors

Lei Gu has 25 years of software development experience and the architect for three key Norton products, Norton Secure Backup, VPN and Norton Family. He is passionate about cloud transformation and most recently spoke about moving from Cassandra to Amazon DynamoDB at AWS re:Invent 2019. Check out his Linkedin profile at https://www.linkedin.com/in/leigu/.

Madhu Nunna is a Sr. Solutions Architect at AWS, with over 20 years of experience in networks and cloud, with the last two years focused on AWS Cloud. He is passionate about Analytics and AI/ML. Outside of work, he enjoys hiking and reading books on philosophy, economics, history, astronomy and biology.

Integral Ad Science secures self-service data lake using AWS Lake Formation

Post Syndicated from Mat Sharpe original https://aws.amazon.com/blogs/big-data/integral-ad-science-secures-self-service-data-lake-using-aws-lake-formation/

This post is co-written with Mat Sharpe, Technical Lead, AWS & Systems Engineering from Integral Ad Science.

Integral Ad Science (IAS) is a global leader in digital media quality. The company’s mission is to be the global benchmark for trust and transparency in digital media quality for the world’s leading brands, publishers, and platforms. IAS does this through data-driven technologies with actionable real-time signals and insight.

In this post, we discuss how IAS uses AWS Lake Formation and Amazon Athena to efficiently manage governance and security of data.

The challenge

IAS processes over 100 billion web transactions per day. With strong growth and changing seasonality, IAS needed a solution to reduce cost, eliminate idle capacity during low utilization periods, and maximize data processing speeds during peaks to ensure timely insights for customers.

In 2020, IAS deployed a data lake in AWS, storing data in Amazon Simple Storage Service (Amazon S3), cataloging its metadata in the AWS Glue Data Catalog, ingesting and processing using Amazon EMR, and using Athena to query and analyze the data. IAS wanted to create a unified data platform to meet its business requirements. Additionally, IAS wanted to enable self-service analytics for customers and users across multiple business units, while maintaining critical controls over data privacy and compliance with regulations such as GDPR and CCPA. To accomplish this, IAS needed to securely ingest and organize real-time and batch datasets, as well as secure and govern sensitive customer data.

To meet the dynamic nature of IAS’s data and use cases, the team needed a solution that could define access controls by attribute, such as classification of data and job function. IAS processes significant volumes of data and this continues to grow. To support the volume of data, IAS needed the governance solution to scale in order to create and secure many new daily datasets. This meant IAS could enable self-service access to data from different tools, such as development notebooks, the AWS Management Console, and business intelligence and query tools.

To address these needs, IAS evaluated several approaches, including a manual ticket-based onboarding process to define permissions on new datasets, many different AWS Identity and Access Management (IAM) policies, and an AWS Lambda based approach to automate defining Lake Formation table and column permissions triggered by changes in security requirements and the arrival of new datasets.

Although these approaches worked, they were complex and didn’t support the self-service experience that IAS data analysts required.

Solution overview

IAS selected Lake Formation, Athena, and Okta to solve this challenge. The following architectural diagram shows how the company chose to secure its data lake.

The solution needed to support data producers and consumers in multiple AWS accounts. For brevity, this diagram shows a central data lake producer that includes a set of S3 buckets for raw and processed data. Amazon EMR is used to ingest and process the data, and all metadata is cataloged in the data catalog. The data lake consumer account uses Lake Formation to define fine-grained permissions on datasets shared by the producer account; users logging in through Okta can run queries using Athena and be authorized by Lake Formation.

Lake Formation enables column-level control, and all Amazon S3 access is provisioned via a Lake Formation data access role in the query account, ensuring only that service can access the data. Each business unit with access to the data lake is provisioned with an IAM role that only allows limited access to:

  • That business unit’s Athena workgroup
  • That workgroup’s query output bucket
  • The lakeformation:GetDataAccess API

Because Lake Formation manages all the data access and permissions, the configuration of the user’s role policy in IAM becomes very straightforward. By defining an Athena workgroup per business unit, IAS also takes advantage of assigning per-department billing tags and query limits to help with cost management.

Define a tag strategy

IAS commonly deals with two types of data: data generated by the company and data from third parties. The latter usually includes contractual stipulations on privacy and use.

Some data sets require even tighter controls, and defining a tag strategy is one key way that IAS ensures compliance with data privacy standards. With the tag-based access controls in Lake Formation IAS can define a set of tags within an ontology that is assigned to tables and columns. This ensures users understand available data and whether or not they have access. It also helps IAS manage privacy permissions across numerous tables with new ones added every day.

At a simplistic level, we can define policy tags for class with private and non-private, and for owner with internal and partner.

As we progressed, our tagging ontology evolved to include individual data owners and data sources within our product portfolio.

Apply tags to data assets

After IAS defined the tag ontology, the team applied tags at the database, table, and column level to manage permissions. Tags are inherited, so they only need to be applied at the highest level. For example, IAS applied the owner and class tags at the database level and relied on inheritance to propagate the tags to all the underlying tables and columns. The following diagram shows how IAS activated a tagging strategy to distinguish between internal and partner datasets , while classifying sensitive information within these datasets.

Only a small number of columns contain sensitive information; IAS relied on inheritance to apply a non-private tag to the majority of the database objects and then overrode it with a private tag on a per-column basis.

The following screenshot shows the tags applied to a database on the Lake Formation console.

With its global scale, IAS needed a way to automate how tags are applied to datasets. The team experimented with various options including string matching on column names, but the results were unpredictable in situations where unexpected column names are used (ipaddress vs. ip_address, for example). Ultimately, IAS incorporated metadata tagging into its existing infrastructure as code (IaC) process, which gets applied as part of infrastructure updates.

Define fine-grained permissions

The final piece of the puzzle was to define permission rules to associate with tagged resources. The initial data lake deployment involved creating permission rules for every database and table, with column exclusions as necessary. Although these were generated programmatically, it added significant complexity when the team needed to troubleshoot access issues. With Lake Formation tag-based access controls, IAS reduced hundreds of permission rules down to precisely two rules, as shown in the following screenshot.

When using multiple tags, the expressions are logically ANDed together. The preceding statements permit access only to data tagged non-private and owned by internal.

Tags allowed IAS to simplify permission rules, making it easy to understand, troubleshoot, and audit access. The ability to easily audit which datasets include sensitive information and who within the organization has access to them made it easy to comply with data privacy regulations.

Benefits

This solution provides self-service analytics to IAS data engineers, analysts, and data scientists. Internal users can query the data lake with their choice of tools, such as Athena, while maintaining strong governance and auditing. The new approach using Lake Formation tag-based access controls reduces the integration code and manual controls required. The solution provides the following additional benefits:

  • Meets security requirements by providing column-level controls for data
  • Significantly reduces permission complexity
  • Reduces time to audit data security and troubleshoot permissions
  • Deploys data classification using existing IaC processes
  • Reduces the time it takes to onboard data users including engineers, analysts, and scientists

Conclusion

When IAS started this journey, the company was looking for a fully managed solution that would enable self-service analytics while meeting stringent data access policies. Lake Formation provided IAS with the capabilities needed to deliver on this promise for its employees. With tag-based access controls, IAS optimized the solution by reducing the number of permission rules from hundreds down to a few, making it even easier to manage and audit. IAS continues to analyze data using more tools governed by Lake Formation.


About the Authors

Mat Sharpe is the Technical Lead, AWS & Systems Engineering at IAS where he is responsible for the company’s AWS infrastructure and guiding the technical teams in their cloud journey. He is based in New York.

Brian Maguire is a Solution Architect at Amazon Web Services, where he is focused on helping customers build their ideas in the cloud. He is a technologist, writer, teacher, and student who loves learning. Brian is the co-author of the book Scalable Data Streaming with Amazon Kinesis.

Danny Gagne is a Solutions Architect at Amazon Web Services. He has extensive experience in the design and implementation of large-scale high-performance analysis systems, and is the co-author of the book Scalable Data Streaming with Amazon Kinesis. He lives in New York City.