Post Syndicated from Ramon Diez Lejarazu original https://aws.amazon.com/blogs/big-data/jumia-builds-a-next-generation-data-platform-with-metadata-driven-specification-frameworks/
Jumia is a technology company born in 2012, present in 14 African countries, with its main headquarters in Lagos, Nigeria. Jumia is built around a marketplace, a logistics service, and a payment service. The logistics service enables the delivery of packages through a network of local partners, and the payment service facilitates the payments of online transactions within Jumia’s ecosystem. Jumia is present in NYSE and has a market cap of $554 million.
In this post, we share part of the journey that Jumia took with AWS Professional Services to modernize its data platform that ran under a Hadoop distribution to AWS serverless based solutions. Some of the challenges that motivated the modernization were the high cost of maintenance, lack of agility to scale computing at specific times, job queuing, lack of innovation when it came to acquiring more modern technologies, complex automation of the infrastructure and applications, and the inability to develop locally.
Solution overview
The basic concept of the modernization project is to create metadata-driven frameworks, which are reusable, scalable, and able to respond to the different phases of the modernization process. These phases are: data orchestration, data migration, data ingestion, data processing, and data maintenance.
This standardization for each phase was considered as a way to streamline the development workflows and minimize the risk of errors that can arise from using disparate methods. This also enabled migration of different kinds of data following a similar approach regardless of the use case. By adopting this approach, the data handling is consistent, more efficient, and more straightforward to manage across different projects and teams. In addition, although the use cases have autonomy in their domain from a governance perspective, on top of them is a centralized governance model that defines the access control in the shared architectural components. Importantly, this implementation emphasizes data protection by enforcing encryption across all services, including Amazon Simple Storage Service (Amazon S3) and Amazon DynamoDB. Furthermore, it adheres to the principle of least privilege, thereby enhancing overall system security and reducing potential vulnerabilities.
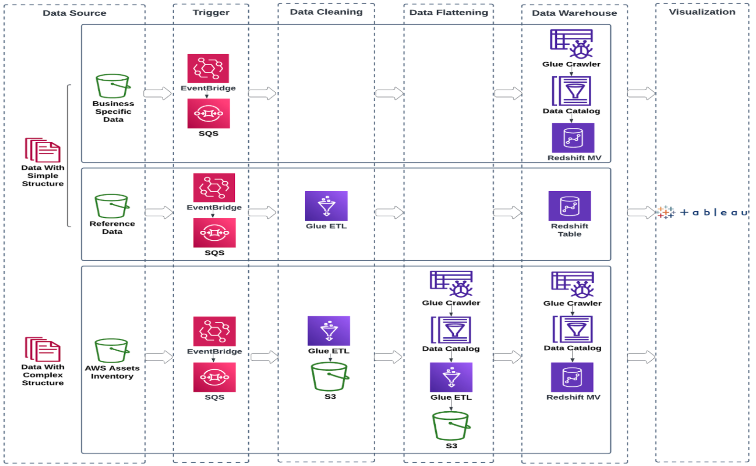
The following diagram describes the frameworks that were created. In this design, the workloads in the new data platform are divided by use case. Each use case requires the creation of a set of YAML files for each phase, from data migration to data flow orchestration, and they are basically the input of the system. The output is a set of DAGs that run the specific tasks.

In the following sections, we discuss the objectives, implementation, and learnings of each phase in more detail.
Data orchestration
The objective of this phase is to build a metadata-driven framework to orchestrate the data flows along the whole modernization process. The orchestration framework provides a robust and scalable solution that has the following capacities: dynamically create DAGs, integrate natively with non-AWS services, allow the creation of dependencies based on past executions, and add an accessible metadata generation per each execution. Therefore, it was decided to use Amazon Managed Workflows for Apache Airflow (Amazon MWAA), which, through the Apache Airflow engine, provides these functionalities while abstracting users from the management operation.
The following is the description of the metadata files that are provided as part of the data orchestration phase for a given use case that performs the data processing using Spark on Amazon EMR Serverless:
owner: # Use case owner
dags: # List of DAGs to be created for this use case
  - name: # Use case name
    type: # Type of DAG (could be migration, ingestion, transformation or maintenance)
    tags: # List of TAGs
    notification: # Defines notificacions for this DAGs
      on_success_callback: true
      on_failure_callback: true
    spark: # Spark job information
      entrypoint: # Spark script
      arguments: # Arguments required by the Spark script
      spark_submit_parameters: # Spark submit parameters.
The idea behind all the frameworks is to build reusable artifacts that enable the development teams to accelerate their work while providing reliability. In this case, the framework provides the capabilities to create DAG objects within Amazon MWAA based on configuration files (YAML files).
This particular framework is built on layers that add different functionalities to the final DAG:
- DAGs – The DAGs are built based on the metadata information provided to the framework. The data engineers don’t have to write Python code in order to create the DAGs, they are automatically created and this module is in charge of performing this dynamic creation of DAGs.
- Validations – This layer handles YAML file validation in order to prevent corrupted files from affecting the creation of other DAGs.
- Dependencies – This layer handles dependencies among different DAGs in order to handle complex interconnections.
- Notifications – This layer handles the type of notifications and alerts that are part of the workflows.

One aspect to consider when using Amazon MWAA is that, being a managed service, it requires some maintenance from the users, and it’s important to have a good understanding of the number of DAGs and processes that you’re expected to have in order to fine-tune the instance and obtain the desired performance. Some of the parameters that were fine-tuned during the engagement were core.dagbag_import_timeout, core.dag_file_processor_timeout, core.min_serialized_dag_update_interval, core.min_serialized_dag_fetch_interval, scheduler.min_file_process_interval, scheduler.max_dagruns_to_create_per_loop, scheduler.processor_poll_interval, scheduler.dag_dir_list_interval, and celery.worker_autoscale.
One of the layers described in the preceding diagram corresponds to validation. This was an important component for the creation of dynamic DAGs. Because the input to the framework consists of YML files, it was decided to filter out corrupted files before attempting to create the DAG objects. Following this approach, Jumia could avoid undesired interruptions of the whole process. The module that actually builds DAGs only receives configuration files that follow the required specifications to successfully create them. In case of corrupted files, information regarding the actual issues is logged into Amazon CloudWatch so that developers can fix them.
Data migration
The objective of this phase is to build a metadata-driven framework for migrating data from HDFS to Amazon S3 with Apache Iceberg storage format, which involves the least operational overhead, provides scalability capacity during peak hours, and guarantees data integrity and confidentiality.
The following diagram illustrates the architecture.

During this phase, a metadata-driven framework built in PySpark receives a configuration file as input so that some migration tasks can run in an Amazon EMR Serverless job. This job uses the PySpark framework as the script location. Then the orchestration framework described previously is used to create a migration DAG that runs the following tasks:
- The first task creates the DDLs in Iceberg format in the AWS Glue Data Catalog using the migration framework within an Amazon EMR Serverless job.
- After the tables are created, the second task transfers HDFS data to a landing bucket in Amazon S3 using AWS DataSync to sync customer data. This process brings data from all the different layers of the data lake.
- When this process is complete, a third task converts data to Iceberg format from the landing bucket to the destination bucket (raw, process, or analytics) using again another option of the migration framework embedded in an Amazon EMR Serverless job.
Data transfer performance is better when the size of the files to be transferred is around 128–256 MB, so it’s recommended to compress the files at the source. By reducing the number of files, metadata analysis and integrity phases are reduced, speeding up the migration phase.
Data ingestion
The objective of this phase is to implement another framework based on metadata that responds to the two data ingestion models. A batch mode is responsible for extracting data from different data sources (such as Oracle or PostgreSQL) and a micro-batch-based mode extracts data from a Kafka cluster that, based on configuration parameters, has the capacity to run native streams in streaming.
The following diagram illustrates the architecture for the batch and micro-batch and streaming approach.

During this phase, a metadata-driven framework builds the logic to bring data from Kafka, databases, or external services, that will be run using an ingestion DAG deployed in Amazon MWAA.
Spark Structured Streaming was used to ingest data from Kafka topics. The framework receives configuration files in YAML format that indicate which topics to read, what extraction processes should be performed, whether it should be read in streaming or micro-batch, and in which destination table the information should be saved, among other configurations.
For batch ingestion, a metadata-driven framework written in Pyspark was implemented. In the same way as the previous one, the framework received a configuration in YAML format with the tables to be migrated and their destination.
One of the aspects to consider in this type of migration is the synchronization of data from the ingestion phase and the migration phase, so that there is no loss of data and that data is not reprocessed unnecessarily. To this end, a solution has been implemented that saves the timestamps of the last historical data (per table) migrated in a DynamoDB table. Both types of frameworks are programmed to use this data the first time they are run. For micro-batching use cases, which use Spark Structured Streaming, Kafka data is read by assigning the value stored in DynamoDB to the startingTimeStamp parameter. For all other executions, priority will be given to the metadata in the checkpoint folder. This way, you can make sure ingestion is synchronized with the data migration.
Data processing
The objective in this phase was to be able to handle updates and deletions of data in an object-oriented file system, so Iceberg is a key solution that was adopted throughout the project as delta lake files because of its ACID capabilities. Although all phases use Iceberg as delta files, the processing phase makes extensive use of Iceberg’s capabilities to do incremental processing of data, creating the processing layer using UPSERT using Iceberg’s ability to run MERGE INTO commands.
The following diagram illustrates the architecture.

The architecture is similar to the ingestion phase, with just changes to the data source to be Amazon S3. This approach speeds up the delivery phase and maintains quality with a production-ready solution.
By default, Amazon EMR Serverless has the spark.dynamicAllocation.enabled parameter set to True. This option scales up or down the number of executors registered within the application, based on the workload. This brings a lot of advantages when dealing with different types of workloads, but it also brings considerations when using Iceberg tables. For instance, while writing data into an Iceberg table, the Amazon EMR Serverless application can use a large number of executors in order to speed up the task. This can result in reaching Amazon S3 limits, specifically the number of requests per second per prefix. For this reason, it’s important to apply good data partitioning practices.
Another important aspect to consider in these cases is the object storage file layout. By default, Iceberg uses the Hive storage layout, but it can be set to use ObjectStoreLocationProvider. By setting this property, a deterministic hash is generated for each file, with a hash appended directly after write.data.path. This can considerably minimize throttle requests based on object prefix, as well as maximize throughput for Amazon S3 related I/O operations, because the files written are equally distributed across multiple prefixes.
Data maintenance
When working with data lake table formats such as Iceberg, it’s essential to engage in routine maintenance tasks to optimize table metadata file management, preventing a large number of unnecessary files from accumulating and promptly removing any unused files. The objective of this phase was to build another framework that can perform these types of tasks on the tables within the data lake.
The following diagram illustrates the architecture.

The framework, as well as the other ones, receives a configuration file (YAML files) indicating the tables and the list of maintenance tasks with their respective parameters. It was built on PySpark so that it could run as an Amazon EMR Serverless job and could be orchestrated using the orchestration framework just like the other frameworks built as part of this solution.
The following maintenance tasks are supported by the framework:
- Expire snapshots – Snapshots can be used for rollback operations as well as time traveling queries. However, they can accumulate over time and can lead to performance degradation. It’s highly recommended to regularly expire snapshots that are no longer needed.
- Remove old metadata files – Metadata files can accumulate over time just like snapshots. Removing them regularly is also recommended, especially when dealing with streaming or micro-batching operations, which was one of the cases of the overall solution.
- Compact files – As the number of data files increases, the number of metadata stored in the manifest files also increases, and small data files can lead to less efficient queries. Because this solution uses a streaming and micro-batching application writing into Iceberg tables, the size of the files tends to be small. For this reason, a method to compact files was imperative to enhance the overall performance.
- Hard delete data – One of the requirements was to be able to perform hard deletes in the data older than a certain period of time. This implies removing expiring snapshots and removing metadata files.
The maintenance tasks were scheduled with different frequencies depending on the use case and the specific task. For this reason, the schedule information for this tasks is defined in each of the YAML files of the specific use case.
At the time this framework was implemented, there was no any automatic maintenance solution on top of Iceberg tables. At AWS re:Invent 2024, Amazon S3 Tables functionality has been released to automatize the maintenance of Iceberg Tables . This functionality automates file compaction, snapshot management, and unreferenced file removal.
Conclusion
Building a data platform on top of standarized frameworks that use metadata for different aspects of the data handling process, from data migration and ingestion to orchestration, enhances the visibility and control over each of the phases and significantly speeds up implementation and development processes. Furthermore, by using services such as Amazon EMR Serverless and DynamoDB, you can bring all the benefits of serverless architectures, including scalability, simplicity, flexible integration, improved reliability, and cost-efficiency.
With this architecture, Jumia was able to reduce their data lake cost by 50%. Furthermore, with this approach, data and DevOps teams were able to deploy complete infrastructures and data processing capabilities by creating metadata files along with Spark SQL files. This approach has reduced turnaround time to production and reduced failure rates. Additionally, AWS Lake Formation provided the capabilities to collaborate and govern datasets on various storage layers on the AWS platform and externally.
Leveraging AWS for our data platform has not only optimized and reduced our infrastructure costs but also standardized our workflows and ways of working across data teams and established a more trustworthy single source of truth for our data assets. This transformation has boosted our efficiency and agility, enabling faster insights and enhancing the overall value of our data platform.
– Hélder Russa, Head of Data Engineering at Jumia Group.
Take the first step towards streamlining the data migration process now, with AWS.
About the Authors
 Ramón Díez is a Senior Customer Delivery Architect at Amazon Web Services. He led the project with the firm conviction of using technology in service of the business.
 Paula Marenco is a Data Architect at Amazon Web Services, she enjoys designing analytical solutions that bring light into complexity, turning intricate data processes into clear and actionable insights. Her work focuses on making data more accessible and impactful for decision-making.
 Hélder Russa is the Head of Data Engineering at Jumia Group, contributing to the strategy definition, design, and implementation of multiple Jumia data platforms that support the overall decision-making process, as well as operational features, data science projects, and real-time analytics.
 Pedro Gonçalves is a Principal Data Engineer at Jumia Group, responsible for designing and overseeing the data architecture, emphasizing on AWS Platform and datalakehouse technologies to ensure robust and agile data solutions and analytics capabilities.


 Michael Davies is a Data Engineer at OUA. He has extensive experience within the education industry, with a particular focus on building robust and efficient data architecture and pipelines.
 Emma Arrigo is a Solutions Architect at AWS, focusing on education customers across Australia. She specializes in leveraging cloud technology and machine learning to address complex business challenges in the education sector. Emma’s passion for data extends beyond her professional life, as evidenced by her dog named Data.


 Sean Zou is a Cloud Operations leader with MuleSoft at Salesforce. Sean has been involved in many aspects of MuleSoft’s Cloud Operations, and helped drive MuleSoft’s cloud infrastructure to scale more than tenfold in 7 years. He built the Oversight Engineering function at MuleSoft from scratch.
 Terry Quan focuses on FinOps issues. He works on MuleSoft Engineering on cloud computing budgets and forecasting, cost reduction efforts, costs-to-serve, and coordinates with Salesforce Finance. Terry is a FinOps Practitioner and Professional Certified.
 Audrey Yuan is a Software Engineer with MuleSoft at Salesforce. Audrey works on data lakehouse solutions to help drive cloud maturity across the six pillars of the Well-Architected Framework.
 Rueben Jimenez is a Senior Solutions Architect at AWS, designing and implementing complex data analytics, AI/ML, and cloud infrastructure solutions.
 Avijit Goswami is a Principal Solutions Architect at AWS specialized in data and analytics. He supports AWS strategic customers in building high-performing, secure, and scalable data lake solutions on AWS using AWS managed services and open source solutions. Outside of his work, Avijit likes to travel, hike, watch sports, and listen to music.


 Ishan Gupta is the Co-Founder and CTO of Juicebox, an AI-powered recruiting software startup backed by top Silicon Valley investors including Y Combinator, Nat Friedman, and Daniel Gross. He has built search products used by thousands of customers to recruit talent for their teams.
 Jon Handler is the Director of Solutions Architecture for Search Services at Amazon Web Services, based in Palo Alto, CA. Jon works closely with OpenSearch and Amazon OpenSearch Service, providing help and guidance to a broad range of customers who have search and log analytics workloads for OpenSearch. Prior to joining AWS, Jon’s career as a software developer included four years of coding a large-scale, eCommerce search engine. Jon holds a Bachelor of the Arts from the University of Pennsylvania, and a Master of Science and a Ph. D. in Computer Science and Artificial Intelligence from Northwestern University.


 Kalyan Janaki is Senior Big Data & Analytics Specialist with Amazon Web Services. He helps customers architect and build highly scalable, performant, and secure cloud-based solutions on AWS.
 Venu Nemallikanti is the Enterprise Architect and Lead for Event Streaming at Fitch Group, a globally recognized financial information services provider operating in over 30 countries. His primary responsibilities include overseeing the architecture and implementation of event streaming solutions, ensuring the seamless integration and performance of systems that deliver credit ratings, research, data, and analytics to a worldwide clientele.
 Chaitanya Shah is a Principal Technical Account Manager with AWS, based out of New York. He loves to code and actively contributes to the AWS solutions labs to help customers solve complex problems. He provides guidance to AWS customers on best practices for their Cloud migrations. He is also specialized in AWS data transfer and the data and analytics domain.
 Oleg Chugaev is a Principal Solutions Architect and Serverless evangelist with 20+ years in IT, holding multiple AWS certifications. At AWS, he drives customers through their cloud transformation journeys by converting complex challenges into actionable roadmaps for both technical and business audiences.


 Ramón Díez is a Senior Customer Delivery Architect at Amazon Web Services. He led the project with the firm conviction of using technology in service of the business.
 Paula Marenco is a Data Architect at Amazon Web Services, she enjoys designing analytical solutions that bring light into complexity, turning intricate data processes into clear and actionable insights. Her work focuses on making data more accessible and impactful for decision-making.
 Hélder Russa is the Head of Data Engineering at Jumia Group, contributing to the strategy definition, design, and implementation of multiple Jumia data platforms that support the overall decision-making process, as well as operational features, data science projects, and real-time analytics.
 Pedro Gonçalves is a Principal Data Engineer at Jumia Group, responsible for designing and overseeing the data architecture, emphasizing on AWS Platform and datalakehouse technologies to ensure robust and agile data solutions and analytics capabilities.


 Luis Campos is the Data & AI Governance GTM Lead for the EMEA market at AWS where he helps customers with their data strategies starting with strong data governance and uses his expertise in end-to-end data & analytics management. Luis is also a public speaking coach, based in the Netherlands, and has two boys with 18 years apart, which has taught him to see problems from both ends of a spectrum.
 Tommaso is the Head of Data & Cloud Platforms at HEMA. He joined the business with the goal of modernising the Data Organization by building cloud-based Data Platform – hosted in AWS – which would power a Data Mesh architecture. With a strong passion for both technical and organizational challenges, Tommaso leads the Solution Architecture efforts as well as all core Data Management and Data Governance initiatives, for which he is also a passionate public speaker. Outside the office, Tommaso is a full-time dad with a passion for traveling and sports.
 Oghosa Omorisiagbon is a Senior Data Engineer at HEMA. He focuses on leveraging AWS-native tools to optimise data pipelines, modernise HEMA’s data infrastructure and introduce reliable and scalable end-to-end data architecture solutions. Outside of work, he enjoys traveling, playing video games and outdoor activities.

 Momota Sasaki is an Engineering Manager at DeSC Healthcare, a subsidiary of DeNA. He joined DeNA in 2021 and was seconded to DeSC Healthcare. Since then, he has been consistently involved in the healthcare business, leading and promoting the development and operation of the data platform.
 Kaito Tawara is a Data Engineer at DeSC Healthcare, a subsidiary of DeNA, focusing on improving healthcare data platforms. After gaining experience in backend development for web systems and data science, he transitioned to data engineering. He joined DeNA in 2023 and was seconded to DeSC Healthcare. Currently, he works remotely from Nagoya-city, contributing to the enhancement of healthcare data platforms.
 Shota Sato is an Analytics Specialist Solution Architect at AWS Japan, focusing on data analytics solutions powered by AWS for digital native business customers.


 Rohit Vashishtha is a Senior Analytics Specialist Solutions Architect at AWS based in Dallas, Texas. He has over 17 years of experience architecting, building, leading, and maintaining big data platforms. Rohit helps customers modernize their analytic workloads using the breadth of AWS services and ensures that customers get the best price/performance with utmost security and data governance.
 Jagadish Kumar (Jag) is a Senior Specialist Solutions Architect at AWS focused on Amazon OpenSearch Service. He is deeply passionate about Data Architecture and helps customers build analytics solutions at scale on AWS.
 Adam Gaulding is a Solution Architect at Satori. At Satori, Adam is helping customers implement data security controls on databases, data lakes and data warehouses. Adam has been in and around the data space throughout his 20+ year career. He’s worked with companies large and small and prides himself in building creative solutions for technical problems.


 Eunice Aguilar is a Staff Data Engineer at REA. She has worked in software engineering in various industries throughout the years and recently for property data. She’s also an advocate for women interested in transitioning into tech, along with the well-versed who she takes inspiration from.
 Francisco Rodera is a Staff Systems Engineer at REA. He has extensive experience building and operating large-scale distributed systems. His interests are automation, observability, and applying SRE practices to business-critical services and platforms.


 Leo Ramsamy is a Platform Architect specializing in data and analytics for ANZ’s Institutional division. He focuses on modern data practices, including Data Mesh architecture, data governance, quality management, and observability. His work aligns data strategies with business goals, improving accessibility and enabling better decision-making across ANZ.
 Srinivasan Kuppusamy is a Senior Cloud Architect – Data at AWS ProServe, where he helps customers solve their business problems using the power of AWS Cloud technology. His areas of interests are data and analytics, data governance, and AI/ML.
 Rada Stanic is a Chief Technologist at Amazon Web Services, where she helps ANZ customers across different segments solve their business problems using AWS Cloud technologies. Her special areas of interest are data analytics, machine learning/AI, and application modernization.


 Sumalatha Bachu is Senior Director, Technology at FINRA. She manages Big Data Operations which includes managing petabyte-scale data and complex workloads processing in cloud. Additionally, she is an expert in developing Enterprise Application Monitoring and Observability Solutions, Operational Data Analytics, & Machine Learning Model Governance work flows. Outside of work, she enjoys doing yoga, practicing singing, and teaching in her free time.
 PremKiran Bejjam is Lead Engineer Consultant at FINRA, specializing in developing resilient and scalable systems. With a keen focus on designing monitoring solutions to enhance infrastructure reliability, he is dedicated to optimizing system performance. Beyond work, he enjoys quality family time and continually seeks out new learning opportunities.
 Akhil Chalamalasetty is Director, Market Regulation Technology at FINRA. He is a Big Data subject matter expert specializing in building cutting edge solutions at scale along with optimizing workloads, data, and its processing capabilities. Akhil enjoys sim racing and Formula 1 in his free time.