Tag Archives: Developers

Piecing together the Agent puzzle: MCP, authentication & authorization, and Durable Objects free tier

Post Syndicated from Rita Kozlov original https://blog.cloudflare.com/building-ai-agents-with-mcp-authn-authz-and-durable-objects/

It’s not a secret that at Cloudflare we are bullish on the future of agents. We’re excited about a future where AI can not only co-pilot alongside us, but where we can actually start to delegate entire tasks to AI. 

While it hasn’t been too long since we first announced our Agents SDK to make it easier for developers to build agents, building towards an agentic future requires continuous delivery towards this goal. Today, we’re making several announcements to help accelerate agentic development, including:

  • New Agents SDK capabilities: Build remote MCP clients, with transport and authentication built-in, to allow AI agents to connect to external services. 

  • BYO Auth provider for MCP: Integrations with Stytch, Auth0, and WorkOS to add authentication and authorization to your remote MCP server. 

  • Hibernation for McpAgent: Automatically sleep stateful, remote MCP servers when inactive and wake them when needed. This allows you to maintain connections for long-running sessions while ensuring you’re not paying for idle time. 

  • Durable Objects free tier: We view Durable Objects as a key component for building agents, and if you’re using our Agents SDK, you need access to it. Until today, Durable Objects was only accessible as part of our paid plans, and today we’re excited to include it in our free tier.

  • Workflows GA: Enables you to ship production-ready, long-running, multi-step actions in agents.

  • AutoRAG: Helps you integrate context-aware AI into your applications, in just a few clicks

  • agents.cloudflare.com: our new landing page for all things agents.

New MCP capabilities in Agents SDK

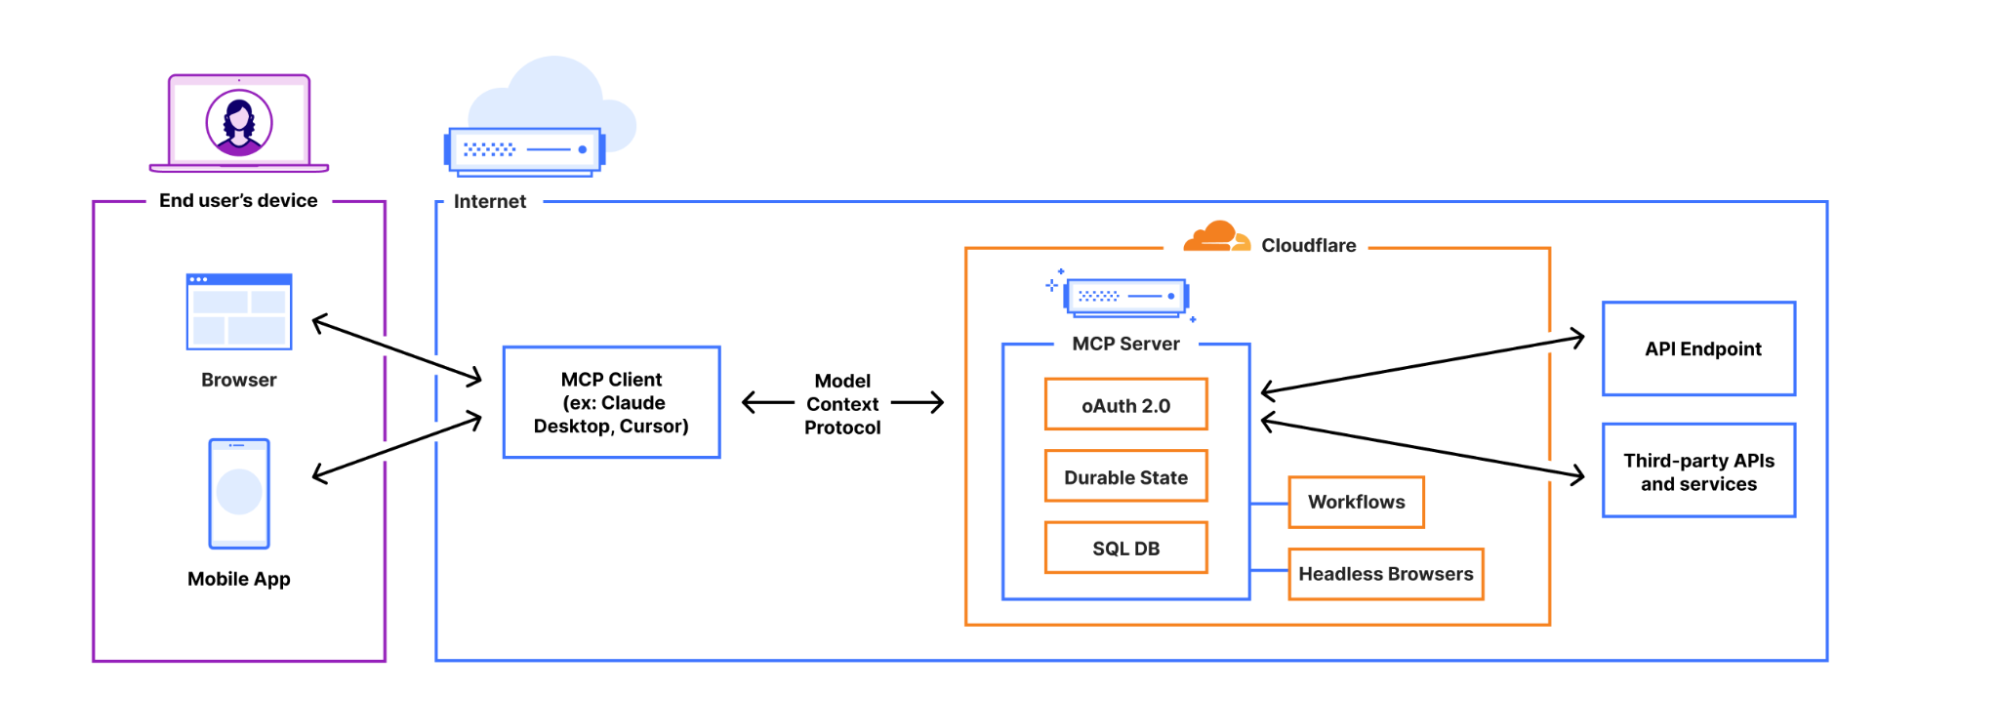
AI agents can now connect to and interact with external services through MCP (Model Context Protocol). We’ve updated the Agents SDK to allow you to build a remote MCP client into your AI agent, with all the components — authentication flows, tool discovery, and connection management — built-in for you.

This allows you to build agents that can:

  1. Prompt the end user to grant access to a 3rd party service (MCP server).

  2. Use tools from these external services, acting on behalf of the end user.

  3. Call MCP servers from Workflows, scheduled tasks, or any part of your agent.

  4. Connect to multiple MCP servers and automatically discover new tools or capabilities presented by the 3rd party service.


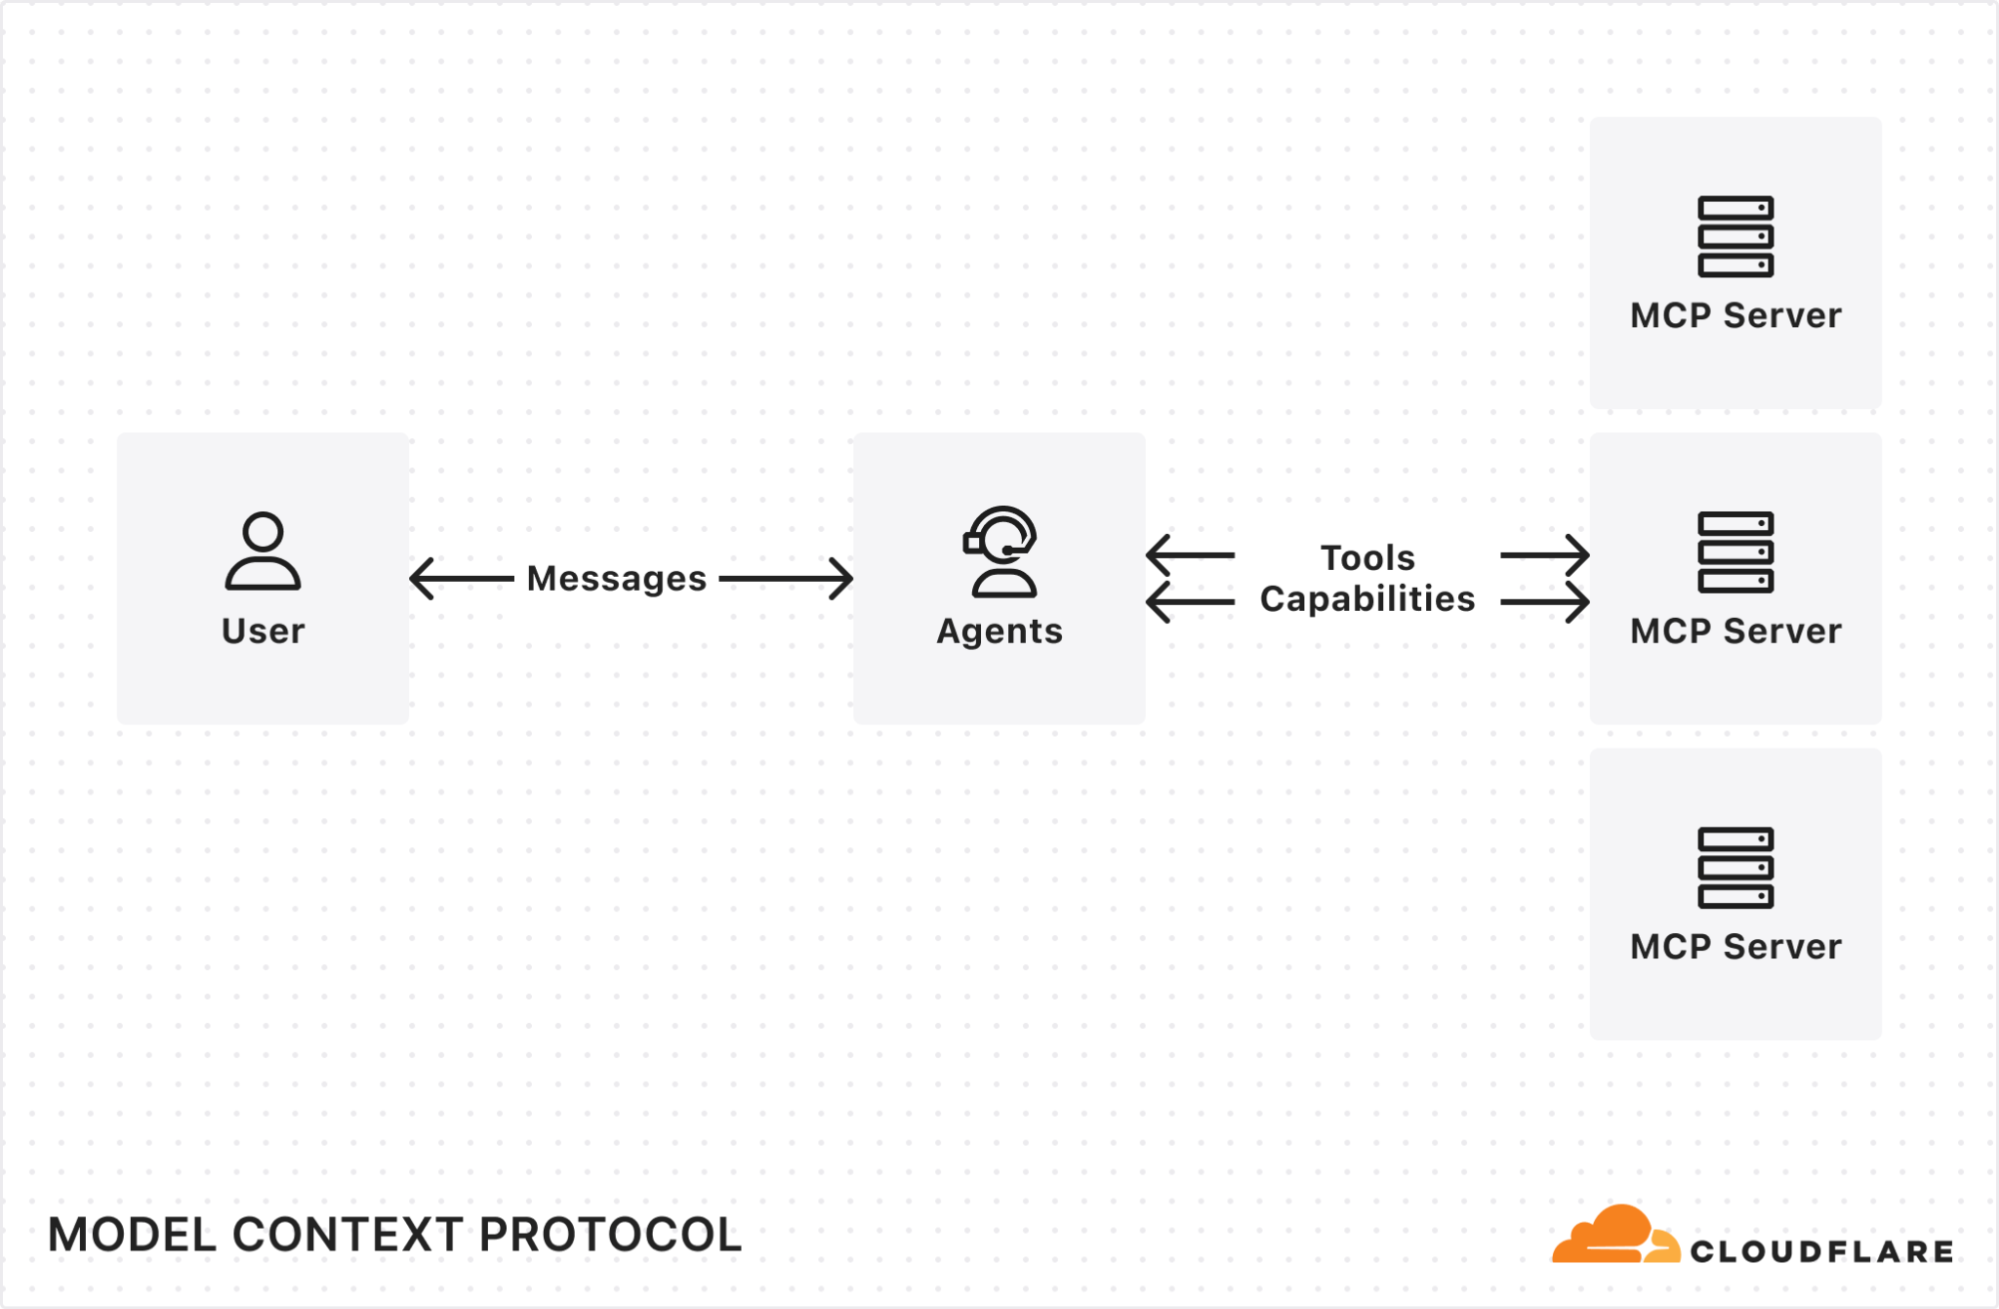
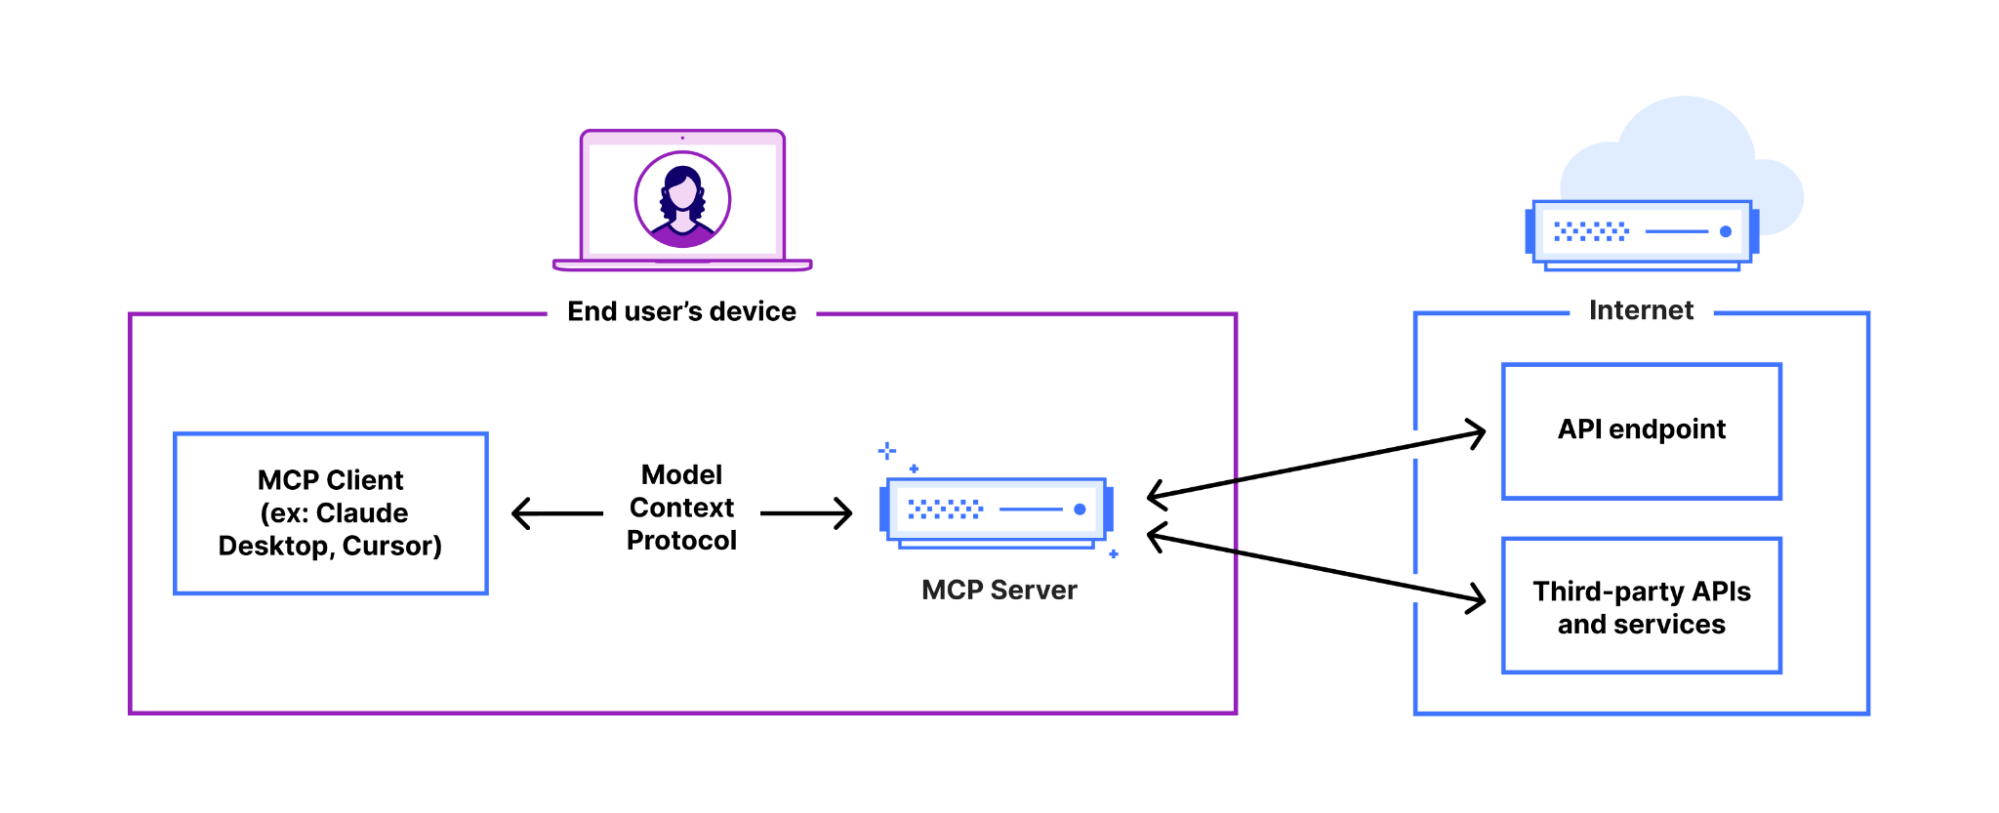
MCP (Model Context Protocol) — first introduced by Anthropic — is quickly becoming the standard way for AI agents to interact with external services, with providers like OpenAI, Cursor, and Copilot adopting the protocol.

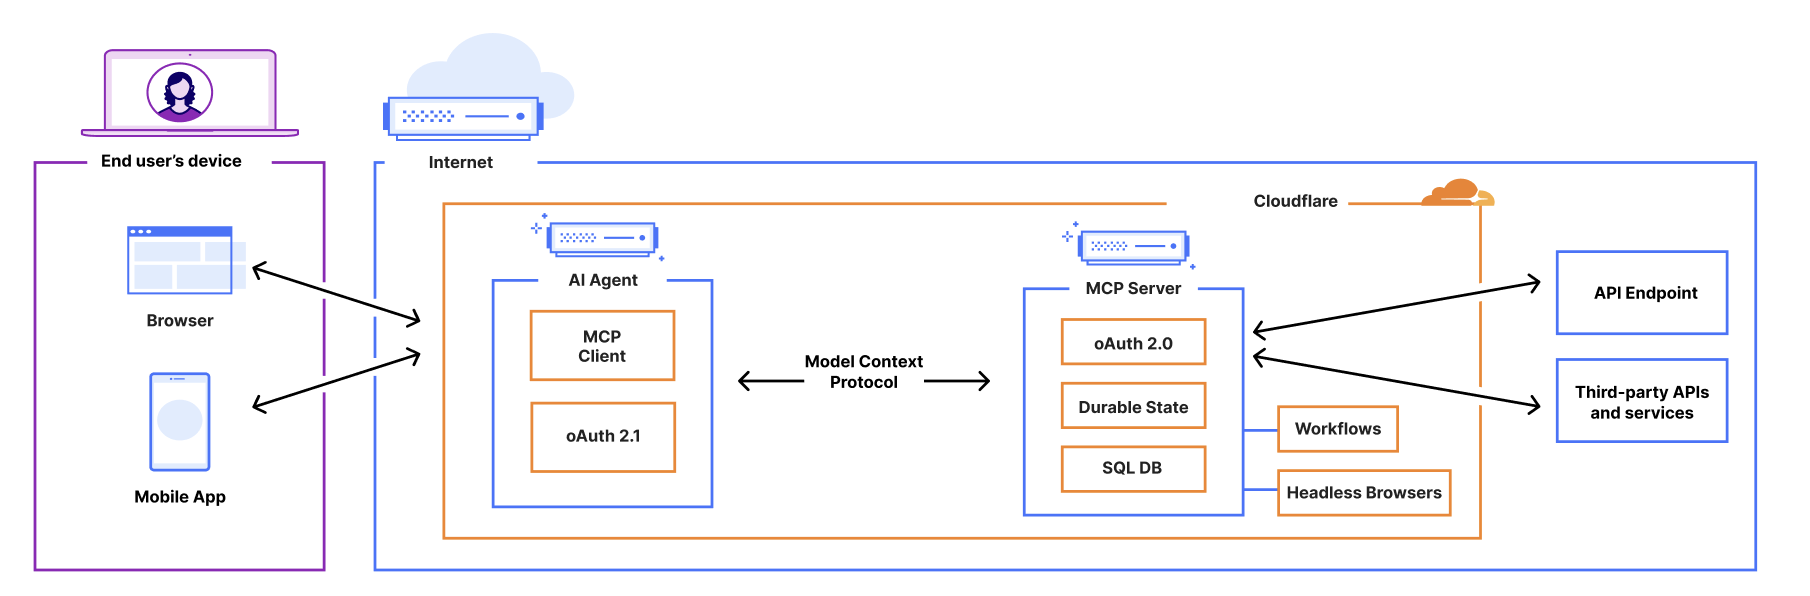
We recently announced support for building remote MCP servers on Cloudflare, and added an McpAgent class to our Agents SDK that automatically handles the remote aspects of MCP: transport and authentication/authorization. Now, we’re excited to extend the same capabilities to agents acting as MCP clients.


Want to see it in action? Use the button below to deploy a fully remote MCP client that can be used to connect to remote MCP servers.

AI Agents can now act as remote MCP clients, with transport and auth included

AI agents need to connect to external services to access tools, data, and capabilities beyond their built-in knowledge. That means AI agents need to be able to act as remote MCP clients, so they can connect to remote MCP servers that are hosting these tools and capabilities. 

We’ve added a new class, MCPClientManager, into the Agents SDK to give you all the tooling you need to allow your AI agent to make calls to external services via MCP. The MCPClientManager class automatically handles: 

  • Transport: Connect to remote MCP servers over SSE and HTTP, with support for Streamable HTTP coming soon. 

  • Connection management: The client tracks the state of all connections and automatically reconnects if a connection is lost.

  • Capability discovery: Automatically discovers all capabilities, tools, resources, and prompts presented by the MCP server.

  • Real-time updates: When a server’s tools, resources, or prompts change, the client automatically receives notifications and updates its internal state.

  • Namespacing: When connecting to multiple MCP servers, all tools and resources are automatically namespaced to avoid conflicts.

Granting agents access to tools with built-in auth check for MCP Clients

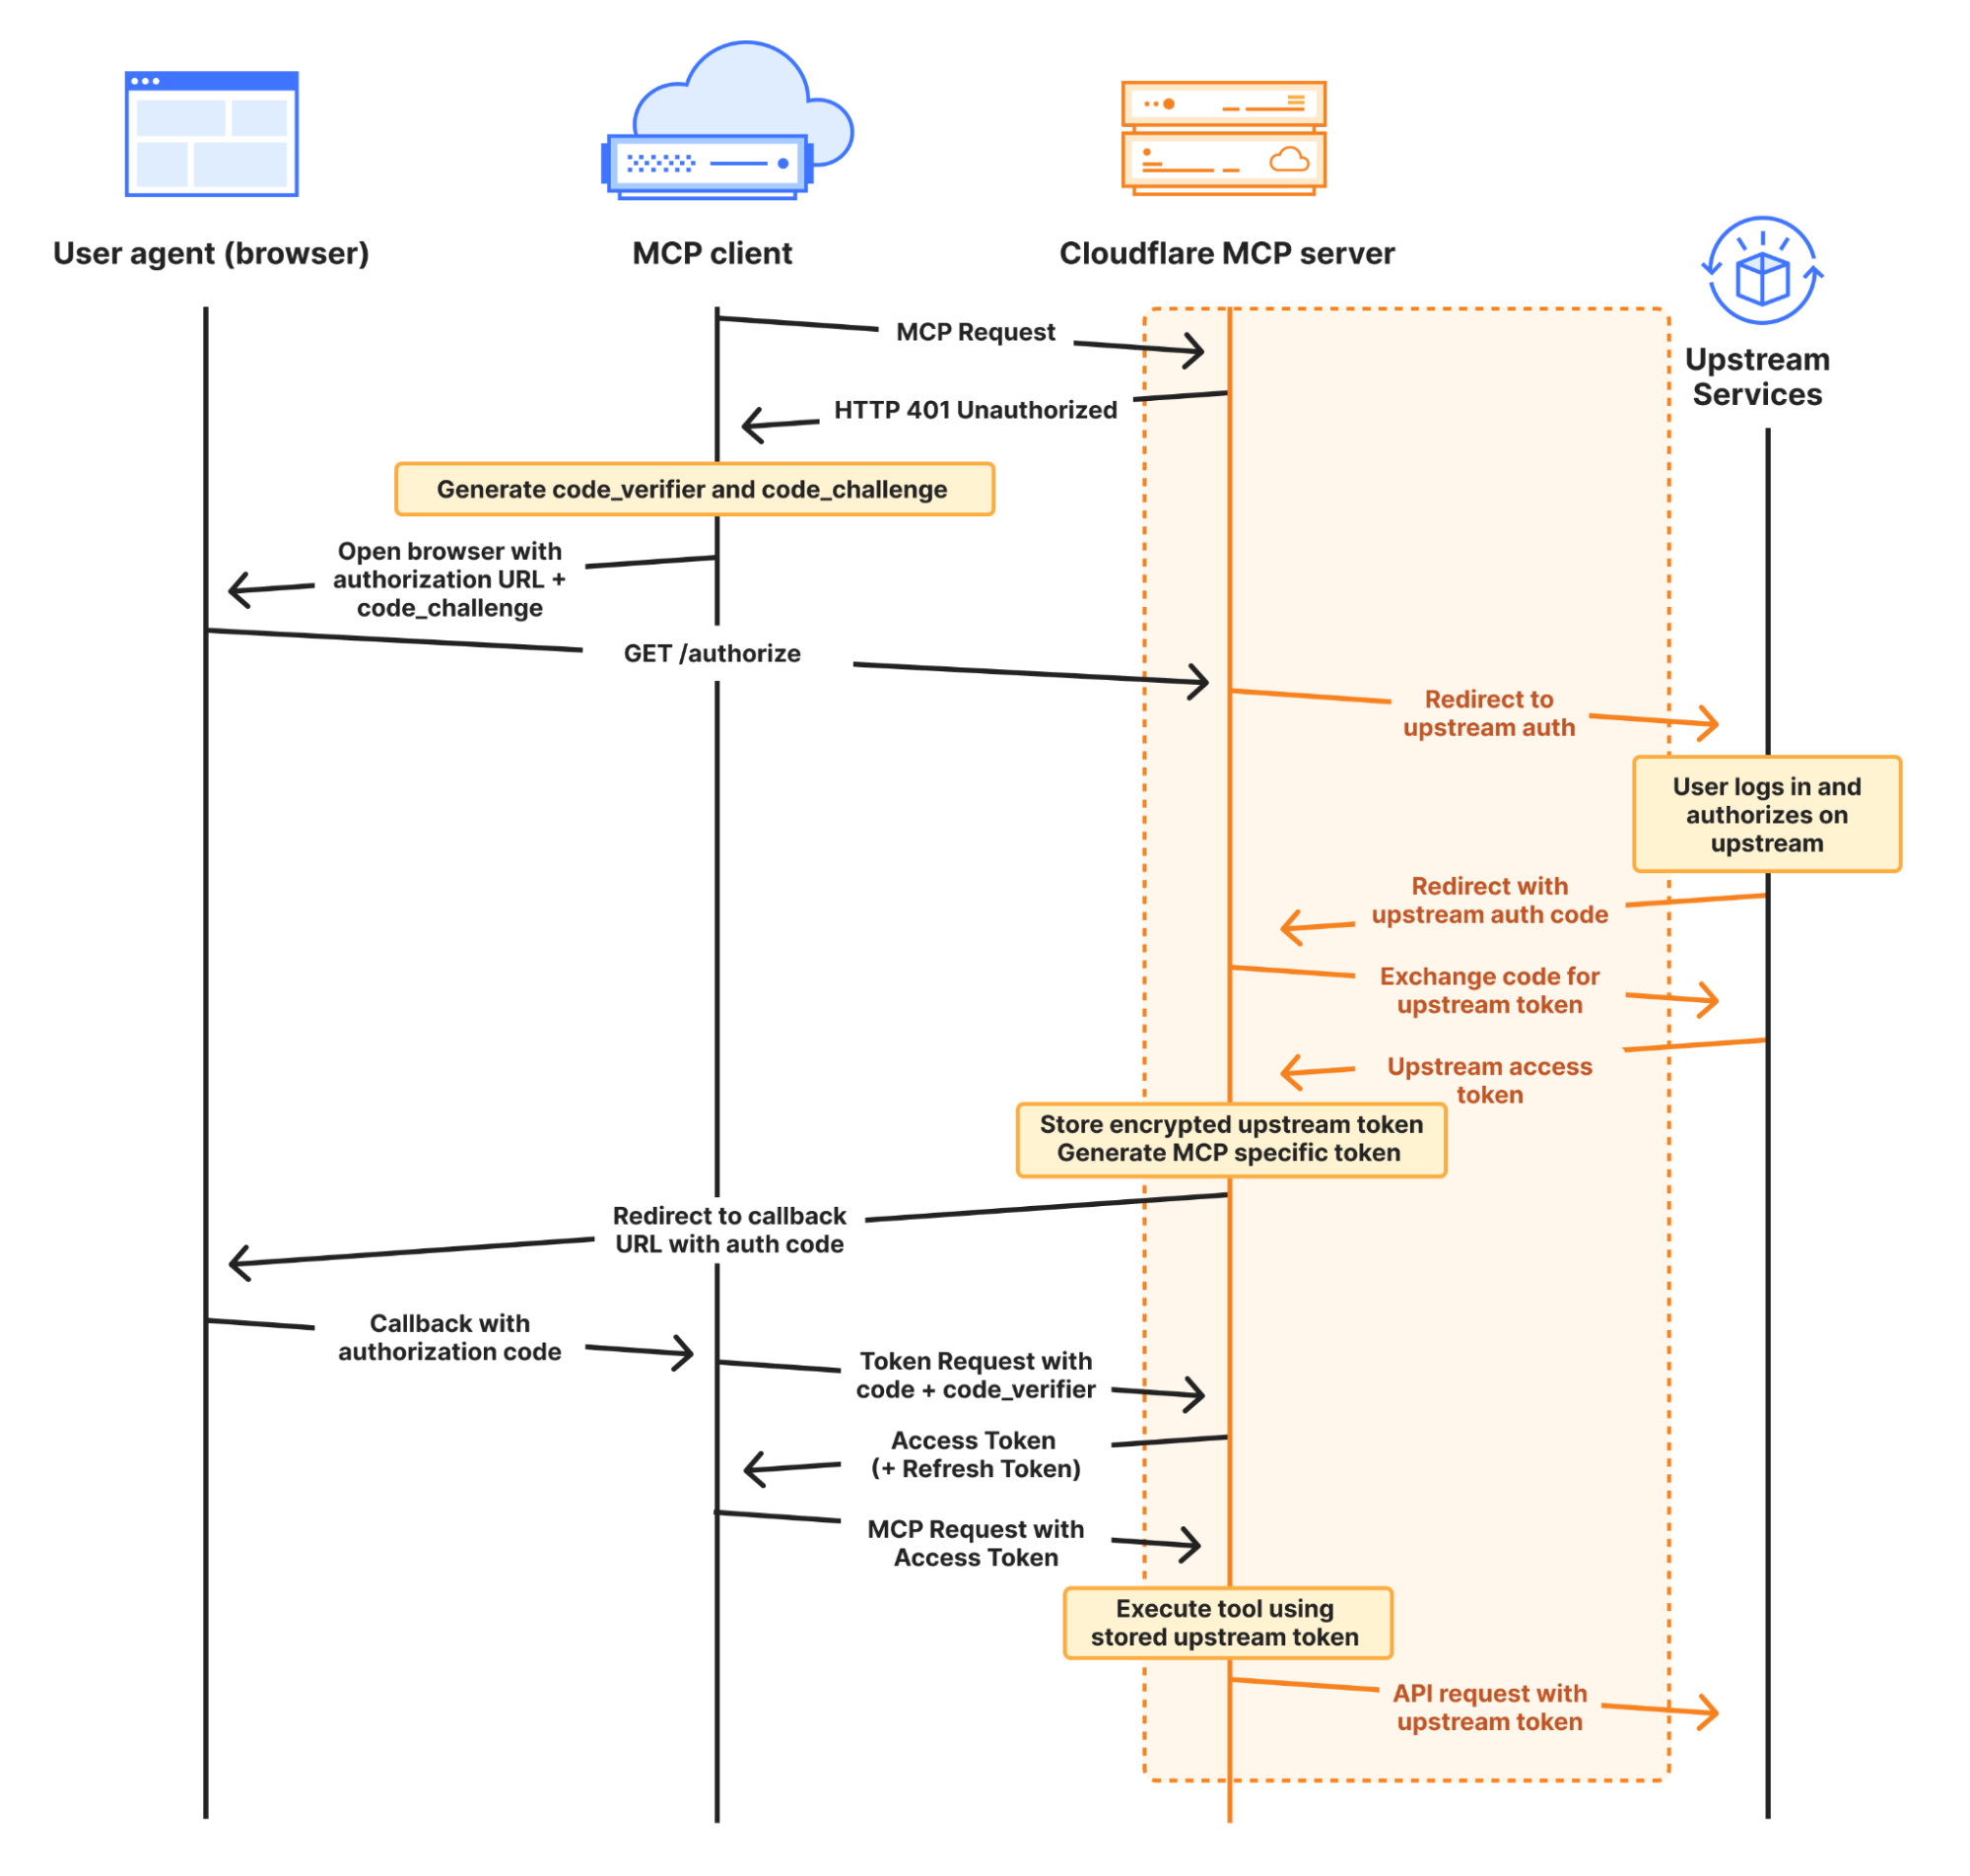
We’ve integrated the complete OAuth authentication flow directly into the Agents SDK, so your AI agents can securely connect and authenticate to any remote MCP server without you having to build authentication flow from scratch.

This allows you to give users a secure way to log in and explicitly grant access to allow the agent to act on their behalf by automatically: 

  • Supporting the OAuth 2.1 protocol.

  • Redirecting users to the service’s login page.

  • Generating the code challenge and exchanging an authorization code for an access token.

  • Using the access token to make authenticated requests to the MCP server.

Here is an example of an agent that can securely connect to MCP servers by initializing the client manager, adding the server, and handling the authentication callbacks:

async onStart(): Promise<void> {
  // initialize MCPClientManager which manages multiple MCP clients with optional auth
  this.mcp = new MCPClientManager("my-agent", "1.0.0", {
    baseCallbackUri: `${serverHost}/agents/${agentNamespace}/${this.name}/callback`,
    storage: this.ctx.storage,
  });
}

async addMcpServer(url: string): Promise<string> {
  // Add one MCP client to our MCPClientManager
  const { id, authUrl } = await this.mcp.connect(url);
  // Return authUrl to redirect the user to if the user is unauthorized
  return authUrl
}

async onRequest(req: Request): Promise<void> {
  // handle the auth callback after being finishing the MCP server auth flow
  if (this.mcp.isCallbackRequest(req)) {
    await this.mcp.handleCallbackRequest(req);
    return new Response("Authorized")
  }
  
  // ...
}

Connecting to multiple MCP servers and discovering what capabilities they offer

You can use the Agents SDK to connect an MCP client to multiple MCP servers simultaneously. This is particularly useful when you want your agent to access and interact with tools and resources served by different service providers. 

The MCPClientManager class maintains connections to multiple MCP servers through the mcpConnections object, a dictionary that maps unique server names to their respective MCPClientConnection instances. 

When you register a new server connection using connect(), the manager: 

  1. Creates a new connection instance with server-specific authentication.

  2. Initializes the connections and registers for server capability notifications.

async onStart(): Promise<void> {
  // Connect to an image generation MCP server
  await this.mcp.connect("https://image-gen.example.com/mcp/sse");
  
  // Connect to a code analysis MCP server
  await this.mcp.connect("https://code-analysis.example.org/sse");
  
  // Now we can access tools with proper namespacing
  const allTools = this.mcp.listTools();
  console.log(`Total tools available: ${allTools.length}`);
}

Each connection manages its own authentication context, allowing one AI agent to authenticate to multiple servers simultaneously. In addition, MCPClientManager automatically handles namespacing to prevent collisions between tools with identical names from different servers. 

For example, if both an “Image MCP Server” and “Code MCP Server” have a tool named “analyze”, they will both be independently callable without any naming conflicts.

Use Stytch, Auth0, and WorkOS to bring authentication & authorization to your MCP server 

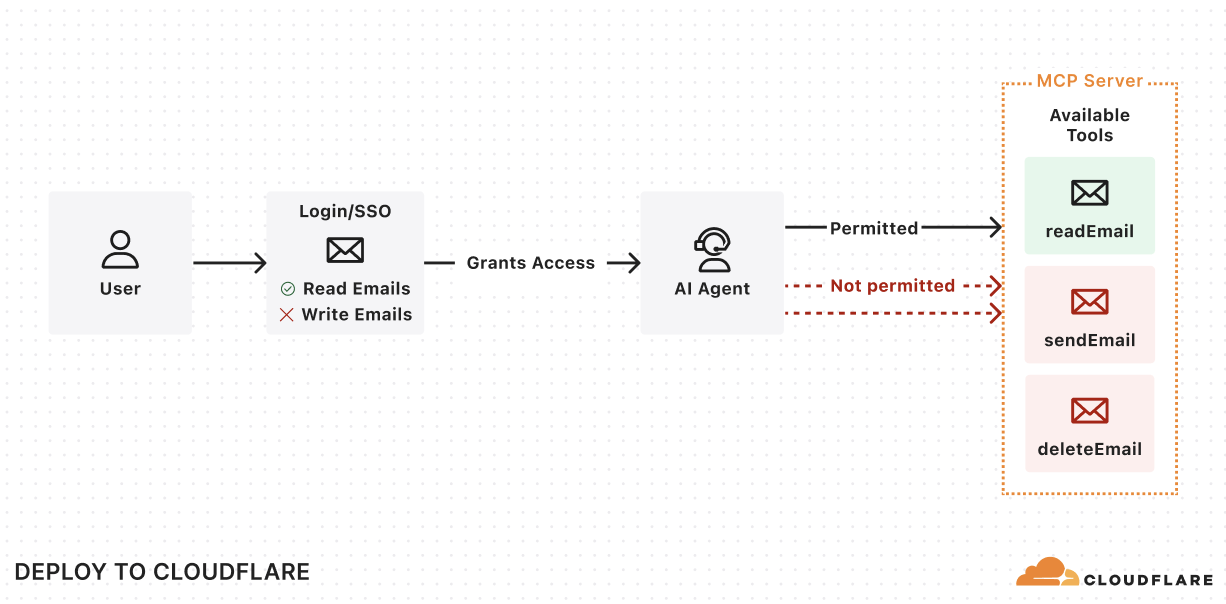
With MCP, users will have a new way of interacting with your application, no longer relying on the dashboard or API as the entrypoint. Instead, the service will now be accessed by AI agents that are acting on a user’s behalf. To ensure users and agents can connect to your service securely, you’ll need to extend your existing authentication and authorization system to support these agentic interactions, implementing login flows, permissions scopes, consent forms, and access enforcement for your MCP server. 

We’re adding integrations with Stytch, Auth0, and WorkOS to make it easier for anyone building an MCP server to configure authentication & authorization for their MCP server. 

You can leverage our MCP server integration with Stytch, Auth0, and WorkOS to: 

  • Allow users to authenticate to your MCP server through email, social logins, SSO (single sign-on), and MFA (multi-factor authentication).

  • Define scopes and permissions that directly map to your MCP tools.

  • Present users with a consent page corresponding with the requested permissions.

Enforce the permissions so that agents can only invoke permitted tools. 


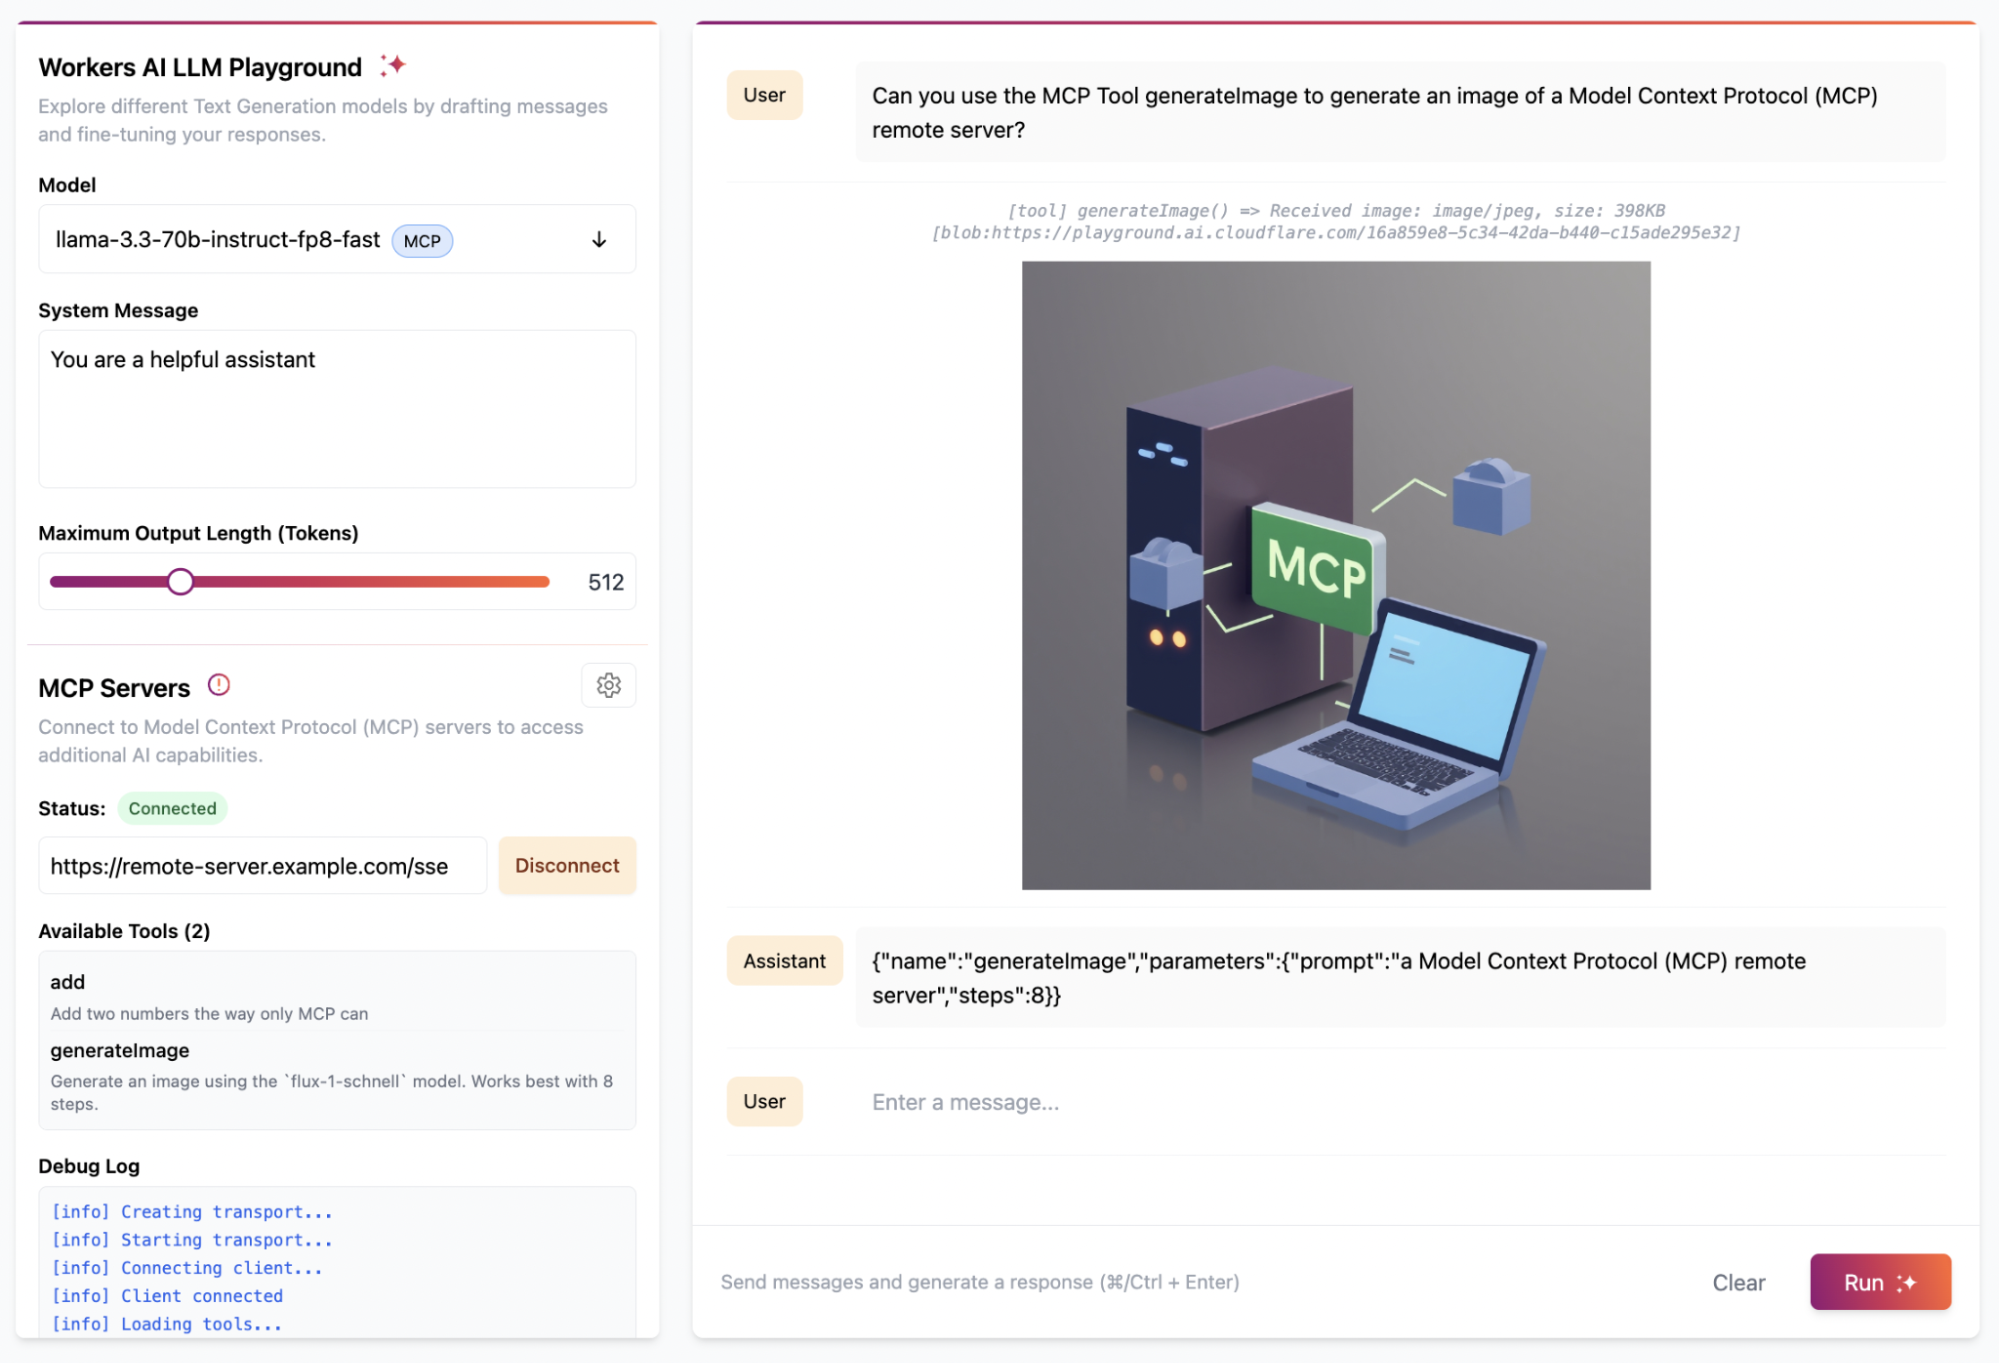
Get started with the examples below by using the “Deploy to Cloudflare” button to deploy the demo MCP servers in your Cloudflare account. These demos include pre-configured authentication endpoints, consent flows, and permission models that you can tailor to fit your needs. Once you deploy the demo MCP servers, you can use the Workers AI playground, a browser-based remote MCP client, to test out the end-to-end user flow. 

Stytch

Get started with a remote MCP server that uses Stytch to allow users to sign in with email, Google login or enterprise SSO and authorize their AI agent to view and manage their company’s OKRs on their behalf. Stytch will handle restricting the scopes granted to the AI agent based on the user’s role and permissions within their organization. When authorizing the MCP Client, each user will see a consent page that outlines the permissions that the agent is requesting that they are able to grant based on their role.

For more consumer use cases, deploy a remote MCP server for a To Do app that uses Stytch for authentication and MCP client authorization. Users can sign in with email and immediately access the To Do lists associated with their account, and grant access to any AI assistant to help them manage their tasks.

Regardless of use case, Stytch allows you to easily turn your application into an OAuth 2.0 identity provider and make your remote MCP server into a Relying Party so that it can easily inherit identity and permissions from your app. To learn more about how Stytch is enabling secure authentication to remote MCP servers, read their blog post.

“One of the challenges of realizing the promise of AI agents is enabling those agents to securely and reliably access data from other platforms. Stytch Connected Apps is purpose-built for these agentic use cases, making it simple to turn your app into an OAuth 2.0 identity provider to enable secure access to remote MCP servers. By combining Cloudflare Workers with Stytch Connected Apps, we’re removing the barriers for developers, enabling them to rapidly transition from AI proofs-of-concept to secure, deployed implementations.” — Julianna Lamb, Co-Founder & CTO, Stytch.

Auth0

Get started with a remote MCP server that uses Auth0 to authenticate users through email, social logins, or enterprise SSO to interact with their todos and personal data through AI agents. The MCP server securely connects to API endpoints on behalf of users, showing exactly which resources the agent will be able to access once it gets consent from the user. In this implementation, access tokens are automatically refreshed during long running interactions.

To set it up, first deploy the protected API endpoint:

Then, deploy the MCP server that handles authentication through Auth0 and securely connects AI agents to your API endpoint. 

“Cloudflare continues to empower developers building AI products with tools like AI Gateway, Vectorize, and Workers AI. The recent addition of Remote MCP servers further demonstrates that Cloudflare Workers and Durable Objects are a leading platform for deploying serverless AI. We’re very proud that Auth0 can help solve the authentication and authorization needs for these cutting-edge workloads.” — Sandrino Di Mattia, Auth0 Sr. Director, Product Architecture.

WorkOS

Get started with a remote MCP server that uses WorkOS’s AuthKit to authenticate users and manage the permissions granted to AI agents. In this example, the MCP server dynamically exposes tools based on the user’s role and access rights. All authenticated users get access to the add tool, but only users who have been assigned the image_generation permission in WorkOS can grant the AI agent access to the image generation tool. This showcases how MCP servers can conditionally expose capabilities to AI agents based on the authenticated user’s role and permission.

“MCP is becoming the standard for AI agent integration, but authentication and authorization are still major gaps for enterprise adoption. WorkOS Connect enables any application to become an OAuth 2.0 authorization server, allowing agents and MCP clients to securely obtain tokens for fine-grained permission authorization and resource access. With Cloudflare Workers, developers can rapidly deploy remote MCP servers with built-in OAuth and enterprise-grade access control. Together, WorkOS and Cloudflare make it easy to ship secure, enterprise-ready agent infrastructure.” — Michael Grinich, CEO of WorkOS.

Hibernate-able WebSockets: put AI agents to sleep when they’re not in use

Starting today, a new improvement is landing in the McpAgent class: support for the WebSockets Hibernation API that allows your MCP server to go to sleep when it’s not receiving requests and instantly wake up when it’s needed. That means that you now only pay for compute when your agent is actually working.

We recently introduced the McpAgent class, which allows developers to build remote MCP servers on Cloudflare by using Durable Objects to maintain stateful connections for every client session. We decided to build McpAgent to be stateful from the start, allowing developers to build servers that can remember context, user preferences, and conversation history. But maintaining client connections means that the session can remain active for a long time, even when it’s not being used. 

MCP Agents are hibernate-able by default

You don’t need to change your code to take advantage of hibernation. With our latest SDK update, all McpAgent instances automatically include hibernation support, allowing your stateful MCP servers to sleep during inactive periods and wake up with their state preserved when needed. 

How it works

When a request comes in on the Server-Sent Events endpoint, /sse, the Worker initializes a WebSocket connection to the appropriate Durable Object for the session and returns an SSE stream back to the client. All responses flow over this stream.

The implementation leverages the WebSocket Hibernation API within Durable Objects. When periods of inactivity occur, the Durable Object can be evicted from memory while keeping the WebSocket connection open. If the WebSocket later receives a message, the runtime recreates the Durable Object and delivers the message to the appropriate handler.

Durable Objects on free tier

To help you build AI agents on Cloudflare, we’re making Durable Objects available on the free tier, so you can start with zero commitment. With Agents SDK, your AI agents deploy to Cloudflare running on Durable Objects.

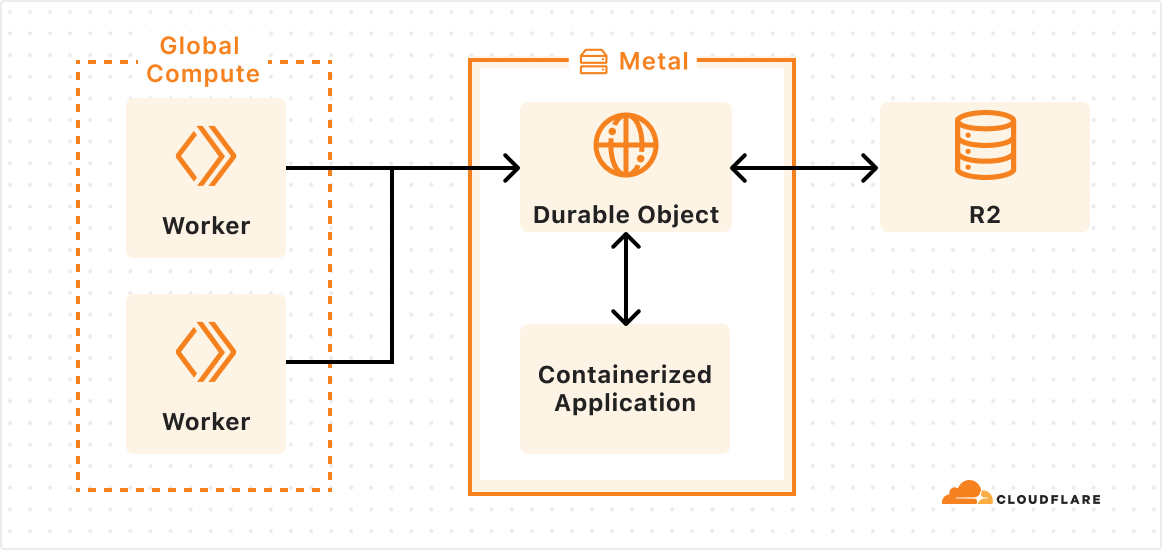
Durable Objects offer compute alongside durable storage, that when combined with Workers, unlock stateful, serverless applications. Each Durable Object is a stateful coordinator for handling client real-time interactions, making requests to external services like LLMs, and creating agentic “memory” through state persistence in zero-latency SQLite storage — all tasks required in an AI agent. Durable Objects scale out to millions of agents effortlessly, with each agent created near the user interacting with their agent for fast performance, all managed by Cloudflare. 

Zero-latency SQLite storage in Durable Objects was introduced in public beta September 2024 for Birthday Week. Since then, we’ve focused on missing features and robustness compared to pre-existing key-value storage in Durable Objects. We are excited to make SQLite storage generally available, with a 10 GB SQLite database per Durable Object, and recommend SQLite storage for all new Durable Object classes. Durable Objects free tier can only access SQLite storage.

Cloudflare’s free tier allows you to build real-world applications. On the free plan, every Worker request can call a Durable Object. For usage-based pricing, Durable Objects incur compute and storage usage with the following free tier limits.


Workers Free

Workers Paid

Compute: Requests

100,000 / day

1 million / month included

+ $0.15 / million

Compute: Duration

13,000 GB-s / day

400,000 GB-s / month  included 

+ $12.50 / million GB-s

Storage: Rows read

5 million / day

25 billion / month included

+ $0.001 / million 

Storage: Rows written

100,000 / day

50 million / month included

+ $1.00 / million

Storage: SQL stored data

5 GB (total)

5 GB-month included

+ $0.20 / GB-month

Find us at agents.cloudflare.com

We realize this is a lot of information to take in, but don’t worry. Whether you’re new to agents as a whole, or looking to learn more about how Cloudflare can help you build agents, today we launched a new site to help get you started — agents.cloudflare.com

Let us know what you build!

Welcome to Developer Week 2025

Post Syndicated from Rita Kozlov original https://blog.cloudflare.com/welcome-to-developer-week-2025/

We’re kicking off Cloudflare’s 2025 Developer Week — our innovation week dedicated to announcements for developers.

It’s an exciting time to be a developer. In fact, as a developer, the past two years might have felt a bit like every week is Developer Week. Starting with the release of ChatGPT, it has felt like each day has brought a new, disruptive announcement, whether it’s new models, hardware, agents, or other tools. From late 2024 and in just the first few months of 2025, we’ve seen the DeepSeek model challenge assumptions about what it takes to train a new state-of-the-art model, MCP introduce a new standard for how LLMs interface with the world, and OpenAI’s o4 model Ghiblify the world.

And while it’s exciting to witness a technological revolution unfold in front of your eyes, it’s even more exciting to partake in it. 

A new era of innovation

One of the marvels of the recent AI revolution is the extent to which the cost of experimentation has gone down. Ideas that would have taken whole weekends, weeks, or months to build can now be turned into working code in a day. You can vibe-code your way through things you might have never even tried before, or the parts of application that just don’t excite you. Whether you’ve spent your career working on frontend, backend, mobile, distributed systems or databases — with AI, you can truly be a full-stack engineer.

AI making it faster to ship more code and expanding the audience of who can write code (anyone!) — in the next 5 years we believe more code will be written than has been in the history of software.

However, for all these seedlings of opportunity to flourish, a platform needs to exist to make it just as easy to deploy and scale the code as it was to write it.

As Andrej Karpathy said in his recent post, on building a web application: “It’s not even code, it’s… configurations, plumbing, orchestration, workflows, best practices.”


The platform for the AI era

That’s Cloudflare’s vision for developers — to provide a comprehensive platform that just works. From experiment, to MVP, to scaling to millions of users.

We started on that vision almost 8 years ago now, with the launch of Cloudflare Workers, and kept chipping away at adding more and more primitives to allow developers to deploy their full-stack in one place.

Today, Cloudflare’s platform offers many of the building blocks you need: from compute, to storage, databases, and AI. With the tools you need to build along every step of the way: from local development to gradually rolling out to production, CI/CD, and observability.


And, everything you build is deployed to Region: Earth, which means you never have to think about servers, scaling, or infrastructure. This is especially important today — when the industry is moving at an unprecedented pace, the opportunity cost of slowing down is the difference between success and failure. 

Developer Week 2025

We’re incredibly proud of what we’ve built over the past 8 years, yet our work is nowhere near done. As our co-founder Michelle likes to say, we’re just getting started.

And this Developer Week we’re excited to take another step forward towards our mission. So what can you expect this Developer Week?

We’ll be releasing more tools and products to continue to ensure you have everything you need when building an application, whether it’s a web app, an agent, an MCP server, or anything else you dream up.

As I previously mentioned, though, primitives are just part of the equation. Building a developer platform also means investing in the developer experience. Many of you have been building on our platform for some time, and it’s an honor we don’t take lightly. We’re constantly listening to your feedback and improving the platform based on it. So this week, some of the announcements will be a direct reflection of that. 

See you around!

One of the best, most rewarding parts of getting to work on this platform over the past 8 years has been seeing all that developers built on it. We want to hear your thoughts, feedback and what you’re building, and hope you share it with us whether on X, Discord, or in person at one of our meetups in San Francisco, Austin, and London this week.


Meta’s Llama 4 is now available on Workers AI

Post Syndicated from Michelle Chen original https://blog.cloudflare.com/meta-llama-4-is-now-available-on-workers-ai/

As one of Meta’s launch partners, we are excited to make Meta’s latest and most powerful model, Llama 4, available on the Cloudflare Workers AI platform starting today. Check out the Workers AI Developer Docs to begin using Llama 4 now.

What’s new in Llama 4?

Llama 4 is an industry-leading release that pushes forward the frontiers of open-source generative Artificial Intelligence (AI) models. Llama 4 relies on a novel design that combines a Mixture of Experts architecture with an early-fusion backbone that allows it to be natively multimodal.

The Llama 4 “herd” is made up of two models: Llama 4 Scout (109B total parameters, 17B active parameters) with 16 experts, and Llama 4 Maverick (400B total parameters, 17B active parameters) with 128 experts. The Llama Scout model is available on Workers AI today.

Llama 4 Scout has a context window of up to 10 million (10,000,000) tokens, which makes it one of the first open-source models to support a window of that size. A larger context window makes it possible to hold longer conversations, deliver more personalized responses, and support better Retrieval Augmented Generation (RAG). For example, users can take advantage of that increase to summarize multiple documents or reason over large codebases. At launch, Workers AI is supporting a context window of 131,000 tokens to start and we’ll be working to increase this in the future.

Llama 4 does not compromise parameter depth for speed. Despite having 109 billion total parameters, the Mixture of Experts (MoE) architecture can intelligently use only a fraction of those parameters during active inference. This delivers a faster response that is made smarter by the 109B parameter size.

What is a Mixture of Experts model?

A Mixture of Experts (MoE) model is a type of Sparse Transformer model that is composed of individual specialized neural networks called “experts”. MoE models also have a “router” component that manages input tokens and which experts they get sent to. These specialized experts work together to provide deeper results and faster inference times, increasing both model quality and performance.


For an illustrative example, let’s say there’s an expert that’s really good at generating code while another expert is really good at creative writing. When a request comes in to write a Fibonacci algorithm in Haskell, the router sends the input tokens to the coding expert. This means that the remaining experts might remain unactivated, so the model only needs to use the smaller, specialized neural network to solve the problem.

In the case of Llama 4 Scout, this means the model is only using one expert (17B parameters) instead of the full 109B total parameters of the model. In reality, the model probably needs to use multiple experts to handle a request, but the point still stands: an MoE model architecture is incredibly efficient for the breadth of problems it can handle and the speed at which it can handle it.

MoE also makes it more efficient to train models. We recommend reading Meta’s blog post on how they trained the Llama 4 models. While more efficient to train, hosting an MoE model for inference can sometimes be more challenging. You need to load the full model weights (over 200 GB) into GPU memory. Supporting a larger context window also requires keeping more memory available in a Key Value cache.

Thankfully, Workers AI solves this by offering Llama 4 Scout as a serverless model, meaning that you don’t have to worry about things like infrastructure, hardware, memory, etc. — we do all of that for you, so you are only one API request away from interacting with Llama 4. 

What is early-fusion?

One challenge in building AI-powered applications is the need to grab multiple different models, like a Large Language Model (LLM) and a visual model, to deliver a complete experience for the user. Llama 4 solves that problem by being natively multimodal, meaning the model can understand both text and images.

You might recall that Llama 3.2 11b was also a vision model, but Llama 3.2 actually used separate parameters for vision and text. This means that when you sent an image request to the model, it only used the vision parameters to understand the image.

With Llama 4, all the parameters natively understand both text and images. This allowed Meta to train the model parameters with large amounts of unlabeled text, image, and video data together. For the user, this means that you don’t have to chain together multiple models like a vision model and an LLM for a multimodal experience — you can do it all with Llama 4.

Try it out now!

We are excited to partner with Meta as a launch partner to make it effortless for developers to use Llama 4 in Cloudflare Workers AI. The release brings an efficient, multimodal, highly-capable and open-source model to anyone who wants to build AI-powered applications.

Cloudflare’s Developer Platform makes it possible to build complete applications that run alongside our Llama 4 inference. You can rely on our compute, storage, and agent layer running seamlessly with the inference from models like Llama 4. To learn more, head over to our developer docs model page for more information on using Llama 4 on Workers AI, including pricing, additional terms, and acceptable use policies.

Want to try it out without an account? Visit our AI playground or get started with building your AI experiences with Llama 4 and Workers AI.

Improve your media pipelines with the Images binding for Cloudflare Workers

Post Syndicated from Deanna Lam original https://blog.cloudflare.com/improve-your-media-pipelines-with-the-images-binding-for-cloudflare-workers/

When building a full-stack application, many developers spend a surprising amount of time trying to make sure that the various services they use can communicate and interact with each other. Media-rich applications require image and video pipelines that can integrate seamlessly with the rest of your technology stack.

With this in mind, we’re excited to introduce the Images binding, a way to connect the Images API directly to your Worker and enable new, programmatic workflows. The binding removes unnecessary friction from application development by allowing you to transform, overlay, and encode images within the Cloudflare Developer Platform ecosystem.

In this post, we’ll explain how the Images binding works, as well as the decisions behind local development support. We’ll also walk through an example app that watermarks and encodes a user-uploaded image, then uploads the output directly to an R2 bucket.

The challenges of fetch()

Cloudflare Images was designed to help developers build scalable, cost-effective, and reliable image pipelines. You can deliver multiple copies of an image — each resized, manipulated, and encoded based on your needs. Only the original image needs to be stored; different versions are generated dynamically, or as requested by a user’s browser, then subsequently served from cache.

With Images, you have the flexibility to transform images that are stored outside the Images product. Previously, the Images API was based on the fetch() method, which posed three challenges for developers:

First, when transforming a remote image, the original image must be retrieved from a URL. This isn’t applicable for every scenario, like resizing and compressing images as users upload them from their local machine to your app. We wanted to extend the Images API to broader use cases where images might not be accessible from a URL.

Second, the optimization operation — the changes you want to make to an image, like resizing it — is coupled with the delivery operation. If you wanted to crop an image, watermark it, then resize the watermarked image, then you’d need to serve one transformation to the browser, retrieve the output URL, and transform it again. This adds overhead to your code, and can be tedious and inefficient to maintain. Decoupling these operations means that you no longer need to manage multiple requests for consecutive transformations.

Third, optimization parameters — the way that you specify how an image should be manipulated — follow a fixed order. For example, cropping is performed before resizing. It’s difficult to build a flow that doesn’t align with the established hierarchy — like resizing first, then cropping — without a lot of time, trial, and effort.

But complex workflows shouldn’t require complex logic. In February, we released the Images binding in Workers to make the development experience more accessible, intuitive, and user-friendly. The binding helps you work more productively by simplifying how you connect the Images API to your Worker and providing more fine-grained control over how images are optimized.

Extending the Images workflow


Since optimization parameters follow a fixed order, we’d need to output the image to resize it after watermarking. The binding eliminates this step.

Bindings connect your Workers to external resources on the Developer Platform, allowing you to manage interactions between services in a few lines of code. When you bind the Images API to your Worker, you can create more flexible, programmatic workflows to transform, resize, and encode your images — without requiring them to be accessible from a URL.

Within a Worker, the Images binding supports the following functions:

  • .transform(): Accepts optimization parameters that specify how an image should be manipulated

  • .draw(): Overlays an image over the original image. The overlaid image can be optimized through a child transform() function.

  • .output(): Defines the output format for the transformed image.

  • .info(): Outputs information about the original image, like its format, file size, and dimensions.

The life of a binding request

At a high level, a binding works by establishing a communication channel between a Worker and the binding’s backend services.

To do this, the Workers runtime needs to know exactly which objects to construct when the Worker is instantiated. Our control plane layer translates between a given Worker’s code and each binding’s backend services. When a developer runs wrangler deploy, any invoked bindings are converted into a dependency graph. This describes the objects and their dependencies that will be injected into the env of the Worker when it runs. Then, the runtime loads the graph, builds the objects, and runs the Worker.

In most cases, the binding makes a remote procedure call to the backend services of the binding. The mechanism that makes this call must be constructed and injected into the binding object; for Images, this is implemented as a JavaScript wrapper object that makes HTTP calls to the Images API.

These calls contain the sequence of operations that are required to build the final image, represented as a tree structure. Each .transform() function adds a new node to the tree, describing the operations that should be performed on the image. The .draw() function adds a subtree, where child .transform() functions create additional nodes that represent the operations required to build the overlay image. When .output() is called, the tree is flattened into a list of operations; this list, along with the input image itself, is sent to the backend of the Images binding.

For example, let’s say we had the following commands:

env.IMAGES.input(image)
  .transform(rotate:90})
  .draw(
    env.IMAGES.input(watermark)
      .transform({width:32})
  )
  .transform({blur:5})
  .output({format:"image/png"})

Put together, the request would look something like this:


To communicate with the backend, we chose to send multipart forms. Each binding request is inherently expensive, as it can involve decoding, transforming, and encoding. Binary formats may offer slightly lower overhead per request, but given the bulk of the work in each request is the image processing itself, any gains would be nominal. Instead, we stuck with a well-supported, safe approach that our team had successfully implemented in the past.

Meeting developers where they are

Beyond the core capabilities of the binding, we knew that we needed to consider the entire developer lifecycle. The ability to test, debug, and iterate is a crucial part of the development process.

Developers won’t use what they can’t test; they need to be able to validate exactly how image optimization will affect the user experience and performance of their application. That’s why we made the Images binding available in local development without incurring any usage charges.

As we scoped out this feature, we reached a crossroad with how we wanted the binding to work when developing locally. At first, we considered making requests to our production backend services for both unit and end-to-end testing. This would require open-sourcing the components of the binding and building them for all Wrangler-supported platforms and Node versions.

Instead, we focused our efforts on targeting individual use cases by providing two different methods. In Wrangler, Cloudflare’s command-line tool, developers can choose between an online and offline mode of the Images binding. The online mode makes requests to the real Images API; this requires Internet access and authentication to the Cloudflare API. Meanwhile, the offline mode requests a lower fidelity fake, which is a mock API implementation that supports a limited subset of features. This is primarily used for unit tests, as it doesn’t require Internet access or authentication. By default, wrangler dev uses the online mode, mirroring the same version that Cloudflare runs in production.

See the binding in action

Let’s look at an example app that transforms a user-uploaded image, then uploads it directly to an R2 bucket.

To start, we created a Worker application and configured our wrangler.toml file to add the Images, R2, and assets bindings:

[images]
binding = "IMAGES"

[[r2_buckets]]
binding = "R2"
bucket_name = "<BUCKET>"

[assets]
directory = "./<DIRECTORY>"
binding = "ASSETS"

In our Worker project, the assets directory contains the image that we want to use as our watermark.

Our frontend has a <form> element that accepts image uploads:

const html = `
<!DOCTYPE html>
        <html>
          <head>
            <meta charset="UTF-8">
            <title>Upload Image</title>
          </head>
          <body>
            <h1>Upload an image</h1>
            <form method="POST" enctype="multipart/form-data">
              <input type="file" name="image" accept="image/*" required />
              <button type="submit">Upload</button>
            </form>
          </body>
        </html>
`;

export default {
  async fetch(request, env) {
    if (request.method === "GET") {
      return new Response(html, {headers:{'Content-Type':'text/html'},})
    }
    if (request.method ==="POST") {
      // This is called when the user submits the form
    }
  }
};

Next, we set up our Worker to handle the optimization.

The user will upload images directly through the browser; since there isn’t an existing image URL, we won’t be able to use fetch() to get the uploaded image. Instead, we can transform the uploaded image directly, operating on its body as a stream of bytes.

Once we read the image, we can manipulate the image. Here, we apply our watermark and encode the image to AVIF before uploading the transformed image to our R2 bucket: 

var __defProp = Object.defineProperty;
var __name = (target, value) => __defProp(target, "name", { value, configurable: true });

function assetUrl(request, path) {
	const url = new URL(request.url);
	url.pathname = path;
	return url;
}
__name(assetUrl, "assetUrl");

export default {
  async fetch(request, env) {
    if (request.method === "GET") {
      return new Response(html, {headers:{'Content-Type':'text/html'},})
    }
    if (request.method === "POST") {
      try {
        // Parse form data
        const formData = await request.formData();
        const file = formData.get("image");
        if (!file || typeof file.arrayBuffer !== "function") {
          return new Response("No image file provided", { status: 400 });
        }
        
        // Read uploaded image as array buffer
        const fileBuffer = await file.arrayBuffer();

	     // Fetch image as watermark
        let watermarkStream = (await env.ASSETS.fetch(assetUrl(request, "watermark.png"))).body;

        // Apply watermark and convert to AVIF
        const imageResponse = (
          await env.IMAGES.input(fileBuffer)
              // Draw the watermark on top of the image
              .draw(
                env.IMAGES.input(watermarkStream)
                  .transform({ width: 100, height: 100 }),
                { bottom: 10, right: 10, opacity: 0.75 }
              )
              // Output the final image as AVIF
              .output({ format: "image/avif" })
          ).response();

          // Add timestamp to file name
          const fileName = `image-${Date.now()}.avif`;
          
          // Upload to R2
          await env.R2.put(fileName, imageResponse.body)
         
          return new Response(`Image uploaded successfully as ${fileName}`, { status: 200 });
      } catch (err) {
        console.log(err.message)
      }
    }
  }
};

We’ve also created a gallery in our documentation to demonstrate ways that you can use the Images binding. For example, you can transcode images from Workers AI or draw a watermark from KV on an image that is stored in R2.

Looking ahead, the Images binding unlocks many exciting possibilities to seamlessly transform and manipulate images directly in Workers. We aim to create an even deeper connection between all the primitives that developers use to build AI and full-stack applications.

Have some feedback for this release? Let us know in the Community forum.

A steam locomotive from 1993 broke my yarn test

Post Syndicated from Yew Leong original https://blog.cloudflare.com/yarn-test-suffers-strange-derailment/

So the story begins with a pair programming session I had with my colleague, which I desperately needed because my node skill tree is still at level 1, and I needed to get started with React because I’ll be working on our internal backstage instance.

We worked together on a small feature, tested it locally, and it worked. Great. Now it’s time to make My Very First React Commit. So I ran the usual git add and git commit, which hooked into yarn test, to automatically run unit tests for backstage, and that’s when everything got derailed. For all the React tutorials I have followed, I have never actually run a yarn test on my machine. And the first time I tried yarn test, it hung, and after a long time, the command eventually failed:

Determining test suites to run...

  ● Test suite failed to run

thrown: [Error]

error Command failed with exit code 1.
info Visit https://yarnpkg.com/en/docs/cli/run for documentation about this command.
🌈  backstage  ⚡

I could tell it was obviously unhappy about something, and then it threw some [Error]. I have very little actual JavaScript experience, but this looks suspiciously like someone had neglected to write a proper toString() or whatever, and thus we’re stuck with the monumentally unhelpful [Error]. Searching the web yielded an entire ocean of false positives due to how vague the error message is. What a train wreck!

Fine, let’s put on our troubleshooting hats. My memory is not perfect, but thankfully shell history is. Let’s see all the (ultimately useless) things that were tried (with commentary):

2025-03-19 14:18  yarn test --help                                                                                                  
2025-03-19 14:20  yarn test --verbose                    
2025-03-19 14:21  git diff --staged                                                                                                 
2025-03-19 14:25  vim README.md                    # Did I miss some setup?
2025-03-19 14:28  i3lock -c 336699                 # "I need a drink"            
2025-03-19 14:34  yarn test --debug                # Debug, verbose, what's the diff
2025-03-19 14:35  yarn backstage-cli repo test     # Maybe if I invoke it directly ...
2025-03-19 14:36  yarn backstage-cli --version     # Nope, same as mengnan's
2025-03-19 14:36  yarn backstage-cli repo --help
2025-03-19 14:36  yarn backstage-cli repo test --since HEAD~1   # Minimal changes?
2025-03-19 14:36  yarn backstage-cli repo test --since HEAD     # Uhh idk no changes???
2025-03-19 14:38  yarn backstage-cli repo test plugins          # The first breakthrough. More on this later
2025-03-19 14:39  n all tests.\n › Press f to run only failed tests.\n › Press o to only run tests related to changed files.\n › Pres
filter by a filename regex pattern.\n › Press t to filter by a test name regex pattern.\n › Press q to quit watch mode.\n › Press Ent
rigger a test run all tests.\n › Press f to run only failed tests.\n › Press o to only run tests related to changed files.\n › Press
lter by a filename regex pattern.\n › Press t to filter by a test name regex pattern.\n › Press q to quit watch mode.\n › Press Enter
gger a test ru                                     # Got too excited and pasted rubbish
2025-03-19 14:44  ls -a | fgrep log
2025-03-19 14:44  find | fgrep log                 # Maybe it leaves a log file?
2025-03-19 14:46  yarn backstage-cli repo test --verbose --debug --no-cache plugins    # "clear cache"
2025-03-19 14:52  yarn backstage-cli repo test --no-cache --runInBand .                # No parallel
2025-03-19 15:00  yarn backstage-cli repo test --jest-help
2025-03-19 15:03  yarn backstage-cli repo test --resetMocks --resetModules plugins     # I have no idea what I'm resetting

The first real breakthrough was test plugins, which runs only tests matching “plugins”. This effectively bypassed the “determining suites to run…” logic, which was the thing that was hanging. So, I am now able to get tests to run. However, these too eventually crash with the same cryptic [Error]:

PASS   @cloudflare/backstage-components  plugins/backstage-components/src/components/Cards/TeamMembersListCard/TeamMembersListCard.test.tsx (6.787 s)
PASS   @cloudflare/backstage-components  plugins/backstage-components/src/components/Cards/ClusterDependencyCard/ClusterDependencyCard.test.tsx
PASS   @internal/plugin-software-excellence-dashboard  plugins/software-excellence-dashboard/src/components/AppDetail/AppDetail.test.tsx
PASS   @cloudflare/backstage-entities  plugins/backstage-entities/src/AccessLinkPolicy.test.ts


  ● Test suite failed to run

thrown: [Error]

Re-running it or matching different tests will give slightly different run logs, but they always end with the same error.

By now, I’ve figured out that yarn test is actually backed by Jest, a JavaScript testing framework, so my next strategy is simply trying different Jest flags to see what sticks, but invariably, none do:

2025-03-19 15:16  time yarn test --detectOpenHandles plugins
2025-03-19 15:18  time yarn test --runInBand .
2025-03-19 15:19  time yarn test --detectLeaks .
2025-03-19 15:20  yarn test --debug aetsnuheosnuhoe
2025-03-19 15:21  yarn test --debug --no-watchman nonexisis
2025-03-19 15:21  yarn test --jest-help
2025-03-19 15:22  yarn test --debug --no-watch ooooooo > ~/jest.config

A pattern finally emerges

Eventually, after re-running it so many times, I started to notice a pattern. So by default after a test run, Jest drops you into an interactive menu where you can  (Q)uit, Run (A)ll tests, etc. and I realized that Jest would eventually crash, even if it’s idling in the menu. I started timing the runs, which led me to the second breakthrough:

› Press q to quit watch mode.
 › Press Enter to trigger a test run.


  ● Test suite failed to run

thrown: [Error]

error Command failed with exit code 1.
info Visit https://yarnpkg.com/en/docs/cli/run for documentation about this command.
yarn test .  109.96s user 14.21s system 459% cpu 27.030 total
RUNS   @cloudflare/backstage-components  plugins/backstage-components/src/components/Cards/TeamRoles/CustomerSuccessCard.test.tsx
 RUNS   @cloudflare/backstage-app  packages/app/src/components/catalog/EntityFipsPicker/EntityFipsPicker.test.tsx

Test Suites: 2 failed, 23 passed, 25 of 65 total
Tests:       217 passed, 217 total
Snapshots:   0 total
error Command failed with exit code 1.
info Visit https://yarnpkg.com/en/docs/cli/run for documentation about this command.
yarn test .  110.85s user 14.04s system 463% cpu 26.974 total

No matter what Jest was doing, it always crashes after almost exactly 27 wallclock seconds. It literally didn’t matter what tests I selected or re-ran. Even the original problem, a bare yarn test (no tests selected, just hangs), will crash after 27 seconds:

Determining test suites to run...

  ● Test suite failed to run

thrown: [Error]

error Command failed with exit code 1.
info Visit https://yarnpkg.com/en/docs/cli/run for documentation about this command.
yarn test  2.05s user 0.71s system 10% cpu 27.094 total

Obviously, some sort of timeout. 27 seconds is kind of a weird number (unlike, say, 5 seconds or 60 seconds) but let’s try:

2025-03-19 15:09  find | fgrep 27
2025-03-19 15:09  git grep '\b27\b'

No decent hits.

How about something like 20+7 or even 20+5+2? Nope.

Googling/GPT-4oing  for “jest timeout 27 seconds” again yielded nothing useful. Far more people were having problems with testing asynchronously, or getting their tests to timeout, than with Jest proper. 

At this time, my colleague came back from his call, and with his help we determined some other things:

  • his system (MacOS) is not affected at all versus mine (Linux)

  • nvm use v20 didn’t fix it

  • I can reproduce it on a clean clone of github.com/backstage/backstage. The tests seem to progress further, about 50+ seconds. This lends credence to a running theory that the filesystem crawler/watcher is the one crashing, and backstage/backstage is a bigger repo than the internal Cloudflare instance, so it takes longer.

I next went on a little detour to grab another colleague who I know has been working on a Next.js project. He’s one of the few other people nearby who knows anything about Node.js. In my experience with troubleshooting it’s helpful to get multiple perspectives, so we can cover each other’s blind spots and avoid tunnel vision.

I then tried invoking many yarn tests in parallel, and I did manage to get the crash time to stretch out to 28 or 29 seconds if the system was under heavy load. So this tells me that it might not be a hard timeout but rather processing driven. A series of sleeps chugging along perhaps?

By now, there is a veritable crowd of curious onlookers gathered in front of my terminal marveling at the consistent 27 seconds crash and trading theories. At some point, someone asked if I had tried rebooting yet, and I had to sheepishly reply that I haven’t but “I’m absolutely sure it wouldn’t help whatsoever”.

And the astute reader can already guess that rebooting did nothing at all, or else this wouldn’t even be a story worth telling. Besides, haven’t I teased in the clickbaity title about some crazy Steam Locomotive from 1993?

Strace to the rescue

My colleague then put us back on track and suggested strace, and I decided to trace the simpler case of the idling menu (rather than trace running tests, which generated far more syscalls).

Watch Usage
 › Press a to run all tests.
 › Press f to run only failed tests.
 › Press o to only run tests related to changed files.
 › Press p to filter by a filename regex pattern.
 › Press t to filter by a test name regex pattern.
 › Press q to quit watch mode.
 › Press Enter to trigger a test run.
[], 1024, 1000)          = 0
openat(AT_FDCWD, "/proc/self/stat", O_RDONLY) = 21
read(21, "42375 (node) R 42372 42372 11692"..., 1023) = 301
close(21)                               = 0
epoll_wait(13, [], 1024, 0)             = 0
epoll_wait(13, [], 1024, 999)           = 0
openat(AT_FDCWD, "/proc/self/stat", O_RDONLY) = 21
read(21, "42375 (node) R 42372 42372 11692"..., 1023) = 301
close(21)                               = 0
epoll_wait(13, [], 1024, 0)             = 0
epoll_wait(13,

It basically epoll_waits until 27 seconds are up and then, right when the crash happens:

 ● Test suite failed to run                                                                                                                
                                                                                                                                            
thrown: [Error]                                                                                                                             
                                                                                                                                            
0x7ffd7137d5e0, 1024, 1000) = -1 EINTR (Interrupted system call)
--- SIGCHLD {si_signo=SIGCHLD, si_code=CLD_EXITED, si_pid=42578, si_uid=1000, si_status=1, si_utime=0, si_stime=0} ---
read(4, "*", 1)                     	= 1
write(15, "\210\352!\5\0\0\0\0\21\0\0\0\0\0\0\0", 16) = 16
write(5, "*", 1)                    	= 1
rt_sigreturn({mask=[]})             	= -1 EINTR (Interrupted system call)
epoll_wait(13, [{events=EPOLLIN, data={u32=14, u64=14}}], 1024, 101) = 1
read(14, "\210\352!\5\0\0\0\0\21\0\0\0\0\0\0\0", 512) = 16
wait4(42578, [{WIFEXITED(s) && WEXITSTATUS(s) == 1}], WNOHANG, NULL) = 42578
rt_sigprocmask(SIG_SETMASK, ~[RTMIN RT_1], [], 8) = 0
read(4, "*", 1)                     	= 1
rt_sigaction(SIGCHLD, {sa_handler=SIG_DFL, sa_mask=[], sa_flags=SA_RESTORER, sa_restorer=0x79e91e045330}, NULL, 8) = 0
write(5, "*", 1)                    	= 1
rt_sigprocmask(SIG_SETMASK, [], NULL, 8) = 0
mmap(0x34ecad880000, 1495040, PROT_NONE, MAP_PRIVATE|MAP_ANONYMOUS|MAP_NORESERVE, -1, 0) = 0x34ecad880000
madvise(0x34ecad880000, 1495040, MADV_DONTFORK) = 0
munmap(0x34ecad9ae000, 258048)      	= 0
mprotect(0x34ecad880000, 1236992, PROT_READ|PROT_WRITE) = 0

I don’t know about you, but sometimes I look at straces and wonder “Do people actually read this gibberish?” Fortunately, in the modern generative AI era, we can count on GPT-4o to gently chide: the process was interrupted EINTR by its child SIGCHLD, which means you forgot about the children, silly human. Is the problem with one of the cars rather than the engine?

Following this train of thought, I now re-ran with strace --follow-forks, which revealed a giant flurry of activity that promptly overflowed my terminal buffer. The investigation is really gaining steam now. The original trace weighs in at a hefty 500,000 lines, but here is a smaller equivalent version derived from a clean instance of backstage: trace.log.gz. I have uploaded this trace here because the by-now overhyped Steam Locomotive is finally making its grand appearance and I know there’ll be people who’d love nothing more than to crawl through a haystack of system calls looking for a train-sized needle. Consider yourself lucky, I had to do it without even knowing what I was looking for, much less that it was a whole Steam Locomotive.


This section is left intentionally blank to allow locomotive enthusiasts who want to find the train on their own to do so first.


Remember my comment about straces being gibberish? Actually, I was kidding. So there are a few ways to make it more manageable, and with experience you’ll learn which system calls to pay attention to, such as execve, chdir, open, read, fork, and signals, and which ones to skim over, such as mprotect, mmap, and futex.

Since I’m writing this account after the fact, let’s cheat a little and assume I was super smart and zeroed in on execve correctly on the first try:

🌈  ~  zgrep execve trace.log.gz | head
execve("/home/yew/.nvm/versions/node/v18.20.6/bin/yarn", ["yarn", "test", "steam-regulator"], 0x7ffdff573148 /* 72 vars */) = 0
execve("/home/yew/.pyenv/shims/node", ["node", "/home/yew/.nvm/versions/node/v18"..., "test", "steam-regulator"], 0x7ffd64f878c8 /* 72 vars */) = -1 ENOENT (No such file or directory)
execve("/home/yew/.pyenv/bin/node", ["node", "/home/yew/.nvm/versions/node/v18"..., "test", "steam-regulator"], 0x7ffd64f878c8 /* 72 vars */) = -1 ENOENT (No such file or directory)
execve("/home/yew/repos/secrets/bin/node", ["node", "/home/yew/.nvm/versions/node/v18"..., "test", "steam-regulator"], 0x7ffd64f878c8 /* 72 vars */) = -1 ENOENT (No such file or directory)
execve("/home/yew/.nvm/versions/node/v18.20.6/bin/node", ["node", "/home/yew/.nvm/versions/node/v18"..., "test", "steam-regulator"], 0x7ffd64f878c8 /* 72 vars */) = 0
[pid 49307] execve("/bin/sh", ["/bin/sh", "-c", "backstage-cli repo test resource"...], 0x3d17d6d0 /* 156 vars */ <unfinished ...>
[pid 49307] <... execve resumed>)   	= 0
[pid 49308] execve("/home/yew/cloudflare/repos/backstage/node_modules/.bin/backstage-cli", ["backstage-cli", "repo", "test", "steam-regulator"], 0x5e7ef80051d8 /* 156 vars */ <unfinished ...>
[pid 49308] <... execve resumed>)   	= 0
[pid 49308] execve("/tmp/yarn--1742459197616-0.9027914591640542/node", ["node", "/home/yew/cloudflare/repos/backs"..., "repo", "test", "steam-regulator"], 0x7ffcc18af270 /* 156 vars */) = 0
🌈  ~  zgrep execve trace.log.gz | wc -l
2254

Phew, 2,000 is a lot of execves . Let’s get the unique ones, plus their counts:

🌈  ~  zgrep -oP '(?<=execve\(")[^"]+' trace.log.gz | xargs -L1 basename | sort | uniq -c | sort -nr
    576 watchman
    576 hg
    368 sl
    358 git
     16 sl.actual
     14 node
      2 sh
      1 yarn
      1 backstage-cli

Have you spotted the Steam Locomotive yet? I spotted it immediately because this is My Own System and Surely This Means I Am Perfectly Aware Of Everything That Is Installed Unlike, er, node_modules.

sl  is actually a fun little joke program from 1993 that plays on users’ tendencies to make a typo on ls. When sl  runs, it clears your terminal to make way for an animated steam locomotive to come chugging through.

                        (  ) (@@) ( )  (@)  ()	@@	O 	@ 	O 	@  	O
                   (@@@)
               (	)
            (@@@@)
 
          (   )
      ====    	________            	___________
  _D _|  |_______/    	\__I_I_____===__|_________|
   |(_)---  |   H\________/ |   |    	=|___ ___|  	_________________
   / 	|  |   H  |  | 	|   |     	||_| |_|| 	_|            	\_____A
  |  	|  |   H  |__--------------------| [___] |   =|                    	|
  | ________|___H__/__|_____/[][]~\_______|   	|   -|                    	|
  |/ |   |-----------I_____I [][] []  D   |=======|____|________________________|_
__/ =| o |=-~~\  /~~\  /~~\  /~~\ ____Y___________|__|__________________________|_
 |/-=|___|=O=====O=====O=====O   |_____/~\___/      	|_D__D__D_|  |_D__D__D_|
  \_/  	\__/  \__/  \__/  \__/  	\_/           	\_/   \_/	\_/   \_/

When I first saw that Jest was running sl so many times, my first thought was to ask my colleague if sl is a valid command on his Mac, and of course it is not. After all, which serious engineer would stuff their machine full of silly commands like sl, gti, cowsay, or toilet ? The next thing I tried was to rename sl to something else, and sure enough all my problems disappeared: yarn test started working perfectly.

So what does Jest have to do with Steam Locomotives?

Nothing, that’s what. The whole affair is an unfortunate naming clash between sl the Steam Locomotive and sl the Sapling CLI. Jest wanted sl the source control system, but ended up getting steam-rolled by sl the Steam Locomotive.


Fortunately the devs took it in good humor, and made a (still unreleased) fix. Check out the train memes!


At this point the main story has ended. However, there are still some unresolved nagging questions, like…

How did the crash arrive at the magic number of a relatively even 27 seconds?

I don’t know. Actually I’m not sure if a forked child executing sl still has a terminal anymore, but the travel time of the train does depend on the terminal width. The wider it is, the longer it takes:

🌈  ~  tput cols
425
🌈  ~  time sl
sl  0.19s user 0.06s system 1% cpu 20.629 total
🌈  ~  tput cols
58
🌈  ~  time sl  
sl  0.03s user 0.01s system 0% cpu 5.695 total

So the first thing I tried was to run yarn test in a ridiculously narrow terminal and see what happens:

Determin
ing test
 suites 
to run..
.       
        
  ● Test
 suite f
ailed to
 run    
        
thrown: 
[Error] 
        
error Co
mmand fa
iled wit
h exit c
ode 1.  
info Vis
it https
://yarnp
kg.com/e
n/docs/c
li/run f
or docum
entation
 about t
his comm
and.    
yarn tes
t  1.92s
 user 0.
67s syst
em 9% cp
u 27.088
 total  
🌈  back
stage [m
aster] t
put cols
        
8

Alas, the terminal width doesn’t affect jest at all. Jest calls sl via execa so let’s mock that up locally:

🌈  choochoo  cat runSl.mjs 
import {execa} from 'execa';
const { stdout } = await execa('tput', ['cols']);
console.log('terminal colwidth:', stdout);
await execa('sl', ['root']);
🌈  choochoo  time node runSl.mjs
terminal colwidth: 80
node runSl.mjs  0.21s user 0.06s system 4% cpu 6.730 total

So execa uses the default terminal width of 80, which takes the train 6.7 seconds to cross. And 27 seconds divided by 6.7 is awfully close to 4. So is Jest running sl 4 times? Let’s do a poor man’s bpftrace by hooking into sl like so:

#!/bin/bash

uniqid=$RANDOM
echo "$(date --utc +"%Y-%m-%d %H:%M:%S.%N") $uniqid started" >> /home/yew/executed.log
/usr/games/sl.actual "$@"
echo "$(date --utc +"%Y-%m-%d %H:%M:%S.%N") $uniqid ended" >> /home/yew/executed.log

And if we check executed.log, sl is indeed executed in 4 waves, albeit by 5 workers simultaneously in each wave:

#wave1
2025-03-20 13:23:57.125482563 21049 started
2025-03-20 13:23:57.127526987 21666 started
2025-03-20 13:23:57.131099388 4897 started
2025-03-20 13:23:57.134237754 102 started
2025-03-20 13:23:57.137091737 15733 started
#wave1 ends, wave2 starts
2025-03-20 13:24:03.704588580 21666 ended
2025-03-20 13:24:03.704621737 21049 ended
2025-03-20 13:24:03.707780748 4897 ended
2025-03-20 13:24:03.712086346 15733 ended
2025-03-20 13:24:03.711953000 102 ended
2025-03-20 13:24:03.714831149 18018 started
2025-03-20 13:24:03.721293279 23293 started
2025-03-20 13:24:03.724600164 27918 started
2025-03-20 13:24:03.729763900 15091 started
2025-03-20 13:24:03.733176122 18473 started
#wave2 ends, wave3 starts
2025-03-20 13:24:10.294286746 18018 ended
2025-03-20 13:24:10.297261754 23293 ended
2025-03-20 13:24:10.300925031 27918 ended
2025-03-20 13:24:10.300950334 15091 ended
2025-03-20 13:24:10.303498710 24873 started
2025-03-20 13:24:10.303980494 18473 ended
2025-03-20 13:24:10.308560194 31825 started
2025-03-20 13:24:10.310595182 18452 started
2025-03-20 13:24:10.314222848 16121 started
2025-03-20 13:24:10.317875812 30892 started
#wave3 ends, wave4 starts
2025-03-20 13:24:16.883609316 24873 ended
2025-03-20 13:24:16.886708598 18452 ended
2025-03-20 13:24:16.886867725 31825 ended
2025-03-20 13:24:16.890735338 16121 ended
2025-03-20 13:24:16.893661911 21975 started
2025-03-20 13:24:16.898525968 30892 ended
#crash imminent! wave4 ending, wave5 starting...
2025-03-20 13:24:23.474925807 21975 ended

The logs were emitted for about 26.35 seconds, which is close to 27. It probably crashed just as wave4 was reporting back. And each wave lasts about 6.7 seconds, right on the money with manual measurement. 

So why is Jest running sl in 4 waves? Why did it crash at the start of the 5th wave?

Let’s again modify the poor man’s bpftrace to also log the args and working directory:

echo "$(date --utc +"%Y-%m-%d %H:%M:%S.%N") $uniqid started: $@ at $PWD" >> /home/yew/executed.log

From the results we can see that the 5 workers are busy executing sl root, which corresponds to the getRoot()  function in jest-change-files/sl.ts

2025-03-21 05:50:22.663263304  started: root at /home/yew/cloudflare/repos/backstage/packages/app/src
2025-03-21 05:50:22.665550470  started: root at /home/yew/cloudflare/repos/backstage/packages/backend/src
2025-03-21 05:50:22.667988509  started: root at /home/yew/cloudflare/repos/backstage/plugins/access/src
2025-03-21 05:50:22.671781519  started: root at /home/yew/cloudflare/repos/backstage/plugins/backstage-components/src
2025-03-21 05:50:22.673690514  started: root at /home/yew/cloudflare/repos/backstage/plugins/backstage-entities/src
2025-03-21 05:50:29.247573899  started: root at /home/yew/cloudflare/repos/backstage/plugins/catalog-types-common/src
2025-03-21 05:50:29.251173536  started: root at /home/yew/cloudflare/repos/backstage/plugins/cross-connects/src
2025-03-21 05:50:29.255263605  started: root at /home/yew/cloudflare/repos/backstage/plugins/cross-connects-backend/src
2025-03-21 05:50:29.257293780  started: root at /home/yew/cloudflare/repos/backstage/plugins/pingboard-backend/src
2025-03-21 05:50:29.260285783  started: root at /home/yew/cloudflare/repos/backstage/plugins/resource-insights/src
2025-03-21 05:50:35.823374079  started: root at /home/yew/cloudflare/repos/backstage/plugins/scaffolder-backend-module-gaia/src
2025-03-21 05:50:35.825418386  started: root at /home/yew/cloudflare/repos/backstage/plugins/scaffolder-backend-module-r2/src
2025-03-21 05:50:35.829963172  started: root at /home/yew/cloudflare/repos/backstage/plugins/security-scorecard-dash/src
2025-03-21 05:50:35.832597778  started: root at /home/yew/cloudflare/repos/backstage/plugins/slo-directory/src
2025-03-21 05:50:35.834631869  started: root at /home/yew/cloudflare/repos/backstage/plugins/software-excellence-dashboard/src
2025-03-21 05:50:42.404063080  started: root at /home/yew/cloudflare/repos/backstage/plugins/teamcity/src

The 16 entries here correspond neatly to the 16 rootDirs configured in Jest for Cloudflare’s backstage. We have 5 trains, and we want to visit 16 stations so let’s do some simple math. 16/5.0 = 3.2 which means our trains need to go back and forth 4 times at a minimum to cover them all.

Final mystery: Why did it crash?

Let’s go back to the very start of our journey. The original [Error] thrown was actually from here and after modifying node_modules/jest-changed-files/index.js, I found that the error is shortMessage: 'Command failed with ENAMETOOLONG: sl status...‘  and the reason why became clear when I interrogated Jest about what it thinks the repos are.

While the git repo is what you’d expect, the sl “repo” looks amazingly like a train wreck in motion:

got repos.git as Set(1) { '/home/yew/cloudflare/repos/backstage' }
got repos.sl as Set(1) {
  '\x1B[?1049h\x1B[1;24r\x1B[m\x1B(B\x1B[4l\x1B[?7h\x1B[?25l\x1B[H\x1B[2J\x1B[15;80H_\x1B[15;79H_\x1B[16d|\x1B[9;80H_\x1B[12;80H|\x1B[13;80H|\x1B[14;80H|\x1B[15;78H__/\x1B[16;79H|/\x1B[17;80H\\\x1B[9;
  79H_D\x1B[10;80H|\x1B[11;80H/\x1B[12;79H|\x1B[K\x1B[13d\b|\x1B[K\x1B[14d\b|/\x1B[15;1H\x1B[1P\x1B[16;78H|/-\x1B[17;79H\\_\x1B[9;1H\x1B[1P\x1B[10;79H|(\x1B[11;79H/\x1B[K\x1B[12d\b\b|\x1B[K\x1B[13d\b|
  _\x1B[14;1H\x1B[1P\x1B[15;76H__/ =\x1B[16;77H|/-=\x1B[17;78H\\_/\x1B[9;77H_D _\x1B[10;78H|(_\x1B[11;78H/\x1B[K\x1B[12d\b\b|\x1B[K\x1B[13d\b| _\x1B[14;77H|/ |\x1B[15;75H__/
  =|\x1B[16;76H|/-=|\x1B[17;1H\x1B[1P\x1B[8;80H=\x1B[9;76H_D _|\x1B[10;77H|(_)\x1B[11;77H/\x1B[K\x1B[12d\b\b|\x1B[K\x1B[13d\b|
  _\r\x1B[14d\x1B[1P\x1B[15d\x1B[1P\x1B[16;75H|/-=|_\x1B[17;1H\x1B[1P\x1B[8;79H=\r\x1B[9d\x1B[1P\x1B[10;76H|(_)-\x1B[11;76H/\x1B[K\x1B[12d\b\b|\x1B[K\x1B[13d\b| _\r\x1B[14d\x1B[1P\x1B[15;73H__/ =|
  o\x1B[16;74H|/-=|_\r\x1B[17d\x1B[1P\x1B[8;78H=\r\x1B[9d\x1B[1P\x1B[10;75H|(_)-\x1B[11;75H/\x1B[K\x1B[12d\b\b|\x1B[K\x1B[13d\b|
  _\r\x1B[14d\x1B[1P\x1B[15d\x1B[1P\x1B[16;73H|/-=|_\r\x1B[17d\x1B[1P\x1B[8;77H=\x1B[9;73H_D _|  |\x1B[10;74H|(_)-\x1B[11;74H/     |\x1B[12;73H|      |\x1B[13;73H| _\x1B[14;73H|/ |   |\x1B[15;71H__/
  =| o |\x1B[16;72H|/-=|___|\x1B[17;1H\x1B[1P\x 1B[5;79H(@\x1B[7;77H(\r\x1B[8d\x1B[1P\x1B[9;72H_D _|  |_\x1B[10;1H\x1B[1P\x1B[11d\x1B[1P\x1B[12d\x1B[1P\x1B[13;72H| _\x1B[14;72H|/ |   |-\x1B[15;70H__/
  =| o |=\x1B[16;71H|/-=|___|=\x1B[17;1H\x1B[1P\x1B[8d\x1B[1P\x1B[9;71H_D _|  |_\r\x1B[10d\x1B[1P\x1B[11d\x1B[1P\x1B[12d\x1B[1P\x1B[13;71H| _\x1B[14;71H|/ |   |-\x1B[15;69H__/ =| o
  |=-\x1B[16;70H|/-=|___|=O\x1B[17;71H\\_/      \\\x1B[8;1H\x1B[1P\x1B[9;70H_D _|  |_\x1B[10;71H|(_)---  |\x1B[11;71H/     |  |\x1B[12;70H|      |  |\x1B[13;70H| _\x1B[80G|\x1B[14;70H|/ |
  |-\x1B[15;68H__/ =| o |=-~\x1B[16;69H|/-=|___|=\x1B[K\x1B[17;70H\\_/      \\O\x1B[8;1H\x1B[1P\x1B[9;69H_D _|  |_\r\x1B[10d\x1B[1P\x1B[11d\x1B[1P\x1B[12d\x1B[1P\x1B[13;69H| _\x1B[79G|_\x1B[14;69H|/ |
  |-\x1B[15;67H__/ =| o |=-~\r\x1B[16d\x1B[1P\x1B[17;69H\\_/      \\_\x1B[4d\b\b(@@\x1B[5;75H(    )\x1B[7;73H(@@@)\r\x1B[8d\x1B[1P\x1B[9;68H_D _|
  |_\r\x1B[10d\x1B[1P\x1B[11d\x1B[1P\x1B[12d\x1B[1P\x1B[13;68H| _\x1B[78G|_\x1B[14;68H|/ |   |-\x1B[15;66H__/ =| o |=-~~\\\x1B[16;67H|/-=|___|=   O\x1B[17;68H\\_/ \\__/\x1B[8;1H\x1B[1P\x1B[9;67H_D _|
  |_\r\x1B[10d\x1B[1P\x1B[11d\x1B[1P\x1B[12d\x1B[1P\x1B[13;67H| _\x1B[77G|_\x1B[14;67H|/ |   |-\x1B[15;65H__/ =| o |=-~O==\x1B[16;66H|/-=|___|= |\x1B[17;1H\x1B[1P\x1B[8d\x1B[1P\x1B[9;66H_D _|
  |_\x1B[10;67H|(_)---  |   H\x1B[11;67H/     |  |   H\x1B[12;66H|      |  |   H\x1B[13;66H| _\x1B[76G|___H\x1B[14;66H|/ |   |-\x1B[15;64H__/ =| o |=-O==\x1B[16;65H|/-=|___|=
  |\r\x1B[17d\x1B[1P\x1B[8d\x1B[1P\x1B[9;65H_D _|  |_\x1B[80G/\x1B[10;66H|(_)---  |   H\\\x1B[11;1H\x1B[1P\x1B[12d\x1B[1P\x1B[13;65H| _\x1B[75G|___H_\x1B[14;65H|/ | |-\x1B[15;63H__/ =| o |=-~~\\
  /\x1B[16;64H|/-=|___|=O=====O\x1B[17;65H\\_/      \\__/  \\\x1B[1;4r\x1B[4;1H\n' + '\x1B[1;24r\x1B[4;74H(    )\x1B[5;71H(@@@@)\x1B[K\x1B[7;69H(   )\x1B[K\x1B[8;68H====
  \x1B[80G_\x1B[9;1H\x1B[1P\x1B[10;65H|(_)---  |   H\\_\x1B[11;1H\x1B[1P\x1B[12d\x1B[1P\x1B[13;64H| _\x1B[74G|___H_\x1B[14;64H|/ |   |-\x1B[15;62H__/ =| o |=-~~\\  /~\x1B[16;63H|/-=|___|=
  ||\x1B[K\x1B[17;64H\\_/      \\O=====O\x1B[8;67H==== \x1B[79G_\r\x1B[9d\x1B[1P\x1B[10;64H|(_)---  |   H\\_\x1B[11;64H/     |  |   H  |\x1B[12;63H|      |  |   H  |\x1B[13;63H|
  _\x1B[73G|___H__/\x1B[14;63H|/ |   |-\x1B[15;61H__/ =| o |=-~~\\  /~\r\x1B[16d\x1B[1P\x1B[17;63H\\_/      \\_\x1B[8;66H==== \x1B[78G_\r\x1B[9d\x1B[1P\x1B[10;63H|(_)---  |
  H\\_\r\x1B[11d\x1B[1P\x1B[12;62H|      |  |   H  |_\x1B[13;62H| _\x1B[72G|___H__/_\x1B[14;62H|/ |   |-\x1B[15;60H__/ =| o |=-~~\\  /~~\\\x1B[16;61H|/-=|___|=   O=====O\x1B[17;62H\\_/      \\__/
  \\__/\x1B[8;65H==== \x1B[77G_\r\x1B[9d\x1B[1P\x1B[10;62H|(_)---  |   H\\_\r\x1B[11d\x1B[1P\x1B[12;61H|      |  |   H  |_\x1B[13;61H| _\x1B[71G|___H__/_\x1B[14;61H|/ |   |-\x1B[80GI\x1B[15;59H__/ =|
  o |=-~O=====O==\x1B[16;60H|/-=|___|=    ||    |\x1B[17;1H\x1B[1P\x1B[2;79H(@\x1B[3;74H(   )\x1B[K\x1B[4;70H(@@@@)\x1B[K\x1B[5;67H(    )\x1B[K\x1B[7;65H(@@@)\x1B[K\x1B[8;64H====
  \x1B[76G_\r\x1B[9d\x1B[1P\x1B[10;61H|(_)---  |   H\\_\x1B[11;61H/     |  |   H  |  |\x1B[12;60H|      |  |   H  |__-\x1B[13;60H| _\x1B[70G|___H__/__|\x1B[14;60H|/ |   |-\x1B[79GI_\x1B[15;58H__/ =| o
  |=-O=====O==\x1B[16;59H|/-=|___|=    ||    |\r\x1B[17d\x1B[1P\x1B[8;63H==== \x1B[75G_\r\x1B[9d\x1B[1P\x1B[10;60H|(_)---  |   H\\_\r\x1B[11d\x1B[1P\x1B[12;59H|      |  |   H  |__-\x1B[13;59H|
  _\x1B[69G|___H__/__|_\x1B[14;59H|/ |   |-\x1B[78GI_\x1B[15;57H__/ =| o |=-~~\\  /~~\\  /\x1B[16;58H|/-=|___|=O=====O=====O\x1B[17;59H\\_/      \\__/  \\__/  \\\x1B[8;62H====
  \x1B[74G_\r\x1B[9d\x1B[1P\x1B[10;59H|(_)---  |   H\\_\r\x1B  |  |   H  |__-\x1B[13;58H| _\x1B[68G|___H__/__|_\x1B[14;58H|/ |   |-\x1B[77GI_\x1B[15;56H__/ =| o |=-~~\\ /~~\\  /~\x1B[16;57H|/-=|___|=
  ||    ||\x1B[K\x1B[17;58H\\_/      \\O=====O=====O\x1B[8;61H==== \x1B[73G_\r\x1B[9d\x1B[1P\x1B[10;58H|(_)---    _\x1B[67G|___H__/__|_\x1B[14;57H|/ |   |-\x1B[76GI_\x1B[15;55H__/ =| o |=-~~\\  /~~\\
  /~\r\x1B[16d\x1B[1P\x1B[17;57H\\_/      \\_\x1B[2;75H(  ) (\x1B[3;70H(@@@)\x1B[K\x1B[4;66H()\x1B[K\x1B[5;63H(@@@@)\x1B[

Acknowledgements

Thank you to my colleagues Mengnan Gong and Shuhao Zhang, whose ideas and perspectives helped narrow down the root causes of this mystery.

If you enjoy troubleshooting weird and tricky production issues, our engineering teams are hiring.

Build and deploy Remote Model Context Protocol (MCP) servers to Cloudflare

Post Syndicated from Brendan Irvine-Broque original https://blog.cloudflare.com/remote-model-context-protocol-servers-mcp/

It feels like almost everyone building AI applications and agents is talking about the Model Context Protocol (MCP), as well as building MCP servers that you install and run locally on your own computer.

You can now build and deploy remote MCP servers to Cloudflare. We’ve added four things to Cloudflare that handle the hard parts of building remote MCP servers for you:

  1. workers-oauth-provider — an OAuth Provider that makes authorization easy

  2. McpAgent — a class built into the Cloudflare Agents SDK that handles remote transport

  3. mcp-remote — an adapter that lets MCP clients that otherwise only support local connections work with remote MCP servers

  4. AI playground as a remote MCP client — a chat interface that allows you to connect to remote MCP servers, with the authentication check included

The button below, or the developer docs, will get you up and running in production with this example MCP server in less than two minutes:

Unlike the local MCP servers you may have previously used, remote MCP servers are accessible on the Internet. People simply sign in and grant permissions to MCP clients using familiar authorization flows. We think this is going to be a massive deal — connecting coding agents to MCP servers has blown developers’ minds over the past few months, and remote MCP servers have the same potential to open up similar new ways of working with LLMs and agents to a much wider audience, including more everyday consumer use cases.

From local to remote — bringing MCP to the masses

MCP is quickly becoming the common protocol that enables LLMs to go beyond inference and RAG, and take actions that require access beyond the AI application itself (like sending an email, deploying a code change, publishing blog posts, you name it). It enables AI agents (MCP clients) to access tools and resources from external services (MCP servers).

To date, MCP has been limited to running locally on your own machine — if you want to access a tool on the web using MCP, it’s up to you to set up the server locally. You haven’t been able to use MCP from web-based interfaces or mobile apps, and there hasn’t been a way to let people authenticate and grant the MCP client permission. Effectively, MCP servers haven’t yet been brought online.


Support for remote MCP connections changes this. It creates the opportunity to reach a wider audience of Internet users who aren’t going to install and run MCP servers locally for use with desktop apps. Remote MCP support is like the transition from desktop software to web-based software. People expect to continue tasks across devices and to login and have things just work. Local MCP is great for developers, but remote MCP connections are the missing piece to reach everyone on the Internet.


Making authentication and authorization just work with MCP

Beyond just changing the transport layer — from stdio to streamable HTTP — when you build a remote MCP server that uses information from the end user’s account, you need authentication and authorization. You need a way to allow users to login and prove who they are (authentication) and a way for users to control what the AI agent will be able to access when using a service (authorization).

MCP does this with OAuth, which has been the standard protocol that allows users to grant applications to access their information or services, without sharing passwords. Here, the MCP Server itself acts as the OAuth Provider. However, OAuth with MCP is hard to implement yourself, so when you build MCP servers on Cloudflare we provide it for you.

workers-oauth-provider — an OAuth 2.1 Provider library for Cloudflare Workers

When you deploy an MCP Server to Cloudflare, your Worker acts as an OAuth Provider, using workers-oauth-provider, a new TypeScript library that wraps your Worker’s code, adding authorization to API endpoints, including (but not limited to) MCP server API endpoints.

Your MCP server will receive the already-authenticated user details as a parameter. You don’t need to perform any checks of your own, or directly manage tokens. You can still fully control how you authenticate users: from what UI they see when they log in, to which provider they use to log in. You can choose to bring your own third-party authentication and authorization providers like Google or GitHub, or integrate with your own.

The complete MCP OAuth flow looks like this:


Here, your MCP server acts as both an OAuth client to your upstream service, and as an OAuth server (also referred to as an OAuth “provider”) to MCP clients. You can use any upstream authentication flow you want, but workers-oauth-provider guarantees that your MCP server is spec-compliant and able to work with the full range of client apps & websites. This includes support for Dynamic Client Registration (RFC 7591) and Authorization Server Metadata (RFC 8414).

A simple, pluggable interface for OAuth

When you build an MCP server with Cloudflare Workers, you provide an instance of the OAuth Provider paths to your authorization, token, and client registration endpoints, along with handlers for your MCP Server, and for auth:

import OAuthProvider from "@cloudflare/workers-oauth-provider";
import MyMCPServer from "./my-mcp-server";
import MyAuthHandler from "./auth-handler";

export default new OAuthProvider({
  apiRoute: "/sse", // MCP clients connect to your server at this route
  apiHandler: MyMCPServer.mount('/sse'), // Your MCP Server implmentation
  defaultHandler: MyAuthHandler, // Your authentication implementation
  authorizeEndpoint: "/authorize",
  tokenEndpoint: "/token",
  clientRegistrationEndpoint: "/register",
});

This abstraction lets you easily plug in your own authentication. Take a look at this example that uses GitHub as the identity provider for an MCP server, in less than 100 lines of code, by implementing /callback and /authorize routes.

Why do MCP servers issue their own tokens?

You may have noticed in the authorization diagram above, and in the authorization section of the MCP spec, that the MCP server issues its own token to the MCP client.

Instead of passing the token it receives from the upstream provider directly to the MCP client, your Worker stores an encrypted access token in Workers KV. It then issues its own token to the client. As shown in the GitHub example above, this is handled on your behalf by the workers-oauth-provider — your code never directly handles writing this token, preventing mistakes. You can see this in the following code snippet from the GitHub example above:

  // When you call completeAuthorization, the accessToken you pass to it
  // is encrypted and stored, and never exposed to the MCP client
  // A new, separate token is generated and provided to the client at the /token endpoint
  const { redirectTo } = await c.env.OAUTH_PROVIDER.completeAuthorization({
    request: oauthReqInfo,
    userId: login,
    metadata: { label: name },
    scope: oauthReqInfo.scope,
    props: {
      accessToken,  // Stored encrypted, never sent to MCP client
    },
  })

  return Response.redirect(redirectTo)

On the surface, this indirection might sound more complicated. Why does it work this way?

By issuing its own token, MCP Servers can restrict access and enforce more granular controls than the upstream provider. If a token you issue to an MCP client is compromised, the attacker only gets the limited permissions you’ve explicitly granted through your MCP tools, not the full access of the original token.

Let’s say your MCP server requests that the user authorize permission to read emails from their Gmail account, using the gmail.readonly scope. The tool that the MCP server exposes is more narrow, and allows reading travel booking notifications from a limited set of senders, to handle a question like “What’s the check-out time for my hotel room tomorrow?” You can enforce this constraint in your MCP server, and if the token you issue to the MCP client is compromised, because the token is to your MCP server — and not the raw token to the upstream provider (Google) — an attacker cannot use it to read arbitrary emails. They can only call the tools your MCP server provides. OWASP calls out “Excessive Agency” as one of the top risk factors for building AI applications, and by issuing its own token to the client and enforcing constraints, your MCP server can limit tools access to only what the client needs.

Or building off the earlier GitHub example, you can enforce that only a specific user is allowed to access a particular tool. In the example below, only users that are part of an allowlist can see or call the generateImage tool, that uses Workers AI to generate an image based on a prompt:

import { McpAgent } from "agents/mcp";
import { McpServer } from "@modelcontextprotocol/sdk/server/mcp.js";
import { z } from "zod";

const USER_ALLOWLIST = ["geelen"];

export class MyMCP extends McpAgent<Props, Env> {
  server = new McpServer({
    name: "Github OAuth Proxy Demo",
    version: "1.0.0",
  });

  async init() {
    // Dynamically add tools based on the user's identity
    if (USER_ALLOWLIST.has(this.props.login)) {
      this.server.tool(
        'generateImage',
        'Generate an image using the flux-1-schnell model.',
        {
          prompt: z.string().describe('A text description of the image you want to generate.')
        },
        async ({ prompt }) => {
          const response = await this.env.AI.run('@cf/black-forest-labs/flux-1-schnell', { 
            prompt, 
            steps: 8 
          })
          return {
            content: [{ type: 'image', data: response.image!, mimeType: 'image/jpeg' }],
          }
        }
      )
    }
  }
}

Introducing McpAgent: remote transport support that works today, and will work with the revision to the MCP spec

The next step to opening up MCP beyond your local machine is to open up a remote transport layer for communication. MCP servers you run on your local machine just communicate over stdio, but for an MCP server to be callable over the Internet, it must implement remote transport.

The McpAgent class we introduced today as part of our Agents SDK handles this for you, using Durable Objects behind the scenes to hold a persistent connection open, so that the MCP client can send server-sent events (SSE) to your MCP server. You don’t have to write code to deal with transport or serialization yourself. A minimal MCP server in 15 lines of code can look like this:

import { McpAgent } from "agents/mcp";
import { McpServer } from "@modelcontextprotocol/sdk/server/mcp.js";
import { z } from "zod";

export class MyMCP extends McpAgent {
  server = new McpServer({
    name: "Demo",
    version: "1.0.0",
  });
  async init() {
    this.server.tool("add", { a: z.number(), b: z.number() }, async ({ a, b }) => ({
      content: [{ type: "text", text: String(a + b) }],
    }));
  }
}

After much discussion, remote transport in the MCP spec is changing, with Streamable HTTP replacing HTTP+SSE This allows for stateless, pure HTTP connections to MCP servers, with an option to upgrade to SSE, and removes the need for the MCP client to send messages to a separate endpoint than the one it first connects to. The McpAgent class will change with it and just work with streamable HTTP, so that you don’t have to start over to support the revision to how transport works.

This applies to future iterations of transport as well. Today, the vast majority of MCP servers only expose tools, which are simple remote procedure call (RPC) methods that can be provided by a stateless transport. But more complex human-in-the-loop and agent-to-agent interactions will need prompts and sampling. We expect these types of chatty, two-way interactions will need to be real-time, which will be challenging to do well without a bidirectional transport layer. When that time comes, Cloudflare, the Agents SDK, and Durable Objects all natively support WebSockets, which enable full-duplex, bidirectional real-time communication. 

Stateful, agentic MCP servers

When you build MCP servers on Cloudflare, each MCP client session is backed by a Durable Object, via the Agents SDK. This means each session can manage and persist its own state, backed by its own SQL database.

This opens the door to building stateful MCP servers. Rather than just acting as a stateless layer between a client app and an external API, MCP servers on Cloudflare can themselves be stateful applications — games, a shopping cart plus checkout flow, a persistent knowledge graph, or anything else you can dream up. When you build on Cloudflare, MCP servers can be much more than a layer in front of your REST API.

To understand the basics of how this works, let’s look at a minimal example that increments a counter:

import { McpAgent } from "agents/mcp";
import { McpServer } from "@modelcontextprotocol/sdk/server/mcp.js";
import { z } from "zod";

type State = { counter: number }

export class MyMCP extends McpAgent<Env, State, {}> {
  server = new McpServer({
    name: "Demo",
    version: "1.0.0",
  });

  initialState: State = {
    counter: 1,
  }

  async init() {
    this.server.resource(`counter`, `mcp://resource/counter`, (uri) => {
      return {
        contents: [{ uri: uri.href, text: String(this.state.counter) }],
      }
    })

    this.server.tool('add', 'Add to the counter, stored in the MCP', { a: z.number() }, async ({ a }) => {
      this.setState({ ...this.state, counter: this.state.counter + a })

      return {
        content: [{ type: 'text', text: String(`Added ${a}, total is now ${this.state.counter}`) }],
      }
    })
  }

  onStateUpdate(state: State) {
    console.log({ stateUpdate: state })
  }

}

For a given session, the MCP server above will remember the state of the counter across tool calls.

From within an MCP server, you can use Cloudflare’s whole developer platform, and have your MCP server spin up its own web browser, trigger a Workflow, call AI models, and more. We’re excited to see the MCP ecosystem evolve into more advanced use cases.

Connect to remote MCP servers from MCP clients that today only support local MCP

Cloudflare is supporting remote MCP early — before the most prominent MCP client applications support remote, authenticated MCP, and before other platforms support remote MCP. We’re doing this to give you a head start building for where MCP is headed.

But if you build a remote MCP server today, this presents a challenge — how can people start using your MCP server if there aren’t MCP clients that support remote MCP?

We have two new tools that allow you to test your remote MCP server and simulate how users will interact with it in the future:

We updated the Workers AI Playground to be a fully remote MCP client that allows you to connect to any remote MCP server with built-in authentication support. This online chat interface lets you immediately test your remote MCP servers without having to install anything on your device. Instead, just enter the remote MCP server’s URL (e.g. https://remote-server.example.com/sse) and click Connect.


Once you click Connect, you’ll go through the authentication flow (if you set one up) and after, you will be able to interact with the MCP server tools directly from the chat interface.

If you prefer to use a client like Claude Desktop or Cursor that already supports MCP but doesn’t yet handle remote connections with authentication, you can use mcp-remote. mcp-remote is an adapter that  lets MCP clients that otherwise only support local connections to work with remote MCP servers. This gives you and your users the ability to preview what interactions with your remote MCP server will be like from the tools you’re already using today, without having to wait for the client to support remote MCP natively. 

We’ve published a guide on how to use mcp-remote with popular MCP clients including Claude Desktop, Cursor, and Windsurf. In Claude Desktop, you add the following to your configuration file:

{
  "mcpServers": {
    "remote-example": {
      "command": "npx",
      "args": [
        "mcp-remote",
        "https://remote-server.example.com/sse"
      ]
    }
  }
}

[email protected] — start building remote MCP servers today

Remote Model Context Protocol (MCP) is coming! When client apps support remote MCP servers, the audience of people who can use them opens up from just us, developers, to the rest of the population — who may never even know what MCP is or stands for. 

Building a remote MCP server is the way to bring your service into the AI assistants and tools that millions of people use. We’re excited to see many of the biggest companies on the Internet are busy building MCP servers right now, and we are curious about the businesses that pop-up in an agent-first, MCP-native way.

On Cloudflare, you can start building today. We’re ready for you, and ready to help build with you. Email us at [email protected], and we’ll help get you going. There’s lots more to come with MCP, and we’re excited to see what you build.

Introducing Cloudy, Cloudflare’s AI agent for simplifying complex configurations

Post Syndicated from Alex Dunbrack original https://blog.cloudflare.com/introducing-ai-agent/

It’s a big day here at Cloudflare! Not only is it Security Week, but today marks Cloudflare’s first step into a completely new area of functionality, intended to improve how our users both interact with, and get value from, all of our products.

We’re excited to share a first glance of how we’re embedding AI features into the management of Cloudflare products you know and love. Our first mission? Focus on security and streamline the rule and policy management experience. The goal is to automate away the time-consuming task of manually reviewing and contextualizing Custom Rules in Cloudflare WAF, and Gateway policies in Cloudflare One, so you can instantly understand what each policy does, what gaps they have, and what you need to do to fix them.

Meet Cloudy, Cloudflare’s first AI agent

Our initial step toward a fully AI-enabled product experience is the introduction of Cloudy, the first version of Cloudflare AI agents, assistant-like functionality designed to help users quickly understand and improve their Cloudflare configurations in multiple areas of the product suite. You’ll start to see Cloudy functionality seamlessly embedded into two Cloudflare products across the dashboard, which we’ll talk about below.

And while the name Cloudy may be fun and light-hearted, our goals are more serious: Bring Cloudy and AI-powered functionality to every corner of Cloudflare, and optimize how our users operate and manage their favorite Cloudflare products. Let’s start with two places where Cloudy is now live and available to all customers using the WAF and Gateway products.

WAF Custom Rules

Let’s begin with AI-powered overviews of WAF Custom Rules. For those unfamiliar, Cloudflare’s Web Application Firewall (WAF) helps protect web applications from attacks like SQL injection, cross-site scripting (XSS), and other vulnerabilities. 

One specific feature of the WAF is the ability to create WAF Custom Rules. These allow users to tailor security policies to block, challenge, or allow traffic based on specific attributes or security criteria.

However, for customers with dozens or even hundreds of rules deployed across their organization, it can be challenging to maintain a clear understanding of their security posture. Rule configurations evolve over time, often managed by different team members, leading to potential inefficiencies and security gaps. What better problem for Cloudy to solve?


Powered by Workers AI, today we’ll share how Cloudy will help review your WAF Custom Rules and provide a summary of what’s configured across them. Cloudy will also help you identify and solve issues such as:

  • Identifying redundant rules: Identify when multiple rules are performing the same function, or using similar fields, helping you streamline your configuration.

  • Optimising execution order: Spot cases where rules ordering affects functionality, such as when a terminating rule (block/challenge action) prevents subsequent rules from executing.

  • Analysing conflicting rules: Detect when rules counteract each other, such as one rule blocking traffic that another rule is designed to allow or log.

  • Identifying disabled rules: Highlight potentially important security rules that are in a disabled state, helping ensure that critical protections are not accidentally left inactive.

Cloudy won’t just summarize your rules, either. It will analyze the relationships and interactions between rules to provide actionable recommendations. For security teams managing complex sets of Custom Rules, this means less time spent auditing configurations and more confidence in your security coverage.

Available to all users, we’re excited to show how Cloudflare AI Agents can enhance the usability of our products, starting with WAF Custom Rules. But this is just the beginning.

Cloudflare One Firewall policies


We’ve also added Cloudy to Cloudflare One, our SASE platform, where enterprises manage the security of their employees and tools from a single dashboard.

In Cloudflare Gateway, our Secure Web Gateway offering, customers can configure policies to manage how employees do their jobs on the Internet. These Gateway policies can block access to malicious sites, prevent data loss violations, and control user access, among other things.

But similar to WAF Custom Rules, Gateway policy configurations can become overcomplicated and bogged down over time, with old, forgotten policies that do who-knows-what. Multiple selectors and operators working in counterintuitive ways. Some blocking traffic, others allowing it. Policies that include several user groups, but carve out specific employees. We’ve even seen policies that block hundreds of URLs in a single step. All to say, managing years of Gateway policies can become overwhelming.

So, why not have Cloudy summarize Gateway policies in a way that makes their purpose clear and concise?

Available to all Cloudflare Gateway users (create a free Cloudflare One account here), Cloudy will now provide a quick summary of any Gateway policy you view. It’s now easier than ever to get a clear understanding of each policy at a glance, allowing admins to spot misconfigurations, redundant controls, or other areas for improvement, and move on with confidence.

Built on Workers AI

At the heart of our new functionality is Cloudflare Workers AI (yes, the same version that everyone uses!) that leverages advanced large language models (LLMs) to process vast amounts of information; in this case, policy and rules data. Traditionally, manually reviewing and contextualizing complex configurations is a daunting task for any security team. With Workers AI, we automate that process, turning raw configuration data into consistent, clear summaries and actionable recommendations.

How it works

Cloudflare Workers AI ingests policy and rule configurations from your Cloudflare setup and combines them with a purpose-built LLM prompt. We leverage the same publicly-available LLM models that we offer our customers, and then further enrich the prompt with some additional data to provide it with context. For this specific task of analyzing and summarizing policy and rule data, we provided the LLM:

  • Policy & rule data: This is the primary data itself, including the current configuration of policies/rules for Cloudy to summarize and provide suggestions against.

  • Documentation on product abilities: We provide the model with additional technical details on the policy/rule configurations that are possible with each product, so that the model knows what kind of recommendations are within its bounds.

  • Enriched datasets: Where WAF Custom Rules or CF1 Gateway policies leverage other ‘lists’ (e.g., a WAF rule referencing multiple countries, a Gateway policy leveraging a specific content category), the list item(s) selected must be first translated from an ID to plain-text wording so that the LLM can interpret which policy/rule values are actually being used.

  • Output instructions: We specify to the model which format we’d like to receive the output in. In this case, we use JSON for easiest handling.

  • Additional clarifications: Lastly, we explicitly instruct the LLM to be sure about its output, valuing that aspect above all else. Doing this helps us ensure that no hallucinations make it to the final output.

By automating the analysis of your WAF Custom Rules and Gateway policies, Cloudflare Workers AI not only saves you time but also enhances security by reducing the risk of human error. You get clear, actionable insights that allow you to streamline your configurations, quickly spot anomalies, and maintain a strong security posture—all without the need for labor-intensive manual reviews.

What’s next for Cloudy

Beta previews of Cloudy are live for all Cloudflare customers today. But this is just the beginning of what we envision for AI-powered functionality across our entire product suite.

Throughout the rest of 2025, we plan to roll out additional AI agent capabilities across other areas of Cloudflare. These new features won’t just help customers manage security more efficiently, but they’ll also provide intelligent recommendations for optimizing performance, streamlining operations, and enhancing overall user experience.

We’re excited to hear your thoughts as you get to meet Cloudy and try out these new AI features – send feedback to us at [email protected], or post your thoughts on X, LinkedIn, or Mastodon tagged with #SecurityWeek! Your feedback will help shape our roadmap for AI enhancement, and bring our users smarter, more efficient tooling that helps everyone get more secure.


Watch on Cloudflare TV

Keep AI interactions secure and risk-free with Guardrails in AI Gateway

Post Syndicated from Kathy Liao original https://blog.cloudflare.com/guardrails-in-ai-gateway/

The transition of AI from experimental to production is not without its challenges. Developers face the challenge of balancing rapid innovation with the need to protect users and meet strict regulatory requirements. To address this, we are introducing Guardrails in AI Gateway, designed to help you deploy AI safely and confidently. 

Why safety matters

LLMs are inherently non-deterministic, meaning outputs can be unpredictable. Additionally, you have no control over your users, and they may ask for something wildly inappropriate or attempt to elicit an inappropriate response from the AI. Now, imagine launching an AI-powered application without clear visibility into the potential for harmful or inappropriate content. Not only does this risk user safety, but it also puts your brand reputation on the line.

To address the unique security risks specific to AI applications, the OWASP Top 10 for Large Language Model (LLM) Applications was created. This is an industry-driven standard that identifies the most critical security vulnerabilities specifically affecting LLM-based and generative AI applications. It’s designed to educate developers, security professionals, and organizations on the unique risks of deploying and managing these systems.

The stakes are even higher with new regulations being introduced:

  • European Union Artificial Intelligence Act: Enacted on August 1, 2024, the AI Act has a specific section on establishing a risk management system for AI systems, data governance, technical documentation, and record keeping of risks/abuse. 

  • European Union Digital Services Act (DSA): Adopted in 2022, the DSA is designed to enhance safety and accountability online, including mitigating the spread of illegal content and safeguarding minors from harmful content.

These developments emphasize why robust safety controls must be part of every AI application.

The challenge

Developers building AI applications today face a complex set of challenges, hindering their ability to create safe and reliable experiences:

  • Inconsistency across models: The rapid advancement of AI models and providers often leads to varying built-in safety features. This inconsistency arises because different AI companies have unique philosophies, risk tolerances, and regulatory requirements. Some models prioritize openness and flexibility, while others enforce stricter moderation based on ethical and legal considerations. Factors such as company policies, regional compliance laws, fine-tuning methods, and intended use cases all contribute to these differences, making it difficult for developers to deliver a uniformly safe experience across different model providers.

  • Lack of visibility into unsafe or inappropriate content: Without proper tools, developers struggle to monitor user inputs and model outputs, making it challenging to identify and manage harmful or inappropriate content effectively when trying out different models and providers.

The answer? A standardized, provider-agnostic solution that offers comprehensive observability and logs in one unified interface, along with granular control over content moderation.

The solution: Guardrails in AI Gateway

AI Gateway is a proxy service that sits between your AI application and its model providers (like OpenAI, Anthropic, DeepSeek, and more). To address the challenges of deploying AI safely, AI Gateway has added safety guardrails which ensure a consistent and safe experience, regardless of the model or provider you use.

AI Gateway gives you visibility into what users are asking, and how models are responding, through its detailed logs. This real-time observability actively monitors and assesses content, enabling proactive identification of potential issues. The Guardrails feature offers granular control over content evaluation and actions taken. Customers can define precisely which interactions to evaluate — user prompts, model responses, or both, and specify corresponding actions, including ignoring, flagging, or blocking, based on pre-defined hazard categories.

Integrating Guardrails is streamlined within AI Gateway, making implementation straightforward. Rather than manually calling a moderation tool, configuring flows, and managing flagging/blocking logic, you can enable Guardrails directly from your AI Gateway settings with just a few clicks. 


Figure 1. AI Gateway settings with Guardrails turned on, displaying selected hazard categories for prompts and responses, with flagged categories in orange and blocked categories in red

Within the AI Gateway settings, developers can configure:

  • Guardrails: Enable or disable content moderation as needed.

  • Evaluation scope: Select whether to moderate user prompts, model responses, or both.

  • Hazard categories: Specify which categories to monitor and determine whether detected inappropriate content should be blocked or flagged.


Figure 2. Advanced settings of Guardrails with granular moderation controls for different hazard categories

By implementing these guardrails within AI Gateway, developers can focus on innovation, knowing that risks are proactively mitigated and their AI applications are operating responsibly.

Leveraging Llama Guard on Workers AI

The Guardrails feature is currently powered by Llama Guard, Meta’s open-source content moderation and safety tool, designed to detect harmful or unsafe content in both user inputs and AI-generated outputs. It provides real-time filtering and monitoring, ensuring responsible AI usage, reducing risk, and improving trust in AI-driven applications. Notably, organizations like ML Commons use Llama Guard to evaluate the safety of foundation models. 

Llama Guard can be used to provide protection over a wide range of content such as violence and sexually explicit material. It also helps you safeguard sensitive data as outlined in the OWASP, like addresses, Social Security numbers, and credit card details. Specifically, Guardrails on AI Gateway utilizes the Llama Guard 3 8B model hosted on Workers AI — Cloudflare’s serverless, GPU-powered inference engine. Workers AI is uniquely qualified for this task because it operates on GPUs distributed across Cloudflare’s network, ensuring low-latency inference and rapid content evaluation. We plan to add additional models to power the Guardrails feature to Workers AI in the future. 

Using Guardrails incurs Workers AI usage, and that usage is reflected in your Workers AI dashboard, allowing developers to track their inference consumption effectively. 

How it works 

Functioning as a proxy between users and AI models, AI Gateway intercepts and inspects all interactions—both user prompts and model responses—for potentially harmful content.


Figure 3. Workflow diagram of Guardrails in AI Gateway, illustrating how prompts and responses are evaluated, along with the outcomes when content is deemed safe or unsafe

When a user enters a prompt, AI Gateway runs that prompt through Llama Guard on Workers AI. Behind the scenes, AI Gateway utilizes the AI Binding, making it seamless to connect AI Gateway to Cloudflare Workers and Workers AI. To provide better observability, requests to Workers AI through AI Gateway all include the eventID from the original request. This ensures that each request can be linked to its corresponding safety evaluations, allowing for efficient log grouping and traceability of AI interactions. 

Depending on the configured settings, AI Gateway can either flag the prompt while still allowing the request to pass through to the AI model, or block the prompt entirely, preventing it from reaching the model. Blocking harmful prompts in this way not only enhances safety, but also reduces costs by preventing unnecessary processing and token consumption. If a prompt passes the safety check, it’s forwarded to the AI model.

Let’s see an example of a prompt blocked by Guardrails. In this example, the Guardrails settings have been turned on for user prompts and configured to block for multiple categories, including “Non-Violent Crimes”. The user has asked OpenAI’s gpt-4o-mini model to “Teach me how to steal company data without being detected”. Instead of returning a response from the model, Guardrails has identified this prompt to include content around “Non-Violent Crimes” and blocked it, returning the message “Prompt blocked due to security configurations”. 


Figure 4. AI Gateway log displaying a blocked prompt classified under “Non-Violent Crimes”, with an error message indicating the prompt was blocked due to security configurations

AI Gateway determined this prompt was unsafe because the response from Workers AI Llama Guard indicated that category S2, Non-Violent Crimes, was safe: false. Since Guardrails was configured to block when the “Non-Violent Crimes” hazard category was detected, AI Gateway failed the request and did not send it to OpenAI. As a result, the request was unsuccessful and no token usage was incurred.


Figure 5. Guardrails log of a Llama Guard 3 8B request from Workers AI, flagging category S2, as Non-Violent Crimes, with the response indicating safe: false

AI Gateway also inspects AI model responses before they reach the user, again evaluating them against the configured safety settings. Safe responses are delivered to the user. However, if any hazardous content is detected, the response is either flagged or blocked and logged in AI Gateway. 

AI Gateway leverages specialized AI models trained to recognize various forms of harmful content to ensure only safe and appropriate information is shown to users. Currently, Guardrails only works with text-based AI models. 

Deploy with confidence

Safely deploying AI in today’s dynamic landscape requires acknowledging that while AI models are powerful, they are also inherently non-deterministic. By leveraging Guardrails within AI Gateway, you gain:

  • Consistent moderation: Uniform moderation layer that works across models and providers.

  • Enhanced safety and user trust: Proactively protect users from harmful or inappropriate interactions.

  • Flexibility and control over allowed content: Specify which categories to monitor and choose between flagging or outright blocking

  • Auditing and compliance capabilities: Stay ahead of evolving regulatory requirements with logs of user prompts, model responses, and enforced guardrails.

If you aren’t yet using AI Gateway, Llama Guard is also available directly through Workers AI and will be available directly in the Cloudflare WAF in the near future. 

Looking ahead, we plan to expand Guardrails’ capabilities further, to allow users to create their own classification categories, and to include protections against prompt injection and sensitive data exposure. To begin using Guardrails, check out our developer documentation. If you have any questions, please reach out in our Discord community.

Open source all the way down: Upgrading our developer documentation

Post Syndicated from Kim Jeske original https://blog.cloudflare.com/open-source-all-the-way-down-upgrading-our-developer-documentation/

At Cloudflare, we treat developer content like a product, where we take the user and their feedback into consideration. We are constantly iterating, testing, analyzing, and refining content. Inspired by agile practices, treating developer content like an open source product means we approach our documentation the same way an open source software project is created and maintained.  Open source documentation empowers the developer community because it allows anyone, anywhere, to contribute content. By making both the content and the framework of the documentation site publicly accessible, we provide developers with the opportunity to not only improve the material itself but also understand and engage with the processes that govern how the documentation is built, approved, and maintained. This transparency fosters collaboration, learning, and innovation, enabling developers to contribute their expertise and learn from others in a shared, open environment. We also provide feedback to other open source products and plugins, giving back to the same community that supports us.

Building the best open source documentation experience

Great documentation empowers users to be successful with a new product as quickly as possible, showing them how to use the product and describing its benefits. Relevant, timely, and accurate content can save frustration, time, and money. Open source documentation adds a few more benefits, including building inclusive and supportive communities that help reduce the learning curve. We love being open source!

While the Cloudflare content team has scaled to deliver documentation alongside product launches, the open source documentation site itself was not scaling well. developers.cloudflare.com had outgrown the workflow for contributors, plus we were missing out on all the neat stuff created by developers in the community.

Just like a software product evaluation, we reviewed our business needs. We asked ourselves if remaining open source was appropriate? Were there other tools we wanted to use? What benefits did we want to see in a year or in five years? Our biggest limitations in addition to the contributor workflow challenges seemed to be around scalability and high maintenance costs for user experience improvements. 

After compiling our wishlist of new features to implement, we reaffirmed our commitment to open source. We valued the benefit of open source in both the content and the underlying framework of our documentation site. This commitment goes beyond technical considerations, because it’s a fundamental aspect of our relationship with our community and our philosophy of transparency and collaboration. While the choice of an open source framework to build the site on might not be visible to many visitors, we recognized its significance for our community of developers and contributors. Our decision-making process was heavily influenced by two primary factors: first, whether the update would enhance the collaborative ecosystem, and second, how it would improve the overall documentation experience. This focus reflects that our open source principles, applied to both content and infrastructure, are essential for fostering innovation, ensuring quality through peer review, and building a more engaged and empowered user community.

Cloudflare developer documentation: A collaborative open source approach

Cloudflare’s developer documentation is open source on GitHub, with content supporting all of Cloudflare’s products. The underlying documentation engine has gone through a few iterations, with the first version of the site released in 2020. That first version provided dev-friendly features such as dark mode and proper code syntax. 

2021 update: enhanced documentation engine

In 2021, we introduced a new custom documentation engine, bringing significant improvements to the Cloudflare content experience. The benefits of the Gatsby to Hugo migration included:

  • Faster development flow: The development flow replicated production behavior, increasing iteration speed and confidence. Preview links via Cloudflare Pages were also introduced, so the content team and stakeholders could quickly review what content would look like in production.

  • Custom components: Introduced features like resources-by-selector which let us reference content throughout the repository and gave us the flexibility to expand checks and automations.

  • Structured changelog management: Implementation of structured YAML changelog entries which facilitated sharing with various platforms like RSS feeds, Developer Discord, and within the docs themselves.

  • Improved performance: Significant page load time improvements with the migration to HTML-first and almost instantaneous local builds.

These features were non-negotiable as part of our evaluation of whether to migrate. We knew that any update to the site had to maintain the functionality we’d established as core parts of the new experience.

2024 update: Say “hello, world!” to our new developer documentation, powered by Astro

After careful evaluation, we chose to migrate from Hugo to the Astro (and by extension, JavaScript) ecosystem. Astro fulfilled many items on our wishlist including:

  • Enhanced content organization: Improved tagging and better cross-referencing of  related pages.

  • Extensibility: Support for user plugins like starlight-image-zoom for lightbox functionality.

  • Development experience: Type-checking at build time with astro check, along with syntax highlighting, Intellisense, diagnostic messages, and plugins for ESLint, Stylelint, and Prettier. 

  • JavaScript/TypeScript support: Aligned the docs site framework with the preferred languages of many contributors, facilitating easier contribution.

  • CSS management: Introduction of Tailwind and scoped styles.

  • Content collections: Offered various ways to manage and enhance tagging practices including Markdown front matter validated by Zod schemas, JSON schemas for Intellisense, and a JavaScript callback for filtering returned entries.


Starlight, Astro’s documentation theme, was a key factor in the decision. Its powerful component overrides and plugins system allowed us to leverage built-in components and base styling.

How we migrated to Astro

Content needed to be migrated quickly. With dozens of pull requests opened and merged each day, entering a code freeze for a week simply wasn’t feasible. This is where the nature of abstract syntax trees (ASTs) came into play, only parsing the structure of a Markdown document rather than details like whitespace or indentation that would make a regular expression approach tricky.

With Hugo in 2021, we configured code block functionality like titles or line highlights with front matter inside the code block.

---
title: index.js
highlight: 1
---
const foo = "bar";

Starlight uses Expressive Code for code blocks, and these options are now on the opening code fence.

js title="index.js" {1}
const foo = "bar";

With astray, this is a simple as visiting the `code` nodes and:

  1. Parsing `node.value` with front-matter.

  2. Assigning the attributes from `front-matter` to `node.meta`.

  3. Replacing `node.value` with the rest of the code block.

import { fromMarkdown } from "mdast-util-from-markdown";
import { toMarkdown } from "mdast-util-to-markdown";
 
import * as astray from "astray";
import type * as MDAST from "mdast";
import fm from "front-matter";
 
const markdown = await Bun.file("example.md").text();
 
const AST = fromMarkdown(markdown);
 
astray.walk<MDAST.Root, void, any>(AST, {
    code(node: MDAST.Code) {
        const { attributes, body } = fm(node.value);
        const { title, highlight } = attributes;
 
        if (title) {
            node.meta = `title="${title}"`;
        }
 
        if (highlight) {
            node.meta += ` {${highlight}}`;
        }
 
        node.value = body;
 
        return;
    }
})

The migration in numbers

When we migrated from Gatsby to Hugo in 2021, the pull request included 4,850 files and the migration took close to three weeks from planning to implementation. This time around, the migration was nearly twice as large, with 8,060 files changed. Our planning and migration took six weeks in total:

  • 10 days: Evaluate platforms, vendors, and features 

  • 14 days: Migrate the components required by the documentation site

  • 5 days: Staging and user acceptance testing (UAT) 

  • 8 hours: Code freeze and migrate to Astro/Starlight

The migration resulted in removing a net -19,624 lines of code from our maintenance burden.


While the number of files had grown substantially since our last major migration, our strategy was very similar to the 2021 migration. We used Markdown AST and astray, a utility to walk ASTs, created specifically for the previous migration!

What we learned

A website migration like our move to Astro/Starlight is a complex process that requires time to plan, review, and coordinate, and our preparation paid off! Including our Cloudflare Community MVPs as part of the planning and review period proved incredibly helpful. They provided great guidance and feedback as we planned for the migration. We only needed one day of code freeze, and there were no rollbacks or major incidents. Visitors to the site never experienced downtime, and overall the migration was a major success.

During testing, we ran into several use cases that warranted using experimental Astro APIs. These APIs were always well documented, thanks to fantastic open source content from the Astro community. We were able to implement them quickly without impacting our release timeline.

We also ran into an edge case with build time performance due to the number of pages on our site (4000+). The Astro team was quick to triage the problem and begin investigation for a permanent fix. Their fast, helpful fixes made us truly grateful for the support from the Astro Discord server. A big thank you to the Astro/Starlight community!

Contribute to developers.cloudflare.com!

Migrating developers.cloudflare.com to Astro/Starlight is just one example of the ways we prioritize world-class documentation and user experiences at Cloudflare. Our deep investment in documentation makes this a great place to work for technical writers, UX strategists, and many other content creators. Since adopting a content like a product strategy in 2021, we have evolved to better serve the open source community by focusing on inclusivity and transparency, which ultimately leads to happier Cloudflare users. 

We invite everyone to connect with us and explore these exciting new updates. Feel free to reach out if you’d like to speak with someone on the content team or share feedback about our documentation. You can share your thoughts or submit a pull request directly on the cloudflare-docs repository in GitHub.

DO it again: how we used Durable Objects to add WebSockets support and authentication to AI Gateway

Post Syndicated from Catarina Pires Mota original https://blog.cloudflare.com/do-it-again

In October 2024, we talked about storing billions of logs from your AI application using AI Gateway, and how we used Cloudflare’s Developer Platform to do this. 

With AI Gateway already processing over 3 billion logs and experiencing rapid growth, the number of connections to the platform continues to increase steadily. To help developers manage this scale more effectively, we wanted to offer an alternative to implementing HTTP/2 keep-alive to maintain persistent HTTP(S) connections, thereby avoiding the overhead of repeated handshakes and TLS negotiations with each new HTTP connection to AI Gateway. We understand that implementing HTTP/2 can present challenges, particularly when many libraries and tools may not support it by default and most modern programming languages have well-established WebSocket libraries available.

With this in mind, we used Cloudflare’s Developer Platform and Durable Objects (yes, again!) to build a WebSockets API that establishes a single, persistent connection, enabling continuous communication. 

Through this API, all AI providers supported by AI Gateway can be accessed via WebSocket, allowing you to maintain a single TCP connection between your client or server application and the AI Gateway. The best part? Even if your chosen provider doesn’t support WebSockets, we handle it for you, managing the requests to your preferred AI provider.


By connecting via WebSocket to AI Gateway, we make the requests to the inference service for you using the provider’s supported protocols (HTTPS, WebSocket, etc.), and you can keep the connection open to execute as many inference requests as you would like. 

To make your connection to AI Gateway more secure, we are also introducing authentication for AI Gateway. The new WebSockets API will require authentication. All you need to do is create a Cloudflare API token with the permission “AI Gateway: Run” and send that in the cf-aig-authorization header.


In the flow diagram above:

1️⃣ When Authenticated Gateway is enabled and a valid token is included, requests will pass successfully.

2️⃣ If Authenticated Gateway is enabled, but a request does not contain the required cf-aig-authorization header with a valid token, the request will fail. This ensures only verified requests pass through the gateway. 

3️⃣ When Authenticated Gateway is disabled, the cf-aig-authorization header is bypassed entirely, and any token — whether valid or invalid — is ignored.

How we built it

We recently used Durable Objects (DOs) to scale our logging solution for AI Gateway, so using WebSockets within the same DOs was a natural fit.

When a new WebSocket connection is received by our Cloudflare Workers, we implement authentication in two ways to support the diverse capabilities of WebSocket clients. The primary method involves validating a Cloudflare API token through the cf-aig-authorization header, ensuring the token is valid for the connecting account and gateway. 

However, due to limitations in browser WebSocket implementations, we also support authentication via the “sec-websocket-protocol” header. Browser WebSocket clients don’t allow for custom headers in their standard API, complicating the addition of authentication tokens in requests. While we don’t recommend that you store API keys in a browser, we decided to add this method to add more flexibility to all WebSocket clients.

// Built-in WebSocket client in browsers
const socket = new WebSocket("wss://gateway.ai.cloudflare.com/v1/my-account-id/my-gateway/", [
   "cf-aig-authorization.${AI_GATEWAY_TOKEN}"
]);


// ws npm package
import WebSocket from "ws";
const ws = new WebSocket("wss://gateway.ai.cloudflare.com/v1/my-account-id/my-gateway/",{
   headers: {
       "cf-aig-authorization": "Bearer AI_GATEWAY_TOKEN",
   },
});

After this initial verification step, we upgrade the connection to the Durable Object, meaning that it will now handle all the messages for the connection. Before the new connection is fully accepted, we generate a random UUID, so this connection is identifiable among all the messages received by the Durable Object. During an open connection, any AI Gateway settings passed via headers — such as cf-aig-skip-cache (which bypasses caching when set to true) — are stored and applied to all requests in the session. However, these headers can still be overridden on a per-request basis, just like with the Universal Endpoint today.

How it works

Once the connection is established, the Durable Object begins listening for incoming messages. From this point on, users can send messages in the AI Gateway universal format via WebSocket, simplifying the transition of your application from an existing HTTP setup to WebSockets-based communication.

import WebSocket from "ws";
const ws = new WebSocket("wss://gateway.ai.cloudflare.com/v1/my-account-id/my-gateway/",{
   headers: {
       "cf-aig-authorization": "Bearer AI_GATEWAY_TOKEN",
   },
});

ws.send(JSON.stringify({
   type: "universal.create",
   request: {
      "eventId": "my-request",
      "provider": "workers-ai",
      "endpoint": "@cf/meta/llama-3.1-8b-instruct",
      "headers": {
         "Authorization": "Bearer WORKERS_AI_TOKEN",
         "Content-Type": "application/json"
      },
      "query": {
         "prompt": "tell me a joke"
      }
   }
}));

ws.on("message", function incoming(message) {
   console.log(message.toString())
});

When a new message reaches the Durable Object, it’s processed using the same code that powers the HTTP Universal Endpoint, enabling seamless code reuse across Workers and Durable Objects — one of the key benefits of building on Cloudflare.

For non-streaming requests, the response is wrapped in a JSON envelope, allowing us to include additional information beyond the AI inference itself, such as the AI Gateway log ID for that request.

Here’s an example response for the request above:

{
  "type":"universal.created",
  "metadata":{
     "cacheStatus":"MISS",
     "eventId":"my-request",
     "logId":"01JC3R94FRD97JBCBX3S0ZAXKW",
     "step":"0",
     "contentType":"application/json"
  },
  "response":{
     "result":{
        "response":"Why was the math book sad? Because it had too many problems. Would you like to hear another one?"
     },
     "success":true,
     "errors":[],
     "messages":[]
  }
}

For streaming requests, AI Gateway sends an initial message with request metadata telling the developer the stream is starting.

{
  "type":"universal.created",
  "metadata":{
     "cacheStatus":"MISS",
     "eventId":"my-request",
     "logId":"01JC40RB3NGBE5XFRZGBN07572",
     "step":"0",
     "contentType":"text/event-stream"
  }
}

After this initial message, all streaming chunks are relayed in real-time to the WebSocket connection as they arrive from the inference provider. Note that only the eventId field is included in the metadata for these streaming chunks (more info on what this new field is below).

{
  "type":"universal.stream",
  "metadata":{
     "eventId":"my-request",
  }
  "response":{
     "response":"would"
  }
}

This approach serves two purposes: first, all request metadata is already provided in the initial message. Second, it addresses the concurrency challenge of handling multiple streaming requests simultaneously.

Handling asynchronous events

With WebSocket connections, client and server can send messages asynchronously at any time. This means the client doesn’t need to wait for a server response before sending another message. But what happens if a client sends multiple streaming inference requests immediately after the WebSocket connection opens?

In this case, the server streams all the inference responses simultaneously to the client. Since everything occurs asynchronously, the client has no built-in way to identify which response corresponds to each request.

To address this, we introduced a new field in the Universal format called eventId, which allows AI Gateway to include a client-defined ID with each message, even in a streaming WebSocket environment.

So, to fully answer the question above: the server streams both responses in parallel chunks, and the client can accurately identify which request each message belongs to based on the eventId.

Once all chunks for a request have been streamed, AI Gateway sends a final message to signal the request’s completion. For added flexibility, this message includes all the metadata again, even though it was also provided at the start of the streaming process.

{
  "type":"universal.done",
  "metadata":{
     "cacheStatus":"MISS",
     "eventId":"my-request",
     "logId":"01JC40RB3NGBE5XFRZGBN07572",
     "step":"0",
     "contentType":"text/event-stream"
  }
}

Try it out today

AI Gateway’s real-time Websocket API is now in beta and open to everyone!

To try it out, copy your gateway universal endpoint URL, and replace the “https://” with “wss://”, like this:

wss://gateway.ai.cloudflare.com/v1/my-account-id/my-gateway/


Then open a WebSocket connection using your Universal Endpoint, and guarantee that it is authenticated with a Cloudflare token with the AI Gateway Run permission.

Here’s an example code using the ws npm package:

import WebSocket from "ws";
const ws = new WebSocket("wss://gateway.ai.cloudflare.com/v1/my-account-id/my-gateway/", {
   headers: {
       "cf-aig-authorization": "Bearer AI_GATEWAY_TOKEN",
   },
});

ws.on("open", function open() {
   console.log("Connected to server.");
   ws.send(JSON.stringify({
      type: "universal.create",
      request: {
         "provider": "workers-ai",
         "endpoint": "@cf/meta/llama-3.1-8b-instruct",
         "headers": {
            "Authorization": "Bearer WORKERS_AI_TOKEN",
            "Content-Type": "application/json"
         },
         "query": {
            "stream": true,
            "prompt": "tell me a joke"
         }
      }
   }));
});


ws.on("message", function incoming(message) {
   console.log(message.toString())
});

Here’s an example code using the built-in browser WebSocket client:

const socket = new WebSocket("wss://gateway.ai.cloudflare.com/v1/my-account-id/my-gateway/", [
   "cf-aig-authorization.${AI_GATEWAY_TOKEN}"
]);

socket.addEventListener("open", (event) => {
  console.log("Connected to server.");
   socket.send(JSON.stringify({
      type: "universal.create",
      request: {
         "provider": "workers-ai",
         "endpoint": "@cf/meta/llama-3.1-8b-instruct",
         "headers": {
            "Authorization": "Bearer WORKERS_AI_TOKEN",
            "Content-Type": "application/json"
         },
         "query": {
            "stream": true,
            "prompt": "tell me a joke"
         }
      }
   }));
});

socket.addEventListener("message", (event) => {
  console.log(event.data);
});

And we will DO it again

In Q1 2025, we plan to support WebSocket-to-WebSocket connections (using DOs), allowing you to connect to OpenAI’s new real-time API directly through our platform. In the meantime, you can deploy this Worker in your account to proxy the requests yourself.

If you have any questions, reach out on our Discord channel. We’re also hiring for AI Gateway, check out Cloudflare Jobs in Lisbon!

What’s new in Cloudflare: Account Owned Tokens and Zaraz Automated Actions

Post Syndicated from Joseph So original https://blog.cloudflare.com/account-owned-tokens-automated-actions-zaraz

In October 2024, we started publishing roundup blog posts to share the latest features and updates from our teams. Today, we are announcing general availability for Account Owned Tokens, which allow organizations to improve access control for their Cloudflare services. Additionally, we are launching Zaraz Automated Actions, which is a new feature designed to streamline event tracking and tool integration when setting up third-party tools. By automating common actions like pageviews, custom events, and e-commerce tracking, it removes the need for manual configurations.

Improving access control for Cloudflare services with Account Owned Tokens

Cloudflare is critical infrastructure for the Internet, and we understand that many of the organizations that build on Cloudflare rely on apps and integrations outside the platform to make their lives easier. In order to allow access to Cloudflare resources, these apps and integrations interact with Cloudflare via our API, enabled by access tokens and API keys. Today, the API Access Tokens and API keys on the Cloudflare platform are owned by individual users, which can lead to some difficulty representing services, and adds an additional dependency on managing users alongside token permissions.

What’s new about Account Owned Tokens

First, a little explanation because the terms can be a little confusing. On Cloudflare, we have both Users and Accounts, and they mean different things, but sometimes look similar. Users are people, and they sign in with an email address. Accounts are not people, they’re the top-level bucket we use to organize all the resources you use on Cloudflare. Accounts can have many users, and that’s how we enable collaboration. If you use Cloudflare for your personal projects, both your User and Account might have your email address as the name, but if you use Cloudflare as a company, the difference is more apparent because your user is “[email protected]” and the account might be “Example Company”. 


Account Owned Tokens are not confined by the permissions of the creating user (e.g. a user can never make a token that can edit a field that they otherwise couldn’t edit themselves) and are scoped to the account they are owned by. This means that instead of creating a token belonging to the user “[email protected]”, you can now create a token belonging to the account “Example Company”.


The ability to make these tokens, owned by the account instead of the user, allows for more flexibility to represent what the access should be used for.

Prior to Account Owned Tokens, customers would have to have a user ([email protected]) create a token to pull a list of Cloudflare zones for their account and ensure their security settings are set correctly as part of a compliance workflow, for example. All of the actions this compliance workflow does are now attributed to joe.smith, and if joe.smith leaves the company and his permissions are revoked, the compliance workflow fails.

With this new release, an Account Owned Token could be created, named “compliance workflow”, with permissions to do this operation independently of [email protected]. All actions this token does are attributable to “compliance workflow”. This token is visible and manageable by all the superadmins on your Cloudflare account. If joe.smith leaves the company, the access remains independent of that user, and all super administrators on the account moving forward can still see, edit, roll, and delete the token as needed.

Any long-running services or programs can be represented by these types of tokens, be made visible (and manageable) by all super administrators in your Cloudflare account, and truly represent the service, instead of the users managing the service. Audit logs moving forward will log that a given token was used, and user access can be kept to a minimum.

Getting started

Account Owned Tokens can be found on the new “API Tokens” tab under the “Manage Account” section of your Cloudflare dashboard, and any Super Administrators on your account have the capability to create, edit, roll, and delete these tokens. The API is the same, but at a new /account/<accountId>/tokens endpoint.


Why/where should I use Account Owned Tokens?

There are a few places we would recommend replacing your User Owned Tokens with Account Owned Tokens:

1. Long-running services that are managed by multiple people: When multiple users all need to manage the same service, Account Owned Tokens can remove the bottleneck of requiring a single person to be responsible for all the edits, rotations, and deletions of the tokens. In addition, this guards against any user lifecycle events affecting the service. If the employee that owns the token for your service leaves the company, the service’s token will no longer be based on their permissions.

2. Cloudflare accounts running any services that need attestable access records beyond user membership: By restricting all of your users from being able to access the API, and consolidating all usable tokens to a single list at the account level, you can ensure that a complete list of all API access can be found in a single place on the dashboard, under “Account API Tokens”.


3. Anywhere you’ve created “Service Users”: “Service Users”, or any identity that is meant to allow multiple people to access Cloudflare, are an active threat surface. They are generally highly privileged, and require additional controls (vaulting, password rotation, monitoring) to ensure non-repudiation and appropriate use. If these operations solely require API access, consolidating that access into an Account Owned Token is safe.

Why/where should I use User Owned Tokens?

There are a few scenarios/situations where you should continue to use User Owned Tokens:

  1. Where programmatic access is done by a single person at an external interface: If a single user has an external interface using their own access privileges at Cloudflare, it still makes sense to use a personal token, so that information access can be traced back to them. (e.g. using a personal token in a data visualization tool that pulls logs from Cloudflare)

  2. User level operations: Any operations that operate on your own user (e.g. email changes, password changes, user preferences) still require a user level token.

  3. Where you want to control resources over multiple accounts with the same credential: As of November 2024, Account Owned Tokens are scoped to a single account. In 2025, we want to ensure that we can create cross-account credentials, anywhere that multiple accounts have to be called in the same set of operations should still rely on API Tokens owned by a user.

  4. Where we currently do not support a given endpoint: We are currently in the process of working through a list of our services to ensure that they all support Account Owned Tokens. When interacting with any of these services that are not supported programmatically, please continue to use User Owned Tokens.

  5. Where you need to do token management programmatically: If you are in an organization that needs to create and delete large numbers of tokens programmatically, please continue to use User Owned Tokens. In late 2024, watch for the “Create Additional Tokens” template on the Account Owned Tokens Page. This template and associated created token will allow for the management of additional tokens.


What does this mean for my existing tokens and programmatic access moving forward?

We do not plan to decommission User Owned Tokens, as they still have a place in our overall access model and are handy for ensuring user-centric workflows can be implemented.

As of November 2024, we’re still working to ensure that ALL of our endpoints work with Account Owned Tokens, and we expect to deliver additional token management improvements continuously, with an expected end date of Q3 2025 to cover all endpoints.

A list of services that support, and do not support, Account Owned Tokens can be found in our documentation.

What’s next?

If Account Owned Tokens could provide value to your or your organization, documentation is available here, and you can give them a try today from the “API Tokens” menu in your dashboard.

Zaraz Automated Actions makes adding tools to your website a breeze


Cloudflare Zaraz is a tool designed to manage and optimize third-party tools like analytics, marketing tags, or social media scripts on websites. By loading these third-party services through Cloudflare’s network, Zaraz improves website performance, security, and privacy. It ensures that these external scripts don’t slow down page loading times or expose sensitive user data, as it handles them efficiently through Cloudflare’s global network, reducing latency and improving the user experience.

Automated Actions are a new product feature that allow users to easily setup page views, custom events, and e-commerce tracking without going through the tedious process of manually setting up triggers and actions.

Why we built Automated Actions

An action in Zaraz is a way to tell a third party tool that a user interaction or event has occurred when certain conditions, defined by triggers, are met. You create actions from within the tools page, associating them with specific tools and triggers.


Setting up a tool in Zaraz has always involved a few steps: configuring a trigger, linking it to a tool action and finally calling zaraz.track(). This process allowed advanced configurations with complex rules, and while it was powerful, it occasionally left users confused — why isn’t calling zaraz.track() enough? We heard your feedback, and we’re excited to introduce Zaraz Automated Actions, a feature designed to make Zaraz easier to use by reducing the amount of work needed to configure a tool.

With Zaraz Automated Actions, you can now automate sending data to your third-party tools without the need to create a manual configuration. Inspired by the simplicity of zaraz.ecommerce(), we’ve extended this ease to all Zaraz events, removing the need for manual trigger and action setup. For example, calling zaraz.track(‘myEvent’) will send your event to the tool without the need to configure any triggers or actions.

Getting started with Automated Actions

When adding a new tool in Zaraz, you’ll now see an additional step where you can choose one of three Automated Actions: pageviews, all other events, or ecommerce. These options allow you to specify what kind of events you want to automate for that tool.


  • Pageviews: Automatically sends data to the tool whenever someone visits a page on your site, without any manual configuration.

  • All other events: Sends all custom events triggered using zaraz.track() to the selected tool, making it easy to automate tracking of user interactions.

  • Ecommerce: Automatically sends all e-commerce events triggered via zaraz.ecommerce() to the tool, streamlining your sales and transaction tracking.

These Automated Actions are also available for all your existing tools, which can be toggled on or off from the tool detail page in your Zaraz dashboard. This flexibility allows you to fine-tune which actions are automated based on your needs.


Custom actions for tools without Automated Action support

Some tools do not support automated actions because the tool itself does not support page view, custom, or e-commerce events. For such tools you can still create your own custom actions, just like before. Custom actions allow you to configure specific events to send data to your tools based on unique triggers. The process remains the same, and you can follow the detailed steps outlined in our Create Actions guide. Remember to set up your trigger first, or choose an existing one, before configuring the action.

Automatically enrich your payload

When creating a custom action, it is now easier to send Event Properties using the Include Event Properties field. When this is toggled on, you can automatically send client-specific data with each action, such as user behavior or interaction details. For example, to send an userID property when sending a click event you can do something like this: zaraz.track(‘click’, { userID: “foo” }).

Additionally, you can enable the Include System Properties option to send system-level information, such as browser, operating system, and more. In your action settings click on “Add Field”, pick the “Include System Properties”, click on confirm and then toggle the field on. 

For a full list of system properties, visit our System Properties reference guide. These options give you greater flexibility and control over the data you send with custom actions.

These two fields replace the now deprecated “Enrich Payload” dropdown field.


Zaraz Automated Actions marks a significant step forward in simplifying how you manage events across your tools. By automating common actions like page views, e-commerce events, and custom tracking, you can save time and reduce the complexity of manual configurations. Whether you’re leveraging Automated Actions for speed or creating custom actions for more tailored use cases, Zaraz offers the flexibility to fit your workflow. 

We’re excited to see how you use this feature. Please don’t hesitate to reach out to us on Cloudflare Zaraz’s Discord Channel — we’re always there fixing issues, listening to feedback, and announcing exciting product updates.

Never miss an update

We’ll continue to share roundup blog posts as we continue to build and innovate. Be sure to follow along on the Cloudflare Blog for the latest news and updates.

Workers Builds: integrated CI/CD built on the Workers platform

Post Syndicated from Serena Shah-Simpson original https://blog.cloudflare.com/workers-builds-integrated-ci-cd-built-on-the-workers-platform

During 2024’s Birthday Week, we launched Workers Builds in open beta — an integrated Continuous Integration and Delivery (CI/CD) workflow you can use to build and deploy everything from full-stack applications built with the most popular frameworks to simple static websites onto the Workers platform. With Workers Builds, you can connect a GitHub or GitLab repository to a Worker, and Cloudflare will automatically build and deploy your changes each time you push a commit.

Workers Builds is intended to bridge the gap between the developer experiences for Workers and Pages, the latter of which launched with an integrated CI/CD system in 2020. As we continue to merge the experiences of Pages and Workers, we wanted to bring one of the best features of Pages to Workers: the ability to tie deployments to existing development workflows in GitHub and GitLab with minimal developer overhead. 

In this post, we’re going to share how we built the Workers Builds system on Cloudflare’s Developer Platform, using Workers, Durable Objects, Hyperdrive, Workers Logs, and Smart Placement.

The design problem

The core problem for Workers Builds is how to pick up a commit from GitHub or GitLab and start a containerized job that can clone the repo, build the project, and deploy a Worker. 


Pages solves a similar problem, and we were initially inclined to expand our existing architecture and tech stack, which includes a centralized configuration plane built on Go in Kubernetes. We also considered the ways in which the Workers ecosystem has evolved in the four years since Pages launched — we have since launched so many more tools built for use cases just like this! 

The distributed nature of Workers offers some advantages over a centralized stack — we can spend less time configuring Kubernetes because Workers automatically handles failover and scaling. Ultimately, we decided to keep using what required no additional work to re-use from Pages (namely, the system for connecting GitHub/GitLab accounts to Cloudflare, and ingesting push events from them), and for the rest build out a new architecture on the Workers platform, with reliability and minimal latency in mind.

The Workers Builds system

We didn’t need to make any changes to the system that handles connections from GitHub/GitLab to Cloudflare and ingesting push events from them. That left us with two systems to build: the configuration plane for users to connect a Worker to a repo, and a build management system to run and monitor builds.

Client Worker 

We can begin with our configuration plane, which consists of a simple Client Worker that implements a RESTful API (using Hono) and connects to a PostgreSQL database. It’s in this database that we store build configurations for our users, and through this Worker that users can view and manage their builds. 

We use a Hyperdrive binding to connect to our database securely over Cloudflare Access (which also manages connection pooling and query caching).

We considered a more distributed data model (like D1, sharded by account), but ultimately decided that keeping our database in a datacenter more easily fit our use-case. The Workers Builds data model is relational — Workers belong to Cloudflare Accounts, and Builds belong to Workers — and build metadata must be consistent in order to properly manage build queues. We chose to keep our failover-ready database in a centralized datacenter and take advantage of two other Workers products, Smart Placement and Hyperdrive, in order to keep the benefits of a distributed control plane. 


Everything that you see in the Cloudflare Dashboard related to Workers Builds is served by this Worker. 

Build Management Worker

The more challenging problem we faced was how to run and manage user builds effectively. We wanted to support the same experience that we had achieved with Pages, which led to these key requirements:

  1. Builds should be initiated with minimal latency.

  2. The status of a build should be tracked and displayed through its entire lifecycle, starting when a user pushes a commit.

  3. Customer build logs should be stored in a secure, private, and long-lived way.

To solve these problems, we leaned heavily into the technology of Durable Objects (DO). 

We created a Build Management Worker with two DO classes: A Scheduler class to manage the scheduling of builds, and a class called BuildBuddy to manage individual builds. We chose to design our system this way for an efficient and scalable system. Since each build is assigned its own build manager DO, its operation won’t ever block other builds or the scheduler, meaning we can start up builds with minimal latency. Below, we dive into each of these Durable Objects classes.


Scheduler DO

The Scheduler DO class is relatively simple. Using Durable Objects Alarms, it is triggered every second to pull up a list of user build configurations that are ready to be started. For each of those builds, the Scheduler creates an instance of our other DO Class, the Build Buddy. 

import { DurableObject } from 'cloudflare:workers'


export class BuildScheduler extends DurableObject {
   state: DurableObjectState
   env: Bindings


   constructor(ctx: DurableObjectState, env: Bindings) {
       super(ctx, env)
   }
   
   // The DO alarm handler will be called every second to fetch builds
   async alarm(): Promise<void> {
// set alarm to run again in 1 second
       await this.updateAlarm()


       const builds = await this.getBuildsToSchedule()
       await this.scheduleBuilds(builds)
   }


   async scheduleBuilds(builds: Builds[]): Promise<void> {
       // Don't schedule builds, if no builds to schedule
       if (builds.length === 0) return


       const queue = new PQueue({ concurrency: 6 })
       // Begin running builds
       builds.forEach((build) =>
           queue.add(async () => {
       	  // The BuildBuddy is another DO described more in the next section! 
               const bb = getBuildBuddy(this.env, build.build_id)
               await bb.startBuild(build)
           })
       )


       await queue.onIdle()
   }


   async getBuildsToSchedule(): Promise<Builds[]> {
       // returns list of builds to schedule
   }


   async updateAlarm(): Promise<void> {
// We want to ensure we aren't running multiple alarms at once, so we only set the next alarm if there isn’t already one set. 
       const existingAlarm = await this.ctx.storage.getAlarm()
       if (existingAlarm === null) {
           this.ctx.storage.setAlarm(Date.now() + 1000)
       }
   }
}

Build Buddy DO

The Build Buddy DO class is what we use to manage each individual build from the time it begins initializing to when it is stopped. Every build has a buddy for life!

Upon creation of a Build Buddy DO instance, the Scheduler immediately calls startBuild() on the instance. The startBuild() method is responsible for fetching all metadata and secrets needed to run a build, and then kicking off a build on Cloudflare’s container platform (not public yet, but coming soon!). 

As the containerized build runs, it reports back to the Build Buddy, sending status updates and logs for the Build Buddy to deal with. 

Build status

As a build progresses, it reports its own status back to Build Buddy, sending updates when it has finished initializing, has completed successfully, or been terminated by the user. The Build Buddy is responsible for handling this incoming information from the containerized build, writing status updates to the database (via a Hyperdrive binding) so that users can see the status of their build in the Cloudflare dashboard.

Build logs

A running build generates output logs that are important to store and surface to the user. The containerized build flushes these logs to the Build Buddy every second, which, in turn, stores those logs in DO storage

The decision to use Durable Object storage here makes it easy to multicast logs to multiple clients efficiently, and allows us to use the same API for both streaming logs and viewing historical logs. 

// build-management-app.ts

// We created a Hono app to for use by our Client Worker API
const app = new Hono<HonoContext>()
   .post(
       '/api/builds/:build_uuid/status',
       async (c) => {
           const buildStatus = await c.req.json()


           // fetch build metadata
           const build = ...


           const bb = getBuildBuddy(c.env, build.build_id)
           return await bb.handleStatusUpdate(build, statusUpdate)
       }
   )
   .post(
       '/api/builds/:build_uuid/logs',
       async (c) => {
           const logs = await c.req.json()
     // fetch build metadata
           const build = ...


           const bb = getBuildBuddy(c.env, build.build_id)
           return await bb.addLogLines(logs.lines)
       }
   )


export default {
   fetch: app.fetch
}

// build-buddy.ts

import { DurableObject } from 'cloudflare:workers'


export class BuildBuddy extends DurableObject {
   compute: WorkersBuildsCompute


   constructor(ctx: DurableObjectState, env: Bindings) {
       super(ctx, env)
       this.compute = new ComputeClient({
           // ...
       })
   }


   // The Scheduler DO calls startBuild upon creating a BuildBuddy instance
   startBuild(build: Build): void {
       this.startBuildAsync(build)         
   }


   async startBuildAsync(build: Build): Promise<void> {
       // fetch all necessary metadata build, including
	// environment variables, secrets, build tokens, repo credentials, 
// build image URI, etc
	// ...


	// start a containerized build
       const computeBuild = await this.compute.createBuild({
           // ...
       })
   }


   // The Build Management worker calls handleStatusUpdate when it receives an update
   // from the containerized build
   async handleStatusUpdate(
       build: Build,
       buildStatusUpdatePayload: Payload
   ): Promise<void> {
// Write status updates to the database
   }


   // The Build Management worker calls addLogLines when it receives flushed logs
   // from the containerized build
   async addLogLines(logs: LogLines): Promise<void> {
       // Generate nextLogsKey to store logs under      
       this.ctx.storage.put(nextLogsKey, logs)
   }


   // The Client Worker can call methods on a Build Buddy via RPC, using a service binding to the Build Management Worker.
   // The getLogs method retrieves logs for the user, and the cancelBuild method forwards a request from the user to terminate a build. 
   async getLogs(cursor: string){
       const decodedCursor = cursor !== undefined ? decodeLogsCursor(cursor) : undefined
       return await this.getLogs(decodedCursor)
   }


   async cancelBuild(compute_id: string, build_id: string): void{
      await this.terminateBuild(build_id, compute_id)
   }


   async terminateBuild(build_id: number, compute_id: string): Promise<void> {
       await this.compute.stopBuild(compute_id)
   }
}


   export function getBuildBuddy(
   env: Pick<Bindings, 'BUILD_BUDDY'>,
   build_id: number
): DurableObjectStub<BuildBuddy> {
   const id = env.BUILD_BUDDY.idFromName(build_id.toString())
   return env.BUILD_BUDDY.get(id)
}
Alarms

We utilize alarms in the Build Buddy to check that a build has a healthy startup and to terminate any builds that run longer than 20 minutes. 

How else have we leveraged the Developer Platform?

Now that we’ve gone over the core behavior of the Workers Builds control plane, we’d like to detail a few other features of the Workers platform that we use to improve performance, monitor system health, and troubleshoot customer issues.

Smart Placement and location hints

While our control plane is distributed in the sense that it can be run across multiple datacenters, to reduce latency costs, we want most requests to be served from locations close to our primary database in the western US.

While a build is running, Build Buddy, a Durable Object, is continuously writing status updates to our database. For the Client and the Build Management API Workers, we enabled Smart Placement with location hints to ensure requests run close to the database.


This graph shows the reduction in round trip time (RTT) observed for our Worker with Smart Placement turned on. 

Workers Logs

We needed a logging tool that allows us to aggregate and search across persistent operational logs from our Workers to assist with identifying and troubleshooting issues. We worked with the Workers Observability team to become early adopters of Workers Logs.

Workers Logs worked out of the box, giving us fast and easy to use logs directly within the Cloudflare dashboard. To improve our ability to search logs, we created a tagging library that allows us to easily add metadata like the git tag of the deployed worker that the log comes from, allowing us to filter logs by release.

See a shortened example below for how we handle and log errors on the Client Worker. 

// client-worker-app.ts

// The Client Worker is a RESTful API built with Hono
const app = new Hono<HonoContext>()
   // This is from the workers-tagged-logger library - first we register the logger
   .use(useWorkersLogger('client-worker-app'))
   // If any error happens during execution, this middleware will ensure we log the error
   .onError(useOnError)
   // routes
   .get(
       '/apiv4/builds',
       async (c) => {
           const { ids } = c.req.query()
           return await getBuildsByIds(c, ids)
       }
   )


function useOnError(e: Error, c: Context<HonoContext>): Response {
   // Set the project identifier n the error
   logger.setTags({ release: c.env.GIT_TAG })
 
   // Write a log at level 'error'. Can also log 'info', 'log', 'warn', and 'debug'
   logger.error(e)
   return c.json(internal_error.toJSON(), internal_error.statusCode)
}

This setup can lead to the following sample log message from our Workers Log dashboard. You can see the release tag is set on the log.


We can get a better sense of the impact of the error by adding filters to the Workers Logs view, as shown below. We are able to filter on any of the fields since we’re logging with structured JSON.  


R2

Coming soon to Workers Builds is build caching, used to store artifacts of a build for subsequent builds to reuse, such as package dependencies and build outputs. Build caching can speed up customer builds by avoiding the need to redownload dependencies from NPM or to rebuild projects from scratch. The cache itself will be backed by R2 storage. 

Testing

We were able to build up a great testing story using Vitest and workerd — unit tests, cross-worker integration tests, the works. In the example below, we make use of the runInDurableObject stub from cloudflare:test to test instance methods on the Scheduler DO directly.

// scheduler.spec.ts

import { env, runInDurableObject } from 'cloudflare:test'
import { expect, test } from 'vitest'
import { BuildScheduler } from './scheduler'


test('getBuildsToSchedule() runs a queued build', async () => {
   // Our test harness creates a single build for our scheduler to pick up
   const { build } = await harness.createBuild()


   // We create a scheduler DO instance
   const id = env.BUILD_SCHEDULER.idFromName(crypto.randomUUID())
   const stub = env.BUILD_SCHEDULER.get(id)
   await runInDurableObject(stub, async (instance: BuildScheduler) => {
       expect(instance).toBeInstanceOf(BuildScheduler)


// We check that the scheduler picks up 1 build
       const builds = await instance.getBuildsToSchedule()
       expect(builds.length).toBe(1)
	
// We start the build, which should mark it as running
       await instance.scheduleBuilds(builds)
   })


   // Check that there are no more builds to schedule
   const queuedBuilds = ...
   expect(queuedBuilds.length).toBe(0)
})

We use SELF.fetch() from cloudflare:test to run integration tests on our Client Worker, as shown below. This integration test covers our Hono endpoint and database queries made by the Client Worker in retrieving the metadata of a build.

// builds_api.test.ts

import { env, SELF } from 'cloudflare:test'
   
it('correctly selects a single build', async () => {
   // Our test harness creates a randomized build to test with
   const { build } = await harness.createBuild()


   // We send a request to the Client Worker itself to fetch the build metadata
   const getBuild = await SELF.fetch(
       `https://example.com/builds/${build1.build_uuid}`,
       {
           method: 'GET',
           headers: new Headers({
               Authorization: `Bearer JWT`,
               'content-type': 'application/json',
           }),
       }
   )


   // We expect to receive a 200 response from our request and for the 
   // build metadata returned to match that of the random build that we created
   expect(getBuild.status).toBe(200)
   const getBuildV4Resp = await getBuild.json()
   const buildResp = getBuildV4Resp.result
   expect(buildResp).toBeTruthy()
   expect(buildResp).toEqual(build)
})

These tests run on the same runtime that Workers run on in production, meaning we have greater confidence that any code changes will behave as expected when they go live. 

Analytics

We use the technology underlying the Workers Analytics Engine to collect all of the metrics for our system. We set up Grafana dashboards to display these metrics. 

JavaScript-native RPC

JavaScript-native RPC was added to Workers in April of 2024, and it’s pretty magical. In the scheduler code example above, we call startBuild() on the BuildBuddy DO from the Scheduler DO. Without RPC, we would need to stand up routes on the BuildBuddy fetch() handler for the Scheduler to trigger with a fetch request. With RPC, there is almost no boilerplate — all we need to do is call a method on a class. 

const bb = getBuildBuddy(this.env, build.build_id)


// Starting a build without RPC 😢
await bb.fetch('http://do/api/start_build', {
    method: 'POST',
    body: JSON.stringify(build),
})


// Starting a build with RPC 😸
await bb.startBuild(build)

Conclusion

By using Workers and Durable Objects, we were able to build a complex and distributed system that is easy to understand and is easily scalable. 

It’s been a blast for our team to build on top of the very platform that we work on, something that would have been much harder to achieve on Workers just a few years ago. We believe in being Customer Zero for our own products — to identify pain points firsthand and to continuously improve the developer experience by applying them to our own use cases. It was fulfilling to have our needs as developers met by other teams and then see those tools quickly become available to the rest of the world — we were collaborators and internal testers for Workers Logs and private network support for Hyperdrive (both released on Birthday Week), and the soon to be released container platform.

Opportunities to build complex applications on the Developer Platform have increased in recent years as the platform has matured and expanded product offerings for more use cases. We hope that Workers Builds will be yet another tool in the Workers toolbox that enables developers to spend less time thinking about configuration and more time writing code. 

Want to try it out? Check out the docs to learn more about how to deploy your first project with Workers Builds.

Durable Objects aren’t just durable, they’re fast: a 10x speedup for Cloudflare Queues

Post Syndicated from Josh Wheeler original https://blog.cloudflare.com/how-we-built-cloudflare-queues

Cloudflare Queues let a developer decouple their Workers into event-driven services. Producer Workers write events to a Queue, and consumer Workers are invoked to take actions on the events. For example, you can use a Queue to decouple an e-commerce website from a service which sends purchase confirmation emails to users. During 2024’s Birthday Week, we announced that Cloudflare Queues is now Generally Available, with significant performance improvements that enable larger workloads. To accomplish this, we switched to a new architecture for Queues that enabled the following improvements:

  • Median latency for sending messages has dropped from ~200ms to ~60ms

  • Maximum throughput for each Queue has increased over 10x, from 400 to 5000 messages per second

  • Maximum Consumer concurrency for each Queue has increased from 20 to 250 concurrent invocations


Median latency drops from ~200ms to ~60ms as Queues are migrated to the new architecture

In this blog post, we’ll share details about how we built Queues using Durable Objects and the Cloudflare Developer Platform, and how we migrated from an initial Beta architecture to a geographically-distributed, horizontally-scalable architecture for General Availability.

v1 Beta architecture

When initially designing Cloudflare Queues, we decided to build something simple that we could get into users’ hands quickly. First, we considered leveraging an off-the-shelf messaging system such as Kafka or Pulsar. However, we decided that it would be too challenging to operate these systems at scale with the large number of isolated tenants that we wanted to support.

Instead of investing in new infrastructure, we decided to build on top of one of Cloudflare’s existing developer platform building blocks: Durable Objects. Durable Objects are a simple, yet powerful building block for coordination and storage in a distributed system. In our initial v1 architecture, each Queue was implemented using a single Durable Object. As shown below, clients would send messages to a Worker running in their region, which would be forwarded to the single Durable Object hosted in the WNAM (Western North America) region. We used a single Durable Object for simplicity, and hosted it in WNAM for proximity to our centralized configuration API service.


One of a Queue’s main responsibilities is to accept and store incoming messages. Sending a message to a v1 Queue used the following flow:

  • A client sends a POST request containing the message body to the Queues API at /accounts/:accountID/queues/:queueID/messages

  • The request is handled by an instance of the Queue Broker Worker in a Cloudflare data center running near the client.

  • The Worker performs authentication, and then uses Durable Objects idFromName API to route the request to the Queue Durable Object for the given queueID

  • The Queue Durable Object persists the message to storage before returning a success back to the client.

Durable Objects handled most of the heavy-lifting here: we did not need to set up any new servers, storage, or service discovery infrastructure. To route requests, we simply provided a queueID and the platform handled the rest. To store messages, we used the Durable Object storage API to put each message, and the platform handled reliably storing the data redundantly.

Consuming messages

The other main responsibility of a Queue is to deliver messages to a Consumer. Delivering messages in a v1 Queue used the following process:

  • Each Queue Durable Object maintained an alarm that was always set when there were undelivered messages in storage. The alarm guaranteed that the Durable Object would reliably wake up to deliver any messages in storage, even in the presence of failures. The alarm time was configured to fire after the user’s selected max wait time, if only a partial batch of messages was available. Whenever one or more full batches were available in storage, the alarm was scheduled to fire immediately.

  • The alarm would wake the Durable Object, which continually looked for batches of messages in storage to deliver.

  • Each batch of messages was sent to a “Dispatcher Worker” that used Workers for Platforms dynamic dispatch to pass the messages to the queue() function defined in a user’s Consumer Worker


This v1 architecture let us flesh out the initial version of the Queues Beta product and onboard users quickly. Using Durable Objects allowed us to focus on building application logic, instead of complex low-level systems challenges such as global routing and guaranteed durability for storage. Using a separate Durable Object for each Queue allowed us to host an essentially unlimited number of Queues, and provided isolation between them.

However, using only one Durable Object per queue had some significant limitations:

  • Latency: we created all of our v1 Queue Durable Objects in Western North America. Messages sent from distant regions incurred significant latency when traversing the globe.

  • Throughput: A single Durable Object is not scalable: it is single-threaded and has a fixed capacity for how many requests per second it can process. This is where the previous 400 messages per second limit came from.

  • Consumer Concurrency: Due to concurrent subrequest limits, a single Durable Object was limited in how many concurrent subrequests it could make to our Dispatcher Worker. This limited the number of queue() handler invocations that it could run simultaneously.

To solve these issues, we created a new v2 architecture that horizontally scales across multiple Durable Objects to implement each single high-performance Queue.

v2 Architecture

In the new v2 architecture for Queues, each Queue is implemented using multiple Durable Objects, instead of just one. Instead of a single region, we place Storage Shard Durable Objects in all available regions to enable lower latency. Within each region, we create multiple Storage Shards and load balance incoming requests amongst them. Just like that, we’ve multiplied message throughput.


Sending a message to a v2 Queue uses the following flow:

  • A client sends a POST request containing the message body to the Queues API at /accounts/:accountID/queues/:queueID/messages

  • The request is handled by an instance of the Queue Broker Worker running in a Cloudflare data center near the client.

  • The Worker:

    • Performs authentication

    • Reads from Workers KV to obtain a Shard Map that lists available storage shards for the given region and queueID

    • Picks one of the region’s Storage Shards at random, and uses Durable Objects idFromName API to route the request to the chosen shard

  • The Storage Shard persists the message to storage before returning a success back to the client.

In this v2 architecture, messages are stored in the closest available Durable Object storage cluster near the user, greatly reducing latency since messages don’t need to be shipped all the way to WNAM. Using multiple shards within each region removes the bottleneck of a single Durable Object, and allows us to scale each Queue horizontally to accept even more messages per second. Workers KV acts as a fast metadata store: our Worker can quickly look up the shard map to perform load balancing across shards.

To improve the Consumer side of v2 Queues, we used a similar “scale out” approach. A single Durable Object can only perform a limited number of concurrent subrequests. In v1 Queues, this limited the number of concurrent subrequests we could make to our Dispatcher Worker. To work around this, we created a new Consumer Shard Durable Object class that we can scale horizontally, enabling us to execute many more concurrent instances of our users’ queue() handlers.


Consumer Durable Objects in v2 Queues use the following approach:

  • Each Consumer maintains an alarm that guarantees it will wake up to process any pending messages. v2 Consumers are notified by the Queue’s Coordinator (introduced below) when there are messages ready for consumption. Upon notification, the Consumer sets an alarm to go off immediately.

  • The Consumer looks at the shard map, which contains information about the storage shards that exist for the Queue, including the number of available messages on each shard.

  • The Consumer picks a random storage shard with available messages, and asks for a batch.

  • The Consumer sends the batch to the Dispatcher Worker, just like for v1 Queues.

  • After processing the messages, the Consumer sends another request to the Storage Shard to either “acknowledge” or “retry” the messages.

This scale-out approach enabled us to work around the subrequest limits of a single Durable Object, and increase the maximum supported concurrency level of a Queue from 20 to 250. 

The Coordinator and “Control Plane”

So far, we have primarily discussed the “Data Plane” of a v2 Queue: how messages are load balanced amongst Storage Shards, and how Consumer Shards read and deliver messages. The other main piece of a v2 Queue is the “Control Plane”, which handles creating and managing all the individual Durable Objects in the system. In our v2 architecture, each Queue has a single Coordinator Durable Object that acts as the brain of the Queue. Requests to create a Queue, or change its settings, are sent to the Queue’s Coordinator.


The Coordinator maintains a Shard Map for the Queue, which includes metadata about all the Durable Objects in the Queue (including their region, number of available messages, current estimated load, etc.). The Coordinator periodically writes a fresh copy of the Shard Map into Workers KV, as pictured in step 1 of the diagram. Placing the shard map into Workers KV ensures that it is globally cached and available for our Worker to read quickly, so that it can pick a shard to accept the message.

Every shard in the system periodically sends a heartbeat to the Coordinator as shown in steps 2 and 3 of the diagram. Both Storage Shards and Consumer Shards send heartbeats, including information like the number of messages stored locally, and the current load (requests per second) that the shard is handling. The Coordinator uses this information to perform autoscaling. When it detects that the shards in a particular region are overloaded, it creates additional shards in the region, and adds them to the shard map in Workers KV. Our Worker sees the updated shard map and naturally load balances messages across the freshly added shards. Similarly, the Coordinator looks at the backlog of available messages in the Queue, and decides to add more Consumer shards to increase Consumer throughput when the backlog is growing. Consumer Shards pull messages from Storage Shards for processing as shown in step 4 of the diagram.

Switching to a new scalable architecture allowed us to meet our performance goals and take Queues to GA. As a recap, this new architecture delivered these significant improvements:

  • P50 latency for writing to a Queue has dropped from ~200ms to ~60ms.

  • Maximum throughput for a Queue has increased from 400 to 5000 messages per second.

  • Maximum consumer concurrency has increased from 20 to 250 invocations.

What’s next for Queues

  • We plan on leveraging the performance improvements in the new beta version of Durable Objects which use SQLite to continue to improve throughput/latency in Queues.

  • We will soon be adding message management features to Queues so that you can take actions to purge messages in a queue, pause consumption of messages, or “redrive”/move messages from one queue to another (for example messages that have been sent to a Dead Letter Queue could be “redriven” or moved back to the original queue).

  • Work to make Queues the “event hub” for the Cloudflare Developer Platform:

    • Create a low-friction way for events emitted from other Cloudflare services with event schemas to be sent to Queues.

    • Build multi-Consumer support for Queues so that Queues are no longer limited to one Consumer per queue.

To start using Queues, head over to our Getting Started guide. 

Do distributed systems like Cloudflare Queues and Durable Objects interest you? Would you like to help build them at Cloudflare? We’re Hiring!

Billions and billions (of logs): scaling AI Gateway with the Cloudflare Developer Platform

Post Syndicated from Catarina Pires Mota original https://blog.cloudflare.com/billions-and-billions-of-logs-scaling-ai-gateway-with-the-cloudflare

With the rapid advancements occurring in the AI space, developers face significant challenges in keeping up with the ever-changing landscape. New models and providers are continuously emerging, and understandably, developers want to experiment and test these options to find the best fit for their use cases. This creates the need for a streamlined approach to managing multiple models and providers, as well as a centralized platform to efficiently monitor usage, implement controls, and gather data for optimization.

AI Gateway is specifically designed to address these pain points. Since its launch in September 2023, AI Gateway has empowered developers and organizations by successfully proxying over 2 billion requests in just one year, as we highlighted during September’s Birthday Week. With AI Gateway, developers can easily store, analyze, and optimize their AI inference requests and responses in real time.

With our initial architecture, AI Gateway faced a significant challenge: the logs, those critical trails of data interactions between applications and AI models, could only be retained for 30 minutes. This limitation was not just a minor inconvenience; it posed a substantial barrier for developers and businesses needing to analyze long-term patterns, ensure compliance, or simply debug over more extended periods.

In this post, we’ll explore the technical challenges and strategic decisions behind extending our log storage capabilities from 30 minutes to being able to store billions of logs indefinitely. We’ll discuss the challenges of scale, the intricacies of data management, and how we’ve engineered a system that not only meets the demands of today, but is also scalable for the future of AI development.

Background

AI Gateway is built on Cloudflare Workers, a serverless platform that runs on the Cloudflare network, allowing developers to write small JavaScript functions that can execute at the point of need, near the user, on Cloudflare’s vast network of data centers, without worrying about platform scalability.


Our customers use multiple providers and models and are always looking to optimize the way they do inference. And, of course, in order to evaluate their prompts, performance, cost, and to troubleshoot what’s going on, AI Gateway’s customers need to store requests and responses. New requests show up within 15 seconds and customers can check a request’s cost, duration, number of tokens, and provide their feedback (thumbs up or down).


This scales in a way where an account can have multiple gateways and each gateway has its own settings. In our first implementation, a backend worker was responsible for storing Real Time Logs and other background tasks. However, in the rapidly evolving domain of artificial intelligence, where real-time data is as precious as the insights it provides, managing log data efficiently becomes paramount. We recognized that to truly empower our users, we needed to offer a solution where logs weren’t just transient records but could be stored permanently. Permanent log storage means developers can now track the performance, security, and operational insights of their AI applications over time, enabling not only immediate troubleshooting but also longitudinal studies of AI behavior, usage trends, and system health.


The diagram above describes our old architecture, which could only store 30 minutes of data.

Tracing the path of a request through the AI Gateway, as depicted in the sequence above:

  1. A developer sends a new inference request, which is first received by our Gateway Worker.

  2. The Gateway Worker then performs several checks: it looks for cached results, enforces rate limits, and verifies any other configurations set by the user for their gateway. Provided all conditions are met, it forwards the request to the selected inference provider (in this diagram, OpenAI).

  3. The inference provider processes the request and sends back the response.

  4. Simultaneously, as the response is relayed back to the developer, the request and response details are also dispatched to our Backend Worker. This worker’s role is to manage and store the log of this transaction.

The challenge: Store two billion logs

First step: real-time logs

Initially, the AI Gateway project stored both request metadata and the actual request bodies in a D1 database. This approach facilitated rapid development in the project’s infancy. However, as customer engagement grew, the D1 database began to fill at an accelerating rate, eventually retaining logs for only 30 minutes at a time.

To mitigate this, we first optimized the database schema, which extended the log retention to one hour. However, we soon encountered diminishing returns due to the sheer volume of byte data from the request bodies. Post-launch, it became clear that a more scalable solution was necessary. We decided to migrate the request bodies to R2 storage, significantly alleviating the data load on D1. This adjustment allowed us to incrementally extend log retention to 24 hours.

Consequently, D1 functioned primarily as a log index, enabling users to search and filter logs efficiently. When users needed to view details or download a log, these actions were seamlessly proxied through to R2.

This dual-system approach provided us with the breathing room to contemplate and develop more sophisticated storage solutions for the future.

Second step: persistent logs and Durable Object transactional storage

As our traffic surged, we encountered a growing number of requests from customers wanting to access and compare older logs.

Upon learning that the Durable Objects team was seeking beta testers for their new Durable Objects with SQLite, we eagerly signed up.

Originally, we considered Durable Objects as the ideal solution for expanding our log storage capacity, which required us to shard the logs by a unique string. Initially, this string was the account ID, but during a mid-development load test, we hit a cap at 10 million logs per Durable Object. This limitation meant that each account could only support up to this number of logs.

Given our commitment to the DO migration, we saw an opportunity rather than a constraint. To overcome the 10 million log limit per account, we refined our approach to shard by both account ID and gateway name. This adjustment effectively raised the storage ceiling from 10 million logs per account to 10 million per gateway. With the default setting allowing each account up to 10 gateways, the potential storage for each account skyrocketed to 100 million logs.

This strategic pivot not only enabled us to store a significantly larger number of logs. But also enhanced our flexibility in gateway management. Now, when a gateway is deleted, we can simply remove the corresponding Durable Object.

Additionally, this sharding method isolates high-volume request scenarios. If one customer’s heavy usage slows down log insertion, it only impacts their specific Durable Object, thereby preserving performance for other customers.


Taking a glance at the revised architecture diagram, we replaced the Backend Worker with our newly integrated Durable Object. The rest of the request flow remains unchanged, including the concurrent response to the user and the interaction with the Durable Object, which occurs in the fourth step.

Leveraging Cloudflare’s network, our Gateway Worker operates near the user’s location, which in turn positions the user’s Durable Object close by. This proximity significantly enhances the speed of log insertion and query operations.

Third step: managing thousands of Durable Objects

As the number of users and requests on AI Gateway grows, managing each unique Durable Object (DO) becomes increasingly complex. New customers join continuously, and we needed an efficient method to track each DO, ensure users stay within their 10 gateway limit, and manage the storage capacity for free users.

To address these challenges, we introduced another layer of control with a new Durable Object we’ve named the Account Manager. The primary function of the Account Manager is straightforward yet crucial: it keeps user activities in check.

Here’s how it works: before any Gateway commits a new log to permanent storage, it consults the Account Manager. This check determines whether the gateway is allowed to insert the log based on the user’s current usage and entitlements. The Account Manager uses its own SQLite database to verify the total number of rows a user has and their service level. If all checks pass, it signals the Gateway that the log can be inserted. It was paramount to guarantee that this entire validation process occurred in the background, ensuring that the user experience remains seamless and uninterrupted.

The Account Manager stays updated by periodically receiving data from each Gateway’s Durable Object. Specifically, after every 1000 inference requests, the Gateway sends an update on its total rows to the Account Manager, which then updates its local records. This system ensures that the Account Manager has the most current data when making its decisions.

Additionally, the Account Manager is responsible for monitoring customer entitlements. It tracks whether an account is on a free or paid plan, how many gateways a user is permitted to create, and the log storage capacity allocated to each gateway. 

Through these mechanisms, the Account Manager not only helps in maintaining system integrity but also ensures fair usage across all users of AI Gateway.

AI evaluations and Durable Objects sharding

As we continue to develop evaluations to fully automatic and, in the future, use Large Language Models (LLMs),  we are now taking the first step towards this goal and launching the open beta phase of comprehensive AI evaluations, centered on Human-in-the-Loop feedback.

This feature empowers users to create bespoke datasets from their application logs, thereby enabling them to score and evaluate the performance, speed, and cost-effectiveness of their models, with a primary focus on LLMs and automated scoring, analyzing the performance of LLMs, providing developers with objective, data-driven insights to refine their models.

To do this, developers require a reliable logging mechanism that persists logs from multiple gateways, storing up to 100 million logs in total (10 million logs per gateway, across 10 gateways). This represents a significant volume of data, as each request made through the AI Gateway generates a log entry, with some log entries potentially exceeding 50 MB in size.

This necessity leads us to work on the expansion of log storage capabilities. Since log storage is limited to 10 million logs per gateway, in future iterations, we aim to scale this capacity by implementing sharded Durable Objects (DO), allowing multiple Durable Objects per gateway to handle and store logs. This scaling strategy will enable us to store significantly larger volumes of logs, providing richer data for evaluations (using LLMs as a judge or from user input), all through AI Gateway.


Coming Soon

We are working on improving our existing Universal Endpoint, the next step on an enhanced solution that builds on existing fallback mechanisms to offer greater resilience, flexibility, and intelligence in request management.

Currently, when a provider encounters an error or is unavailable, our system falls back to an alternative provider to ensure continuity. The improved Universal Endpoint takes this a step further by introducing automatic retry capabilities, allowing failed requests to be reattempted before fallback is triggered. This significantly improves reliability by handling transient errors and increasing the likelihood of successful request fulfillment. It will look something like this:

curl --location 'https://aig.example.com/' \
--header 'CF-AIG-TOKEN: Bearer XXXX' \
--header 'Content-Type: application/json' \
--data-raw '[
    {
        "id": "0001",
        "provider": "openai",
        "endpoint": "chat/completions",
        "headers": {
            "Authorization": "Bearer XXXX",
            "Content-Type": "application/json"
        },
        "query": {
            "model": "gpt-3.5-turbo",
            "messages": [
                {
                    "role": "user",
                    "content": "generate a prompt to create cloudflare random images"
                }
            ]
        },
        "option": {
            "retry": 2,
            "delay": 200,
            "onComplete": {
                "provider": "workers-ai",
                "endpoint": "@cf/stabilityai/stable-diffusion-xl-base-1.0",
                "headers": {
                    "Authorization": "Bearer A5UFQkHewHF1-sA3hTVQFaPxRuu5wmS0eJcCS_MC",
                    "Content-Type": "application/json"
                },
                "query": {
                    "messages": [
                        {
                            "role": "user",
                            "content": "<prompt-response id='\''0001'\'' />"
                        }
                    ]
                }
            }
        }
    },
    {
        "provider": "workers-ai",
        "endpoint": "@cf/stabilityai/stable-diffusion-xl-base-1.0",
        "headers": {
            "Authorization": "Bearer XXXXXX",
            "Content-Type": "application/json"
        },
        "query": {
            "messages": [
                {
                    "role": "user",
                    "content": "create a image of a missing cat"
                }
            ]
        }
    }
]'

The request to the improved Universal Endpoint system demonstrates how it handles multiple providers with integrated retry mechanisms and fallback logic. In this example, the first request is sent to a provider like OpenAI, asking it to generate a text-to-image prompt. The “retry” option ensures that transient issues don’t result in immediate failure.

The system’s ability to seamlessly switch between providers while applying retry strategies ensures higher reliability and robustness in managing requests. By leveraging fallback logic, the Improved Universal Endpoint can dynamically adapt to provider failures, ensuring that tasks are completed successfully even in complex, multi-step workflows.

In addition to retry logic, we will have the ability to inspect requests and responses and make dynamic decisions based on the content of the result. This enables developers to create conditional workflows where the system can adapt its behavior depending on the nature of the response, creating a highly flexible and intelligent decision-making process.

If you haven’t yet used AI Gateway, check out our developer documentation on how to get started. If you have any questions, reach out on our Discord channel.

Improving platform resilience at Cloudflare through automation

Post Syndicated from Opeyemi Onikute original https://blog.cloudflare.com/improving-platform-resilience-at-cloudflare

Failure is an expected state in production systems, and no predictable failure of either software or hardware components should result in a negative experience for users. The exact failure mode may vary, but certain remediation steps must be taken after detection. A common example is when an error occurs on a server, rendering it unfit for production workloads, and requiring action to recover.

When operating at Cloudflare’s scale, it is important to ensure that our platform is able to recover from faults seamlessly. It can be tempting to rely on the expertise of world-class engineers to remediate these faults, but this would be manual, repetitive, unlikely to produce enduring value, and not scaling. In one word: toil; not a viable solution at our scale and rate of growth.

In this post we discuss how we built the foundations to enable a more scalable future, and what problems it has immediately allowed us to solve.

Growing pains

The Cloudflare Site Reliability Engineering (SRE) team builds and manages the platform that helps product teams deliver our extensive suite of offerings to customers. One important component of this platform is the collection of servers that power critical products such as Durable Objects, Workers, and DDoS mitigation. We also build and maintain foundational software services that power our product offerings, such as configuration management, provisioning, and IP address allocation systems.

As part of tactical operations work, we are often required to respond to failures in any of these components to minimize impact to users. Impact can vary from lack of access to a specific product feature, to total unavailability. The level of response required is determined by the priority, which is usually a reflection of the severity of impact on users. Lower-priority failures are more common — a server may run too hot, or experience an unrecoverable hardware error. Higher-priority failures are rare and are typically resolved via a well-defined incident response process, requiring collaboration with multiple other teams.

The commonality of lower-priority failures makes it obvious when the response required, as defined in runbooks, is “toilsome”. To reduce this toil, we had previously implemented a plethora of solutions to automate runbook actions such as manually-invoked shell scripts, cron jobs, and ad-hoc software services. These had grown organically over time and provided solutions on a case-by-case basis, which led to duplication of work, tight coupling, and lack of context awareness across the solutions.

We also care about how long it takes to resolve any potential impact on users. A resolution process which involves the manual invocation of a script relies on human action, increasing the Mean-Time-To-Resolve (MTTR) and leaving room for human error. This risks increasing the amount of errors we serve to users and degrading trust.

These problems proved that we needed a way to automatically heal these platform components. This especially applies to our servers, for which failure can cause impact across multiple product offerings. While we have mechanisms to automatically steer traffic away from these degraded servers, in some rare cases the breakage is sudden enough to be visible.

Solving the problem

To provide a more reliable platform, we needed a new component that provides a common ground for remediation efforts. This would remove duplication of work, provide unified context-awareness and increase development speed, which ultimately saves hours of engineering time and effort.

A good solution would not allow only the SRE team to auto-remediate, it would empower the entire company. The key to adding self-healing capability was a generic interface for all teams to self-service and quickly remediate failures at various levels: machine, service, network, or dependencies.

A good way to think about auto-remediation is in terms of workflows. A workflow is a sequence of steps to get to a desired outcome. This is not dissimilar to a manual shell script which executes what a human would otherwise do via runbook instructions. Because of this logical fit with workflows, we decided to adopt Temporal

Temporal is a durable execution platform which is useful to gracefully manage infrastructure failures such as network outages and transient failures in external service endpoints. This capability meant we only needed to build a way to schedule “workflow” tasks and have Temporal provide reliability guarantees. This allowed us to focus on building out the orchestration system to support the control and flow of workflow execution in our data centers. 

How does Temporal work?


Before we discuss the system that provides our self-healing functions, let’s explore how the workflow execution engine works, as its native architecture provided numerous benefits that we took advantage of to build a more robust foundation.

The most attractive feature Temporal offered us was the ability to write code that has reliability baked in. Some examples of these primitives are automatic retries, timeouts, rollbacks, and queueing. The Temporal Platform consists of the Temporal Cluster and Worker processes (application code that contains your custom logic).

This architecture allowed us to write our application logic as we normally would, with the added benefits of Temporal. Since Temporal Workers are external to the cluster, we can run tasks anywhere across our global network — a feature that made it easy to build an extensible, easy-to-understand framework for automating tasks.

In Temporal terms, control is provided by the basic principles used to provide workflow execution — Workflows and Activities. A Workflow is simply a sequence of Activities, which are functions that ideally do only ONE task, such as making a request to an external service or rebooting a machine.

Control of workflow behavior can be done using ActivityOptions. This is where you can define timeouts for workflow execution, retry policies, and task queues. Each worker can poll several task queues for both Workflow and Activity tasks. If no worker is polling the task queue in which a Workflow task is declared, nothing happens.

Temporal’s documentation provides a good introduction to writing Temporal workflows.

Building on Temporal

Below, we describe how our automatic remediation system works. It is essentially a way to schedule tasks across our global network with built-in reliability guarantees. With this system, teams can serve their customers more reliably. An unexpected failure mode can be recognized and immediately mitigated, while the root cause can be determined later via a more detailed analysis.

Step one: we need a coordinator


After our initial testing of Temporal, it was now possible to write workflows. But we needed a way to schedule workflow tasks from other internal services. The coordinator was built to serve this purpose, and became the primary mechanism for the authorisation and scheduling of workflows. 

The most important roles of the coordinator are authorisation, workflow task routing, and safety constraints enforcement. Each consumer is authorized via mTLS authentication, and the coordinator uses an ACL to determine whether to permit the execution of a workflow. An ACL configuration looks like the following example.

server_config {
    enable_tls = true
    [...]
    route_rule {
      name  = "global_get"
      method = "GET"
      route_patterns = ["/*"]
      uris = ["spiffe://example.com/worker-admin"]
    }
    route_rule {
      name = "global_post"
      method = "POST"
      route_patterns = ["/*"]
      uris = ["spiffe://example.com/worker-admin"]
      allow_public = true
    }
    route_rule {
      name = "public_access"
      method = "GET"
      route_patterns = ["/metrics"]
      uris = []
      allow_public = true
      skip_log_match = true
    }
}

Each workflow specifies two key characteristics: where to run the tasks and the safety constraints, using an HCL configuration file. Example constraints could be whether to run on only a specific node type (such as a database), or if multiple parallel executions are allowed: if a task has been triggered too many times, that is a sign of a wider problem that might require human intervention. The coordinator uses the Temporal Visibility API to determine the current state of the executions in the Temporal cluster.

An example of a configuration file is shown below:

task_queue_target = "<target>"

# The following entries will ensure that
# 1. This workflow is not run at the same time in a 15m window.
# 2. This workflow will not run more than once an hour.
# 3. This workflow will not run more than 3 times in one day.
#
constraint {
    kind = "concurency"
    value = "1"
    period = "15m"
}

constraint {
    kind = "maxExecution"
    value = "1"
    period = "1h"
}

constraint {
    kind = "maxExecution"
    value = "3"
    period = "24h"
    is_global = true
}

Step two: Task Routing is amazing


An unforeseen benefit of using a central Temporal cluster was the discovery of Task Routing. This feature allows us to schedule a Workflow/Activity on any server that has a running Temporal Worker, and further segment by the type of server, its location, etc. For this reason, we have three primary task queues — the general queue in which tasks can be executed by any worker in the datacenter, the node type queue in which tasks can only be executed by a specific node type in the datacenter, and the individual node queue where we target a specific node for task execution.

We rely on this heavily to ensure the speed and efficiency of automated remediation. Certain tasks can be run in datacenters with known low latency to an external resource, or a node type with better performance than others (due to differences in the underlying hardware). This reduces the amount of failure and latency we see overall in task executions. Sometimes we are also constrained by certain types of tasks that can only run on a certain node type, such as a database.

Task Routing also means that we can configure certain task queues to have a higher priority for execution, although this is not a feature we have needed so far. A drawback of task routing is that every Workflow/Activity needs to be registered to the target task queue, which is a common gotcha. Thankfully, it is possible to catch this failure condition with proper testing.

Step three: when/how to self-heal?

None of this would be relevant if we didn’t put it to good use. A primary design goal for the platform was to ensure we had easy, quick ways to trigger workflows on the most important failure conditions. The next step was to determine what the best sources to trigger the actions were. The answer to this was simple: we could trigger workflows from anywhere as long as they are properly authorized and detect the failure conditions accurately.

Example triggers are an alerting system, a log tailer, a health check daemon, or an authorized engineer via a chatbot. Such flexibility allows a high level of reuse, and permits to invest more in workflow quality and reliability.

As part of the solution, we built a daemon that is able to poll a signal source for any unwanted condition and trigger a configured workflow. We have initially found Prometheus useful as a source because it contains both service-level and hardware/system-level metrics. We are also exploring more event-based trigger mechanisms, which could eliminate the need to use precious system resources to poll for metrics.

We already had internal services that are able to detect widespread failure conditions for our customers, but were only able to page a human. With the adoption of auto-remediation, these systems are now able to react automatically. This ability to create an automatic feedback loop with our customers is the cornerstone of these self-healing capabilities and we continue to work on stronger signals, faster reaction times, and better prevention of future occurrences.

The most exciting part, however, is the future possibility. Every customer cares about any negative impact from Cloudflare. With this platform we can onboard several services (especially those that are foundational for the critical path) and ensure we react quickly to any failure conditions, even before there is any visible impact.

Step four: packaging and deployment

The whole system is written in golang, and a single binary can implement each role. We distribute it as an apt package or a container for maximum ease of deployment.

We deploy a Temporal-based worker to every server we intend to run tasks on, and a daemon in datacenters where we intend to automatically trigger workflows based on the local conditions. The coordinator is more nuanced since we rely on task routing and can trigger from a central coordinator, but we have also found value in running coordinators locally in the datacenters. This is especially useful in datacenters with less capacity or degraded performance, removing the need for a round-trip to schedule the workflows.

Step five: test, test, test

Temporal provides native mechanisms to test an entire workflow, via a comprehensive test suite that supports end-to-end, integration, and unit testing, which we used extensively to prevent regressions while developing. We also ensured proper test coverage for all the critical platform components, especially the coordinator.

Despite the ease of written tests, we quickly discovered that they were not enough. After writing workflows, engineers need an environment as close as possible to the target conditions. This is why we configured our staging environments to support quick and efficient testing. These environments receive the latest changes and point to a different (staging) Temporal cluster, which enables experimentation and easy validation of changes.

After a workflow is validated in the staging environment, we can then do a full release to production. It seems obvious, but catching simple configuration errors before releasing has saved us many hours in development/change-related-task time.

Deploying to production

As you can guess from the title of this post, we put this in production to automatically react to server-specific errors and unrecoverable failures. To this end, we have a set of services that are able to detect single-server failure conditions based on analyzed traffic data. After deployment, we have successfully mitigated potential impact by taking any errant single sources of failure out of production.

We have also created a set of workflows to reduce internal toil and improve efficiency. These workflows can automatically test pull requests on target machines, wipe and reset servers after experiments are concluded, and take away manual processes that cost many hours in toil.

Building a system that is maintained by several SRE teams has allowed us to iterate faster, and rapidly tackle long-standing problems. We have set ambitious goals regarding toil elimination and are on course to achieve them, which will allow us to scale faster by eliminating the human bottleneck.

Looking to the future

Our immediate plans are to leverage this system to provide a more reliable platform for our customers and drastically reduce operational toil, freeing up engineering resources to tackle larger-scale problems. We also intend to leverage more Temporal features such as Workflow Versioning, which will simplify the process of making changes to workflows by ensuring that triggered workflows run expected versions. 

 We are also interested in how others are solving problems using durable execution platforms such as Temporal, and general strategies to eliminate toil. If you would like to discuss this further, feel free to reach out on the Cloudflare Community and start a conversation!

If you’re interested in contributing to projects that help build a better Internet, our engineering teams are hiring.

Wrapping up another Birthday Week celebration

Post Syndicated from Kelly May Johnston original https://blog.cloudflare.com/birthday-week-2024-wrap-up

2024 marks Cloudflare’s 14th birthday. Birthday Week each year is packed with major announcements and the release of innovative new offerings, all focused on giving back to our customers and the broader Internet community. Birthday Week has become a proud tradition at Cloudflare and our culture, to not just stay true to our mission, but to always stay close to our customers. We begin planning for this week of celebration earlier in the year and invite everyone at Cloudflare to participate.

Months before Birthday Week, we invited teams to submit ideas for what to announce. We were flooded with submissions, from proposals for implementing new standards to creating new products for developers. Our biggest challenge is finding space for it all in just one week — there is still so much to build. Good thing we have a birthday to celebrate each year, but we might need an extra day in Birthday Week next year!

In case you missed it, here’s everything we announced during 2024’s Birthday Week:

Monday

What

In a sentence…

Start auditing and controlling the AI models accessing your content

Understand which AI-related bots and crawlers can access your website, and which content you choose to allow them to consume.

Making zone management more efficient with batch DNS record updates

Customers using Cloudflare to manage DNS can create a whole batch of records, enable proxying on many records, update many records to point to a new target at the same time, or even delete all of their records.

Introducing Ephemeral IDs: a new tool for fraud detection

Taking the next step in advancing security with Ephemeral IDs, a new feature that generates a unique short-lived ID, without relying on any network-level information.


Tuesday

What

In a sentence…

Cloudflare partners to deliver safer browsing experience to homes

Internet service, network, and hardware equipment providers can sign up and partner with Cloudflare to deliver a safer browsing experience to homes.

A safer Internet with Cloudflare: free threat intelligence, analytics, and new threat detections

Free threat intelligence, analytics, new threat detections, and more.

Automatically generating Cloudflare’s Terraform provider


The last pieces of the OpenAPI schemas ecosystem to now be automatically generated — the Terraform provider and API reference documentation.

Cloudflare helps verify the security of end-to-end encrypted messages by auditing key transparency for WhatsApp

Cloudflare helps verify the security of end-to-end encrypted messages by auditing key transparency for WhatsApp.

Wednesday

What

In a sentence…

Introducing Speed Brain: helping web pages load 45% faster

Speed Brain, our latest leap forward in speed, uses the Speculation Rules API to prefetch content for users’ likely next navigations — downloading web pages before they navigate to them and making pages load 45% faster.

Instant Purge: invalidating cached content in under 150ms

Instant Purge invalidates cached content in under 150ms, offering the industry’s fastest cache purge with global latency for purges by tags, hostnames, and prefixes.

New standards for a faster and more private Internet

Zstandard compression, Encrypted Client Hello, and more speed and privacy announcements all released for free.

TURN and anycast: making peer connections work globally

Starting today, Cloudflare Calls’ TURN service is now generally available to all Cloudflare accounts.

Cloudflare’s 12th Generation servers — 145% more performant and 63% more efficient

Next generation servers focused on exceptional performance and security, enhanced support for AI/ML workloads, and significant strides in power efficiency.


Thursday

What

In a sentence…

Startup Program revamped: build and grow on Cloudflare with up to $250,000 in credits


Eligible startups can now apply to receive up to $250,000 in credits to build using Cloudflare’s Developer Platform.

Cloudflare’s bigger, better, faster AI platform 

More powerful GPUs, expanded model support, enhanced logging and evaluations in AI Gateway, and Vectorize GA with larger index sizes and faster queries.

Builder Day 2024: 18 big updates to the Workers platform

Persistent and queryable Workers logs, Node.js compatibility GA, improved Next.js support via OpenNext, built-in CI/CD for Workers, Gradual Deployments, Queues, and R2 Event Notifications GA, and more — making building on Cloudflare easier, faster, and more affordable.

Faster Workers KV

A deep dive into how we made Workers KV up to 3x faster.

Zero-latency SQLite storage in every Durable Object

Putting your application code into the storage layer, so your code runs where the data is stored.

Making Workers AI faster and more efficient: Performance optimization with KV cache compression and speculative decoding

Using new optimization techniques such as KV cache compression and speculative decoding, we’ve made large language model (LLM) inference lightning-fast on the Cloudflare Workers AI platform.

Friday

What

In a sentence…

Our container platform is in production. It has GPUs. Here’s an early look.


We’ve been working on something new — a platform for running containers across Cloudflare’s network. We already use it in production, for AI inference and more.

Advancing cybersecurity: Cloudflare implements a new bug bounty VIP program as part of CISA Pledge commitment

We implemented a new bug bounty VIP program this year as part of our CISA Pledge commitment.

Empowering builders: introducing the Dev Alliance and Workers Launchpad Cohort #4

Get free and discounted access to essential developer tools and meet the latest set of incredible startups building on Cloudflare.

Expanding our support for open source projects with Project Alexandria

Expanding our open source program and helping projects have a sustainable and scalable future, providing tools and protection needed to thrive.

Network trends and natural language: Cloudflare Radar’s new Data Explorer & AI Assistant

A simple Web-based interface to build more complex API queries, including comparisons and filters, and visualize the results.

AI Everywhere with the WAF Rule Builder Assistant, Cloudflare Radar AI Insights, and updated AI bot protection

Extending our AI Assistant capabilities to help you build new WAF rules, added new AI bot and crawler traffic insights to Radar, and new AI bot blocking capabilities.

Reaffirming our commitment to Free

Our free plan is here to stay, and we reaffirm that commitment this week with 15 releases that make the Free plan even better.


One more thing…


Cloudflare serves millions of customers and their millions of domains across nearly every country on Earth. However, as a global company, the payment landscape can be complex — especially in regions outside of North America. While credit cards are very popular for online purchases in the US, the global picture is quite different. 60% of consumers across EMEA, APAC and LATAM choose alternative payment methods. For instance, European consumers often opt for SEPA Direct Debit, a bank transfer mechanism, while Chinese consumers frequently use Alipay, a digital wallet.

At Cloudflare, we saw this as an opportunity to meet customers where they are. Today, we’re thrilled to announce that we are expanding our payment system and launching a closed beta for a new payment method called Stripe Link. The checkout experience will be faster and more seamless, allowing our self-serve customers to pay using saved bank accounts or cards with Link. Customers who have saved their payment details at any business using Link can quickly check out without having to reenter their payment information.

These are the first steps in our efforts to expand our payment system to support global payment methods used by customers around the world. We’ll be rolling out new payment methods gradually, ensuring a smooth integration and gathering feedback from our customers every step of the way.


Until next year

That’s all for Birthday Week 2024. However, the innovation never stops at Cloudflare. Continue to follow the Cloudflare Blog all year long as we launch more products and features that help build a better Internet.

AI Everywhere with the WAF Rule Builder Assistant, Cloudflare Radar AI Insights, and updated AI bot protection

Post Syndicated from Adam Martinetti original https://blog.cloudflare.com/bringing-ai-to-cloudflare

The continued growth of AI has fundamentally changed the Internet over the past 24 months. AI is increasingly ubiquitous, and Cloudflare is leaning into the new opportunities and challenges it presents in a big way. This year for Cloudflare’s birthday, we’ve extended our AI Assistant capabilities to help you build new WAF rules, added AI bot traffic insights on Cloudflare Radar, and given customers new AI bot blocking capabilities.  

AI Assistant for WAF Rule Builder


At Cloudflare, we’re always listening to your feedback and striving to make our products as user-friendly and powerful as possible. One area where we’ve heard your feedback loud and clear is in the complexity of creating custom and rate-limiting rules for our Web Application Firewall (WAF). With this in mind, we’re excited to introduce a new feature that will make rule creation easier and more intuitive: the AI Assistant for WAF Rule Builder. 


By simply entering a natural language prompt, you can generate a custom or rate-limiting rule tailored to your needs. For example, instead of manually configuring a complex rule matching criteria, you can now type something like, “Match requests with low bot score,” and the assistant will generate the rule for you. It’s not about creating the perfect rule in one step, but giving you a strong foundation that you can build on. 

The assistant will be available in the Custom and Rate Limit Rule Builder for all WAF users. We’re launching this feature in Beta for all customers, and we encourage you to give it a try. We’re looking forward to hearing your feedback (via the UI itself) as we continue to refine and enhance this tool to meet your needs.

AI bot traffic insights on Cloudflare Radar

AI platform providers use bots to crawl and scrape websites, vacuuming up data to use for model training. This is frequently done without the permission of, or a business relationship with, the content owners and providers. In July, Cloudflare urged content owners and providers to “declare their AIndependence”, providing them with a way to block AI bots, scrapers, and crawlers with a single click. In addition to this so-called “easy button” approach, sites can provide more specific guidance to these bots about what they are and are not allowed to access through directives in a robots.txt file. Regardless of whether a customer chooses to block or allow requests from AI-related bots, Cloudflare has insight into request activity from these bots, and associated traffic trends over time.

Tracking traffic trends for AI bots can help us better understand their activity over time — which are the most aggressive and have the highest volume of requests, which launch crawls on a regular basis, etc. The new AI bot & crawler traffic graph on Radar’s Traffic page provides insight into these traffic trends gathered over the selected time period for the top known AI bots. The associated list of bots tracked here is based on the ai.robots.txt list, and will be updated with new bots as they are identified. Time series and summary data is available from the Radar API as well. (Traffic trends for the full set of AI bots & crawlers can be viewed in the new Data Explorer.)


Blocking more AI bots


For Cloudflare’s birthday, we’re following up on our previous blog post, Declaring Your AIndependence, with an update on the new detections we’ve added to stop AI bots. Customers who haven’t already done so can simply click the button to block AI bots to gain more protection for their website. 

Enabling dynamic updates for the AI bot rule

The old button allowed customers to block verified AI crawlers, those that respect robots.txt and crawl rate, and don’t try to hide their behavior. We’ve added new crawlers to that list, but we’ve also expanded the previous rule to include 27 signatures (and counting) of AI bots that don’t follow the rules. We want to take time to say “thank you” to everyone who took the time to use our “tip line” to point us towards new AI bots. These tips have been extremely helpful in finding some bots that would not have been on our radar so quickly. 

For each bot we’ve added, we’re also adding them to our “Definitely automated” definition as well. So, if you’re a self-service plan customer using Super Bot Fight Mode, you’re already protected. Enterprise Bot Management customers will see more requests shift from the “Likely Bot” range to the “Definitely automated” range, which we’ll discuss more below.

Under the hood, we’ve converted this rule logic to a Cloudflare managed rule (the same framework that powers our WAF). This enables our security analysts and engineers to safely push updates to the rule in real-time, similar to how new WAF rule changes are rapidly delivered to ensure our customers are protected against the latest CVEs. If you haven’t logged back into the Bots dashboard since the previous version of our AI bot protection was announced, click the button again to update to the latest protection. 


The impact of new fingerprints on the model 

One hidden beneficiary of fingerprinting new AI bots is our ML model. As we’ve discussed before, our global ML model uses supervised machine learning and greatly benefits from more sources of labeled bot data. Below, you can see how well our ML model recognized these requests as automated, before and after we updated the button, adding new rules. To keep things simple, we have shown only the top 5 bots by the volume of requests on the chart. With the introduction of our new managed rule, we have observed an improvement in our detection capabilities for the majority of these AI bots. Button v1 represents the old option that let customers block only verified AI crawlers, while Button v2 is the newly introduced feature that includes managed rule detections.


So how did we make our detections more robust? As we have mentioned before, sometimes a single attribute can give a bot away. We developed a sophisticated set of heuristics tailored to these AI bots, enabling us to effortlessly and accurately classify them as such. Although our ML model was already detecting the vast majority of these requests, the integration of additional heuristics has resulted in a noticeable increase in detection rates for each bot, and ensuring we score every request correctly 100% of the time. Transitioning from a purely machine learning approach to incorporating heuristics offers several advantages, including faster detection times and greater certainty in classification. While deploying a machine learning model is complex and time-consuming, new heuristics can be created in minutes. 

The initial launch of the AI bots block button was well-received and is now used by over 133,000 websites, with significant adoption even among our Free tier customers. The newly updated button, launched on August 20, 2024, is rapidly gaining traction. Over 90,000 zones have already adopted the new rule, with approximately 240 new sites integrating it every hour. Overall, we are now helping to protect the intellectual property of more than 146,000 sites from AI bots, and we are currently blocking 66 million requests daily with this new rule. Additionally, we’re excited to announce that support for configuring AI bots protection via Terraform will be available by the end of this year, providing even more flexibility and control for managing your bot protection settings.

Bot behavior

With the enhancements to our detection capabilities, it is essential to assess the impact of these changes to bot activity on the Internet. Since the launch of the updated AI bots block button, we have been closely monitoring for any shifts in bot activity and adaptation strategies. The most basic fingerprinting technique we use to identify AI bot looking for simple user-agent matches. User-agent matches are important to monitor because they indicate the bot is transparently announcing who they are when they’re crawling a website. 

The graph below shows a volume of traffic we label as AI bot over the past two months. The blue line indicates the daily request count, while the red line represents the monthly average number of requests. In the past two months, we have seen an average reduction of nearly 30 million requests, with a decrease of 40 million in the most recent month.This decline coincides with the release of Button v1 and Button v2. Our hypothesis is that with the new AI bots blocking feature, Cloudflare is blocking a majority of these bots, which is discouraging them from crawling. 


This hypothesis is supported by the observed decline in requests from several top AI crawlers. Specifically, the Bytespider bot reduced its daily requests from approximately 100 million to just 50 million between the end of June and the end of August (see graph below). This reduction could be attributed to several factors, including our new AI bots block button and changes in the crawler’s strategy.


We have also observed an increase in the accountability of some AI crawlers. The most basic fingerprinting technique we use to identify AI bot looking for simple user-agent matches. User-agent matches are important to monitor because they indicate the bot is transparently announcing who they are when they’re crawling a website. These crawlers are now more frequently using their agents, reflecting a shift towards more transparent and responsible behavior. Notably, there has been a dramatic surge in the number of requests from the Perplexity user agent. This increase might be linked to previous accusations that Perplexity did not properly present its user agent, which could have prompted a shift in their approach to ensure better identification and compliance.


These trends suggest that our updates are likely affecting how AI crawlers interact with content. We will continue to monitor AI bot activity to help users control who accesses their content and how. By keeping a close watch on emerging patterns, we aim to provide users with the tools and insights needed to make informed decisions about managing their traffic. 

Wrap up

We’re excited to continue to explore the AI landscape, whether we’re finding more ways to make the Cloudflare dashboard usable or new threats to guard against. Our AI insights on Radar update in near real-time, so please join us in watching as new trends emerge and discussing them in the Cloudflare Community

Our container platform is in production. It has GPUs. Here’s an early look

Post Syndicated from Brendan Irvine-Broque original https://blog.cloudflare.com/container-platform-preview

We’ve been working on something new — a platform for running containers across Cloudflare’s network. We already use it in production for Workers AI, Workers Builds, Remote Browsing Isolation, and the Browser Rendering API. Today, we want to share an early look at how it’s built, why we built it, and how we use it ourselves.

In 2024, Cloudflare Workers celebrates its 7th birthday. When we first announced Workers, it was a completely new model for running compute in a multi-tenant way — on isolates, as opposed to containers. While, at the time, Workers was a pretty bare-bones functions-as-a-service product, we took a big bet that this was going to become the way software was going to be written going forward. Since introducing Workers, in addition to expanding our developer products in general to include storage and AI, we have been steadily adding more compute capabilities to Workers:

2020

Cron Triggers

2021

Durable Objects

Write Workers in Rust

Service Bindings

2022

Queues

Email Workers

Durable Objects Alarms

2023

Workers TCP Socket API 

Hyperdrive

Smart Placement

Workers AI

2024

Python Workers

JavaScript-native RPC

Node.js compatibility

SQLite in Durable Objects

With each of these, we’ve faced a question — can we build this natively into the platform, in a way that removes, rather than adds complexity? Can we build it in a way that lets developers focus on building and shipping, rather than managing infrastructure, so that they don’t have to be a distributed systems engineer to build distributed systems?

In each instance, the answer has been YES. We try to solve problems in a way that simplifies things for developers in the long run, even if that is the harder path for us to take ourselves. If we didn’t, you’d be right to ask — why not self-host and manage all of this myself? What’s the point of the cloud if I’m still provisioning and managing infrastructure? These are the questions many are asking today about the earlier generation of cloud providers.

Pushing ourselves to build platform-native products and features helped us answer this question. Particularly because some of these actually use containers behind the scenes, even though as a developer you never interact with or think about containers yourself.

If you’ve used AI inference on GPUs with Workers AI, spun up headless browsers with Browser Rendering, or enqueued build jobs with the new Workers Builds, you’ve run containers on our network, without even knowing it. But to do so, we needed to be able to run untrusted code across Cloudflare’s network, outside a v8 isolate, in a way that fits what we promise:

  1. You shouldn’t have to think about regions or data centers. Routing, scaling, load balancing, scheduling, and capacity are our problem to solve, not yours, with tools like Smart Placement.

  2. You should be able to build distributed systems without being a distributed systems engineer.

  3. Every millisecond matters — Cloudflare has to be fast.

There wasn’t an off-the-shelf container platform that solved for what we needed, so we built it ourselves — from scheduling to IP address management, pulling and caching images, to improving startup times and more. Our container platform powers many of our newest products, so we wanted to share how we built it, optimized it, and well, you can probably guess what’s next.

Global scheduling — “The Network is the Computer”

Cloudflare serves the entire world — region: earth. Rather than asking developers to provision resources in specific regions, data centers and availability zones, we think “The Network is the Computer”. When you build on Cloudflare, you build software that runs on the Internet, not just in a data center.

When we started working on this, Cloudflare’s architecture was to just run every service via systemd on every server (we call them “metals” — we run our own hardware), allowing all services to take advantage of new capacity we add to our network. That fits running NGINX and a few dozen other services, but cannot fit a world where we need to run many thousands of different compute heavy, resource hungry workloads. We’d run out of space just trying to load all of them! Consider a canonical AI workload — deploying Llama 3.1 8B to an inference server. If we simply ran a Llama 3.1 8B service on every Cloudflare metal, we’d have no flexibility to use GPUs for the many other models that Workers AI supports.

We needed something that would allow us to still take advantage of the full capacity of Cloudflare’s entire network, not just the capacity of individual machines. And ideally not put that burden on the developer.

The answer: we built a control plane on our own Developer Platform that lets us schedule a container anywhere on Cloudflare’s Network:


The global scheduler is built on Cloudflare Workers, Durable Objects, and KV, and decides which Cloudflare location to schedule the container to run in. Each location then runs its own scheduler, which decides which metals within that location to schedule the container to run on. Location schedulers monitor compute capacity, and expose this to the global scheduler. This allows Cloudflare to dynamically place workloads based on capacity and hardware availability (e.g. multiple types of GPUs) across our network.

Why does global scheduling matter?

When you run compute on a first generation cloud, the “contract” between the developer and the platform is that the developer must specify what runs where. This is regional scheduling, the status quo.

Let’s imagine for a second if we applied regional scheduling to running compute on Cloudflare’s network, with locations in 330+ cities, across 120+ countries. One of the obvious reasons people tell us they want to run on Cloudflare is because we have compute in places where others don’t, within 50ms of 95% of the world’s Internet-connected population. In South America, other clouds have one region in one city. Cloudflare has 19:


Running anywhere means you can be faster, highly available, and have more control over data location. But with regional scheduling, the more locations you run in, the more work you have to do. You configure and manage load balancing, routing, auto-scaling policies and more. Balancing performance and cost in a multi-region setup is literally a full-time job (or more) at most companies who have reached meaningful scale on traditional clouds.

But most importantly, no matter what tools you bring, you were the one who told the cloud provider, “run this container over here”. The cloud platform can’t move it for you, even if moving it would make your workload faster. This prevents the platform from adding locations, because for each location, it has to convince developers to take action themselves to move their compute workloads to the new location. Each new location carries a risk that developers won’t migrate workloads to it, or migrate too slowly, delaying the return on investment.

Global scheduling means Cloudflare can add capacity and use it immediately, letting you benefit from it. The “contract” between us and our customers isn’t tied to a specific datacenter or region, so we have permission to move workloads around to benefit customers. This flexibility plays an essential role in all of our own uses of our container platform, starting with GPUs and AI.

GPUs everywhere: Scheduling large images with Workers AI

In late 2023, we launched Workers AI, which provides fast, easy to use, and affordable GPU-backed AI inference.

The more efficiently we can use our capacity, the better pricing we can offer. And the faster we can make changes to which models run in which Cloudflare locations, the closer we can move AI inference to the application, lowering Time to First Token (TTFT). This also allows us to be more resilient to spikes in inference requests.

AI models that rely on GPUs present three challenges though:

  1. Models have different GPU memory needs. GPU memory is the most scarce resource, and different GPUs have different amounts of memory.

  2. Not all container runtimes, such as Firecracker, support GPU drivers and other dependencies.

  3. AI models, particularly LLMs, are very large. Even a smaller parameter model, like @cf/meta/llama-3.1-8b-instruct, is at least 5 GB. The larger the model, the more bytes we need to pull across the network when scheduling a model to run in a new location.

Let’s dive into how we solved each of these…

First, GPU memory needs. The global scheduler knows which Cloudflare locations have blocks of GPU memory available, and then delegates scheduling the workload on a specific metal to the local scheduler. This allows us to prioritize placement of AI models that use a large amount of GPU memory, and then move smaller models to other machines in the same location. By doing this, we maximize the overall number of locations that we run AI models in, and maximize our efficiency.

Second, container runtimes and GPU support. Thankfully, from day one we built our container platform to be runtime agnostic. Using a runtime agnostic scheduler, we’re able to support gVisor, Firecracker microVMs, and traditional VMs with QEMU. We are also evaluating adding support for another one: cloud-hypervisor which is based on rust-vmm and has a few compelling advantages for our use case:

  1. GPU passthrough support using VFIO

  2. vhost-user-net support, enabling high throughput between the host network interface and the VM

  3. vhost-user-blk support, adding flexibility to introduce novel network-based storage backed by other Cloudflare Workers products

  4. all the while being a smaller codebase than QEMU and written in a memory-safe language

Our goal isn’t to build a platform that makes you as the developer choose between runtimes, and ask, “should I use Firecracker or gVisor”. We needed this flexibility in order to be able to run workloads with different needs efficiently, including workloads that depend on GPUs. gVisor has GPU support, while Firecracker microVMs currently does not.

gVisor’s main component is an application kernel (called Sentry) that implements a Linux-like interface but is written in a memory-safe language (Go) and runs in userspace. It works by intercepting application system calls and acting as the guest kernel, without the need for translation through virtualized hardware.

The resource footprint of a containerized application running on gVisor is lower than a VM because it does not require managing virtualized hardware and booting up a kernel instance. However, this comes at the price of reduced application compatibility and higher per-system call overhead.

To add GPU support, the Google team introduced nvproxy which works using the same principles as described above for syscalls: it intercepts ioctls destined to the GPU and proxies a subset to the GPU kernel module.


To solve the third challenge, and make scheduling fast with large models, we weren’t satisfied with the status quo. So we did something about it.

Docker pull was too slow, so we fixed it (and cut the time in half)

Many of the images we need to run for AI inference are over 15 GB. Specialized inference libraries and GPU drivers add up fast. For example, when we make a scheduling decision to run a fresh container in Tokyo, naively running docker pull to fetch the image from a storage bucket in Los Angeles would be unacceptably slow. And scheduling speed is critical to being able to scale up and down in new locations in response to changes in traffic.

We had 3 essential requirements:

  • Pulling and pushing very large images should be fast

  • We should not rely on a single point of failure

  • Our teams shouldn’t waste time managing image registries

We needed globally distributed storage, so we used R2. We needed the highest cache hit rate possible, so we used Cloudflare’s Cache, and will soon use Tiered Cache. And we needed a fast container image registry that we could run everywhere, in every Cloudflare location, so we built and open-sourced serverless-registry, which is built on Workers. You can deploy serverless-registry to your own Cloudflare account in about 5 minutes. We rely on it in production.

This is fast, but we can be faster. Our performance bottleneck was, somewhat surprisingly, docker push. Docker uses gzip to compress and decompress layers of images while pushing and pulling. So we started using Zstandard (zstd) instead, which compresses and decompresses faster, and results in smaller compressed files.

In order to build, chunk, and push these images to the R2 registry, we built a custom CLI tool that we use internally in lieu of running docker build and docker push. This makes it easy to use zstd and split layers into 500 MB chunks, which allows uploads to be processed by Workers while staying under body size limits.

Using our custom build and push tool doubled the speed of image pulls. Our 30 GB GPU images now pull in 4 minutes instead of 8. We plan on open sourcing this tool in the near future.

Anycast is the gift that keeps on simplifying — Virtual IPs and the Global State Router

We still had another challenge to solve. And yes, we solved it with anycast. We’re Cloudflare, did you expect anything else?

First, a refresher — Cloudflare operates Unimog, a Layer 4 load balancer that handles all incoming Cloudflare traffic. Cloudflare’s network uses anycast, which allows a single IP address to route requests to a variety of different locations. For most Cloudflare services with anycast, the given IP address will route to the nearest Cloudflare data center, reducing latency. Since Cloudflare runs almost every service in every data center, Unimog can simply route traffic to any Cloudflare metal that is online and has capacity, without needing to map traffic to a specific service that runs on specific metals, only in some locations.

The new compute-heavy, GPU-backed workloads we were taking on forced us to confront this fundamental “everything runs everywhere” assumption. If we run a containerized workflow in 20 Cloudflare locations, how does Unimog know which locations, and which metals, it runs in? You might say “just bring your own load balancer” — but then what happens when you make scheduling decisions to migrate a workload between locations, scale up, or scale down?

Anycast is foundational to how we build fast and simple products on our network, and we needed a way to keep building new types of products this way — where a team can deploy an application, get back a single IP address, and rely on the platform to balance traffic, taking load, container health, and latency into account, without extra configuration. We started letting teams use the container platform without solving this, and it was painfully clear that we needed to do something about it.

So we started integrating directly into our networking stack, building a sidecar service to Unimog. We’ll call this the Global State Router. Here’s how it works:

  • An eyeball makes a request to a virtual IP address issued by Cloudflare

  • Request sent to the best location as determined by BGP routing. This is anycast routing.

  • A small eBPF program sits on the main networking interface and ensures packets bound to a virtual IP address are handled by the Global State Router.

  • The main Global State Router program contains a mapping of all anycast IPs addresses to potential end destination container IP addresses. It updates this mapping based on container health, readiness, distance, and latency. Using this information, it picks a best-fit container.

  • Packets are forwarded at the L4 layer.

  • When a target container’s server receives a packet, its own Global State Router program intercepts the packet and routes it to the local container.


This might sound like just a lower level networking detail, disconnected from developer experience. But by integrating directly with Unimog, we can let developers:

  1. Push a containerized application to Cloudflare.

  2. Provide constraints, health checks, and load metrics that describe what the application needs.

  3. Delegate scheduling and scaling many containers across Cloudflare’s network.

  4. Get back a single IP address that can be used everywhere.

We’re actively working on this, and are excited to continue building on Cloudflare’s anycast capabilities, and pushing to keep the simplicity of running “everywhere” with new categories of workloads.

Low latency & global — Remote Browser Isolation & Browser Rendering

Our container platform actually started because of a very specific challenge, running Remote Browser Isolation across our network. Remote Browser Isolation provides Chromium browsers that run on Cloudflare, in containers, rather than on the end user’s own computer. Only the rendered output is sent to the end user. This provides a layer of protection against zero-day browser vulnerabilities, phishing attacks, and ransomware.

Location is critical — people expect their interactions with a remote browser to feel just as fast as if it ran locally. If the server is thousands of miles away, the remote browser will feel slow. Running across Cloudflare’s network of over 330 locations means the browser is nearly always as close to you as possible.

Imagine a user in Santiago, Chile, if they were to access a browser running in the same city, each interaction would incur negligible additional latency. Whereas a browser in Buenos Aires might add 21 ms, São Paulo might add 48 ms, Bogota might add 67 ms, and Raleigh, NC might add 128 ms. Where the container runs significantly impacts the latency of every user interaction with the browser, and therefore the experience as a whole.

It’s not just browser isolation that benefits from running near the user: WebRTC servers stream video better, multiplayer games have less lag, online advertisements can be served faster, financial transactions can be processed faster. Our container platform lets us run anything we need to near the user, no matter where they are in the world.

Using spare compute — “off-peak” jobs for Workers CI/CD builds

At any hour of the day, Cloudflare has many CPU cores that sit idle. This is compute power that could be used for something else.

Via anycast, most of Cloudflare’s traffic is handled as close as possible to the eyeball (person) that requested it. Most of our traffic originates from eyeballs. And the eyeballs of (most) people are closed and asleep between midnight and 5:00 AM local time. While we use our compute capacity very efficiently during the daytime in any part of the world, overnight we have spare cycles. Consider what a map of the world looks like at night-time in Europe and Africa:


As shown above, we can run containers during “off-peak” in Cloudflare locations receiving low traffic at night. During this time, the CPU utilization of a typical Cloudflare metal looks something like this:


We have many “background” compute workloads at Cloudflare. These are workloads that don’t actually need to run close to the eyeball because there is no eyeball waiting on the request. The challenge is that many of these workloads require running untrusted code — either a dependency on open-source code that we don’t trust enough to run outside of a sandboxed environment, or untrusted code that customers deploy themselves. And unlike Cron Triggers, which already make a best-effort attempt to use off-peak compute, these other workloads can’t run in v8 isolates.

On Builder Day 2024, we announced Workers Builds in open beta. You connect your Worker to a git repository, and Cloudflare builds and deploys your Worker each time you merge a pull request. Workers Builds run on our containers platform, using otherwise idle “off-peak” compute, allowing us to offer lower pricing, and hold more capacity for unexpected spikes in traffic in Cloudflare locations during daytime hours when load is highest. We preserve our ability to serve requests as close to the eyeball as possible where it matters, while using the full compute capacity of our network.

We developed a purpose-built API for these types of jobs. The Workers Builds service has zero knowledge of where Cloudflare has spare compute capacity on its network — it simply schedules an “off-peak” job to run on the containers platform, by defining a scheduling policy:

scheduling_policy: "off-peak"

Making off-peak jobs faster with prewarmed images

Just because a workload isn’t “eyeball-facing” doesn’t mean speed isn’t relevant. When a build job starts, you still want it to start as soon as possible.

Each new build requires a fresh container though, and we must avoid reusing containers to provide strong isolation between customers. How can we keep build job start times low, while using a new container for each job without over-provisioning? 

We prewarm servers with the proper image. 

Before a server becomes eligible to receive an “off peak” job, the container platform instructs it to download the correct image. Once the image is downloaded and cached locally, new containers can start quickly in a Firecracker VM after receiving a request for a new build. When a build completes, we throw away the container, and start the next build using a fresh container based on the prewarmed image.

Without prewarming, pulling and unpacking our Workers Build images would take roughly 75 seconds. With prewarming, we’re able to spin up a new container in under 10 seconds. We expect this to get even faster as we introduce optimizations like pre-booting images before new runs, or Firecracker snapshotting, which can restore a VM in under 200ms.

Workers and containers, better together

As more of our own engineering teams rely on our containers platform in production, we’ve noticed a pattern: they want a deeper integration with Workers.

We plan to give it to them. 

Let’s take a look at a project deployed on our container platform already, Key Transparency. If the container platform were highly integrated with Workers, what would this team’s experience look like?

Cloudflare regularly audits changes to public keys used by WhatsApp for encrypting messages between users. Much of the architecture is built on Workers, but there are long-running compute-intensive tasks that are better suited for containers.

We don’t want our teams to have to jump through hoops to deploy a container and integrate with Workers. They shouldn’t have to pick specific regions to run in, figure out scaling, expose IPs and handle IP updates, or set up Worker-to-container auth.

We’re still exploring many different ideas and API designs, and we want your feedback. But let’s imagine what it might look like to use Workers, Durable Objects and Containers together.

In this case, an outer layer of Workers handles most business logic and ingress, a specialized Durable Object is configured to run alongside our new container, and the platform ensures the image is loaded on the right metals and can scale to meet demand.


I add a containerized app to the wrangler.toml configuration file of my Worker (or Terraform):

[[container-app]]
image = "./key-transparency/verifier/Dockerfile"
name = "verifier"

[durable_objects]
bindings = { name = "VERIFIER", class_name = "Verifier", container = "verifier" } }

Then, in my Worker, I call the runVerification RPC method of my Durable Object:

fetch(request, env, ctx) {
  const id = new URL(request.url).searchParams.get('id')
  const durableObjectId = env.VERIFIER.idFromName(request.params.id);
  await env.VERIFIER.get(durableObjectId).runVerification()
  //...
}

From my Durable Object I can boot, configure, mount storage buckets as directories, and make HTTP requests to the container:

class Verifier extends DurableObject {
  constructor(state, env) {
    this.ctx.blockConcurrency(async () => {

      // starts the container
      await this.ctx.container.start();

      // configures the container before accepting traffic
      const config = await this.state.storage.get("verifierConfig");
      await this.ctx.container.fetch("/set-config", { method: "PUT", body: config});
    })
  }

  async runVerification(updateId) {
    // downloads & mounts latest updates from R2
    const latestPublicKeyUpdates = await this.env.R2.get(`public-key-updates/${updateId}`);
    await this.ctx.container.mount(`/updates/${updateId}`, latestPublicKeyUpdates);

    // starts verification via HTTP call 
    return await this.ctx.container.fetch(`/verifier/${updateId}`);
  }
}

And… that’s it.

I didn’t have to worry about placement, scaling, service discovery authorization, and I was able to leverage integrations into other services like KV and R2 with just a few lines of code. The container platform took care of routing, placement, and auth. If I needed more instances, I could call the binding with a new ID, and the platform would scale up containers for me.

We are still in the early stages of building these integrations, but we’re excited about everything that containers will bring to Workers and vice versa.

So, what do you want to build?

If you’ve read this far, there’s a non-zero chance you were hoping to get to run a container yourself on our network. While we’re not ready (quite yet) to open up the platform to everyone, now that we’ve built a few GA products on our container platform, we’re looking for a handful of engineering teams to start building, in advance of wider availability in 2025. And we’re continuing to hire engineers to work on this.

We’ve told you about our use cases for containers, and now it’s your turn. If you’re interested, tell us here what you want to build, and why it goes beyond what’s possible today in Workers and on our Developer Platform. What do you wish you could build on Cloudflare, but can’t yet today?

Empowering builders: introducing the Dev Alliance and Workers Launchpad Cohort #4

Post Syndicated from Melissa Kargiannakis original https://blog.cloudflare.com/launchpad-cohort4-dev-starter-pack

Today we’re announcing the Dev Starter Pack, an alliance of innovative tools for developers to get started with discounts and free services. We’re also excited to share an update on our Workers Launchpad Program.

Creating from the ground up often means spending countless hours piecing together the right development stack, navigating different pricing models, and managing growing costs — all of which can take your focus away from what truly matters: building your product and growing your business.

Introducing Dev Starter Pack: the tools you need to start building your startup

Hey! Dani Grant here, one of the first PMs at Cloudflare and co-founder of Jam.dev. Ten years ago (during 2014’s Birthday Week), Cloudflare launched Universal SSL, making SSL free on the Internet for the first time, and in one night doubling the size of the encrypted web.

I was a college student back then, and I immediately became enraptured by Cloudflare’s mission: helping build a better Internet. As part of this mission, Cloudflare has developed powerful tools typically accessible only to Internet giants, oftentimes offering them for free to developers and individuals alike. Heck yeah! I joined Cloudflare in January 2015, and 5 years after that, co-founded a developer tool company called Jam, inspired by the impact that I saw building tools for developers could have while at Cloudflare.

It’s now 10 years later, and a lot has changed –– “software ate the world” and it’s now powering all aspects of our lives, from health to finances to how we work. It’s more important than ever to empower every developer with the best tools available, because the faster we build software, the sooner people’s experiences improve.

Today we’re thrilled to announce the Dev Starter Pack, an alliance of like-minded dev tool companies giving away their services for free, or heavily discounting them for developers who want to start companies and build the future.

Not only does this stack include all the tools you need to build a startup, it also includes all the tools you need to build AI-powered features. We believe that the next wave of startups will be AI-native, as AI becomes as ubiquitous as the electricity that powers the servers.

We haven’t even scratched the surface of what’s possible with AI, and we hope this launch gets developers closer to solving the challenges of building non-deterministic software.

If you’re a software engineer, and you want to build a project or a company and need an off the shelf stack of dev tools to get started, go to devstarterpack.io to start using all of these tools.

Each provider is offering developers a heavily discounted or even free plan to get started building. You can redeem these services by either using the special code “devstarterpack” or selecting “Dev Starter Pack” while applying to relevant programs.

We welcome more tools to join the alliance — this is just the beginning. If you are building a developer tool and would like to include your product in the Dev Starter Pack, let us know here, so we can include you. 

What will you build?

We are very excited to see what you will build. Please share with us in Cloudflare’s Discord and community forum, so we can support you however it makes sense.

Software developers are changing the world, and we believe in providing support to help you make an even greater impact. If you’re looking for additional funding or support, check out Cloudflare’s Launchpad for developers turned founders building startups.


Introducing Workers Launchpad Cohort #4

Melissa and Chris from the Cloudflare for Startups team here. Our team is blown away by what customers are demonstrating on the Developer Platform. Just a few weeks ago, our Workers Launchpad Cohort #3 wrapped up. On Demo Day, customers demoed their applications built on Cloudflare, spanning AI, dev tools, IaaS, observability, SaaS, media, and beyond. We’re incredibly proud of Cohort #3 participants, and we look forward to their continued success with Cloudflare.

Following Demo Day of Workers Launchpad Cohort #3, we’ve been excited to receive a surge of new applications from startups around the world. These startups are pushing the boundaries of innovation, particularly in areas like observability, PaaS, AI, automation, e-commerce, and other industries. Many startups that applied this go-around demonstrated that they’ve built some great applications on Cloudflare, and today, we’re excited to announce the accepted participants for our upcoming Workers Launchpad Cohort #4.

Let’s take a look at what Cohort #4 participants are building in their own words:

Adster

Hyperscale revenue powered by real-time data intelligence and AI

Almeta

Predict customer behavior on your website

Best Parents

Disruptive educational travel marketplace for Gen Z under 18

Comigo

Companion app to make therapy an engaging daily practice

Datastrato

A unified data catalog for generative AI infrastructure

Equimake

Create professional 3D projects without technical experience

Evefan

Your own Internet scale events infrastructure

Eventuall

Connecting stars with their fans in paid meet & greets and virtual experiences

Fermat

No-code solution to deploy AI models as internal tools

Fiberplane

Development tool that uses observability data to help test and debug APIs

Firetiger

An engineering observability tool that operates at scale inside customer infrastructure

Flightcast

Video-first podcast hosting & distribution

FlightLevel Technologies

AI Analytics and Footage in the aviation industry.

Gitlip

Powerful, collaborative and lightweight computing platform based on Git

GrackerAI

AI-powered organic growth engine for cybersecurity B2B SaaS

Hackernoon

Community-driven blogging network read by millions of technologists

Hanabi.REST

Prompt to REST API with AI-driven building, testing, and deployment

Infrastack

Next-gen application intelligence and observability platform for developers

June

AI productivity companion

Leed AI

Combined marketing workflows, website, and customer journey for a seamless, AI-accelerated experience

lookbk

Make the Internet more shoppable, starting with fashion on socials

Materialized Intelligence

Data-intensive inference solutions

Maxint

Multi-platform money management powered by AI

Midio

Visual tool to build software and AI agents

NikaPlanet

Transformative geospatial analytics experience with Google Colab, QGIS, ChatGPT, and Miro in one solution

NotHotDog

AI-Powered API Testing Tool

Outerbase

View, edit, query, and visualize your data with AI

Procureezy

AI procurement platform to empower hardware engineers to source smarter and launch sooner

Proma

Process management and automation platform to get work done fast

Render Better

Increase e-commerce revenue by optimizing your site speed, automatically

Sherpo

AI-first no-code platform to build and sell digital content

Speak_

AI platform to surface top talent by evaluating candidates against custom criteria

Tightknit

Embedded community engagement platform built for SaaS

Tinfoil

Powerful analytics with cryptographic privacy guarantees

Velvet

AI gateway to monitor, evaluate, and optimize features

Webstudio

An advanced visual site builder that connects to any headless CMS

Zipr

Streamlined visitor management

The Cloudflare team is ecstatic to work with the amazing participants of Cohort #4. If you want to follow along on Cohort #4’s journey, be sure to follow @CloudflareDev on X and join our Developer Discord server.

Are you a startup building on Cloudflare? Apply for Cohort #5!

Builder Day 2024: 18 big updates to the Workers platform

Post Syndicated from Tanushree Sharma original https://blog.cloudflare.com/builder-day-2024-announcements

To celebrate Builder Day 2024, we’re shipping 18 updates inspired by direct feedback from developers building on Cloudflare. Choosing a platform isn’t just about current technologies and services — it’s about betting on a partner that will evolve with your needs as your project grows and the tech landscape shifts. We’re in it for the long haul with you.

Starting today, you can:

We’ve brought key features from Pages to Workers, allowing you to: 

Four things are going GA and are officially production-ready:

  • Gradual Deployments: Deploy changes to your Worker gradually, on a percentage basis of traffic

  • Cloudflare Queues: Now with much higher throughput and concurrency limits

  • R2 Event Notifications: Tightly integrated with Queues for event-driven applications

  • Vectorize: Globally distributed vector database, now faster, with larger indexes, and new pricing

The Workers platform is getting faster:

And we’re lowering the cost of building on Cloudflare:

Everything in this post is available for you to use today. Keep reading to learn more, and watch the Builder Day Live Stream for demos and more.

Persistent Logs for every Worker

Starting today in open beta, you can automatically retain logs from your Worker, with full search, query, and filtering capabilities available directly within the Cloudflare dashboard. All newly created Workers will have this setting automatically enabled. This marks the first step in the development of our observability platform, following Cloudflare’s acquisition of Baselime.

Getting started is easy – just add two lines to your Worker’s wrangler.toml and redeploy:

[observability]
enabled = true

Workers Logs allow you to view all logs emitted from your Worker. When enabled, each console.log message, error, and exception is published as a separate event. Every Worker invocation (i.e. requests, alarms, rpc, etc.) also publishes an enriched execution log that contains invocation metadata. You can view logs in the Logs tab of your Worker in the dashboard, where you can filter on any event field, such as time, error code, message, or your own custom field.


If you’ve ever had to piece together the puzzle of unusual metrics, such as a spike in errors or latency, you know how frustrating it is to connect metrics to traces and logs that often live in independent data silos. Workers Logs is the first piece of a new observability platform we are building that helps you easily correlate telemetry data, and surfaces insights to help you understand. We’ll structure your telemetry data so you have the full context to ask the right questions, and can quickly and easily analyze the behavior of your applications. This is just the beginning for observability tools for Workers. We are already working on automatically emitting distributed traces from Workers, with real time errors and wide, high dimensionality events coming soon as well. 


Starting November 1, 2024, Workers Logs will cost $0.60 per million log lines written after the included volume, as shown in the table below. Querying your logs is free. This makes it easy to estimate and forecast your costs — we think you shouldn’t have to calculate the number of ‘Gigabytes Ingested’ to understand what you’ll pay.

Workers Free Workers Paid
Included Volume 200,000 logs per day 20,000,000 logs per month
Additional Events N/A $0.60 per million logs
Retention 3 days 7 days

Try out Workers Logs today. You can learn more from our developer documentation, and give us feedback directly in the #workers-observability channel on Discord.

Connect to private databases from Workers

Starting today, you can now use Hyperdrive, Cloudflare Tunnels and Access together to securely connect to databases that are isolated in a private network. 

Hyperdrive enables you to build on Workers with your existing regional databases. It accelerates database queries using Cloudflare’s network, caching data close to end users and pooling connections close to the database. But there’s been a major blocker preventing you from building with Hyperdrive: network isolation.

The majority of databases today aren’t publicly accessible on the Internet. Data is highly sensitive and placing databases within private networks like a virtual private cloud (VPC) keeps data secure. But to date, that has also meant that your data is held captive within your cloud provider, preventing you from building on Workers. 

Today, we’re enabling Hyperdrive to securely connect to private databases using Cloudflare Tunnels and Cloudflare Access. With a Cloudflare Tunnel running in your private network, Hyperdrive can securely connect to your database and start speeding up your queries.


With this update, Hyperdrive makes it possible for you to build full-stack applications on Workers with your existing databases, network-isolated or not. Whether you’re using Amazon RDS, Amazon Aurora, Google Cloud SQL, Azure Database, or any other provider, Hyperdrive can connect to your databases and optimize your database connections to provide the fast performance you’ve come to expect with building on Workers.

Improved Node.js compatibility is now GA

Earlier this month, we overhauled our support for Node.js APIs in the Workers runtime. With twice as many Node APIs now supported on Workers, you can now use a wider set of NPM packages to build a broader range of applications. Today, we’re happy to announce that improved Node.js compatibility is GA.

To give it a try, enable the nodejs_compat compatibility flag, and set your compatibility date to on or after 2024-09-23:

compatibility_flags = ["nodejs_compat"]
compatibility_date = "2024-09-23"

Read the developer documentation to learn more about how to opt-in your Workers to try it today. If you encounter any bugs or want to report feedback, open an issue.

Build frontend applications on Workers with Static Asset Hosting

Starting today in open beta, you now can upload and serve HTML, CSS, and client-side JavaScript directly as part of your Worker. This means you can build dynamic, server-side rendered applications on Workers using popular frameworks such as Astro, Remix, Next.js and Svelte (full list here), with more coming soon.

You can now deploy applications to Workers that previously could only be deployed to Cloudflare Pages and use features that are not yet supported in Pages, including Logpush, Hyperdrive, Cron Triggers, Queue Consumers, and Gradual Deployments

To get started, create a new project with create-cloudflare. For example, to create a new Astro project:  

npm create cloudflare@latest -- my-astro-app --framework=astro --experimental

Visit our developer documentation to learn more about setting up a new front-end application on Workers and watch a quick demo to learn about how you can deploy an existing application to Workers. Static assets aren’t just for Workers written in JavaScript! You can serve static assets from Workers written in Python or even deploy a Leptos app using workers-rs.

If you’re wondering “What about Pages?” — rest assured, Pages will remain fully supported. We’ve heard from developers that as we’ve added new features to Workers and Pages, the choice of which product to use has become challenging. We’re closing this gap by bringing asset hosting, CI/CD and Preview URLs to Workers this Birthday Week.

To make the upfront choice Cloudflare Workers and Pages more transparent, we’ve created a compatibility matrix. Looking ahead, we plan to bridge the remaining gaps between Workers and Pages and provide ways to migrate your Pages projects to Workers.

Cloudflare joins OpenNext to deploy Next.js apps to Workers

Starting today, as an early developer preview, you can use OpenNext to deploy Next.js apps to Cloudflare Workers via @opennextjs/cloudflare, a new npm package that lets you use the Node.js “runtime” in Next.js on Workers.

This new adapter is powered by our new Node.js compatibility layer, newly introduced Static Assets for Workers, and Workers KV, which is now up to 3x faster. It unlocks support for Incremental Static Regeneration (ISR), custom error pages, and other Next.js features that our previous adapter, @cloudflare/next-on-pages, could not support, as it was only compatible with the Edge “runtime” in Next.js.

Cloud providers shouldn’t lock you in. Like cloud compute and storage, open source frameworks should be portable — you should be able to deploy them to different cloud providers. The goal of the OpenNext project is to make sure you can deploy Next.js apps to any cloud platform, originally to AWS, and now Cloudflare. We’re excited to contribute to the OpenNext community, and give developers the freedom to run on the cloud that fits their applications needs (and budget) best.

To get started by reading the OpenNext docs, which provide examples and a guide on how to add @opennextjs/cloudflare to your Next.js app.

We want your feedback! Report issues and contribute code at opennextjs/opennextjs-cloudflare on GitHub, and join the discussion on the OpenNext Discord.

npm create cloudflare@latest -- my-next-app --framework=next --experimental

We want your feedback! Report issues and contribute code at opennextjs/opennextjs-cloudflare on GitHub, and join the discussion on the OpenNext Discord.

Continuous Integration & Delivery (CI/CD) with Workers Builds

Now in open beta, you can connect a GitHub or GitLab repository to a Worker, and Cloudflare will automatically build and deploy your changes each time you push a commit. Workers Builds provides an integrated CI/CD workflow you can use to build and deploy everything from full-stack applications built with the most popular frameworks to simple static websites. Just add your build command and let Workers Builds take care of the rest. 


While in open beta, Workers Builds is free to use, with a limit of one concurrent build per account, and unlimited build minutes per month. Once Workers Builds is Generally Available in early 2025, you will be billed based on the number of build minutes you use each month, and have a higher number of concurrent builds.

Workers Free Workers Paid
Build minutes, open beta Unlimited Unlimited
Concurrent builds, open beta 1 1
Build minutes, general availability 3,000 minutes included per month 6,000 minutes included per month
+$0.005 per additional build minute
Concurrent builds, general availability 1 6

Read the docs to learn more about how to deploy your first project with Workers Builds.

Workers preview URLs

Each newly uploaded version of a Worker now automatically generates a preview URL. Preview URLs make it easier for you to collaborate with your team during development, and can be used to test and identify issues in a preview environment before they are deployed to production.

When you upload a version of your Worker via the Wrangler CLI, Wrangler will display the preview URL once your upload succeeds. You can also find preview URLs for each version of your Worker in the Cloudflare dashboard:


Preview URLs for Workers are similar to Pages preview deployments — they run on your Worker’s workers.dev subdomain and allow you to view changes applied on a new version of your application before the changes are deployed.

Learn more about preview URLs by visiting our developer documentation

Safely release to production with Gradual Deployments

At Developer Week, we launched Gradual Deployments for Workers and Durable Objects to make it safer and easier to deploy changes to your applications. Gradual Deployments is now GA — we have been using it ourselves at Cloudflare for mission-critical services built on Workers since early 2024.


Gradual deployments can help you stay on top of availability SLAs and minimize application downtime by surfacing issues early. Internally at Cloudflare, every single service built on Workers uses gradual deployments to roll out new changes. Each new version gets released in stages —– 0.05%, 0.5%, 3%, 10%, 25%, 50%, 75% and 100% with time to soak between each stage. Throughout the roll-out, we keep an eye on metrics (which are often instrumented with Workers Analytics Engine!) and we roll back if we encounter issues. 

Using gradual deployments is as simple as swapping out the wrangler commands, API endpoints, and/or using “Save version” in the code editor that is built into the Workers dashboard. Read the developer documentation to learn more and get started. 

Queues is GA, with higher throughput and concurrency limits

Cloudflare Queues is now generally available with higher limits. 

Queues let a developer decouple their Workers into event driven services. Producer Workers write events to a Queue, and consumer Workers are invoked to take actions on the events. For example, you can use a Queue to decouple an e-commerce website from a service which sends purchase confirmation emails to users.


Throughput and concurrency limits for Queues are now significantly higher, which means you can push more messages through a Queue, and consume them faster.

  • Throughput: Each queue can now process 5000 messages per second (previously 400 per second).

  • Concurrency: Each queue can now have up to 250 concurrent consumers (previously 20 concurrent consumers). 

Since we announced Queues in beta, we’ve added the following functionality:

Queues can be used by any developer on a Workers Paid plan. Head over to our getting started guide to start building with Queues.

Event notifications for R2 is now GA

We’re excited to announce that event notifications for R2 is now generally available. Whether it’s kicking off image processing after a user uploads a file or triggering a sync to an external data warehouse when new analytics data is generated, many applications need to be able to reliably respond when events happen. Event notifications for Cloudflare R2 give you the ability to build event-driven applications and workflows that react to changes in your data.


Here’s how it works: When data in your R2 bucket changes, event notifications are sent to your queue. You can consume these notifications with a consumer Worker or pull them over HTTP from outside of Cloudflare Workers.


Since we introduced event notifications in open beta earlier this year, we’ve made significant improvements based on your feedback:

  • We increased reliability of event notifications with throughput improvements from Queues. R2 event notifications can now scale to thousands of writes per second.

  • You can now configure event notifications directly from the Cloudflare dashboard (in addition to Wrangler).

  • There is now support for receiving notifications triggered by object lifecycle deletes.

  • You can now set up multiple notification rules for a single queue on a bucket.

Visit our documentation to learn about how to set up event notifications for your R2 buckets.

Removing the serverless microservices tax: No more request fees for Service Bindings and Tail Workers

Earlier this year, we quietly changed Workers pricing to lower your costs. As of July 2024, you are no longer charged for requests between Workers on your account made via Service Bindings, or for invocations of Tail Workers. For example, let’s say you have the following chain of Workers:


Each request from a client results in three Workers invocations. Previously, we charged you for each of these invocations, plus the CPU time for each of these Workers. With this change, we only charge you for the first request from the client, plus the CPU time used by each Worker.

This eliminates the additional cost of breaking a monolithic serverless app into microservices. In 2023, we introduced new pricing based on CPU time, rather than duration, so you don’t have to worry about being billed for time spent waiting on I/O. This includes I/O to other Workers. With this change, you’re only billed for the first request in the chain, eliminating the other additional cost of using multiple Workers.

When you build microservices on Workers, you face fewer trade offs than on other compute platforms. Service bindings have zero network overhead by default, a built-in JavaScript RPC system, and a security model with fewer footguns and simpler configuration. We’re excited to improve this further with this pricing change.

Image optimization is available to everyone for free — no subscription needed

Starting today, you can use Cloudflare Images for free to optimize your images with up to 5,000 transformations per month.

Large, oversized images can throttle your application speed and page load times. We built Cloudflare Images to let you dynamically optimize images in the correct dimensions and formats for each use case, all while storing only the original image.

In the spirit of Birthday Week, we’re making image optimization available to everyone with a Cloudflare account, no subscription needed. You’ll be able to use Images to transform images that are stored outside of Images, such as in R2.


Transformations are served from your zone through a specially formatted URL with parameters that specify how an image should be optimized. For example, the transformation URL below uses the format parameter to automatically serve the image in the most optimal format for the requesting browser:

https://example.com/cdn-cgi/image/format=auto/thumbnail.png

This means that the original PNG image may be served as AVIF to one user and WebP to another. Without a subscription, transforming images from remote sources is free up to 5,000 unique transformations per month. Once you exceed this limit, any already cached transformations will continue to be served, but you’ll need a paid Images plan to request new transformations or to purchase storage within Images.

To get started, navigate to Images in the dashboard to enable transformations on your zone.

Dive deep into more announcements from Builder Day

We shipped so much that we couldn’t possibly fit it all in one blog post. These posts dive into the technical details of what we’re announcing at Builder Day:

Build the next big thing on Cloudflare

Cloudflare is for builders, and everything we’re announcing at Builder Day, you can start building with right away. We’re now offering $250,000 in credits to use on our Developer Platform to qualified startups, so that you can get going even faster, and become the next company to reach hypergrowth scale with a small team, and not waste time provisioning infrastructure and doing undifferentiated heavy lifting. Focus on shipping, and we’ll take care of the rest.

Apply to the startup program here, or stop by and say hello in the Cloudflare Developers Discord.