Tag Archives: Kubernetes

Evolving Container Security With Linux User Namespaces

Post Syndicated from Netflix Technology Blog original https://netflixtechblog.com/evolving-container-security-with-linux-user-namespaces-afbe3308c082

By Fabio Kung, Sargun Dhillon, Andrew Spyker, Kyle, Rob Gulewich, Nabil Schear, Andrew Leung, Daniel Muino, and Manas Alekar

As previously discussed on the Netflix Tech Blog, Titus is the Netflix container orchestration system. It runs a wide variety of workloads from various parts of the company — everything from the frontend API for netflix.com, to machine learning training workloads, to video encoders. In Titus, the hosts that workloads run on are abstracted from our users. The Titus platform maintains large pools of homogenous node capacity to run user workloads, and the Titus scheduler places workloads. This abstraction allows the compute team to influence the reliability, efficiency, and operability of the fleet via the scheduler. The hosts that run workloads are called Titus “agents.” In this post, we describe how Titus agents leverage user namespaces to improve the overall security of the Titus agent fleet.

Titus’s Multi-Tenant Clusters

The Titus agent fleet appears to users as a homogenous pool of capacity. Titus internally employs a cellular bulkhead architecture for scalability, so the fleet is composed of multiple cells. Many bulkhead architectures partition their cells on tenants, where a tenant is defined as a team and their collection of applications. We do not take this approach, and instead, we partition our cells to balance load. We do this for reliability, scalability, and efficiency reasons.
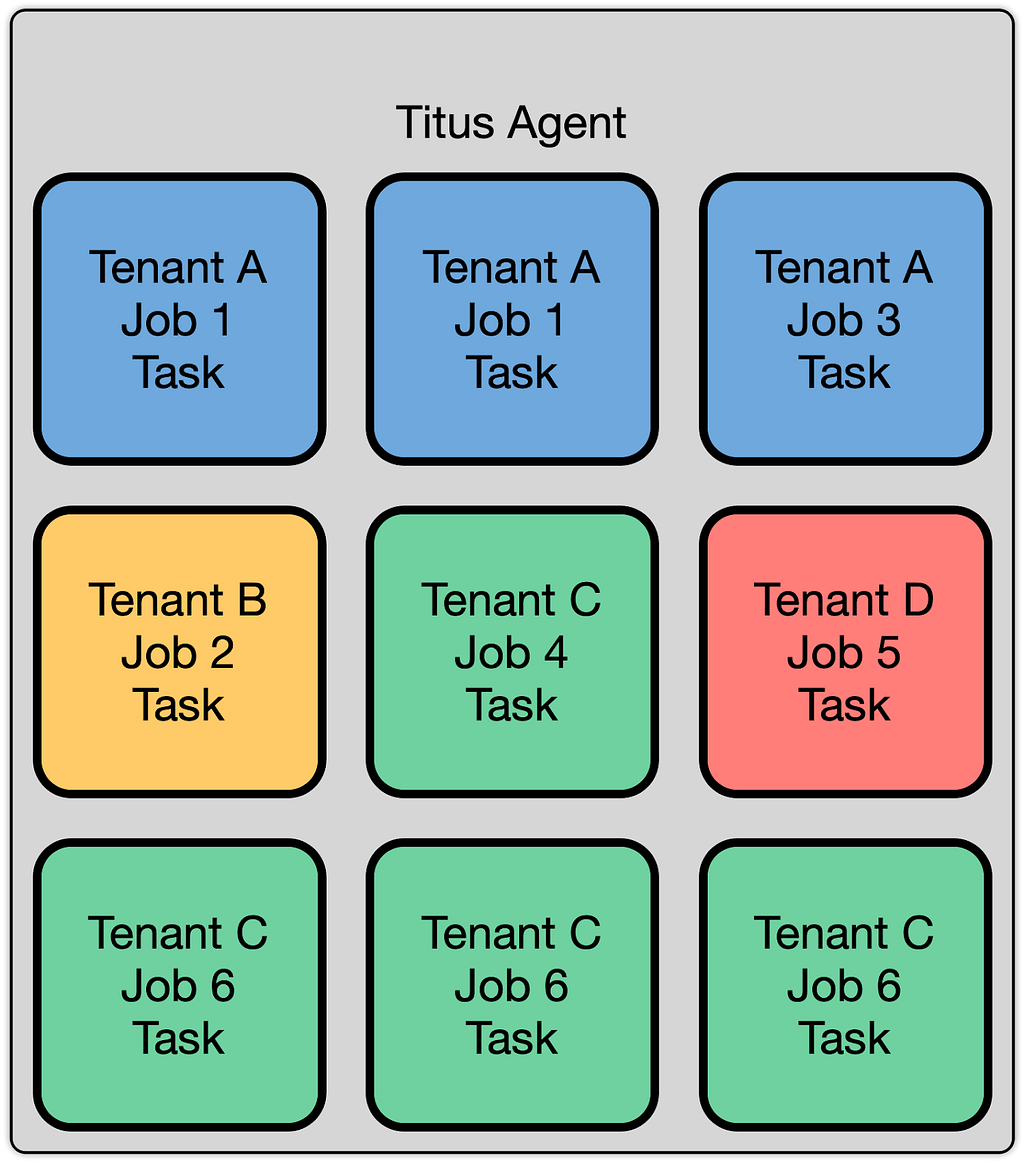
Titus is a multi-tenant system, allowing multiple teams and users to run workloads on the system, and ensuring they can all co-exist while still providing guarantees about security and performance. Much of this comes down to isolation, which comes in multiple forms. These forms include performance isolation (ensuring workloads do not degrade one another’s performance), capacity isolation (ensuring that a given tenant can acquire resources when they ask for them), fault isolation (ensuring that the failure of a part of the system doesn’t cause the whole system to fail), and security isolation (ensuring that the compromise of one tenant’s workload does not affect the security of other tenants). This post focuses on our approaches to security isolation.

Secure Multi-tenancy

One of Titus’s biggest concerns with multi-tenancy is security isolation. We want to allow different kinds of containers from different tenants to run on the same instance. Security isolation in containers has been a contentious topic. Despite the risks, we’ve chosen to leverage containers as part of our security boundary. To offset the risks brought about by the container security boundary, we employ some additional protections.

The building blocks of multi-tenancy are Linux namespaces, the very technology that makes LXC, Docker, and other kinds of containers possible. For example, the PID namespace makes it so that a process can only see PIDs in its own namespace, and therefore cannot send kill signals to random processes on the host. In addition to the default Docker namespaces (mount, network, UTS, IPC, and PID), we employ user namespaces for added layers of isolation. Unfortunately, these default namespace boundaries are not sufficient to prevent container escape, as seen in CVEs like CVE-2015–2925. These vulnerabilities arise due to the complexity of interactions between namespaces, a large number of historical decisions during kernel development, and leaky abstractions like the proc filesystem in Linux. Composing these security isolation primitives correctly is difficult, so we’ve looked to other layers for additional protection.

Running many different workloads multi-tenant on a host necessitates the prevention lateral movement, a technique in which the attacker compromises a single piece of software running in a container on the system, and uses that to compromise other containers on the same system. To mitigate this, we run containers as unprivileged users — making it so that users cannot use “root.” This is important because, in Linux, UID 0 (or root’s privileges), do not come from the mere fact that the user is root, but from capabilities. These capabilities are tied to the current process’s credentials. Capabilities can be added via privilege escalation (e.g., sudo, file capabilities) or removed (e.g., setuid, or switching namespaces). Various capabilities control what the root user can do. For example, the CAP_SYS_BOOT capability controls the ability of a given user to reboot the machine. There are also more common capabilities that are granted to users like CAP_NET_RAW, which allows a process the ability to open raw sockets. A user can automatically have capabilities added when they execute specific files via file capabilities. For example, on a stock Ubuntu system, the ping command needs CAP_NET_RAW:

One of the most powerful capabilities in Linux is CAP_SYS_ADMIN, which is effectively equivalent to having superuser access. It gives the user the ability to do everything from mounting arbitrary filesystems, to accessing tracepoints that can expose vital information about the Linux kernel. Other powerful capabilities include CAP_CHOWN and CAP_DAC_OVERRIDE, which grant the capability to manipulate file permissions.

In the kernel, you’ll often see capability checks spread throughout the code, which looks something like this:

Notice this function doesn’t check if the user is root, but if the task has the CAP_SYS_ADMIN capability before allowing it to execute.

Docker takes the approach of using an allow-list to define which capabilities a container receives. These can be extended or attenuated by the user. Even the default capabilities that are defined in the Docker profile can be abused in certain situations. When we looked into running workloads as unprivileged users without many of these capabilities, we found that it was a non-starter. Various pieces of software used elevated capabilities for FUSE, low-level packet monitoring, and performance tracing amongst other use cases. Programs will usually start with capabilities, perform any activities that require those capabilities, and then “drop” them when the process no longer needs them.

User Namespaces

Fortunately, Linux has a solution — User Namespaces. Let’s go back to that kernel code example earlier. The pcrlock function called the capable function to determine whether or not the task was capable. This function is defined as:

This checks if the task has this capability relative to the init_user_ns. The init_user_ns is the namespace that processes are initialially spawned in, as it’s the only user namespace that exists at kernel startup time. User namespaces are a mechanism to split up the init_user_ns UID space. The interface to set up the mappings is via a “uid_map” and “gid_map” that’s exposed via /proc. The mapping looks something like this:
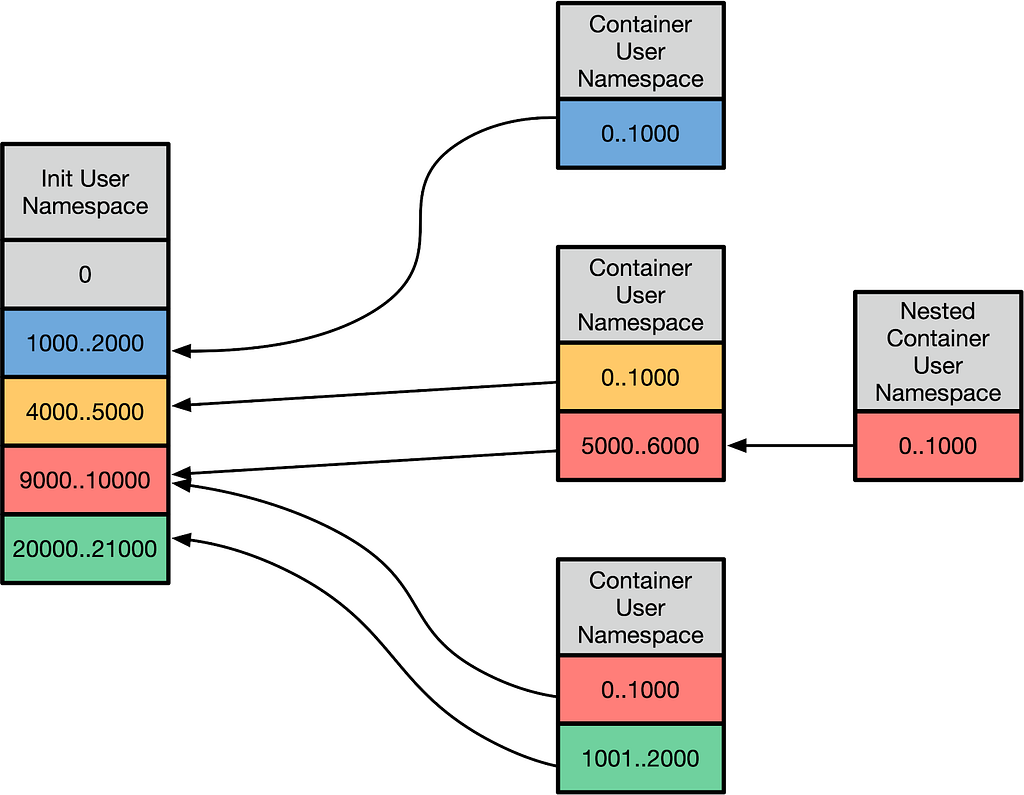
This allows UIDs in user-namespaced containers to be mapped to host UIDs. A variety of translations occur, but from the container’s perspective, everything is from the perspective of the UID ranges (otherwise known as extents) that are mapped. This is powerful in a few ways:

  1. It allows you to make certain UIDs off-limits to the container — if a UID is not mapped in the user namespace to a real UID, and you try to examine a file on disk with it, it will show up as overflowuid / overflowgid, a UID and GID specified in /proc/sys to indicate that it cannot be mapped into the current working space. Also, the container cannot setuid to a UID that can access files owned by that “outside uid.”
  2. From the user namespace’s perspective, the container’s root user appears to be UID 0, and the container can use the entire range of UIDs that are mapped into that namespace.
  3. Kernel subsystems can then proceed to call ns_capable with the specific user namespace that is tied to the resource. Many capability checks are now done to a user namespace that is relative to the resource being manipulated. This, in turn, allows processes to exercise certain privileges without having any privileges in the init user namespace. Even if the mapping is the same across many different namespaces, capability checks are still done relative to a specific user namespace.

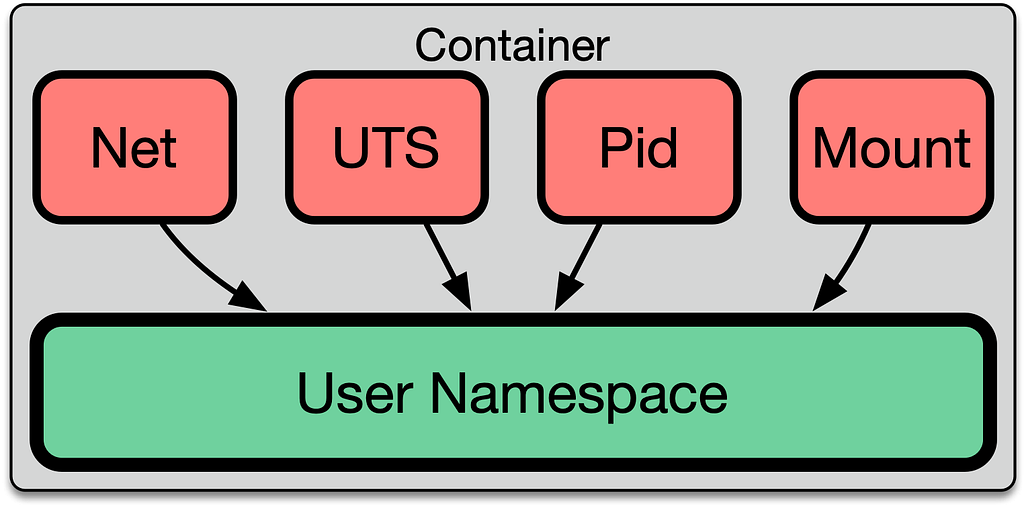
One critical aspect of understanding how permissions work is that every namespace belongs to a specific user namespace. For example, let’s look at the UTS namespace, which is responsible for controlling the hostname:

The namespace has a relationship with a particular user namespace. The ability for a user to manipulate the hostname is based on whether or not the process has the appropriate capability in that user namespace.
Let’s Get Into It

We can examine how the interaction of namespaces and users work ourselves. To set the hostname in the UTS namespace, you need to have CAP_SYS_ADMIN in its user namespace. We can see this in action here, where an unprivileged process doesn’t have permission to set the hostname:

The reason for this is that the process does not have CAP_SYS_ADMIN. According to /proc/self/status, the effective capability set of this process is empty:

Now, let’s try to set up a user namespace, and see what happens:

Immediately, you’ll notice the command prompt says the current user is root, and that the id command agrees. Can we set the hostname now?

We still cannot set the hostname. This is because the process is still in the initial UTS namespace. Let’s see if we can unshare the UTS namespace, and set the hostname:

This is now successful, and the process is in an isolated UTS namespace with the hostname “foo.” This is because the process now has all of the capabilities that a traditional root user would have, except they are relative to the new user namespace we created:

If we inspect this process from the outside, we can see that the process still runs as the unprivileged user, and the hostname in the original outside namespace hasn’t changed:

From here, we can do all sorts of things, like mount filesystems, create other new namespaces, and in fact, we can create an entire container environment. Notice how no privilege escalation mechanism was used to perform any of these actions. This approach is what some people refer to as “rootless containers.”

Road to Implementation

We began work to enable user namespaces in early 2017. At the time we had a naive model that was simpler. This simplicity was possible because we were running without user namespaces:
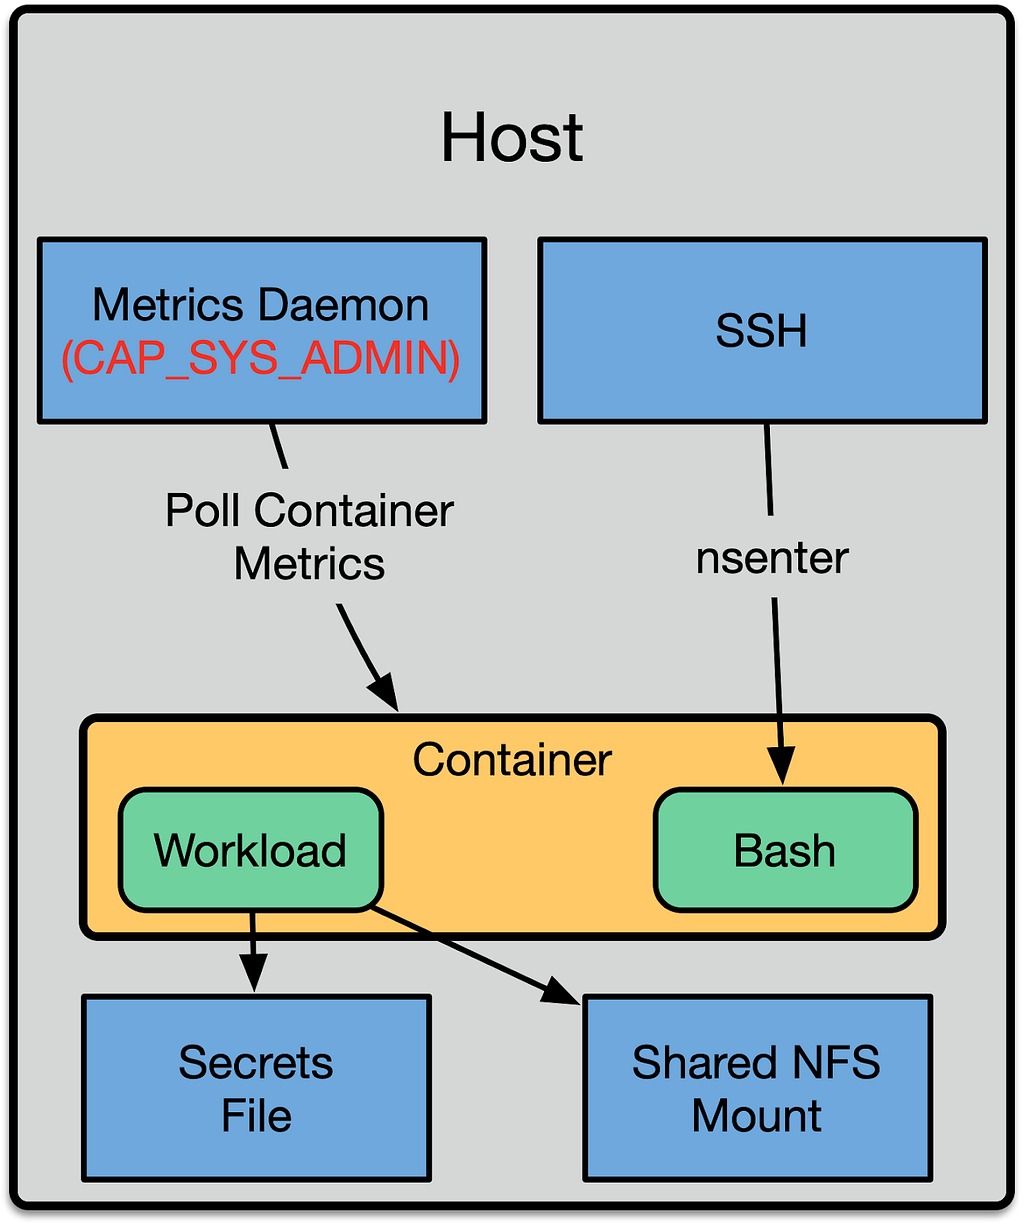
This approach mirrored the process layout and boundaries of contemporary container orchestration systems. We had a shared metrics daemon on the machine that reached in and polled metrics from the container. User access was done by exposing an SSH daemon, and automatically doing nsenter on the user’s behalf to drop them into the container. To expose files to the container we would use bind mounts. The same mechanism was used to expose configuration, such as secrets.

This had the benefit that much of our software could be installed in the host namespace, and only manage files in the that namespace. The container runtime management system (Titus) was then responsible for configuring Docker to expose the right files to the container via bind mounts. In addition to that, we could use our standard metrics daemons on the host.

Although this model was easy to reason about and write software for, it had several shortcomings that we addressed by shifting everything to running inside of the container’s unprivileged user namespace. The first shortcoming was that all of the host daemons now needed to be aware of the UID translation, and perform the proper setuid or chown calls to transition across the container boundary. Second, each of these transitions represented a security risk. If the SSH daemon only partially transitioned into the container namespace by changing into the container’s pid namespace, it would leave its /proc accessible. This could then be used by a malicious attacker to escape.

With user namespaces, we can improve our security posture and reduce the complexity of the system by running those daemons in the container’s unprivileged user namespace, which removes the need to cross the namespace boundaries. In turn, this removes the need to correctly implement a cross-namespace transition mechanism thus, reducing the risk of introducing container escapes.
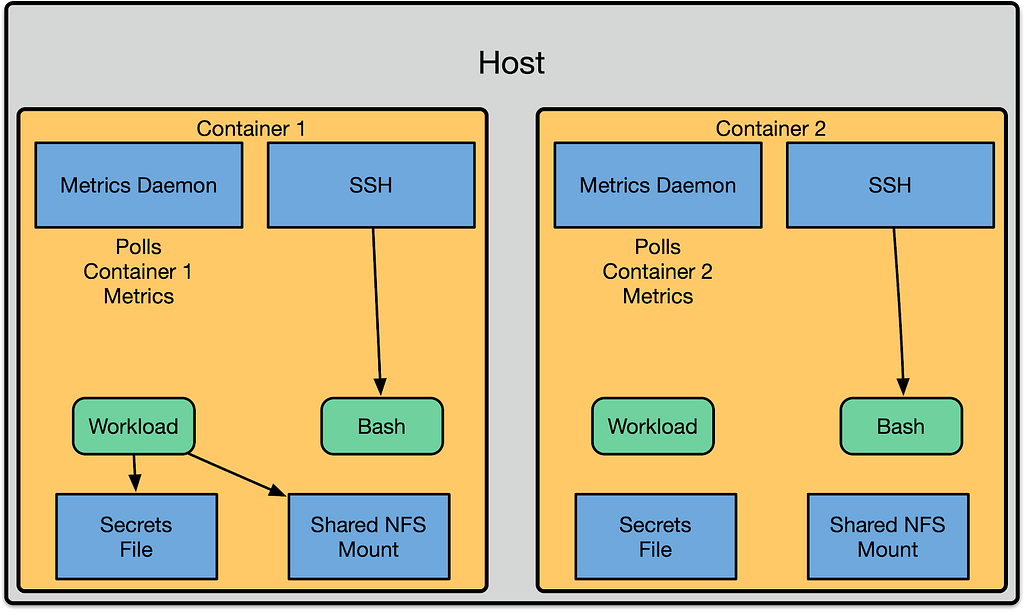
We did this by moving aspects of the container runtime environment into the container. For example, we run an SSH daemon per container and a metrics daemon per container. These run inside of the namespaces of the container, and they have the same capabilities and lifecycle as the workloads in the container. We call this model “System Services” — one can think of it as a primordial version of pods. By the end of 2018, we had moved all of our containers to run in unprivileged user namespaces successfully.

Why is this useful?

This may seem like another level of indirection that just introduces complexity, but instead, it allows us to leverage an extremely useful concept — “unprivileged containers.” In unprivileged containers, the root user starts from a baseline in which they don’t automatically have access to the entire system. This means that DAC, MAC, and seccomp policies are now an extra layer of defense against accessing privileged aspects of the system — not the only layer. As new privileges are added, we do not have to add them to an exclusion list. This allows our users to write software where they can control low-level system details in their own containers, rather than forcing all of the complexity up into the container runtime.

Use Case: FUSE

Netflix internally uses a purpose built FUSE filesystem called MezzFS. The purpose of this filesystem is to provide access to our content for a variety of encoding tools. Most of these encoding tools are designed to interact with the POSIX filesystem API. Our Media Cloud Engineering team wanted to leverage containers for a new platform they were building, called Archer. Archer, in turn, uses MezzFS, which needs FUSE, and at the time, FUSE required that the user have CAP_SYS_ADMIN in the initial user namespace. To accommodate the use case from our internal partner, we had to run them in a dedicated cluster where they could run privileged containers.

In 2017, we worked with our partner, Kinvolk, to have patches added to the Linux kernel that allowed users to safely use FUSE from non-init user namespaces. They were able to successfully upstream these patches, and we’ve been using them in production. From our user’s perspective, we were able to seamlessly move them into an unprivileged environment that was more secure. This simplified operations, as this workload was no longer considered exceptional, and could run alongside every other workload in the general node pool. In turn, this allowed the media encoding team access to a massive amount of compute capacity from the shared clusters, and better reliability due to the homogeneous nature of the deployment.

Use Case: Unintended Privileges

Many CVEs related to granting containers unintended privileges have been released in the past few years:

CVE-2020–15257: Privilege escalation in containerd

CVE-2019–5736: Privilege escalation via overwriting host runc binary

CVE-2018–10892: Access to /proc/acpi, allowing an attacker to modify hardware configuration

There will certainly be more vulnerabilities in the future, as is to be expected in any complex, quickly evolving system. We already use the default settings offered by Docker, such as AppArmor, and seccomp, but by adding user namespaces, we can achieve a superior defense-in-depth security model. These CVEs did not affect our infrastructure because we were using user namespaces for all of our containers. The attenuation of capabilities in the init user namespace performed as intended and stopped these attacks.

The Future

There are still many bits of the Kernel that are receiving support for user namespaces or enhancements making user namespaces easier to use. Much of the work left to do is focused on filesystems and container orchestration systems themselves. Some of these changes are slated for upcoming kernel releases. Work is being done to add unprivileged mounts to overlayfs allowing for nested container builds in a user namespace with layers. Future work is going on to make the Linux kernel VFS layer natively understand ID translation. This will make user namespaces with different ID mappings able to access the same underlying filesystem by shifting UIDs through a bind mount. Our partners at Kinvolk are also working on bringing user namespaces to Kubernetes.

Today, a variety of container runtimes support user namespaces. Docker can set up machine-wide UID mappings with separate user namespaces per container, as outlined in their docs. Any OCI compliant runtime such as Containerd / runc, Podman, and systemd-nspawn support user namespaces. Various container orchestration engines also support user namespaces via their underlying container runtimes, such as Nomad and Docker Swarm.

As part of our move to Kubernetes, Netflix has been working with Kinvolk on getting user namespaces to work under Kubernetes. You can follow this work via the KEP discussion here, and Kinvolk has more information about running user namespaces under Kubernetes on their blog. We look forward to evolving container security together with the Kubernetes community.


Evolving Container Security With Linux User Namespaces was originally published in Netflix TechBlog on Medium, where people are continuing the conversation by highlighting and responding to this story.


Getting to the Core: Benchmarking Cloudflare’s Latest Server Hardware

Post Syndicated from Brian Bassett original https://blog.cloudflare.com/getting-to-the-core/

Getting to the Core: Benchmarking Cloudflare’s Latest Server Hardware

Getting to the Core: Benchmarking Cloudflare’s Latest Server Hardware

Maintaining a server fleet the size of Cloudflare’s is an operational challenge, to say the least. Anything we can do to lower complexity and improve efficiency has effects for our SRE (Site Reliability Engineer) and Data Center teams that can be felt throughout a server’s 4+ year lifespan.

At the Cloudflare Core, we process logs to analyze attacks and compute analytics. In 2020, our Core servers were in need of a refresh, so we decided to redesign the hardware to be more in line with our Gen X edge servers. We designed two major server variants for the core. The first is Core Compute 2020, an AMD-based server for analytics and general-purpose compute paired with solid-state storage drives. The second is Core Storage 2020, an Intel-based server with twelve spinning disks to run database workloads.

Core Compute 2020

Earlier this year, we blogged about our 10th generation edge servers or Gen X and the improvements they delivered to our edge in both performance and security. The new Core Compute 2020 server leverages many of our learnings from the edge server. The Core Compute servers run a variety of workloads including Kubernetes, Kafka, and various smaller services.

Configuration Changes (Kubernetes)

Previous Generation Compute Core Compute 2020
CPU 2 x Intel Xeon Gold 6262 1 x AMD EPYC 7642
Total Core / Thread Count 48C / 96T 48C / 96T
Base / Turbo Frequency 1.9 / 3.6 GHz 2.3 / 3.3 GHz
Memory 8 x 32GB DDR4-2666 8 x 32GB DDR4-2933
Storage 6 x 480GB SATA SSD 2 x 3.84TB NVMe SSD
Network Mellanox CX4 Lx 2 x 25GbE Mellanox CX4 Lx 2 x 25GbE

Configuration Changes (Kafka)

Previous Generation (Kafka) Core Compute 2020
CPU 2 x Intel Xeon Silver 4116 1 x AMD EPYC 7642
Total Core / Thread Count 24C / 48T 48C / 96T
Base / Turbo Frequency 2.1 / 3.0 GHz 2.3 / 3.3 GHz
Memory 6 x 32GB DDR4-2400 8 x 32GB DDR4-2933
Storage 12 x 1.92TB SATA SSD 10 x 3.84TB NVMe SSD
Network Mellanox CX4 Lx 2 x 25GbE Mellanox CX4 Lx 2 x 25GbE

Both previous generation servers were Intel-based platforms, with the Kubernetes server based on Xeon 6262 processors, and the Kafka server based on Xeon 4116 processors. One goal with these refreshed versions was to converge the configurations in order to simplify spare parts and firmware management across the fleet.

As the above tables show, the configurations have been converged with the only difference being the number of NVMe drives installed depending on the workload running on the host. In both cases we moved from a dual-socket configuration to a single-socket configuration, and the number of cores and threads per server either increased or stayed the same. In all cases, the base frequency of those cores was significantly improved. We also moved from SATA SSDs to NVMe SSDs.

Core Compute 2020 Synthetic Benchmarking

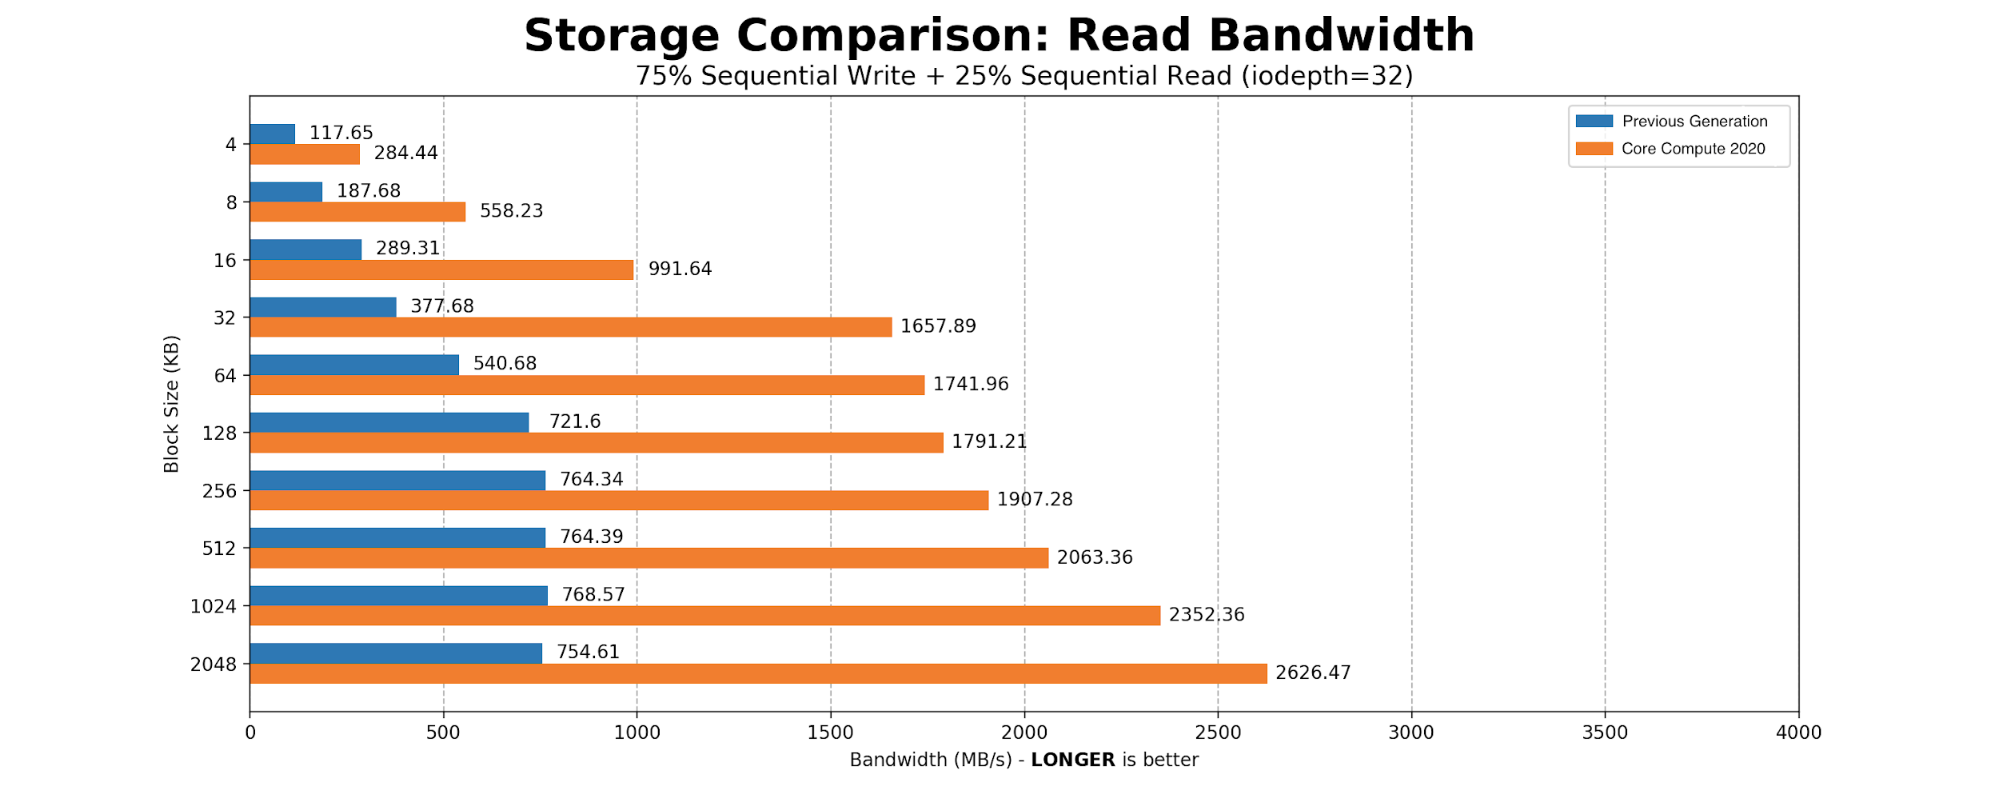
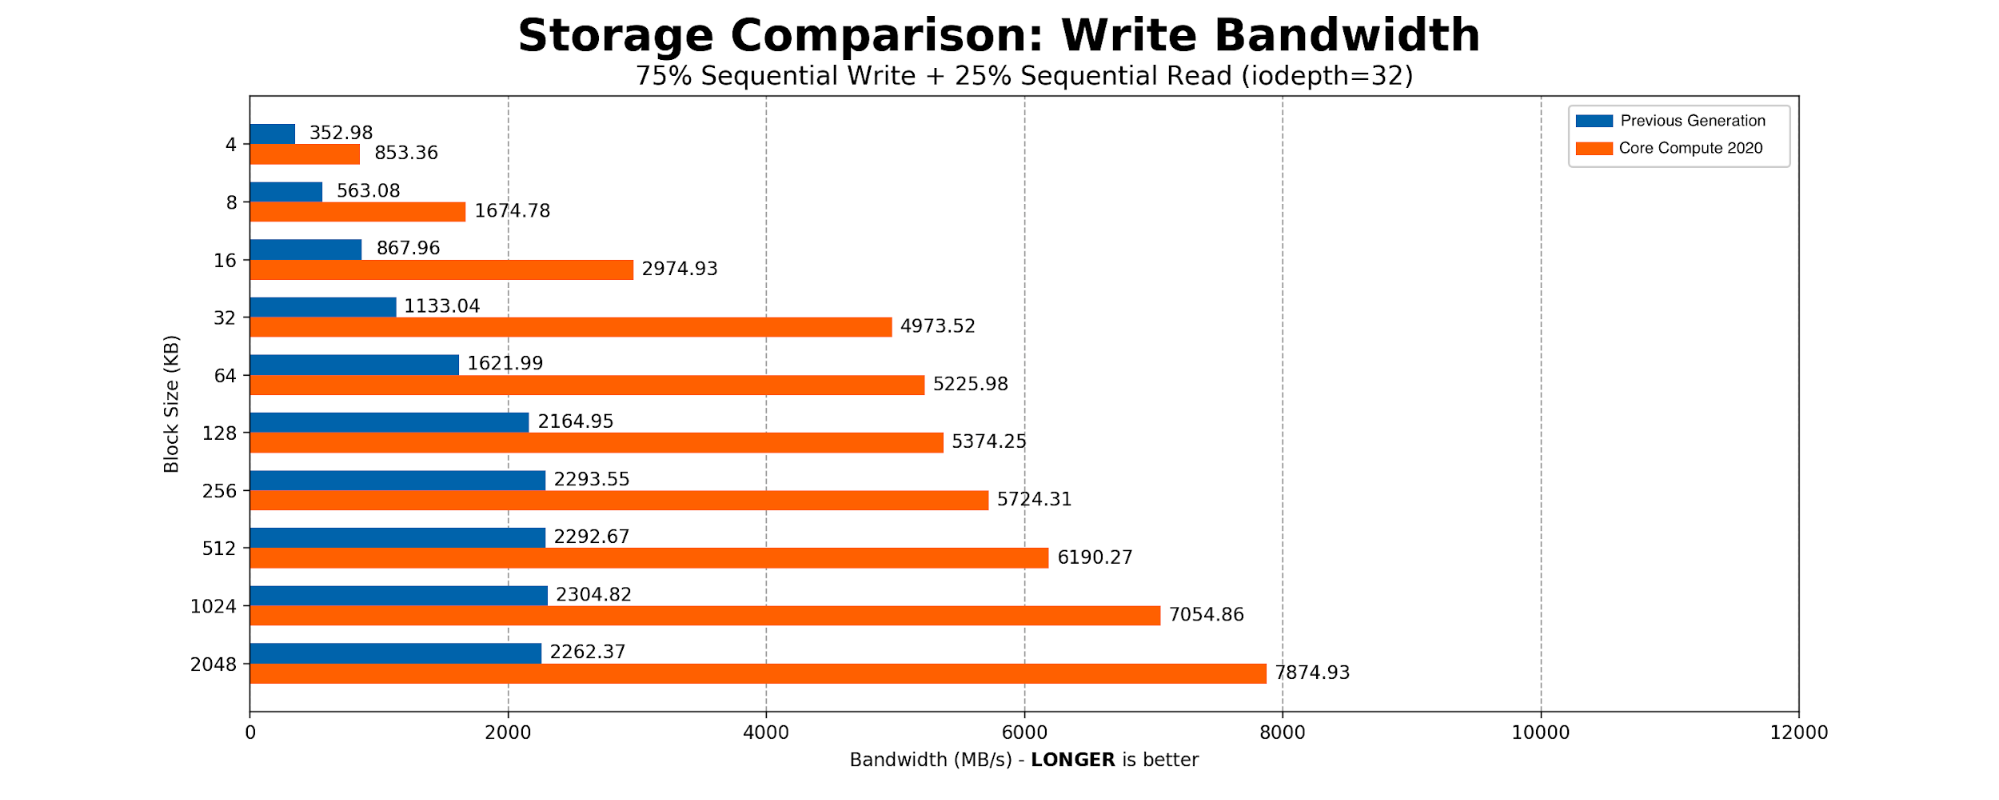
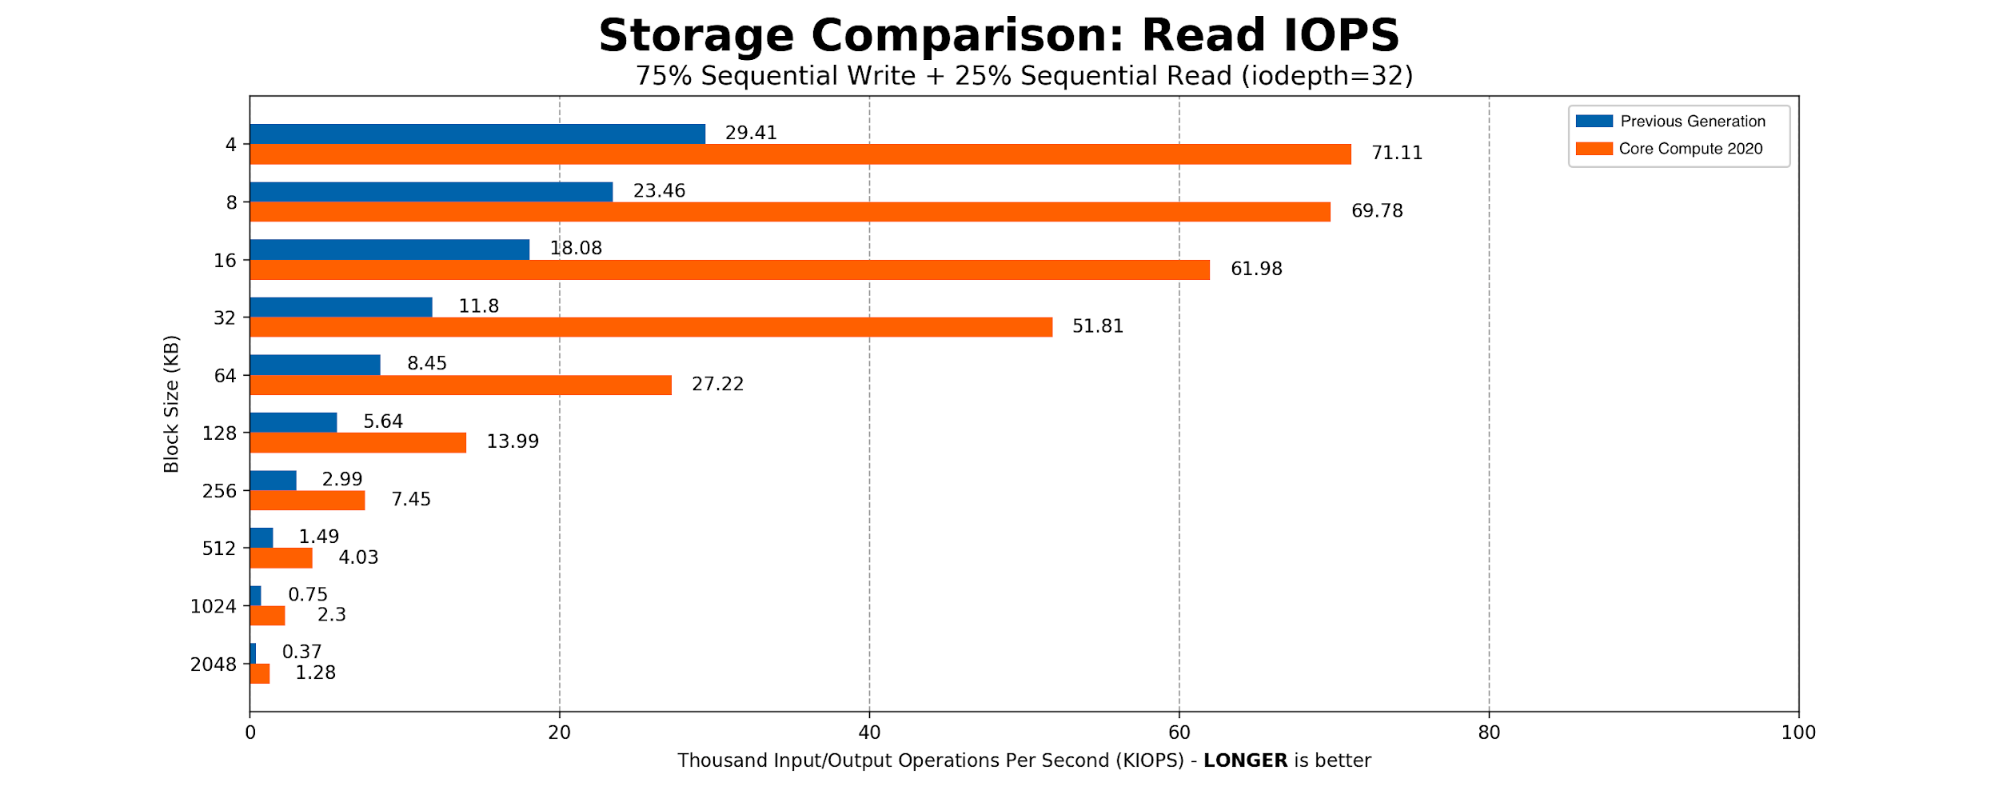
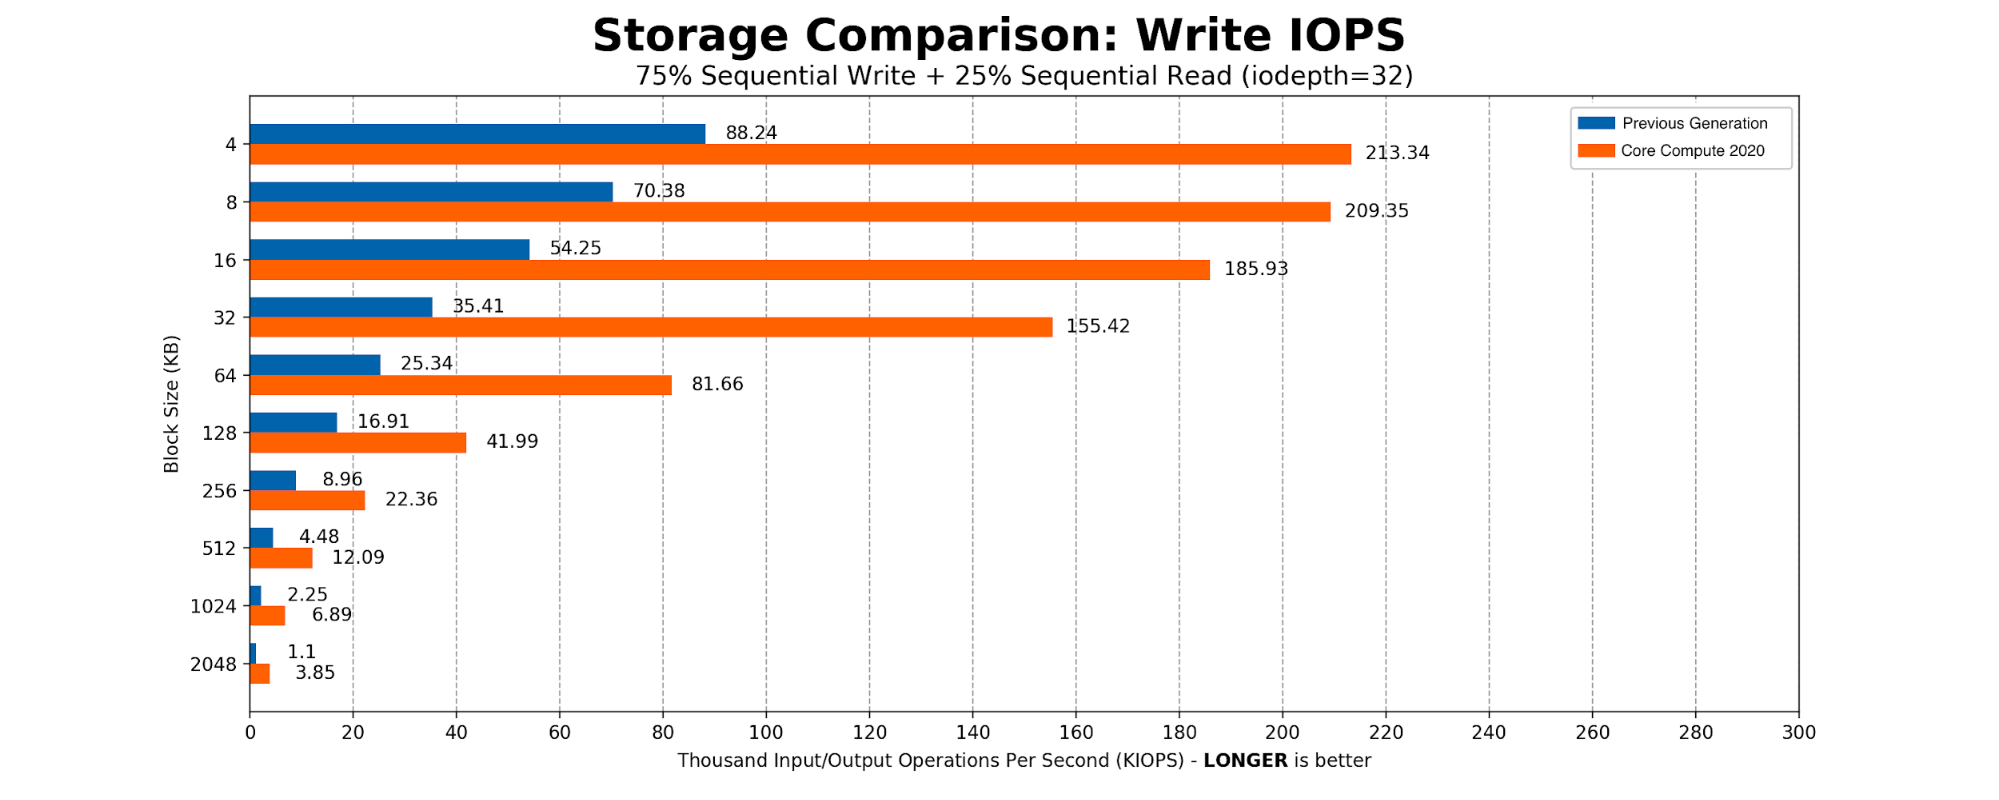
The heaviest user of the SSDs was determined to be Kafka. The majority of the time Kafka is sequentially writing 2MB blocks to the disk. We created a simple FIO script with 75% sequential write and 25% sequential read, scaling the block size from a standard page table entry size of 4096KB to Kafka’s write size of 2MB. The results aligned with what we expected from an NVMe-based drive.

Getting to the Core: Benchmarking Cloudflare’s Latest Server Hardware

Core Compute 2020 Production Benchmarking

Cloudflare runs many of our Core Compute services in Kubernetes containers, some of which are multi-core. By transitioning to a single socket, problems associated with dual sockets were eliminated, and we are guaranteed to have all cores allocated for any given container on the same socket.

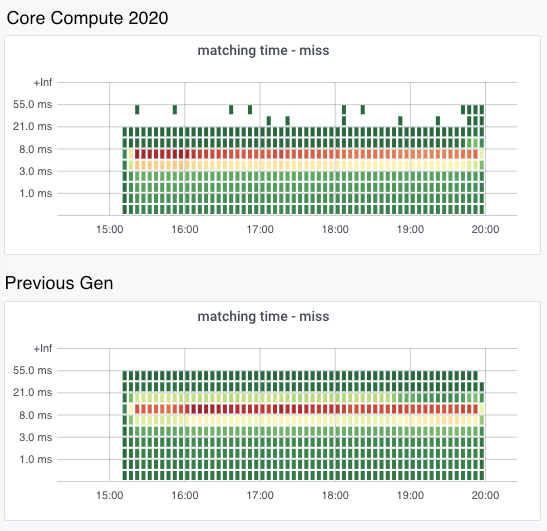
Another heavy workload that is constantly running on Compute hosts is the Cloudflare CSAM Scanning Tool. Our Systems Engineering team isolated a Compute 2020 compute host and the previous generation compute host, had them run just this workload, and measured the time to compare the fuzzy hashes for images to the NCMEC hash lists and verify that they are a “miss”.

Because the CSAM Scanning Tool is very compute intensive we specifically isolated it to take a look at its performance with the new hardware. We’ve spent a great deal of effort on software optimization and improved algorithms for this tool but investing in faster, better hardware is also important.

In these heatmaps, the X axis represents time, and the Y axis represents “buckets” of time taken to verify that it is not a match to one of the NCMEC hash lists. For a given time slice in the heatmap, the red point is the bucket with the most times measured, the yellow point the second most, and the green points the least. The red points on the Compute 2020 graph are all in the 5 to 8 millisecond bucket, while the red points on the previous Gen heatmap are all in the 8 to 13 millisecond bucket, which shows that on average, the Compute 2020 host is verifying hashes significantly faster.

Getting to the Core: Benchmarking Cloudflare’s Latest Server Hardware

Core Storage 2020

Another major workload we identified was ClickHouse, which performs analytics over large datasets. The last time we upgraded our servers running ClickHouse was back in 2018.

Configuration Changes

Previous Generation Core Storage 2020
CPU 2 x Intel Xeon E5-2630 v4 1 x Intel Xeon Gold 6210U
Total Core / Thread Count 20C / 40T 20C / 40T
Base / Turbo Frequency 2.2 / 3.1 GHz 2.5 / 3.9 GHz
Memory 8 x 32GB DDR4-2400 8 x 32GB DDR4-2933
Storage 12 x 10TB 7200 RPM 3.5” SATA 12 x 10TB 7200 RPM 3.5” SATA
Network Mellanox CX4 Lx 2 x 25GbE Mellanox CX4 Lx 2 x 25GbE

CPU Changes

For ClickHouse, we use a 1U chassis with 12 x 10TB 3.5” hard drives. At the time we were designing Core Storage 2020 our server vendor did not yet have an AMD version of this chassis, so we remained on Intel. However, we moved Core Storage 2020 to a single 20 core / 40 thread Xeon processor, rather than the previous generation’s dual-socket 10 core / 20 thread processors. By moving to the single-socket Xeon 6210U processor, we were able to keep the same core count, but gained 17% higher base frequency and 26% higher max turbo frequency. Meanwhile, the total CPU thermal design profile (TDP), which is an approximation of the maximum power the CPU can draw, went down from 165W to 150W.

On a dual-socket server, remote memory accesses, which are memory accesses by a process on socket 0 to memory attached to socket 1, incur a latency penalty, as seen in this table:

Previous Generation Core Storage 2020
Memory latency, socket 0 to socket 0 81.3 ns 86.9 ns
Memory latency, socket 0 to socket 1 142.6 ns N/A

An additional advantage of having a CPU with all 20 cores on the same socket is the elimination of these remote memory accesses, which take 76% longer than local memory accesses.

Memory Changes

The memory in the Core Storage 2020 host is rated for operation at 2933 MHz; however, in the 8 x 32GB configuration we need on these hosts, the Intel Xeon 6210U processor clocks them at 2666 MH. Compared to the previous generation, this gives us a 13% boost in memory speed. While we would get a slightly higher clock speed with a balanced, 6 DIMMs configuration, we determined that we are willing to sacrifice the slightly higher clock speed in order to have the additional RAM capacity provided by the 8 x 32GB configuration.

Storage Changes

Data capacity stayed the same, with 12 x 10TB SATA drives in RAID 0 configuration for best  throughput. Unlike the previous generation, the drives in the Core Storage 2020 host are helium filled. Helium produces less drag than air, resulting in potentially lower latency.

Core Storage 2020 Synthetic benchmarking

We performed synthetic four corners benchmarking: IOPS measurements of random reads and writes using 4k block size, and bandwidth measurements of sequential reads and writes using 128k block size. We used the fio tool to see what improvements we would get in a lab environment. The results show a 10% latency improvement and 11% IOPS improvement in random read performance. Random write testing shows 38% lower latency and 60% higher IOPS. Write throughput is improved by 23%, and read throughput is improved by a whopping 90%.

Previous Generation Core Storage 2020 % Improvement
4k Random Reads (IOPS) 3,384 3,758 11.0%
4k Random Read Mean Latency (ms, lower is better) 75.4 67.8 10.1% lower
4k Random Writes (IOPS) 4,009 6,397 59.6%
4k Random Write Mean Latency (ms, lower is better) 63.5 39.7 37.5% lower
128k Sequential Reads (MB/s) 1,155 2,195 90.0%
128k Sequential Writes (MB/s) 1,265 1,558 23.2%

CPU frequencies

The higher base and turbo frequencies of the Core Storage 2020 host’s Xeon 6210U processor allowed that processor to achieve higher average frequencies while running our production ClickHouse workload. A recent snapshot of two production hosts showed the Core Storage 2020 host being able to sustain an average of 31% higher CPU frequency while running ClickHouse.

Previous generation (average core frequency) Core Storage 2020 (average core frequency) % improvement
Mean Core Frequency 2441 MHz 3199 MHz 31%

Core Storage 2020 Production benchmarking

Our ClickHouse database hosts are continually performing merge operations to optimize the database data structures. Each individual merge operation takes just a few seconds on average, but since they’re constantly running, they can consume significant resources on the host. We sampled the average merge time every five minutes over seven days, and then sampled the data to find the average, minimum, and maximum merge times reported by a Compute 2020 host and by a previous generation host. Results are summarized below.

ClickHouse merge operation performance improvement
(time in seconds, lower is better)

Time Previous generation Core Storage 2020 % improvement
Mean time to merge 1.83 1.15 37% lower
Maximum merge time 3.51 2.35 33% lower
Minimum merge time 0.68 0.32 53% lower

Our lab-measured CPU frequency and storage performance improvements on Core Storage 2020 have translated into significantly reduced times to perform this database operation.

Conclusion

With our Core 2020 servers, we were able to realize significant performance improvements, both in synthetic benchmarking outside production and in the production workloads we tested. This will allow Cloudflare to run the same workloads on fewer servers, saving CapEx costs and data center rack space. The similarity of the configuration of the Kubernetes and Kafka hosts should help with fleet management and spare parts management. For our next redesign, we will try to further converge the designs on which we run the major Core workloads to further improve efficiency.

Special thanks to Will Buckner and Chris Snook for their help in the development of these servers, and to Tim Bart for validating CSAM Scanning Tool’s performance on Compute.

Automated Origin CA for Kubernetes

Post Syndicated from Terin Stock original https://blog.cloudflare.com/automated-origin-ca-for-kubernetes/

Automated Origin CA for Kubernetes

Automated Origin CA for Kubernetes

In 2016, we launched the Cloudflare Origin CA, a certificate authority optimized for making it easy to secure the connection between Cloudflare and an origin server. Running our own CA has allowed us to support fast issuance and renewal, simple and effective revocation, and wildcard certificates for our users.

Out of the box, managing TLS certificates and keys within Kubernetes can be challenging and error prone. The secret resources have to be constructed correctly, as components expect secrets with specific fields. Some forms of domain verification require manually rotating secrets to pass. Once you’re successful, don’t forget to renew before the certificate expires!

cert-manager is a project to fill this operational gap, providing Kubernetes resources that manage the lifecycle of a certificate. Today we’re releasing origin-ca-issuer, an extension to cert-manager integrating with Cloudflare Origin CA to easily create and renew certificates for your account’s domains.

Origin CA Integration

Creating an Issuer

After installing cert-manager and origin-ca-issuer, you can create an OriginIssuer resource. This resource creates a binding between cert-manager and the Cloudflare API for an account. Different issuers may be connected to different Cloudflare accounts in the same Kubernetes cluster.

apiVersion: cert-manager.k8s.cloudflare.com/v1
kind: OriginIssuer
metadata:
  name: prod-issuer
  namespace: default
spec:
  signatureType: OriginECC
  auth:
    serviceKeyRef:
      name: service-key
      key: key
      ```

This creates a new OriginIssuer named “prod-issuer” that issues certificates using ECDSA signatures, and the secret “service-key” in the same namespace is used to authenticate to the Cloudflare API.

Signing an Origin CA Certificate

After creating an OriginIssuer, we can now create a Certificate with cert-manager. This defines the domains, including wildcards, that the certificate should be issued for, how long the certificate should be valid, and when cert-manager should renew the certificate.

apiVersion: cert-manager.io/v1
kind: Certificate
metadata:
  name: example-com
  namespace: default
spec:
  # The secret name where cert-manager
  # should store the signed certificate.
  secretName: example-com-tls
  dnsNames:
    - example.com
  # Duration of the certificate.
  duration: 168h
  # Renew a day before the certificate expiration.
  renewBefore: 24h
  # Reference the Origin CA Issuer you created above,
  # which must be in the same namespace.
  issuerRef:
    group: cert-manager.k8s.cloudflare.com
    kind: OriginIssuer
    name: prod-issuer

Once created, cert-manager begins managing the lifecycle of this certificate, including creating the key material, crafting a certificate signature request (CSR), and constructing a certificate request that will be processed by the origin-ca-issuer.

When signed by the Cloudflare API, the certificate will be made available, along with the private key, in the Kubernetes secret specified within the secretName field. You’ll be able to use this certificate on servers proxied behind Cloudflare.

Extra: Ingress Support

If you’re using an Ingress controller, you can use cert-manager’s Ingress support to automatically manage Certificate resources based on your Ingress resource.

apiVersion: networking/v1
kind: Ingress
metadata:
  annotations:
    cert-manager.io/issuer: prod-issuer
    cert-manager.io/issuer-kind: OriginIssuer
    cert-manager.io/issuer-group: cert-manager.k8s.cloudflare.com
  name: example
  namespace: default
spec:
  rules:
    - host: example.com
      http:
        paths:
          - backend:
              serviceName: examplesvc
              servicePort: 80
            path: /
  tls:
    # specifying a host in the TLS section will tell cert-manager 
    # what DNS SANs should be on the created certificate.
    - hosts:
        - example.com
      # cert-manager will create this secret
      secretName: example-tls

Building an External cert-manager Issuer

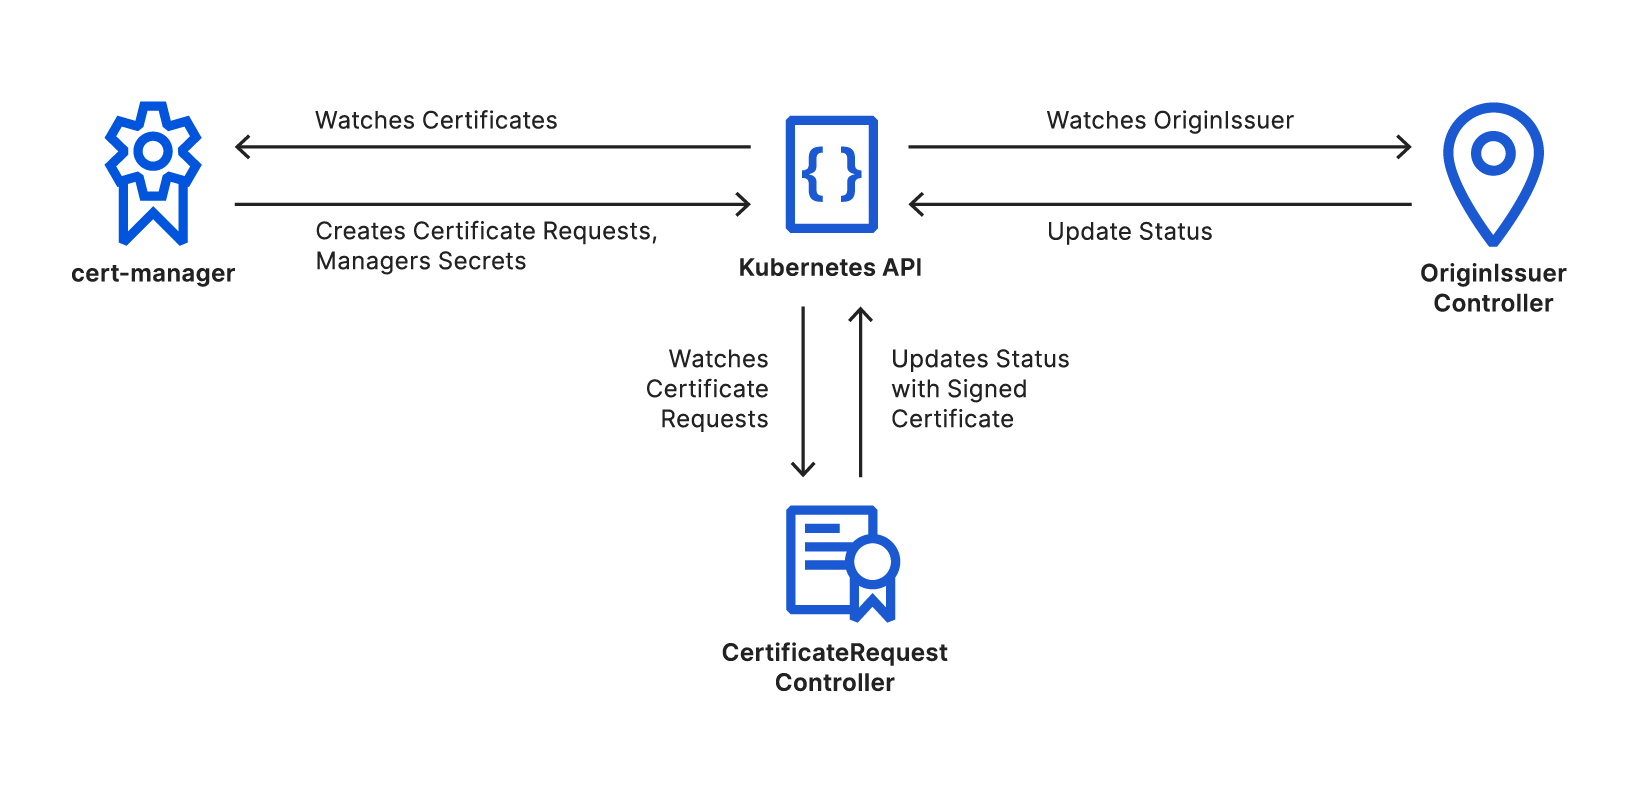
An external cert-manager issuer is a specialized Kubernetes controller. There’s no direct communication between cert-manager and external issuers at all; this means that you can use any existing tools and best practices for developing controllers to develop an external issuer.

We’ve decided to use the excellent controller-runtime project to build origin-ca-issuer, running two reconciliation controllers.

Automated Origin CA for Kubernetes

OriginIssuer Controller

The OriginIssuer controller watches for creation and modification of OriginIssuer custom resources. The controllers create a Cloudflare API client using the details and credentials referenced. This client API instance will later be used to sign certificates through the API. The controller will periodically retry to create an API client; once it is successful, it updates the OriginIssuer’s status to be ready.

CertificateRequest Controller

The CertificateRequest controller watches for the creation and modification of cert-manager’s CertificateRequest resources. These resources are created automatically by cert-manager as needed during a certificate’s lifecycle.

The controller looks for Certificate Requests that reference a known OriginIssuer, this reference is copied by cert-manager from the origin Certificate resource, and ignores all resources that do not match. The controller then verifies the OriginIssuer is in the ready state, before transforming the certificate request into an API request using the previously created clients.

On a successful response, the signed certificate is added to the certificate request, and which cert-manager will use to create or update the secret resource. On an unsuccessful request, the controller will periodically retry.

Learn More

Up-to-date documentation and complete installation instructions can be found in our GitHub repository. Feedback and contributions are greatly appreciated. If you’re interested in Kubernetes at Cloudflare, including building controllers like these, we’re hiring.

Register for the Modern Applications Online Event

Post Syndicated from Rachel Richardson original https://aws.amazon.com/blogs/compute/register-for-the-modern-applications-online-event/

Earlier this year we hosted the first serverless themed virtual event, the Serverless-First Function. We enjoyed the opportunity to virtually connect with our customers so much that we want to do it again. This time, we’re expanding the scope to feature serverless, containers, and front-end development content. The Modern Applications Online Event is scheduled for November 4-5, 2020.

This free, two-day event addresses how to build and operate modern applications at scale across your organization, enabling you to become more agile and respond to change faster. The event covers topics including serverless application development, containers best practices, front-end web development and more. If you missed the containers or serverless virtual events earlier this year, this is great opportunity to watch the content and interact directly with expert moderators. The full agenda is listed below.

Register now

Organizational Level Operations

Wednesday, November 4, 2020, 9:00 AM – 1:00 PM PT

Move fast and ship things: Using serverless to increase speed and agility within your organization
In this session, Adrian Cockcroft demonstrates how you can use serverless to build modern applications faster than ever. Cockcroft uses real-life examples and customer stories to debunk common misconceptions about serverless.

Eliminating busywork at the organizational level: Tips for using serverless to its fullest potential 
In this session, David Yanacek discusses key ways to unlock the full benefits of serverless, including building services around APIs and using service-oriented architectures built on serverless systems to remove the roadblocks to continuous innovation.

Faster Mobile and Web App Development with AWS Amplify
In this session, Brice Pellé, introduces AWS Amplify, a set of tools and services that enables mobile and front-end web developers to build full stack serverless applications faster on AWS. Learn how to accelerate development with AWS Amplify’s use-case centric open-source libraries and CLI, and its fully managed web hosting service with built-in CI/CD.

Built Serverless-First: How Workgrid Software transformed from a Liberty Mutual project to its own global startup
Connected through a central IT team, Liberty Mutual has embraced serverless since AWS Lambda’s inception in 2014. In this session, Gillian McCann discusses Workgrid’s serverless journey—from internal microservices project within Liberty Mutual to independent business entity, all built serverless-first. Introduction by AWS Principal Serverless SA, Sam Dengler.

Market insights: A conversation with Forrester analyst Jeffrey Hammond & Director of Product for Lambda Ajay Nair
In this session, guest speaker Jeffrey Hammond and Director of Product for AWS Lambda, Ajay Nair, discuss the state of serverless, Lambda-based architectural approaches, Functions-as-a-Service platforms, and more. You’ll learn about the high-level and enduring enterprise patterns and advancements that analysts see driving the market today and determining the market in the future.

AWS Fargate Platform Version 1.4
In this session we will go through a brief introduction of AWS Fargate, what it is, its relation to EKS and ECS and the problems it addresses for customers. We will later introduce the concept of Fargate “platform versions” and we will then dive deeper into the new features that the new platform version 1.4 enables.

Persistent Storage on Containers
Containerizing applications that require data persistence or shared storage is often challenging since containers are ephemeral in nature, are scaled in and out dynamically, and typically clear any saved state when terminated. In this session you will learn about Amazon Elastic File System (EFS), a fully managed, elastic, highly-available, scalable, secure, high-performance, cloud native, shared file system that enables data to be persisted separately from compute for your containerized applications.

Security Best Practices on Amazon ECR
In this session, we will cover best practices with securing your container images using ECR. Learn how user access controls, image assurance, and image scanning contribute to securing your images.

Application Level Design

Thursday, November 5, 2020, 9:00 AM – 1:00 PM PT

Building a Live Streaming Platform with Amplify Video
In this session, learn how to build a live-streaming platform using Amplify Video and the platform powering it, AWS Elemental Live. Amplify video is an open source plugin for the Amplify CLI that makes it easy to incorporate video streaming into your mobile and web applications powered by AWS Amplify.

Building Serverless Web Applications
In this session, follow along as Ben Smith shows you how to build and deploy a completely serverless web application from scratch. The application will span from a mobile friendly front end to complex business logic on the back end.

Automating serverless application development workflows
In this talk, Eric Johnson breaks down how to think about CI/CD when building serverless applications with AWS Lambda and Amazon API Gateway. This session will cover using technologies like AWS SAM to build CI/CD pipelines for serverless application back ends.

Observability for your serverless applications
In this session, Julian Wood walks you through how to add monitoring, logging, and distributed tracing to your serverless applications. Join us to learn how to track platform and business metrics, visualize the performance and operations of your application, and understand which services should be optimized to improve your customer’s experience.

Happy Building with AWS Copilot
The hard part’s done. You and your team have spent weeks pouring over pull requests, building micro-services and containerizing them. Congrats! But what do you do now? How do you get those services on AWS? Copilot is a new command line tool that makes building, developing and operating containerized apps on AWS a breeze. In this session, we’ll talk about how Copilot helps you and your team set up modern applications that follow AWS best practices

CDK for Kubernetes
The CDK for Kubernetes (cdk8s) is a new open-source software development framework for defining Kubernetes applications and resources using familiar programming languages. Applications running on Kubernetes are composed of dozens of resources maintained through carefully maintained YAML files. As applications evolve and teams grow, these YAML files become harder and harder to manage. It’s also really hard to reuse and create abstractions through config files — copying & pasting from previous projects is not the solution! In this webinar, the creators of cdk8s show you how to define your first cdk8s application, define reusable components called “constructs” and generally say goodbye (and thank you very much) to writing in YAML.

Machine Learning on Amazon EKS
Amazon EKS has quickly emerged as a leading choice for machine learning workloads. In this session, we’ll walk through some of the recent ML related enhancements the Kubernetes team at AWS has released. We will then dive deep with walkthroughs of how to optimize your machine learning workloads on Amazon EKS, including demos of the latest features we’ve contributed to popular open source projects like Spark and Kubeflow

Deep Dive on Amazon ECS Capacity Providers
In this talk, we’ll dive into the different ways that ECS Capacity Providers can enable teams to focus more on their core business, and less on the infrastructure behind the scenes. We’ll look at the benefits and discuss scenarios where Capacity Providers can help solve the problems that customers face when using container orchestration. Lastly, we’ll review what features have been released with Capacity Providers, as well as look ahead at what’s to come.

Register now

Optimally scaling Kafka consumer applications

Post Syndicated from Grab Tech original https://engineering.grab.com/optimally-scaling-kafka-consumer-applications

Earlier this year, we took you on a journey on how we built and deployed our event sourcing and stream processing framework at Grab. We’re happy to share that we’re able to reliably maintain our uptime and continue to service close to 400 billion events a week. We haven’t stopped there though. To ensure that we can scale our framework as the Grab business continuously grows, we have spent efforts optimizing our infrastructure.

In this article, we will dive deeper into our Kubernetes infrastructure setup for our stream processing framework. We will cover why and how we focus on optimal scalability and availability of our infrastructure.

Quick Architecture Recap

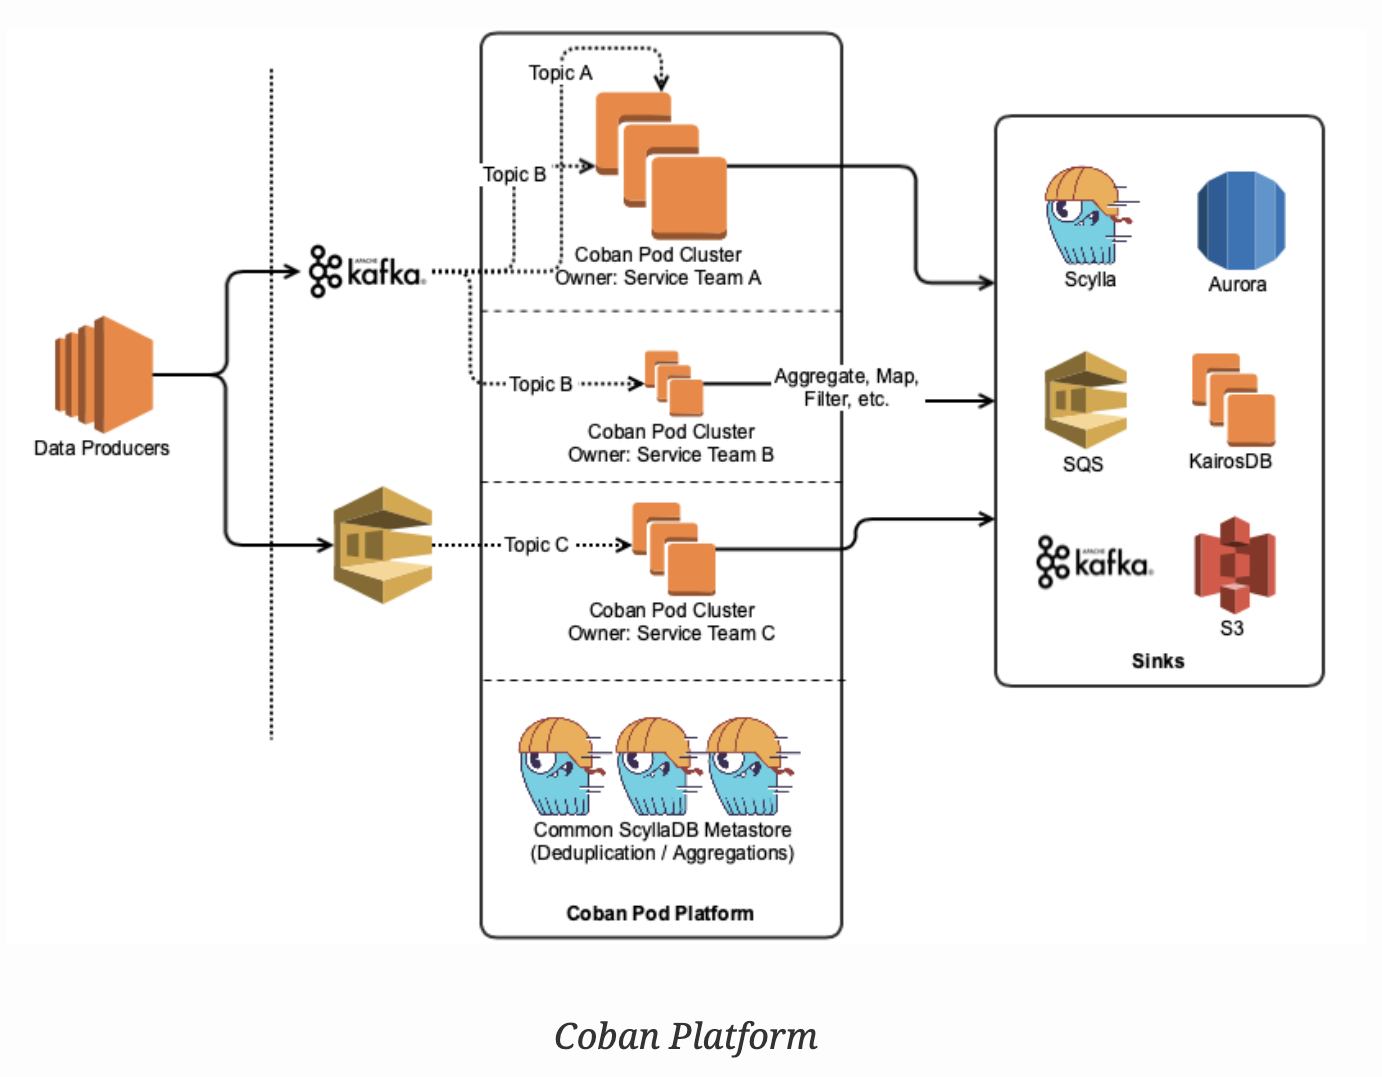
Coban Platform Architecture

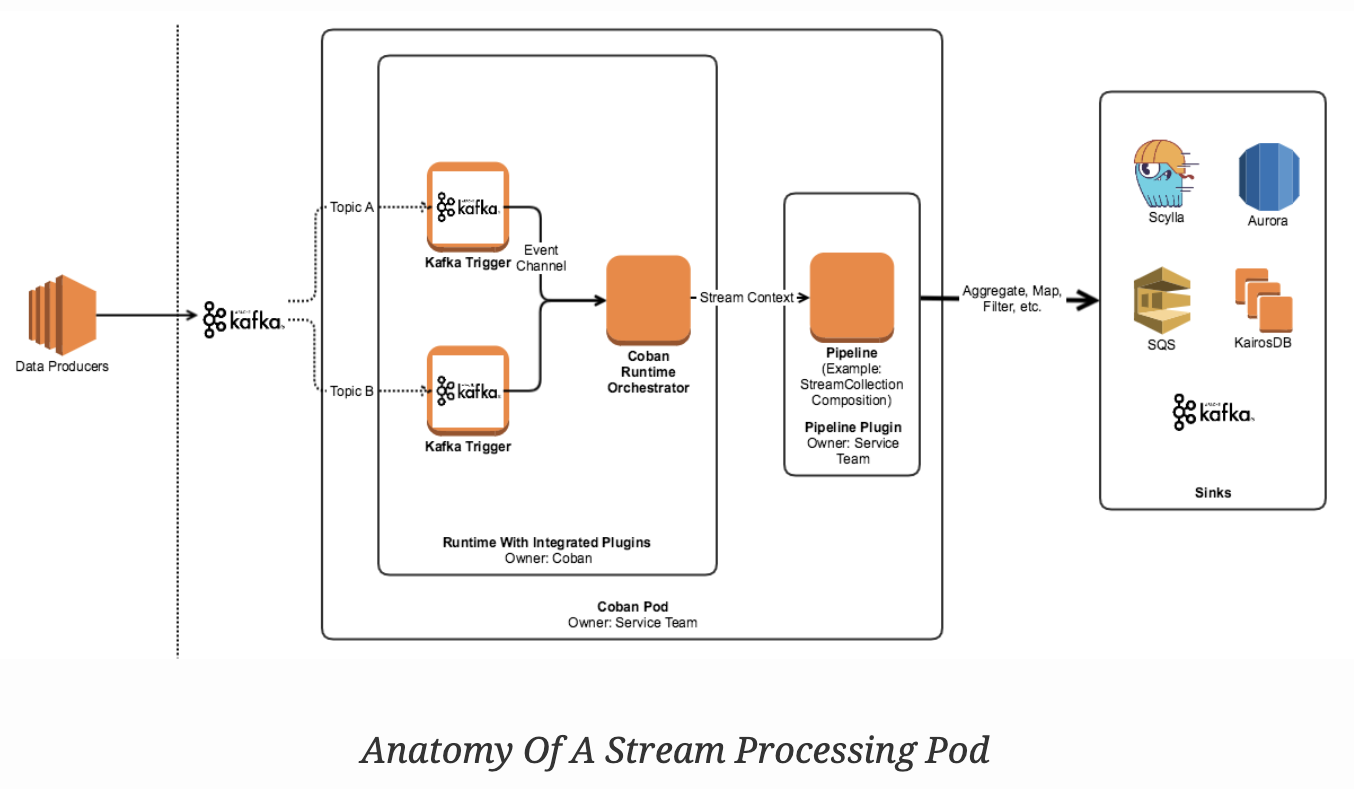
The Coban platform provides lightweight Golang plugin architecture-based data processing pipelines running in Kubernetes. These are essentially Kafka consumer pods that consume data, process it, and then materialize the results into various sinks (RDMS, other Kafka topics).

Anatomy of a Processing Pod

Anatomy of a Processing Pod

Each stream processing pod (the smallest unit of a pipeline’s deployment) has three top level components:

  • Trigger: An interface that connects directly to the source of the data and converts it into an event channel.
  • Runtime: This is the app’s entry point and the orchestrator of the pod. It manages the worker pools, triggers, event channels, and lifecycle events.
  • Pipeline plugin: This is provided by the user, and conforms to a contract that the platform team publishes. It contains the domain logic for the pipeline and houses the pipeline orchestration defined by a user based on our Stream Processing Framework.

Optimal Scaling

We initially architected our Kubernetes setup around horizontal pod autoscaling (HPA), which scales the number of pods per deployment based on CPU and memory usage. HPA keeps CPU and memory per pod specified in the deployment manifest and scales horizontally as the load changes.

These were the areas of application wastage we observed on our platform:

  • As Grab’s traffic is uneven, we’d always have to provision for peak traffic. As users would not (or could not) always account for ramps, they would be fairly liberal with setting limit values (CPU and memory), leading to resource wastage.
  • Pods often had uneven traffic distribution despite fairly even partition load distribution in Kafka. The Stream Processing Framework(SPF) is essentially Kafka consumers consuming from Kafka topics, hence the number of pods scaling in and out resulted in unequal partition load per pod.

Vertically Scaling with Fixed Number of Pods

We initially kept the number of pods for a pipeline equal to the number of partitions in the topic the pipeline consumes from. This ensured even distribution of partitions to each pod providing balanced consumption. In order to abstract this from the end user, we automated the application deployment process to directly call the Kafka API to fetch the number of partitions during runtime.

After achieving a fixed number of pods for the pipeline, we wanted to move away from HPA. We wanted our pods to scale up and down as the load increases or decreases without any manual intervention. Vertical pod autoscaling (VPA) solves this problem as it relieves us from any manual operation for setting up resources for our deployment.

We just deploy the application and let VPA handle the resources required for its operation. It’s known to not be very susceptible to quick load changes as it trains its model to monitor the deployment’s load trend over a period of time before recommending an optimal resource. This process ensures the optimal resource allocation for our pipelines considering the historic trends on throughput.

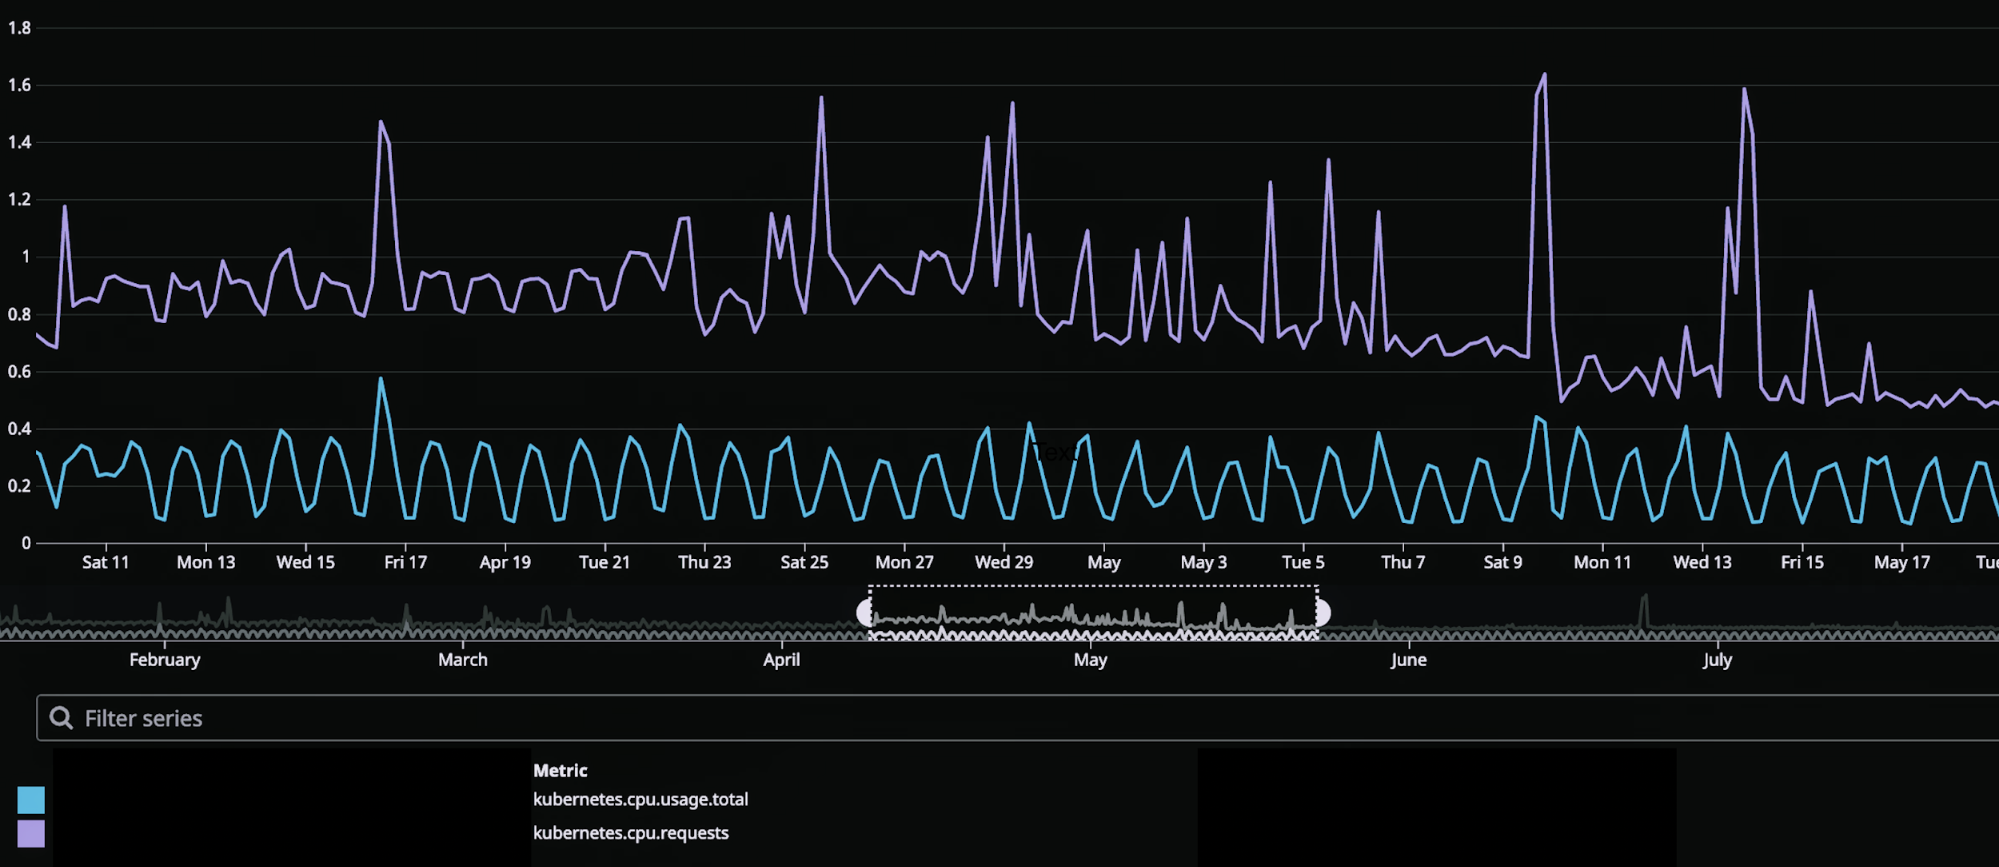
We saw a ~45% reduction in our total resource usage vs resource requested after moving to VPA with a fixed number of pods from HPA.

Anatomy of a Processing Pod

Managing Availability

We broadly classify our workloads as latency sensitive (critical) and latency tolerant (non-critical). As a result, we could optimize scheduling and cost efficiency using priority classes and overprovisioning on heterogeneous node types on AWS.

Kubernetes Priority Classes

The main cost of running EKS in AWS is attributed to the EC2 machines that form the worker nodes for the Kubernetes cluster. Running On-Demand brings all the guarantees of instance availability but it is definitely very expensive. Hence, our first action to drive cost optimisation was to include Spot instances in our worker node group.

With the uncertainty of losing a spot instance, we started assigning priority to our various applications. We then let the user choose the priority of their pipeline depending on their use case. Different priorities would result in different node affinity to different kinds of instance groups (On-Demand/Spot). For example, Critical pipelines (latency sensitive) run on On-Demand worker node groups and Non-critical pipelines (latency tolerant) on Spot instance worker node groups.

We use priority class as a method of preemption, as well as a node affinity that chooses a certain priority pipeline for the node group to deploy to.

Overprovisioning

With spot instances running we realised a need to make our cluster quickly respond to failures. We wanted to achieve quick rescheduling of evicted pods, hence we added overprovisioning to our cluster. This means we keep some noop pods occupying free space running in our worker node groups for the quick scheduling of evicted or deploying pods.

The overprovisioned pods are the lowest priority pods, thus can be preempted by any pod waiting in the queue for scheduling. We used cluster proportional autoscaler to decide the right number of these overprovisioned pods, which scales up and down proportionally to cluster size (i.e number of nodes and CPU in worker node group). This relieves us from tuning the number of these noop pods as the cluster scales up or down over the period keeping the free space proportional to current cluster capacity.

Lastly, overprovisioning also helped improve the deployment time because there is no  dependency on the time required for Auto Scaling Groups (ASG) to add a new node to the cluster every time we want to deploy a new application.

Future Improvements

Evolution is an ongoing process. In the next few months, we plan to work on custom resources for combining VPA and fixed deployment size. Our current architecture setup works fine for now, but we would like to create a more tuneable in-house CRD(Custom Resource Definition) for VPA that incorporates rightsizing our Kubernetes deployment horizontally.


Authored By Shubham Badkur on behalf of the Coban team at Grab – Ryan Ooi, Karan Kamath, Hui Yang, Yuguang Xiao, Jump Char, Jason Cusick, Shrinand Thakkar, Dean Barlan, Shivam Dixit, Andy Nguyen, and Ravi Tandon.


Join us

Grab is more than just the leading ride-hailing and mobile payments platform in Southeast Asia. We use data and technology to improve everything from transportation to payments and financial services across a region of more than 620 million people. We aspire to unlock the true potential of Southeast Asia and look for like-minded individuals to join us on this ride.

If you share our vision of driving South East Asia forward, apply to join our team today.

Testing cloud apps with GitHub Actions and cloud-native open source tools

Post Syndicated from Sarah Khalife original https://github.blog/2020-10-09-devops-cloud-testing/

See this post in action during GitHub Demo Days on October 16.

What makes a project successful? For developers building cloud-native applications, successful projects thrive on transparent, consistent, and rigorous collaboration. That collaboration is one of the reasons that many open source projects, like Docker containers and Kubernetes, grow to become standards for how we build, deliver, and operate software. Our Open Source Guides and Introduction to innersourcing are great first steps to setting up and encouraging these best practices in your own projects.

However, a common challenge that application developers face is manually testing against inconsistent environments. Accurately testing Kubernetes applications can differ from one developer’s environment to another, and implementing a rigorous and consistent environment for end-to-end testing isn’t easy. It can also be very time consuming to spin up and down Kubernetes clusters. The inconsistencies between environments and the time required to spin up new Kubernetes clusters can negatively impact the speed and quality of cloud-native applications.

Building a transparent CI process

On GitHub, integration and testing becomes a little easier by combining GitHub Actions with open source tools. You can treat Actions as the native continuous integration and continuous delivery (CI/CD) tool for your project, and customize your Actions workflow to include automation and validation as next steps.

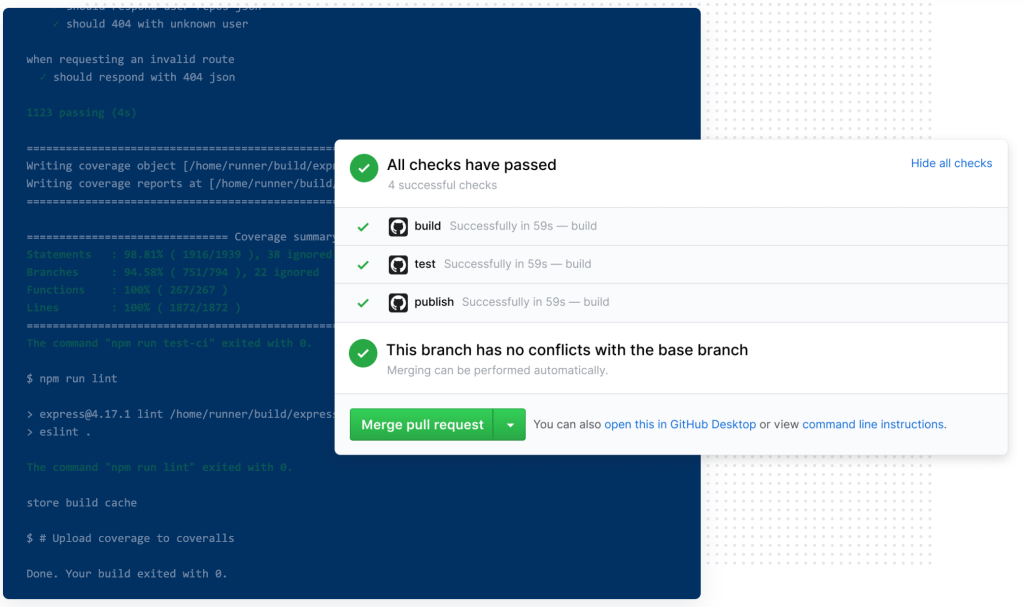
Since Actions can be triggered based on nearly any GitHub event, it’s also possible to build in accountability for updating tests and fixing bugs. For example, when a developer creates a pull request, Actions status checks can automatically block the merge if the test fails.

Here are a few more examples:

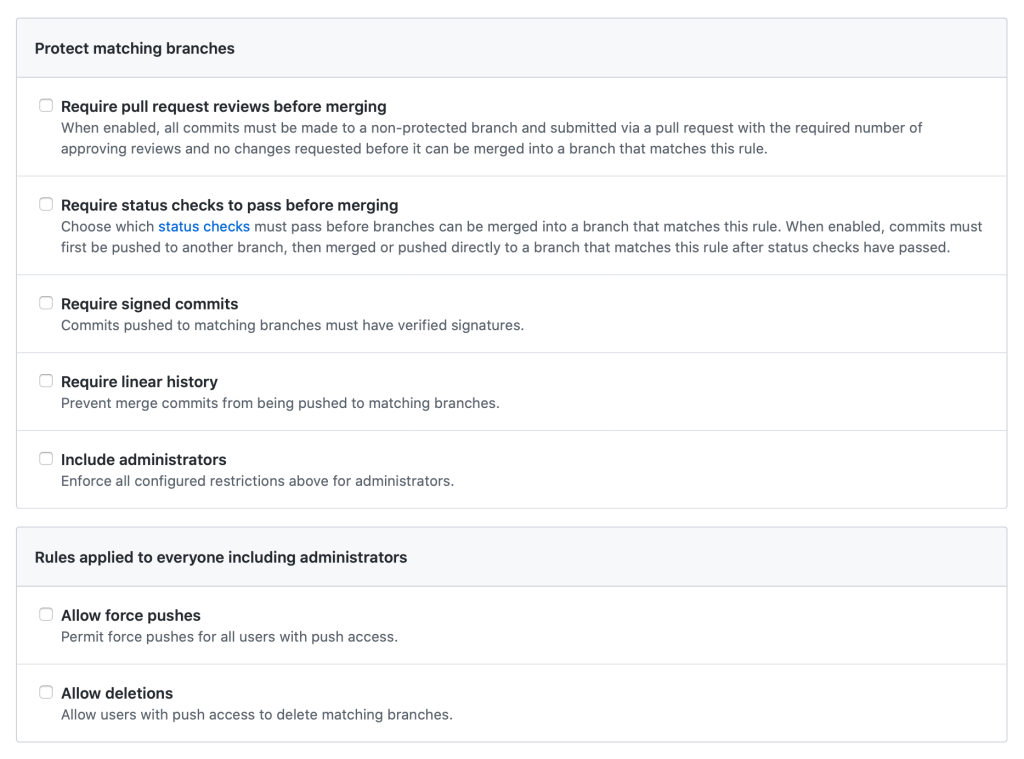
Branch protection rules in the repository help enforce certain workflows, such as requiring more than one pull request review or requiring certain status checks to pass before allowing a pull request to merge.

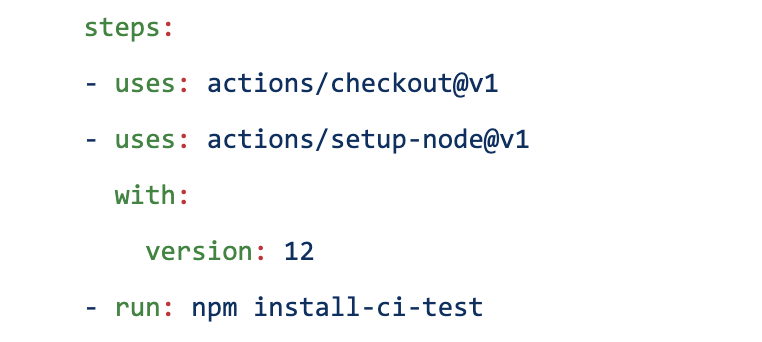
GitHub Actions are natively configured to act as status checks when they’re set up to trigger `on: [pull_request]`.

Continuous integration (CI) is extremely valuable as it allows you to run tests before each pull request is merged into production code. In turn, this will reduce the number of bugs that are pushed into production and increases confidence that newly introduced changes will not break existing functionality.

But transparency remains key: Requiring CI status checks on protected branches provides a clearly-defined, transparent way to let code reviewers know if the commits meet the conditions set for the repository—right in the pull request view.

Using community-powered workflows

Now that we’ve thought through the simple CI policies, automated workflows are next. Think of an Actions workflow as a set of “plug and play” open sourced, automated steps contributed by the community. You can use them as they are, or customize and make them your own. Once you’ve found the right one, open sourced Actions can be plugged into your workflow with the`- uses: repo/action-name` field.

You might ask, “So how do I find available Actions that suit my needs?”

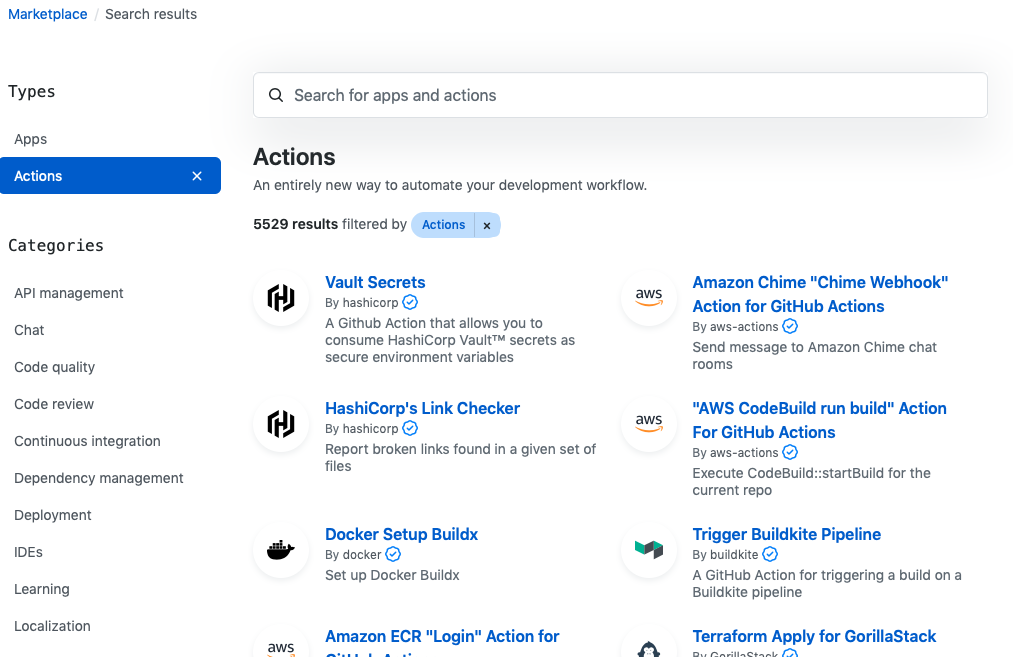
The GitHub Marketplace!

As you’re building automation and CI pipelines, take advantage of Marketplace to find pre-built Actions provided by the community. Examples of pre-built Actions span from a Docker publish and the kubectl CLI installation to container scans and cloud deployments. When it comes to cloud-native Actions, the list keeps growing as container-based development continues to expand.

Testing with kind

Testing is a critical part of any CI/CD pipeline, but running tests in Kubernetes can absorb the extra time that automation saves. Enter kind. kind stands for “Kubernetes in Docker.” It’s an open source project from the Kubernetes special interest group (SIGs) community, and a tool for running local Kubernetes clusters using Docker container “nodes.” Creating a kind cluster is a simple way to run Kubernetes cluster and application testing—without having to spin up a complete Kubernetes environment.

As the number of Kubernetes users pushing critical applications to production grows, so does the need for a repeatable, reliable, and rigorous testing process. This can be accomplished by combining the creation of a homogenous Kubernetes testing environment with kind, the community-powered Marketplace, and the native and transparent Actions CI process.

Bringing it all together with kind and Actions

Come see kind and Actions at work during our next GitHub Demo Day live stream on October 16, 2020 at 11am PT. I’ll walk you through how to easily set up automated and consistent tests per pull request, including how to use kind with Actions to automatically run end-to-end tests across a common Kubernetes environment.

Secondary DNS – Deep Dive

Post Syndicated from Alex Fattouche original https://blog.cloudflare.com/secondary-dns-deep-dive/

How Does Secondary DNS Work?

Secondary DNS - Deep Dive

If you already understand how Secondary DNS works, please feel free to skip this section. It does not provide any Cloudflare-specific information.

Secondary DNS has many use cases across the Internet; however, traditionally, it was used as a synchronized backup for when the primary DNS server was unable to respond to queries. A more modern approach involves focusing on redundancy across many different nameservers, which in many cases broadcast the same anycasted IP address.

Secondary DNS involves the unidirectional transfer of DNS zones from the primary to the Secondary DNS server(s). One primary can have any number of Secondary DNS servers that it must communicate with in order to keep track of any zone updates. A zone update is considered a change in the contents of a  zone, which ultimately leads to a Start of Authority (SOA) serial number increase. The zone’s SOA serial is one of the key elements of Secondary DNS; it is how primary and secondary servers synchronize zones. Below is an example of what an SOA record might look like during a dig query.

example.com	3600	IN	SOA	ashley.ns.cloudflare.com. dns.cloudflare.com. 
2034097105  // Serial
10000 // Refresh
2400 // Retry
604800 // Expire
3600 // Minimum TTL

Each of the numbers is used in the following way:

  1. Serial – Used to keep track of the status of the zone, must be incremented at every change.
  2. Refresh – The maximum number of seconds that can elapse before a Secondary DNS server must check for a SOA serial change.
  3. Retry – The maximum number of seconds that can elapse before a Secondary DNS server must check for a SOA serial change, after previously failing to contact the primary.
  4. Expire – The maximum number of seconds that a Secondary DNS server can serve stale information, in the event the primary cannot be contacted.
  5. Minimum TTL – Per RFC 2308, the number of seconds that a DNS negative response should be cached for.

Using the above information, the Secondary DNS server stores an SOA record for each of the zones it is tracking. When the serial increases, it knows that the zone must have changed, and that a zone transfer must be initiated.  

Serial Tracking

Serial increases can be detected in the following ways:

  1. The fastest way for the Secondary DNS server to keep track of a serial change is to have the primary server NOTIFY them any time a zone has changed using the DNS protocol as specified in RFC 1996, Secondary DNS servers will instantly be able to initiate a zone transfer.
  2. Another way is for the Secondary DNS server to simply poll the primary every “Refresh” seconds. This isn’t as fast as the NOTIFY approach, but it is a good fallback in case the notifies have failed.

One of the issues with the basic NOTIFY protocol is that anyone on the Internet could potentially notify the Secondary DNS server of a zone update. If an initial SOA query is not performed by the Secondary DNS server before initiating a zone transfer, this is an easy way to perform an amplification attack. There is two common ways to prevent anyone on the Internet from being able to NOTIFY Secondary DNS servers:

  1. Using transaction signatures (TSIG) as per RFC 2845. These are to be placed as the last record in the extra records section of the DNS message. Usually the number of extra records (or ARCOUNT) should be no more than two in this case.
  2. Using IP based access control lists (ACL). This increases security but also prevents flexibility in server location and IP address allocation.

Generally NOTIFY messages are sent over UDP, however TCP can be used in the event the primary server has reason to believe that TCP is necessary (i.e. firewall issues).

Zone Transfers

In addition to serial tracking, it is important to ensure that a standard protocol is used between primary and Secondary DNS server(s), to efficiently transfer the zone. DNS zone transfer protocols do not attempt to solve the confidentiality, authentication and integrity triad (CIA); however, the use of TSIG on top of the basic zone transfer protocols can provide integrity and authentication. As a result of DNS being a public protocol, confidentiality during the zone transfer process is generally not a concern.

Authoritative Zone Transfer (AXFR)

AXFR is the original zone transfer protocol that was specified in RFC 1034 and RFC 1035 and later further explained in RFC 5936. AXFR is done over a TCP connection because a reliable protocol is needed to ensure packets are not lost during the transfer. Using this protocol, the primary DNS server will transfer all of the zone contents to the Secondary DNS server, in one connection, regardless of the serial number. AXFR is recommended to be used for the first zone transfer, when none of the records are propagated, and IXFR is recommended after that.

Incremental Zone Transfer (IXFR)

IXFR is the more sophisticated zone transfer protocol that was specified in RFC 1995. Unlike the AXFR protocol, during an IXFR, the primary server will only send the secondary server the records that have changed since its current version of the zone (based on the serial number). This means that when a Secondary DNS server wants to initiate an IXFR, it sends its current serial number to the primary DNS server. The primary DNS server will then format its response based on previous versions of changes made to the zone. IXFR messages must obey the following pattern:

  1. Current latest SOA
  2. Secondary server current SOA
  3. DNS record deletions
  4. Secondary server current SOA + changes
  5. DNS record additions
  6. Current latest SOA

Steps 2,3,4,5,6 can be repeated any number of times, as each of those represents one change set of deletions and additions, ultimately leading to a new serial.

IXFR can be done over UDP or TCP, but again TCP is generally recommended to avoid packet loss.

How Does Secondary DNS Work at Cloudflare?

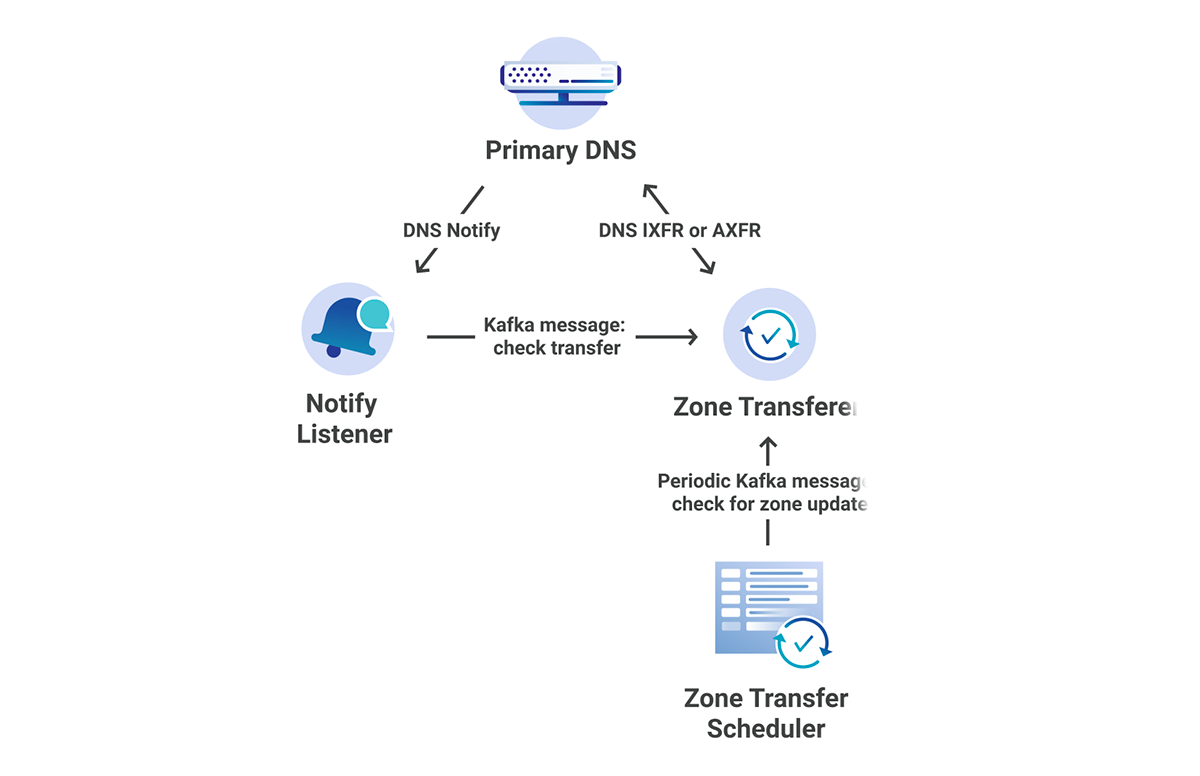
The DNS team loves microservice architecture! When we initially implemented Secondary DNS at Cloudflare, it was done using Mesos Marathon. This allowed us to separate each of our services into several different marathon apps, individually scaling apps as needed. All of these services live in our core data centers. The following services were created:

  1. Zone Transferer – responsible for attempting IXFR, followed by AXFR if IXFR fails.
  2. Zone Transfer Scheduler – responsible for periodically checking zone SOA serials for changes.
  3. Rest API – responsible for registering new zones and primary nameservers.

In addition to the marathon apps, we also had an app external to the cluster:

  1. Notify Listener – responsible for listening for notifies from primary servers and telling the Zone Transferer to initiate an AXFR/IXFR.

Each of these microservices communicates with the others through Kafka.

Secondary DNS - Deep Dive
Figure 1: Secondary DNS Microservice Architecture‌‌

Once the zone transferer completes the AXFR/IXFR, it then passes the zone through to our zone builder, and finally gets pushed out to our edge at each of our 200 locations.

Although this current architecture worked great in the beginning, it left us open to many vulnerabilities and scalability issues down the road. As our Secondary DNS product became more popular, it was important that we proactively scaled and reduced the technical debt as much as possible. As with many companies in the industry, Cloudflare has recently migrated all of our core data center services to Kubernetes, moving away from individually managed apps and Marathon clusters.

What this meant for Secondary DNS is that all of our Marathon-based services, as well as our NOTIFY Listener, had to be migrated to Kubernetes. Although this long migration ended up paying off, many difficult challenges arose along the way that required us to come up with unique solutions in order to have a seamless, zero downtime migration.

Challenges When Migrating to Kubernetes

Although the entire DNS team agreed that kubernetes was the way forward for Secondary DNS, it also introduced several challenges. These challenges arose from a need to properly scale up across many distributed locations while also protecting each of our individual data centers. Since our core does not rely on anycast to automatically distribute requests, as we introduce more customers, it opens us up to denial-of-service attacks.

The two main issues we ran into during the migration were:

  1. How do we create a distributed and reliable system that makes use of kubernetes principles while also making sure our customers know which IPs we will be communicating from?
  2. When opening up a public-facing UDP socket to the Internet, how do we protect ourselves while also preventing unnecessary spam towards primary nameservers?.

Issue 1:

As was previously mentioned, one form of protection in the Secondary DNS protocol is to only allow certain IPs to initiate zone transfers. There is a fine line between primary servers allow listing too many IPs and them having to frequently update their IP ACLs. We considered several solutions:

  1. Open source k8s controllers
  2. Altering Network Address Translation(NAT) entries
  3. Do not use k8s for zone transfers
  4. Allowlist all Cloudflare IPs and dynamically update
  5. Proxy egress traffic

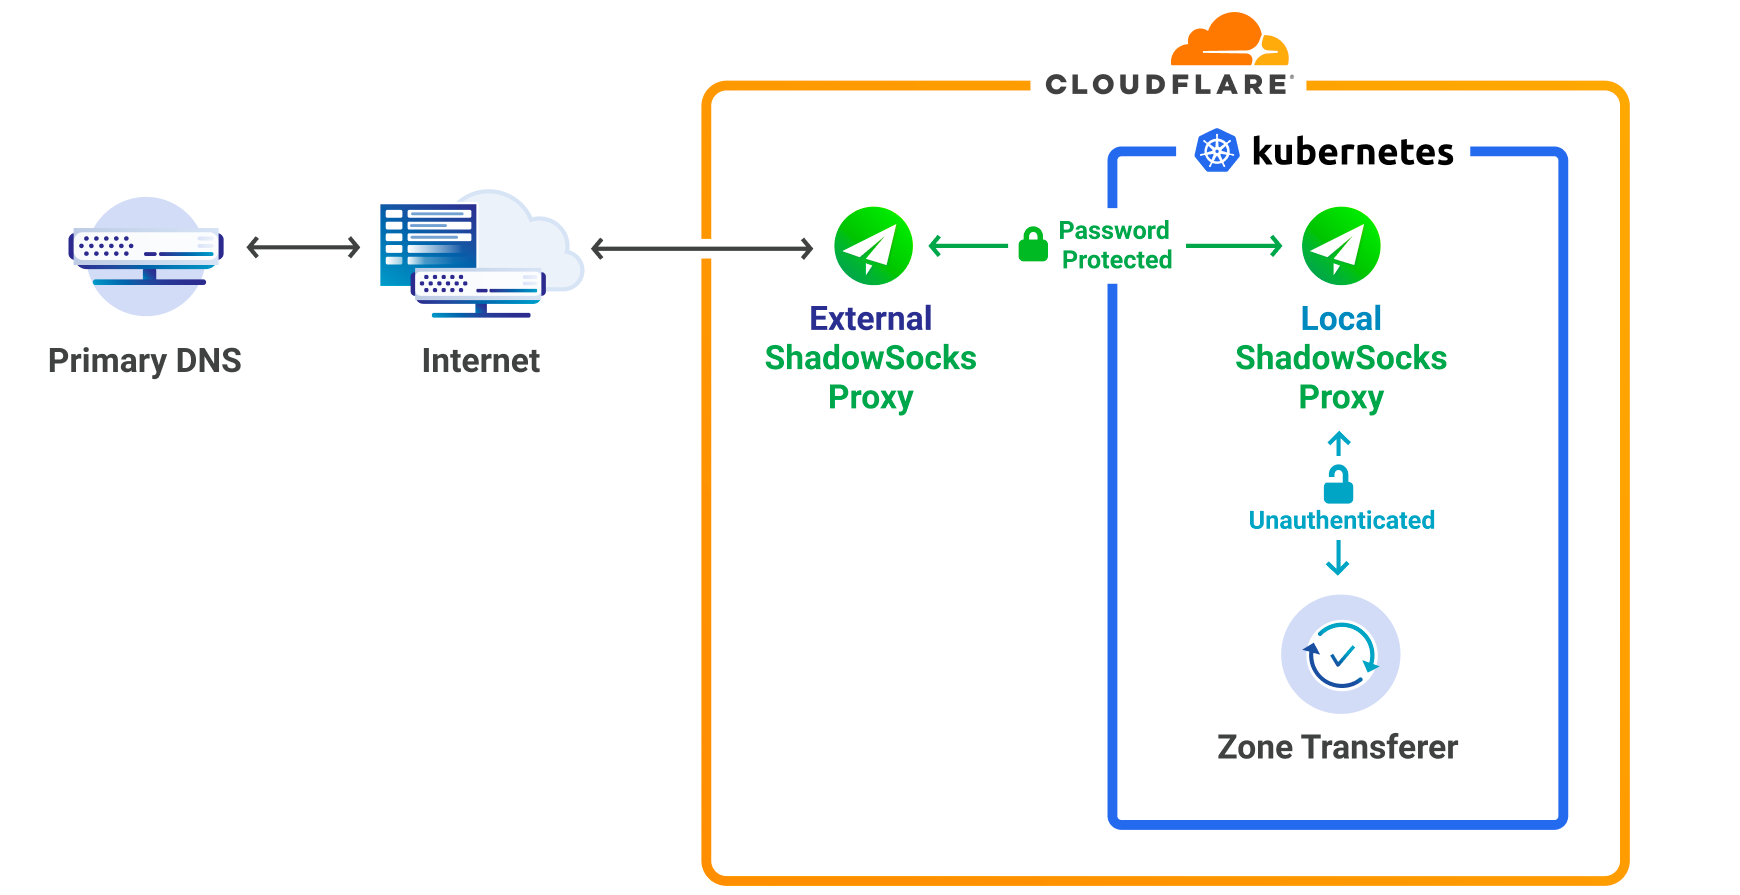
Ultimately we decided to proxy our egress traffic from k8s, to the DNS primary servers, using static proxy addresses. Shadowsocks-libev was chosen as the SOCKS5 implementation because it is fast, secure and known to scale. In addition, it can handle both UDP/TCP and IPv4/IPv6.

Secondary DNS - Deep Dive
Figure 2: Shadowsocks proxy Setup

The partnership of k8s and Shadowsocks combined with a large enough IP range brings many benefits:

  1. Horizontal scaling
  2. Efficient load balancing
  3. Primary server ACLs only need to be updated once
  4. It allows us to make use of kubernetes for both the Zone Transferer and the Local ShadowSocks Proxy.
  5. Shadowsocks proxy can be reused by many different Cloudflare services.

Issue 2:

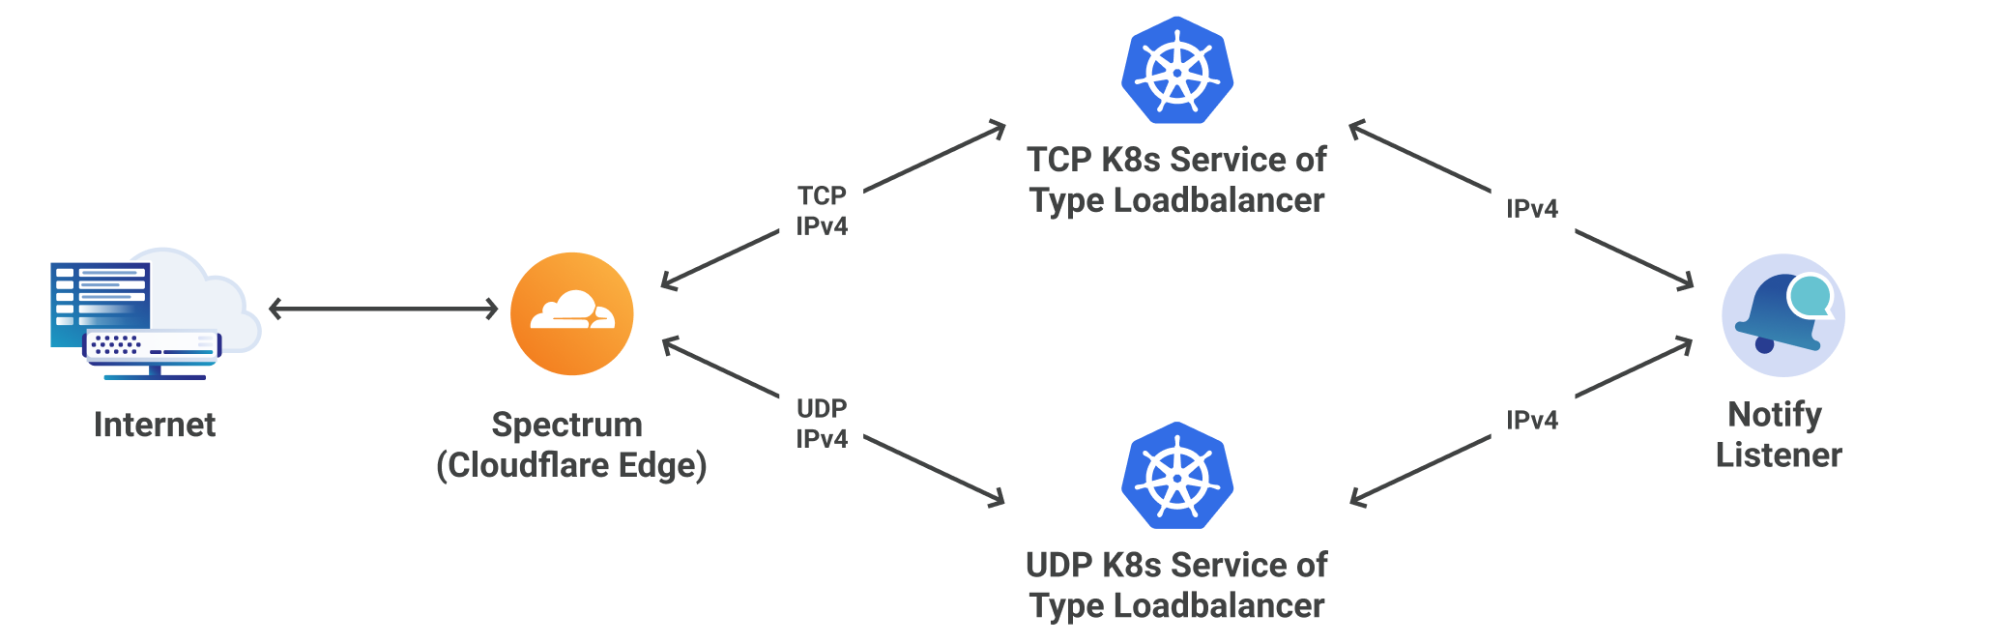
The Notify Listener requires listening on static IPs for NOTIFY Messages coming from primary DNS servers. This is mostly a solved problem through the use of k8s services of type loadbalancer, however exposing this service directly to the Internet makes us uneasy because of its susceptibility to attacks. Fortunately DDoS protection is one of Cloudflare’s strengths, which lead us to the likely solution of dogfooding one of our own products, Spectrum.

Spectrum provides the following features to our service:

  1. Reverse proxy TCP/UDP traffic
  2. Filter out Malicious traffic
  3. Optimal routing from edge to core data centers
  4. Dual Stack technology
Secondary DNS - Deep Dive
Figure 3: Spectrum interaction with Notify Listener

Figure 3 shows two interesting attributes of the system:

  1. Spectrum <-> k8s IPv4 only:
  2. This is because our custom k8s load balancer currently only supports IPv4; however, Spectrum has no issue terminating the IPv6 connection and establishing a new IPv4 connection.
  3. Spectrum <-> k8s routing decisions based of L4 protocol:
  4. This is because k8s only supports one of TCP/UDP/SCTP per service of type load balancer. Once again, spectrum has no issues proxying this correctly.

One of the problems with using a L4 proxy in between services is that source IP addresses get changed to the source IP address of the proxy (Spectrum in this case). Not knowing the source IP address means we have no idea who sent the NOTIFY message, opening us up to attack vectors. Fortunately, Spectrum’s proxy protocol feature is capable of adding custom headers to TCP/UDP packets which contain source IP/Port information.

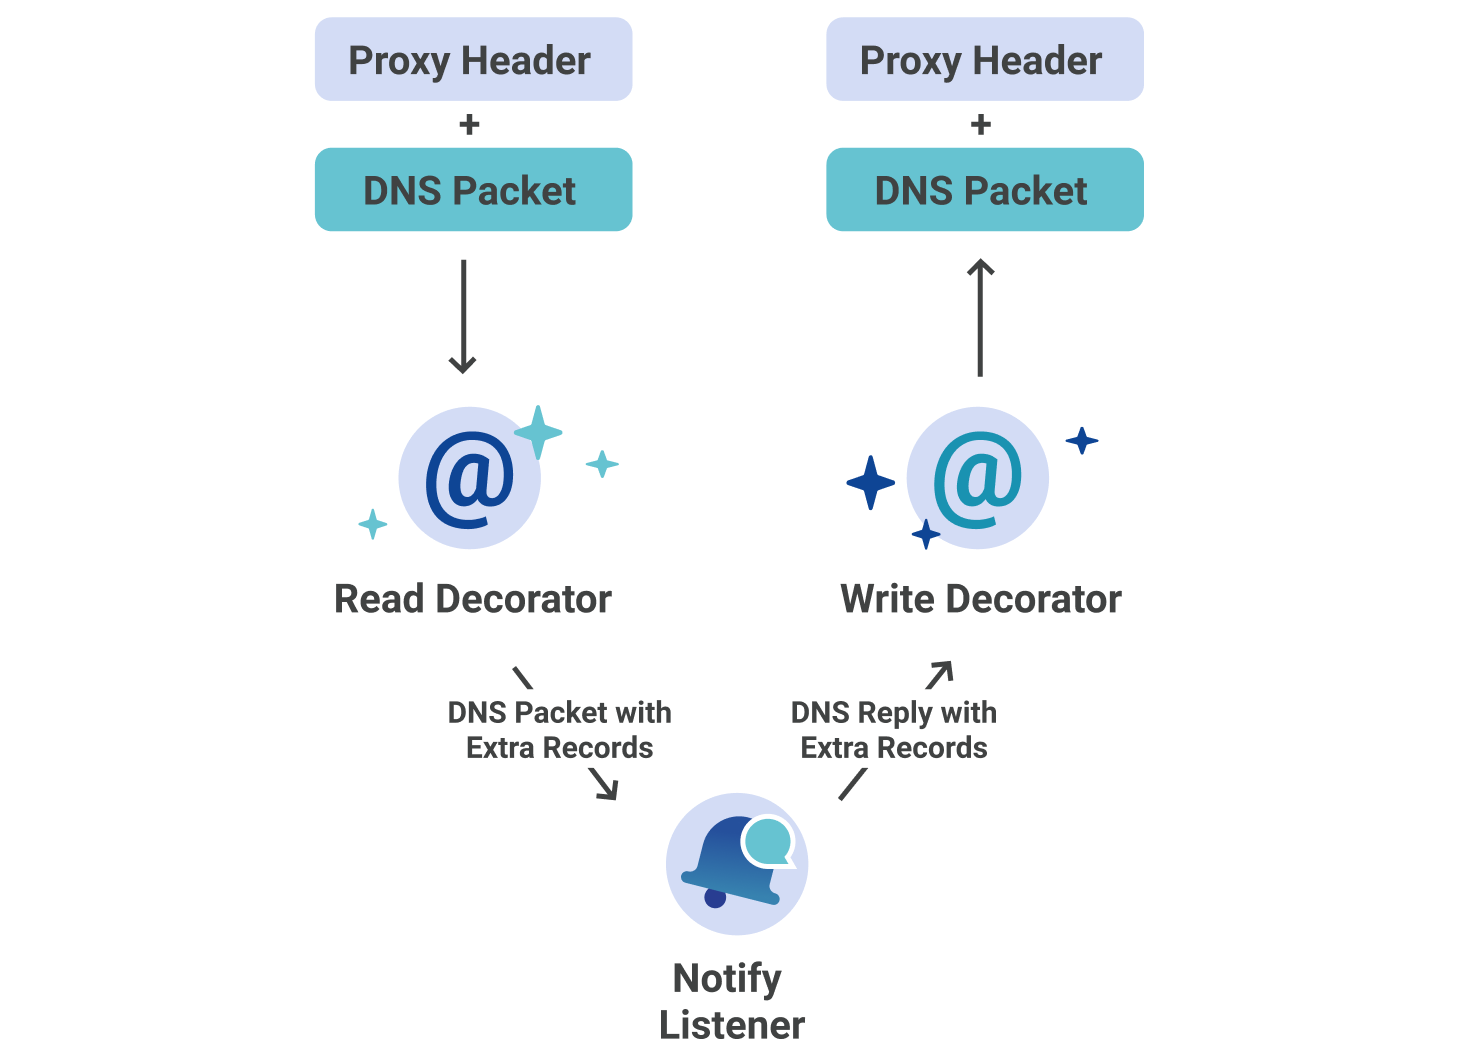
As we are using miekg/dns for our Notify Listener, adding proxy headers to the DNS NOTIFY messages would cause failures in validation at the DNS server level. Alternatively, we were able to implement custom read and write decorators that do the following:

  1. Reader: Extract source address information on inbound NOTIFY messages. Place extracted information into new DNS records located in the additional section of the message.
  2. Writer: Remove additional records from the DNS message on outbound NOTIFY replies. Generate a new reply using proxy protocol headers.

There is no way to spoof these records, because the server only permits two extra records, one of which is the optional TSIG. Any other records will be overwritten.

Secondary DNS - Deep Dive
Figure 4: Proxying Records Between Notifier and Spectrum‌‌

This custom decorator approach abstracts the proxying away from the Notify Listener through the use of the DNS protocol.  

Although knowing the source IP will block a significant amount of bad traffic, since NOTIFY messages can use both UDP and TCP, it is prone to IP spoofing. To ensure that the primary servers do not get spammed, we have made the following additions to the Zone Transferer:

  1. Always ensure that the SOA has actually been updated before initiating a zone transfer.
  2. Only allow at most one working transfer and one scheduled transfer per zone.

Additional Technical Challenges

Zone Transferer Scheduling

As shown in figure 1, there are several ways of sending Kafka messages to the Zone Transferer in order to initiate a zone transfer. There is no benefit in having a large backlog of zone transfers for the same zone. Once a zone has been transferred, assuming no more changes, it does not need to be transferred again. This means that we should only have at most one transfer ongoing, and one scheduled transfer at the same time, for any zone.

If we want to limit our number of scheduled messages to one per zone, this involves ignoring Kafka messages that get sent to the Zone Transferer. This is not as simple as ignoring specific messages in any random order. One of the benefits of Kafka is that it holds on to messages until the user actually decides to acknowledge them, by committing that messages offset. Since Kafka is just a queue of messages, it has no concept of order other than first in first out (FIFO). If a user is capable of reading from the Kafka topic concurrently, it is entirely possible that a message in the middle of the queue be committed before a message at the end of the queue.

Most of the time this isn’t an issue, because we know that one of the concurrent readers has read the message from the end of the queue and is processing it. There is one Kubernetes-related catch to this issue, though: pods are ephemeral. The kube master doesn’t care what your concurrent reader is doing, it will kill the pod and it’s up to your application to handle it.

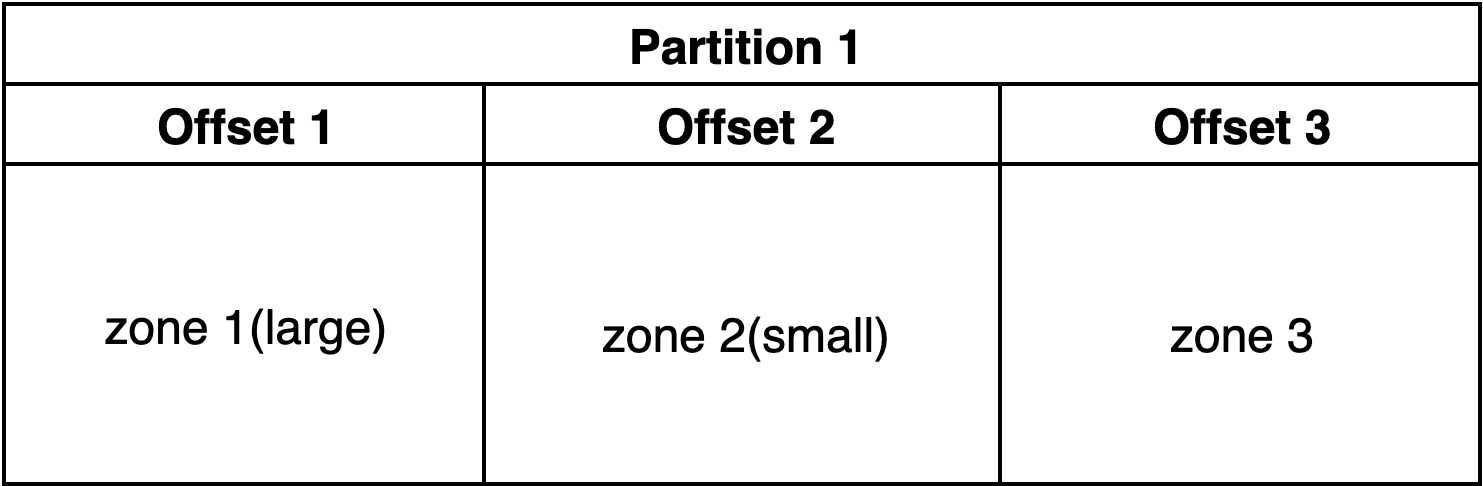
Consider the following problem:

Secondary DNS - Deep Dive
Figure 5: Kafka Partition‌‌
  1. Read offset 1. Start transferring zone 1.
  2. Read offset 2. Start transferring zone 2.
  3. Zone 2 transfer finishes. Commit offset 2, essentially also marking offset 1.
  4. Restart pod.
  5. Read offset 3 Start transferring zone 3.

If these events happen, zone 1 will never be transferred. It is important that zones stay up to date with the primary servers, otherwise stale data will be served from the Secondary DNS server. The solution to this problem involves the use of a list to track which messages have been read and completely processed. In this case, when a zone transfer has finished, it does not necessarily mean that the kafka message should be immediately committed. The solution is as follows:

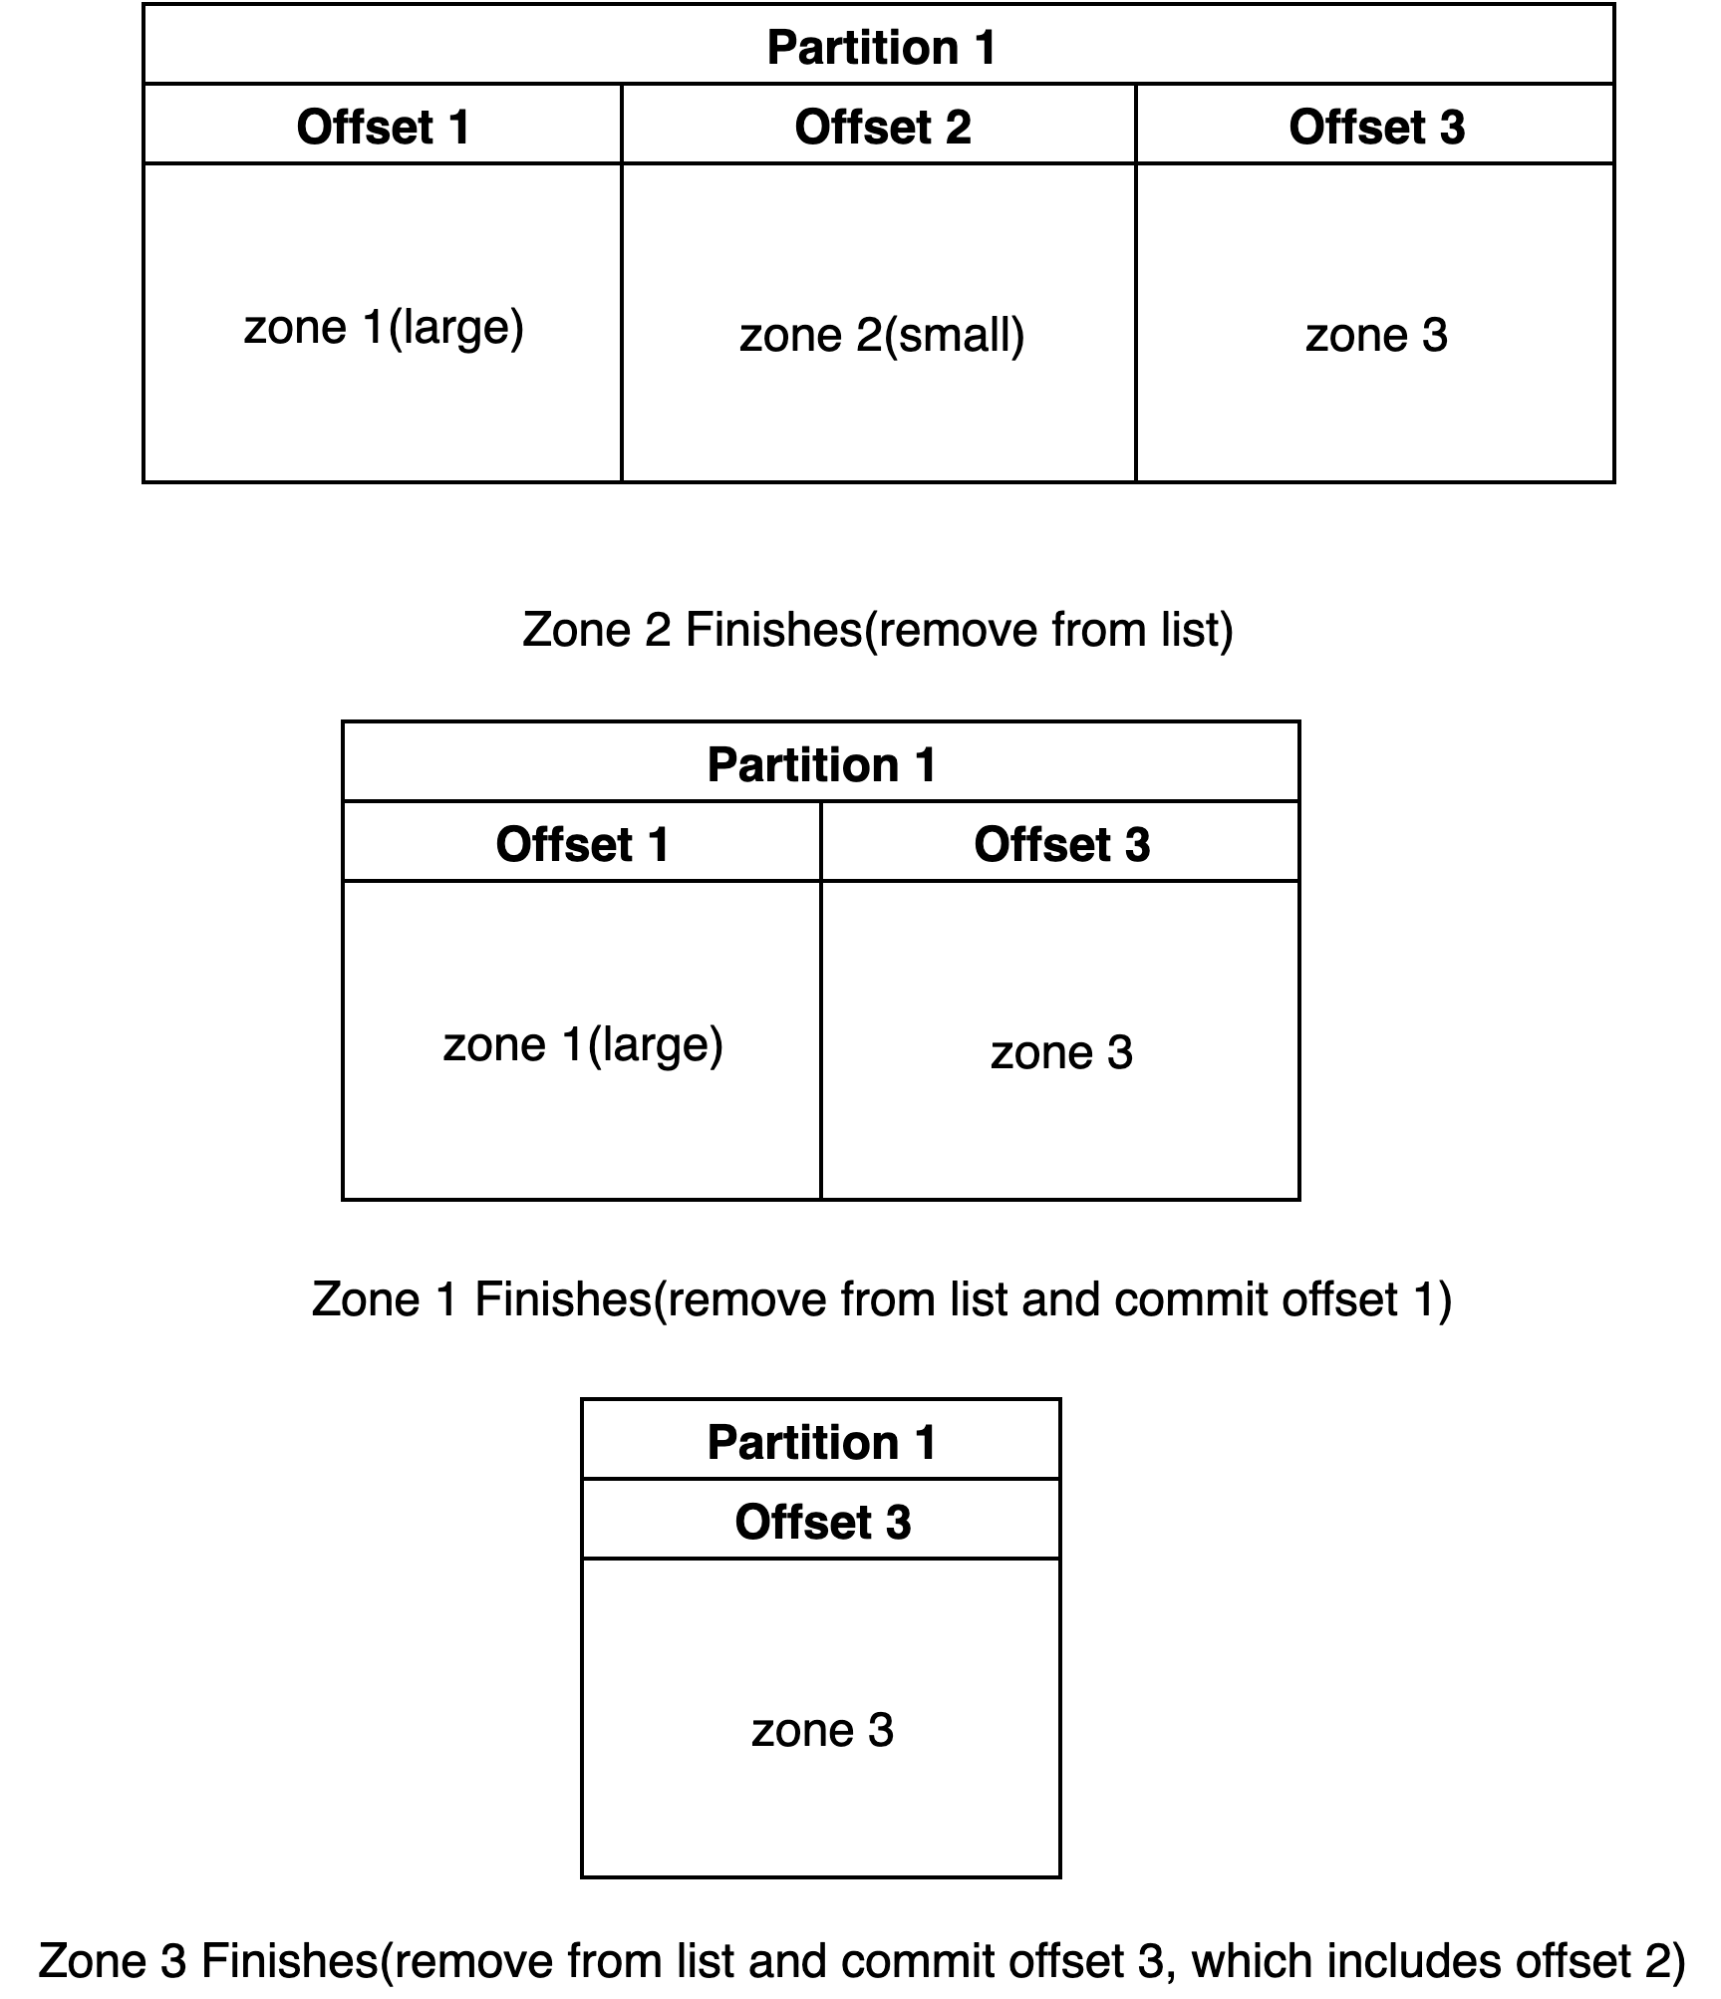
  1. Keep a list of Kafka messages, sorted based on offset.
  2. If finished transfer, remove from list:
  3. If the message is the oldest in the list, commit the messages offset.
Secondary DNS - Deep Dive
Figure 6: Kafka Algorithm to Solve Message Loss

This solution is essentially soft committing Kafka messages, until we can confidently say that all other messages have been acknowledged. It’s important to note that this only truly works in a distributed manner if the Kafka messages are keyed by zone id, this will ensure the same zone will always be processed by the same Kafka consumer.

Life of a Secondary DNS Request

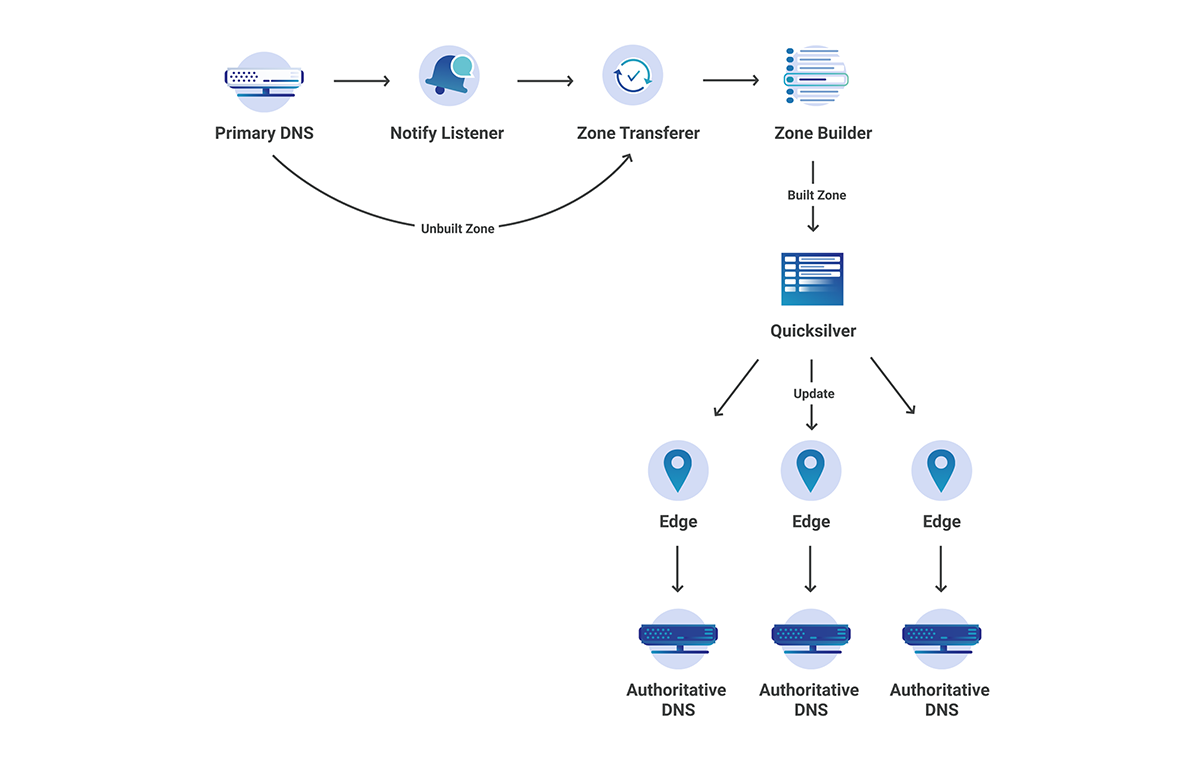
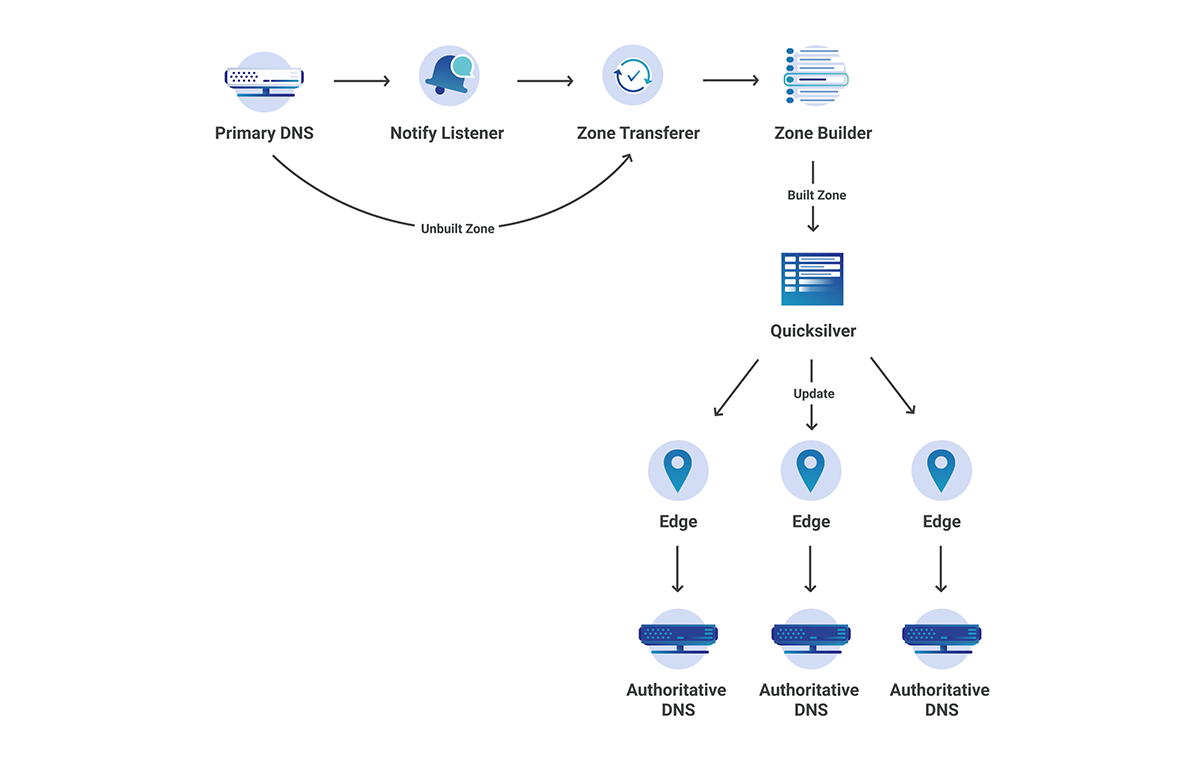
Although Cloudflare has a large global network, as shown above, the zone transferring process does not take place at each of the edge datacenter locations (which would surely overwhelm many primary servers), but rather in our core data centers. In this case, how do we propagate to our edge in seconds? After transferring the zone, there are a couple more steps that need to be taken before the change can be seen at the edge.

  1. Zone Builder – This interacts with the Zone Transferer to build the zone according to what Cloudflare edge understands. This then writes to Quicksilver, our super fast, distributed KV store.
  2. Authoritative Server – This reads from Quicksilver and serves the built zone.
Secondary DNS - Deep Dive
Figure 7: End to End Secondary DNS‌‌

What About Performance?

At the time of writing this post, according to dnsperf.com, Cloudflare leads in global performance for both Authoritative and Resolver DNS. Here, Secondary DNS falls under the authoritative DNS category here. Let’s break down the performance of each of the different parts of the Secondary DNS pipeline, from the primary server updating its records, to them being present at the Cloudflare edge.

  1. Primary Server to Notify Listener – Our most accurate measurement is only precise to the second, but we know UDP/TCP communication is likely much faster than that.
  2. NOTIFY to Zone Transferer – This is negligible
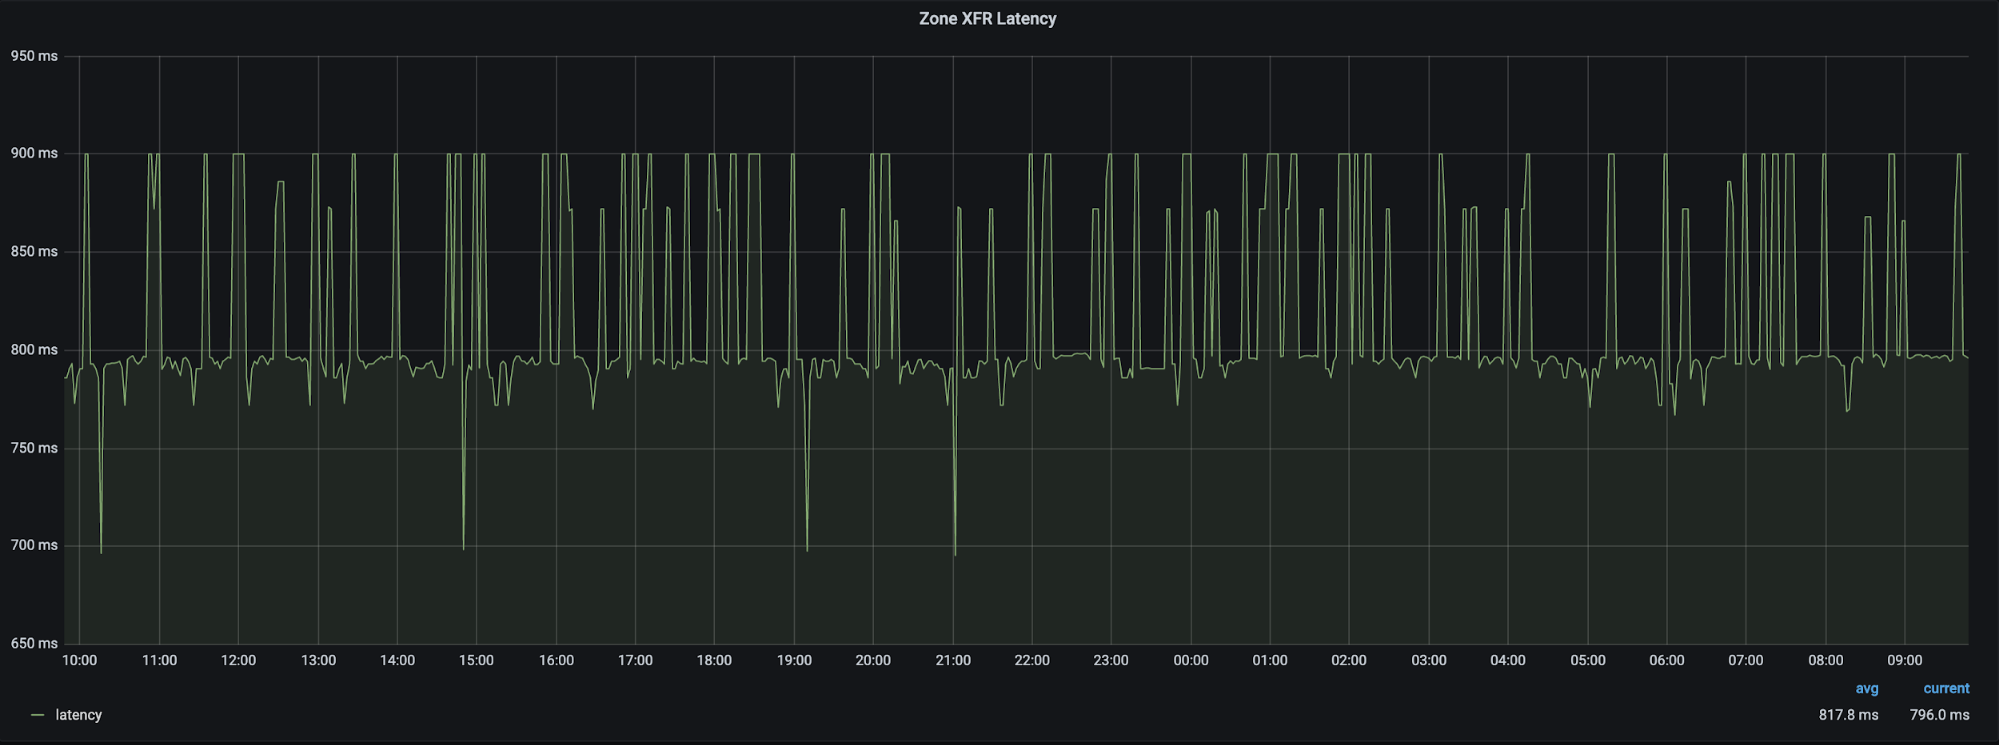
  3. Zone Transferer to Primary Server – 99% of the time we see ~800ms as the average latency for a zone transfer.
Secondary DNS - Deep Dive
Figure 8: Zone XFR latency

4. Zone Transferer to Zone Builder – 99% of the time we see ~10ms to build a zone.

Secondary DNS - Deep Dive
Figure 9: Zone Build time

5. Zone Builder to Quicksilver edge: 95% of the time we see less than 1s propagation.

Secondary DNS - Deep Dive
Figure 10: Quicksilver propagation time

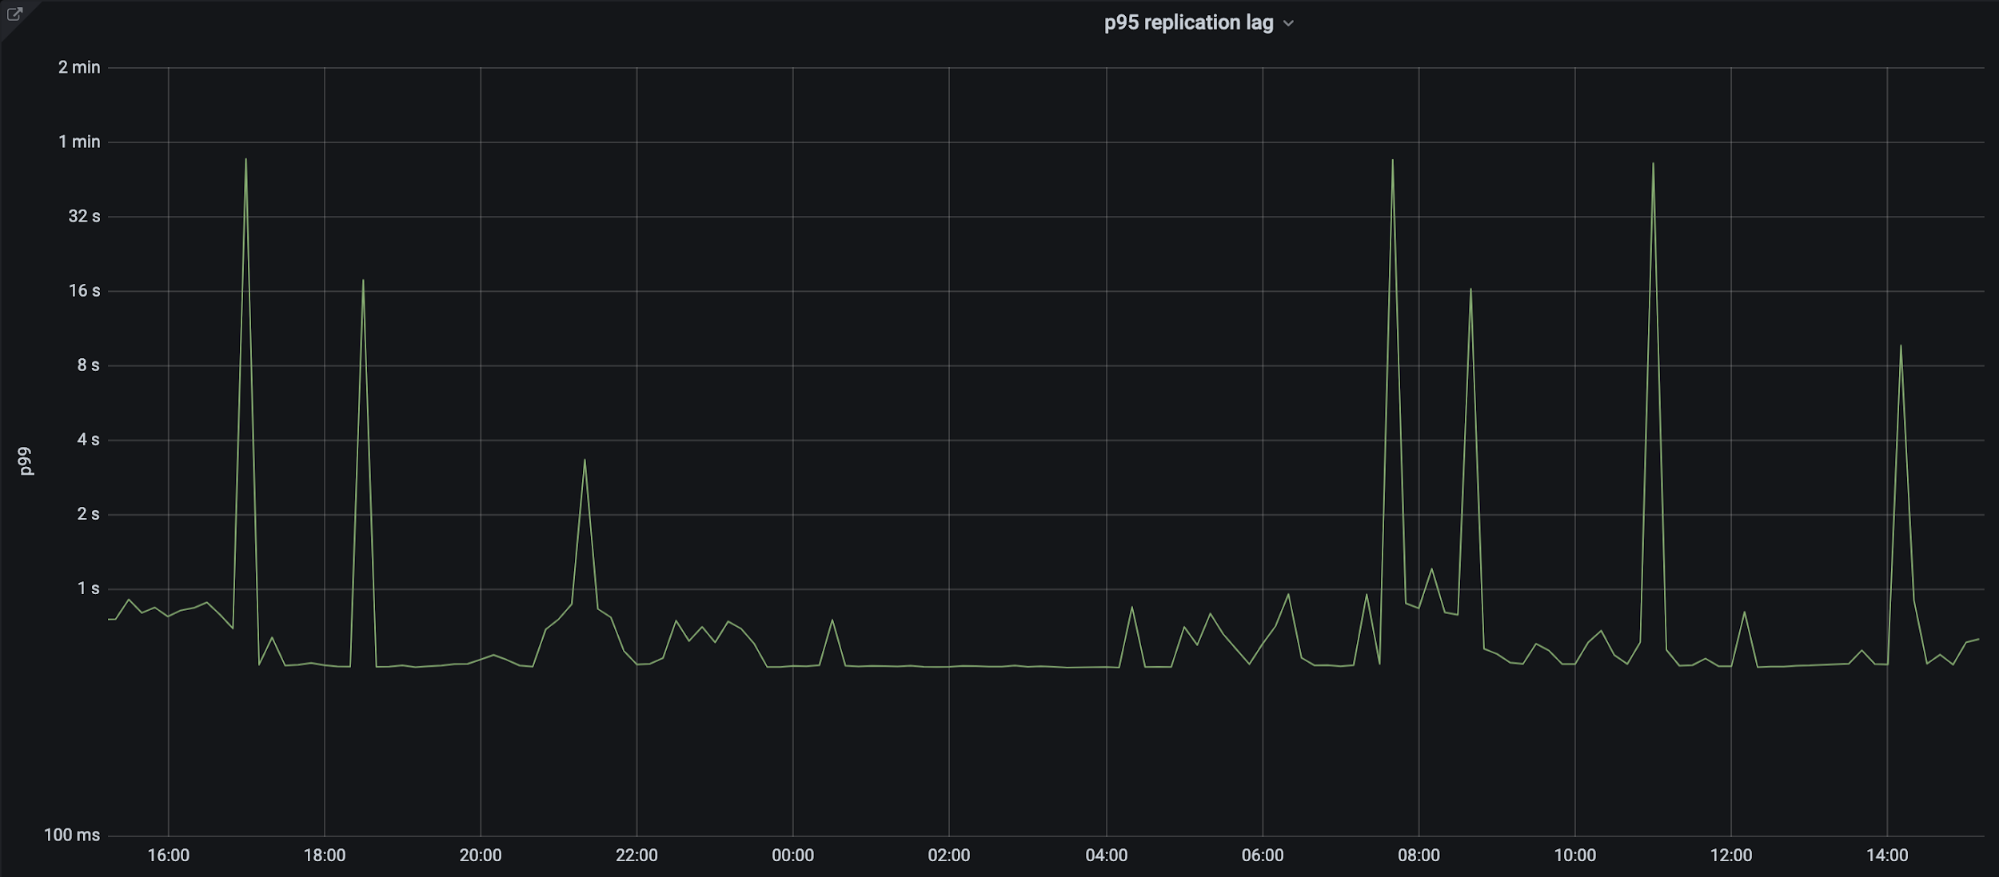
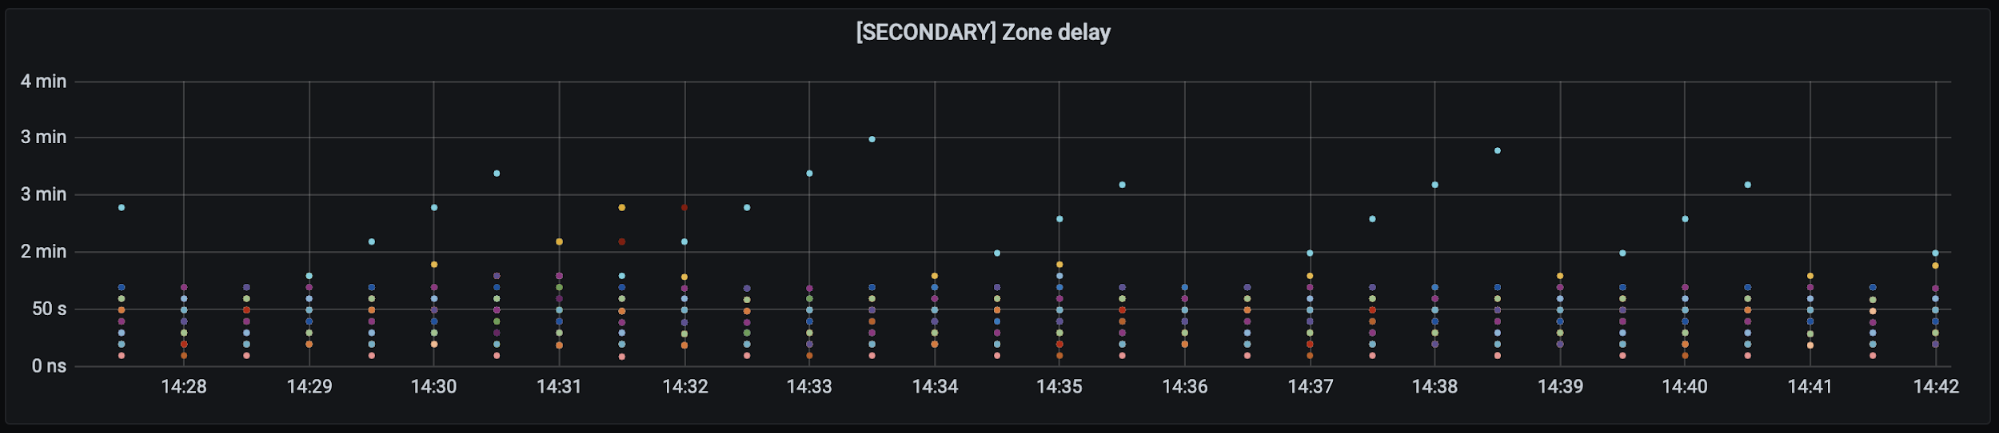
End to End latency: less than 5 seconds on average. Although we have several external probes running around the world to test propagation latencies, they lack precision due to their sleep intervals, location, provider and number of zones that need to run. The actual propagation latency is likely much lower than what is shown in figure 10. Each of the different colored dots is a separate data center location around the world.

Secondary DNS - Deep Dive
Figure 11: End to End Latency

An additional test was performed manually to get a real world estimate, the test had the following attributes:

Primary server: NS1
Number of records changed: 1
Start test timer event: Change record on NS1
Stop test timer event: Observe record change at Cloudflare edge using dig
Recorded timer value: 6 seconds

Conclusion

Cloudflare serves 15.8 trillion DNS queries per month, operating within 100ms of 99% of the Internet-connected population. The goal of Cloudflare operated Secondary DNS is to allow our customers with custom DNS solutions, be it on-premise or some other DNS provider, to be able to take advantage of Cloudflare’s DNS performance and more recently, through Secondary Override, our proxying and security capabilities too. Secondary DNS is currently available on the Enterprise plan, if you’d like to take advantage of it, please let your account team know. For additional documentation on Secondary DNS, please refer to our support article.