Tag Archives: Uncategorized

Classify your trash with Raspberry Pi

Post Syndicated from Ashley Whittaker original https://www.raspberrypi.org/blog/classify-your-trash-with-raspberry-pi/

Maker Jen Fox took to hackster.io to share a Raspberry Pi–powered trash classifier that tells you whether the trash in your hand is recyclable, compostable, or just straight-up garbage.

Jen reckons this project is beginner-friendly, as you don’t need any code to train the machine learning model, just a little to load it on Raspberry Pi. It’s also a pretty affordable build, costing less than $70 including a Raspberry Pi 4.

“Haz waste”?!

Hardware:

  • Raspberry Pi 4 Model B
  • Raspberry Pi Camera Module
  • Adafruit push button
  • Adafruit LEDs
Watch Jen giving a demo of her creation

Software

The code-free machine learning model is created using Lobe, a desktop tool that automatically trains a custom image classifier based on what objects you’ve shown it.

The image classifier correctly guessing it has been shown a bottle cap

Training the image classifier

Basically, you upload a tonne of photos and tell Lobe what object each of them shows. Jen told the empty classification model which photos were of compostable waste, which were of recyclable and items, and which were of garbage or bio-hazardous waste. Of course, as Jen says, “the more photos you have, the more accurate your model is.”

Loading up Raspberry Pi

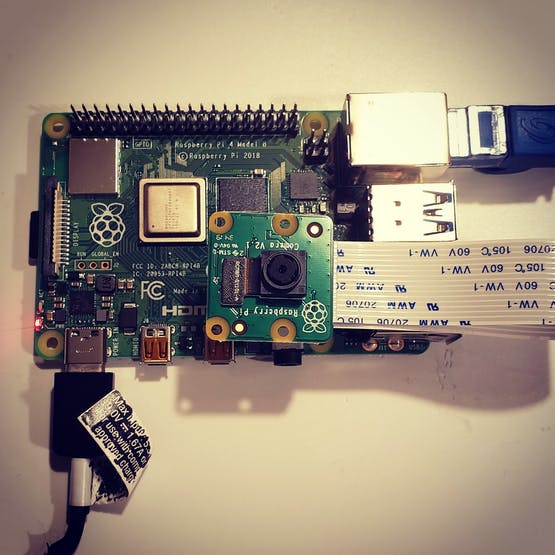
Birds eye view of Raspberry Pi 4 with a camera module connected
The Raspberry Pi Camera Module attached to Raspberry Pi 4

As promised, you only need a little bit of code to load the image classifier onto your Raspberry Pi. The Raspberry Pi Camera Module acts as the image classifier’s “eyes” so Raspberry Pi can find out what kind of trash you hold up for it.

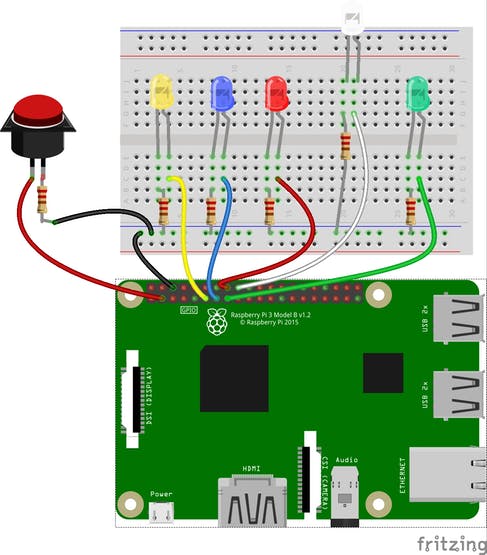
The push button and LEDs are wired up to the Raspberry Pi GPIO pins, and they work together with the camera and light up according to what the image classifier “sees”.

Here’s the fritzing diagram showing how to wire the push button and LEDS to the Raspberry Pi GPIO pins

You’ll want to create a snazzy case so your trash classifier looks good mounted on the wall. Kate cut holes in a cardboard box to make sure that the camera could “see” out, the user can see the LEDs, and the push button is accessible. Remember to leave room for Raspberry Pi’s power supply to plug in.

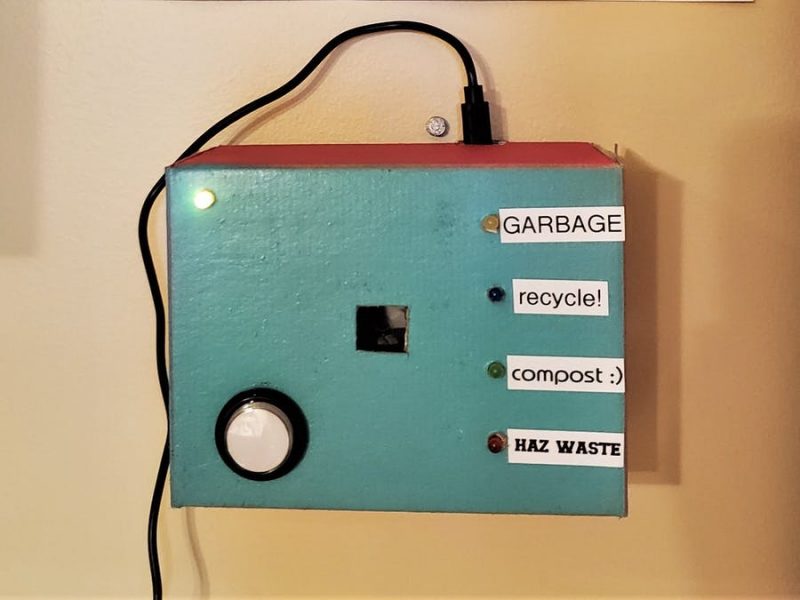
Jen’s hand-painted case mounted to the wall, having a look at a plastic bag

Jen has tonnes of other projects on her Hackster profile — check out the micro:bit Magic Wand.

The post Classify your trash with Raspberry Pi appeared first on Raspberry Pi.

Monitoring dashboard for AWS ParallelCluster

Post Syndicated from Ben Peven original https://aws.amazon.com/blogs/compute/monitoring-dashboard-for-aws-parallelcluster/

This post is contributed by Nicola Venuti, Sr. HPC Solutions Architect.

AWS ParallelCluster is an AWS-supported, open source cluster management tool that makes it easy to deploy and manage High Performance Computing (HPC) clusters on AWS. While AWS ParallelCluster includes many benefits for its users, it has not provided straightforward support for monitoring your workloads. In this post, I walk you through an add-on extension that you can use to help monitor your cloud resources with AWS ParallelCluster.

Product overview

AWS ParallelCluster offers many benefits that hide the complexity of the underlying platform and processes. Some of these benefits include:

  • Automatic resource scaling
  • A batch scheduler
  • Easy cluster management that allows you to build and rebuild your infrastructure without the need for manual actions
  • Seamless migration to the cloud supporting a wide variety of operating systems.

While all of these benefits streamline processes for you, one crucial task for HPC stakeholders that customers have found challenging with AWS ParallelCluster is monitoring.

Resources in an HPC cluster like schedulers, instances, storage, and networking are important assets to monitor, especially when you pay for what you use. Organizing and displaying all these metrics becomes challenging as the scale of the infrastructure increases or changes over time which is the typical scenario in the Cloud.

Given these challenges, AWS wants to provide AWS ParallelCluster users with two additional benefits: 1/ facilitate the optimization of price performance and 2/ visualize and monitor the components of cost for their workloads.

The HPC Solution Architects team has created an AWS ParallelCluster add-on that is easy to use and customize. In this blog post, I demonstrate how Grafana – a platform for monitoring and observability – can run on AWS ParallelCluster to enable infrastructure monitoring.

AWS ParallelCluster integrated dashboard and Grafana add-on dashboards

Many customers want a tool that consolidates information coming from different AWS services and makes it easy to monitor the computing infrastructure created and managed by AWS ParallelCluster. The AWS ParallelCluster team – just like every other service team at AWS – is open and keen to listen from our customers.

This feedback helps us inform our product roadmap and build new, customer-focused features.

We recently released AWS ParallelCluster 2.10.0 based on customer feedback. Here are some key features have been released with it:

  • Support for the CentOS 8 Operating System: Customers can now choose CentOS 8 as their base operating system of choice to run their clustersfor both x86 and Arm architectures.
  • Support for P4d instances along with NVIDIA GPUDirect Remote Direct Memory Access (RDMA).
  • FSx for Lustre enhancements (support for  FSx AutoImport and HDD-based support filesystem options)
  • And finally, a new CloudWatch Dashboards designed to help aggregating cluster information, metrics, and logging already available on CloudWatch.

The last of these features above, integrated CloudWatch Dashboards, are designed to help customers face the challenge of cluster monitoring mentioned above. In addition, the Grafana dashboards demonstrated later in this blog are a complementary add-on to this new, CloudWatch-based, dashboard. There are some key differences between the two, summarized in the table below.

The latter does not require any additional component or agent running on either the head or the compute nodes. It aggregates the metrics already pushed by AWS ParallelCluster on CloudWatch into a single dashboard. This translates into zero overhead for the cluster, but at the expense of less flexibility and expandability.

Instead, the Grafana-based dashboard offers additional flexibility and customizability and requires a few lightweight components installed on either the head or the compute nodes. Another key difference between the two monitoring dashboards is that the CloudWatch based one requires AWS credentials, IAM User and Roles configured and access to the AWS web-console, while the Grafana-based one has its-own built-in authentication and authorization system unrelated from the AWS account, end-users or HPC admins might not have permissions (or simply are not willing) to access the AWS Management Console in order to monitor their clusters.

CloudWatch based dashboard Grafana-based monitoring add-on
No additional component Grafana + Prometheus
No overhead Minimal overhead
Little to no expandability Support full customizability
Requires AWS credentials and IAM configured Custom credentials, no AWS access required
Custom user-interface

Grafana add-on dashboards on GitHub

There are many components of an HPC cluster to monitor. Moreover, the cluster is built on a system that is continuously evolving: AWS ParallelCluster and AWS services in general are updated and new features are released often. Because of this, we wanted to have a monitoring solution that is developed on flexible components, that can evolve rapidly. So, we released a Grafana add-on as an open-source project onto this GitHub repository.

Releasing it as an open-source project allows us to more easily and frequently release new updates and enhancements. It also enables users to customize and extend its functionalities by adding new dashboards, or extending the dashboards functionalities (like GPU monitoring or track EC2 Spot Instance interruptions).

At the moment, this new solution is composed of the following open-source components:

  • Grafana is an open-source platform for monitoring and observing. Grafana allows you to query, visualize, alert, and understand your metrics. It also helps you create, explore, and share dashboards fostering a data-driven culture.
  • Prometheus is an open source project for systems and service monitoring from the Cloud Native Computing Foundation. It collects metrics from configured targets at given intervals, evaluates rule expressions, displays the results, and can trigger alerts if some condition is observed to be true.
  • The Prometheus Pushgateway is an open source tool that allows ephemeral and batch jobs to expose their metrics to Prometheus.
  • NGINX is an HTTP and reverse proxy server, a mail proxy server, and a generic TCP/UDP proxy server.
  • Prometheus-Slurm-Exporter is a Prometheus collector and exporter for metrics extracted from the Slurm resource scheduling system.
  • Node_exporter is a Prometheus exporter for hardware and OS metrics exposed by *NIX kernels, written in Go with pluggable metric collectors.

Note: while almost all components are under the Apache2 license, only Prometheus-Slurm-Exporter is licensed under GPLv3. You should be aware of this license and accept its terms before proceeding and installing this component.

The dashboards

I demonstrate a few different Grafana dashboards in this post. These dashboards are available for you in the AWS Samples GitHub repository. In addition, two dashboards – still under development – are proposed in beta. The first shows the cluster logs coming from Amazon CloudWatch Logs. The second one shows the costs associated to each AWS service utilized.

All these dashboards can be used as they are or customized as you need:

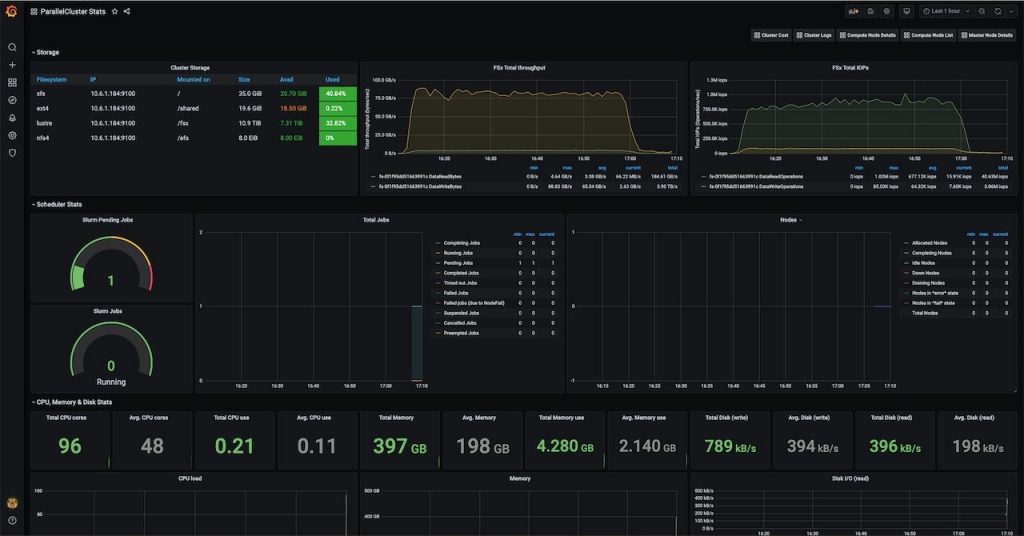
  • AWS ParallelCluster Summary – This is the main dashboard that shows general monitoring info and metrics for the whole cluster. It includes: Slurm metrics, compute related metrics, storage performance metrics, and network usage.

ParallelCluster dashboard

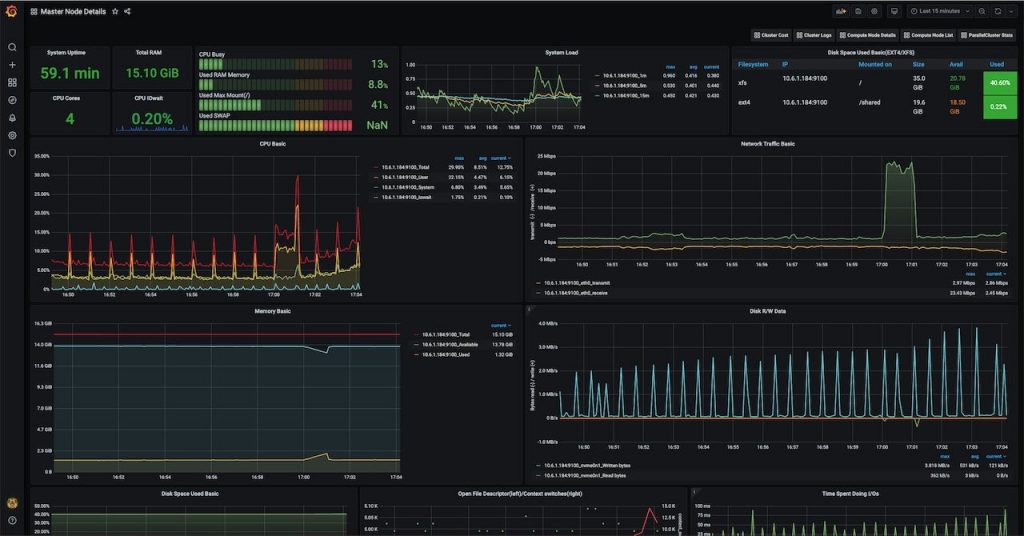
  • Master Node Details – This dashboard shows detailed metrics for the head node, including CPU, memory, network, and storage utilization.

Master node details

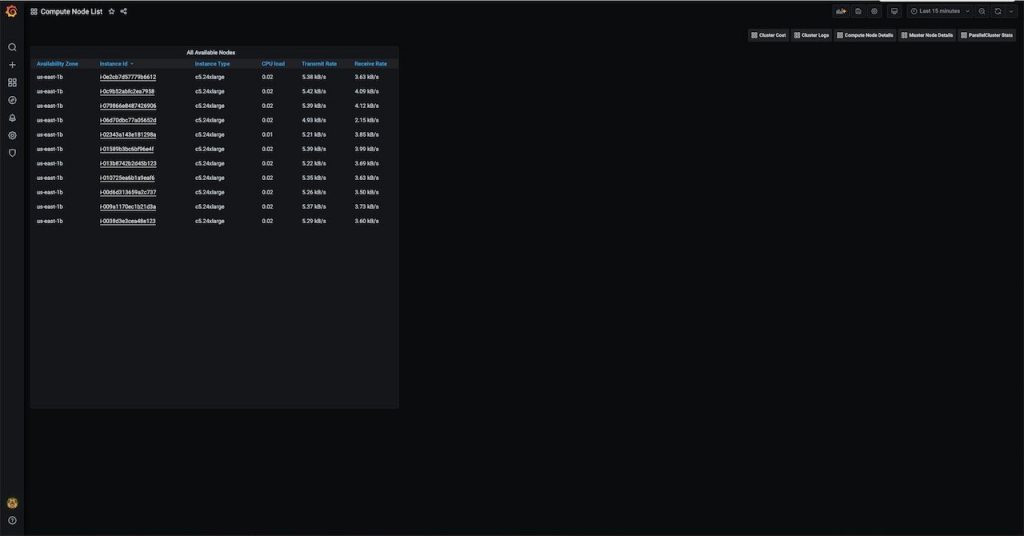
  • Compute Node List – This dashboard shows the list of the available compute nodes. Each entry is a link to a more detailed dashboard: the compute node details (see the following image).

Compute node list

  • Compute Node Details – Similar to the head node details, this dashboard shows detailed metrics for the compute nodes.
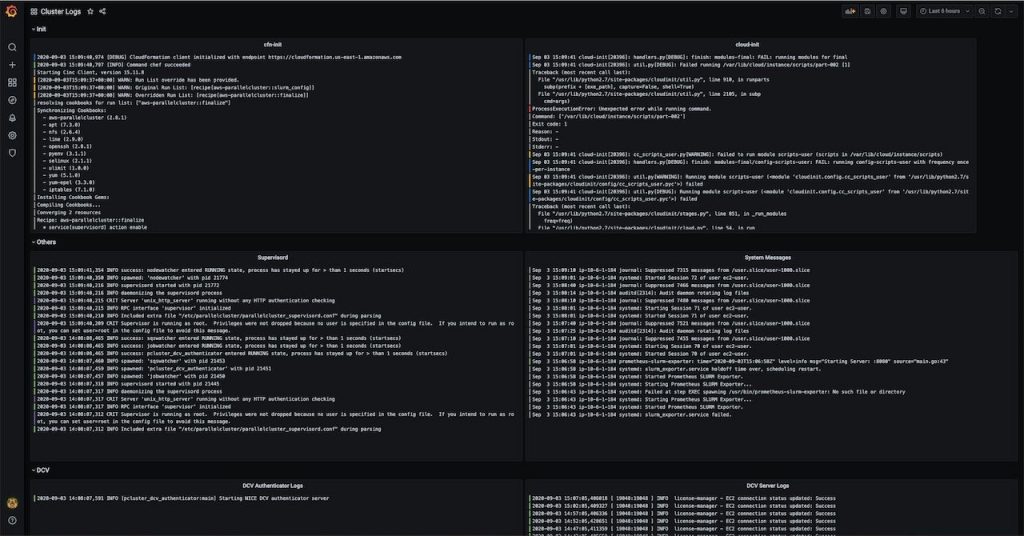
  • Cluster Logs – This dashboard (still under development) shows all the logs of your HPC cluster. The logs are pushed by AWS ParallelCluster to Amazon CloudWatch Logs and are reported here.

Cluster logs

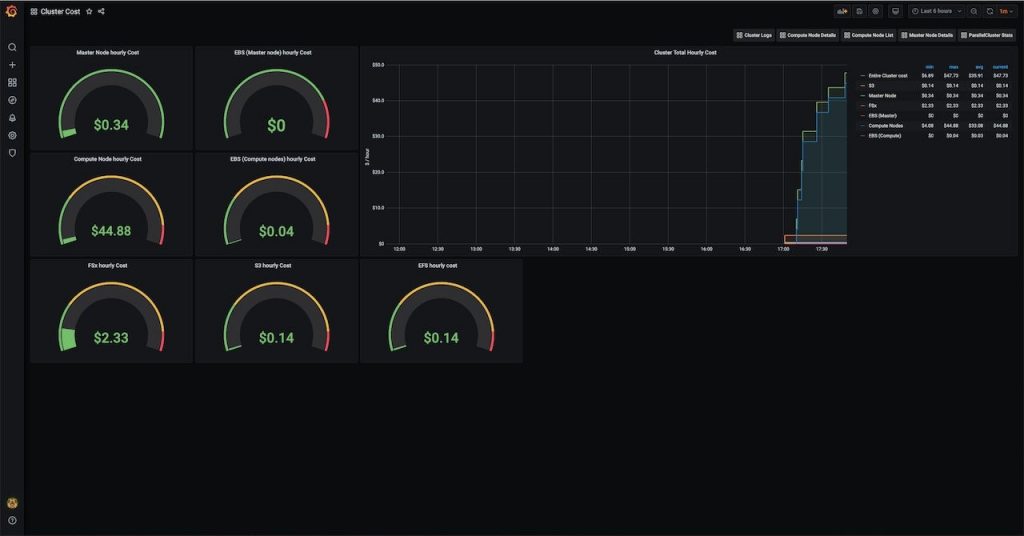
  • Cluster Costs (also under development) – This dashboard shows the cost associated to AWS Service utilized by your cluster. It includes: EC2, Amazon EBS, FSx, Amazon S3, Amazon EFS. as well as an aggregation of all the costs of every single component.

Cluster costs

How to deploy it

You can simply use the post-install script that you can find in this GitHub repo as it is, or customize it as you need. For instance, you might want to change your Grafana password to something more secure and meaningful for you, or you might want to customize some dashboards by adding additional components to monitor.

#Load AWS Parallelcluster environment variables
. /etc/parallelcluster/cfnconfig
#get GitHub repo to clone and the installation script
monitoring_url=$(echo ${cfn_postinstall_args}| cut -d ',' -f 1 )
monitoring_dir_name=$(echo ${cfn_postinstall_args}| cut -d ',' -f 2 )
monitoring_tarball="${monitoring_dir_name}.tar.gz"
setup_command=$(echo ${cfn_postinstall_args}| cut -d ',' -f 3 )
monitoring_home="/home/${cfn_cluster_user}/${monitoring_dir_name}"
case ${cfn_node_type} in
    MasterServer)
        wget ${monitoring_url} -O ${monitoring_tarball}
        mkdir -p ${monitoring_home}
        tar xvf ${monitoring_tarball} -C ${monitoring_home} --strip-components 1
    ;;
    ComputeFleet)
    ;;
esac
#Execute the monitoring installation script
bash -x "${monitoring_home}/parallelcluster-setup/${setup_command}" >/tmp/monitoring-setup.log 2>&1
exit $?

The proposed post-install script takes care of installing and configuring everything for you. Although a few additional parameters are needed in the AWS ParallelCluster configuration file: the post-install argument, additional IAM policies, custom security group, and a tag. You can find an AWS ParallelCluster template here.

Please note that, at the moment, the post install script has only been tested using Amazon Linux 2.

Add the following parameters to your AWS ParallelCluster configuration file, and then build up your cluster:

base_os = alinux2
post_install = s3://<my-bucket-name>/post-install.sh
post_install_args = https://github.com/aws-samples/aws-parallelcluster-monitoring/tarball/main,aws-parallelcluster-monitoring,install-monitoring.sh
additional_iam_policies = arn:aws:iam::aws:policy/CloudWatchFullAccess,arn:aws:iam::aws:policy/AWSPriceListServiceFullAccess,arn:aws:iam::aws:policy/AmazonSSMFullAccess,arn:aws:iam::aws:policy/AWSCloudFormationReadOnlyAccess
tags = {"Grafana" : "true"}

Make sure that port 80 and port 443 of your head node are accessible from the internet or from your network. You can achieve this by creating the appropriate security group via AWS Management Console or via Command Line Interface (AWS CLI), see the following example:

aws ec2 create-security-group --group-name my-grafana-sg --description "Open Grafana dashboard ports" —vpc-id vpc-1a2b3c4d
aws ec2 authorize-security-group-ingress --group-id sg-12345 --protocol tcp --port 443 —cidr 0.0.0.0/0
aws ec2 authorize-security-group-ingress --group-id sg-12345 --protocol tcp --port 80 —cidr 0.0.0.0/0

There is more information on how to create your security groups here.

Finally, set the additional_sg parameter in the [VPC] section of your AWS ParallelCluster configuration file.

After your cluster is created, you can open a web-browser and connect to https://your_public_ip. You should see a landing page with links to the Prometheus database service and the Grafana dashboards.

Size your compute and head nodes

We looked into resource utilization of the components required for building this monitoring solution. In particular, the Prometheus node exporter installed in the compute nodes uses a small (almost negligible) number of CPU cycles, memory, and network.

Depending on the size of your cluster the components installed on the head node (see the list in the chapter “Solution components” of this blog) it might require additional CPU, memory and network capabilities. In particular, if you expect to run a large-scale cluster (hundreds of instances) because of the higher volume of network traffic due to the compute nodes continuously pushing metrics into the head node, we recommend you use an instance type bigger than what you planned.

We cannot advise you exactly how to size your head node because there are many factors that can influence resource utilization. The best recommendation we could give you is to use the Grafana dashboard itself to monitor the CPU, memory, disk, and most importantly, network utilization, and then resize your head node (or other components) accordingly.

Conclusions

This monitoring solution for AWS ParallelCluster is an add-on for your HPC Cluster on AWS and a complement to new features recently released in AWS ParallelCluster 2.10. This blog aimed to provide you with instructions and basic tooling that can be customized based on your needs and that can be adapted quickly as the underlying AWS services evolve.

We are open to hear from you, receive feedback, issues, and pull requests to extend its functionalities.

The US Military Buys Commercial Location Data

Post Syndicated from Bruce Schneier original https://www.schneier.com/blog/archives/2020/11/the-us-military-buys-commercial-location-data.html

Vice has a long article about how the US military buys commercial location data worldwide.

The U.S. military is buying the granular movement data of people around the world, harvested from innocuous-seeming apps, Motherboard has learned. The most popular app among a group Motherboard analyzed connected to this sort of data sale is a Muslim prayer and Quran app that has more than 98 million downloads worldwide. Others include a Muslim dating app, a popular Craigslist app, an app for following storms, and a “level” app that can be used to help, for example, install shelves in a bedroom.

This isn’t new, this isn’t just data of non-US citizens, and this isn’t the US military. We have lots of instances where the government buys data that it cannot legally collect itself.

Some app developers Motherboard spoke to were not aware who their users’ location data ends up with, and even if a user examines an app’s privacy policy, they may not ultimately realize how many different industries, companies, or government agencies are buying some of their most sensitive data. U.S. law enforcement purchase of such information has raised questions about authorities buying their way to location data that may ordinarily require a warrant to access. But the USSOCOM contract and additional reporting is the first evidence that U.S. location data purchases have extended from law enforcement to military agencies.

Tracking the latest server images in Amazon EC2 Image Builder pipelines

Post Syndicated from Eric Johnson original https://aws.amazon.com/blogs/compute/tracking-the-latest-server-images-in-amazon-ec2-image-builder-pipelines/

This post courtesy of Anoop Rachamadugu, Cloud Architect at AWS

The Amazon EC2 Image Builder service helps users to build and maintain server images. The images created by EC2 Image Builder can be used with Amazon Elastic Compute Cloud (EC2) and on-premises. Image Builder reduces the effort of keeping images up-to-date and secure by providing a graphical interface, built-in automation, and AWS-provided security settings. Customers have told us that they manage multiple server images and are looking for ways to track the latest server images created by the pipelines.

In this blog post, I walk through a solution that uses AWS Lambda and AWS Systems Manager (SSM) Parameter Store. It tracks and updates the latest Amazon Machine Image (AMI) IDs every time an Image Builder pipeline is run. With Lambda, you pay only for what you use. You are charged based on the number of requests for your functions and the time it takes for your code to run. In this case, the Lambda function is invoked upon the completion of the image builder pipeline. Standard SSM parameters are available at no additional charge.

Users can reference the SSM parameters in automation scripts and AWS CloudFormation templates providing access to the latest AMI ID for your EC2 infrastructure. Consider the use case of updating Amazon Machine Image (AMI) IDs for the EC2 instances in your CloudFormation templates. Normally, you might map AMI IDs to specific instance types and Regions. Then to update these, you would manually change them in each of your templates. With the SSM parameter integration, your code remains untouched and a CloudFormation stack update operation automatically fetches the latest Parameter Store value.

Overview

This solution uses a Lambda function written in Python that subscribes to an Amazon Simple Notification Service (SNS) topic. The Lambda function and the SNS topic are deployed using AWS SAM CLI. Once deployed, the SNS topic must be configured in an existing Image Builder pipeline. This results in the Lambda function being invoked at the completion of the Image Builder pipeline.

When a Lambda function subscribes to an SNS topic, it is invoked with the payload of the published messages. The Lambda function receives the message payload as an input parameter. The Lambda function first checks the message payload to see if the image status is available. If the image state is available, it retrieves the AMI ID from the message payload and updates the SSM parameter.

EC2 Image builder architecture diagram

EC2 Image builder architecture diagram

Prerequisites

To get started with this solution, the following is required:

Deploying the solution

The solution consists of two files, which can be downloaded from the amazon-ec2-image-builder GitHub repository.

  1. The Python file image-builder-lambda-update-ssm.py contains the code for the Lambda function. It first checks the SNS message payload to determine if the image is available. If it’s available, it extracts the AMI ID from the SNS message payload and updates the SSM parameter specified.The ‘ssm_parameter_name’ variable specifies the SSM parameter path where the AMI ID should be stored and updated. The Lambda function finishes by adding tags to the SSM parameter.
  2. The template.yaml file is an AWS SAM template. It deploys the Lambda function, SNS topic, and IAM role required for the Lambda function. I use Python 3.7 as the runtime and assign a memory of 256 MB for the Lambda function. The IAM policy gives the Lambda function permissions to retrieve and update SSM parameters. Deploy this application using the AWS SAM CLI guided deploy:
    sam deploy --guided

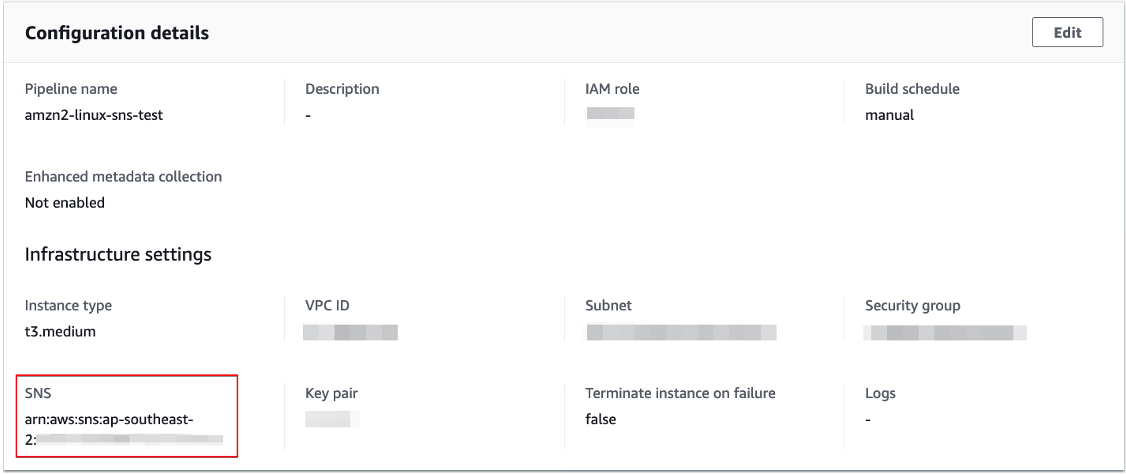
After deploying the application, note the ARN of the created SNS topic. Next, update the infrastructure settings of an existing Image Builder pipeline with this newly created SNS topic. This results in the Lambda function being invoked upon the completion of the image builder pipeline.

Configuration details

Configuration details

Verifying the solution

After the completion of the image builder pipeline, use the AWS CLI or check the AWS Management Console to verify the updated SSM parameter. To verify via AWS CLI, run the following commands to retrieve and list the tags attached to the SSM parameter:

aws ssm get-parameter --name ‘/ec2-imagebuilder/latest’
aws ssm list-tags-for-resource --resource-type "Parameter" --resource-id ‘/ec2-imagebuilder/latest’

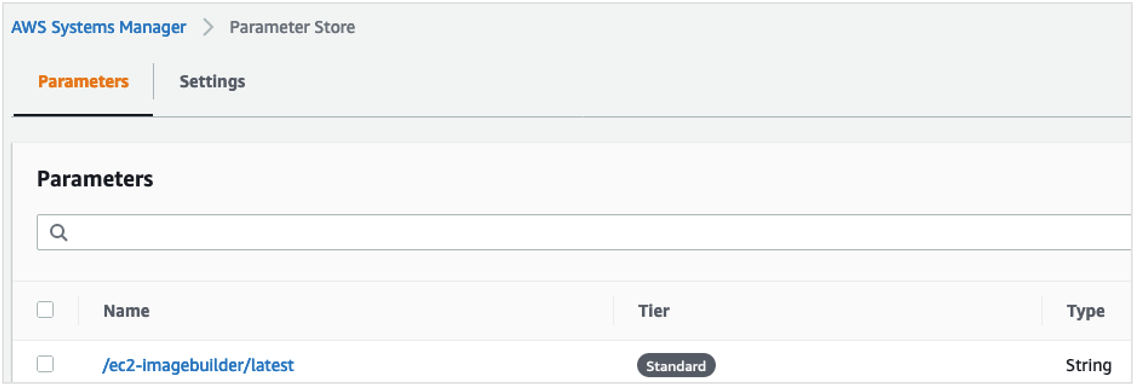
To verify via the AWS Management Console, navigate to the Parameter Store under AWS Systems Manager. Search for the parameter /ec2-imagebuilder/latest:

AWS Systems Manager: Parameter Store

AWS Systems Manager: Parameter Store

Select the Tags tab to view the tags attached to the SSM parameter:

Image builder tags list

Image builder tags list

Referencing the SSM Parameter in CloudFormation templates

Users can reference the SSM parameters in automation scripts and AWS CloudFormation templates providing access to the latest AMI ID for your EC2 infrastructure. This sample code shows how to reference the SSM parameter in a CloudFormation template.

Parameters :
  LatestAmiId :
    Type : 'AWS::SSM::Parameter::Value<AWS::EC2::Image::Id>'
    Default: ‘/ec2-imagebuilder/latest’

Resources :
  Instance :
    Type : 'AWS::EC2::Instance'
    Properties :
      ImageId : !Ref LatestAmiId

Conclusion

In this blog post, I demonstrate a solution that allows users to track and update the latest AMI ID created by the Image Builder pipelines. The Lambda function retrieves the AMI ID of the image created by a pipeline and update an AWS Systems Manager parameter. This Lambda function is triggered via an SNS topic configured in an Image Builder pipeline.

The solution is deployed using AWS SAM CLI. I also note how users can reference Systems Manager parameters in AWS CloudFormation templates providing access to the latest AMI ID for your EC2 infrastructure.

The amazon-ec2-image-builder-samples GitHub repository provides a number of examples for getting started with EC2 Image Builder. Image Builder can make it easier for you to build virtual machine (VM) images.

Performing canary deployments for service integrations with Amazon API Gateway

Post Syndicated from Eric Johnson original https://aws.amazon.com/blogs/compute/performing-canary-deployments-for-service-integrations-with-amazon-api-gateway/

This post authored by Dhiraj Thakur and Sameer Goel, Solutions Architects at AWS.

When building serverless web applications, it is common to use AWS Lambda functions as the compute layer for business logic. To manage canary releases, it’s best practice to use Lambda deployment preferences. However, if you use Amazon API Gateway service integrations instead of Lambda functions, it is necessary to manage the canary release at the API level. This post shows how to use canary releases in REST APIs to gradually deploy changes to serverless applications.

Overview

Modern applications frequently deploy updates to implement new features. But updating or changing a production application is often risky and may introduce bugs. Canary deployments are a popular strategy to help mitigate this risk.

In a canary deployment, you partially deploy a new software feature and shift some percentage of traffic to a new version of the application. This allows you to verify stability and reduce risk associated with the new release. After gaining confidence in the new version, you continually increment traffic until all traffic flows to the new release. Additionally, a canary deployment can be a cost-effective approach as there is no need to duplicate application resources, compared with other deployment strategies such as blue/green deployments.

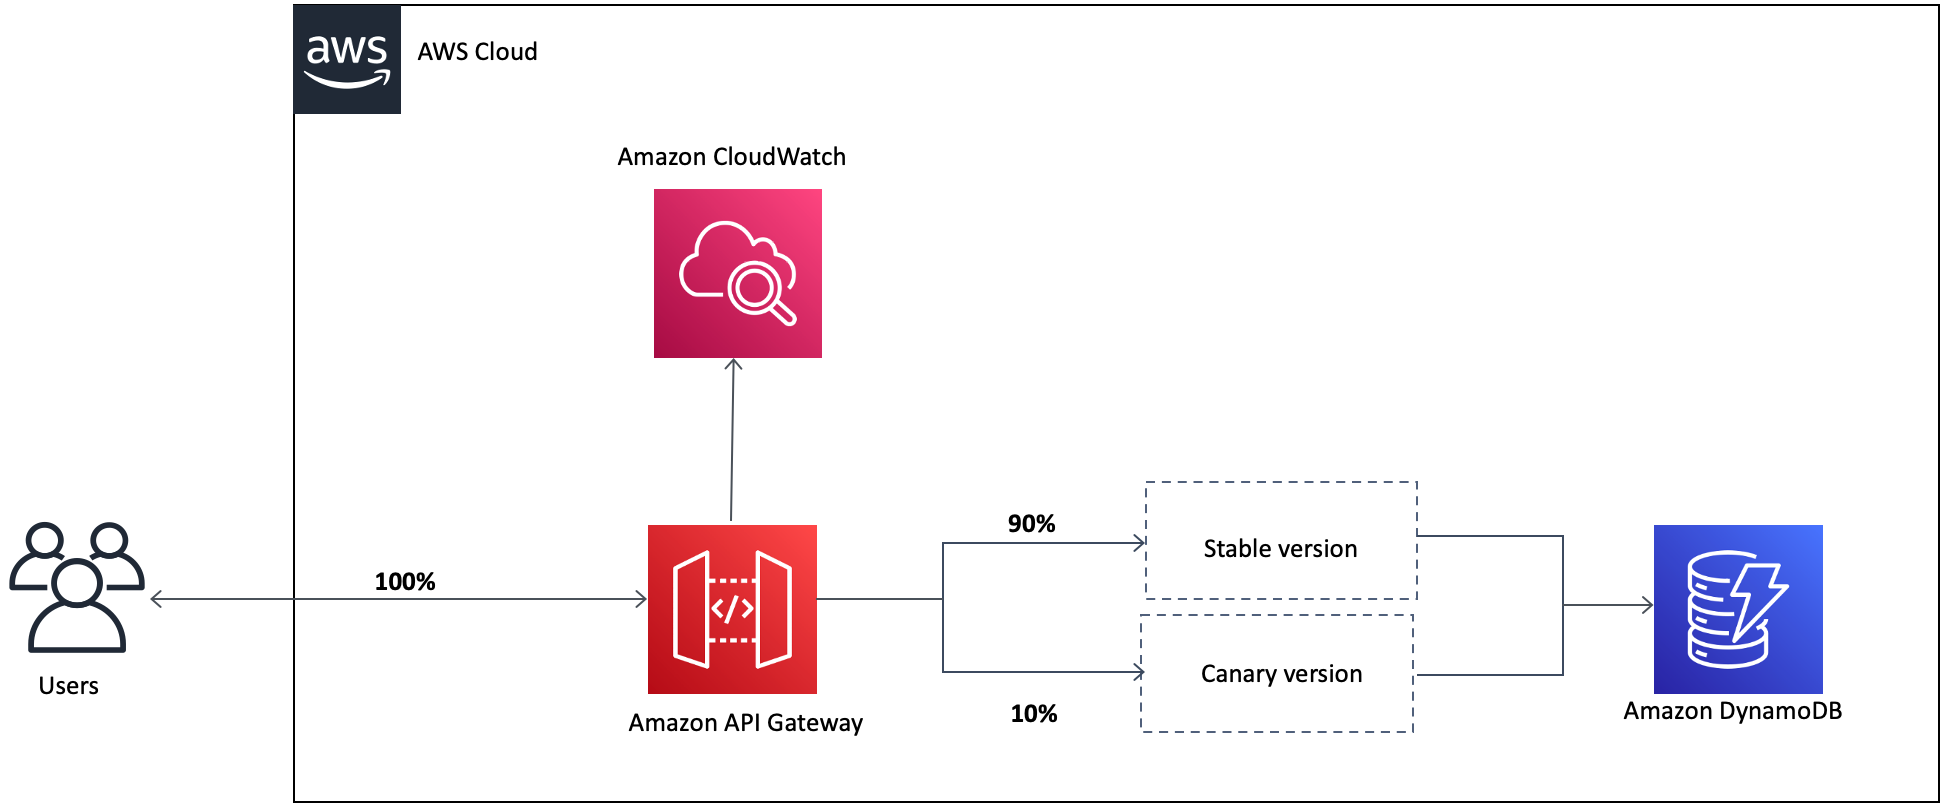
In this example, there are two service versions deployed with API Gateway. The canary version receives 10% of traffic and the remaining 90% is routed to the stable version.

Canary deploy example

Canary deploy example

After deploying the new version, you can test the health and performance of the new version. Once you are confident that it is ready for release, you can promote the canary version and send 100% of traffic to this API version.

Promoted deployment example

Promoted deployment example

In this post, I show how to use AWS Serverless Application Model (AWS SAM) to build a canary release with a REST API in API Gateway. This is an open-source framework for building serverless applications. It enables developers to define and deploy canary releases and then shift the traffic programmatically. In this example, AWS SAM creates the canary settings necessary to divide traffic and the IAM role used by API Gateway.

API Gateway canary deployment example

For this tutorial, a REST API integrates directly with Amazon DynamoDB. This returns three data attributes from the DynamoDB table. In the canary version, the code is modified to provide additional information from the table.

Create Amazon REST API and other resources

Download the code from this post from https://github.com/aws-samples/amazon-api-gateway-canary-deployment. The template.yaml file is the AWS SAM configuration for the application, and the api.yaml is the OpenAPI configuration for the API. Deploy this application by following the instructions in the README.md file.

The deployment creates an empty DynamoDB table called “<sam-stack-name>-DataTable-*” and an API Gateway REST API called “Canary Deployment” with the stage “PROD”.

  1. Run the Amazon DynamoDB put-item command to create a new item in the DynamoDB table from the AWS CLI. Ensure you have configured AWS CLI – refer to the quickstart guide to learn more.Replace <tablename> with the DynamoDB table name.
    aws dynamodb put-item --table-name <tablename> --item "{""country"":{""S"":""Germany""},""runner-up"":{""S"":""France""},""winner"":{""S"":""Italy""},""year"":{""S"":""2006""}}" --return-consumed-capacity TOTAL

    It returns a success message:

    Update Amazon DynamoDB output

    Update Amazon DynamoDB output

    You can verify the record in the DynamoDB table in the AWS Management Console:

    Scan of Amazon DynamoDB table

    Scan of Amazon DynamoDB table

  2. Select the REST API “Canary Deployment” in Amazon API Gateway. Choose “GET” under the resource section. In the Integration Request, you see the Mapping Template:
    {
      "Key": {
        "year": {
          "S": "$input.params("year")"
        }
      },
      "TableName": "<stack-name>-DataTable-<random-string>"
    }

    The Integration Response is an HTTP response encapsulating the backend response and template looks like this:The TableName indicates which table is used in the REST API call. The value for year is extracted from the request URL using $input.params(‘year’)

    {
      "year": "$input.path('$.Item.year.S')",
      "country": "$input.path('$.Item.country.S')",
      "winner": "$input.path('$.Item.winner.S')"
    }

    It returns the “country”, “year”, “winner” attributes.

  3. You can also check the logs/tracing configuration in the API stage as per the following settings. You can see Amazon CloudWatch Logs are enabled for the API, which helps to check the health of the canary API version.For example, a response code of 2xx indicates that the operation was successful. Other error codes indicate either a client error (4xx) or a server error (5xx). See this link for status code details. Analyze the status of the API in the logs before promoting the canary.

    Enabling logs on the Amazon API Gateway console

    Enabling logs on the Amazon API Gateway console

If you invoke the API endpoint URL in your browser, you can see it returns “country”, “year” and “winner”, as expected from the DynamoDB table.

Invoking endpoint from browser example

Invoking endpoint from browser example

Next, set up the canary release deployment to create a new version of the deployed API and route 10% of the API traffic to it.

Canary deployment

You can now create a new version of the API using the AWS SAM template, which changes the number of attributes returned. With the new version of the API, the additional attribute “runner-up” is returned from the DynamoDB table. For the initial deployment, 10% of API traffic is routed to this API version.

  1. Go to the canary-stack directory and deploy the application. Be sure to use the same stack name that you used for the previous deployment:
    sam deploy -gAWS CloudFormation deploys the canary version and configures the API to route 10% of traffic the new version.You can validate this by checking the canary setting in the PROD stage. You can see “percentage of requests directed to canary” (new version) is “10%” and “percentage of requests directed to Prod” (previous version) is 90%.
  2. Check the Integration Response. The modified template looks like this:
    {
      "year": "$input.path('$.Item.year.S')",
      "country": "$input.path('$.Item.country.S')",
      "winner": "$input.path('$.Item.winner.S')",
      "runner-up": "$input.path('$.Item.runner-up.S')"
    }
  3. Now, test the canary deployment using the API endpoint URL. You can refresh the browser and see the “runner-up” results shown for a small percentage of requests. This demonstrates that 10% of the traffic is routed to the canary. If don’t see this new attribute, even after multiple refreshes, clear your browser cache.Reviewing the Integration Response, you can see that the template now includes the additional attribute “runner-up”. This returns “country”, “year”, “winner” and “runner-up”, as per the new canary release requirement.

    Testing response in browser after change

    Testing response in browser after change

Analyze Amazon CloudWatch Logs

You can analyze the health of the canary version via Amazon CloudWatch Logs. To ensure that there is data in CloudWatch Logs, refresh your browser several times when accessing the API URL.

  1. In the AWS Management Console, navigate to Services -> CloudWatch.
  2. Choose the Region that matches your API Gateway Region, then select Logs on the Left menu.
  3. The logs for API Gateway are named based on the ID of the API. The form is “API-Gateway-Execution-Logs_<api id>/<api stage>
    Viewing the logs, you can see a list of log streams with GUID identifiers. Use the Last Event Time column for a date/time stamp and find a recent execution.
  4. Analyze the canary log to confirm that the REST API call is successful.
Canary promotion options

Canary promotion options

Promote or delete the canary version

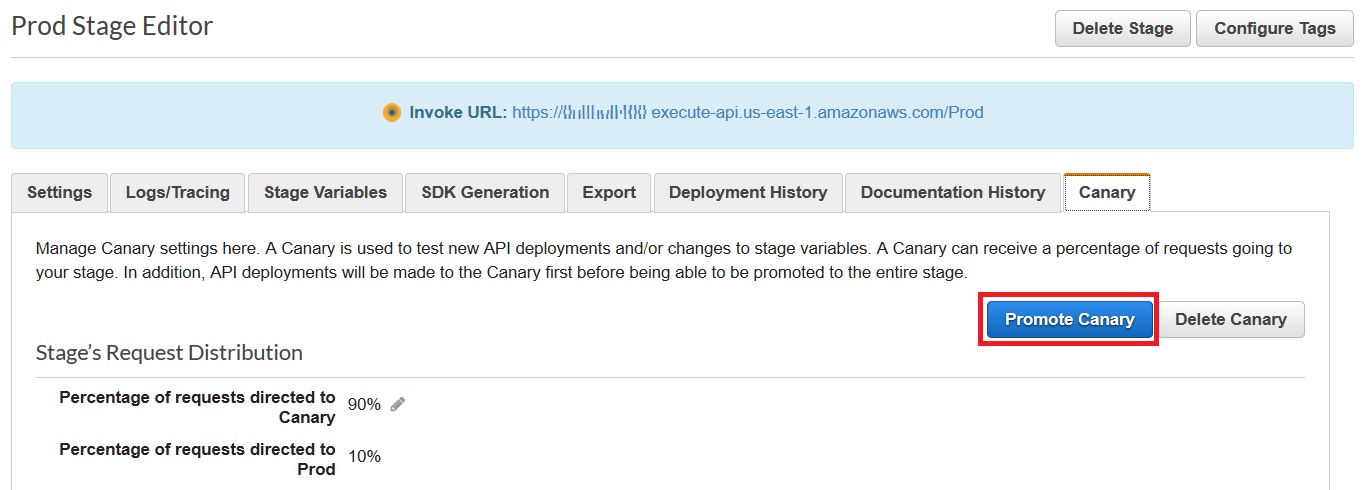
To roll back to the initial version, choose Delete Canary or set “Percentage of requests directed to Canary“ to 0. If the Amazon CloudWatch analysis shows that the canary version is operating successfully, you are ready to promote the canary to receive all API traffic.

  1. Navigate to the Canary tab and choose Promote Canary.

    Promoting the canary in the Amazon API Gateway console

    Promoting the canary in the Amazon API Gateway console

  2. Choose Update to accept the settings. This sends 100% traffic to the new version.

    Canary promotion options

    Canary promotion options

Cleanup

See the repo’s README.md for cleanup instructions.

Conclusion

Canary deployments are a recommended practice for testing new versions of applications. This blog post shows how to implement canary deployments for service integrations in API Gateway. I walk through how to analyze the logs generated for canary requests and promote the canary to complete the deployment. Using AWS SAM, you deploy a canary in API Gateway with a predefined routing configuration and strategy.

To learn more, read Building APIs with Amazon API Gateway and Implementing safe AWS Lambda deployments with AWS CodeDeploy.

Michael Ellis as NSA General Counsel

Post Syndicated from Bruce Schneier original https://www.schneier.com/blog/archives/2020/11/michael-ellis-as-nsa-general-counsel.html

Over at Lawfare, Susan Hennessey has an excellent primer on how Trump loyalist Michael Ellis got to be the NSA General Counsel, over the objections of NSA Director Paul Nakasone, and what Biden can and should do about it.

While important details remain unclear, media accounts include numerous indications of irregularity in the process by which Ellis was selected for the job, including interference by the White House. At a minimum, the evidence of possible violations of civil service rules demand immediate investigation by Congress and the inspectors general of the Department of Defense and the NSA.

The moment also poses a test for President-elect Biden’s transition, which must address the delicate balance between remedying improper politicization of the intelligence community, defending career roles against impermissible burrowing, and restoring civil service rules that prohibit both partisan favoritism and retribution. The Biden team needs to set a marker now, to clarify the situation to the public and to enable a new Pentagon general counsel to proceed with credibility and independence in investigating and potentially taking remedial action upon assuming office.

The NSA general counsel is not a Senate-confirmed role. Unlike the general counsels of the CIA, Pentagon and Office of the Director of National Intelligence (ODNI), all of which require confirmation, the NSA’s general counsel is a senior career position whose occupant is formally selected by and reports to the general counsel of the Department of Defense. It’s an odd setup — ­and one that obscures certain realities, like the fact that the NSA general counsel in practice reports to the NSA director. This structure is the source of a perennial legislative fight. Every few years, Congress proposes laws to impose a confirmation requirement as more appropriately befits an essential administration role, and every few years, the executive branch opposes those efforts as dangerously politicizing what should be a nonpolitical job.

While a lack of Senate confirmation reduces some accountability and legislative screening, this career selection process has the benefit of being designed to eliminate political interference and to ensure the most qualified candidate is hired. The system includes a complex set of rules governing a selection board that interviews candidates, certifies qualifications and makes recommendations guided by a set of independent merit-based principles. The Pentagon general counsel has the final call in making a selection. For example, if the panel has ranked a first-choice candidate, the general counsel is empowered to choose one of the others.

Ryan Goodman has a similar article at Just Security.

On Blockchain Voting

Post Syndicated from Bruce Schneier original https://www.schneier.com/blog/archives/2020/11/on-blockchain-voting.html

Blockchain voting is a spectacularly dumb idea for a whole bunch of reasons. I have generally quoted Matt Blaze:

Why is blockchain voting a dumb idea? Glad you asked.

For starters:

  • It doesn’t solve any problems civil elections actually have.
  • It’s basically incompatible with “software independence”, considered an essential property.
  • It can make ballot secrecy difficult or impossible.

I’ve also quoted this XKCD cartoon.

But now I have this excellent paper from MIT researchers:

“Going from Bad to Worse: From Internet Voting to Blockchain Voting”
Sunoo Park, Michael Specter, Neha Narula, and Ronald L. Rivest

Abstract: Voters are understandably concerned about election security. News reports of possible election interference by foreign powers, of unauthorized voting, of voter disenfranchisement, and of technological failures call into question the integrity of elections worldwide.This article examines the suggestions that “voting over the Internet” or “voting on the blockchain” would increase election security, and finds such claims to be wanting and misleading. While current election systems are far from perfect, Internet- and blockchain-based voting would greatly increase the risk of undetectable, nation-scale election failures.Online voting may seem appealing: voting from a computer or smart phone may seem convenient and accessible. However, studies have been inconclusive, showing that online voting may have little to no effect on turnout in practice, and it may even increase disenfranchisement. More importantly: given the current state of computer security, any turnout increase derived from with Internet- or blockchain-based voting would come at the cost of losing meaningful assurance that votes have been counted as they were cast, and not undetectably altered or discarded. This state of affairs will continue as long as standard tactics such as malware, zero days, and denial-of-service attacks continue to be effective.This article analyzes and systematizes prior research on the security risks of online and electronic voting, and show that not only do these risks persist in blockchain-based voting systems, but blockchains may introduce additional problems for voting systems. Finally, we suggest questions for critically assessing security risks of new voting system proposals.

You may have heard of Voatz, which uses blockchain for voting. It’s an insecure mess. And this is my general essay on blockchain. Short summary: it’s completely useless.

Upcoming Speaking Engagements

Post Syndicated from Bruce Schneier original https://www.schneier.com/blog/archives/2020/11/upcoming-speaking-engagements-3.html

This is a current list of where and when I am scheduled to speak:

The list is maintained on this page.

Friday Squid Blogging: Underwater Robot Uses Squid-Like Propulsion

Post Syndicated from Bruce Schneier original https://www.schneier.com/blog/archives/2020/11/friday-squid-blogging-underwater-robot-uses-squid-like-propulsion.html

This is neat:

By generating powerful streams of water, UCSD’s squid-like robot can swim untethered. The “squidbot” carries its own power source, and has the room to hold more, including a sensor or camera for underwater exploration.

As usual, you can also use this squid post to talk about the security stories in the news that I haven’t covered.

Read my blog posting guidelines here.

Inrupt’s Solid Announcement

Post Syndicated from Bruce Schneier original https://www.schneier.com/blog/archives/2020/11/inrupts-solid-announcement.html

Earlier this year, I announced that I had joined Inrupt, the company commercializing Tim Berners-Lee’s Solid specification:

The idea behind Solid is both simple and extraordinarily powerful. Your data lives in a pod that is controlled by you. Data generated by your things — your computer, your phone, your IoT whatever — is written to your pod. You authorize granular access to that pod to whoever you want for whatever reason you want. Your data is no longer in a bazillion places on the Internet, controlled by you-have-no-idea-who. It’s yours. If you want your insurance company to have access to your fitness data, you grant it through your pod. If you want your friends to have access to your vacation photos, you grant it through your pod. If you want your thermostat to share data with your air conditioner, you give both of them access through your pod.

This week, Inrupt announced the availability of the commercial-grade Enterprise Solid Server, along with a small but impressive list of initial customers of the product and the specification (like the UK National Health Service). This is a significant step forward to realizing Tim’s vision:

The technologies we’re releasing today are a component of a much-needed course correction for the web. It’s exciting to see organizations using Solid to improve the lives of everyday people — through better healthcare, more efficient government services and much more.

These first major deployments of the technology will kick off the network effect necessary to ensure the benefits of Solid will be appreciated on a massive scale. Once users have a Solid Pod, the data there can be extended, linked, and repurposed in valuable new ways. And Solid’s growing community of developers can be rest assured that their apps will benefit from the widespread adoption of reliable Solid Pods, already populated with valuable data that users are empowered to share.

A few news articles. Slashdot thread.

New Zealand Election Fraud

Post Syndicated from Bruce Schneier original https://www.schneier.com/blog/archives/2020/11/new-zealand-election-fraud.html

It seems that this election season has not gone without fraud. In New Zealand, a vote for “Bird of the Year” has been marred by fraudulent votes:

More than 1,500 fraudulent votes were cast in the early hours of Monday in the country’s annual bird election, briefly pushing the Little-Spotted Kiwi to the top of the leaderboard, organizers and environmental organization Forest & Bird announced Tuesday.

Those votes — which were discovered by the election’s official scrutineers — have since been removed. According to election spokesperson Laura Keown, the votes were cast using fake email addresses that were all traced back to the same IP address in Auckland, New Zealand’s most populous city.

It feels like writing this story was a welcome distraction from writing about the US election:

“No one has to worry about the integrity of our bird election,” she told Radio New Zealand, adding that every vote would be counted.

Asked whether Russia had been involved, she denied any “overseas interference” in the vote.

I’m sure that’s a relief to everyone involved.

“Privacy Nutrition Labels” in Apple’s App Store

Post Syndicated from Bruce Schneier original https://www.schneier.com/blog/archives/2020/11/privacy-nutrition-labels-in-apples-app-store.html

Apple will start requiring standardized privacy labels for apps in its app store, starting in December:

Apple allows data disclosure to be optional if all of the following conditions apply: if it’s not used for tracking, advertising or marketing; if it’s not shared with a data broker; if collection is infrequent, unrelated to the app’s primary function, and optional; and if the user chooses to provide the data in conjunction with clear disclosure, the user’s name or account name is prominently displayed with the submission.

Otherwise, the privacy labeling is mandatory and requires a fair amount of detail. Developers must disclose the use of contact information, health and financial data, location data, user content, browsing history, search history, identifiers, usage data, diagnostics, and more. If a software maker is collecting the user’s data to display first or third-party adverts, this has to be disclosed.

These disclosures then get translated to a card-style interface displayed with app product pages in the platform-appropriate App Store.

The concept of a privacy nutrition label isn’t new, and has been well-explored at CyLab at Carnegie Mellon University.

The Security Failures of Online Exam Proctoring

Post Syndicated from Bruce Schneier original https://www.schneier.com/blog/archives/2020/11/the-security-failures-of-online-exam-proctoring.html

Proctoring an online exam is hard. It’s hard to be sure that the student isn’t cheating, maybe by having reference materials at hand, or maybe by substituting someone else to take the exam for them. There are a variety of companies that provide online proctoring services, but they’re uniformly mediocre:

The remote proctoring industry offers a range of services, from basic video links that allow another human to observe students as they take exams to algorithmic tools that use artificial intelligence (AI) to detect cheating.

But asking students to install software to monitor them during a test raises a host of fairness issues, experts say.

“There’s a big gulf between what this technology promises, and what it actually does on the ground,” said Audrey Watters, a researcher on the edtech industry who runs the website Hack Education.

“(They) assume everyone looks the same, takes tests the same way, and responds to stressful situations in the same way.”

The article discusses the usual failure modes: facial recognition systems that are more likely to fail on students with darker faces, suspicious-movement-detection systems that fail on students with disabilities, and overly intrusive systems that collect all sorts of data from student computers.

I teach cybersecurity policy at the Harvard Kennedy School. My solution, which seems like the obvious one, is not to give timed closed-book exams in the first place. This doesn’t work for things like the legal bar exam, which can’t modify itself so quickly. But this feels like an arms race where the cheater has a large advantage, and any remote proctoring system will be plagued with false positives.

Building Serverless Land: Part 2 – An auto-building static site

Post Syndicated from Benjamin Smith original https://aws.amazon.com/blogs/compute/building-serverless-land-part-2-an-auto-building-static-site/

In this two-part blog series, I show how serverlessland.com is built. This is a static website that brings together all the latest blogs, videos, and training for AWS serverless. It automatically aggregates content from a number of sources. The content exists in a static JSON file, which generates a new static site each time it is updated. The result is a low-maintenance, low-latency serverless website, with almost limitless scalability.

A companion blog post explains how to build an automated content aggregation workflow to create and update the site’s content. In this post, you learn how to build a static website with an automated deployment pipeline that re-builds on each GitHub commit. The site content is stored in JSON files in the same repository as the code base. The example code can be found in this GitHub repository.

The growing adoption of serverless technologies generates increasing amounts of helpful and insightful content from the developer community. This content can be difficult to discover. Serverless Land helps channel this into a single searchable location. By collating this into a static website, users can enjoy a browsing experience with fast page load speeds.

The serverless nature of the site means that developers don’t need to manage infrastructure or scalability. The use of AWS Amplify Console to automatically deploy directly from GitHub enables a regular release cadence with a fast transition from prototype to production.

Static websites

A static site is served to the user’s web browser exactly as stored. This contrasts to dynamic webpages, which are generated by a web application. Static websites often provide improved performance for end users and have fewer or no dependant systems, such as databases or application servers. They may also be more cost-effective and secure than dynamic websites by using cloud storage, instead of a hosted environment.

A static site generator is a tool that generates a static website from a website’s configuration and content. Content can come from a headless content management system, through a REST API, or from data referenced within the website’s file system. The output of a static site generator is a set of static files that form the website.

Serverless Land uses a static site generator for Vue.js called Nuxt.js. Each time content is updated, Nuxt.js regenerates the static site, building the HTML for each page route and storing it in a file.

The architecture

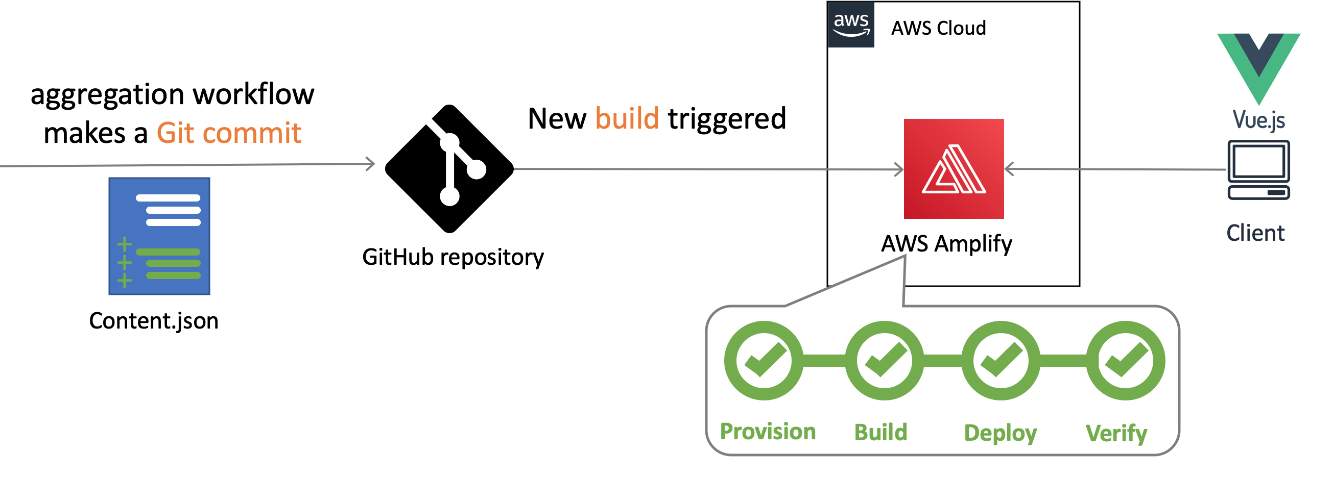
Serverless Land static website architecture

When the content.json file is committed to GitHub, a new build process is triggered in AWS Amplify Console.

Deploying AWS Amplify

AWS Amplify helps developers to build secure and scalable full stack cloud applications. AWS Amplify Console is a tool within Amplify that provides a user interface with a git-based workflow for hosting static sites. Deploy applications by connecting to an existing repository (GitHub, BitBucket Cloud, GitLab, and AWS CodeCommit) to set up a fully managed, nearly continuous deployment pipeline.

This means that any changes committed to the repository trigger the pipeline to build, test, and deploy the changes to the target environment. It also provides instant content delivery network (CDN) cache invalidation, atomic deploys, password protection, and redirects without the need to manage any servers.

Building the static website

  1. To get started, use the Nuxt.js scaffolding tool to deploy a boiler plate application. Make sure you have npx installed (npx is shipped by default with npm version 5.2.0 and above).
    $ npx create-nuxt-app content-aggregator

    The scaffolding tool asks some questions, answer as follows:Nuxt.js scaffolding tool inputs

  2. Navigate to the project directory and launch it with:
    $ cd content-aggregator
    $ npm run dev

    The application is now running on http://localhost:3000.The pages directory contains your application views and routes. Nuxt.js reads the .vue files inside this directory and automatically creates the router configuration.

  3. Create a new file in the /pages directory named blogs.vue:$ touch pages/blogs.vue
  4. Copy the contents of this file into pages/blogs.vue.
  5. Create a new file in /components directory named Post.vue :$ touch components/Post.vue
  6. Copy the contents of this file into components/Post.vue.
  7. Create a new file in /assets named content.json and copy the contents of this file into it.$ touch /assets/content.json

The blogs Vue component

The blogs page is a Vue component with some special attributes and functions added to make development of your application easier. The following code imports the content.json file into the variable blogPosts. This file stores the static website’s array of aggregated blog post content.

import blogPosts from '../assets/content.json'

An array named blogPosts is initialized:

data(){
    return{
      blogPosts: []
    }
  },

The array is then loaded with the contents of content.json.

 mounted(){
    this.blogPosts = blogPosts
  },

In the component template, the v-for directive renders a list of post items based on the blogPosts array. It requires a special syntax in the form of blog in blogPosts, where blogPosts is the source data array and blog is an alias for the array element being iterated on. The Post component is rendered for each iteration. Since components have isolated scopes of their own, a :post prop is used to pass the iterated data into the Post component:

<ul>
  <li v-for="blog in blogPosts" :key="blog">
     <Post :post="blog" />
  </li>
</ul>

The post data is then displayed by the following template in components/Post.vue.

<template>
    <div class="hello">
      <h3>{{ post.title }} </h3>
      <div class="img-holder">
          <img :src="post.image" />
      </div>
      <p>{{ post.intro }} </p>
      <p>Published on {{post.date}}, by {{ post.author }} p>
      <a :href="post.link"> Read article</a>
    </div>
</template>

This forms the framework for the static website. The /blogs page displays content from /assets/content.json via the Post component. To view this, go to http://localhost:3000/blogs in your browser:

The /blogs page

Add a new item to the content.json file and rebuild the static website to display new posts on the blogs page. The previous content was generated using the aggregation workflow explained in this companion blog post.

Connect to Amplify Console

Clone the web application to a GitHub repository and connect it to Amplify Console to automate the rebuild and deployment process:

  1. Upload the code to a new GitHub repository named ‘content-aggregator’.
  2. In the AWS Management Console, go to the Amplify Console and choose Connect app.
  3. Choose GitHub then Continue.
  4. Authorize to your GitHub account, then in the Recently updated repositories drop-down select the ‘content-aggregator’ repository.
  5. In the Branch field, leave the default as master and choose Next.
  6. In the Build and test settings choose edit.
  7. Replace - npm run build with – npm run generate.
  8. Replace baseDirectory: / with baseDirectory: dist

    This runs the nuxt generate command each time an application build process is triggered. The nuxt.config.js file has a target property with the value of static set. This generates the web application into static files. Nuxt.js creates a dist directory with everything inside ready to be deployed on a static hosting service.
  9. Choose Save then Next.
  10. Review the Repository details and App settings are correct. Choose Save and deploy.

    Amplify Console deployment

Once the deployment process has completed and is verified, choose the URL generated by Amplify Console. Append /blogs to the URL, to see the static website blogs page.

Any edits pushed to the repository’s content.json file trigger a new deployment in Amplify Console that regenerates the static website. This companion blog post explains how to set up an automated content aggregator to add new items to the content.json file from an RSS feed.

Conclusion

This blog post shows how to create a static website with vue.js using the nuxt.js static site generator. The site’s content is generated from a single JSON file, stored in the site’s assets directory. It is automatically deployed and re-generated by Amplify Console each time a new commit is pushed to the GitHub repository. By automating updates to the content.json file you can create low-maintenance, low-latency static websites with almost limitless scalability.

This application framework is used together with this automated content aggregator to pull together articles for http://serverlessland.com. Serverless Land brings together all the latest blogs, videos, and training for AWS Serverless. Download the code from this GitHub repository to start building your own automated content aggregation platform.

2020 Was a Secure Election

Post Syndicated from Bruce Schneier original https://www.schneier.com/blog/archives/2020/11/2020-was-a-secure-election.html

Over at Lawfare: “2020 Is An Election Security Success Story (So Far).”

What’s more, the voting itself was remarkably smooth. It was only a few months ago that professionals and analysts who monitor election administration were alarmed at how badly unprepared the country was for voting during a pandemic. Some of the primaries were disasters. There were not clear rules in many states for voting by mail or sufficient opportunities for voting early. There was an acute shortage of poll workers. Yet the United States saw unprecedented turnout over the last few weeks. Many states handled voting by mail and early voting impressively and huge numbers of volunteers turned up to work the polls. Large amounts of litigation before the election clarified the rules in every state. And for all the president’s griping about the counting of votes, it has been orderly and apparently without significant incident. The result was that, in the midst of a pandemic that has killed 230,000 Americans, record numbers of Americans voted­ — and voted by mail — ­and those votes are almost all counted at this stage.

On the cybersecurity front, there is even more good news. Most significantly, there was no serious effort to target voting infrastructure. After voting concluded, the director of the Cybersecurity and Infrastructure Security Agency (CISA), Chris Krebs, released a statement, saying that “after millions of Americans voted, we have no evidence any foreign adversary was capable of preventing Americans from voting or changing vote tallies.” Krebs pledged to “remain vigilant for any attempts by foreign actors to target or disrupt the ongoing vote counting and final certification of results,” and no reports have emerged of threats to tabulation and certification processes.

A good summary.

Detecting Phishing Emails

Post Syndicated from Bruce Schneier original https://www.schneier.com/blog/archives/2020/11/detecting-phishing-emails.html

Research paper: Rick Wash, “How Experts Detect Phishing Scam Emails“:

Abstract: Phishing scam emails are emails that pretend to be something they are not in order to get the recipient of the email to undertake some action they normally would not. While technical protections against phishing reduce the number of phishing emails received, they are not perfect and phishing remains one of the largest sources of security risk in technology and communication systems. To better understand the cognitive process that end users can use to identify phishing messages, I interviewed 21 IT experts about instances where they successfully identified emails as phishing in their own inboxes. IT experts naturally follow a three-stage process for identifying phishing emails. In the first stage, the email recipient tries to make sense of the email, and understand how it relates to other things in their life. As they do this, they notice discrepancies: little things that are “off” about the email. As the recipient notices more discrepancies, they feel a need for an alternative explanation for the email. At some point, some feature of the email — usually, the presence of a link requesting an action — triggers them to recognize that phishing is a possible alternative explanation. At this point, they become suspicious (stage two) and investigate the email by looking for technical details that can conclusively identify the email as phishing. Once they find such information, then they move to stage three and deal with the email by deleting it or reporting it. I discuss ways this process can fail, and implications for improving training of end users about phishing.

Integrating AWS Outposts with existing security zones

Post Syndicated from Shubha Kumbadakone original https://aws.amazon.com/blogs/compute/integrating-aws-outposts-with-existing-security-zones/

This post is contributed by Santiago Freitas and Matt Lehwess.

AWS Outposts is a fully managed service that extends AWS infrastructure, services, APIs, and tools to your on-premises facility. This blog post explains how the resources created on an Outpost can be integrated with security zones of an existing infrastructure. Integrating Outposts with existing security zones is important for customers that segment their environment into multiple domains based on their security policy.

Background

It’s common for customers to have different security zones within their infrastructure. For example, a customer might have a DMZ security zone where internet facing systems are located, an extra-net security zone where systems used to communicate with business partners are hosted, and an internal security zone where the systems accessible only by employees operate.

As illustrated in the following figure, customers often use firewalls and network ACLs to perform packet inspection and filtering for traffic that flows between security zones. Customers also usually use similar security controls for traffic flowing between different application tiers.


Example of firewall being used for security zone segmentation

Enabling connectivity from an Outposts VPC to your on-premises network

During your Outpost deployment, AWS works with you to establish connectivity to your local network. During this installation process, AWS creates an address pool based on an IP range you assign to the Outpost out of your local network’s IP ranges. This address pool is known as a customer-owned IP address pool or CoIP pool.

When resources running on Outposts (like an EC2 instance) need to communicate with existing on-premises systems, you must assign an Elastic IP address to them. This Elastic IP address comes from the CoIP pool. The resources in your local area network (LAN), including firewalls and network ACLs, see the Elastic IP address as the source IP of the packets sent from the resources running on Outposts. This Elastic IP address is also used as the destination IP for traffic from your on-premises systems to the instance on the Outpost.

How to enable connectivity from an Outposts VPC to your on-premises network

With a typical Outpost deployment, as shown in the following diagram, the following items are required to enable connectivity from the Outpost’s VPC to your on-premises network:

  1. VPC routing: Routes to your on-premises network in the route table of the VPC’s Outpost subnet.
  2. CoIP pool: Assigned by you, the customer, and created by AWS at time of install, for example, 192.168.1.0/26 in the diagram. It’s used to allocate Elastic IP addresses that can then be associated with instances or other resources on the Outpost.
  3. Elastic IP address association: Customer configured, association of Elastic IP addresses from the CoIP pool with EC2 instances and other resources on the Outpost. For example, VPC IP 10.0.3.112 from instance Y has Elastic IP address 192.168.1.15 associated with it.
  4. Routing advertisement: The Outpost advertises the assigned CoIP range to the local devices within your on-premises network via Border Gateway Protocol (BGP). This is configured by AWS during installation and based on the CoIP pool IP range you provide.


AWS Outposts – typical network topology

Integrating Outposts with existing security zones

CoIP pools, and AWS Resource Access Manager (RAM) are used to facilitate the integration of Outposts with your existing security zones. AWS RAM lets you share your resources with AWS account or through AWS Organizations.

When AWS deploys your Outposts, you can ask AWS to create multiple CoIP pools. Each CoIP pool is configured with an IP range assigned by you during initial installation. If after the initial installation you need AWS to create additional CoIP pools for an existing Outpost, you can open a case with AWS Support and request the creation of additional pools.

CoIP pools are owned initially by the AWS account that owns the Outpost. In a multi-account Outpost deployment, you can share your customer-owned IP pool(s) with other AWS accounts in your AWS Organization using AWS RAM.

VPCs that have subnets on the Outpost must be created in the same account that owns the Outpost. After creation of these subnets within the Outpost account, AWS RAM can then be used to share these subnets with other accounts or organizational units that are in the same organization from AWS Organizations.

After you’ve shared the CoIP pool with the account where you’d like to run your workloads, and you’ve shared an Outpost subnet with that same account, users of that account can deploy resources in the shared Outpost subnet. For the Outposts resources that must communicate with resources in your existing infrastructure, users can assign Elastic IP addresses from one or more of the shared CoIP pools to those Outposts resources.

Multiple CoIP pools and the ability to share them and Outpost subnets with a particular account, gives you granular control over the IP range used by Outpost resources requiring connectivity to your on-premises LAN.

The following figure illustrates the sharing of a subnet and CoIP pool from Account 1, which is the account where the Outpost was initially deployed, with Account 2. As the CoIP pool was shared with Account 2, the users in Account 2 are able to assign an Elastic IP address to the EC2 instance running within Account 2.

AWS Outposts and VPC Sharing

Creating an AWS RAM resource share

The following screenshots demonstrate how to use AWS RAM to share a CoIP pool and a subnet with another account in the same organization from AWS Organizations.

Step 1. Navigate to the AWS RAM service page within the AWS Management Console, and click Create Resource Share. This step is done within the AWS account that owns the Outpost.

Step 2. Next, give the share an appropriate name.

Step 3. Select one or more subnets you’d like to share with your application owner’s account. In this case, select a subnet that exists in your VPC on the Outpost.

Step 4. In this case, share the CoIP range. You can find that in the resources type list.

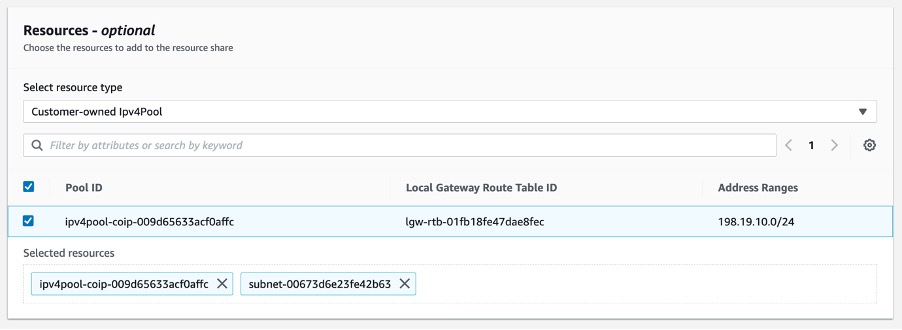
Step 5. Select the Customer-owned Ipv4Pool resource type, and then select the CoIP to be shared. Selecting the the CoIP adds it to the list of shared resources along with the subnet selected earlier.

Step 6. Add the account number for the account you’d like to share the Outposts subnet and CoIP pool with.

Step 7. Click Create Resource. After clicking the Create Resource share button, you should see the resource share listed and be in the state “active.”

Now that you’ve successfully shared the subnet and CoIP pool with your application account (that’s in the same organization), you can now go in to that account and allocate an Elastic IP address from the CoIP pool. You can then assign the Elastic IP address to an instance launched in the subnet previously shared, which is on the Outpost.

Allocating and associating the Elastic IP address from your CoIP pool

Step 1. From within the application account, allocate an Elastic IP address from the CoIP pool. This is done by navigating to the VPC console, then to Elastic IP addresses, and then click Allocate Elastic IP address.

Step 2. Select Customer owned pool of IPv4 addresses, select the CoIP pool that’s been shared with this account previously, then click Allocate. You can see this step in the following image.

Step 3. You can now see the new Elastic IP address that has been allocated from the shared CoIP pool. You can now associate that Elastic IP address with an instance in our shared subnet.

Note: When using the AWS Management Console to allocate an Elastic IP address, the ElasticIP address is automatically allocated from the CoIPpool. If you’re using the AWS CLI, you have the option to select a specific Elastic IP address from the CoIP pool by using the --customer-owned-ipv4-pool <value> option.

Step 4. You can now associate the Elastic IP address of type CoIP with an instance. Click Associate after selecting the instance that is running on your Outpost in the shared subnet. This step is represented in the following image.

Step 5 – Once the operation is complete, you can see the CoIP Elastic IP address in the Elastic IP address console, and that it’s assigned to the instance that’s running in your shared subnet.

The steps preceding demonstrated how to share the Outpost with other accounts through the use of AWS Resource Access Manager, subnet sharing, and CoIP sharing.

Use case

Let’s apply the capabilities described prior into a design. A customer is running a 3-tier web application and would like to host the web and application tiers on Outposts. The database tier is hosted on the existing infrastructure. The application’s user traffic comes from the internet, through an external firewall towards the web tier hosted on the Outpost. Traffic between web and application tiers is secured with security groups and remains within the Outpost. Application servers connect to the database servers via the existing internal firewalls. The customer uses independent external and internal firewalls.

During the Outposts installation, the customer asks AWS to create two CoIP pools. The first CoIP pool, referenced in the following image as CoIP Web, is assigned the IP range 172.0.1.0/24. The second CoIP pool, referenced in the following image as CoIP App, is assigned the IP range 172.0.2.0/24. The customer then creates two additional AWS accounts, one for the web tier and another for the app tier. Within the account that owns the Outpost, the customer creates two VPCs and within each of those VPCs a subnet is created.

The subnet with IP address 10.0.1.0/24 is shared with the web tier account and the subnet with IP address 10.1.2.0/24 is shared with the app tier account. The customer then configures VPC peering between the VPCs to enable communication between the web and app tiers. VPC peering configuration is performed within the account that owns the Outposts.

Note: With VPC peering traffic between the VPCs remains within the Outpost. However, data transfer charges for VPC peering applies. This use-case could also be built with the web tier and app tier using different subnets within the same VPC to save on data transfer costs over VPC peering.

The following image shows initial setup with two CoIP pools, two accounts, and two VPCs.


Initial setup with two CoIP pools, two accounts and two VPCs

After the initial setup the customer then shares each CoIP pool with the appropriate account using AWS RAM. The customer can then create their web and application servers within the respective accounts. As shown in the prior image, the web server is assigned IP address 10.0.1.5 and the application server is assigned IP address 10.1.2.10. Each IP address is part of their respective VPC IP range and are reachable only within the Outpost at this point.

To enable the integration of the web and application servers with the existing infrastructure, the customer assigns an Elastic IP address from the CoIP pool shared with each account to their respective Amazon EC2 instances.

With this configuration, the customer can integrate the web and application servers into the existing security zones. To integrate the web servers, path “A” in the following image, the customer creates a rule in their external firewall that allows communication from any source (internet) to Elastic IP address 172.0.1.5 on port 443 (HTTPS) which has been assigned to the web server.

For the communication between the web and application servers, path “B” in the following image, the customer has configured VPC peering between the two VPCs and created the required security groups.

To integrate the application servers into the Internal Security Zone, path “C” in the following image, the customer has assigned Elastic IP address 172.0.2.10 to the application server and has configured a rule on the Internal Firewall allowing the IP range 172.0.2.0/24 that is assigned to the app CoIP pool to communicate with the database server.


End to end traffic flow from users to web tier and from app tier to database tier

In addition to setting up their Outposts as covered in the preceding details, to enable the communication between the Outposts hosted resources and the existing infrastructure you must create a custom route table and associate it with an Outpost subnet.

Conclusion

AWS Outposts extends AWS infrastructure, services, APIs, and tools to your on-premises facility. During deployment of your Outposts, AWS works with you to establish connectivity to your local network. This blog post builds upon this initial deployment of an Outpost to allow the Outpost’s resources to integrate into your existing security zones. The design is applicable for customers that segment their environment into multiple security zones.


Santiago Freitas is AWS Head of Technology for Central Eastern Europe (CEE), Middle East, North Africa (MENA), Sub Saharan Africa (SSA), Turkey (TUR), and Russia and Commonwealth of Independent States (RUS-CIS). Previously he was an AWS Global Solutions Architect for financial services. Before joining AWS, Santiago was a Distinguished Engineer at Cisco. He is based in Dubai, United Arab Emirates.

Matt is a Principal Developer Advocate for Amazon Web Services where he has spent the last 7 years working with AWS customers and partners, helping them to build best-in-class AWS networking solutions. He is co-author of the AWS Certified Advanced Networking Official Study Guide, as well as an Amazon Re:Invent speaker extraordinaire (5 years and counting!). His primary focus at AWS is to help evangelize AWS networking solutions and more recently, AWS Outposts.
California Proposition 24 Passes

Post Syndicated from Bruce Schneier original https://www.schneier.com/blog/archives/2020/11/california-proposition-24-passes.html

California’s Proposition 24, aimed at improving the California Consumer Privacy Act, passed this week. Analyses are very mixed. I was very mixed on the proposition, but on the whole I supported it. The proposition has some serious flaws, and was watered down by industry, but voting for privacy feels like it’s generally a good thing.

Determining What Video Conference Participants Are Typing from Watching Shoulder Movements

Post Syndicated from Bruce Schneier original https://www.schneier.com/blog/archives/2020/11/determining-what-video-conference-participants-are-typing-from-watching-shoulder-movements.html

Accuracy isn’t great, but that it can be done at all is impressive.

Murtuza Jadiwala, a computer science professor heading the research project, said his team was able to identify the contents of texts by examining body movement of the participants. Specifically, they focused on the movement of their shoulders and arms to extrapolate the actions of their fingers as they typed.

Given the widespread use of high-resolution web cams during conference calls, Jadiwala was able to record and analyze slight pixel shifts around users’ shoulders to determine if they were moving left or right, forward or backward. He then created a software program that linked the movements to a list of commonly used words. He says the “text inference framework that uses the keystrokes detected from the video … predict[s] words that were most likely typed by the target user. We then comprehensively evaluate[d] both the keystroke/typing detection and text inference frameworks using data collected from a large number of participants.”

In a controlled setting, with specific chairs, keyboards and webcam, Jadiwala said he achieved an accuracy rate of 75 percent. However, in uncontrolled environments, accuracy dropped to only one out of every five words being correctly identified.

Other factors contribute to lower accuracy levels, he said, including whether long sleeve or short sleeve shirts were worn, and the length of a user’s hair. With long hair obstructing a clear view of the shoulders, accuracy plummeted.