Just recently, I was coding a new feature for GitHub Copilot Chat. My task was to enable the chat to recognize a user’s project dependencies, allowing it to provide magical answers when the user poses a question. While I could have easily listed the project dependencies and considered the task complete, I knew that to extract top-notch responses from these large language models, I needed to be careful to not overload the prompt to avoid confusing the model by providing too much context. This meant pre-processing the dependency list and selecting the most relevant ones to include in the chat prompt.
Creating machine-processable formats for the most prominent frameworks across various programming languages would have consumed days. It was during this time that I experienced one of those “Copilot moments.”
I simply queried the chat in my IDE:
Look at the data structure I have selected and create at least 10 examples that conform to the data structure. The data should cover the most prominent frameworks for the Go programming language.
Voilà, there it was my initial batch of machine-processable dependencies. Just 30 minutes later, I had amassed a comprehensive collection of significant dependencies for nearly all supported languages, complete with parameterized unit tests. Completing a task that would likely have taken days without GitHub Copilot, in just 30 minutes, was truly remarkable.
This led me to ponder: what other “Copilot moments” might my colleagues here at GitHub have experienced? Thus, here are a few ways we use GitHub Copilot at GitHub.
1. Semi-automating repetitive tasks
Semi-automating repetitive tasks is a topic that resonates with a colleague of mine from another team. He mentions that they are tasked with developing and maintaining several live services, many of which utilize protocol buffers for data communication. During maintenance, they often encounter a situation where they need to increment ID numbers in the protobuf definitions, as illustrated in the code snippet below:
He particularly appreciates having GitHub Copilot completions in the editor for these tasks. It serves as a significant time saver, eliminating the need to manually generate ID numbers. Instead, one can simply tab through the completion suggestions until the task is complete.
2. Avoid getting side tracked
Here’s another intriguing use case I heard about from a colleague. He needed to devise a regular expression to capture a Markdown code block and extract the language identifier. Fully immersed in his work, he preferred not to interrupt his flow by switching to chat, even though it could have provided a solution. Instead, he employed a creative approach by formalizing his task in a code comment:
// The string above contains a code block with a language identifier.
// Create a regexp that matches the code block and captures the language
identifier.
// Use tagged capture groups for the language and the code.
This prompted GitHub Copilot to generate the regular expression as the subsequent statement in his editor:
const re = /```(?<lang>\w+)(?<code>[\s\S]+?)```/;
With the comment deleted, the task was swiftly accomplished!
3. Structuring data-related notes
During a pleasant coffee chat, one of our support engineers shared an incident she experienced with a colleague last week. It was a Friday afternoon, and they were attempting to troubleshoot an issue for a specific customer. Eventually, they pinpointed the solution by creating various notes in VSCode. At GitHub, we prioritize remote collaboration. Thus, merely resolving the task wasn’t sufficient; it was also essential to inform our colleagues about the process to ensure the best possible experience for future customer requests. Consequently, even after completing this exhaustive task, they needed to document how they arrived at the solution.
She initiated GitHub Copilot Chat and simply typed something along the lines of, “Organize my notes, structure them, and compile the data in the editor into Markdown tables.” Within seconds, the task was completed, allowing them to commence their well-deserved weekend.
4. Exploring and learning
Enhancing and acquiring new skills are integral aspects of every engineer’s journey. John Berryman, a colleague of mine, undertook the challenge of leveraging GitHub Copilot to tackle a non-trivial coding task in a completely unfamiliar programming language. His goal was to delve into Rust, so on a Sunday, he embarked on this endeavor with the assistance of GitHub Copilot Chat. The task he set out to accomplish was to develop a program capable of converting any numerical input into its written English equivalent. While initially seeming straightforward, this task presented various complexities such as handling teen numbers, naming conventions for tens, placement of “and” in the output, and more.
Twenty-three minutes and nine seconds later, he successfully produced a functional version written in Rust, despite having no prior experience with the language. Notably, he documented his entire process, recording himself throughout the endeavor.
Berryman uses an older, experimental version of GitHub Copilot to write a program in Rust.
Your very own GitHub Copilot moment
I found it incredibly enlightening to discover how my fellow Hubbers utilize GitHub Copilot, and their innovative approaches inspired me to incorporate some of their ideas into my daily workflows. If you’re eager to explore GitHub Copilot firsthand, getting started is a breeze. Simply install it into your preferred editor and ask away.
„Нямам намерение да се самоубивам. Ако умра, трябва да знаете, че те са ме убили.“ На 1 април получих лично съобщение с тези думи от саудитския бежанец Абдулрахман ал-Халиди, интервю с когото „Тоест“ публикува на 11 март. Уви, не беше лоша шега – Ал-Халиди действително се страхуваше за живота си, след като предишния ден е бил пребит от полицаи, както твърди, в центъра за задържане в Бусманци. Това е един от няколкото случая на насилие над бежанци в рамките само на няколко дни. Как се стигна до тази вълна от насилие и как бежанците пак се превърнаха във врагове?
Отново се задават избори. А в предизборна ситуация по традиция определени политически сили и властови центрове имат нужда от враг, върху когото да се фиксира вниманието, за да се отклони погледът на обществото от реалните проблеми и нередности, за които същите тези политически сили и властови центрове носят отговорност. При липса на реален враг той винаги може да се конструира. Ето няколко примера.
Някои дежурни „врагове“
За дежурни врагове в предизборни периоди са били нарочвани ромите, които „продават гласовете си“, като по този начин остават в сянка политическите сили, които редовно купуват гласове (не само ромски). Или изселените по времето на т.нар. Възродителен процес етнически турци, заклеймени като „изборни туристи“, когато се връщат по родните си места да гласуват.
През 2017 г. председателят на националистическата партия Национален фронт за спасение на България Валери Симеонов, по онова време вицепремиер по икономическата и демографската политика, отиде на границата, за да попречи лично на български турци да упражнят правото си на глас. Тогава той удари възрастна жена така, че тя падна на земята. После се похвали в ефира на bTV, че е „избутал не само тая възрастна баба“, която определи като „изключително нагла“, а още десетина души – „почти един рейс“. И че това е донесло гласове за партията му.
ЛГБТИ+ хората също често се оказват предизборни врагове, като агресията срещу тях се усили след пропагандната кампания срещу Истанбулската конвенция. Само през 2021 г., през която три пъти се състояха парламентарни избори, случаите на хомофобска агресия бяха толкова много, че е трудно да бъдат изброени. Националисти нападнаха първия прайд в Бургас, организираха акции срещу представяне на книги и филмови прожекции в Пловдив и София, вандализираха клуб The Steps, облепиха превозни средства и улични стълбове с хомофобски лепенки. „Защитници на семейството“ разпространяваха невярна информация за ЛГБТИ+ хората. Кулминацията беше, когато група, предвождана от Боян Станков, самонарекъл се Расате, нахлу в общностния център „Рейнбоу хъб“ и го изпотроши, а самият Станков удари активистка.
От 2014–2015 г. и бежанците са сред обичайните предизборни врагове. Преди парламентарните избори през октомври 2022 г. те отново бяха нарочени за „плашила“, редом с лихварите в ромските махали и „дрогираните шофьори“.
Актуалният „враг“ – бежанците
В момента, в който премиерът Николай Денков подаде оставка съгласно споразумението за ротация на кабинета и още преди да стане публично ясно, че ротацията няма да се състои, а ще се ходи на избори, бежанците внезапно пак станаха враг. Политици и медии заговориха за „мигрантска криза“, каквато всъщност няма, и създадоха истерия заради четири случая – в поне два от тях бежанци няма, в поне три няма пострадал български гражданин и в нито един няма сериозно пострадал човек. В два от случаите българи нападнаха чуждестранни студенти. В третия бежанци бяха снимани как се гонят в близост до общежитието на Агенцията за бежанците в квартал „Овча купел“. Четвъртият случай се оказа конфликт между две групи заради гадже. В едната от групите е имало сирийски младеж.
Тези случки, в три от които пострадалите са всъщност чужденци, бяха използвани за разпалване на ксенофобски настроения. Организираха се протести пред бежански центрове – например в „Овча купел“ и в Харманли. Протестиращите искат центровете да се охраняват от полиция и ако може, да не виждат никакви бежанци, защото ги възприемат като заплаха, макар нищо да не са им направили.
От МВР хем отрекоха, че има „мигрантска криза“, хем министър Калин Стоянов използва случая да повтори искането на предшественика си за над 1000 нови гранични полицаи. В това искане беше подкрепен от председателя на ГЕРБ Бойко Борисов и съпредседателя на ДПС Делян Пеевски. Стоянов разпореди и жандармеристи с пушки да охраняват публичните места, където има „хора с различен произход“, каквото и да означава това.
На 28 март пък полицията извърши „внезапна проверка“ на спазването на реда в трите бежански центъра (от отворен тип) в София. Поводът за нея не стана ясен, но пък новинарските емисии излъчиха кадри как служители на реда с маски на лицето и каски (защо ли?) влизат в общежитията, в които има и жени с малки деца, и проверяват кой спазва вечерния час и на кого са му изрядни документите.
На същата дата – 28 март – ксенофоби пребиват поне трима бежанци. И една българка – защото е жена на един от тях. До метростанция „Мизия“, в близост до центъра на ДАБ в „Овча купел“, група напада две момчета с вид на деца. И гордо публикува в интернет видео на „подвига“ си. В друга част на София ксенофоби пребиват афганистанския бежанец Джавед Нури и жена му. На 31 март Абдулрахман ал-Халиди е пребит в Бусманци.
Побоите над Джавед Нури, жена му и бежанците в „Овча купел“
Нури бяга от Афганистан в България преди 20 години. Тогава е още непълнолетен. Първият му досег с българската земя е болезнен в буквалния смисъл – каналджиите го хвърлят от влака и той губи съзнание. Въпреки доказателствата, които представя, че семейството му е преследвано, не получава бежански статут. Прекарва години затворен – първо в центъра за задържане в ж.к. „Дружба“ (вече несъществуващ), а после и в Бусманци – и под постоянната заплаха да бъде депортиран. Нервите му не издържат и той решава да се самоубие. Самозапалва се, но оцелява.
През 2008 г. го освобождават и той се озовава на улицата, тоест на голата поляна пред центъра в Бусманци. Тогава го прибира у дома си писателят Иван Кулеков, който от години се застъпва за него. Скоро младежът се изнася на квартира, защото не иска да е в тежест на никого.
След много години и не по-малко перипетии Джавед Нури получава легален статут. Успява да устрои живота си, има жена, която го обича, приятели, работа, дом. Лошото е останало зад гърба му и той възприема България като рай. До 28 март т.г., когато, по думите на Мария Черешева, „неговият рай се превърна в ад“. Тогава група младежи напада него и жена му с аргумента „от майната си сте дошли“. Удрят ги с тръби, хвърлят камъни по тях. На Нури му разрязват пръст. Цялата му длан е в кръв.
Това е впрочем вторият път, когато му раняват пръст. Още когато е бягал от Афганистан, преследвачите му са отрязали парче от един от пръстите му.
Полицията не приема сигнала на афганистанския бежанец за побоя. Задейства се чак когато се обажда жена му, която е българка. Нещо повече – когато полицията пристига, първо обвинява него.
Джавед Нури и жена му си търсят ново жилище, защото не се чувстват в безопасност.
В деня на побоя срещу Джавед Нури и жена му група напада двама млади бежанци в „Овча купел“. Във видеото, което нападателите правят и публикуват в интернет, се чува „Вие к’ви сте?“ и „Where are you from, бе?“. Битите изглеждат деца и с нищо не са предизвикали агресията срещу себе си. „Свободна Европа“ разговаря с едно от пострадалите момчета – Али от Сирия, на 20 години. Той разказва, че това е вторият път, когато го нападат, и пита дали има някакви права.
За побоя над двамата младежи има задържани, но никой не държи самия Али в течение за това. Опитал се е да подаде жалба, но са го отпратили, защото „няма преводач“.
Побоят над Абдулрахман ал-Халиди
На 31 март саудитският бежанец Абдулрахман ал-Халиди прави нещо, което, както разказва пред „Тоест“, е правил и преди, но до този момент е нямало проблем – дава храна на едно семейство, чиито членове също са затворени в Бусманци: „Хранех ги със спагети [в оригинал – noodles, б.а.]. Правил съм го и преди без никакъв проблем, защото те постят заради Рамазана. Но само този ден полицията реши да ме спре, да ми забрани. След това имахме спор [с полицая] и към него се присъедини още един [полицай]. После отвориха вратата, закараха ме до тоалетната и ме биха там.“
От аудиосъобщението, което ми оставя, не става ясно колко точно са били полицаите, но във Facebook той уточнява, че са били трима. Добавя и че са го били, докато загуби съзнание. Когато се е свестил, те още са го биели. Започнал да плюе кръв.
В аудиосъобщенията, в които разказва това, Ал-Халиди звучи притеснено. Но не толкова плашещо, колкото на 1 април, когато се записва, за да ми каже, че е бит по лицето и тялото и че изпитва „изключителна болка“.
В продължение на няколко дни саудитският бежанец иска да бъде прегледан, за да има доказателства за побоя. Накрая го закарват в болницата на МВР, където е с белезници и не му позволяват да има придружител.
На 4 април Дирекция „Миграция“ към МВР заявява, че саудитецът всъщност се е самонаранил. „Казах го! – коментира той, препращайки към поста си, че не иска да се самоубие и ако умре, значи е убит. – Може би ще ме убият и ще кажат, че е самоубийство! Удивен съм от тази безочлива лъжа! О, Господи, спаси българския народ от тези власти!“
Няма данни за конкретен повод за побоя над Абдулрахман ал-Халиди. Но на следващия ден (1 април) във Върховния административен съд се разглежда делото за бежанския му статут. Тогава е организирана и поредна демонстрация в негова защита.
Междувременно още през януари съдът разпорежда незабавното освобождаване на Ал-Халиди от Бусманци и нарежда на ДАБ да го премести в общежитие със свободен достъп. И макар в съдебното решение да пише, че то не подлежи на обжалване, близо три месеца по-късно той още е в центъра за задържане.
Ролята на МВР
Във всички тези случаи МВР най-малкото не реагира адекватно. Не се задейства по сигнала на Джавед Нури, а когато пристига, обвинява него. Не държи в течение за разследването Али, а той не е допуснат да подаде жалба. Излиза с неправдоподобната версия, че Ал-Халиди се е самопребил.
МВР трудно признава случаи на полицейско насилие и по отношение на български граждани, какво остава за бежанци. Разривът между Калин Стоянов и Николай Денков настъпи именно защото първият отказа да поеме отговорност за насилието от страна на полицейски служители по време на протеста срещу вече бившето ръководство на БФС, ескалирал до безредици.
В предишната си статия зададох въпроса каква е целта на бутафорната активност на МВР в последно време. Две от предположенията ми бяха свързани с предстоящите предсрочни парламентарни избори. Жандармеристите с пушките по улиците могат да „дисциплинират“ определени групи избиратели, а насажданият в обществото страх може да се канализира в желаната електорална посока и да отвлича вниманието от реалните проблеми.
Вече има едно неизвестно по-малко – ясно е, че Калин Стоянов ще бъде вътрешен министър и в служебното правителство, чиято основна задача ще е организирането на изборите. Той беше министър и на последните местни избори, които ще останат в историята с много нередности и рекордно количество невалидни бюлетини.
Колкото по-бутафорна става активността на МВР обаче, толкова по-реални са потърпевшите от нея. Бежанците са удобна жертва, понеже са беззащитни. А и повечето си мълчат от страх, не са гласовити като Нури и Ал-Халиди. Но покрай „дежурните врагове“ потърпевши могат да се окажат и всички, които са неудобни. Дори главният секретар на МВР, на когото пресцентърът на Министерството не позволил да участва в телевизионно предаване, за да се защити от обвиненията, отправяни срещу него в публичното пространство.
Абдулрахман ал-Халиди призовава Бог да спаси българите от властите. За разлика от Саудитска Арабия обаче, в България има свободни избори. Поне в степента, в която не са манипулирани. Властите са резултат от избора на хората. Конструирането на врагове притъпява личната отговорност. А цената на цялата бутафория се измерва в кръв. Днес бежанска, вчера и утре – българска.
Amazon WorkMail’s new audit logging capability equips email system administrators with powerful visibility into mailbox activities and system events across their organization. As announced in our recent “What’s New” post, this feature enables the comprehensive capture and delivery of critical email data, empowering administrators to monitor, analyze, and maintain compliance.
With audit logging, WorkMail records a wide range of events, including metadata about messages sent, received, and failed login attempts, and configuration changes. Administrators have the option to deliver these audit logs to their preferred AWS services, such as Amazon Simple Storage System (S3) for long-term storage, Amazon Kinesis Data Firehose for real-time data streaming, or Amazon CloudWatch Logs for centralized log management. Additionally, standard CloudWatch metrics on audit logs provide deep insights into the usage and health of WorkMail mailboxes within the organization.
By leveraging Amazon WorkMail’s audit logging capabilities, enterprises have the ability to strengthen their security posture, fulfill regulatory requirements, and gain critical visibility into the email activities that underpin their daily operations. This post will explore the technical details and practical use cases of this powerful new feature.
In this blog, you will learn how to configure your WorkMail organization to send email audit logs to Amazon CloudWatch Logs, Amazon S3, and Amazon Data Firehose . We’ll also provide examples that show how to monitor access to your Amazon WorkMail Organization’s mailboxes by querying the logs via CloudWatch Log Insights.
Email security
Imagine you are the email administrator for a biotech company, and you’ve received a report about spam complaints coming from your company’s email system. When you investigate, you learn these complaints point to unauthorized emails originating from several of your company’s mailboxes. One or more of your company’s email accounts may have been compromised by a hacker. You’ll need to determine the specific mailboxes involved, understand who has access to those mailboxes, and how the mailboxes have been accessed. This will be useful in identifying mailboxes with multiple failed logins or unfamiliar IP access, which can indicate unauthorized attempts or hacking. To identify the cause of the security breach, you require access to detailed audit logs and familiar tools to analyze extensive log data and locate the root of your issues.
Amazon WorkMail Audit Logging
Amazon WorkMail is a secure, managed business email service that hosts millions of mailboxes globally. WorkMail features robust audit logging capabilities, equipping IT administrators and security experts with in-depth analysis of mailbox usage patterns. Audit logging provides detailed insights into user activities within WorkMail. Organizations can detect potential security vulnerabilities by utilizing audit logs. These logs document user logins, access permissions, and other critical activities. WorkMail audit logging facilitates compliance with various regulatory requirements, providing a clear audit trail of data privacy and security. WorkMail’s audit logs are crucial for maintaining the integrity, confidentiality, and reliability of your organization’s email system.
Understanding WorkMail Audit Logging
Amazon WorkMail’s audit logging feature provides you with the data you need to have a thorough understanding of your email mailbox activities. By sending detailed logs to Amazon CloudWatch Logs, Amazon S3, and Amazon Data Firehose, administrators can identify mailbox access issues, track access by IP addresses, and review mailbox data movements or deletions using familiar tools. It is also possible to configure multiple destinations for each log to meet the needs of a variety of use cases, including compliance archiving.
ACCESS CONTROL LOGS – These logs record evaluations of access control rules, noting whether access to the endpoint was granted or denied in accordance with the configured rules;
AUTHENTICATION LOGS – These logs capture details of login activities, chronicling both successful and failed authentication attempts;
AVAILABILITY PROVIDER LOGS – These logs document the use of the Availability Providers feature, tracking its operational status and interactions feature;
MAILBOX ACCESS LOGS – Logs in this category record each attempt to access mailboxes within the WorkMail Organization, providing a detailed account of credential and protocol access patterns.
Once audit logging is enabled, alerts can be configured to warn of authentication or access anomalies that surpass predetermined thresholds. JSON formatting allows for advanced processing and analysis of audit logs by third party tools. Audit logging stores all interactions with the exception of web mail client authentication metrics.
WorkMail audit logging in action
Below are two examples that show how WorkMail’s audit logging can be used to investigate unauthorized login attempts, and diagnose a misconfigured email client. In both examples, we’ll use WorkMail’s Mailbox Access Control Logs and query the mailbox access control logs in CloudWatch Log Insights.
In our first example, we’re looking for unsuccessful login attempts in a target timeframe. In CloudWatch Log Insights we run this query:
CloudWatch Log Insights returns all records in the timeframe, providing auth_succesful = 0 (false) and auth_failed_reason = Invalid username or password. We also see the source_ip, which we may decide to block in a WorkMail access control rule, or any other network security system.
Mailbox Access Control Log – an unsuccessful login attempt
In this next example, consider a WorkMail organization that has elected to block the IMAP protocol using a WorkMail access control rule (below):
WorkMail Access Control Rule – block IMAP protocol
Because some email clients use IMAP by default, occasionally new users in this example organization are denied access to email due to an incorrectly configured email client. Using WorkMail’s mailbox access control logs in CloudWatch Log Insights we run this query:
And we see the user’s attempt to access their email inbox via IMAP has been denied by the access control rule_id (below):
WorkMail Access Control logs – IMAP blocked by access rule
Conclusion
Amazon WorkMail’s audit logging feature offers comprehensive view of your organization’s email activities. Four different logs provide visibility into access controls, authentication attempts, interactions with external systems, and mailbox activities. It provides flexible log delivery through native integration with AWS services and tools. Enabling WorkMail’s audit logging capabilities helps administrators meet compliance requirements and enhances the overall security and reliability of their email system.
To learn more about audit logging on Amazon WorkMail, you may comment on this post (below), view the WorkMail documentation, or reach out to your AWS account team.
To learn more about Amazon WorkMail, or to create a no-cost 30-day test organization, see Amazon WorkMail.
About the Authors
Luis Miguel Flores dos Santos
Miguel is a Solutions Architect at AWS, boasting over a decade of expertise in solution architecture, encompassing both on-premises and cloud solutions. His focus lies on resilience, performance, and automation. Currently, he is delving into serverless computing. In his leisure time, he enjoys reading, riding motorcycles, and spending quality time with family and friends.
Andy Wong
Andy Wong is a Sr. Product Manager with the Amazon WorkMail team. He has 10 years of diverse experience in supporting enterprise customers and scaling start-up companies across different industries. Andy’s favorite activities outside of technology are soccer, tennis and free-diving.
Zip
Zip is a Sr. Specialist Solutions Architect at AWS, working with Amazon Pinpoint and Simple Email Service and WorkMail. Outside of work he enjoys time with his family, cooking, mountain biking, boating, learning and beach plogging.
For those of you attending NAB 2024 (coming up in Las Vegas from April 14–17), we’re excited to invite you to our Backblaze Tech Talk series in booth SL7077. This series will deliver insights from expert guest speakers from a range of media workflow service providers in conversation with Backblaze solution engineers. Whether you’re an experienced workflow architect or new to the industry, anyone attending will leave with actionable insights to improve their own media workflows.
All presentations are free, open to attendees, and will be held in the Backblaze booth (SL7077). Bonus: Get scanned while you’re there for exclusive Backblaze swag.
Sunday, April 14:
3:00 p.m.: Leslie Hathaway, Sales Engineer and Brian Scheffler, Pre-Sales Sys. Engineer at Quantum discuss AI tools, CatDV Classic & .io utilizing Backblaze for primary storage.
Monday, April 15:
10:00 a.m.: Helge Høibraaten, Co-Founder of CuttingRoom presents “Cloud-Powered Remote Production: Collaborative Video Editing on the Back of Backblaze.”
11:00 a.m.: Mattia Varriale, Sales Director EMEA at Backlight presents “Optimizing Media Workflow: Leveraging iconik and Backblaze for Cost-Effective, Searchable Storage.”
1:00 p.m.: Danny Peters, VP of Business Development, Americas at ELEMENTS presents “Bridging On-Premises and Cloud Workflows: The ELEMENTS Media Ecosystem.”
2:00 p.m.: Sam Bogoch, CEO at Axle AI with a new product announcement that is Powered by Backblaze.
3:00 p.m.: Greg Hollick, Chief Product Officer and Co-Founder at CloudSoda presents “Effortless Integration: Automating Media Assets into Backblaze with CloudSoda.”
Tuesday, April 16:
10:00 a.m.: Raul Vecchione, from Product Marketing at bunny.net presents “Edge Computing—Just Smarter.”
11:00 a.m.: Paul Matthijs Lombert, CEO at Hedge presents “Every Cloud Workflow Starts at the (H)edge.”
1:00 p.m.: Craig Hering, Co-Founder & CEO of Suite Studios presents “Suite Studios and Backblaze Integration Providing Direct Access to Your Data for Real-Time Editing and Archive.”
2:00 p.m.: Murad Mordukhay, CEO of Qencode presents “Building an Efficient Content Repository With Backblaze.”
Don’t miss out on these great tech talks. Elevate your expertise and connect with fellow media industry leaders. We look forward to seeing you at NAB! And, if you’re ready to sit down and take a deep dive into your storage needs, book a meeting here.
On February 20, Linaro held the initial
get-together for what is intended to be a regular Linux Kernel Forum for
the Arm-focused kernel community. This gathering aims to convene
approximately a few weeks prior to the merge window opening and prior to
the release of the current kernel version under development. Topics
covered in the first gathering include preparing 64-bit Arm kernels for
low-end embedded systems, memory errors and Compute Express
Link (CXL), devlink objectives, and scheduler integration.
Version 3.3.0 of the OpenSSL SSL/TLS implementation has been released.
Changes include a number of additions to its QUIC protocol support, some
year-2038 improvements for 32-bit systems, and a lot of cryptographic
features with descriptions like “Added a new EVP_DigestSqueeze()
API. This allows SHAKE to squeeze multiple times with different output
sizes.” See the release
notes for details.
The US Cyber Safety Review Board released a report on the summer 2023 hack of Microsoft Exchange by China. It was a serious attack by the Chinese government that accessed the emails of senior US government officials.
From the executive summary:
The Board finds that this intrusion was preventable and should never have occurred. The Board also concludes that Microsoft’s security culture was inadequate and requires an overhaul, particularly in light of the company’s centrality in the technology ecosystem and the level of trust customers place in the company to protect their data and operations. The Board reaches this conclusion based on:
the cascade of Microsoft’s avoidable errors that allowed this intrusion to succeed;
Microsoft’s failure to detect the compromise of its cryptographic crown jewels on its own, relying instead on a customer to reach out to identify anomalies the customer had observed;
the Board’s assessment of security practices at other cloud service providers, which maintained security controls that Microsoft did not;
Microsoft’s failure to detect a compromise of an employee’s laptop from a recently acquired company prior to allowing it to connect to Microsoft’s corporate network in 2021;
Microsoft’s decision not to correct, in a timely manner, its inaccurate public statements about this incident, including a corporate statement that Microsoft believed it had determined the likely root cause of the intrusion when in fact, it still has not; even though Microsoft acknowledged to the Board in November 2023 that its September 6, 2023 blog post about the root cause was inaccurate, it did not update that post until March 12, 2024, as the Board was concluding its review and only after the Board’s repeated questioning about Microsoft’s plans to issue a correction;
the Board’s observation of a separate incident, disclosed by Microsoft in January 2024, the investigation of which was not in the purview of the Board’s review, which revealed a compromise that allowed a different nation-state actor to access highly-sensitive Microsoft corporate email accounts, source code repositories, and internal systems; and
how Microsoft’s ubiquitous and critical products, which underpin essential services that support national security, the foundations of our economy, and public health and safety, require the company to demonstrate the highest standards of security, accountability, and transparency.
The report includes a bunch of recommendations. It’s worth reading in its entirety.
The board was established in early 2022, modeled in spirit after the National Transportation Safety Board. This is their third report.
There are many mechanisms for deferred work in the Linux kernel. One of them,
workqueues, has seen increasing use as part of
the move away from software interrupts. Alison Chaiken gave a talk
at SCALE
about how they compare to software interrupts, the new challenges they pose for
system administrators, and what tools are available to
kernel developers wishing to diagnose problems with workqueues as they become
increasingly prevalent.
Security updates have been issued by Debian (expat), Oracle (less and nodejs:20), Slackware (libarchive), SUSE (kubernetes1.23, nghttp2, qt6-base, and util-linux), and Ubuntu (python-django).
It’s been almost a year since we launched our first set of Experience AI resources in the UK, and we’re now working with partner organisations to bring AI literacy to teachers and students all over the world.
Developed by the Raspberry Pi Foundation and Google DeepMind, Experience AI provides everything that teachers need to confidently deliver engaging lessons that will inspire and educate young people about AI and the role that it could play in their lives.
Over the past six months we have been working with partners in Canada, Kenya, Malaysia, and Romania to create bespoke localised versions of the Experience AI resources. Here is what we’ve learned in the process.
Creating culturally relevant resources
The Experience AI Lessons address a variety of real-world contexts to support the concepts being taught. Including real-world contexts in teaching is a pedagogical strategy we at the Raspberry Pi Foundation call “making concrete”. This strategy significantly enhances the learning experience for learners because it bridges the gap between theoretical knowledge and practical application.
The initial aim of Experience AI was for the resources to be used in UK schools. While we put particular emphasis on using culturally relevant pedagogy to make the resources relatable to learners from backgrounds that are underrepresented in the tech industry, the contexts we included in them were for UK learners. As many of the resource writers and contributors were also based in the UK, we also unavoidably brought our own lived experiences and unintentional biases to our design thinking.
Therefore, when we began thinking about how to adapt the resources for schools in other countries, we knew we needed to make sure that we didn’t just convert what we had created into different languages. Instead we focused on localisation.
Localisation goes beyond translating resources into a different language. For example in educational resources, the real-world contexts used to make concrete the concepts being taught need to be culturally relevant, accessible, and engaging for students in a specific place. In properly localised resources, these contexts have been adapted to provide educators with a more relatable and effective learning experience that resonates with the students’ everyday lives and cultural background.
Working with partners on localisation
Recognising our UK-focused design process, we made sure that we made no assumptions during localisation. We worked with partner organisations in the four countries — Digital Moment, Tech Kidz Africa, Penang Science Cluster, and Asociația Techsoup — drawing on their expertise regarding their educational context and the real-world examples that would resonate with young people in their countries.
A video call with educators in Kenya.
We asked our partners to look through each of the Experience AI resources and point out the things that they thought needed to change. We then worked with them to find alternative contexts that would resonate with their students, whilst ensuring the resources’ intended learning objectives would still be met.
Spotlight on localisation for Kenya
Tech Kidz Africa, our partner in Kenya, challenged some of the assumptions we had made when writing the original resources.
An Experience AI resource in English and Swahili.
Relevant applications of AI technology
Tech Kidz Africa wanted the contexts in the lessons to not just be relatable to their students, but also to demonstrate real-world uses of AI applications that could make a difference in learners’ communities. They highlighted that as agriculture is the largest contributor to the Kenyan economy, there was an opportunity to use this as a key theme for making the Experience AI lessons more culturally relevant.
This conversation with Tech Kidz Africa led us to identify a real-world use case where farmers in Kenya were using an AI application that identifies disease in crops and provides advice on which pesticides to use. This helped the farmers to increase their crop yields.
Training an AI model to classify healthy and unhealthy cassava plant photos.
We included this example when we adapted an activity where students explore the use of AI for “computer vision”. A Google DeepMind research engineer, who is one of the General Chairs of the Deep Learning Indaba, recommended a data set of images of healthy and diseased cassava crops (1). We were therefore able to include an activity where students build their own machine learning models to solve this real-world problem for themselves.
Access to technology
While designing the original set of Experience AI resources, we made the assumption that the vast majority of students in UK classrooms have access to computers connected to the internet. This is not the case in Kenya; neither is it the case in many other countries across the world. Therefore, while we localised the Experience AI resources with our Kenyan partner, we made sure that the resources allow students to achieve the same learning outcomes whether or not they have access to internet-connected computers.
An Experience AI activity related to farming.
Assuming teachers in Kenya are able to download files in advance of lessons, we added “unplugged” options to activities where needed, as well as videos that can be played offline instead of being streamed on an internet-connected device.
What we’ve learned
The work with our first four Experience AI partners has given us with lots of localisation learnings, which we will use as we continue to expand the programme with more partners across the globe:
Cultural specificity: We gained insight into which contexts are not appropriate for non-UK schools, and which contexts all our partners found relevant.
Importance of local experts: We know we need to make sure we involve not just people who live in a country, but people who have a wealth of experience of working with learners and understand what is relevant to them.
Adaptation vs standardisation: We have learned about the balance between adapting resources and maintaining the same progression of learning across the Experience AI resources.
Throughout this process we have also reflected on the design principles for our resources and the choices we can make while we create more Experience AI materials in order to make them more amenable to localisation.
Join us as an Experience AI partner
We are very grateful to our partners for collaborating with us to localise the Experience AI resources. Thank you to Digital Moment, Tech Kidz Africa, Penang Science Cluster, and Asociația Techsoup.
We now have the tools to create resources that support a truly global community to access Experience AI in a way that resonates with them. If you’re interested in joining us as a partner, you can register your interest here.
(1) The cassava data set was published open source by Ernest Mwebaze, Timnit Gebru, Andrea Frome, Solomon Nsumba, and Jeremy Tusubira. Read their research paper about it here.
This article introduces the GrabX Decision Engine, an internal open-source package that offers a comprehensive framework for designing and analysing experiments conducted on online experiment platforms. The package encompasses a wide range of functionalities, including a pre-experiment advisor, a post-experiment analysis toolbox, and other advanced tools. In this article, we explore the motivation behind the development of these functionalities, their integration into the unique ecosystem of Grab’s multi-sided marketplace, and how these solutions strengthen the culture and calibre of experimentation at Grab.
Background
Today, Grab’s Experimentation (GrabX) platform orchestrates the testing of thousands of experimental variants each week. As the platform continues to expand and manage a growing volume of experiments, the need for dependable, scalable, and trustworthy experimentation tools becomes increasingly critical for data-driven and evidence-based
decision-making.
In our previous article, we presented the Automated Experiment Analysis application, a tool designed to automate data pipelines for analyses. However, during the development of this application for Grab’s experimenter community, we noticed a prevailing trend: experiments were predominantly analysed on a one-by-one, manual basis. While such a federated approach may be needed in a few cases, it presents numerous challenges at
the organisational level:
Lack of a contextual toolkit: GrabX facilitates executing a diverse range of experimentation designs, catering to the varied needs and contexts of different tech teams across the organisation. However, experimenters may often rely on generic online tools for experiment configurations (e.g. sample size calculations), which were not specifically designed to cater to the nuances of GrabX experiments or the recommended evaluation method, given the design. This is exacerbated by the fact
that most online tutorials or courses on experimental design do not typically address the nuances of multi-sided marketplaces, and cannot consider the nature or constraints of specific experiments.
Lack of standards: In this federated model, the absence of standardised and vetted practices can lead to reliability issues. In some cases, these can include poorly designed experiments, inappropriate evaluation methods, suboptimal testing choices, and unreliable inferences, all of which are difficult to monitor and rectify.
Lack of scalability and efficiency: Experimenters, coming from varied backgrounds and possessing distinct skill sets, may adopt significantly different approaches to experimentation and inference. This diversity, while valuable, often impedes the transferability and sharing of methods, hindering a cohesive and scalable experimentation framework. Additionally, this variance in methods can extend the lifecycle of experiment analysis, as disagreements over approaches may give rise to
repeated requests for review or modification.
Solution
To address these challenges, we developed the GrabX Decision Engine, a Python package open-sourced internally across all of Grab’s development platforms. Its central objective is to institutionalise best practices in experiment efficiency and analytics, thereby ensuring the derivation of precise and reliable conclusions from each experiment.
In particular, this unified toolkit significantly enhances our end-to-end experimentation processes by:
Ensuring compatibility with GrabX and Automated Experiment Analysis: The package is fully integrated with the Automated Experiment Analysis app, and provides analytics and test results tailored to the designs supported by GrabX. The outcomes can be further used for other downstream jobs, e.g. market modelling, simulation-based calibrations, or auto-adaptive configuration tuning.
Standardising experiment analytics: By providing a unified framework, the package ensures that the rationale behind experiment design and the interpretation of analysis results adhere to a company-wide standard, promoting consistency and ease of review across different teams.
Enhancing collaboration and quality: As an open-source package, it not only fosters a collaborative culture but also upholds quality through peer reviews. It invites users to tap into a rich pool of features while encouraging contributions that refine and expand the toolkit’s capabilities.
The package is designed for everyone involved in the experimentation process, with data scientists and product analysts being the primary users. Referred to as experimenters in this article, these key stakeholders can not only leverage the existing capabilities of the package to support their projects, but can also contribute their own innovations. Eventually, the experiment results and insights generated from the package via the Automated Experiment Analysis app have an even wider reach to stakeholders across all functions.
In the following section, we go deeper into the key functionalities of the package.
Feature details
The package comprises three key components:
An experimentation trusted advisor
A comprehensive post-experiment analysis toolbox
Advanced tools
These have been built taking into account the type of experiments we typically run at Grab. To understand their functionality, it’s useful to first discuss the key experimental designs supported by GrabX.
A note on experimental designs
While there is a wide variety of specific experimental designs implemented, they can be bucketed into two main categories: a between-subject design and a within-subject design.
In a between-subject design, participants — like our app users, driver-partners, and merchant-partners — are split into experimental groups, and each group gets exposed to a distinct condition throughout the experiment. One challenge in this design is that each participant may provide multiple observations to our experimental analysis sample, causing a high within-subject correlation among observations and deviations between the randomisation and session unit. This can affect the accuracy of
pre-experiment power analysis, and post-experiment inference, since it necessitates adjustments, e.g. clustering of standard errors when conducting hypothesis testing.
Conversely, a within-subject design involves every participant experiencing all conditions. Marketplace-level switchback experiments are a common GrabX use case, where a timeslice becomes the experimental unit. This design not only faces the aforementioned challenges, but also creates other complications that need to be accounted for, such as spillover effects across timeslices.
Designing and analysing the results of both experimental approaches requires careful nuanced statistical tools. Ensuring proper duration, sample size, controlling for confounders, and addressing potential biases are important considerations to enhance the validity of the results.
Trusted Advisor
The first key component of the Decision Engine is the Trusted Advisor, which provides a recommendation to the experimenter on key experiment attributes to be considered when preparing the experiment. This is dependent on the design; at a minimum, the experimenter needs to define whether the experiment design is between- or within-subject.
The between-subject design: We strongly recommend that experimenters utilise the “Trusted Advisor” feature in the Decision Engine for estimating their required sample size. This is designed to account for the multiple observations per user the experiment is expected to generate and adjusts for the presence of clustered errors (Moffatt, 2020; List, Sadoff, & Wagner, 2011). This feature allows users to input their data, either as a PySpark or Pandas dataframe. Alternatively, a function is
provided to extract summary statistics from their data, which can then be inputted into the Trusted Advisor. Obtaining the data beforehand is actually not mandatory; users have the option to directly query the recommended sample size based on common metrics derived from a regular data pipeline job. These functionalities are illustrated in the flowchart below.
Trusted Advisor functionalities
Furthermore, the Trusted Advisor feature can identify the underlying characteristics of the data, whether it’s passed directly, or queried from our common metrics database. This enables it to determine the appropriate power analysis for the experiment, without further guidance. For instance, it can detect if the target metric is a binary decision variable, and will adapt the power analysis to the correct context.
The within-subject design: In this case, we instead provide a best practices guideline to follow. Through our experience supporting various Tech Families running switchback experiments, we have observed various challenges highly dependent on the use case. This makes it difficult to create a one-size-fits-all solution.
For instance, an important factor affecting the final sample size requirement is how frequently treatments switch, which is also tied to what data granularity is appropriate to use in the post-experiment analysis. These considerations are dependent on, among other factors, how quickly a given treatment is expected to cause an effect. Some treatments may take effect relatively quickly (near-instantly, e.g. if applied to price checks), while others may take significantly longer (e.g. 15-30 minutes because they may require a trip to be completed). This has further consequences, e.g. autocorrelation between observations within a treatment window, spillover effects between different treatment windows, requirements for cool-down windows when treatments switch, etc.
Another issue we have identified from analysing the history of experiments on our platform is that a significant portion is prone to issues related to sample ratio mismatch (SRM). We therefore also heavily emphasise the post-experiment analysis corrections and robustness checks that are needed in switchback experiments, and do not simply rely on pre-experiment guidance such as power analysis.
Post-experiment analysis
Upon completion of the experiment, a comprehensive toolbox for post-experiment analysis is available. This toolbox consists of a wide range of statistical tests, ranging from normality tests to non-parametric and parametric tests. Here is an overview of the different types of tests included in the toolbox for different experiment setups:
Tests supported by the post-experiment analysis component
Though we make all the relevant tests available, the package sets a default list of output. With just two lines of code specifying the desired experiment design, experimenters can easily retrieve the recommended results, as summarised in the following table.
Types
Details
Basic statistics
The mean, variance, and sample size of Treatment and Control
Uplift tests
Welch’s t-test; Non-parametric tests, such as Wilcoxon signed-rank test and Mann-Whitney U Test
Misc tests
Normality tests such as the Shapiro-Wilk test, Anderson-Darling test, and Kolmogorov-Smirnov test; Levene test which assesses the equality of variances between groups
Regression models
A standard OLS/Logit model to estimate the treatment uplift; Recommended regression models
Warning
Provides a warning or notification related to the statistical analysis or results, for example: – Lack of variation in the variables – Sample size is too small – Too few randomisation units which will lead to under-estimated standard errors
Recommended regression models
Besides reporting relevant statistical test results, we adopt regression models to leverage their flexibility in controlling for confounders, fixed effects and heteroskedasticity, as is commonly observed in our experiments. As mentioned in the section “A note on experimental design”, each approach has different implications on the achieved randomisation, and hence requires its own customised regression models.
Between-subject design: the observations are not independent and identically distributed (i.i.d) but clustered due to repeated observations of the same experimental units. Therefore, we set the default clustering level at the participant level in our regression models, considering that most of our between-subject experiments only take a small portion of the population (Abadie et al., 2022).
Within-subject design: this has further challenges, including spillover effects and randomisation imbalances. As a result, they often require better control of confounding factors. We adopt panel data methods and impose time fixed effects, with no option to remove them. Though users have the flexibility to define these themselves, we use hourly fixed effects as our default as we have found that these match the typical seasonality we observe in marketplace metrics. Similar to between-subject
designs, we use standard error corrections for clustered errors, and small number of clusters, as the default. Our API is flexible for users to include further controls, as well as further fixed effects to adapt the estimator to geo-timeslice designs.
Advanced tools
Apart from the pre-experiment Trusted Advisor and the post-experiment Analysis Toolbox, we have enriched this package by providing more advanced tools. Some of them are set as a default feature in the previous two components, while others are ad-hoc capabilities which the users can utilise via calling the functions directly.
Variance reduction
We bring in multiple methods to reduce variance and improve the power and sensitivity of experiments:
Stratified sampling: recognised for reducing variance during assignment
Post stratification: a post-assignment variance reduction technique
MLRATE: an extension of CUPED that allows for the use of non-linear / machine learning models
These approaches offer valuable ways to mitigate variance and improve the overall effectiveness of experiments. The experimenters can directly access these ad hoc capabilities via the package.
Multiple comparisons problem
A multiple comparisons problem occurs when multiple hypotheses are simultaneously tested, leading to a higher likelihood of false positives. To address this, we implement various statistical correction techniques in this package, as illustrated below.
Statistical correction techniques
Experimenters can specify if they have concerns about the dependency of the tests and whether the test results are expected to be negatively related. This capability will adopt the following procedures and choose the relevant tests to mitigate the risk of false positives accordingly:
False Discovery Rate (FDR) procedures, which control the expected rate of false discoveries.
Family-wise Error Rate (FWER) procedures, which control the probability of making at least one false discovery within a set of related tests referred to as a family.
Multiple treatments and unequal treatment sizes
We developed a capability to deal with experiments where there are multiple treatments. This capability employs a conservative approach to ensure that the size reaches a minimum level where any pairwise comparison between the control and treatment groups has a sufficient sample size.
Heterogeneous treatment effects
Heterogeneous treatment effects refer to a situation where the treatment effect varies across different groups or subpopulations within a larger population. For instance, it may be of interest to examine treatment effects specifically on rainy days compared to non-rainy days. We have incorporated this functionality into the tests for both experiment designs. By enabling this feature, we facilitate a more nuanced analysis that accounts for potential variations in treatment effects based on different factors or contexts.
Maintenance and support
The package is available across all internal DS/Machine Learning platforms and individual local development environments within Grab. Its source code is openly accessible to all developers within Grab and its release adheres to a semantic release standard.
In addition to the technical maintenance efforts, we have introduced a dedicated committee and a workspace to address issues that may extend beyond the scope of the package’s current capabilities.
Experiment Council
Within Grab, there is a dedicated committee known as the ‘Experiment Council’. This committee includes data scientists, analysts, and economists from various functions. One of their responsibilities is to collaborate to enhance and maintain the package, as well as guide users in effectively utilising its functionalities. The Experiment Council plays a crucial role in enhancing the overall operational excellence of conducting experiments and deriving meaningful insights from them.
GrabCausal Methodology Bank
Experimenters frequently encounter challenges regarding the feasibility of conducting experiments for causal problems. To address this concern, we have introduced an alternative workspace called GrabCausal Methodology Bank. Similar to the internal open-source nature of this project, the GrabCausal Methodology bank is open to contributions from all users within Grab. It provides a collaborative space where users can readily share their code, case studies, guidelines, and suggestions related to
causal methodologies. By fostering an open and inclusive environment, this workspace encourages knowledge sharing and promotes the advancement of causal research methods.
The workspace functions as a platform, which now exhibits a wide range of commonly used methods, including Diff-in-Diff, Event studies, Regression Discontinuity Designs (RDD), Instrumental Variables (IV), Bayesian structural time series, and Bunching. Additionally, we are dedicated to incorporating more, such as Synthetic control, Double ML (Chernozhukov et al. 2018), DAG discovery/validation, etc., to further enhance our offerings in this space.
Learnings
Over the past few years, we have invested in developing and expanding this package. Our initial motivation was humble yet motivating – to contribute to improving the quality of experimentation at Grab, helping it develop from its initial start-up modus operandi to a more consolidated, rigorous, and guided approach.
Throughout this journey, we have learned that prioritisation holds the utmost significance in open-source projects of this nature; the majority of user demands can be met through relatively small yet pivotal efforts. By focusing on these core capabilities, we avoid spreading resources too thinly across all areas at the initial stage of planning and development.
Meanwhile, we acknowledge that there is still a significant journey ahead. While the package now focuses solely on individual experiments, an inherent challenge in online-controlled experimentation platforms is the interference between experiments (Gupta, et al, 2019). A recent development in the field is to embrace simultaneous tests (Microsoft, Google, Spotify and booking.com and Optimizely), and to carefully consider the tradeoff between accuracy and velocity.
The key to overcoming this challenge will be a close collaboration between the community of experimenters, the teams developing this unified toolkit, and the GrabX platform engineers. In particular, the platform developers will continue to enrich the experimentation SDK by providing diverse assignment strategies, sampling mechanisms, and user interfaces to manage potential inference risks better. Simultaneously, the community of experimenters can coordinate among themselves effectively to
avoid severe interference, which will also be monitored by GrabX. Last but not least, the development of this unified toolkit will also focus on monitoring, evaluating, and managing inter-experiment interference.
In addition, we are committed to keeping this package in sync with industry advancements. Many existing tools in this package, despite being labelled as “advanced” in the earlier discussions, are still relatively simplified. For instance,
Incorporating standard errors clustering based on the diverse assignment and sampling strategies requires attention (Abadie, et al, 2023).
Sequential testing will play a vital role in detecting uplifts earlier and safely, avoiding p-hacking. One recent innovation is the “always valid inference” (Johari, et al., 2022)
The advancements in investigating heterogeneous effects, such as Causal Forest (Athey and Wager, 2019), have extended beyond linear approaches, now incorporating nonlinear and more granular analyses.
Estimating the long-term treatment effects observed from short-term follow-ups is also a long-term objective, and one approach is using a Surrogate Index (Athey, et al 2019).
Continuous effort is required to stay updated and informed about the latest advancements in statistical testing methodologies, to ensure accuracy and effectiveness.
This article marks the beginning of our journey towards automating the experimentation and product decision-making process among the data scientist community. We are excited about the prospect of expanding the toolkit further in these directions. Stay tuned for more updates and posts.
References
Abadie, Alberto, et al. “When should you adjust standard errors for clustering?.” The Quarterly Journal of Economics 138.1 (2023): 1-35.
Athey, Susan, et al. “The surrogate index: Combining short-term proxies to estimate long-term treatment effects more rapidly and precisely.” No. w26463. National Bureau of Economic Research, 2019.
Athey, Susan, and Stefan Wager. “Estimating treatment effects with causal forests: An application.” Observational studies 5.2 (2019): 37-51.
Chernozhukov, Victor, et al. “Double/debiased machine learning for treatment and structural parameters.” (2018): C1-C68.
Facure, Matheus. Causal Inference in Python. O’Reilly Media, Inc., 2023.
Gupta, Somit, et al. “Top challenges from the first practical online controlled experiments summit.” ACM SIGKDD Explorations Newsletter 21.1 (2019): 20-35.
Huntington-Klein, Nick. The Effect: An Introduction to Research Design and Causality. CRC Press, 2021.
Imbens, Guido W. and Donald B. Rubin. Causal Inference for Statistics, Social, and Biomedical Sciences: An Introduction. Cambridge University Press, 2015.
Johari, Ramesh, et al. “Always valid inference: Continuous monitoring of a/b tests.” Operations Research 70.3 (2022): 1806-1821.
List, John A., Sally Sadoff, and Mathis Wagner. “So you want to run an experiment, now what? Some simple rules of thumb for optimal experimental design.” Experimental Economics 14 (2011): 439-457.
Moffatt, Peter. Experimetrics: Econometrics for Experimental Economics. Bloomsbury Publishing, 2020.
Join us
Grab is the leading superapp platform in Southeast Asia, providing everyday services that matter to consumers. More than just a ride-hailing and food delivery app, Grab offers a wide range of on-demand services in the region, including mobility, food, package and grocery delivery services, mobile payments, and financial services across 428 cities in eight countries.
Powered by technology and driven by heart, our mission is to drive Southeast Asia forward by creating economic empowerment for everyone. If this mission speaks to you, join our team today!
A photo of the eclipse taken by Bryton Herdes, a member of our Network team, in Southern Illinois.
There are events that unite people, like a total solar eclipse, reminding us, humans living on planet Earth, of our shared dependence on the sun. Excitement was obvious in Mexico, several US states, and Canada during the total solar eclipse that occurred on April 8, 2024. Dubbed the Great North American Eclipse, millions gathered outdoors to witness the Moon pass between Earth and the Sun, casting darkness over fortunate states. Amidst the typical gesture of putting the eclipse glasses on and taking them off, depending on if people were looking at the sky during the total eclipse, or before or after, what happened to Internet traffic?
Cloudflare’s data shows a clear impact on Internet traffic from Mexico to Canada, following the path of totality. The eclipse occurred between 15:42 UTC and 20:52 UTC, moving from south to north, as seen in this NASA image of the path and percentage of darkness of the eclipse.
Looking at the United States in aggregate terms, bytes delivered traffic dropped by 8%, and request traffic by 12% as compared to the previous week at 19:00 UTC (14:00 Eastern, 12:00 Pacific).
Bytes delivered percentage change (-8% at 19:00 UTC)HTTP requests percentage change (-12% at 19:00 UTC)
The state-level perspective in terms of traffic drop at the time of the eclipse, as compared to the previous week, is much more revealing. Here’s a summary of the US states’ traffic changes. We can almost trace the path of the eclipse, as shown in the previous NASA image.
From our data, Vermont, Arkansas, Indiana, Maine, New Hampshire, and Ohio experienced traffic drops of 40% or more around the time of the eclipse. These states were all in the path of totality, which was not the case for several others.
In the next table, we provide a detailed breakdown of the same perspective shown on the US map ordered by drop in traffic. In all of these charts, we’re using UTC as the time. We include the time of the biggest traffic drop compared to the previous week, at a 5-minute granularity, and also the percentage of drop compared to the previous week. States where it was possible to see at least part of the total eclipse are highlighted in bold. At the bottom are those with no clear difference.
The US: traffic change at time of the eclipse
State
Time of drop (UTC)
Local time
% of drop
Vermont
19:25
15:25
-60%
Arkansas
18:50
13:50
-54%
Indiana
19:05
15:05
-50%
Maine
19:30
15:30
-48%
New Hampshire
19:20
15:20
-40%
Ohio
19:10
15:10
-40%
Kentucky
19:05
14:05
-33%
Massachusetts
19:25
15:25
-33%
Michigan
19:15
15:15
-32%
Kansas
18:50
13:50
-31%
Missouri
18:55
13:55
-31%
Connecticut
19:20
15:20
-29%
Maryland
19:15
15:15
-29%
New York
19:25
15:25
-29%
Oklahoma
18:45
13:45
-29%
Rhode Island
19:25
15:25
-29%
New Jersey
19:20
15:20
-28%
Arizona
18:15
11:15
-27%
Illinois
19:05
14:05
-26%
Pennsylvania
19:15
15:15
-26%
West Virginia
19:15
15:15
-24%
Wisconsin
19:05
14:05
-22%
Wyoming
18:20
12:20
-19%
Alaska
20:15
12:15
-18%
Delaware
19:20
15:20
-18%
District of Columbia
19:15
15:15
-16%
New Mexico
18:25
12:25
-16%
Oregon
18:15
11:15
-16%
Nebraska
18:50
13:50/12:50
-15%
Texas
18:45
13:45
-15%
Colorado
18:25
12:25
-14%
Virginia
18:20
14:20
-14%
Alabama
19:00
14:00
-13%
Tennessee
19:00
15:00/14:00
-13%
Iowa
18:15
13:15
-12%
Nevada
18:10
11:10
-12%
Georgia
19:05
15:05
-11%
North Carolina
19:10
15:10
-10%
California
18:15
11:15
-9%
Florida
18:15
14:15
-7%
Utah
18:15
12:15
-5%
Montana
18:25
12:25
-4%
South Carolina
19:00
15:00
-4%
Hawaii
—
—
—
Louisiana
—
—
—
Minnesota
—
—
—
Mississippi
—
—
—
North Dakota
—
—
—
Idaho
—
—
—
South Dakota
—
—
—
Washington
—
—
—
Visualized, here’s what Vermont’s 60% drop looks like:
And here’s what the traffic drops in Arkansas, Maine, and Indiana look like:
In terms of states with larger populations, New York took the lead:
Mexico got the eclipse first
Before the eclipse became visible in the US, Mexico experienced it first. States within the eclipse zone, such as Coahuila, Durango, and Sinaloa, experienced noticeable drops in traffic. Even Mexico City, located further south, was affected.
Mexico: traffic change at time of the eclipse
State
Time of drop (UTC)
Local time
% of drop
Durango
18:15
12:15
-57%
Coahuila
18:15
12:15
-43%
Sinaloa
18:10
11:10
-34%
Mexico City
18:10
12:10
-22%
Here’s the Durango and Coahuila state perspectives:
Canada at last: an island stopped to see the eclipse
After Mexico and the US, Canada was next in the path of the eclipse. Prince Edward Island experienced the most significant impact in Canada. This region, with a population of less than 200,000, is one of eastern Canada’s maritime provinces, situated off New Brunswick and Nova Scotia in the Gulf of St. Lawrence. Next came New Brunswick and Newfoundland and Labrador.
This was the last total solar eclipse visible in the contiguous United States until August 23, 2044, with the next eclipse of similar breadth projected for August 12, 2045.
Last week, we announced the general availability of the integration between Amazon DataZone and AWS Lake Formationhybrid access mode. In this post, we share how this new feature helps you simplify the way you use Amazon DataZone to enable secure and governed sharing of your data in the AWS Glue Data Catalog. We also delve into how data producers can share their AWS Glue tables through Amazon DataZone without needing to register them in Lake Formation first.
Overview of the Amazon DataZone integration with Lake Formation hybrid access mode
Amazon DataZone is a fully managed data management service to catalog, discover, analyze, share, and govern data between data producers and consumers in your organization. With Amazon DataZone, data producers populate the business data catalog with data assets from data sources such as the AWS Glue Data Catalog and Amazon Redshift. They also enrich their assets with business context to make it straightforward for data consumers to understand. After the data is available in the catalog, data consumers such as analysts and data scientists can search and access this data by requesting subscriptions. When the request is approved, Amazon DataZone can automatically provision access to the data by managing permissions in Lake Formation or Amazon Redshift so that the data consumer can start querying the data using tools such as Amazon Athena or Amazon Redshift.
To manage the access to data in the AWS Glue Data Catalog, Amazon DataZone uses Lake Formation. Previously, if you wanted to use Amazon DataZone for managing access to your data in the AWS Glue Data Catalog, you had to onboard your data to Lake Formation first. Now, the integration of Amazon DataZone and Lake Formation hybrid access mode simplifies how you can get started with your Amazon DataZone journey by removing the need to onboard your data to Lake Formation first.
Lake Formation hybrid access mode allows you to start managing permissions on your AWS Glue databases and tables through Lake Formation, while continuing to maintain any existing AWS Identity and Access Management (IAM) permissions on these tables and databases. Lake Formation hybrid access mode supports two permission pathways to the same Data Catalog databases and tables:
In the first pathway, Lake Formation allows you to select specific principals (opt-in principals) and grant them Lake Formation permissions to access databases and tables by opting in
The second pathway allows all other principals (that are not added as opt-in principals) to access these resources through the IAM principal policies for Amazon Simple Storage Service (Amazon S3) and AWS Glue actions
With the integration between Amazon DataZone and Lake Formation hybrid access mode, if you have tables in the AWS Glue Data Catalog that are managed through IAM-based policies, you can publish these tables directly to Amazon DataZone, without registering them in Lake Formation. Amazon DataZone registers the location of these tables in Lake Formation using hybrid access mode, which allows managing permissions on AWS Glue tables through Lake Formation, while continuing to maintain any existing IAM permissions.
Amazon DataZone enables you to publish any type of asset in the business data catalog. For some of these assets, Amazon DataZone can automatically manage access grants. These assets are called managed assets, and include Lake Formation-managed Data Catalog tables and Amazon Redshift tables and views. Prior to this integration, you had to complete the following steps before Amazon DataZone could treat the published Data Catalog table as a managed asset:
Identity the Amazon S3 location associated with Data Catalog table.
Register the Amazon S3 location with Lake Formation in hybrid access mode using a role with appropriate permissions.
Publish the table metadata to the Amazon DataZone business data catalog.
The following diagram illustrates this workflow.
With the Amazon DataZone’s integration with Lake Formation hybrid access mode, you can simply publish your AWS Glue tables to Amazon DataZone without having to worry about registering the Amazon S3 location or adding an opt-in principal in Lake Formation by delegating these steps to Amazon DataZone. The administrator of an AWS account can enable the data location registration setting under the DefaultDataLake blueprint on the Amazon DataZone console. Now, a data owner or publisher can publish their AWS Glue table (managed through IAM permissions) to Amazon DataZone without the extra setup steps. When a data consumer subscribes to this table, Amazon DataZone registers the Amazon S3 locations of the table in hybrid access mode, adds the data consumer’s IAM role as an opt-in principal, and grants access to the same IAM role by managing permissions on the table through Lake Formation. This makes sure that IAM permissions on the table can coexist with newly granted Lake Formation permissions, without disrupting any existing workflows. The following diagram illustrates this workflow.
Solution overview
To demonstrate this new capability, we use a sample customer scenario where the finance team wants to access data owned by the sales team for financial analysis and reporting. The sales team has a pipeline that creates a dataset containing valuable information about ticket sales, popular events, venues, and seasons. We call it the tickit dataset. The sales team stores this dataset in Amazon S3 and registers it in a database in the Data Catalog. The access to this table is currently managed through IAM-based permissions. However, the sales team wants to publish this table to Amazon DataZone to facilitate secure and governed data sharing with the finance team.
The steps to configure this solution are as follows:
The Amazon DataZone administrator enables the data lake location registration setting in Amazon DataZone to automatically register the Amazon S3 location of the AWS Glue tables in Lake Formation hybrid access mode.
After the hybrid access mode integration is enabled in Amazon DataZone, the finance team requests a subscription to the sales data asset. The asset shows up as a managed asset, which means Amazon DataZone can manage access to this asset even if the Amazon S3 location of this asset isn’t registered in Lake Formation.
The sales team is notified of a subscription request raised by the finance team. They review and approve the access request. After the request is approved, Amazon DataZone fulfills the subscription request by managing permissions in the Lake Formation. It registers the Amazon S3 location of the subscribed table in Lake Formation hybrid mode.
The finance team gains access to the sales dataset required for their financial reports. They can go to their DataZone environment and start running queries using Athena against their subscribed dataset.
Prerequisites
To follow the steps in this post, you need an AWS account. If you don’t have an account, you can create one. In addition, you must have the following resources configured in your account:
An S3 bucket
An AWS Glue database and crawler
IAM roles for different personas and services
An Amazon DataZone domain and project
An Amazon DataZone environment profile and environment
An Amazon DataZone data source
If you don’t have these resources already configured, you can create them by deploying the following AWS CloudFormation stack:
Choose Launch Stack to deploy a CloudFormation template.
Complete the steps to deploy the template and leave all settings as default.
Select I acknowledge that AWS CloudFormation might create IAM resources, then choose Submit.
After the CloudFormation deployment is complete, you can log in to the Amazon DataZone portal and manually trigger a data source run. This pulls any new or modified metadata from the source and updates the associated assets in the inventory. This data source has been configured to automatically publish the data assets to the catalog.
On the Amazon DataZone console, choose View domains.
You should be logged in using the same role that is used to deploy CloudFormation and verify that you are in the same AWS Region.
Find the domain blog_dz_domain, then choose Open data portal.
Choose Browse all projects and choose Sales producer project.
On the Data tab, choose Data sources in the navigation pane.
Locate and choose the data source that you want to run.
This opens the data source details page.
Choose the options menu (three vertical dots) next to tickit_datasource and choose Run.
The data source status changes to Running as Amazon DataZone updates the asset metadata.
Enable hybrid mode integration in Amazon DataZone
In this step, the Amazon DataZone administrator goes through the process of enabling the Amazon DataZone integration with Lake Formation hybrid access mode. Complete the following steps:
On a separate browser tab, open the Amazon DataZone console.
Verify that you are in the same Region where you deployed the CloudFormation template.
Choose View domains.
Choose the domain created by AWS CloudFormation, blog_dz_domain.
Scroll down on the domain details page and choose the Blueprints tab.
A blueprint defines what AWS tools and services can be used with the data assets published in Amazon DataZone. The DefaultDataLake blueprint is enabled as part of the CloudFormation stack deployment. This blueprint enables you to create and query AWS Glue tables using Athena. For the steps to enable this in your own deployments, refer to Enable built-in blueprints in the AWS account that owns the Amazon DataZone domain.
Choose the DefaultDataLake blueprint.
On the Provisioning tab, choose Edit.
Select Enable Amazon DataZone to register S3 locations using AWS Lake Formation hybrid access mode.
You have the option of excluding specific Amazon S3 locations if you don’t want Amazon DataZone to automatically register them to Lake Formation hybrid access mode.
Choose Save changes.
Request access
In this step, you log in to Amazon DataZone as the finance team, search for the sales data asset, and subscribe to it. Complete the following steps:
Return to your Amazon DataZone data portal browser tab.
Switch to the finance consumer project by choosing the dropdown menu next to the project name and choosing Finance consumer project.
From this step onwards, you take on the persona of a finance user looking to subscribe to a data asset published in the previous step.
In the search bar, search for and choose the sales data asset.
Choose Subscribe.
The asset shows up as managed asset. This means that Amazon DataZone can grant access to this data asset to the finance team’s project by managing the permissions in Lake Formation.
Enter a reason for the access request and choose Subscribe.
Approve access request
The sales team gets a notification that an access request from the finance team is submitted. To approve the request, complete the following steps:
Choose the dropdown menu next to the project name and choose Sales producer project.
You now assume the persona of the sales team, who are the owners and stewards of the sales data assets.
Choose the notification icon at the top-right corner of the DataZone portal.
Choose the Subscription Request Created task.
Grant access to the sales data asset to the finance team and choose Approve.
Analyze the data
The finance team has now been granted access to the sales data, and this dataset has been to their Amazon DataZone environment. They can access the environment and query the sales dataset with Athena, along with any other datasets they currently own. Complete the following steps:
On the dropdown menu, choose Finance consumer project.
On the right pane of the project overview screen, you can find a list of active environments available for use.
Choose the Amazon DataZone environment finance_dz_environment.
In the navigation pane, under Data assets, choose Subscribed.
Verify that your environment now has access to the sales data.
It may take a few minutes for the data asset to be automatically added to your environment.
Choose the new tab icon for Query data.
A new tab opens with the Athena query editor.
For Database, choose finance_consumer_db_tickitdb-<suffix>.
This database will contain your subscribed data assets.
Generate a preview of the sales table by choosing the options menu (three vertical dots) and choosing Preview table.
Clean up
To clean up your resources, complete the following steps:
Switch back to the administrator role you used to deploy the CloudFormation stack.
On the Amazon DataZone console, delete the projects used in this post. This will delete most project-related objects like data assets and environments.
On the AWS CloudFormation console, delete the stack you deployed in the beginning of this post.
On the Amazon S3 console, delete the S3 buckets containing the tickit dataset.
On the Lake Formation console, delete the Lake Formation admins registered by Amazon DataZone.
On the Lake Formation console, delete tables and databases created by Amazon DataZone.
Conclusion
In this post, we discussed how the integration between Amazon DataZone and Lake Formation hybrid access mode simplifies the process to start using Amazon DataZone for end-to-end governance of your data in the AWS Glue Data Catalog. This integration helps you bypass the manual steps of onboarding to Lake Formation before you can start using Amazon DataZone.
Utkarsh Mittal is a Senior Technical Product Manager for Amazon DataZone at AWS. He is passionate about building innovative products that simplify customers’ end-to-end analytics journeys. Outside of the tech world, Utkarsh loves to play music, with drums being his latest endeavor.
Praveen Kumar is a Principal Analytics Solution Architect at AWS with expertise in designing, building, and implementing modern data and analytics platforms using cloud-centered services. His areas of interests are serverless technology, modern cloud data warehouses, streaming, and generative AI applications.
Paul Villena is a Senior Analytics Solutions Architect in AWS with expertise in building modern data and analytics solutions to drive business value. He works with customers to help them harness the power of the cloud. His areas of interests are infrastructure as code, serverless technologies, and coding in Python
The collective thoughts of the interwebz
Manage Consent
To provide the best experiences, we use technologies like cookies to store and/or access device information. Consenting to these technologies will allow us to process data such as browsing behavior or unique IDs on this site. Not consenting or withdrawing consent, may adversely affect certain features and functions.
Functional
Always active
The technical storage or access is strictly necessary for the legitimate purpose of enabling the use of a specific service explicitly requested by the subscriber or user, or for the sole purpose of carrying out the transmission of a communication over an electronic communications network.
Preferences
The technical storage or access is necessary for the legitimate purpose of storing preferences that are not requested by the subscriber or user.
Statistics
The technical storage or access that is used exclusively for statistical purposes.The technical storage or access that is used exclusively for anonymous statistical purposes. Without a subpoena, voluntary compliance on the part of your Internet Service Provider, or additional records from a third party, information stored or retrieved for this purpose alone cannot usually be used to identify you.
Marketing
The technical storage or access is required to create user profiles to send advertising, or to track the user on a website or across several websites for similar marketing purposes.


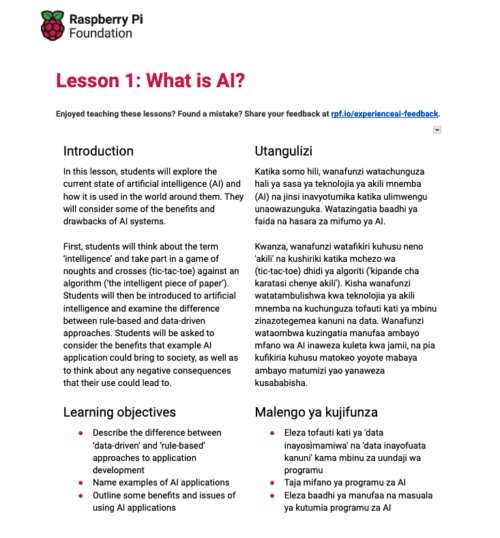


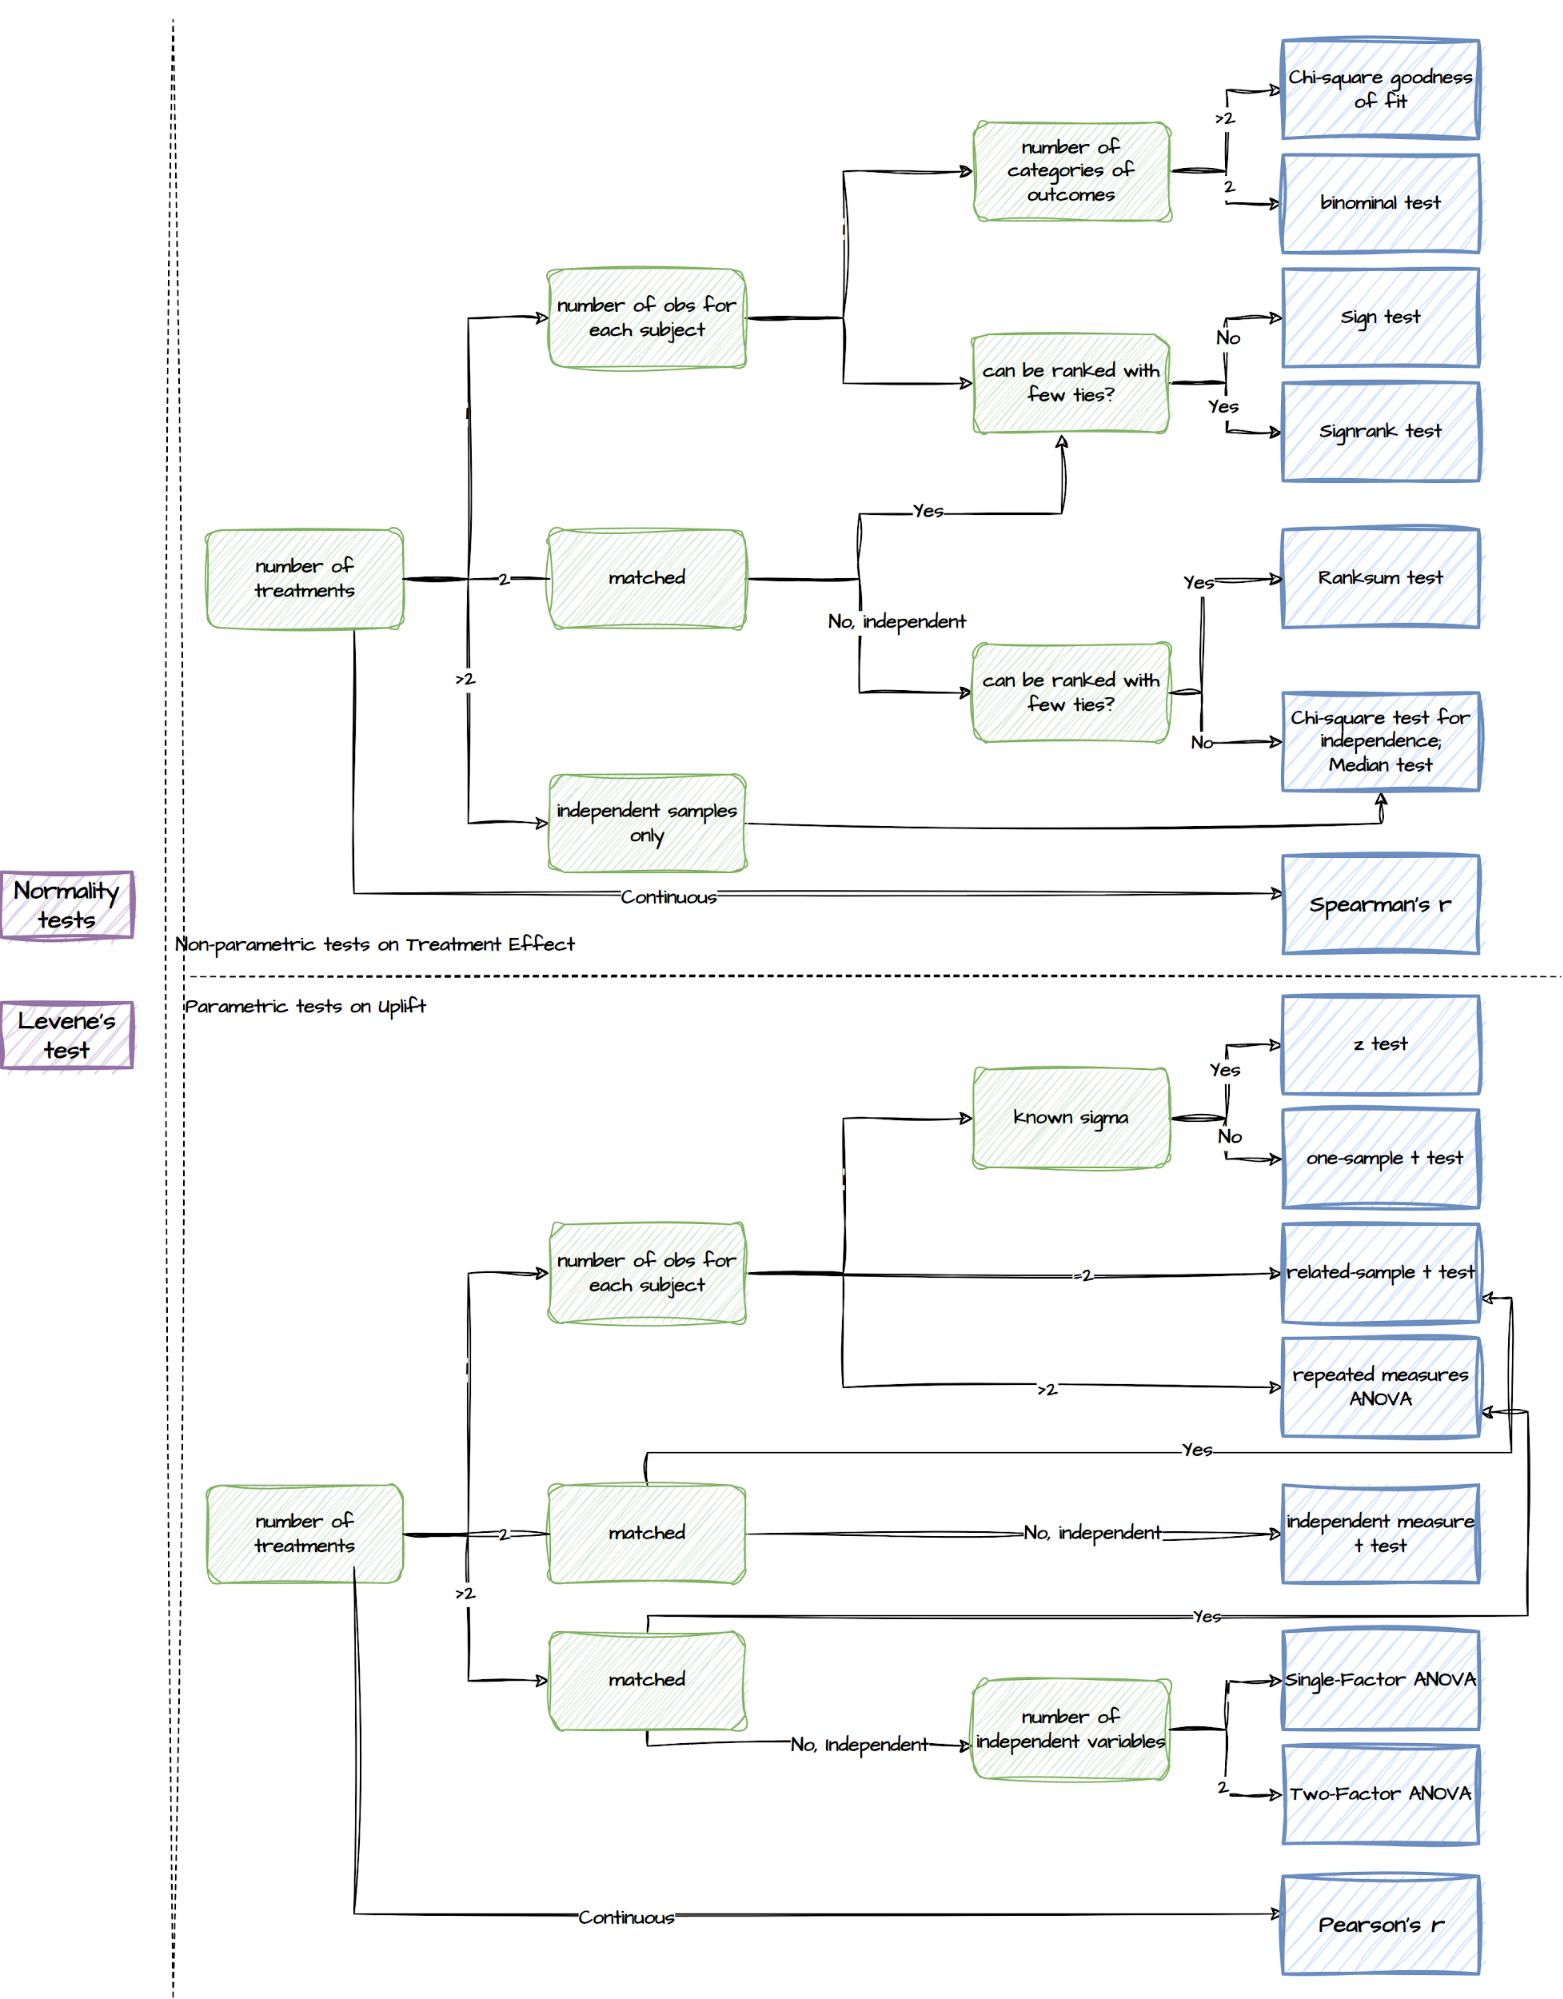
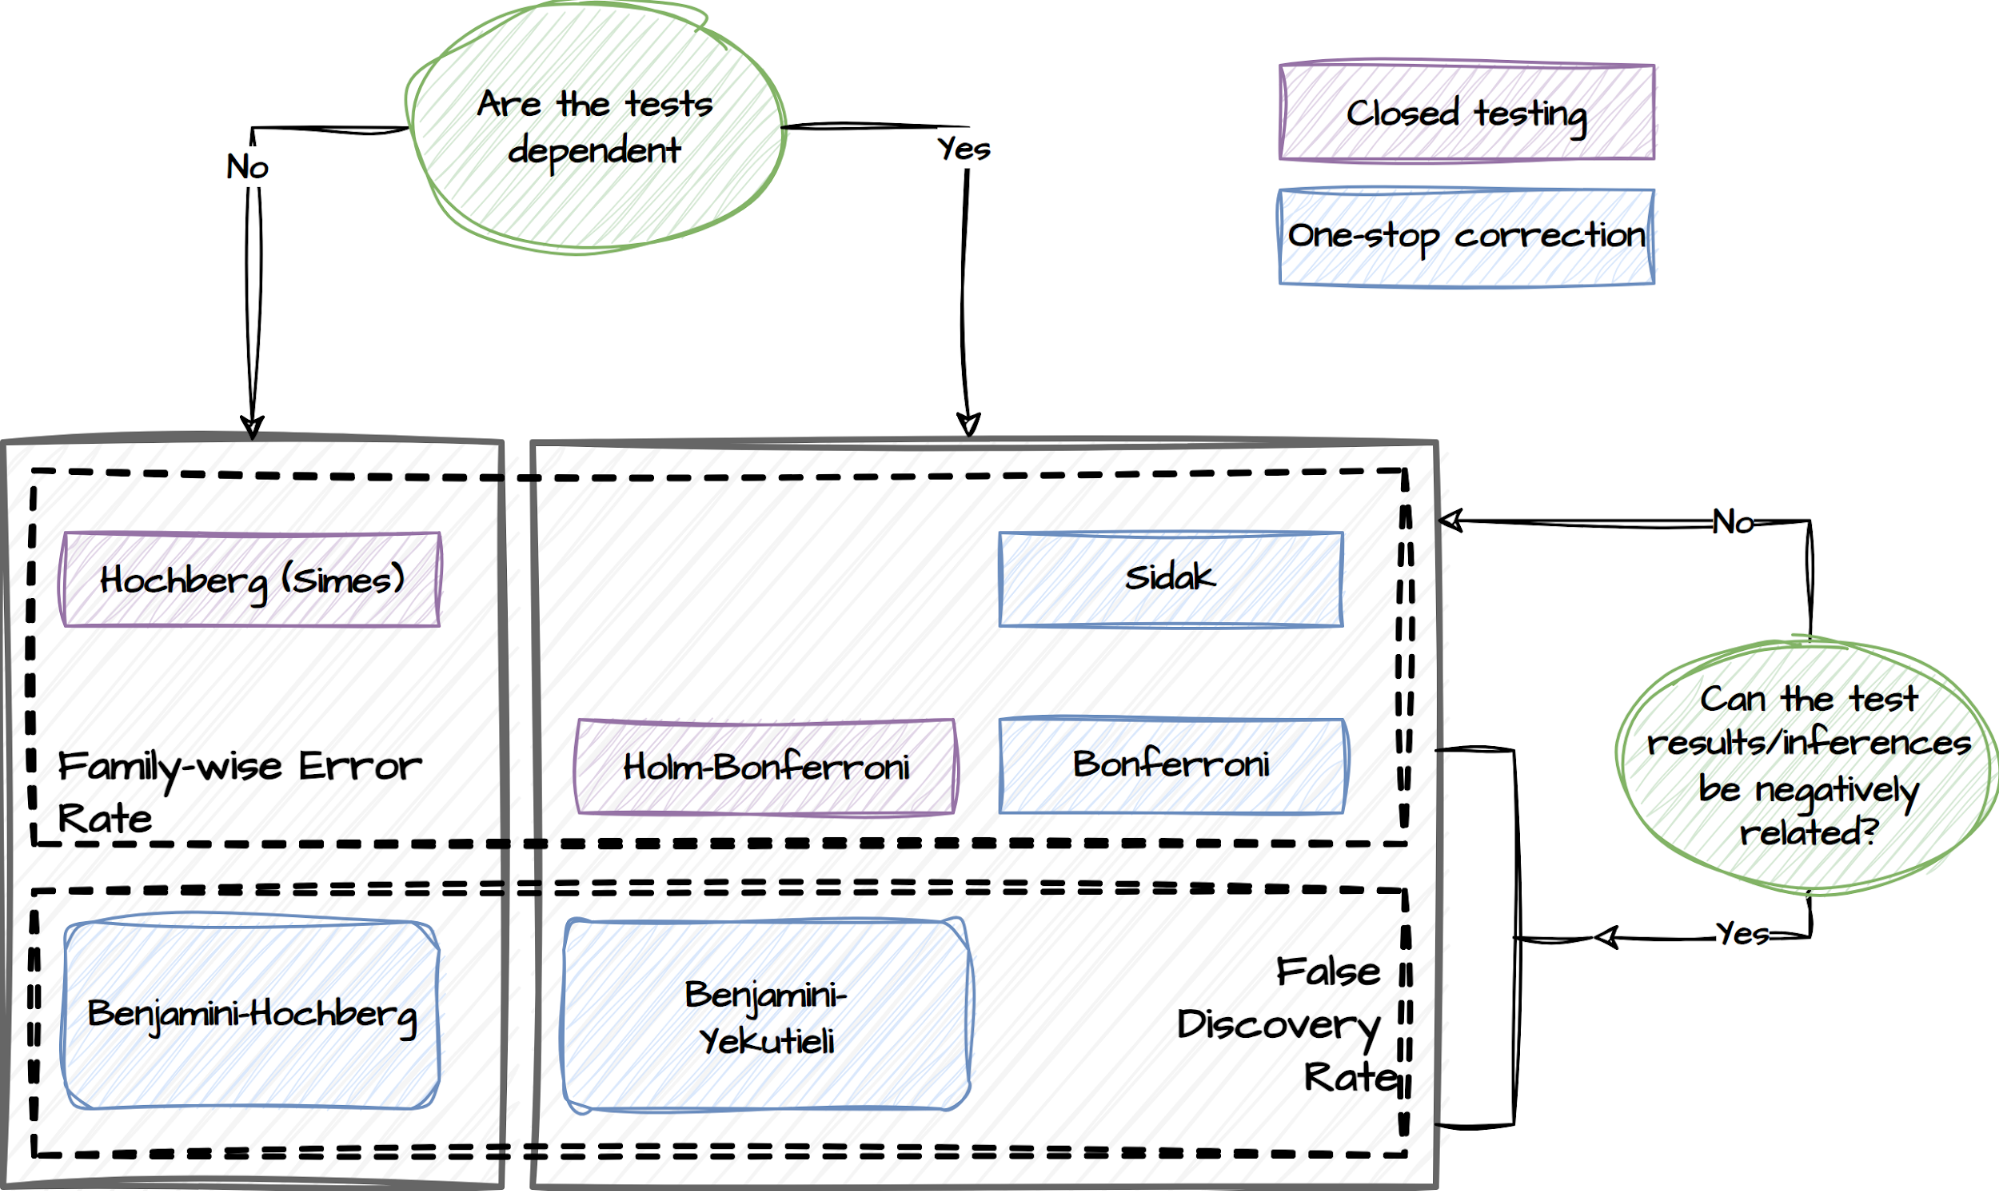


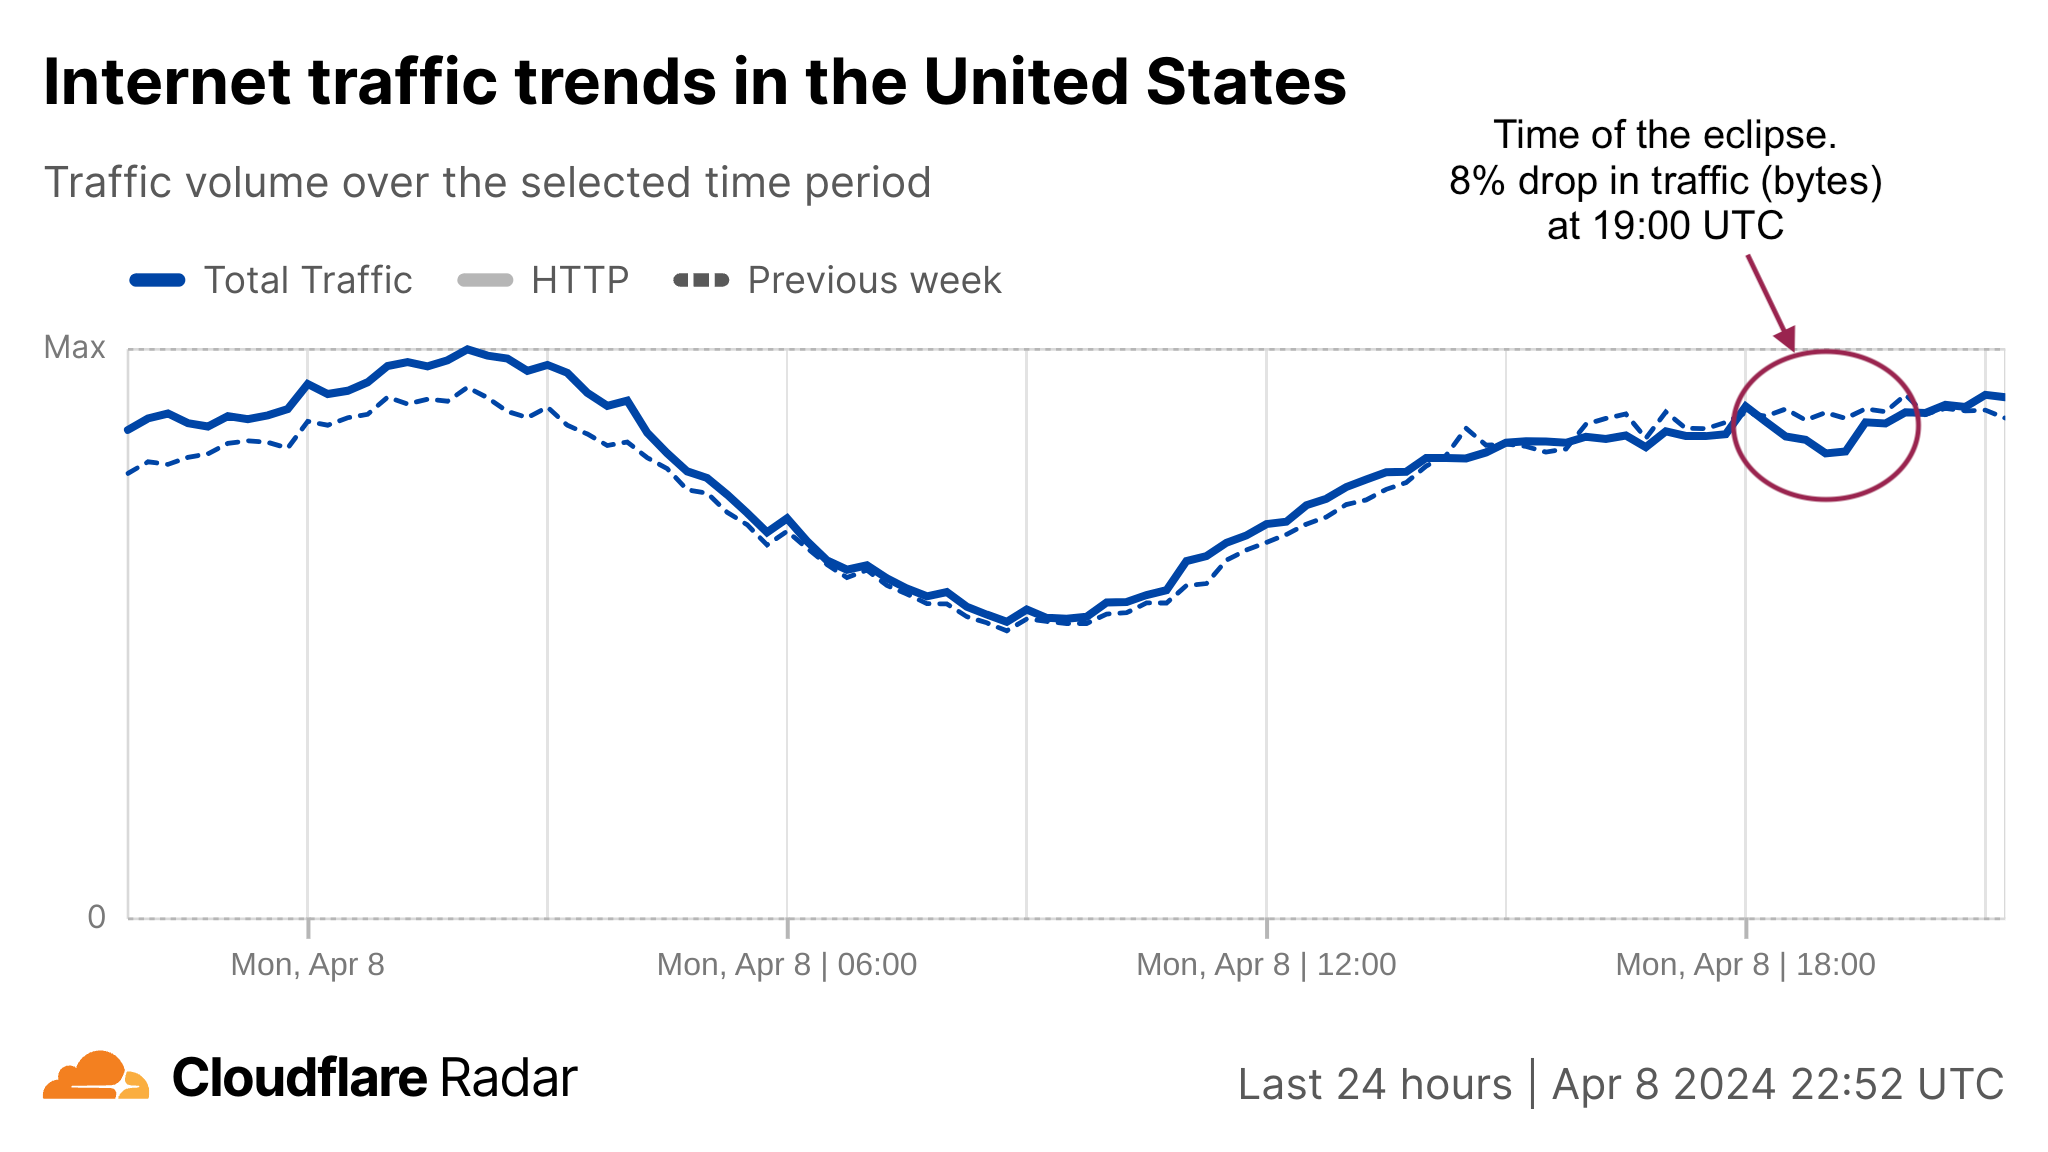
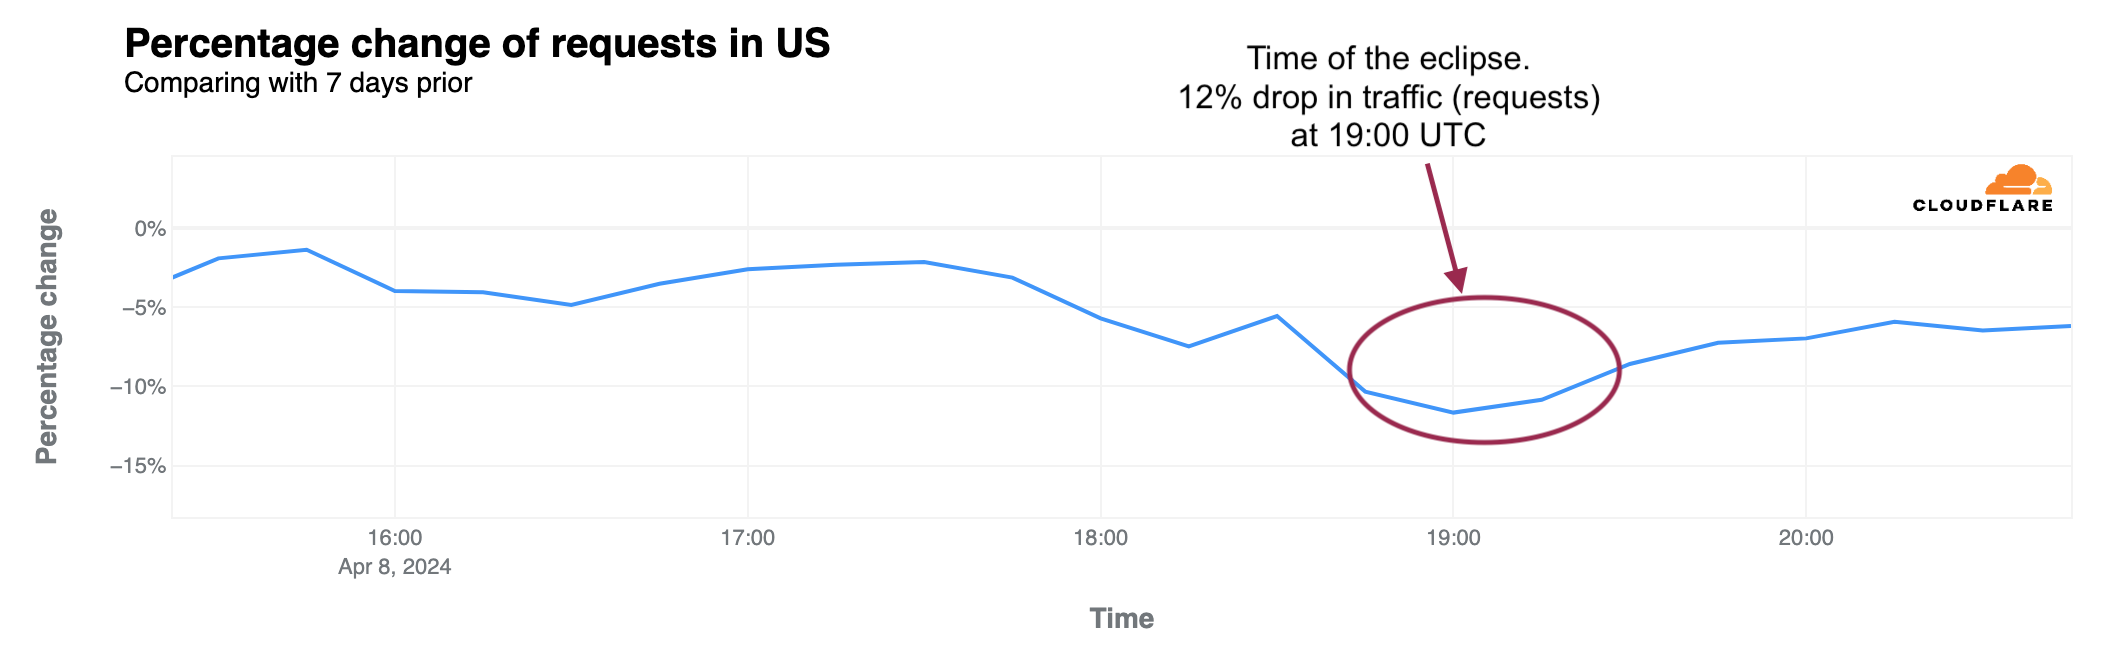

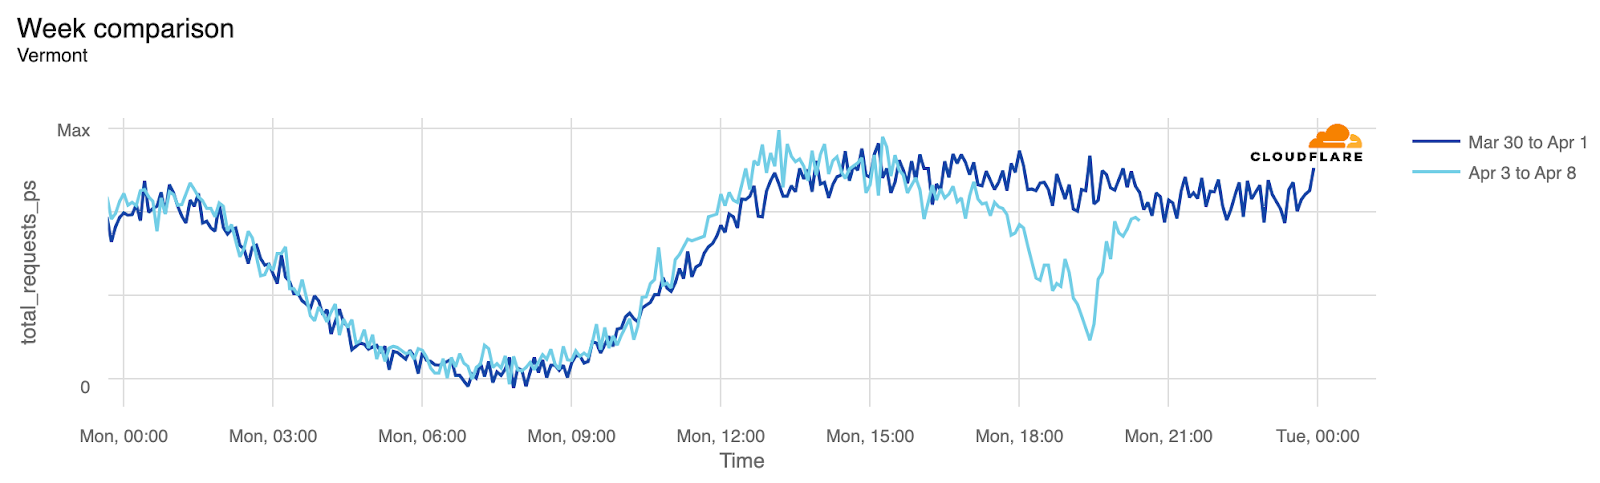
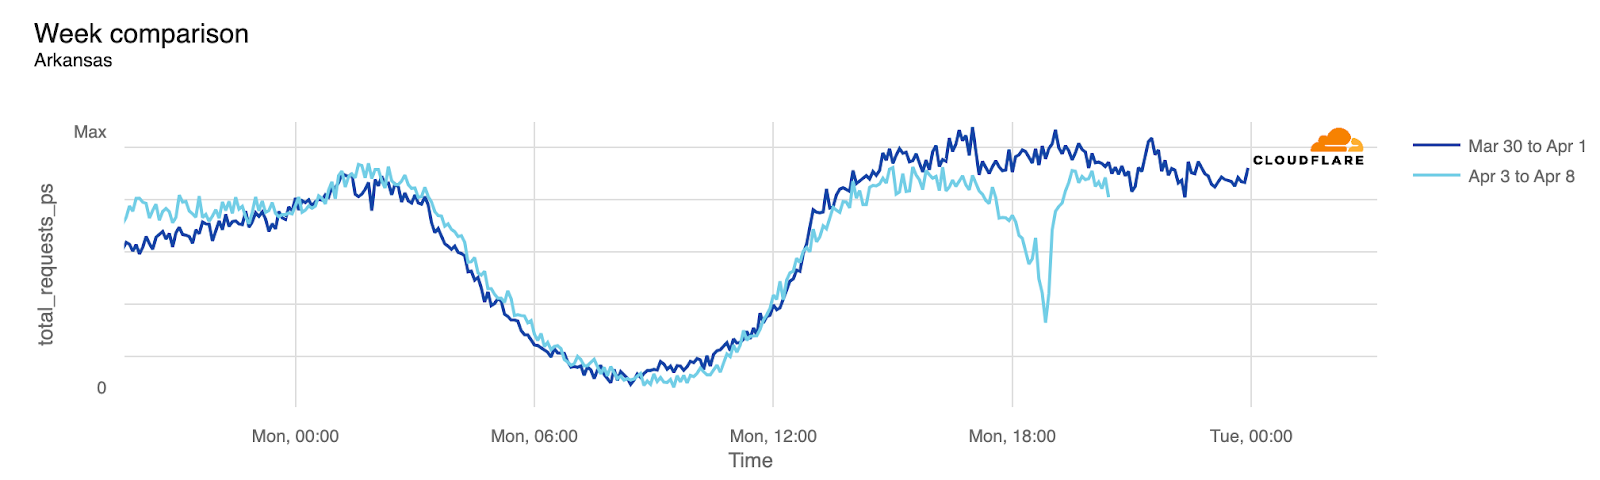
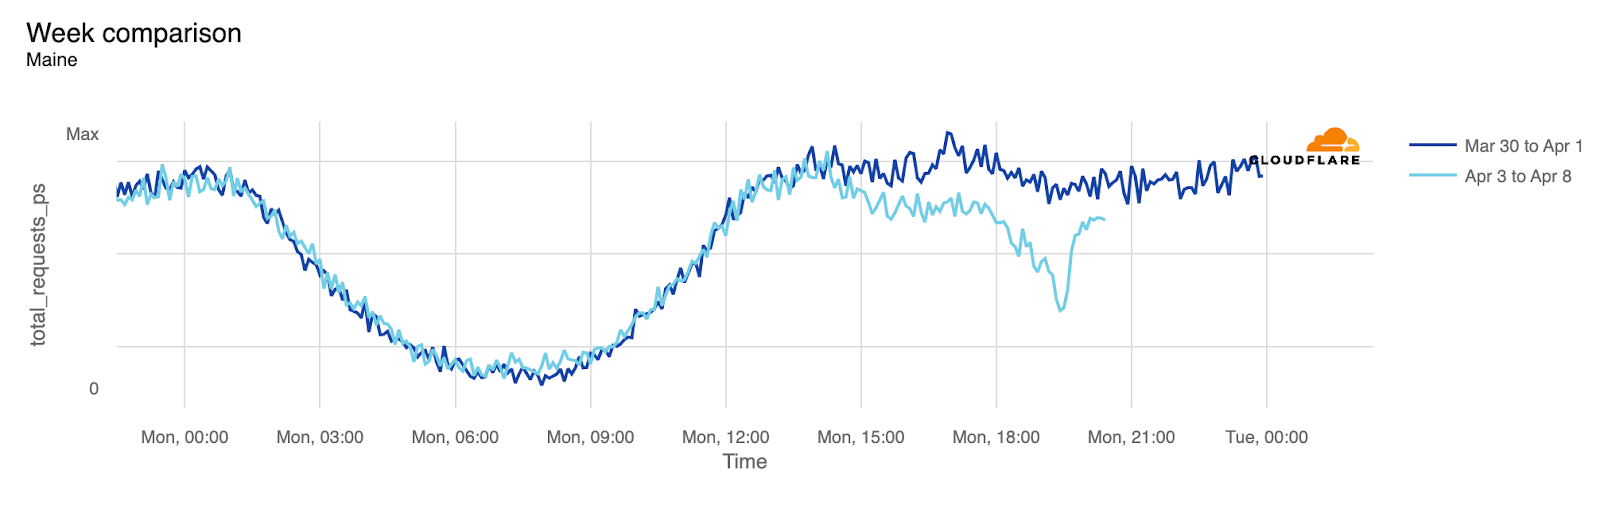
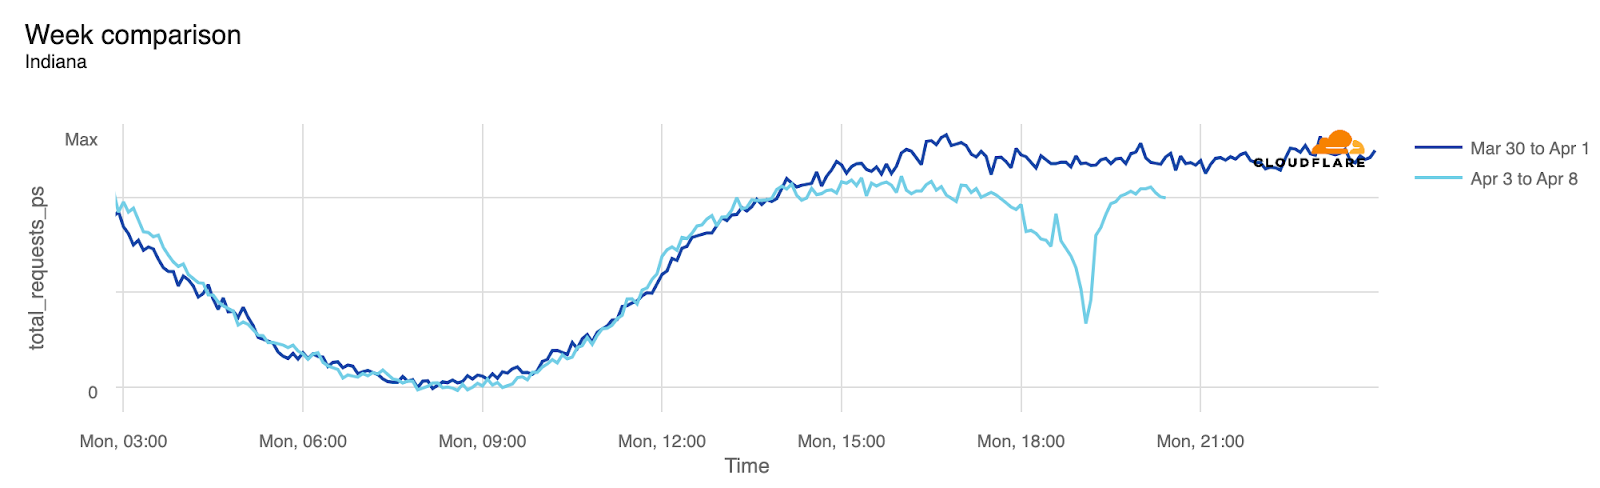
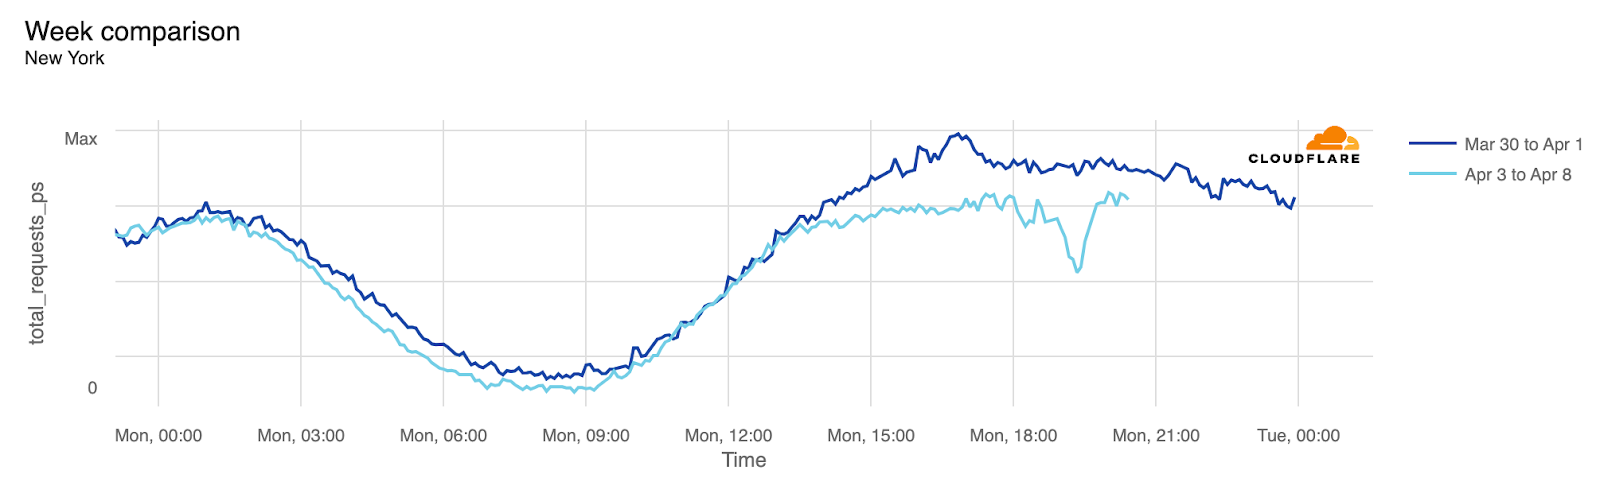
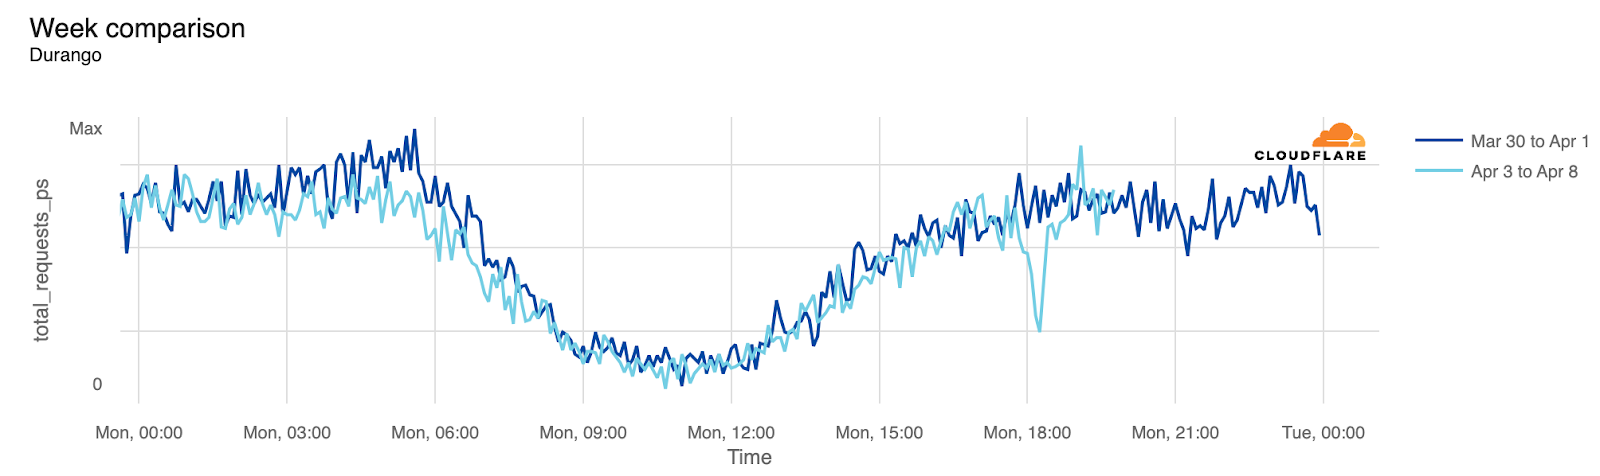
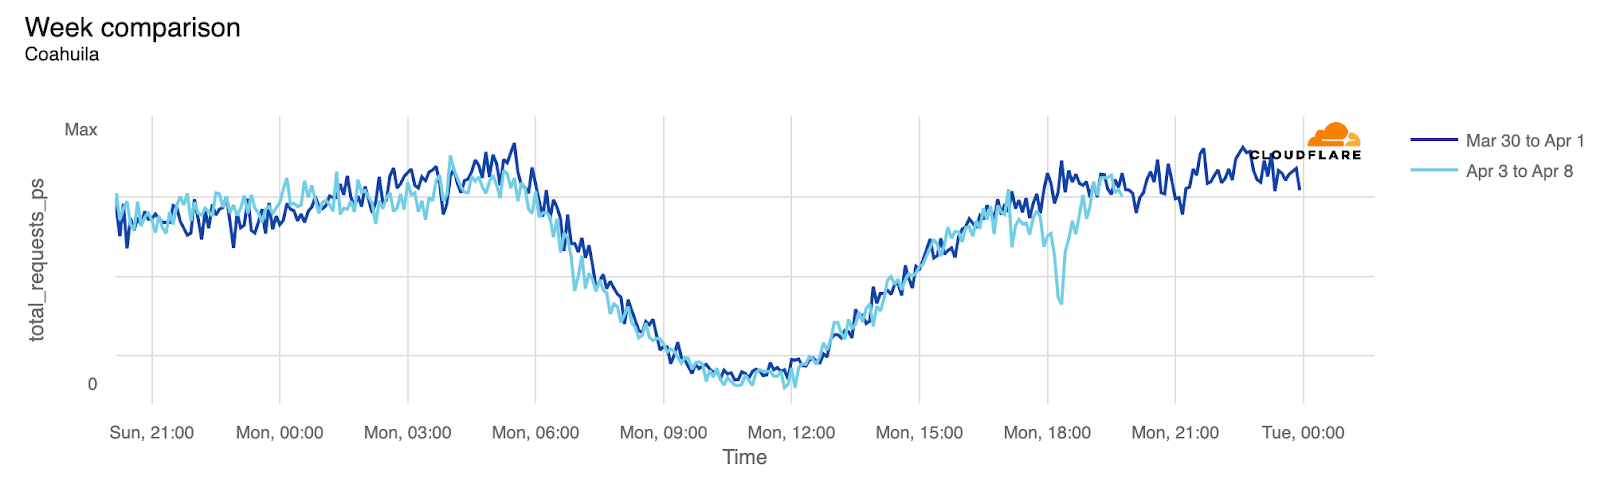


 Utkarsh Mittal is a Senior Technical Product Manager for Amazon DataZone at AWS. He is passionate about building innovative products that simplify customers’ end-to-end analytics journeys. Outside of the tech world, Utkarsh loves to play music, with drums being his latest endeavor.
 Praveen Kumar is a Principal Analytics Solution Architect at AWS with expertise in designing, building, and implementing modern data and analytics platforms using cloud-centered services. His areas of interests are serverless technology, modern cloud data warehouses, streaming, and generative AI applications.
 Paul Villena is a Senior Analytics Solutions Architect in AWS with expertise in building modern data and analytics solutions to drive business value. He works with customers to help them harness the power of the cloud. His areas of interests are infrastructure as code, serverless technologies, and coding in Python