Post Syndicated from digiblur DIY original https://www.youtube.com/watch?v=_lJ41VVB_4U
Yearly Archives: 2024
Pirates Stole our Kilogram
Post Syndicated from The History Guy: History Deserves to Be Remembered original https://www.youtube.com/watch?v=NaRRfD9qLuI
How we reduced initialisation time of Product Configuration Management SDK
Post Syndicated from Grab Tech original https://engineering.grab.com/how-we-reduced-grabx-sdk-initialisation-time
Introduction
GrabX serves as Grab’s central platform for product configuration management. GrabX client services read product configurations through an SDK. This SDK reads the configurations in a way that’s eventually consistent, meaning it takes about a minute for any configuration updates to reach the client SDKs.
However, some GrabX SDK clients, particularly those that need to read larger configuration data (~400 MB), reported that the SDK takes an extended amount of time to initialise, approximately four minutes. This blog post details how we analysed and addressed this issue.
SDK Observations
GrabX clients have observed that the GrabX SDK requires several minutes to initialise. This results in what is known as ‘cold starts’, where the SDK takes an extended time to begin supporting the reading of configurations at startup. This challenge highlights the importance of efficient SDK start-up management, especially when a service handling a high volume of incoming traffic initiates new SDK instances to manage the load better. However, due to the extended SDK initialisation time, these instances continue to experience stress, potentially leading to service throttling.
SDK Initialisation Workflow
The SDK initialisation flow described below is based on the improvements we proposed to the SDK design in our previous post. In that post, we suggested enhancing the SDK design by:
A. Implementing service-based data partitioning and storage in the AWS S3 bucket
B. Allowing service-based subscription of data for the SDK
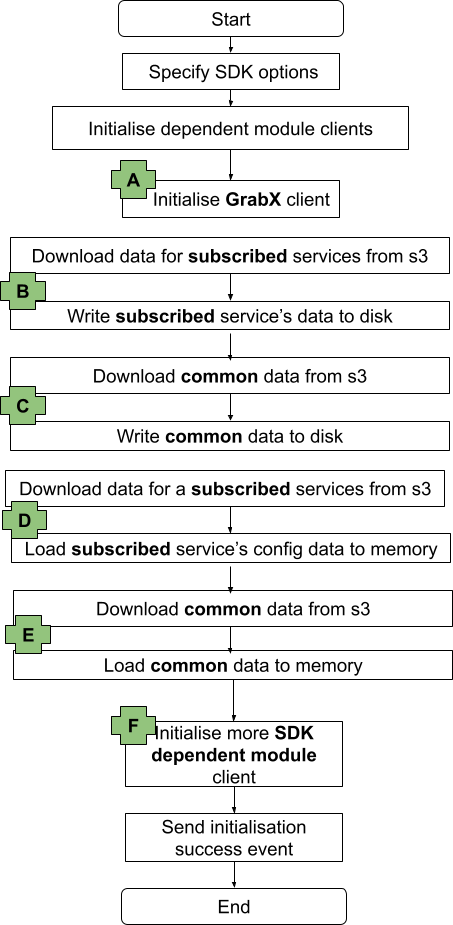
The following diagram provides a high-level overview of the initialisation process of the GrabX SDK, which can be divided into the following sequential steps:
- Set options that drive the behaviour of the SDK.
- Initialise dependent module clients.
- Initialise the GrabX client. (Highlighted as A in the diagram below)
- Download data for the SDK’s subscribed list of services from the AWS S3 bucket and store this data on the SDK instance disk. (Highlighted as B in the diagram below)
- Download common data needed by the SDK from the AWS S3 bucket and store this data on the SDK instance disk. This data is referred to as ‘common’ because it is required by all different client services. (Highlighted as C in the diagram below)
- Download data for the SDK’s subscribed list of services from the AWS S3 bucket and load this data into the SDK instance memory. (Highlighted as D in the diagram below)
- Download common data needed by the SDK from the AWS S3 bucket and load this data into the SDK instance memory. (Highlighted as E in the diagram below)
- Initialise dependent modules for resolving the configuration value. (Highlighted as F in the diagram below)
Proposed Solution
In order to address the issue of extended SDK initialisation time, we have decided to enhance the SDK initialisation design in multiple phases. Each phase focused on improving a specific part of the workflow.
Improvement Phase 1
As discussed in the previous section, the GrabX SDK needs to load two separate sets of data: the subscribed services data and the common data. These two data sets are currently downloaded from the AWS S3 bucket and sequentially loaded into disk and memory.
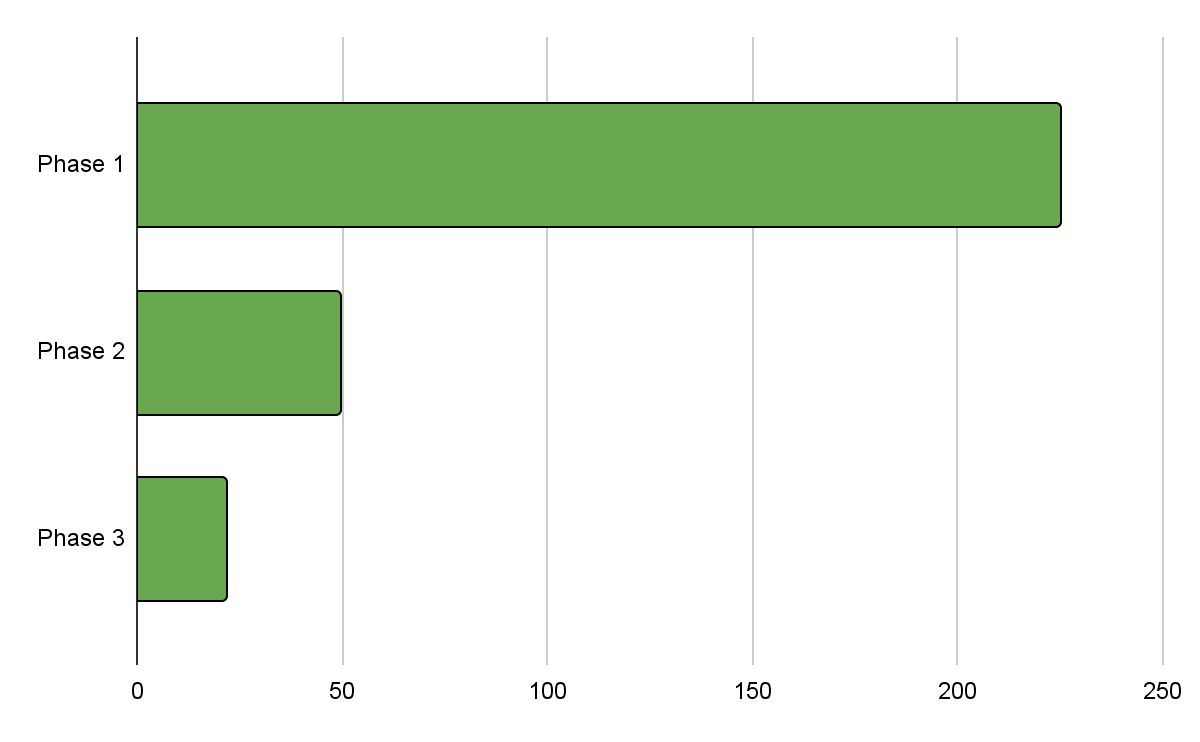
In the first phase of our improvement plan, we decided to change the sequential data load to a concurrent data load for these two data sets, as illustrated in the following diagram. This alteration in the SDK initialisation workflow reduced the initialisation time by approximately 80%.

Improvement Phase 2
Building on the progress made in Phase 1, we next turned our attention to the issue of large configuration file sizes. As mentioned in the introduction, the extended SDK initialisation time was particularly noticeable for client services that needed to load larger amounts of data.
In this phase, we decided to implement an SDK design change that allows the SDK to concurrently download data from the AWS S3 bucket and load it into memory for all these large configurations within a subscribed service, as illustrated in the following diagram. This modification to the SDK initialisation workflow further reduced the initialisation time by approximately 6%.

Improvement Phase 3
Upon examining the SDK’s behaviour, we observed that the SDK is both persisting configuration data downloaded from the AWS S3 bucket to disk and loading the data into memory. We understand that the data is loaded into memory to reduce the latency of configuration reads. The data is stored on disk to support a fallback mechanism, which is activated in a very specific use case: when the client SDK instance restarts and there is a connectivity issue with AWS S3 for downloading configuration files. In this scenario, the SDK will read the configuration data stored on disk. However, this data could be outdated as it is not freshly downloaded from the AWS S3 bucket, and most client services require the most recent data.
Therefore, we realised that the fallback mechanism, for which data is persisted on disk, actually conflicts with the desired SDK behaviour for most client services. As a result, we decided to eliminate the SDK initialisation step that downloads configuration data from AWS S3 and persists it on disk. If the SDK initialisation fails to connect to the AWS S3 bucket and download data, client services can then take the necessary action, such as retrying initialisation. This modification further reduced the initialisation time by approximately 50% compared to the improvement achieved in Phase 2.

Conclusion
We benchmarked the proposed solution with a variety of services, each having different configuration data sizes. Our findings suggest that the proposed solution has the potential to reduce initialisation time by up to 90%.
The following chart illustrates the phase-wise reduction in initialisation time achieved through the improvements made to the GrabX SDK.
Join us
Grab is the leading superapp platform in Southeast Asia, providing everyday services that matter to consumers. More than just a ride-hailing and food delivery app, Grab offers a wide range of on-demand services in the region, including mobility, food, package and grocery delivery services, mobile payments, and financial services across 700 cities in eight countries.
Powered by technology and driven by heart, our mission is to drive Southeast Asia forward by creating economic empowerment for everyone. If this mission speaks to you, join our team today!
D Combinatorics
Post Syndicated from xkcd.com original https://xkcd.com/3015/

Node.js 22 runtime now available in AWS Lambda
Post Syndicated from Julian Wood original https://aws.amazon.com/blogs/compute/node-js-22-runtime-now-available-in-aws-lambda/
This post is written by Julian Wood, Principal Developer Advocate, and Andrea Amorosi, Senior SA Engineer.
You can now develop AWS Lambda functions using the Node.js 22 runtime, which is in active LTS status and ready for production use. Node.js 22 includes a number of additions to the language, including require()ing ES modules, as well as changes to the runtime implementation and the standard library. With this release, Node.js developers can take advantage of these new features and enhancements when creating serverless applications on Lambda.
You can develop Node.js 22 Lambda functions using the AWS Management Console, AWS Command Line Interface (AWS CLI), AWS SDK for JavaScript, AWS Serverless Application Model (AWS SAM), AWS Cloud Development Kit (AWS CDK), and other infrastructure as code tools.
To use this new version, specify a runtime parameter value of nodejs22.x when creating or updating functions or by using the appropriate container base image.
You can use Node.js 22 with Powertools for AWS Lambda (TypeScript), a developer toolkit to implement serverless best practices and increase developer velocity. Powertools for AWS Lambda includes libraries to support common tasks such as observability, AWS Systems Manager Parameter Store integration, idempotency, batch processing, and more. You can also use Node.js 22 with Lambda@Edge to customize low-latency content delivered through Amazon CloudFront.
This blog post highlights important changes to the Node.js runtime, notable Node.js language updates, and how you can use the new Node.js 22 runtime in your serverless applications.
Node.js 22 language updates
Node.js 22 introduces several language updates and features that enhance developer productivity and improve application performance.
This release adds support for loading ECMAScript modules (ESM) using require(). You can enable this feature using the --experimental-require-module flag by configuring the NODE_OPTIONS environment variable. require() support for synchronous ESM graphs bridges the gap between CommonJS and ESM, providing more flexibility in module loading. It is important to note that this feature is currently experimental and may change in future releases.
WebSocket support which was previously available behind the --experimental-websocket flag is now enabled by default in Node.js 22. This brings a browser-compatible WebSocket client implementation to Node.js with no need for external dependencies. Native support simplifies building real-time applications and enhances the overall WebSocket experience in Node.js environments.
The new runtime also includes performance improvements to AbortSignal creation. This makes network operations faster and more efficient for the Fetch API and test runner. The Fetch API is also now considered stable in Node.js 22.
For TypeScript users, Node.js 22 introduces experimental support for transforming TypeScript-only syntax into JavaScript code. By using the --experimental-transform-types flag, you can enable this feature to support TypeScript syntax such as Enum and namespace directly. While you can enable the feature in Lambda, your function entrypoint (i.e. index.mjs or app.cjs) cannot currently be written using TypeScript as the runtime expects a file with a JavaScript extension. You can use TypeScript for any other module imported within your codebase.
For a detailed overview of Node.js 22 language features, see the Node.js 22 release blog post and the Node.js 22 changelog.
Experimental features that are unavailable
Node.js 22 includes an experimental feature to detect the module syntax automatically (CommonJS or ES Modules). This feature must be enabled when the Node.js runtime is compiled. Since the Lambda-provided Node.js 22 runtime is intended for production workloads, this experimental feature is not enabled in the Lambda build and cannot be enabled via an execution-time flag. To use this feature in Lambda, you need to deploy your own Node.js runtime using a custom runtime or container image with experimental module syntax detection enabled.
Performance considerations
At launch, new Lambda runtimes receive less usage than existing established runtimes. This can result in longer cold start times due to reduced cache residency within internal Lambda sub-systems. Cold start times typically improve in the weeks following launch as usage increases. As a result, AWS recommends not drawing conclusions from side-by-side performance comparisons with other Lambda runtimes until the performance has stabilized. Since performance is highly dependent on workload, customers with performance-sensitive workloads should conduct their own testing, instead of relying on generic test benchmarks.
Builders should continue to measure and test function performance and optimize function code and configuration for any impact. To learn more about how to optimize Node.js performance in Lambda, see Performance optimization in the Lambda Operator Guide, and our blog post Optimizing Node.js dependencies in AWS Lambda.
Migration from earlier Node.js runtimes
AWS SDK for JavaScript
Up until Node.js 16, Lambda’s Node.js runtimes included the AWS SDK for JavaScript version 2. This has since been superseded by the AWS SDK for JavaScript version 3, which was released in December 2022. Starting with Node.js 18, and continuing with Node.js 22, the Lambda Node.js runtimes include version 3. When upgrading from Node.js 16 or earlier runtimes and using the included version 2, you must upgrade your code to use the v3 SDK.
For optimal performance, and to have full control over your code dependencies, we recommend bundling and minifying the AWS SDK in your deployment package, rather than using the SDK included in the runtime. For more information, see Optimizing Node.js dependencies in AWS Lambda.
Amazon Linux 2023
The Node.js 22 runtime is based on the provided.al2023 runtime, which is based on the Amazon Linux 2023 minimal container image. The Amazon Linux 2023 minimal image uses microdnf as a package manager, symlinked as dnf. This replaces the yum package manager used in Node.js 18 and earlier AL2-based images. If you deploy your Lambda function as a container image, you must update your Dockerfile to use dnf instead of yum when upgrading to the Node.js 22 base image from Node.js 18 or earlier.
Additionally AL2 includes curl and gnupg2 as their minimal versions curl-minimal and gnupg2-minimal.
Learn more about the provided.al2023 runtime in the blog post Introducing the Amazon Linux 2023 runtime for AWS Lambda and the Amazon Linux 2023 launch blog post.
Using the Node.js 22 runtime in AWS Lambda
AWS Management Console
To use the Node.js 22 runtime to develop your Lambda functions, specify a runtime parameter value Node.js 22.x when creating or updating a function. The Node.js 22 runtime version is now available in the Runtime dropdown on the Create function page in the AWS Lambda console:

Creating Node.js function in AWS Management Console
To update an existing Lambda function to Node.js 22, navigate to the function in the Lambda console, then choose Node.js 22.x in the Runtime settings panel. The new version of Node.js is available in the Runtime dropdown:

Changing a function to Node.js 22
AWS Lambda container image
Change the Node.js base image version by modifying the FROM statement in your Dockerfile.
FROM public.ecr.aws/lambda/nodejs:22
# Copy function code
COPY lambda_handler.xx ${LAMBDA_TASK_ROOT}
AWS Serverless Application Model (AWS SAM)
In AWS SAM, set the Runtime attribute to node22.x to use this version:
AWSTemplateFormatVersion: "2210-09-09"
Transform: AWS::Serverless-2216-10-31

Resources:
  MyFunction:
    Type: AWS::Serverless::Function
    Properties:
      Handler: lambda_function.lambda_handler
      Runtime: nodejs22.x
      CodeUri: my_function/.
      Description: My Node.js Lambda Function
When you add function code directly in an AWS SAM or AWS CloudFormation template as an inline function, it is seen as common.js.
AWS SAM supports generating this template with Node.js 22 for new serverless applications using the sam init command. Refer to the AWS SAM documentation.
AWS Cloud Development Kit (AWS CDK)
In AWS CDK, set the runtime attribute to Runtime.NODEJS_22_X to use this version.
import * as cdk from "aws-cdk-lib";
import * as lambda from "aws-cdk-lib/aws-lambda";
import * as path from "path";
import { Construct } from "constructs";

export class CdkStack extends cdk.Stack {
  constructor(scope: Construct, id: string, props?: cdk.StackProps) {
    super(scope, id, props);

    // The code that defines your stack goes here

    // The Node.js 22 enabled Lambda Function
    const lambdaFunction = new lambda.Function(this, "node22LambdaFunction", {
      runtime: lambda.Runtime.NODEJS_22_X,
      code: lambda.Code.fromAsset(path.join(__dirname, "/../lambda")),
      handler: "index.handler",
    });
  }
}
Conclusion
Lambda now supports Node.js 22 as a managed language runtime. This release uses the Amazon Linux 2023 OS as well as other improvements detailed in this blog post.
You can build and deploy functions using Node.js 22 using the AWS Management Console, AWS CLI, AWS SDK, AWS SAM, AWS CDK, or your choice of infrastructure as code tool. You can also use the Node.js 22 container base image if you prefer to build and deploy your functions using container images.
The Node.js 22 runtime helps developers build more efficient, powerful, and scalable serverless applications. Read about the Node.js programming model in the Lambda documentation to learn more about writing functions in Node.js 22. Try the Node.js runtime in Lambda today.
For more serverless learning resources, visit Serverless Land.
PHP 8.4.1 released
Post Syndicated from corbet original https://lwn.net/Articles/999004/
Version
8.4.1 of the PHP language has been released. See this page for details on
the new features in this release. “PHP 8.4 is a major update of the PHP
“
language. It contains many new features, such as property hooks,
asymmetric visibility, an updated DOM API, performance improvements, bug
fixes, and general cleanup.
Coast Guard vs U-Boats
Post Syndicated from The History Guy: History Deserves to Be Remembered original https://www.youtube.com/watch?v=o9jilNwrXLw
Introducing new capabilities to AWS CloudTrail Lake to enhance your cloud visibility and investigations
Post Syndicated from Esra Kayabali original https://aws.amazon.com/blogs/aws/introducing-new-capabilities-to-aws-cloudtrail-lake-to-enhance-your-cloud-visibility-and-investigations/
Today, I’m excited to announce new updates to AWS CloudTrail Lake, which is a managed data lake you can use to aggregate, immutably store, and query events recorded by AWS CloudTrail for auditing, security investigation, and operational troubleshooting.
The new updates in CloudTrail Lake are:
- Enhanced filtering options for CloudTrail events
- Cross-account sharing of event data stores
- General availability of the generative AI–powered natural language query generation
- AI-powered query results summarization capability in preview
- Comprehensive dashboard capabilities, including a high-level overview dashboard with AI-powered insights (AI-powered insights is in preview), a suite of 14 pre-built dashboards for various use cases, and the ability to create custom dashboards with scheduled refreshes
Let’s look into the new features one by one.
Enhanced filtering options for CloudTrail events ingested into event data stores
Enhanced event filtering capabilities give you greater control over which CloudTrail events are ingested into your event data stores. These enhanced filtering options provide tighter control over your AWS activity data, improving the efficiency and precision of security, compliance, and operational investigations. Additionally, the new filtering options help you reduce your analysis workflow costs by ingesting only the most relevant event data into your CloudTrail Lake event data stores.
You can filter both management and data events based on attributes such as eventSource, eventType, eventName, userIdentity.arn, and sessionCredentialFromConsole.
I go to the AWS CloudTrail console and choose Event data stores under Lake in the navigation pane. I choose Create event data store. In the first step, I enter a name in the Event data store name field. For this demo, I leave other fields as default. You can choose the pricing and retention options that suit your needs. In the next step, I choose Managements events and Data events under CloudTrail events. You can include all the options you need under CloudTrail events. You also have the option to choose ingestion options. I choose Ingest events to start ingesting when it’s created. There may be scenarios, when you want to deselect the Ingest events option to stop an event data store from ingesting events. For example, you may be copying trail events to the event data store and do not want the event data store to collect any future events. You can also choose to enable ingestion for all accounts in your organization or include only the current region in your event data store.

The following example shows an out of the box template for filtering, which excludes any management events that are initiated by an AWS Service. I choose Advanced event collection under the Management events. I choose Exclude AWS service-initiated events from the Log selector template dropdown. You can also expand the JSON view to see how the filters actually apply.

Under the Data events, the following example creates a filter to include DynamoDB data events initiated by a certain user, helping me to log events based on an IAM principal. I choose DynamoDB as Resource type. I choose Custom as Log selector template. Under the Advanced event selector, I choose userIdentity.arn as Field and equals as Operator. I enter the user’s ARN as Value. I choose Next and choose Create event data store in the final step.

Now, I have my event data store that gives me granular control over the ingested CloudTrail data.
This expanded set of filtering options helps you to be more selective in capturing only the most relevant events for your security, compliance, and operational needs.
Cross-account sharing of event data stores
You can use the cross-account sharing feature of event data stores to enhance collaborative analysis within organizations. It enables secure sharing of event data stores with selected AWS principals through Resource-Based Policies (RBP). This functionality allows authorized entities to query shared event data stores within the same AWS Region where they were created.
To use this feature, I go to the AWS CloudTrail console and choose Event data stores under Lake in the navigation pane. I choose an event data store from the list and navigate to its details page. I choose Edit in the Resource policy section. The following example policy includes a statement that allows root users in accounts 111111111111, 222222222222, and 333333333333 to run queries and get query results on the event data store owned by account ID 999999999999. I choose Save changes to save the policy.

Generative AI–powered natural language query generation in CloudTrail Lake is now generally available
In June, we announced this feature for CloudTrail Lake in preview. With this launch, you can generate SQL queries using natural language questions to easily explore and analyze AWS activity logs (only management, data, and network activity events) without needing technical SQL expertise. The feature uses generative AI to convert natural language questions into ready-to-use SQL queries you can run directly in the CloudTrail Lake console. This simplifies the process of exploring event data stores and retrieving insights such as error counts, top services used, and the causes of errors. This feature is also accessible through the AWS Command Line Interface (AWS CLI), providing additional flexibility for users who prefer command-line operations. The preview blog post provides step-by-step instructions on how to get started with the natural language query generation feature in CloudTrail Lake.
CloudTrail Lake generative AI–powered query results summarization capability in preview
Building on the capability of natural language query generation, we’re introducing a new AI-powered query results summarization feature in preview to further simplify the process of analyzing AWS account activity. With this feature, you can easily extract valuable insights from your AWS activity logs (only management, data, and network activity events) by automatically summarizing the key points from your query results in natural language, reducing the time and effort required to understand the information.
To try this feature, I go to the AWS CloudTrail console and choose Query under Lake in the navigation pane. I choose an event data store for my CloudTrail Lake query from the dropdown list in Event data store. You can use summarization regardless of whether the query was written manually or generated by generative AI. For this example, I will use the natural language query generation capability. In the Query generator, I enter the following prompt in the Prompt field using natural language:
How many errors were logged during the past month for each service and what was the cause of each error?
Then, I choose Generate query. The following SQL query is automatically generated:
SELECT eventsource,
    errorcode,
    errormessage,
    count(*) as errorcount
FROM a0******
WHERE eventtime >= '2024-10-14 00:00:00'
    AND eventtime <= '2024-11-14 23:59:59'
    AND (
        errorcode IS NOT NULL
        OR errormessage IS NOT NULL
    )
GROUP BY 1,
    2,
    3
ORDER BY 4 DESC;
I choose Run to get the results. To use the summarization capability, I choose Summarize results in the Query results tab. CloudTrail automatically analyzes the query results and provides a natural language summary of the key insights. It’s important to note that there’s a monthly quota of 3 MB for query results that can be summarized.

This new summarization capability can save you time and effort in understanding your AWS activity data by automatically generating meaningful summaries of the key findings.
Comprehensive dashboard capabilities
Lastly, let me tell you about the new dashboard capabilities of CloudTrail Lake to enhance visibility and analysis across your AWS environments.
The first one is a Highlights dashboard that provides you with an easy-to-view summary of the data captured in your CloudTrail Lake management and data events stored in event data stores. This dashboard makes it easier to quickly identify and understand important insights, such as the top failed API calls, trends in failed login attempts, and spikes in resource creation. It surfaces any anomalies or unusual trends in the data.
I go to the AWS CloudTrail console and choose Dashboard under Lake in the navigation pane to check out the Highlights dashboard. First, I enable Highlights dashboard by choosing Agree and enable Highlights.

I check out the Highlights dashboard once it populates with data.

The second addition to the new dashboard capabilities is a suite of 14 pre-built dashboards. These dashboards are designed for different personas and use cases. For example, the security-focused dashboards help you to track and analyze key security indicators, such as top access denied events, failed console login attempts, and users who have disabled multi-factor authentication (MFA). There are also pre-built dashboards for operational monitoring, highlighting trends in errors and availability issues, such as top APIs with throttling errors and top users with errors. You can also use the dashboards focused on specific AWS services such as Amazon EC2 and Amazon DynamoDB, which help you identify security risks or operational problems within those particular service environments.
You can create your own dashboards and optionally set schedules for refreshing them. This level of customization helps you tailor the CloudTrail Lake analysis capabilities to your precise monitoring and investigative needs across your AWS environments.
I switch to the Managed and custom dashboards to observe the custom and pre-built dashboards.

I choose IAM activity dashboard pre-built dashboard to observe overall IAM activity. You can choose Save as new dashboard to customize this dashboard.

To create a custom dashboard from scratch, I go to Dashboard under Lake in the navigation pane and choose Build my own dashboard. I enter a name in the Enter a name for the dashboard field and choose event data stores under Permissions, to visualize the events. Next, I choose Create dashboard.

Now, I can add widgets to my dashboard. You have the flexibility to customize your dashboards in multiple ways. You can select from a list of pre-built sample widgets using Add sample widget, or you can create your own custom widgets using Create new widget. For each widget, you can choose the type of visualization you prefer, such as a line graph, bar graph, or other options to best represent your data.

Now available
The new features in AWS CloudTrail Lake represent a major advancement in providing a comprehensive audit logging and analysis solution. These enhancements provide the ability to gain more profound understanding and conduct investigations more rapidly, assisting with more preventative monitoring and faster incident handling across your entire AWS environments.
You can now start using generative AI–powered natural language query generation in CloudTrail Lake in US East (N. Virginia), US West (Oregon), Asia Pacific (Mumbai), Asia Pacific (Sydney), Asia Pacific (Tokyo), Canada (Central), and Europe (London) AWS Regions.
CloudTrail Lake generative AI–powered query results summarization capability is available in preview in US East (N. Virginia), US West (Oregon), and Asia Pacific (Tokyo) Regions.
Enhanced filtering options, cross-account sharing of event data stores and dashboards are available in all the Regions where CloudTrail Lake is available, with the exception of generative AI–powered summarization feature on the Highlights dashboard being available only in US East (N. Virginia), US West (Oregon), and Asia Pacific (Tokyo) Regions.
Running queries will incur CloudTrail Lake query charges. For more details on pricing, visit AWS CloudTrail pricing.
AWS Glue Data Catalog supports automatic optimization of Apache Iceberg tables through your Amazon VPC
Post Syndicated from Noritaka Sekiyama original https://aws.amazon.com/blogs/big-data/aws-glue-data-catalog-supports-automatic-optimization-of-apache-iceberg-tables-through-your-amazon-vpc/
The AWS Glue Data Catalog supports automatic table optimization of Apache Iceberg tables, including compaction, snapshots, and orphan data management. The data compaction optimizer constantly monitors table partitions and kicks off the compaction process when the threshold is exceeded for the number of files and file sizes.
The Iceberg table compaction process starts and will continue if the table or any of the partitions within the table has more than the configured number of files (default five files), each smaller than 75% of the target file size. The snapshot retention process runs periodically (default daily) to identify and remove snapshots that are older than the specified retention configuration from the table properties, while keeping the most recent snapshots up to the configured limit. Similarly, the orphan file deletion process scans the table metadata and the actual data files, identifies the unreferenced files, and deletes them to reclaim storage space. These storage optimizations can help you reduce metadata overhead, control storage costs, and improve query performance.
Although automatic table optimization has simplified day-to-day Iceberg table maintenance tasks, certain industries and customers have advanced requirements to access their Iceberg tables from specific virtual private clouds (VPCs). This access control is needed for not only data ingestion and querying, but also for table maintenance.
To help achieve such requirements, we provide the capability where the Data Catalog optimizes Iceberg tables to run in your specific VPC. This post demonstrates how it works with step-by-step instructions.
How the table optimizer works with AWS Glue network connection
By default, a table optimizer is not associated with any of your VPCs and subnets. With this new capability of supporting data access from VPCs, you can associate a table optimizer with an AWS Glue network connection to run in a specific VPC, subnet, and security group. An AWS Glue network connection is commonly used to run an AWS Glue job with a specific VPC, subnet, and security group. The following diagram illustrates how it works.

In the next sections, we demonstrate how to configure a table optimizer with an AWS Glue network connection.
Prerequisites
To run through this instruction, you must have the following prerequisites:
- An AWS account.
- AWS Identity and Access Management (IAM) permissions to create and deploy an AWS CloudFormation stack.
Set up resources with AWS CloudFormation
This post includes a sample AWS CloudFormation template that enables a quick setup of the solution resources. You can review and customize the template to suit your needs.
The CloudFormation template generates the following resources:
- An Amazon Simple Storage Service (Amazon S3) bucket to store the dataset, AWS Glue job scripts, and so on. (See Appendix 1 at the end of this post for manual instructions.)
- A Data Catalog database.
- An AWS Glue job that creates and modifies sample customer data in your S3 bucket with a trigger every 10 minutes.
- AWS IAM roles and policies.
- A VPC, public subnet, two private subnets, internet gateway, and route tables.
- Amazon Virtual Private Cloud (Amazon VPC) endpoints for AWS Glue, AWS Lake Formation, Amazon CloudWatch, Amazon S3, and AWS Security Token Service (AWS STS). The endpoint names are as follows:
- AWS Glue –
com.amazonaws.<region>.glue(for example,com.amazonaws.us-east-1.glue). - Lake Formation –
com.amazonaws.<region>.lakeformation(only if tables are registered with Lake Formation). - CloudWatch –
com.amazonaws.<region>.monitoring. - Amazon S3 –
com.amazonaws.<region>.s3. - AWS STS –
com.amazonaws.<region>.sts.
- AWS Glue –
- An AWS Glue network connection configured with the VPC and subnet. (See Appendix 2 at the end of this post for manual instructions.)
To launch the CloudFormation stack, complete the following steps:
- Sign in to the AWS CloudFormation console.
- Choose Launch Stack.

- Choose Next.
- For SubnetAz1, choose your preferred Availability Zone.
- For SubnetAz2, choose your preferred Availability Zone. This needs to be different from
SubnetAz1. - Leave the other parameters as default or make appropriate changes based on your requirements, then choose Next.
- Review the details on the final page and select I acknowledge that AWS CloudFormation might create IAM resources.
- Choose Create.
This stack can take around 5–10 minutes to complete, after which you can view the deployed stack on the AWS CloudFormation console.
Configure automatic table optimization with an AWS Glue network connection
Complete following steps to configure automatic table optimization with an AWS Glue network connection:
- On the AWS Glue console, choose Databases in the navigation pane.
- Choose
iceberg_optimizer_vpc_db. - Under Tables, choose
customer. - On the Table optimization – new tab, choose Enable optimization.

- For Optimization configuration, choose Customize settings.
- For IAM role, choose the
iceberg-optimizer-vpc-MyGlueTableOptimizerRole-xxxrole created by the CloudFormation stack. - For Virtual private cloud (VPC) – optional, choose
myvpc_private_network_connection.

- Select I acknowledge that expired data will be deleted as part of the optimizers and choose Enable optimization.
Now the table optimizer has been configured with your VPC. After a while, you can see how the optimizer worked.
- Under Table optimization – new, choose View optimization history on the Actions menu.
You can confirm that the table optimizer worked successfully for this Iceberg table.

You have now seen how to set up the table optimizer with an AWS Glue network connection to run it through a specific VPC.
Clean up
When you have finished all the preceding steps, remember to clean up all the AWS resources you created using AWS CloudFormation:
- Delete the S3 bucket storing the Iceberg table and the AWS Glue job script.
- Delete the CloudFormation stack.
Conclusion
This post demonstrated how the Data Catalog supports automatic optimization of Iceberg tables through your VPC. With this enhancement, you can simplify table maintenance for your Iceberg tables under advanced security requirements. This feature is available today in all AWS Glue supported AWS Regions.
Try out this solution for your own use case, and share your feedback and questions in the comments.
About the Authors
 Noritaka Sekiyama is a Principal Big Data Architect on the AWS Glue team. He is responsible for building software artifacts to help customers. In his spare time, he enjoys cycling with his new road bike.
 Paul Villena is an Analytics Solutions Architect in AWS with expertise in building modern data and analytics solutions to drive business value. He works with customers to help them harness the power of the cloud. His areas of interest are infrastructure as code, serverless technologies, and coding in Python.
 Justin Lin is a software engineer on the AWS Lake Formation team. He works on delivering managed optimization solutions for open table formats to enhance customer data management and query performance. In his spare time, he enjoys playing tennis.
 Himani Desai is a Software Engineer on the AWS Lake Formation team. She works on providing managed optimization solutions for Iceberg tables.
 Abishek Shankar is a software engineer on the AWS Lake Formation team, working on providing managed optimization solutions for Iceberg tables.
 Shyam Rathi is a Software Development Manager on the AWS Lake Formation team, working on delivering new features and enhancements related to modern data lakes.
 Sandeep Adwankar is a Senior Product Manager at AWS. Based in the California Bay Area, he works with customers around the globe to translate business and technical requirements into products that enable customers to improve how they manage, secure, and access data.
Appendix 1: Configure your S3 bucket to allow access only from a specific VPC
The instructions provided in this post help you configure your S3 bucket automatically through the CloudFormation template, but you can also manually configure your S3 bucket to allow access only from a specific VPC. This is an optional step to simulate the strict security regulation on your Iceberg table. Complete following steps:
- On the Amazon S3 console, choose Buckets in the navigation pane.
- Choose your S3 bucket.
- Choose Permissions.
- Under Bucket policy, choose Edit.
- Enter following bucket policy:
- Choose Save changes.
Now this S3 bucket prevents any data operations not from the VPC. You can try uploading files to the bucket through Amazon S3 console to see that this operation fails as expected.
Appendix 2: Create an AWS Glue network connection
You can also can manually configure the AWS Glue network connection with the following steps:
- On the AWS Glue console, choose Data connections in the navigation pane.
- Under Connections, choose Create connection.
- Select Network, and choose Next.
- For VPC, choose your VPC created by the CloudFormation stack. The VPC ID is shown on the Outputs tab of the CloudFormation stack.
- For Subnet, choose your private subnet created by the CloudFormation stack. The subnet ID is shown on the Outputs tab of the CloudFormation stack.
- For Security groups, choose your security group created by the CloudFormation stack. The security group ID is shown on the Outputs tab of the CloudFormation stack.
- Choose Next.
- For Name, enter
myvpc_private_network_connection. - Choose Next.
- Review the configurations and choose Create connection.
Track performance of serverless applications built using AWS Lambda with Application Signals
Post Syndicated from Veliswa Boya original https://aws.amazon.com/blogs/aws/track-performance-of-serverless-applications-built-using-aws-lambda-with-application-signals/
In November 2023, we announced Amazon CloudWatch Application Signals, an AWS built-in application performance monitoring (APM) solution, to solve the complexity associated with monitoring performance of distributed systems for applications hosted on Amazon EKS, Amazon ECS, and Amazon EC2. Application Signals automatically correlates telemetry across metrics, traces, and logs, to speed up troubleshooting and reduce application disruption. By providing an integrated experience for analyzing performance in the context of your applications, Application Signals gives you improved productivity focusing on the applications that support your most critical business functions.
Today we’re announcing the availability of Application Signals for AWS Lambda to eliminate the complexities of manual setup and performance issues required to assess application health for Lambda functions. With CloudWatch Application Signals for Lambda, you can now collect application golden metrics (the incoming and outgoing volume of requests, latency, faults, and errors).
AWS Lambda abstracts away the complexity of the underlying infrastructure, enabling you to focus on building your application without having to monitor server health. This allows you to shift your focus toward monitoring the performance and health of your applications, which is necessary to operate your applications at peak performance and availability. This requires deep visibility into performance insights such as volume of transactions, latency spikes, availability drops, and errors for your critical business operations and application programming interfaces (APIs).
Previously, you had to spend significant time correlating disjointed logs, metrics, and traces across multiple tools to establish the root cause of anomalies, increasing mean time to recovery (MTTR) and operational costs. Additionally, building your own APM solutions with custom code or manual instrumentation using open source (OSS) libraries was time-consuming, complex, operationally expensive, and often resulted in increased cold start times and deployment challenges when managing large fleets of Lambda functions. Now, you can use Application Signals to seamlessly monitor and troubleshoot health and performance issues in serverless applications, without requiring any manual instrumentation or code changes from your application developers.
How it works
Using the pre-built, standardized dashboards of Application Signals, you can identify the root cause of performance anomalies in just a few clicks by drilling down into performance metrics for critical business operations and APIs. This helps you visualize application topology which shows interactions between the function and its dependencies. In addition, you can define Service Level Objectives (SLOs) on your applications to monitor specific operations that matter most to you. An example of an SLO could be to set a goal that a webpage should render within 2000 ms 99.9 percent of the time in a rolling 28-day interval.
Application Signals auto-instruments your Lambda function using enhanced AWS Distro for OpenTelemetry (ADOT) libraries. This delivers better performance such as lower cold start latency,
memory consumption, and function invocation duration, so you can quickly monitor your applications.
I have an existing Lambda function appsignals1 and I will configure Application Signals in the Lambda Console to collect various telemetry on this application.
In the Configuration tab of the function I select Monitoring and operations tools to enable both the Application signals and the Lambda service traces.


I have an application myAppSignalsApp that has this Lambda function attached as a resource. I’ve defined an SLO for my application to monitor specific operations that matter most to me. I’ve defined a goal that states that the application executes within 10 ms 99.9 percent of the time in a rolling 1-day interval.

It can take 5-10 minutes for Application Signals to discover the function after it’s been invoked. As a result you’ll need to refresh the Services page before you can see the service.

Now I’m in the Services page and I can see a list of all my Lambda functions that have been discovered by Application Signals. Any telemetry that is emitted will be displayed here.

I can then visualize the complete application topology from the Service Map and quickly spot anomalies across my service’s individual operations and dependencies, using the newly collected metrics of volume of requests, latency, faults, and errors. To troubleshoot, I can click into any point in time for any application metric graph to discover correlated traces and logs related to that metric, to quickly identify if issues impacting end users are isolated to an individual task or deployment.

Available now
Amazon CloudWatch Application Signals for Lambda is now generally available and you can start using it today in all AWS Regions where Lambda and Application Signals are available. Today, Application Signals is available for Lambda functions that use Python and Node.js managed runtimes. We’ll continue to add support for other Lambda runtimes in near future.
To learn more, visit the AWS Lambda developer guide and Application Signals developer guide. You can submit your questions to AWS re:Post for Amazon CloudWatch, or through your usual AWS Support contacts.
– Veliswa.
Comparing DORA, SOX and PCI DSS: What Businesses Need to Know
Post Syndicated from Editor original https://nebosystems.eu/comparing-sox-dora-pci-dss/
Table of Contents
In today’s interconnected business environment, organizations must navigate an increasingly complex regulatory landscape. Key regulatory requirements such as, the Digital Operational Resilience Act (DORA), the Sarbanes-Oxley Act (SOX) and the Payment Card Industry Data Security Standard (PCI DSS) are essential in ensuring financial transparency, operational resilience and data security. But what sets them apart and where do they overlap? Let’s explore.
What Are SOX, DORA, and PCI DSS?
- SOX: Introduced in 2002, the Sarbanes-Oxley Act ensures accurate financial reporting and corporate accountability. It applies primarily to U.S.-based public companies, emphasizing internal controls and financial disclosures.
- DORA: Enacted by the EU, the Digital Operational Resilience Act focuses on digital operational resilience for financial institutions. It establishes robust guidelines for managing ICT (Information and Communication Technology) risks, ensuring businesses can withstand cyber incidents.
- PCI DSS: A global standard created to secure payment card data, the Payment Card Industry Data Security Standard applies to any organization handling cardholder information. It mandates rigorous security measures to prevent data breaches.
Key Differences
| SOX | DORA | PCI DSS | |
| Scope | U.S. public companies. (Section 302, 404) | EU financial entities. (Article 2) | Global organizations handling card data. (Requirement 1) |
| Primary Concern | Financial reporting accuracy. (Section 404) | Operational resilience and cybersecurity. (Article 5, Article 6) | Payment data security. (Requirement 3, 4) |
| Enforcement | SEC and PCAOB. | EU financial regulators. (Article 46) | Payment brands (Visa, Mastercard). |
| Specificity in IT | Limited to financial systems. (Section 404) | Comprehensive ICT and operational risks. (Article 11, Article 15) | Highly prescriptive for payment environments. (Requirement 12) |
Overlapping Areas Across SOX, DORA, and PCI DSS
While SOX, DORA, and PCI DSS have distinct scopes, they share common objectives in risk management, incident response and compliance auditing:
| SOX | DORA | PCI DSS | |
| Risk Management | Focuses on risks to financial reporting systems. | Emphasizes managing ICT and operational risks. (Article 5, DORA Regulation) | Requires mitigating risks to payment data. (Requirement 12) |
| Incident Response | Requires procedures to disclose financial data breaches. (Section 302) | Mandates reporting and responding to ICT disruptions. (Article 15) | Specifies response plans for payment data breaches. (Requirement 12) |
| Third-Party Oversight | Requires oversight of third parties impacting financial reporting. (Section 404) | Regulates third-party ICT providers for financial entities. (Article 28) | Ensures third-party service providers comply with security standards. (Requirement 12) |
| Auditing and Compliance | Requires annual audits of internal controls. (Section 404) | Implements operational resilience assessments and testing. (Article 7) | Demands regular audits and vulnerability scans for payment systems. (PCI DSS v4.0) |
| Data Integrity | Ensures accuracy of financial records. | Focuses on maintaining operational and ICT system integrity. (Article 6) | Protects cardholder data integrity and confidentiality. (PCI DSS v4.0) |
Common Technical Measures to Consider
Although SOX, DORA, and PCI DSS have distinct objectives, they share several technical measures that businesses can implement to align their compliance efforts. These measures not only enhance security but also streamline adherence to multiple frameworks.
| Technical Measure | SOX | DORA | PCI DSS |
| Access Controls | User restrictions and authentication. | Role-based access and secure authentication (Article 6). | Strict access control requirements (Req. 7, 8). |
| Data Encryption | Encryption for sensitive data. | Encryption for ICT-related data (Article 6). | Encryption of cardholder data (Req. 3, 4). |
| Monitoring and Logging | Log unauthorized access or changes. | Logging for ICT incident monitoring (Article 15). | System and data access logging (Req. 10). |
| Testing and Assessments | Regular testing of IT controls. | Penetration and resilience testing (Article 23). | Penetration testing and scans (Req. 11). |
| Backup and Recovery | Backup systems for financial data. | Backup and disaster recovery plans (Article 11). | Backup solutions for cardholder data (Req. 12). |
| Network Security | Secure networks for data protection. | Network defenses (firewalls, IDS) (Article 6). | Firewalls, secure configurations (Req. 1, 2). |
| Multi-Factor Authentication | Often recommended. | Mandatory for critical ICT systems (Article 6). | Required for sensitive systems (Req. 8). |
Why This Matters to Your Business
For companies operating in regulated industries or handling sensitive data, understanding these frameworks is critical. Compliance not only protects against fines and reputational damage but also fosters trust among customers and stakeholders.
For example:
- If your company is a public entity in the U.S., SOX compliance ensures the accuracy of your financial statements.
- If you’re a financial institution in the EU, DORA equips you to handle cyber risks and operational challenges.
- Handling payment card transactions, PCI DSS safeguards your customers’ data and strengthens your security posture.
The Cost of Non-Compliance
Failing to comply with SOX, DORA, or PCI DSS doesn’t just result in regulatory scrutiny—it can lead to significant financial penalties, legal liabilities and reputational damage. Here’s a breakdown:
SOX (Sarbanes-Oxley Act)
- Corporate officers who willfully certify false financial statements can face fines up to $5 million and/or imprisonment for up to 20 years (Section 906).
- Tampering with records or obstructing investigations can lead to criminal penalties, including imprisonment for up to 20 years (Section 802).
DORA (Digital Operational Resilience Act)
- Financial entities in violation of DORA can be fined up to 2% of annual global turnover for severe breaches of operational resilience requirements, such as inadequate ICT risk management or failing to report major incidents.
- Specific penalties vary by Member State within the EU but are harmonized to ensure consistency and proportionality.
PCI DSS
Non-compliance penalties are typically imposed by payment brands like Visa and Mastercard. These include:
- Fines ranging from $5,000 to $100,000 per month until compliance is achieved.
- Potential revocation of card processing privileges and higher transaction fees.
How to Align with Multiple Regulatory Requirements
Organizations such as a multinational bank operating in the EU or a retailer processing credit card transactions globally, must comply with multiple regulatory requirements. Here’s how to streamline compliance:
- Integrated Risk Management: Build policies that address financial, ICT and data security risks holistically.
- Unified Incident Response Plans: Standardize response procedures for data breaches, cyber disruptions, and financial irregularities. This unified approach minimizes confusion and ensures timely action during incidents.
- Auditing for All: Conduct comprehensive audits that meet SOX, DORA, and PCI DSS requirements.
Through these measures, organizations can reduce complexity, improve resource utilization, and ensure they remain compliant across all frameworks.
Practical Benefits for Your Business
Adopting a unified approach to compliance doesn’t just meet regulatory obligations—it also delivers practical advantages:
- Cost Savings: Streamlining risk management and auditing across frameworks reduces duplicated efforts and optimizes resource allocation.
- Enhanced Security: Implementing shared technical measures like encryption, logging, and access controls improves protection for all critical systems and data.
- Business Continuity: Resilience testing and incident response plans ensure your organization can recover quickly from disruptions, safeguarding operations and customer trust.
By proactively addressing these frameworks, businesses can turn compliance into a strategic advantage, fostering growth and stability in a competitive marketplace.
In Conclusion
Regulatory requirements like SOX, DORA and PCI DSS provide a robust foundation for financial integrity, operational resilience and data security. By understanding their differences and leveraging their overlaps, businesses can create a compliance strategy that not only meets legal obligations but also drives confidence in their operations.
Need help navigating these regulatory requirements? Contact us for tailored solutions to align your business with today’s compliance standards.
References:
Digital Operational Resilience Act (EU) 2022/2554. EUR-Lex.
Payment Card Industry Data Security Standard. Requirements and Testing Procedures, Version 4.0.1, June 2024.
Sarbanes-Oxley Act. Public Law 107–204, Approved July 30, 2002.
Implementing custom domain names for private endpoints with Amazon API Gateway
Post Syndicated from Chris McPeek original https://aws.amazon.com/blogs/compute/implementing-custom-domain-names-for-private-endpoints-with-amazon-api-gateway/
This post is written by Heeki Park, Principal Solutions Architect
Amazon API Gateway is introducing custom domain name support for private REST API endpoints. Customers choose private REST API endpoints when they want endpoints that are only callable from within their Amazon VPC. Custom domain names are simpler and more intuitive URLs that you can use with your applications and were previously only supported with public REST API endpoints. Now you can use custom domain names to map to private REST APIs and share those custom domain names across accounts using AWS Resource Access Manager (AWS RAM).
Overview of API Gateway connectivity
When considering network connectivity with API Gateway, two aspects are important to keep in mind: the integration type and the connectivity type. The following diagram shows examples of those considerations.

Figure 1: Overall architecture
The first aspect is the distinction between frontend integrations and backend integrations. Frontend integrations are how API clients like mobile devices, web browsers, or client applications connect to the API endpoint. Backend integrations are the API services to which your API Gateway endpoint proxies requests, like applications running on Amazon Elastic Compute Cloud (EC2) instances, Amazon Elastic Kubernetes Service (EKS) or Amazon Elastic Container Service (ECS) containers, or as AWS Lambda functions. The second aspect is whether that connectivity is via the public internet or via your private VPC.
Calling private REST API endpoints
In order to send requests to a private REST API endpoint, clients must operate within a VPC that is configured with a VPC endpoint. Once a VPC endpoint is configured, a client has three different options within the VPC for connecting to the API endpoint, depending on how the VPC and the VPC endpoint are configured.
If the VPC endpoint has private DNS enabled, the client can send requests to the standard endpoint URL: https://{api-id}.execute-api.{region}.amazonaws.com/{stage}. These requests resolve to the VPC endpoint, which then get routed to the appropriate API Gateway endpoint.

Figure 2: VPC endpoint configured with private DNS names enabled
Alternatively, if the VPC endpoint has private DNS disabled, the client can send requests to the VPC endpoint URL: https://{vpce-id}.execute-api.{region}.amazonaws.com/{stage}. One of the following headers also needs to be sent along with that request.
Host: {api-id}.execute-api.us-east-1.amazonaws.com
x-apigw-api-id: {api-id}
Finally, if the VPC endpoint has private DNS disabled and the private REST API endpoint is associated with the VPC endpoint, the client can send requests to the following URL: https://{api-id}-{vpce-id}.execute-api.{region}.amazonaws.com/{stage}. To associate a VPC endpoint with a private API, the following property configures that association.
You can see that configuration in the console, as follows.

Figure 3: Optional VPC endpoint configuration with private REST API endpoints
To simplify access to your private REST API endpoints, you can now also configure custom domain names, which functions as a stable vanity URL for your private APIs.
Implementing custom domain names for private endpoints
Before setting up a custom domain name for your private REST API endpoints, a VPC endpoint for API Gateway, an AWS Certificate Manager (ACM) certificate, an Amazon Route 53 private hosted zone, and one or more private REST API endpoints need to be configured.
Once those pre-requisites are set up, a custom domain name can be setup with the following steps:
- In the API provider account, create a custom domain name and base path mapping.
- In the provider account, use AWS RAM to create a resource share for the custom domain name. In the consumer account, accept the resource share request. This step is only required if the provider and consumer are in different AWS accounts.
- In the consumer account, associate the custom domain name to a VPC endpoint.
- In the consumer account, create a Route 53 alias to map the custom domain to the VPC endpoint.
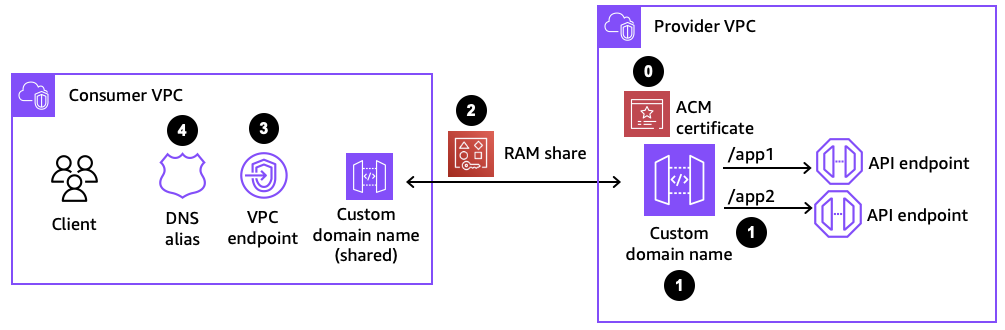
Figure 4: Components for configuring a custom domain name
Step 1: Creating a private custom domain name
When configuring a custom domain name, two policies are used to manage permissions to the private custom domain name resource. Management policies specify which principals are allowed to associate a private custom domain name to a VPC endpoint. Resource-based policies specify which API consumers are allowed to invoke your private custom domain name.
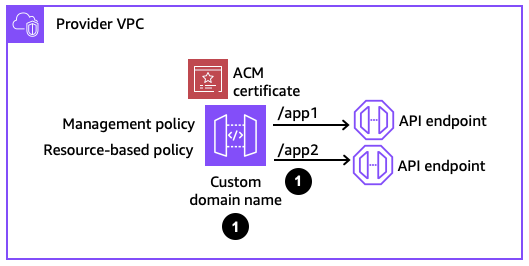
Figure 5: Creating a private custom domain name
This is an example CloudFormation definition for a private custom domain name.
In this example, the management policy specifies that the account 123456789012 is allowed to associate a private custom domain name with a VPC endpoint. The resource-based policy then denies any request that does not come from a particular VPC endpoint and only allows invoke requests that come from that same account 123456789012.
The private custom domain name then needs to be mapped to a private REST API.
In this example, the BasePath is set to app1. If the Stage is set as dev, then the private endpoint can be accessed via https://api.internal.example.com/app1/dev. The domain id is the identifier for the private custom domain name.
Note that with public custom domain names, the domain name has to be unique in the region, since they are resolved publicly. With private custom domain names, since they are resolved within a VPC, a private custom domain name with the same name can be created in different accounts. The private custom domain name is then resolved to the VPC endpoint in that account’s VPC.
Step 2: Sharing the private custom domain name using AWS RAM
In order for API consumers to access the private custom domain name from another account, the custom domain name needs to be shared with the consumer accounts using RAM. If the API provider and API consumer are in the same account, this step with RAM can be skipped.
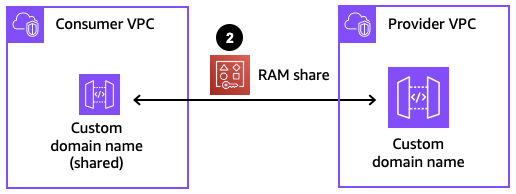
Figure 6: Sharing the private custom domain name
The following CloudFormation definition creates a resource share in the provider account.
The allowed Principals for the resource share specifies the consumer account ids. The ResourceArns specify the ARN of the private custom domain name.
In the consumer account, an administrator receives a notification to accept the resource share. This request must be accepted to allow the consumer account to see the private custom domain name. This handshake acts as a mutual agreement between the accounts to allow the private custom domain name to be exposed from the provider account to the consumer account. If the provider and consumer accounts are in the same AWS Organization, the share is automatically accepted on behalf of consumers.
Step 3: Associating the private custom domain name to a VPC endpoint
The private custom domain name is now visible in the consumer account. Next, associate the private custom domain name with a VPC endpoint in the consumer account and in the VPC where the client applications reside.

Figure 7: Associating the private custom domain name to a VPC endpoint
The AccessAssociationSource is the VPC endpoint id, and the DomainNameArn is the same ARN that is used in the RAM resource share.
Step 4: Creating a Route 53 alias for the custom domain name
The final step before being able to test the custom domain name in the consumer account is setting up a Route 53 alias. That alias is configured in a private hosted zone that is associated with the VPC where the VPC endpoint and client applications reside. The alias resolves the fully qualified domain name (FQDN) to the VPC endpoint DNS name.

Figure 8: Creating a Route 53 alias
The following CloudFormation definition creates that alias.
The ResourceRecords point to the FQDN of the VPC endpoint to which our private custom domain name is associated. Once this alias is created, your client applications can test if it can successfully send requests to the private custom domain name.
Optional: Cleaning up the resources
If you’ve configured a test environment with these resources, you can clean up the deployment by following the steps in reverse order.
- In the consumer account, delete the Route 53 alias.
- In the consumer account, delete the association.
- In both the consumer and provider account, remove the RAM resource share.
- In the provider account, delete the custom domain name and base path mapping.
Conclusion
In this post, you learned about how clients can connect to private REST API endpoints with API Gateway. With custom domain names, your applications connect to stable URLs that can forward requests to many different private API backends. Furthermore, your application teams can deploy resources in separate line of business AWS accounts and access the private custom domain name as a central shared resource, using AWS RAM resource sharing. This allows your application teams to build secure, private API applications and expose them to API consumers securely and across multiple AWS accounts.
For more details, refer to the API Gateway documentation and check out patterns with API Gateway on Serverless Land.
Your DevOps and Developer Productivity guide to 2024 re:Invent
Post Syndicated from Artur Rodrigues original https://aws.amazon.com/blogs/devops/your-devops-and-developer-productivity-guide-to-2024-reinvent/
It’s that time of the year again. The annual AWS re:Invent conference is just around the corner. Still need to save your spot? You can register here.
This year’s DevOps and Developer Productivity (DOP) track features an impressive lineup, including 11 breakout sessions, 14 chalk talks, 2 code talks, 8 workshops, 3 builder sessions, and 2 lightning talks.
I have curated a list of the DOP sessions that you should pay attention. I also invite you to visit the re:Invent catalog to explore the full range of DOP offerings. There is a collection of GenAI related sessions, leveraging Amazon Q Developer and Amazon Bedrock, as well as the usual AWS DevOps tools that we all love, Infrastructure as Code (IaC), Continuous Integration and Continuous Deployment (CI/CD).
How to reserve a seat in the sessions
Reserved seating is available for registered attendees to secure seats in the sessions of their choice. Reserve a seat by signing in to the attendee portal and navigating to “Event”, then “Sessions”.
Do not miss the Innovation Talk led by VP of Developer Experience, Adam Seligman. In DOP220 – Reimagining the Developer Experience at AWS – Software development is undergoing a seismic shift driven by generative AI, transforming how developers work, what they build, and who can become a developer. AWS empowers developers to fearlessly embrace this evolution, integrating cutting-edge yet responsible generative AI solutions across the development lifecycle. Explore real-world use cases accelerating legacy modernization, elevating cloud-native innovation, and unlocking remarkable results. Gain insights into AWS’s pragmatic approach, fueling creativity and customer impact. Join the vibrant community on this transformative journey, where generative AI is redefining software development, opening new frontiers for innovation, and democratizing access to coding for diverse creators shaping technology’s future.
DevOps and Developer Productivity breakout sessions
What are breakout sessions?
AWS re:Invent breakout sessions are lecture-style and 60 minutes long. These sessions are delivered by AWS experts and typically reserve 10–15 minutes for Q&A at the end. Breakout sessions are recorded and made available on-demand after the event.
DOP201 – AWS infrastructure as code: A year in review – AWS provides services that enable the creation, deployment and maintenance of application infrastructure in a programmatic, descriptive, and declarative way. These services provide rigor, clarity, and reliability to application development. Join this session to learn about the new features and improvements for AWS infrastructure as code with AWS CloudFormation and AWS Cloud Development Kit (AWS CDK) and discover how they can benefit your team.
DOP202 – Continuous integration and continuous delivery (CI/CD) for AWS – AWS provides one place where you can plan work, collaborate on code, and build, test, and deploy applications with continuous integration and continuous delivery (CI/CD) tools. In this session, learn about creating complete CI/CD pipelines using infrastructure as code on AWS.
DOP204 – Amazon Q Developer: Your gen AI assistant for software development – In this session, learn how Amazon Q Developer is transforming the developer experience by speeding up a range of tasks that support you as you research how to get started, evaluate system design, build secure and scalable applications, upgrade existing applications, and optimize application performance. Learn firsthand how Amazon Q capabilities for building, troubleshooting, and transforming applications faster and more easily frees you up to focus on experimentation and innovation.
DOP209 – Accelerate application maintenance and upgrades with generative AI – Developers spend significant time completing the undifferentiated work of maintaining and upgrading legacy applications. Teams need to balance investments in building new features with mandatory patching and update work. Now, using the power of generative AI, the Amazon Q Developer agent for code transformation can expedite these critical upgrade tasks, transforming applications to use the latest language features and versions in hours or days and saving significant costs. Join the session to learn what’s new and how your team can automate Java application upgrades.
DOP214 – Unleashing generative AI: Amazon’s journey with Amazon Q Developer – Join us to discover how Amazon rolled out Amazon Q Developer to thousands of developers, trained them in prompt engineering, and measured its transformative impact on productivity. In this session, learn best practices for effectively adopting generative AI in your organization. Gain insights into training strategies, productivity metrics, and real-world use cases to empower your developers to harness the full potential of this game-changing technology. Don’t miss this opportunity to stay ahead of the curve and drive innovation within your team.
DevOps and Developer Productivity chalk talks
What are chalk talks?
Chalk Talks are highly interactive sessions with a small audience. Experts lead you through problems and solutions on a digital whiteboard as the discussion unfolds. Each begins with a short lecture (10–15 minutes) delivered by an AWS expert, followed by a 45- or 50-minute Q&A session with the audience.
DOP318 – Prompt engineering expertise: Unleashing code with Amazon Q Developer – Dive into the art of prompt engineering and discover how to harness the full potential of Amazon Q Developer, AWS’s cutting-edge generative AI service. Learn techniques to craft compelling prompts that yield remarkable code generation results. Explore strategies to provide contextual information beyond prompts, such as import statements, to enhance the accuracy and relevance of your AI-generated code. Elevate your software development workflow and unleash the transformative capabilities of generative AI.
DOP324 – Incorporating generative AI in the CI/CD pipeline – In this chalk talk, discover how generative AI can revolutionize your continuous integration and delivery (CI/CD) pipeline. Learn how AI models can analyze code changes and generate recommendations for safe deployments. Explore automated orchestration capabilities that trigger deployments, monitor metrics, and adapt strategies. Gain insights into using AI for continual monitoring and self-improving release cycles, streamlining your software delivery while minimizing risks and manual efforts.
DOP314 – Automate Java app upgrades & accelerate innovation with generative AI – Amazon Q Developer’s agent for code transformation automates the end-to-end process of upgrading and transforming code. Reduce the time and costs associated with modernizing applications, unlock previously cost-prohibitive and cumbersome modernization opportunities, and save customers months or even years of effort. By automating undifferentiated upgrade and modernization tasks, customers can enhance application performance and security and accelerate innovation. Join this chalk talk to learn how to take your application modernization to the next level.
DOP323 – From Windows to Linux: .NET application modernization – Porting and upgrades of .NET applications running on Windows servers to Linux can deliver cost savings and enhance security and compliance, but the modernization process can be long and laborious. This interactive chalk talk explores strategies for porting server-side components of a .NET application within days by refactoring. The session includes codebase analysis, code decomposition into buildable units, transformation plan creation, and execution of key transformation tasks with approval from the developer.
DevOps and Developer Productivity workshops
What are workshops?
Workshops are two-hour interactive learning sessions where you work in small group teams to solve problems using AWS services. Each workshop starts with a short lecture (10–15 minutes) by the main speaker, and the rest of the time is spent working as a group.
DOP304 – Develop AWS CDK resources to deploy your applications on AWS – In this workshop, learn how to build and deploy applications using infrastructure as code with AWS Cloud Development Kit (AWS CDK). Create resources using AWS CDK, and learn maintenance and operations tips. In addition, get an introduction to building your own constructs. You must bring your laptop to participate.
DOP305 – Modern CI/CD with GitHub and AWS CodePipeline – In this workshop, learn how to build modern continuous integration and continuous delivery (CI/CD) pipelines using GitHub and AWS CodePipeline through the AWS Management Console. Learn how to work with monorepos and branching strategies. Explore advanced features such as automatic rollbacks, pipeline parameters, stage level conditions, and concurrent execution modes to improve your pipeline performance. You must bring your laptop to participate.
DOP309 – The Amazon Q Developer coding challenge – Join this workshop to participate in 20 increasingly complex coding challenges aided by Amazon Q Developer, an AI-powered assistant for software development. Discover how Amazon Q Developer’s auto-generated code recommendations and chat explanations can help you develop code and understand complex algorithmic coding challenges more efficiently compared to manual coding alone. Learn about Amazon Q Developer capabilities and how it can help you improve productivity. You must bring your laptop to participate.
DOP325 – Boost code quality with generative AI – In this hands-on workshop, you unleash the power of generative AI to boost code quality using Amazon Q Developer. You learn to use Amazon Q Developer to generate unit tests and documentation automatically, addressing the challenge of balancing new feature development with writing unit tests and documentation. By the end of the workshop, you have firsthand experience streamlining your development process and freeing up time to focus on core feature development. Come follow along with step-by-step instructions and gain practical experience with this cutting-edge AWS service. You must bring your laptop to participate.
DevOps and Developer Productivity builders’ sessions
What are builders’ sessions?
These 60-minute group sessions are led by an AWS expert and provide an interactive learning experience for building on AWS. Builders’ sessions are designed to create a hands-on experience where questions are encouraged.
DOP205 – Learning new skills with Amazon Q Developer – Experience the power of Amazon Q Developer, your AI-powered assistant for software development. In this session, explore how Amazon Q Developer can streamline your daily workflow on AWS. Stuck in the console? Open the Amazon Q Developer panel for instant assistance. Can’t find your way through the documentation? Amazon Q Developer guides you effortlessly. Need help crafting CLI commands? Amazon Q Developer has you covered. Want assistance right in Slack or Microsoft Teams? Amazon Q Developer is by your side, helping you work smarter, faster, and more efficiently across your favorite tools. You must bring your laptop to participate.
DOP302 – Creating secure code with Amazon Q Developer – In this builders’ session, gain hands-on experience using Amazon Q Developer to create secure code. Write unit tests, optimize code, and scan for vulnerabilities, and discover how Amazon Q Developer suggests remediations that help fix your code instantaneously. Also, learn how you can use Amazon Q Developer security scanning to outperform other publicly benchmarkable tools on detection across popular programming languages. You must bring your laptop to participate.
DOP401 – Modernizing Java applications with Amazon Q Developer – In this builders’ session, use Amazon Q Developer Agent for code transformation to modernize a Java application. Learn how Amazon Q Developer can leverage generative AI to automate common language upgrade tasks like updating your code, conducting unit tests, and verifying deployment readiness starting with Java. Save days’ or even months’ worth of the undifferentiated work involved in moving from older language versions. You must bring your laptop to participate.
DevOps and Developer Productivity lightning talks
What are lightning talks?
Lightning talks are short, 20-minute demos led from a stage.
DOP217 – Best practices for customizing Amazon Q Developer – With Amazon Q Developer, you can securely connect to your private repositories to generate even more relevant code recommendations based on your internal code repositories, ask questions about your company code, and understand your internal code bases faster. In this session, learn how to set up customizations and generate code based on your internal repos. Use the Amazon Q Developer chat in your IDE to ask questions about how your internal code base is structured, where and how certain functions or libraries are used, and how to use specific functions, methods, or APIs.
DOP219 – How NAB uses Amazon Q Developer for increased productivity – Significantly accelerate development by customizing Amazon Q Developer to generate even more relevant inline code recommendations and chat responses (in preview) by making it aware of your internal libraries, APIs, best practices, and architectural patterns. In this lightning talk, you learn how National Australia Bank (NAB) is using Amazon Q Developer to help their development teams ship faster, and innovate more for their customers, by using customizations.
DevOps and Developer Productivity code talks
What are code talks?
Code talks are 60-minute, highly-interactive discussions featuring live coding. Attendees are encouraged to dig in and ask questions about the speaker’s approach.
DOP313 – Get tailored code insights with Amazon Q Developer and private repos – Unlock the full potential of Amazon Q Developer with customized code recommendations tailored to your organization’s code base. In this code talk, learn how to securely connect Amazon Q to your private repositories, enabling it to generate highly relevant code suggestions based on your internal coding practices. Discover how to create and utilize customizations, and witness firsthand the transformative impact on code comprehension and development efficiency by comparing suggestions with and without customization. Elevate your coding experience with this powerful feature.
DOP315 – Optimize your cloud environments in the AWS console with generative AI – Available in the AWS Management Console, Amazon Q Developer is the only AI assistant that is an expert on AWS, helping developers and IT pros optimize their AWS cloud environments. Proactively diagnose and resolve errors and networking issues, provide guidance on architectural best practices, analyze billing information and trends, and use natural language in chat to manage resources in your AWS account. Learn how Amazon Q Developer accelerates task completion with tailored recommendations based on your specific AWS workloads, shifting from a reactive review to proactive notifications and remediation.
Want to stay connected?
Get the latest updates for DevOps and Developer Productivity by following us on Twitter and visiting the AWS devops blog.
If you are unable to join us in-person, Breakout Sessions will be available via our YouTube channel after the event. Contact your AWS Account Team is you are interested in learning more about any of these sessions or how to bring our experts to you.
We look forward to seeing you at re:Invent 2024!
The Best of Geographics: Astrographics Part 1, Pluto, Ninth Planet, Oumuamua, and Halley’s Comet
Post Syndicated from Geographics original https://www.youtube.com/watch?v=i3CBlJmDDOw
US HPC and the DOGE Impact on Next-Gen Supercomputers
Post Syndicated from Patrick Kennedy original https://www.servethehome.com/us-hpc-and-the-doge-impact-on-next-gen-supercomputers/
We explore how the US Department of Government Efficiency or DOGE might impact US high-performance computing in the coming years
The post US HPC and the DOGE Impact on Next-Gen Supercomputers appeared first on ServeTheHome.
Introducing AWS CloudFormation Hooks invoked via AWS Cloud Control API (CCAPI)
Post Syndicated from Kevin DeJong original https://aws.amazon.com/blogs/devops/introducing-aws-cloudformation-hooks-invoked-via-aws-cloud-control-api-ccapi/
Today we are announcing the integration of AWS CloudFormation Hooks with AWS Cloud Control API (CCAPI). This integration enables the use of hooks to validate the configuration of resources being provisioned through CCAPI. In this blog post, we will explore the integration between CloudFormation Hooks and CCAPI by configuring an existing hook to work with CCAPI and then test that hook using the AWS CLI and Terraform.
Understanding CloudFormation Hooks
CloudFormation Hooks integrate seamlessly with your CloudFormation and CCAPI requests to perform validation of your resource configuration during resource create and update operations. You can create hooks using AWS Lambda, AWS CloudFormation Guard rules, or using code and the CloudFormation Command Line Interface (CFN-CLI). A hook can be triggered on change sets, entire stack templates, or by each resource and it will return back any discovered misconfiguration information. Hooks can be configured to warn or fail on the operation allowing you to prevent any misconfigured resources from being deployed in your account. Some key benefits of using CloudFormation Hooks with CCAPI include:
- Enforcing security best practices
- Applying organizational policies to resource deployments
- Optimizing resource configurations for cost and performance
- Standardize validation across different infrastructure as code solutions like CloudFormation, Terraform (Terraform AWS Cloud Control Provider), and Pulumi (AWS Cloud Control)
Prerequisites
For this post we are going to use the new AWS CloudFormation Guard (Guard) hook AWS::Hooks::GuardHook. Guard is an open-source policy-as-code tool that allows you to validate your infrastructure configurations against company policy guidelines. It provides a domain-specific language (DSL) for writing rules to check both required and prohibited resource configurations. The new AWS::Hooks::GuardHook allows you to use the Guard DSL inside of a hook so you can easily implement your organizations guidelines. The result is you can use the same Guard rules in our local development environment, continuous integration and continuous deployment pipelines, and at deployment time (using hooks). To learn more about AWS::Hooks::GuardHook you can look at the blog.
This is what the configuration of the current Guard hook looks like.
This hook has been configured to log the Guard validation report to an Amazon Simple Storage Service (S3) bucket. Additionally, this hook is configured to use a rule from the AWS CloudFormation Guard registry. This rule will validate that an S3 bucket is using versioning. This hook is configured with an alias named My::Hooks::Guard.
Here is the rule for reference. This rule will validate that the property VersioningConfiguration is provided and that its value is Enabled.
Configuring the hook to work with CCAPI
This announcement adds a new hook target that can easily be configured on your existing or new hooks. To configure the hook to work with CCAPI you will edit the configuration to include a new TargetOperations value of CLOUD_CONTROL. This hook is only enabled to execute on CREATE and UPDATE operations. Additionally HookInvocationStatus is ENABLED which will execute the hook and FailureMode will tell the hook to FAIL the operation if the resource is not compliant.
By using TargetOperations of ["RESOURCE", "CLOUD_CONTROL"] the Guard rules will work the same across CloudFormation resource operations and CCAPI operations.
Testing the hook using AWS CLI
Test your hook using the AWS CLI which allows us to create, update, delete, and list resources.
- Start by creating a S3 bucket using CCAPI. In this example you are providing no properties for creating the S3 bucket. Run the command
aws cloudcontrol create-resource --type-name AWS::S3::Bucket --desired-state {}
Response: - Get the request status by using the
RequestTokenfrom the response above. Run the commandaws cloudcontrol get-resource-request-status --request-token 2c7b6f5e-4083-4ef8-9a23-5c81472540b1In the response you will see all hooks that were executed and their response in relation to the request. This response shows that the hook
My::Hooks::Guardfailed because of the ruleS3_BUCKET_VERSIONING_ENABLED. You are also provided a s3 location for where the full Guard output is stored. - You can get the Guard results file by using the following command. Replace
<path-from-previous-output>with the path provided in the previous output. Run the commandaws s3 cp s3://<path-from-previous-output> -Response:
We truncated the output as it can be very verbose.
Testing the hook using Terraform
The Terraform AWS Cloud Control Provider allows you to manage AWS resources using CCAPI and Terraform. By leveraging this provider you get the benefit of using hooks to validate the configuration of Terraform provisioned resources.
- Create a new Terraform configuration file named
main.tfwith the following content: - Run the following commands to initialize Terraform and create an execution plan. Run the command
terraform initfollowed byterraform plan. - Apply the configuration by running. Run the command
terraform apply - You can get details on the hook invocation by running the command
aws cloudformation list-hook-results --hook-target TargetType=CLOUD_CONTROL,TargetId=d417b05b-9eff-46ef-b164-08c76aec1801Response:As with the AWS CLI you now know what rule failed and additional you have the S3 bucket location for the Guard log file.
- You can get the Guard results file by running the command
aws s3 cp s3://<path-from-previous-output> -. Replace<path-from-previous-output>with the path provided in the previous output.Response:We truncated the output as it can be very verbose.
- Let’s correct our S3 bucket configuration in
main.tf - Try the deployment again by running
terraform applyResponse:Conclusion
CloudFormation Hooks provide a powerful way to enforce best practices and compliance for your AWS resources. By leveraging CloudFormation Hooks and the Cloud Control API you can create consistent validation of your resources before deployment across many of your infrastructure as code solutions.
Ultimate RV Internet Setup: Triple WAN Router Changes Everything
Post Syndicated from Crosstalk Solutions original https://www.youtube.com/watch?v=gRZ4j-mXbEQ
A Bag of RATs: VenomRAT vs. AsyncRAT
Post Syndicated from Anna Širokova original https://blog.rapid7.com/2024/11/21/a-bag-of-rats-venomrat-vs-asyncrat/
Introduction

Remote access tools (RATs) have long been a favorite tool for cyber attackers, since they enable remote control over compromised systems and facilitate data theft, espionage, and continuous monitoring of victims. Among the well-known RATs are VenomRAT and AsyncRAT. These are open-source RATs and have been making headlines for their frequent use by different threat actors, including Blind Eagle/APT-C-36, Coral Rider, NullBulge, and OPERA1ER. Both RATs have their roots in QuasarRAT, another open-source project, which explains their similarities. However, as both have evolved over time, they have diverged in terms of functionalities and behavior, which affects how attackers use them and how they are detected.
Interestingly, as these RATs evolved, some security vendors have started to blur the line between them, often grouping detections under a single label, such as AsyncRAT or AsyncRAT/VenomRAT. This indicates how closely related the two are, but also suggests that their similarities may cause challenges for detection systems. We took a closer look at recent samples of each RAT to examine how they differ, if at all.
This comparison explores the core technical differences between VenomRAT and AsyncRAT by analyzing their architecture, capabilities, and tactics.
Here’s a comparison table between VenomRAT and AsyncRAT based on the findings
| Capability | VenomRAT | AsyncRAT |
|---|---|---|
| AMSI Bypass | ✔ Patches AmsiScanBuffer in amsi.dll (In-memory patching) T1562.001 | ✘ Not implemented |
| ETW Bypass | ✔ Patches EtwEventWrite in ntdll.dll (In-memory patching) T1562.006 | ✘ Not implemented |
| Keylogging | ✔ Advanced keylogger with filtering and process tracking T1056.001 | ✔ Basic keylogger with clipboard logging T1056.001 |
| Anti-analysis Techniques | ✔ Uses WMI for OS detection, VM check T1497.001 | ✔ VM, sandbox, and debugger detection T1497 |
| Hardware Interaction | ✔ Collects CPU, RAM, GPU, and software data using WMI T1082 | ✔ Collects system data via Win32_ComputerSystem T1082 |
| Process discovery | ✔ This the capability to obtain a listing of running processes T1057 | ✘ Not implemented |
| Anti-process Monitoring | ✔ Terminates system monitoring and security processes T1562.009 | ✘ Not implemented |
| Webcam Access | ✔ Camera detection and access T1125 | ✘ Not implemented |
| Dynamic API Resolution | ✔ DInvokeCore class for dynamic API resolution T1027.007 | ✘ Not implemented |
| Encrypts the configuration | ✔ 16-byte salt ("VenomRATByVenom") T1027.013 | ✔ 32-byte binary salt T1027.013 |
| Error Handling | ✔ Silent failures with basic try-catch | ✔ Sends detailed error reports to C2 T1071 |
Technical analysis
In this technical analysis, we compare two specific RAT samples:
- VenomRAT: 1574d418de3976fc9a2ba0be7bf734b919927d49bd5e74b57553dfc6eee67371AsyncRAT: caf9e2eac1bac6c5e09376c0f01fed66eea96acc000e564c907e8a1fbd594426
Both AsyncRAT and VenomRAT are open-source remote access tools developed in C# and built on the .NET Framework (v4.0.30319). A preliminary analysis based on CAPA results revealed several shared characteristics between the two. For example, both RATs use standard libraries like System.IO, System.Security.Cryptography, and System.Net for file handling, encryption, and networking. They also have common cryptographic components such as HMACSHA256, AES, and SHA256Managed, indicating similar encryption routines. Indeed, upon closer code examination, we found that their encryption classes were identical, with only one minor difference: AsyncRAT uses a 32-byte binary salt, while VenomRAT uses a 16-byte salt derived from the string “VenomRATByVenom.” Additionally, both RATs share similarities in configuration handling, mutex creation, and parts of their anti-analysis class.
However, the CAPA analysis also highlighted distinct differences between the two. Certain features present in one RAT were notably absent in the other. To verify, we manually reviewed code in both samples and described the differences below.
Keylogging and System Hooking
In the samples we analyzed the keylogger was present only in VenomRAT. However, the open-source version of AsyncRAT has a keylogger plugin. We therefore decided to investigate whether the VenomRAT keylogger implementation is the same as AsyncRAT’s implementation. Our findings suggest that the keylogging functionality is different. We summarized a comparative analysis of their keylogging implementations in the table below. Additionally, the VenomRAT keylogger configuration file DataLogs.conf and log files are saved in the user’s %AppData%\MyData folder.
| Feature | VenomRAT | AsyncRAT |
|---|---|---|
| Low-level keyboard hook (WH_KEYBOARD_LL) | ✔ | ✔ |
| Keystroke Processing | ✔ | ✔ |
| Window/Process Tracking | Tracks both process and window title | Tracks window title only |
| Clipboard Logging | ✘ | ✔ |
| Log Transmission | Periodic log sending to C2 | Continuous log sending to C2 |
| Filtering Mechanism | ✔ | ✘ |
| Error Handling | Silent failures with basic try-catch | Sends detailed error reports to C2 |
| Additional Features | Focused on keystrokes | Handles both keystrokes and clipboard |
| Thread Management | ✘ | ✔ |
Anti-Analysis
Both AsyncRAT and Venom RAT have similar implementations of the anti-analysis classes. However, we can see notable differences. AsyncRAT focuses on a broad spectrum of detection techniques, including:
- Virtual Machine Detection: It checks for known system manufacturer names such as VMware,VirtualBox, or Hyper-V.
- Sandbox Detection: It looks for sandbox-related DLLs, such as SbieDll.dll from Sandboxie.
- Debugger Detection: AsyncRAT uses CheckRemoteDebuggerPresent to detect if it’s being monitored by a debugger.
- Disk Size Check: It avoids execution on machines with less than 60GB disk size.
On the other hand, VenomRAT uses a more targeted approach. The virtual machine detection method in VenomRAT relies on querying system memory through WMI (Windows Management Instrumentation) to query system memory via Win32_CacheMemory. The method relies on counting cache memory entries, and if the number is less than 2 cache memories, it assumes the system is a virtual machine (VM). However, modern VMs are more sophisticated, and simply relying on counting cache memories may not be effective.
The other difference is, instead of targeting debuggers or sandboxes, VenomRAT attempts to avoid running on server operating systems by querying the Win32_OperatingSystem WMI class and checking the ProductType, which differentiates between desktop and server environments. We summarized class differences in the table below.
| Feature | AsyncRAT AntiAnalysis Class | Venom RAT Anti_Analysis Class |
|---|---|---|
| VM Detection | ✔ | ✔ |
| Sandbox Detection | ✔ | ✘ |
| Debugger Detection | ✔ | ✘ |
| Operating System Detection | ✔ | ✔ |
| Process Discovery | ✘ | ✔ |
Hardware Interaction
VenomRAT has hardware interaction capabilities, allowing it to gather detailed system information through WMI queries with ManagementObjectSearcher objects. These features are encapsulated in the CGRInfo class, which enables the collection of CPU, RAM, GPU, and software data:
- GetCPUName(): Retrieves the CPU name and the number of cores
- GetRAM(): Fetches the total installed physical memory (RAM)
- GetGPU(): Obtains the GPU name and driver version
- GetInstalledApplications(): Scans the Windows Registry to compile a list of installed applications
- GetUserProcessList(): Collects information on all running processes with visible windows
The collected data is sent back to the command-and-control (C2) server. This class is absent in both the version of AsyncRAT we analyzed and the open-source version.
DcRAT joined the party with AntiProcess and Camera classes
VenomRAT includes two notable classes absent in AsyncRAT: the AntiProcess and Camera classes.
The AntiProcess class is an anti-monitoring and anti-detection component of VenomRAT. Malware uses the Windows API function CreateToolhelp32Snapshot to get a snapshot of all running processes and search for specific processes. We categorized the processes the malware is looking for below.
System Monitoring Tools that can prevent users from identifying or stopping VenomRAT.
- Taskmgr.exe
- ProcessHacker.exe
- procexp.exe
Security & Antivirus Processes: Terminating them reduces the risk of VenomRAT being detected or removed by security software.
- MSASCui.exe
- MsMpEng.exe
- MpUXSrv.exe
- MpCmdRun.exe
- NisSrv.exe
System Configuration Utilities: By targeting these, VenomRAT prevents users from adjusting security settings, inspecting registry changes, or manually removing the malware.
- ConfigSecurityPolicy.exe
- MSConfig.exe
- Regedit.exe
- UserAccountControlSettings.exe
- Taskkill.exe
If a matching process is found, it terminates it by its process ID (PID).
The Camera class is designed to detect webcams on a Windows system by querying the available system devices using COM interfaces. It retrieves a list of devices by category, specifically looking for video input devices. The class uses the ICreateDevEnum and IPropertyBag interfaces to enumerate and extract the device names.
However, both these classes, although absent in AasyncRAT, are not exclusive to VenomRAT only. Apparently they are exact copycats of yet another open-source RAT, DcRAT.
AMSI and ETW Bypass
This class was found only in the VenomRAT sample and is designed to bypass key Windows security mechanisms through in-memory patching. It specifically disables two critical Windows security features: AMSI (Antimalware Scan Interface) and ETW (Event Tracing for Windows), which are often used by antivirus software and monitoring tools to detect malware.
Key Functions:
- AMSI Bypass: The class patches the AmsiScanBuffer function within amsi.dll to prevent AMSI from scanning for malicious content.
- ETW Bypass: The class patches the EtwEventWrite function in ntdll.dll, which stops ETW from logging events related to the malware’s activity.
The patching process is performed in-memory. The class dynamically checks the system’s architecture (32-bit or 64-bit) and loads the appropriate DLLs (amsi.dll and ntdll.dll) to apply the patches based on the platform. The techniques used by VenomRAT closely mirror those found in the SharpSploit project, an open-source tool often used by penetration testers and red teams to test and bypass security features in a controlled environment. SharpSploit contains classes for bypassing both AMSI and ETW using similar in-memory patching methods, which likely served as inspiration for VenomRAT’s implementation.
This security bypass functionality makes VenomRAT more capable of evading modern security defenses.
Dynamic API resolution
VenomRAT has yet another class which is absent in AsyncRAT. The DInvokeCore class is implemented to dynamically resolve and call Windows API functions at runtime; this method bypasses traditional static imports, making it harder for antivirus and endpoint detection and response (EDR) systems to detect malicious activity.
Instead of statically importing Windows APIs, the class resolves function addresses at runtime (e.g., from ntdll.dll or kernel32.dll) using methods like GetLibraryAddress and GetExportAddress. This approach makes it difficult for static analysis tools to flag malicious behavior.
It uses the NtProtectVirtualMemory method to alter memory protection settings, allowing execution of code in memory regions that are normally non-executable—an effective method for in-memory execution of malicious payloads.
Implementation of DInvokeCore closely mirrors the open-source SharpSploit Generic class from the D/Invoke project by TheWover. The DInvokeCore class from VenomRAT appears to be a simplified version, which lacks some features but has core techniques for dynamic API invocation.
Conclusion
Our analysis was sparked by detection vendors grouping VenomRAT and AsyncRAT under the same label, blurring the lines between the two. While they indeed belong to the QuasarRAT family, they are still different RATs.
AsyncRAT appears to closely match the latest open-source release (v0.5.8). However, the VenomRAT seems to have evolved and added other capabilities, although a lot of them seem to be a copy-paste from another open-source RAT (DcRAT) and the SharpSploit project. Despite this, VenomRAT presents more advanced evasion techniques, making it a more sophisticated threat.
Therefore, it’s important for security vendors to treat them as distinct threats, recognizing that VenomRAT brings more advanced evasion capabilities, even if much of it isn’t truly unique. To help to resolve this confusion, we are sharing an updated VenomRAT YARA rule with the community, helping improve detection and response efforts.
Rapid7 customers
InsightIDR and Managed Detection and Response (MDR) customers have existing detection coverage through Rapid7’s expansive library of detection rules. Rapid7 recommends installing the Insight Agent on all applicable hosts to ensure visibility into suspicious processes and proper detection coverage. The following rule will alert on a wide range of malicious hashes tied to behavior in this blog: Suspicious Process – Malicious Hash On Asset
YARA rule
The VenomRAT YARA rule can be found on the Rapid7 Labs GitHub here.
Run high-availability long-running clusters with Amazon EMR instance fleets
Post Syndicated from Garima Arora original https://aws.amazon.com/blogs/big-data/run-high-availability-long-running-clusters-with-amazon-emr-instance-fleets/
AWS now supports high availability Amazon EMR on EC2 clusters with instance fleet configuration. With high availability instance fleet clusters, you now get the enhanced resiliency and fault tolerance of high availability architecture, along with the improved flexibility and intelligence in Amazon Elastic Compute Cloud (Amazon EC2) instance selection of instance fleets. Amazon EMR is a cloud big data platform for petabyte-scale data processing, interactive analysis, streaming, and machine learning (ML) using open source frameworks such as Apache Spark, Presto and Trino, and Apache Flink. Customers love the scalability and flexibility that Amazon EMR on EC2 offers. However, like most distributed systems running mission-critical workloads, high availability is a core requirement, especially for those with long-running workloads.
In this post, we demonstrate how to launch a high availability instance fleet cluster using the newly redesigned Amazon EMR console, as well as using an AWS CloudFormation template. We also go over the basic concepts of Hadoop high availability, EMR instance fleets, the benefits and trade-offs of high availability, and best practices for running resilient EMR clusters.
High availability in Hadoop
High availability (HA) provides continuous uptime and fault tolerance for a Hadoop cluster. The core components of Hadoop, like Hadoop Distributed File System (HDFS) NameNode and YARN ResourceManager, are single points of failure in clusters with a single primary node. In the event that any of them crash, the entire cluster goes down. High Availability removes this single point of failure by introducing redundant standby nodes that can quickly take over if the primary node fails.
In a high availability EMR cluster, one node serves as the active NameNode that handles client operations, and others act as standby NameNodes. The standby NameNodes constantly synchronize their state with the active one, enabling seamless failover to maintain service availability. To learn more, see Supported applications in an Amazon EMR Cluster with multiple primary nodes.
Key instance fleet differentiations
Amazon EMR recommends using the instance fleet configuration option for provisioning EC2 instances in EMR clusters because it offers a flexible and robust approach to cluster provisioning. Some key advantages include:
- Flexible instance provisioning – Instance fleets provide a powerful and simple way to specify up to five EC2 instance types on the Amazon EMR console, or up to 30 when using the AWS Command Line Interface (AWS CLI) or API with an allocation strategy. This enhanced diversity helps optimize for cost and performance while increasing the likelihood of fulfilling capacity requirements.
- Target capacity management – You can specify target capacities for On-Demand and Spot Instances for each fleet. Amazon EMR automatically manages the mix of instances to meet these targets, reducing operational overhead.
- Improved availability – By spanning multiple instance types and purchasing options such as On-Demand and Spot, instance fleets are more resilient to capacity fluctuations in specific EC2 instance pools.
- Enhanced Spot Instance handling – Instance fleets offer superior management of Spot Instances, including the ability to set timeouts and specify actions if Spot capacity can’t be provisioned.
- Reliable cluster launches – You can configure your instance fleet to select multiple subnets for different Availability Zones, allowing Amazon EMR to find the best combination of instances and purchasing options across these zones to launch your cluster in. Amazon EMR will identify the best Availability Zone based on your configuration and available EC2 capacity and launch the cluster.
Prerequisites
Before you launch the high availability EMR instance fleet clusters, make sure you have the following:
- Latest Amazon EMR release – We recommend that you use the latest Amazon EMR release to benefit from the highest level of resiliency and stability for your high availability clusters. High availability for instance fleets is supported with Amazon EMR releases 5.36.1, 6.8.1, 6.9.1, 6.10.1, 6.11.1, 6.12.0, and later.
- Supported applications – High availability for instance fleets is supported for applications such as Apache Spark, Presto, Trino, and Apache Flink. Refer to Supported applications in an Amazon EMR Cluster with multiple primary nodes for the complete list of supported applications and their failover processes.
Launch a high availability instance fleet cluster using the Amazon EMR console
Complete the following steps on the Amazon EMR console to configure and launch a high availability EMR cluster with instance fleets:
- On the Amazon EMR console, create a new cluster.
- For Name, enter a name.
- For Amazon EMR release, choose the Amazon EMR release that supports high availability clusters with instance fleets. The setting will default to the latest available Amazon EMR release.

- Under Cluster configuration, choose the desired instance types for the primary fleet. (You can select up to five when using the Amazon EMR console.)
- Select Use high availability to launch the cluster with three primary nodes.

- Choose the instance types and target On-Demand and Spot size for the core and task fleet according to your requirements.

- Under Allocation strategy, select Apply allocation strategy.
- 1 We recommend that you select Price-capacity optimized for your allocation strategy for your cluster for faster cluster provisioning, more accurate Spot Instance allocation, and fewer Spot Instance interruptions.
- Under Networking, you can choose multiple subnets for different Availability Zones. This allows Amazon EMR to look across those subnets and launch the cluster in an Availability Zone that best suits your instance and purchasing option requirements.

- Review your cluster configuration and choose Create cluster.
Amazon EMR will launch your cluster in a few minutes. You can view the cluster details on the Amazon EMR console.

Launch a high availability cluster with AWS CloudFormation
To launch a high availability cluster using AWS CloudFormation, complete the following steps:
- Create a CloudFormation template with EMR resource type
AWS::EMR::Clusterand JobFlowInstancesConfig property typesMasterInstanceFleet,CoreInstanceFleetand (optional)TaskInstanceFleets. To launch a high availability cluster, configure TargetOnDemandCapacity=3, TargetSpotCapacity=0 for the primary instance fleet and weightedCapacity=1 for each instance type configured for the fleet. See the following code:
{
  "AWSTemplateFormatVersion": "2010-09-09",
  "Resources": {
    "cluster": {
      "Type": "AWS::EMR::Cluster",
      "Properties": {
        "Instances": {
          "Ec2SubnetIds": [
            "subnet-003c889b8379f42d1",
            "subnet-0382aadd4de4f5da9",
            "subnet-078fbbb77c92ab099"
          ],
          "MasterInstanceFleet": {
            "Name": "HAPrimaryFleet",
            "TargetOnDemandCapacity": 3,
            "TargetSpotCapacity": 0,
            "InstanceTypeConfigs": [
              {
                "InstanceType": "m5.xlarge",
                "WeightedCapacity": 1
              },
              {
                "InstanceType": "m5.2xlarge",
                "WeightedCapacity": 1
              },
              {
                "InstanceType": "m5.4xlarge",
                "WeightedCapacity": 1
              }
            ]
          },
          "CoreInstanceFleet": {
            "Name": "cfnCore",
            "InstanceTypeConfigs": [
              {
                "InstanceType": "m5.xlarge",
                "WeightedCapacity": 1
              },
              {
                "InstanceType": "m5.2xlarge",
                "WeightedCapacity": 2
              },
              {
                "InstanceType": "m5.4xlarge",
                "WeightedCapacity": 4
              }
            ],
            "LaunchSpecifications": {
              "SpotSpecification": {
                "TimeoutAction": "SWITCH_TO_ON_DEMAND",
                "TimeoutDurationMinutes": 20,
                "AllocationStrategy": "PRICE_CAPACITY_OPTIMIZED"
              }
            },
            "TargetOnDemandCapacity": "4",
            "TargetSpotCapacity": 0
          },
          "TaskInstanceFleets": [
            {
              "Name": "cfnTask",
              "InstanceTypeConfigs": [
                {
                  "InstanceType": "m5.xlarge",
                  "WeightedCapacity": 1
                },
                {
                  "InstanceType": "m5.2xlarge",
                  "WeightedCapacity": 2
                },
                {
                  "InstanceType": "m5.4xlarge",
                  "WeightedCapacity": 4
                }
              ],
              "LaunchSpecifications": {
                "SpotSpecification": {
                  "TimeoutAction": "SWITCH_TO_ON_DEMAND",
                  "TimeoutDurationMinutes": 20,
                  "AllocationStrategy": "PRICE_CAPACITY_OPTIMIZED"
                }
              },
              "TargetOnDemandCapacity": "0",
              "TargetSpotCapacity": 4
            }
          ]
        },
        "Name": "TestHACluster",
        "ServiceRole": "EMR_DefaultRole",
        "JobFlowRole": "EMR_EC2_DefaultRole",
        "ReleaseLabel": "emr-6.15.0",
        "PlacementGroupConfigs": [
          {
            "InstanceRole": "MASTER",
            "PlacementStrategy": "SPREAD"
          }
        ]
      }
    }
  }
}
Make sure to use an Amazon EMR release that supports high availability clusters with instance fleets.
- Create a CloudFormation stack with the preceding template:
aws cloudformation create-stack --stack-name HAInstanceFleetCluster --template-body file://cfn-template.json --region us-east-1- Retrieve the cluster ID from the list-clusters response to use in the following steps. You can further filter this list based on filters like cluster status, creation date, and time.
aws emr list-clusters --query "Clusters[?Name=='<YourClusterName>']"- Run the following describe-cluster command:
aws emr describe-cluster --cluster-id j-XXXXXXXXXXX --region us-east-1If the high availability cluster was launched successfully, the describe-cluster response will return the state of the primary fleet as RUNNING and provisionedOnDemandCapacity as 3. By this point, all three primary nodes have been started successfully.

Primary node failover with High Availability clusters
To fetch information on all EC2 instances for an instance fleet, use the list-instances command:
aws emr list-instances --cluster-id j-XXXXXXXXXXX --instance-fleet-type MASTER --region us-east-1
For high availability clusters, it will return three instances in RUNNING state for the primary fleet and other attributes like public and private DNS names.

The following screenshot shows the instance fleet status on the Amazon EMR console.

Let’s examine two cases for primary node failover.
Case 1: One of the three primary instances is accidentally stopped
When an EC2 instance is accidentally stopped by a user, Amazon EMR detects this and performs a failover for the stopped primary node. Amazon EMR also attempts to launch a new primary node with the same private IP and DNS name to recover back the quorum. During this failover, the cluster remains fully operational, providing true resiliency to single primary node failures.
The following screenshots illustrate the instance fleet details.


This automatic recovery for primary nodes is also reflected in the MultiMasterInstanceGroupNodesRunning or MultiMasterInstanceGroupNodesRunningPercentage Amazon CloudWatch metric emitted by Amazon EMR for your cluster. The following screenshot shows an example of these metrics.

Case 2: One of the three primary instances becomes unhealthy
If Amazon EMR continuously receives failures when trying to connect to a primary instance, it is deemed as unhealthy and Amazon EMR will attempt to replace it. Similar to case 1, Amazon EMR will perform a failover for the stopped primary node and also attempt to launch a new primary node with the same private IP and DNS name to recover the quorum.


If you list the instances for the primary fleet, the response will include information for the EC2 instance that was stopped by the user and the new primary instance that replaced it with the same private IP and DNS name.

The following screenshot shows an example of the CloudWatch metrics.

An instance can have connection failures for multiple reasons, including but not limited to disk space unavailable on the instance, critical cluster daemons like instance controller shut down with errors, high CPU utilization, and more. Amazon EMR is continuously improving its health monitoring criteria to better identify unhealthy nodes on an EMR cluster.
Considerations and best practices
The following are some of the key considerations and best practices for using EMR instance fleets to launch a high availability cluster with multiple primary nodes:
- Use the latest EMR release – With the latest EMR releases, you get the highest level of resiliency and stability for your high availability EMR clusters with multiple primary nodes.
- Configure subnets for high availability – Amazon EMR can’t replace a failed primary node if the subnet is oversubscribed (there aren’t any available private IP addresses in the subnet). This results in a cluster failure as soon as the second primary node fails. Limited availability of IP addresses in a subnet can also result in cluster launch or scaling failures. To avoid such scenarios, we recommend that you dedicate an entire subnet to an EMR cluster.
- Configure core nodes for enhanced data availability – To minimize the risk of local HDFS data loss on your production clusters, we recommend that you set the
dfs.replicationparameter to 3 and launch at least four core nodes. Settingdfs.replicationto 1 on clusters with fewer than four core nodes can lead to data loss if a single core node goes down. For clusters with three or fewer core nodes, setdfs.replicationparameter to at least 2 to achieve sufficient HDFS data replication. For more information, see HDFS configuration. - Use an allocation strategy – We recommend enabling an allocation strategy option for your instance fleet cluster to provide faster cluster provisioning, more accurate Spot Instance allocation, and fewer Spot Instance interruptions.
- Set alarms for monitoring primary nodes – You should monitor the health and status of primary nodes of your long-running clusters to maintain smooth operations. Configure alarms using CloudWatch metrics such as
MultiMasterInstanceGroupNodesRunning,MultiMasterInstanceGroupNodesRunningPercentage, orMultiMasterInstanceGroupNodesRequested. - Integrate with EC2 placement groups – You can also choose to protect primary instances against hardware failures by using a placement group strategy for your primary fleet. This will spread the three primary instances across separate underlying hardware to avoid loss of multiple primary nodes at the same time in the event of a hardware failure. See Amazon EMR integration with EC2 placement groups for more details.
When setting up a high availability instance fleet cluster with Amazon EMR on EC2, it’s important to understand that all EMR nodes, including the three primary nodes, are launched within a single Availability Zone. Although this configuration maintains high availability within that Availability Zone, it also means that the entire cluster can’t tolerate an Availability Zone outage. To mitigate the risk of cluster failures due to Spot Instance reclamation, Amazon EMR launches the primary nodes using On-Demand instances, providing an additional layer of reliability for these critical components of the cluster.
Conclusion
This post demonstrated how you can use high availability with EMR on EC2 instance fleets to enhance the resiliency and reliability of your big data workloads. By using instance fleets with multiple primary nodes, EMR clusters can withstand failures and maintain uninterrupted operations, while providing enhanced instance diversity and better Spot capacity management within a single Availability Zone. You can quickly set up these high availability clusters using the Amazon EMR console or AWS CloudFormation, and monitor their health using CloudWatch metrics.
To learn more about the supported applications and their failover process, see Supported applications in an Amazon EMR Cluster with multiple primary nodes. To get started with this feature and launch a high availability EMR on EC2 cluster, refer to Plan and configure primary nodes.
About the Authors
 Garima Arora is a Software Development Engineer for Amazon EMR at Amazon Web Services. She specializes in capacity optimization and helps build services that allow customers to run big data applications and petabyte-scale data analytics faster. When not hard at work, she enjoys reading fiction novels and watching anime.
 Ravi Kumar is a Senior Product Manager Technical-ES (PMT) at Amazon Web Services, specialized in building exabyte-scale data infrastructure and analytics platforms. With a passion for building innovative tools, he helps customers unlock valuable insights from their structured and unstructured data. Ravi’s expertise lies in creating robust data foundations using open-source technologies and advanced cloud computing, that powers advanced artificial intelligence and machine learning use cases. A recognized thought leader in the field, he advances the data and AI ecosystem through pioneering solutions and collaborative industry initiatives. As a strong advocate for customer-centric solutions, Ravi constantly seeks ways to simplify complex data challenges and enhance user experiences. Outside of work, Ravi is an avid technology enthusiast who enjoys exploring emerging trends in data science, cloud computing, and machine learning.
 Tarun Chanana is a Software Development Manager for Amazon EMR at Amazon Web Services.
Comic for 2024.11.21 – This Doesn’t Normally Happen
Post Syndicated from Explosm.net original https://explosm.net/comics/this-doesnt-normally-happen
New Cyanide and Happiness Comic