Southeast Asia (SEA) is a dynamic market, very different from other parts of the world. When travelling on the road, you may experience fast-changing road restrictions, new roads appearing overnight, and high traffic congestion. To address these challenges, GrabMaps has adapted to the SEA market by leveraging big data solutions. One of the solutions is the integration of hyperlocal data in GrabMaps.
Hyperlocal information is oriented around very small geographical communities and obtained from the local knowledge that our map team gathers. The map team is spread across SEA, enabling us to define clear specifications (e.g. legal speed limits), and validate that our solutions are viable.
Figure 1 – Map showing detections from images and probe data, and hyperlocal data.
Hyperlocal inputs make our mapping data even more robust, adding to the details collected from our image and probe detection pipelines. Figure 1 shows how data from our detection pipeline is overlaid with hyperlocal data, and then mapped across the SEA region. If you are curious and would like to check out the data yourself, you can download it here.
Processing hyperlocal data
Now let’s go through the process of detecting hyperlocal data.
Download data
GrabMaps is based on OpenStreetMap (OSM). The first step in the process is to download the .pbf file for Asia from geofabrick.de. This .pbf file contains all the data that is available on OSM, such as details of places, trees, and roads. Take for example a park, the .pbf file would contain data on the park name, wheelchair accessibility, and many more.
For this article, we will focus on hyperlocal data related to the road network. For each road, you can obtain data such as the type of road (residential or motorway), direction of traffic (one-way or more), and road name.
Convert data
To take advantage of big data computing, the next step in the process is to convert the .pbf file into Parquet format using a Parquetizer. This will convert the binary data in the .pbf file into a table format. Each road in SEA is now displayed as a row in a table as shown in Figure 2.
Figure 2 – Road data in Parquet format.
Identify hyperlocal data
After the data is prepared, GrabMaps then identifies and inputs all of our hyperlocal data, and delivers a consolidated view to our downstream services. Our hyperlocal data is obtained from various sources, either by looking at geometry, or other attributes in OSM such as the direction of travel and speed limit. We also apply customised rules defined by our local map team, all in a fully automated manner. This enhances the map together with data obtained from our rides and deliveries GPS pings and from KartaView, Grab’s product for imagery collection.
Figure 3 – Architecture diagram showing how hyperlocal data is integrated into GrabMaps.
Benefit of our hyperlocal GrabMaps
GrabNav, a turn-by-turn navigation tool available on the Grab driver app, is one of our products that benefits from having hyperlocal data. Here are some hyperlocal data that are made available through our approach:
Localisation of roads: The country, state/county, or city the road is in
Language spoken, driving side, and speed limit
Region-specific default speed regulations
Consistent name usage using language inference
Complex attributes like intersection links
To further explain the benefits of this hyperlocal feature, we will use intersection links as an example. In the next section, we will explain how intersection links data is used and how it impacts our driver-partners and passengers.
Identifying hyperlocal data – intersection links
An intersection link is when two or more roads meet. Figure 4 and 5 illustrates what an intersection link looks like in a GrabMaps mock and in OSM.
Figure 4 – Mock of an intersection link.
Figure 5 – Intersection link illustration from a real road network in OSM.
To locate intersection links in a road network, there are computations involved. We would first combine big data processing (which we do using Spark) with graphs. We use geohash as the unit of processing, and for each geohash, a bi-directional graph is created.
From such resulting graphs, we can determine intersection links if:
Road segments are parallel
The roads have the same name
The roads are one way roads
Angles and the shape of the road are in the intervals or requirements we seek
Each intersection link we identify is tagged in the map as intersection_links. Our downstream service teams can then identify them by searching for the tag.
Impact
The impact we create with our intersection link can be explained through the following example.
Figure 6 – Longer route, without GrabMaps intersection link feature. The arrow indicates where the route should have suggested a U-turn.
Figure 7 – Shorter route using GrabMaps by taking a closer link between two main roads.
Figure 6 and Figure 7 show two different routes for the same origin and destination. However, you can see that Figure 7 has a shorter route and this is made available by taking an intersection link early on in the route. The highlighted road segment in Figure 7 is an intersection link, tagged by the process we described earlier. The route is now much shorter making GrabNav more efficient in its route suggestion.
There are numerous factors that can impact a driver-partner’s trip, and intersection links are just one example. There are many more features that GrabMaps offers across Grab’s services that allow us to “outserve” our partners.
Conclusion
GrabMaps and GrabNav deliver enriched experiences to our driver-partners. By integrating certain hyperlocal data features, we are also able to provide more accurate pricing for both our driver-partners and passengers. In our mission towards sustainable growth, this is an area that we will keep on improving by leveraging scalable tech solutions.
Join us
Grab is the leading superapp platform in Southeast Asia, providing everyday services that matter to consumers. More than just a ride-hailing and food delivery app, Grab offers a wide range of on-demand services in the region, including mobility, food, package and grocery delivery services, mobile payments, and financial services across 428 cities in eight countries.
Powered by technology and driven by heart, our mission is to drive Southeast Asia forward by creating economic empowerment for everyone. If this mission speaks to you, join our team today!
by David Vroom, James Mulcahy, Ling Yuan, Rob Gulewich
In this post we discuss Netflix’s adoption of service mesh: some history, motivations, and how we worked with Kinvolk and the Envoy community on a feature that streamlines service mesh adoption in complex microservice environments: on-demand cluster discovery.
A brief history of IPC at Netflix
Netflix was early to the cloud, particularly for large-scale companies: we began the migration in 2008, and by 2010, Netflix streaming was fully run on AWS. Today we have a wealth of tools, both OSS and commercial, all designed for cloud-native environments. In 2010, however, nearly none of it existed: the CNCF wasn’t formed until 2015! Since there were no existing solutions available, we needed to build them ourselves.
For Inter-Process Communication (IPC) between services, we needed the rich feature set that a mid-tier load balancer typically provides. We also needed a solution that addressed the reality of working in the cloud: a highly dynamic environment where nodes are coming up and down, and services need to quickly react to changes and route around failures. To improve availability, we designed systems where components could fail separately and avoid single points of failure. These design principles led us to client-side load-balancing, and the 2012 Christmas Eve outage solidified this decision even further. During these early years in the cloud, we built Eureka for Service Discovery and Ribbon (internally known as NIWS) for IPC. Eureka solved the problem of how services discover what instances to talk to, and Ribbon provided the client-side logic for load-balancing, as well as many other resiliency features. These two technologies, alongside a host of other resiliency and chaos tools, made a massive difference: our reliability improved measurably as a result.
Eureka and Ribbon presented a simple but powerful interface, which made adopting them easy. In order for a service to talk to another, it needs to know two things: the name of the destination service, and whether or not the traffic should be secure. The abstractions that Eureka provides for this are Virtual IPs (VIPs) for insecure communication, and Secure VIPs (SVIPs) for secure. A service advertises a VIP name and port to Eureka (eg: myservice, port 8080), or an SVIP name and port (eg: myservice-secure, port 8443), or both. IPC clients are instantiated targeting that VIP or SVIP, and the Eureka client code handles the translation of that VIP to a set of IP and port pairs by fetching them from the Eureka server. The client can also optionally enable IPC features like retries or circuit breaking, or stick with a set of reasonable defaults.
In this architecture, service to service communication no longer goes through the single point of failure of a load balancer. The downside is that Eureka is a new single point of failure as the source of truth for what hosts are registered for VIPs. However, if Eureka goes down, services can continue to communicate with each other, though their host information will become stale over time as instances for a VIP come up and down. The ability to run in a degraded but available state during an outage is still a marked improvement over completely stopping traffic flow.
Why mesh?
The above architecture has served us well over the last decade, though changing business needs and evolving industry standards have added more complexity to our IPC ecosystem in a number of ways. First, we’ve grown the number of different IPC clients. Our internal IPC traffic is now a mix of plain REST, GraphQL, and gRPC. Second, we’ve moved from a Java-only environment to a Polyglot one: we now also support node.js, Python, and a variety of OSS and off the shelf software. Third, we’ve continued to add more functionality to our IPC clients: features such as adaptive concurrency limiting, circuit breaking, hedging, and fault injection have become standard tools that our engineers reach for to make our system more reliable. Compared to a decade ago, we now support more features, in more languages, in more clients. Keeping feature parity between all of these implementations and ensuring that they all behave the same way is challenging: what we want is a single, well-tested implementation of all of this functionality, so we can make changes and fix bugs in one place.
This is where service mesh comes in: we can centralize IPC features in a single implementation, and keep per-language clients as simple as possible: they only need to know how to talk to the local proxy. Envoy is a great fit for us as the proxy: it’s a battle-tested OSS product at use in high scale in the industry, with many critical resiliency features, and good extension points for when we need to extend its functionality. The ability to configure proxies via a central control plane is a killer feature: this allows us to dynamically configure client-side load balancing as if it was a central load balancer, but still avoids a load balancer as a single point of failure in the service to service request path.
Moving to mesh
Once we decided that moving to service mesh was the right bet to make, the next question became: how should we go about moving? We decided on a number of constraints for the migration. First: we wanted to keep the existing interface. The abstraction of specifying a VIP name plus secure serves us well, and we didn’t want to break backwards compatibility. Second: we wanted to automate the migration and to make it as seamless as possible. These two constraints meant that we needed to support the Discovery abstractions in Envoy, so that IPC clients could continue to use it under the hood. Fortunately, Envoy had ready to use abstractions for this. VIPs could be represented as Envoy Clusters, and proxies could fetch them from our control plane using the Cluster Discovery Service (CDS). The hosts in those clusters are represented as Envoy Endpoints, and could be fetched using the Endpoint Discovery Service (EDS).
We soon ran into a stumbling block to a seamless migration: Envoy requires that clusters be specified as part of the proxy’s config. If service A needs to talk to clusters B and C, then you need to define clusters B and C as part of A’s proxy config. This can be challenging at scale: any given service might communicate with dozens of clusters, and that set of clusters is different for every app. In addition, Netflix is always changing: we’re constantly adding new initiatives like live streaming, ads and games, and evolving our architecture. This means the clusters that a service communicates with will change over time. There are a number of different approaches to populating cluster config that we evaluated, given the Envoy primitives available to us:
Get service owners to define the clusters their service needs to talk to. This option seems simple, but in practice, service owners don’t always know, or want to know, what services they talk to. Services often import libraries provided by other teams that talk to multiple other services under the hood, or communicate with other operational services like telemetry and logging. This means that service owners would need to know how these auxiliary services and libraries are implemented under the hood, and adjust config when they change.
Auto-generate Envoy config based on a service’s call graph. This method is simple for pre-existing services, but is challenging when bringing up a new service or adding a new upstream cluster to communicate with.
Push all clusters to every app: this option was appealing in its simplicity, but back of the napkin math quickly showed us that pushing millions of endpoints to each proxy wasn’t feasible.
Given our goal of a seamless adoption, each of these options had significant enough downsides that we explored another option: what if we could fetch cluster information on-demand at runtime, rather than predefining it? At the time, the service mesh effort was still being bootstrapped, with only a few engineers working on it. We approached Kinvolk to see if they could work with us and the Envoy community in implementing this feature. The result of this collaboration was On-Demand Cluster Discovery (ODCDS). With this feature, proxies could now look up cluster information the first time they attempt to connect to it, rather than predefining all of the clusters in config.
With this capability in place, we needed to give the proxies cluster information to look up. We had already developed a service mesh control plane that implements the Envoy XDS services. We then needed to fetch service information from Eureka in order to return to the proxies. We represent Eureka VIPs and SVIPs as separate Envoy Cluster Discovery Service (CDS) clusters (so service myservice may have clusters myservice.vip and myservice.svip). Individual hosts in a cluster are represented as separate Endpoint Discovery Service (EDS) endpoints. This allows us to reuse the same Eureka abstractions, and IPC clients like Ribbon can move to mesh with minimal changes. With both the control plane and data plane changes in place, the flow works as follows:
Client request comes into Envoy
Extract the target cluster based on the Host / :authority header (the header used here is configurable, but this is our approach). If that cluster is known already, jump to step 7
The cluster doesn’t exist, so we pause the in flight request
Make a request to the Cluster Discovery Service (CDS) endpoint on the control plane. The control plane generates a customized CDS response based on the service’s configuration and Eureka registration information
Envoy gets back the cluster (CDS), which triggers a pull of the endpoints via Endpoint Discovery Service (EDS). Endpoints for the cluster are returned based on Eureka status information for that VIP or SVIP
Client request unpauses
Envoy handles the request as normal: it picks an endpoint using a load-balancing algorithm and issues the request
This flow is completed in a few milliseconds, but only on the first request to the cluster. Afterward, Envoy behaves as if the cluster was defined in the config. Critically, this system allows us to seamlessly migrate services to service mesh with no configuration required, satisfying one of our main adoption constraints. The abstraction we present continues to be VIP name plus secure, and we can migrate to mesh by configuring individual IPC clients to connect to the local proxy instead of the upstream app directly. We continue to use Eureka as the source of truth for VIPs and instance status, which allows us to support a heterogeneous environment of some apps on mesh and some not while we migrate. There’s an additional benefit: we can keep Envoy memory usage low by only fetching data for clusters that we’re actually communicating with.
There is a downside to fetching this data on-demand: this adds latency to the first request to a cluster. We have run into use-cases where services need very low-latency access on the first request, and adding a few extra milliseconds adds too much overhead. For these use-cases, the services need to either predefine the clusters they communicate with, or prime connections before their first request. We’ve also considered pre-pushing clusters from the control plane as proxies start up, based on historical request patterns. Overall, we feel the reduced complexity in the system justifies the downside for a small set of services.
We’re still early in our service mesh journey. Now that we’re using it in earnest, there are many more Envoy improvements that we’d love to work with the community on. The porting of our adaptive concurrency limiting implementation to Envoy was a great start — we’re looking forward to collaborating with the community on many more. We’re particularly interested in the community’s work on incremental EDS. EDS endpoints account for the largest volume of updates, and this puts undue pressure on both the control plane and Envoy.
We’d like to give a big thank-you to the folks at Kinvolk for their Envoy contributions: Alban Crequy, Andrew Randall, Danielle Tal, and in particular Krzesimir Nowak for his excellent work. We’d also like to thank the Envoy community for their support and razor-sharp reviews: Adi Peleg, Dmitri Dolguikh, Harvey Tuch, Matt Klein, and Mark Roth. It’s been a great experience working with you all on this.
This is the first in a series of posts on our journey to service mesh, so stay tuned. If this sounds like fun, and you want to work on service mesh at scale, come work with us — we’re hiring!
Amazon OpenSearch Serverless is a serverless deployment option for Amazon OpenSearch Service that makes it simple for you to run search and analytics workloads without having to think about infrastructure management. The compute capacity used for data ingestion, and search and query in OpenSearch Serverless is measured in OpenSearch Compute Units (OCUs). Customers can configure maximum OCU limits in their AWS account to control costs. In the past, customers had to monitor resource usage metrics to make sure that the collections did not deplete their configured storage and computational capacity. With the new AWS User Notification integration, you can configure the system to send notifications whenever the capacity threshold is breached. The User Notification feature eliminates the need to monitor the service constantly. AWS User Notifications enables users to centrally set up and view notifications from various AWS services across accounts and regions in a human-friendly format. Users can view notifications in a Console Notifications Center and also configure various delivery channels.
You can now use AWS User Notifications to set up delivery channels to get notified when resource usage is nearing or exceeding the capacity threshold. You receive a notification when an event matches a rule that you specify. There are multiple channels for receiving notifications, including email, AWS Chatbot chat notifications, and AWS Console Mobile Application push notifications. In this post, you will see how you can use AWS user notifications to receive notifications for OCU threshold breaches across all your OpenSearch Serverless collections.
Solution overview
OpenSearch Serverless allows you to receive OCU utilization notifications for both search and indexing in the two scenarios listed below. OCU utilization percent is calculated based on your configured maximum capacity limit and the current OCU consumption.
OCU Utilization Approaching Max Limit – OpenSearch Serverless sends this event through AWS User Notifications when current OCU usage percent reaches greater than or equal to 75 percent of the configured maximum OCU capacity.
OCU Utilization Reached Max Limit – OpenSearch Serverless sends this event when OCU usage percent reaches 100 percent of the configured maximum OCU capacity.
If you receive OCU utilization notification, you can adjust the maximum capacity limit for your collection using either the console or AWS CLI.
The following sections detail the steps you can take to receive both these OCU utilization notifications for all collections.
Prerequisites
As a prerequisite to receive OCU utilization notifications, you will set up notification configuration in notification hubs to store the notifications data. This has to be done only once, and at least one AWS region should be selected. The following screenshot shows a sample notification hub configuration for the US East (Ohio) AWS Region.
Choose Amazon OpenSearch Serverless for the service name and choose OCU Utilization Approaching Max Limit for the event type.
Click Add another event rule and choose OCU Utilization Reached Max Limit for the event type.
Using AWS User Notifications, you can receive the notifications as soon as they occur or receive them within 5 minutes to avoid receiving too many notifications all at once. We recommend receiving notifications every 5 minutes. Choose Receive within 5 minutes (recommended).
You can opt to receive notifications through many delivery channels like the AWS Console Mobile Application and chat channels like Slack. For this blog post, to keep it simple, you can add your email address as the delivery channel, as shown in the following image.
After you complete the configuration, your notification configurations page should look like the following screenshot.
Once the OCU consumption for any of your collections reaches greater than or equal to 75 percent of the configured maximum OCU capacity, you will get a notification to your configured email address within 5 minutes, as shown in the following image.
Once the OCU consumption reaches 100 percent of allocated OCU capacity for any of your collections, you will get a notification to your configured email address within 5 minutes, as shown in the following image.
You can also see notifications in the AWS User Notifications console, as shown in the following screenshots
Summary
You can use AWS User Notifications to get notifications from various AWS services in one place. Now with Amazon OpenSearch Serverless integration, you can receive OCU utilization notifications as well. In this post, we explored how to enable notifications for all Amazon OpenSearch Serverless collections and receive notifications using an email delivery channel. If you have any questions or suggestions, please write to us in the comments section.
About the Author
Raj Ramasubbu is a Senior Analytics Specialist Solutions Architect focused on big data and analytics and AI/ML with Amazon Web Services. He helps customers architect and build highly scalable, performant, and secure cloud-based solutions on AWS. Raj provided technical expertise and leadership in building data engineering, big data analytics, business intelligence, and data science solutions for over 18 years prior to joining AWS. He helped customers in various industry verticals like healthcare, medical devices, life science, retail, asset management, car insurance, residential REIT, agriculture, title insurance, supply chain, document management, and real estate.
Amazon Security Lake automatically centralizes the collection of security-related logs and events from integrated AWS and third-party services. With the increasing amount of security data available, it can be challenging knowing what data to focus on and which tools to use. You can use native AWS services such as Amazon QuickSight, Amazon OpenSearch, and Amazon SageMaker Studio to visualize, analyze, and interactively identify different areas of interest to focus on, and prioritize efforts to increase your AWS security posture.
In this post, we go over how to generate machine learning insights for Security Lake using SageMaker Studio. SageMaker Studio is a web integrated development environment (IDE) for machine learning that provides tools for data scientists to prepare, build, train, and deploy machine learning models. With this solution, you can quickly deploy a base set of Python notebooks focusing on AWS Security Hub findings in Security Lake, which can also be expanded to incorporate other AWS sources or custom data sources in Security Lake. After you’ve run the notebooks, you can use the results to help you identify and focus on areas of interest related to security within your AWS environment. As a result, you might implement additional guardrails or create custom detectors to alert on suspicious activity.
Prerequisites
Specify a delegated administrator account to manage the Security Lake configuration for all member accounts within your organization.
Security Lake has been enabled in the delegated administrator AWS account.
As part of the solution in this post, we focus on Security Hub as a data source. AWS Security Hub must be enabled for your AWS Organizations. When enabling Security Lake, select All log and event sources to include AWS Security Hub findings.
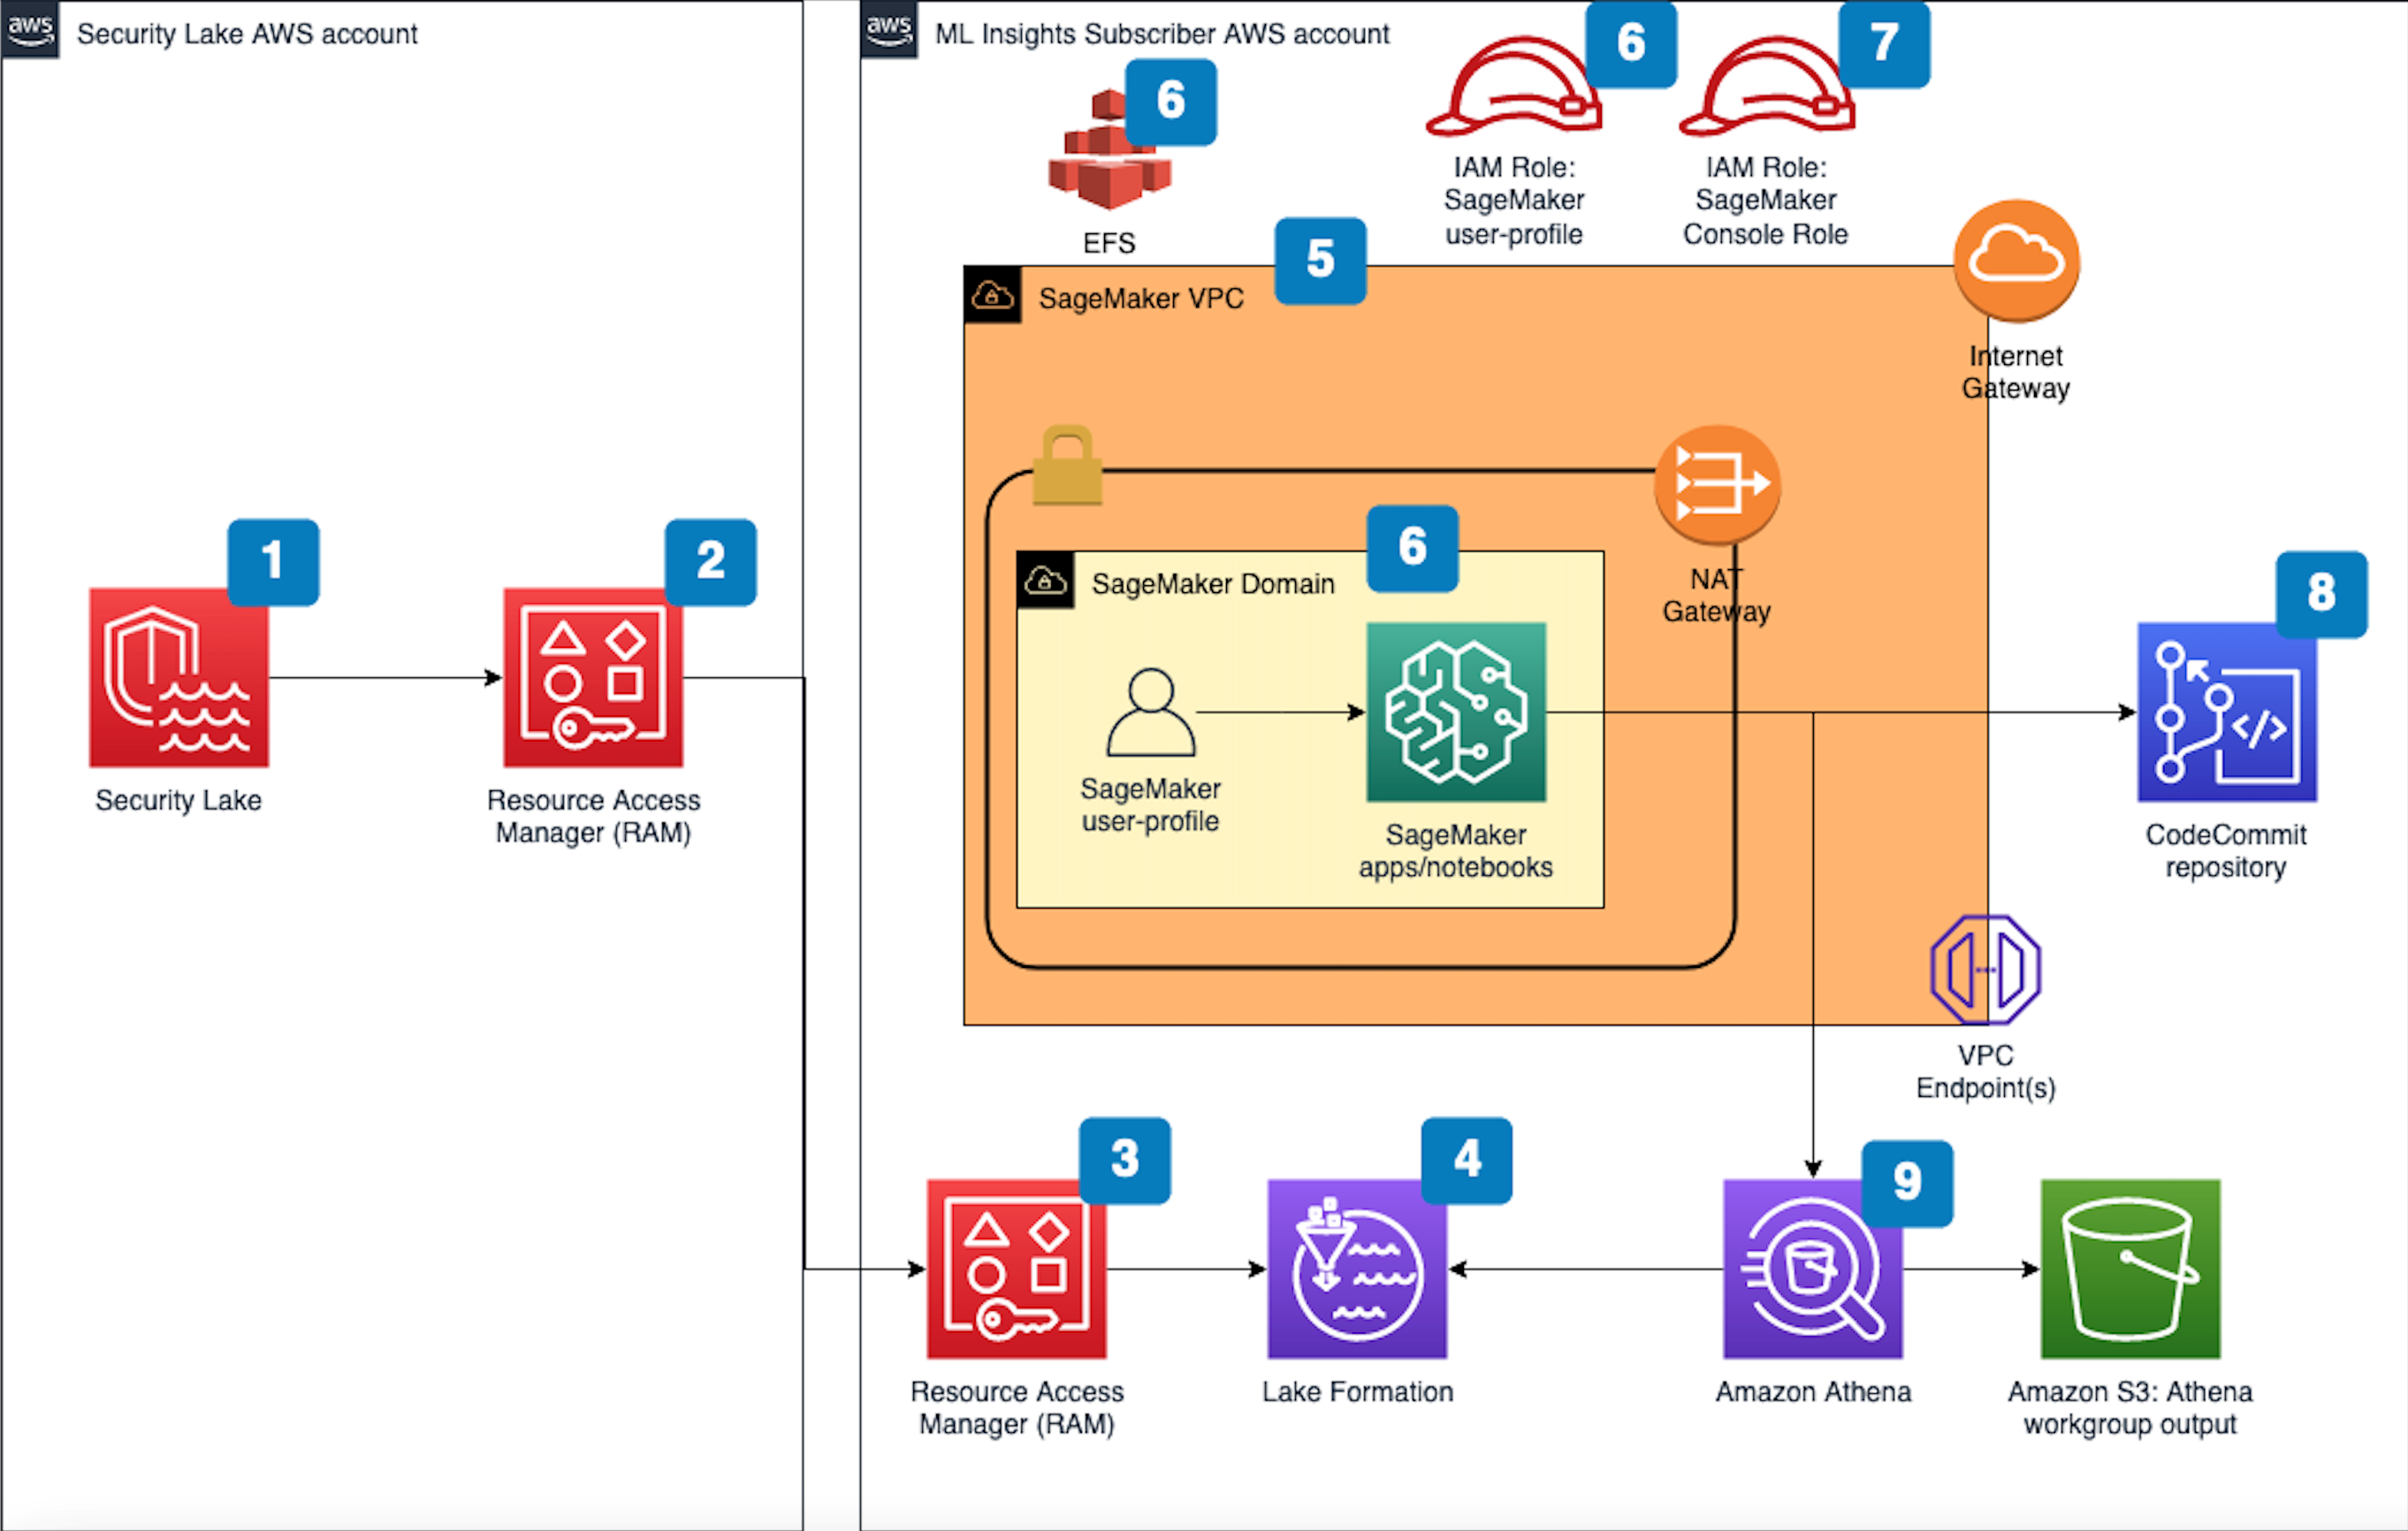
Figure 1 that follows depicts the architecture of the solution.
Figure 1 SageMaker machine learning insights architecture for Security Lake
The deployment builds the architecture by completing the following steps:
A Security Lake is set up in an AWS account with supported log sources — such as Amazon VPC Flow Logs, AWS Security Hub, AWS CloudTrail, and Amazon Route53 — configured.
Subscriber query access is created from the Security Lake AWS account to a subscriber AWS account.
Note: See Prerequisite #4 for more information.
The AWS RAM resource share request must be accepted in the subscriber AWS account where this solution is deployed.
Note: See Prerequisite #4 for more information.
A resource link database in Lake Formation is created in the subscriber AWS account and grants access for the Athena tables in the Security Lake AWS account.
VPC is provisioned for SageMaker with IGW, NAT GW, and VPC endpoints for the AWS services used in the solution. IGW and NAT are required to install external open-source packages.
A dedicated IAM role is created to restrict access to create and access the presigned URL for the SageMaker Domain from a specific CIDR for accessing the SageMaker notebook.
An AWS CodeCommit repository containing Python notebooks is used for the AI and ML workflow by the SageMaker user-profile.
An Athena workgroup is created for the Security Lake queries with an S3 bucket for output location (access logging configured for the output bucket).
Option 1: Deploy the solution with AWS CloudFormation using the console
Use the console to sign in to your subscriber AWS account and then choose the Launch Stack button to open the AWS CloudFormation console pre-loaded with the template for this solution. It takes approximately 10 minutes for the CloudFormation stack to complete.
Option 2: Deploy the solution by using the AWS CDK
To build the app when navigating to the project’s root folder, use the following commands:
npm install -g aws-cdk-lib
npm install
Update IAM_role_assumption_for_sagemaker_presigned_url and security_lake_aws_account default values in source/lib/sagemaker_domain.ts with their respective appropriate values.
Run the following commands in your terminal while authenticated in your subscriber AWS account. Be sure to replace <INSERT_AWS_ACCOUNT> with your account number and replace <INSERT_REGION> with the AWS Region that you want the solution deployed to.
Now that you’ve deployed the SageMaker solution, you must grant the SageMaker user profile in the subscriber AWS account query access to your Security Lake. You can Grant permission for the SageMaker user profile to Security Lake in Lake Formation in the subscriber AWS account.
Grant permission to the Security Lake database
Copy the SageMaker user-profile Amazon resource name (ARN) arn:aws:iam::<account-id>:role/sagemaker-user-profile-for-security-lake
Go to Lake Formation in the console.
Select the amazon_security_lake_glue_db_us_east_1 database.
From the Actions Dropdown, select Grant.
In GrantData Permissions, select SAML Users and Groups.
Paste the SageMaker user profile ARN from Step 1.
In Database Permissions, select Describe and then Grant.
Grant permission to Security Lake – Security Hub table
Copy the SageMaker user-profile ARN arn:aws:iam:<account-id>:role/sagemaker-user-profile-for-security-lake
Go to Lake Formation in the console.
Select the amazon_security_lake_glue_db_us_east_1 database.
Choose View Tables.
Select the amazon_security_lake_table_us_east_1_sh_findings_1_0 table.
From Actions Dropdown, select Grant.
In Grant Data Permissions, select SAML Users and Groups.
Paste the SageMaker user-profile ARN from Step 1.
In Table Permissions, select Describe and then Grant.
Launch your SageMaker Studio application
Now that you have granted permissions for a SageMaker user-profile, we can move on to launching the SageMaker application associated to that user-profile.
You’ll work primarily in the SageMaker user profile to create a data-science app to work in. As part of the solution deployment, we’ve created Python notebooks in CodeCommit that you will need to clone.
In the Stacks section, select the SageMakerDomainStack.
Select to the Outputs tab/
Copy the value for sagemakernotebookmlinsightsrepositoryURL. (For example: https://git-codecommit.us-east-1.amazonaws.com/v1/repos/sagemaker_ml_insights_repo)
Go back to your SageMaker app.
In Studio, in the left sidebar, choose the Git icon (identified by a diamond with two branches), then choose Clone a Repository.
Figure 3: SageMaker clone CodeCommit repository
Paste the CodeCommit repository link from Step 4 under the Git repository URL (git). After you paste the URL, select Clone “https://git-codecommit.us-east-1.amazonaws.com/v1/repos/sagemaker_ml_insights_repo”, then select Clone.
NOTE: If you don’t select from the auto-populated drop-down, SageMaker won’t be able to clone the repository.
Figure 4: SageMaker clone CodeCommit URL
Generating machine learning insights using SageMaker Studio
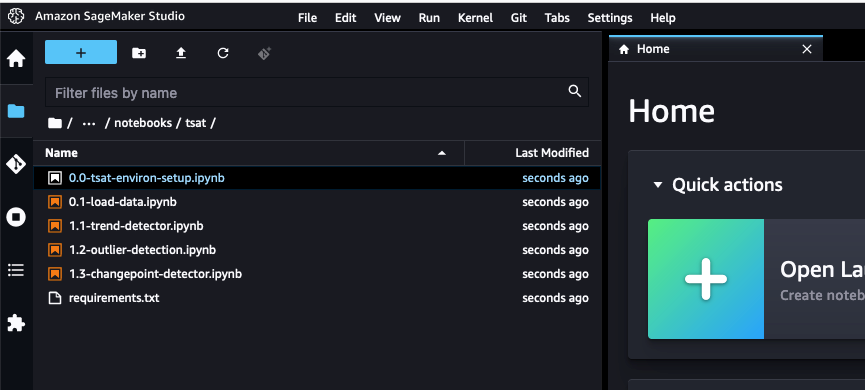
You’ve successfully pulled the base set of Python notebooks into your SageMaker app and they can be accessed at sagemaker_ml_insights_repo/notebooks/tsat/. The notebooks provide you with a starting point for running machine learning analysis using Security Lake data. These notebooks can be expanded to existing native or custom data sources being sent to Security Lake.
Figure 5: SageMaker cloned Python notebooks
Notebook #1 – Environment setup
The 0.0-tsat-environ-setup notebook handles the installation of the required libraries and dependencies needed for the subsequent notebooks within this blog. For our notebooks, we use an open-source Python library called Kats, which is a lightweight, generalizable framework to perform time series analysis.
Select the 0.0-tsat-environ-setup.ipynb notebook for the environment setup.
Note: If you have already provisioned a kernel, you can skip steps 2 and 3.
In the right-hand corner, select No Kernel
In the Set up notebook environment pop-up, leave the defaults and choose Select.
After the kernel has successfully started, choose the Terminal icon to open the image terminal.
Figure 7: SageMaker application terminal
To install open-source packages from https instead of http, you must update the sources.list file. After the terminal opens, send the following commands:
cd /etc/apt
sed -i 's/http:/https:/g' sources.list
Go back to the 0.0-tsat-environ-setup.ipynb notebook and select the Run drop-down and select Run All Cells. Alternatively, you can run each cell independently, but it’s not required. Grab a coffee! This step will take about 10 minutes.
IMPORTANT: If you complete the installation out of order or update the requirements.txt file, you might not be able to successfully install Kats and you will need to rebuild your environment by using a net-new SageMaker user profile.
After installing all the prerequisites, check the Kats version to determine if it was successfully installed.
Figure 8: Kats installation verification
Install PyAthena (Python DB API client for Amazon Athena) which is used to query your data in Security Lake.
You’ve successfully set up the SageMaker app environment! You can now load the appropriate dataset and create a time series.
Notebook #2 – Load data
The 0.1-load-data notebook establishes the Athena connection to query data in Security Lake and creates the resulting time series dataset. The time series dataset will be used for subsequent notebooks to identify trends, outliers, and change points.
Select the 0.1-load-data.ipynb notebook.
If you deployed the solution outside of us-east-1, update the con details to the appropriate Region. In this example, we’re focusing on Security Hub data within Security Lake. If you want to change the underlying data source, you can update the TABLE value.
Figure 9: SageMaker notebook load Security Lake data settings
In the Query section, there’s an Athena query to pull specific data from Security Hub, this can be expanded as needed to a subset or can include all products within Security Hub. The query below pulls Security Hub information after 01:00:00 1/1/2022 from the products listed in productname.
Figure 10: SageMaker notebook Athena query
After the values have been updated, you can create your time series dataset. For this notebook, we recommend running each cell individually instead of running all cells at once so you can get a bit more familiar with the process. Select the first cell and choose the Run icon.
Figure 11: SageMaker run Python notebook code
Follow the same process as Step 4 for the subsequent cells.
You’ve successfully loaded your data and created a timeseries! You can now move on to generating machine learning insights from your timeseries.
Notebook #3 – Trend detector
The 1.1-trend-detector.ipynb notebook handles trend detection in your data. Trend represents a directional change in the level of a time series. This directional change can be either upward (increase in level) or downward (decrease in level). Trend detection helps detect a change while ignoring the noise from natural variability. Each environment is different, and trends help us identify where to look more closely to determine why a trend is positive or negative.
Select 1.1-trend-detector.ipynb notebook for trend detection.
Slopes are created to identify the relationship between x (time) and y (counts).
Figure 12: SageMaker notebook slope view
If the counts are increasing with time, then it’s considered a positive slope and the reverse is considered a negative slope. A positive slope isn’t necessarily a good thing because in an ideal state we would expect counts of a finding type to come down with time.
Figure 13: SageMaker notebook trend view
Now you can plot the top five positive and negative trends to identify the top movers.
Figure 14: SageMaker notebook trend results view
Notebook #4 – Outlier detection
The 1.2-outlier-detection.ipynb notebook handles outlier detection. This notebook does a seasonal decomposition of the input time series, with additive or multiplicative decomposition as specified (default is additive). It uses a residual time series by either removing only trend or both trend and seasonality if the seasonality is strong. The intent is to discover useful, abnormal, and irregular patterns within data sets, allowing you to pinpoint areas of interest.
To start, it detects points in the residual that are over 5 times the inter-quartile range.
Inter-quartile range (IQR) is the difference between the seventy-fifth and twenty-fifth percentiles of residuals or the spread of data within the middle two quartiles of the entire dataset. IQR is useful in detecting the presence of outliers by looking at values that might lie outside of the middle two quartiles.
The IQR multiplier controls the sensitivity of the range and decision of identifying outliers. By using a larger value for the iqr_mult_thresh parameter in OutlierDetector, outliers would be considered data points, while a smaller value would identify data points as outliers.
Note: If you don’t have enough data, decrease iqr_mult_thresh to a lower value (for example iqr_mult_thresh=3).
Figure 15: SageMaker notebook outlier setting
Along with outlier detection plots, investigation SQL will be displayed as well, which can help with further investigation of the outliers.
In the diagram that follows, you can see that there are several outliers in the number of findings, related to failed AWS Firewall Manager policies, which have been identified by the vertical red lines within the line graph. These are outliers because they deviate from the normal behavior and number of findings on a day-to-day basis. When you see outliers, you can look at the resources that might have caused an unusual increase in Firewall Manager policy findings. Depending on the findings, it could be related to an overly permissive or noncompliant security group or a misconfigured AWS WAF rule group.
The 1.3-changepoint-detector.ipynb notebook handles the change point detection. Change point detection is a method to detect changes in a time series that persist over time, such as a change in the mean value. To detect a baseline to identify when several changes might have occurred from that point. Change points occur when there’s an increase or decrease to the average number of findings within a data set.
Along with identifying change points within the data set, the investigation SQL is generated to further investigate the specific change point if applicable.
In the following diagram, you can see there’s a change point decrease after July 27, 2022, with confidence of 99.9 percent. It’s important to note that change points differ from outliers, which are sudden changes in the data set observed. This diagram means there was some change in the environment that resulted in an overall decrease in the number of findings for S3 buckets with block public access being disabled. The change could be the result of an update to the CI/CD pipelines provisioning S3 buckets or automation to enable all S3 buckets to block public access. Conversely, if you saw a change point that resulted in an increase, it could mean that there was a change that resulted in a larger number of S3 buckets with a block public access configuration consistently being disabled.
Figure 17: SageMaker changepoint detector view
By now, you should be familiar with the set up and deployment for SageMaker Studio and how you can use Python notebooks to generate machine learning insights for your Security Lake data. You can take what you’ve learned and start to curate specific datasets and data sources within Security Lake, create a time series, detect trends, and identify outliers and change points. By doing so, you can answer a variety of security-related questions such as:
CloudTrail
Is there a large volume of Amazon S3 download or copy commands to an external resource? Are you seeing a large volume of S3 delete object commands? Is it possible there’s a ransomware event going on?
VPC Flow Logs
Is there an increase in the number of requests from your VPC to external IPs? Is there an increase in the number of requests from your VPC to your on-premises CIDR? Is there a possibility of internal or external data exfiltration occurring?
Route53
Which resources are making DNS requests that they haven’t typically made within the last 30–45 days? When did it start? Is there a potential command and control session occurring on an Amazon Elastic Compute Cloud (Amazon EC2) instance?
It’s important to note that this isn’t a solution to replace Amazon GuardDuty, which uses foundational data sources to detect communication with known malicious domains and IP addresses and identify anomalous behavior, or Amazon Detective, which provides customers with prebuilt data aggregations, summaries, and visualizations to help security teams conduct faster and more effective investigations. One of the main benefits of using Security Lake and SageMaker Studio is the ability to interactively create and tailor machine learning insights specific to your AWS environment and workloads.
Clean up
If you deployed the SageMaker machine learning insights solution by using the Launch Stack button in the AWS Management Console or the CloudFormation template sagemaker_ml_insights_cfn, do the following to clean up:
In the CloudFormation console for the account and Region where you deployed the solution, choose the SageMakerML stack.
Choose the option to Delete the stack.
If you deployed the solution by using the AWS CDK, run the command cdk destroy.
Conclusion
Amazon Security Lake gives you the ability to normalize and centrally store your security data from various log sources to help you analyze, visualize, and correlate appropriate security logs. You can then use this data to increase your overall security posture by implementing additional security guardrails or take appropriate remediation actions within your AWS environment.
In this blog post, you learned how you can use SageMaker to generate machine learning insights for your Security Hub findings in Security Lake. Although the example solution focuses on a single data source within Security Lake, you can expand the notebooks to incorporate other native or custom data sources in Security Lake.
There are many different use-cases for Security Lake that can be tailored to fit your AWS environment. Take a look at this blog post to learn how you can ingest, transform and deliver Security Lake data to Amazon OpenSearch to help your security operations team quickly analyze security data within your AWS environment. In supported Regions, new Security Lake account holders can try the service free for 15 days and gain access to its features.
If you have feedback about this post, submit comments in the Comments section below. If you have questions about this post, contact AWS Support.
Want more AWS Security news? Follow us on Twitter.
This post is written by Islam Elhamaky, Senior Solutions Architect and Adrian Tadros, Senior Solutions Architect.
Amazon S3 is a cloud storage service that many customers use for secure file storage. S3 offers a feature called presigned URLs to generate temporary download links, which are effective and secure way to upload and download data to authorized users.
There are times when customers need more control over how data is accessed. For example, they may want to limit downloads based on IAM roles instead of presigned URLs, or limit the number of downloads per object to control data access costs. Additionally, it can be useful to track individuals access those download URLs.
This blog post presents an example application that can provide this extra functionality, using AWS serverless services.
Overview
The code included in this example uses a variety of serverless services:
AWS Step Functions coordinates file sharing and downloading activities such as user validation, checking download eligibility, recording events, request routing, and response formatting.
AWS Lambda implements admin activities such as retrieving metadata, listing files and deletion.
Amazon DynamoDB stores permissions to ensure users only have access to files that have been shared with them.
Amazon S3 provides durable storage for users to upload and download files.
User Interface: The front end is a static React single page application hosted on S3 and served via Amazon CloudFront. The UI uses AWS NorthStar and Cloudscape design components. Amplify UI simplifies interactions with Amazon Cognito such as providing the ability to log in, sign up, and perform email verification.
API Gateway: Users interact via an API Gateway REST API.
Authentication: Amazon Cognito manages user identities and access. Users sign up using their email address and then verify their email address. Requests to the API include an access token, which is verified using a Amazon Cognito authorizer.
Microservices: The core operations are built with Lambda. The primary workflows allow users to share and download files and Step Functions orchestrates multiple steps in the process. These can include validating requests, authorizing that users have the correct permissions to access files, sending notifications, auditing, and keeping tracking of who is accessing files.
Permission store: DynamoDB stores essential information about files such as ownership details and permissions for sharing. It tracks who owns a file and who has been granted access to download it.
File store: An S3 bucket is the central file repository. Each user has a dedicated folder within the S3 bucket to store files.
Notifications: The solution uses Amazon Simple Notification Service (SNS) to send email notifications to recipients when a file is shared.
Analytics:S3 Access Logs are generated whenever users download or upload files to the file storage bucket. Amazon Athena filters these logs to generate a download report, extracting key information (such as the identity of the users who downloaded files and the total bandwidth consumed during the downloads).
Reporting: Amazon QuickSight provides an interface for administrators to view download reports and dashboards.
An AWS account and a profile set up on your computer.
Follow the instructions in the code repository to deploy the example to your AWS account. Once the application is deployed, you can access the user interface.
In this example, you walk through the steps to create upload a file and share it with a recipient:
The example requires users to identify themselves using an email address. Choose Create Account then Sign In with your credentials.
Select Share a file.
Select Choose file to browse and select file to share. Choose Next.
You must populate at least one recipient. Choose Add recipient to add more recipients. Choose Next.
Set Expire date and Limit downloads to configure share expiry date and limit the number of allowed downloads. Choose Next.
Review the share request details. You can navigate to previous screens to modify. Choose Submit once done.
Choose My files to view your shared file.
Extending the solution
The example uses Step Functions to allow you to extend and customize the workflows. This implements a default workflow, providing you with the ability to override logic or introduce new steps to meet your requirements.
This section walks through the default behavior of the Share File and Download File Step Functions workflows.
The Share File workflow
The share file workflow consists of the following steps:
Validate: check that the share request contains all mandatory fields.
Get User Info: retrieve the logged in user’s information such as name and email address from Amazon Cognito.
Authorize: check the permissions stored in DynamoDB to verify if the user owns the file and has permission to share the file.
Audit: record the share attempt for auditing purposes.
Process: update the permission store in DynamoDB.
Send notifications: send email notifications to recipients to let them know that a new file has been shared with them.
The Download File workflow
The download file workflow consists of the following steps:
Validate: check that the download request contains the required fields (for example, user ID and file ID).
Get user info: retrieve the user’s information from Amazon Cognito such as their name and email address.
Authorize: check the permissions store in DynamoDB to check if the user owns the file or is valid recipient with permissions to download the file.
Audit: record the download attempt.
Process: generate a short-lived S3 pre-signed download URL and return to the user.
Step Functions API data mapping
The example uses API Gateway request and response data mappings to allow the REST API to communicate directly with Step Functions. This section shows how to customize the mapping based on your use case.
Request data mapping
The API Gateway REST API uses Apache VTL templates to transform and construct requests to the underlying service. This solution abstracts the construction of these templates using a CDK construct:
The StepFunctionApiIntegration construct handles the request mapping allowing you to extract fields from the incoming API request and pass these as inputs to a Step Functions workflow. This generates the following VTL template:
In this scenario, fields are extracted from the API request parameters, body, and authorization header and passed to the workflow. You can customize the configuration to meet your requirements.
Response data mapping
The example has response mapping templates using Apache VTL. The output of the last step in a workflow is mapped as a JSON response and returned to the user through API Gateway. The response also includes CORS headers:
You can customize this response template to meet your requirements. For example, you may provide custom behavior for different response codes.
Conclusion
In this blog post, you learn how you can securely share files with authorized external parties and track their access using AWS serverless services. The sample application presented uses Step Functions to allow you to extend and customize the workflows to meet your use case requirements.
To learn more about the concepts discussed, visit:
If you do any kind of video streaming, encoding and storing your data is one of your main challenges. Encoding videos in various formats and resolutions for different devices and platforms can be a resource-intensive task, and setting up and maintaining on-premises encoding infrastructure can be expensive.
Today, we’re excited to announce an expanded partnership with Qencode, a media services platform that enables users to build powerful video solutions, including solutions to the challenges of transcoding, live streaming, and media storage. The expanded partnership embeds the Backblaze Partner API within the Qencode platform, making it frictionless for users to add cloud storage to their media production workflows.
What Is Qencode?
Qencode is a media services platform founded in 2017 that assists with digital video transformation. The Qencode API provides developers within the over-the-top (OTT), broadcasting, and media & entertainment sectors with scalable and robust APIs for:
Video transcoding
Live streaming
Content delivery
Media storage
Artificial intelligence
Qencode + Backblaze
Recognizing the growing demand for integrated and efficient cloud storage within media production, Qencode and Backblaze built an alliance which creates a new paradigm for cutting-edge video APIs fortified by a reliable and efficient cloud storage solution. This integration empowers flexible workflows consisting of uploading, transcoding, storing, and delivering video content for media and OTT companies of all sizes. By integrating the platforms, this partnership provides top-tier features while simplifying the complexities and reducing the risks often associated with innovation.
We want to set new standards for value in an industry that is fragmented and complex. By merging Qencode’s advanced video processing capabilities with Backblaze’s reliable cloud storage, we’re addressing a critical industry need for seamless integration and efficiency. Integrating Backblaze’s Partner API takes our platform to the next level, providing users with a single, streamlined interface for all their video and media needs.
Murad Mordukhay, CEO of Qencode
Qencode + Backblaze Use Cases
The easy-to-use interface and affordability make Qencode an ideal choice for businesses who need video processing at scale without compromising spend or flexibility. Qencode enables businesses of all sizes to customize and control a complete end-to-end solution, from sign-on to billing, which includes seamless access to Backblaze storage through the Qencode software as a service (SaaS) platform.
Simplifying the User Experience
Expanding this partnership with Qencode takes our API technology a step further in making cloud storage more accessible to businesses whose mission is to simplify user experience. We are excited to work with a specialist like Qencode to bring a simple and low cost storage solution to businesses who need it the most.
At AWS, we often hear from customers that they want expanded security coverage for the multiple services that they use on AWS. However, alert fatigue is a common challenge that customers face as we introduce new security protections. The challenge becomes how to operationalize, identify, and prioritize alerts that represent real risk.
In this post, we highlight recent enhancements to Amazon Detective finding groups visualizations. We show you how Detective automatically consolidates multiple security findings into a single security event—called finding groups—and how finding group visualizations help reduce noise and prioritize findings that present true risk. We incorporate additional services like Amazon GuardDuty, Amazon Inspector, and AWS Security Hub to highlight how effective findings groups is at consolidating findings for different AWS security services.
Overview of solution
This post uses several different services. The purpose is twofold: to show how you can enable these services for broader protection, and to show how Detective can help you investigate findings from multiple services without spending a lot of time sifting through logs or querying multiple data sources to find the root cause of a security event. These are the services and their use cases:
GuardDuty – a threat detection service that continuously monitors your AWS accounts and workloads for malicious activity. If potential malicious activity, such as anomalous behavior, credential exfiltration, or command and control (C2) infrastructure communication is detected, GuardDuty generates detailed security findings that you can use for visibility and remediation. Recently, GuardDuty released the following threat detections for specific services that we’ll show you how to enable for this walkthrough: GuardDuty RDS Protection, EKS Runtime Monitoring, and Lambda Protection.
Amazon Inspector – an automated vulnerability management service that continually scans your AWS workloads for software vulnerabilities and unintended network exposure. Like GuardDuty, Amazon Inspector sends a finding for alerting and remediation when it detects a software vulnerability or a compute instance that’s publicly available.
Security Hub – a cloud security posture management service that performs automated, continuous security best practice checks against your AWS resources to help you identify misconfigurations, and aggregates your security findings from integrated AWS security services.
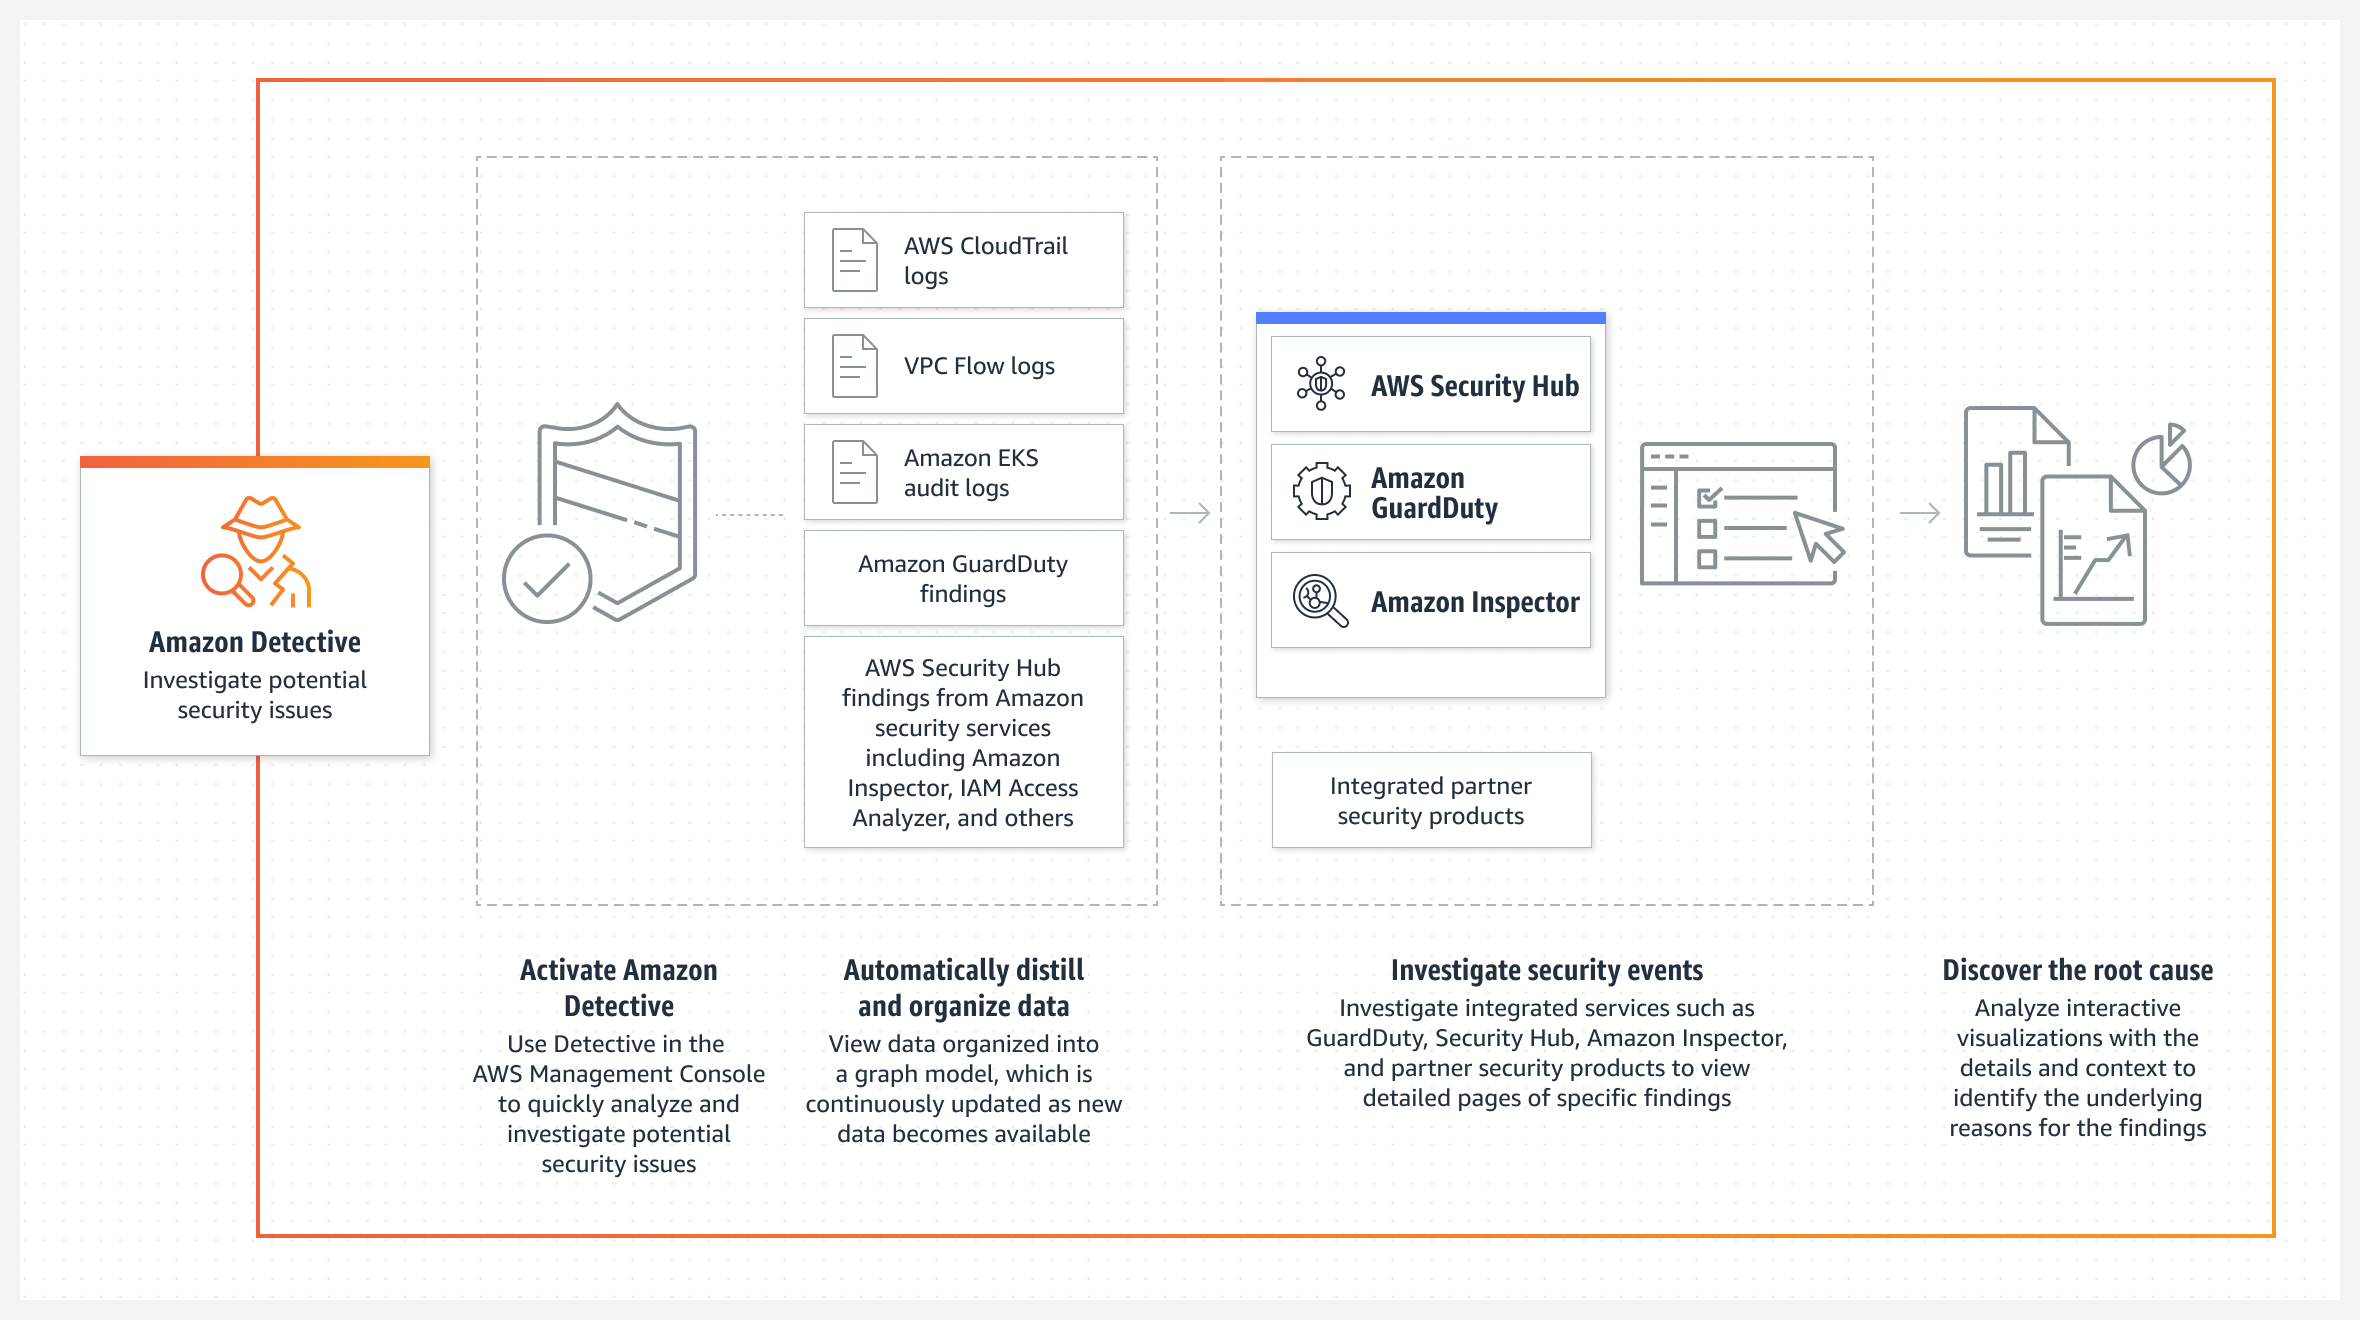
Detective – a security service that helps you investigate potential security issues. It does this by collecting log data from AWS CloudTrail, Amazon Virtual Private Cloud (Amazon VPC) flow logs, and other services. Detective then uses machine learning, statistical analysis, and graph theory to build a linked set of data called a security behavior graph that you can use to conduct faster and more efficient security investigations.
The following diagram shows how each service delivers findings along with log sources to Detective.
Figure 1: Amazon Detective log source diagram
Enable the required services
If you’ve already enabled the services needed for this post—GuardDuty, Amazon Inspector, Security Hub, and Detective—skip to the next section. For instructions on how to enable these services, see the following resources:
Each of these services offers a free 30-day trial and provides estimates on charges after your trial expires. You can also use the AWS Pricing Calculator to get an estimate.
To enable the services across multiple accounts, consider using a delegated administrator account in AWS Organizations. With a delegated administrator account, you can automatically enable services for multiple accounts and manage settings for each account in your organization. You can view other accounts in the organization and add them as member accounts, making central management simpler. For instructions on how to enable the services with AWS Organizations, see the following resources:
The next step is to enable the latest detections in GuardDuty and learn how Detective can identify multiple threats that are related to a single security event.
If you’ve already enabled the different GuardDuty protection plans, skip to the next section. If you recently enabled GuardDuty, the protections plans are enabled by default, except for EKS Runtime Monitoring, which is a two-step process.
For the next steps, we use the delegated administrator account in GuardDuty to make sure that the protection plans are enabled for each AWS account. When you use GuardDuty (or Security Hub, Detective, and Inspector) with AWS Organizations, you can designate an account to be the delegated administrator. This is helpful so that you can configure these security services for multiple accounts at the same time. For instructions on how to enable a delegated administrator account for GuardDuty, see Managing GuardDuty accounts with AWS Organizations.
To enable EKS Protection
Sign in to the GuardDuty console using the delegated administrator account, choose Protection plans, and then choose EKS Protection.
In the Delegated administrator section, choose Edit and then choose Enable for each scope or protection. For this post, select EKS Audit Log Monitoring, EKS Runtime Monitoring, and Manage agent automatically, as shown in Figure 2. For more information on each feature, see the following resources:
To enable these protections for current accounts, in the Active member accounts section, choose Edit and Enable for each scope of protection.
To enable these protections for new accounts, in the New account default configuration section, choose Edit and Enable for each scope of protection.
To enable RDS Protection
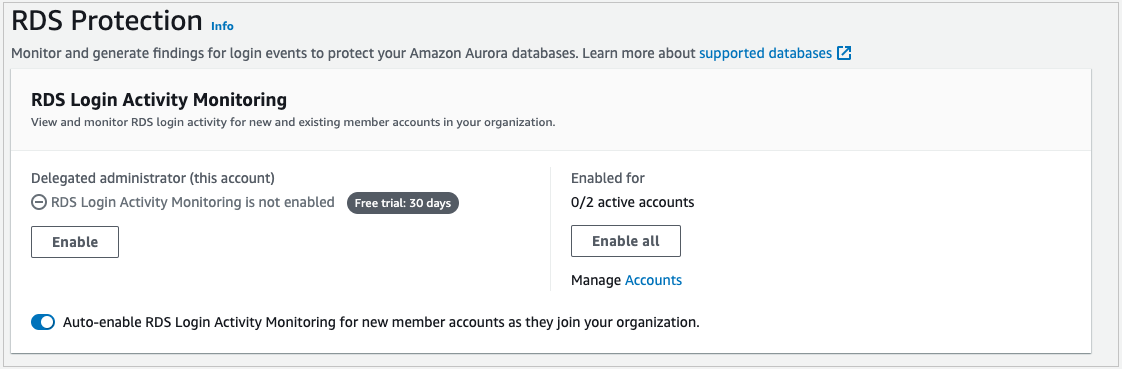
The next step is to enable RDS Protection. GuardDuty RDS Protection works by analysing RDS login activity for potential threats to your Amazon Aurora databases (MySQL-Compatible Edition and Aurora PostgreSQL-Compatible Editions). Using this feature, you can identify potentially suspicious login behavior and then use Detective to investigate CloudTrail logs, VPC flow logs, and other useful information around those events.
Navigate to the RDS Protection menu and under Delegated administrator (this account), select Enable and Confirm.
In the Enabled for section, select Enable all if you want RDS Protection enabled on all of your accounts. If you want to select a specific account, choose Manage Accounts and then select the accounts for which you want to enable RDS Protection. With the accounts selected, choose Edit Protection Plans, RDS Login Activity, and Enable for X selected account.
(Optional) For new accounts, turn on Auto-enable RDS Login Activity Monitoring for new member accounts as they join your organization.
Figure 2: Enable EKS Runtime Monitoring
To enable Lambda Protection
The final step is to enable Lambda Protection. Lambda Protection helps detect potential security threats during the invocation of AWS Lambda functions. By monitoring network activity logs, GuardDuty can generate findings when Lambda functions are involved with malicious activity, such as communicating with command and control servers.
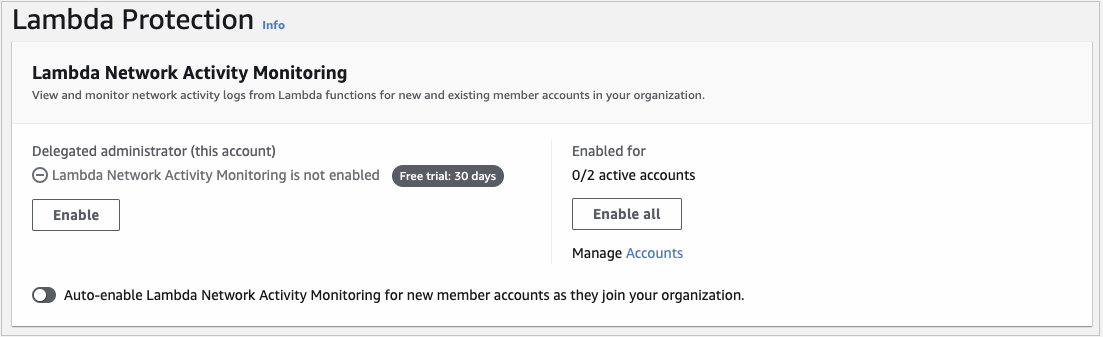
Navigate to the Lambda Protection menu and under Delegated administrator (this account), select Enable and Confirm.
In the Enabled for section, select Enable all if you want Lambda Protection enabled on all of your accounts. If you want to select a specific account, choose Manage Accounts and select the accounts for which you want to enable RDS Protection. With the accounts selected, choose Edit Protection Plans, Lambda Network Activity Monitoring, and Enable for X selected account.
(Optional) For new accounts, turn on Auto-enable Lambda Network Activity Monitoring for new member accounts as they join your organization.
Now that you’ve enabled these new protections, GuardDuty will start monitoring EKS audit logs, EKS runtime activity, RDS login activity, and Lambda network activity. If GuardDuty detects suspicious or malicious activity for these log sources or services, it will generate a finding for the activity, which you can review in the GuardDuty console. In addition, you can automatically forward these findings to Security Hub for consolidation, and to Detective for security investigation.
Detective data sources
If you have Security Hub and other AWS security services such as GuardDuty or Amazon Inspector enabled, findings from these services are forwarded to Security Hub. With the exception of sensitive data findings from Amazon Macie, you’re automatically opted in to other AWS service integrations when you enable Security Hub. For the full list of services that forward findings to Security Hub, see Available AWS service integrations.
With each service enabled and forwarding findings to Security Hub, the next step is to enable the data source in Detective called AWS security findings, which are the findings forwarded to Security Hub. Again, we’re going to use the delegated administrator account for these steps to make sure that AWS security findings are being ingested for your accounts.
To enable AWS security findings
Sign in to the Detective console using the delegated administrator account and navigate to Settings and then General.
Choose Optional source packages, Edit, select AWS security findings, and then choose Save.
Figure 5: Enable AWS security findings
When you enable Detective, it immediately starts creating a security behavior graph for AWS security findings to build a linked dataset between findings and entities, such as RDS login activity from Aurora databases, EKS runtime activity, and suspicious network activity for Lambda functions. For GuardDuty to detect potential threats that affect your database instances, it first needs to undertake a learning period of up to two weeks to establish a baseline of normal behavior. For more information, see How RDS Protection uses RDS login activity monitoring. For the other protections, after suspicious activity is detected, you can start to see findings in both GuardDuty and Security Hub consoles. This is where you can start using Detective to better understand which findings are connected and where to prioritize your investigations.
Detective behavior graph
As Detective ingests data from GuardDuty, Amazon Inspector, and Security Hub, as well as CloudTrail logs, VPC flow logs, and Amazon Elastic Kubernetes Service (Amazon EKS) audit logs, it builds a behavior graph database. Graph databases are purpose-built to store and navigate relationships. Relationships are first-class citizens in graph databases, which means that they’re not computed out-of-band or by interfering with relationships through querying foreign keys. Because Detective stores information on relationships in your graph database, you can effectively answer questions such as “are these security findings related?”. In Detective, you can use the search menu and profile panels to view these connections, but a quicker way to see this information is by using finding groups visualizations.
Finding groups visualizations
Finding groups extract additional information out of the behavior graph to highlight findings that are highly connected. Detective does this by running several machine learning algorithms across your behavior graph to identify related findings and then statically weighs the relationships between those findings and entities. The result is a finding group that shows GuardDuty and Amazon Inspector findings that are connected, along with entities like Amazon Elastic Compute Cloud (Amazon EC2) instances, AWS accounts, and AWS Identity and Access Management (IAM) roles and sessions that were impacted by these findings. With finding groups, you can more quickly understand the relationships between multiple findings and their causes because you don’t need to connect the dots on your own. Detective automatically does this and presents a visualization so that you can see the relationships between various entities and findings.
Enhanced visualizations
Recently, we released several enhancements to finding groups visualizations to aid your understanding of security connections and root causes. These enhancements include:
Dynamic legend – the legend now shows icons for entities that you have in the finding group instead of showing all available entities. This helps reduce noise to only those entities that are relevant to your investigation.
Aggregated evidence and finding icons – these icons provide a count of similar evidence and findings. Instead of seeing the same finding or evidence repeated multiple times, you’ll see one icon with a counter to help reduce noise.
More descriptive side panel information – when you choose a finding or entity, the side panel shows additional information, such as the service that identified the finding and the finding title, in addition to the finding type, to help you understand the action that invoked the finding.
Label titles – you can now turn on or off titles for entities and findings in the visualization so that you don’t have to choose each to get a summary of what the different icons mean.
To use the finding groups visualization
Open the Detective console, choose Summary, and then choose View all finding groups.
Choose the title of an available finding group and scroll down to Visualization.
Under the Select layout menu, choose one of the layouts available, or choose and drag each icon to rearrange the layout according to how you’d like to see connections.
For a complete list of involved entities and involved findings, scroll down below the visualization.
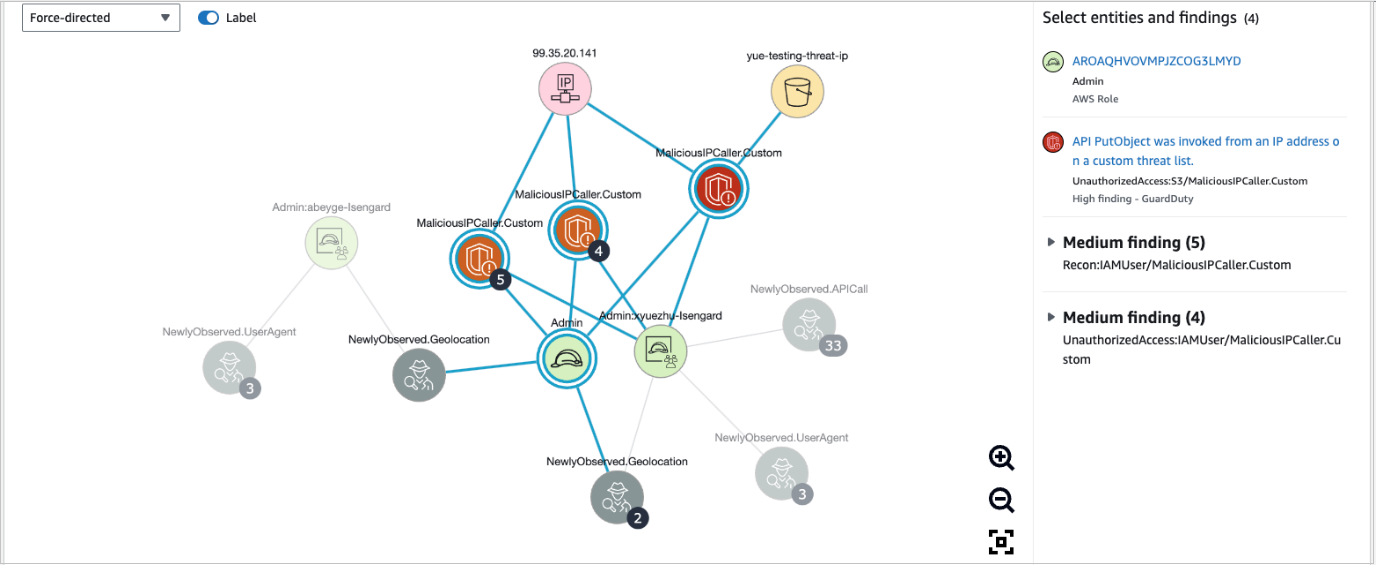
Figure 6 shows an example of how you can use finding groups visualization to help identify the root cause of findings quickly. In this example, an IAM role was connected to newly observed geolocations, multiple GuardDuty findings detected malicious API calls, and there were newly observed user agents from the IAM session. The visualization can give you high confidence that the IAM role is compromised. It also provides other entities that you can search against, such as the IP address, S3 bucket, or new user agents.
Figure 6: Finding groups visualization
Now that you have the new GuardDuty protections enabled along with the data source of AWS security findings, you can use finding groups to more quickly visualize which IAM sessions have had multiple findings associated with unauthorized access, or which EC2 instances are publicly exposed with a software vulnerability and active GuardDuty finding—these patterns can help you determine if there is an actual risk.
Conclusion
In this blog post, you learned how to enable new GuardDuty protections and use Detective, finding groups, and visualizations to better identify, operationalize, and prioritize AWS security findings that represent real risk. We also highlighted the new enhancements to visualizations that can help reduce noise and provide summaries of detailed information to help reduce the time it takes to triage findings. If you’d like to see an investigation scenario using Detective, watch the video Amazon Detective Security Scenario Investigation.
“Sugar” is, to a certain extent, in the eye of the beholder—at least when
it comes to syntax. Programming languages are often made up of a (mostly)
irreducible core, with lots of sugary constructs sprinkled on top—the syntactic sugar. No one
wants to be forced to do without the extra syntax—at least not for their
favorite pieces—but it is worth looking at how a language’s constructs can
be built from the core. That is just what Brett Cannon has been doing for
Python, on his blog and in talks,
including a talk at PyCon back in April (YouTube video).
Security updates have been issued by Debian (flask-security and opendmarc), Fedora (qemu), Oracle (rust and rust-toolset:ol8), Red Hat (cups and libxml2), Scientific Linux (cups), SUSE (ca-certificates-mozilla, chromium, clamav, freetype2, haproxy, nodejs12, procps, and vim), and Ubuntu (faad2, json-c, libqb, linux, linux-aws, linux-lts-xenial, linux-gcp-5.15, linux-gke, linux-gke-5.15, linux-gkeop, linux-gkeop-5.15, and linux-gke, linux-ibm-5.4).
Tyler Starks, Christiaan Beek, Robert Knapp, Zach Dayton, and Caitlin Condon contributed to this blog.
Rapid7’s managed detection and response (MDR) teams have observed increased threat activity targeting Cisco ASA SSL VPN appliances (physical and virtual) dating back to at least March 2023. In some cases, adversaries have conducted credential stuffing attacks that leveraged weak or default passwords; in others, the activity we’ve observed appears to be the result of targeted brute-force attacks on ASA appliances where multi-factor authentication (MFA) was either not enabled or was not enforced for all users (i.e., via MFA bypass groups). Several incidents our managed services teams have responded to ended in ransomware deployment by the Akira and LockBit groups.
There is no clear pattern among target organizations or verticals. Victim organizations varied in size and spanned healthcare, professional services, manufacturing, and oil and gas, along with other verticals. We have included indicators of compromise (IOCs) and attacker behavior observations in this blog, along with practical recommendations to help organizations strengthen their security posture against future attacks. Note: Rapid7 has not observed any bypasses or evasion of correctly configured MFA.
Rapid7 has been actively working with Cisco over the course of our investigations. On August 24, Cisco’s Product Security Incident Response Team (PSIRT) published a blog outlining attack tactics they have observed, many of which overlap with Rapid7’s observations. We thank Cisco for their collaboration and willingness to share information in service of protecting users.
Observed attacker behavior
Rapid7 identified at least 11 customers who experienced Cisco ASA-related intrusions between March 30 and August 24, 2023. Our team traced the malicious activity back to an ASA appliance servicing SSL VPNs for remote users. ASA appliance patches varied across compromised appliances — Rapid7 did not identify any particular version that was unusually susceptible to exploitation.
In our analysis of these intrusions, Rapid7 identified multiple areas of overlap among observed IOCs. The Windows clientname WIN-R84DEUE96RB was often associated with threat actor infrastructure, along with the IP addresses 176.124.201[.]200 and 162.35.92[.]242. We also saw overlap in accounts used to authenticate into internal systems, including the use of accounts TEST, CISCO, SCANUSER, and PRINTER. User domain accounts were also used to successfully authenticate to internal assets — in several cases, attackers successfully authenticated on the first try, which may indicate that the victim accounts were using weak or default credentials.
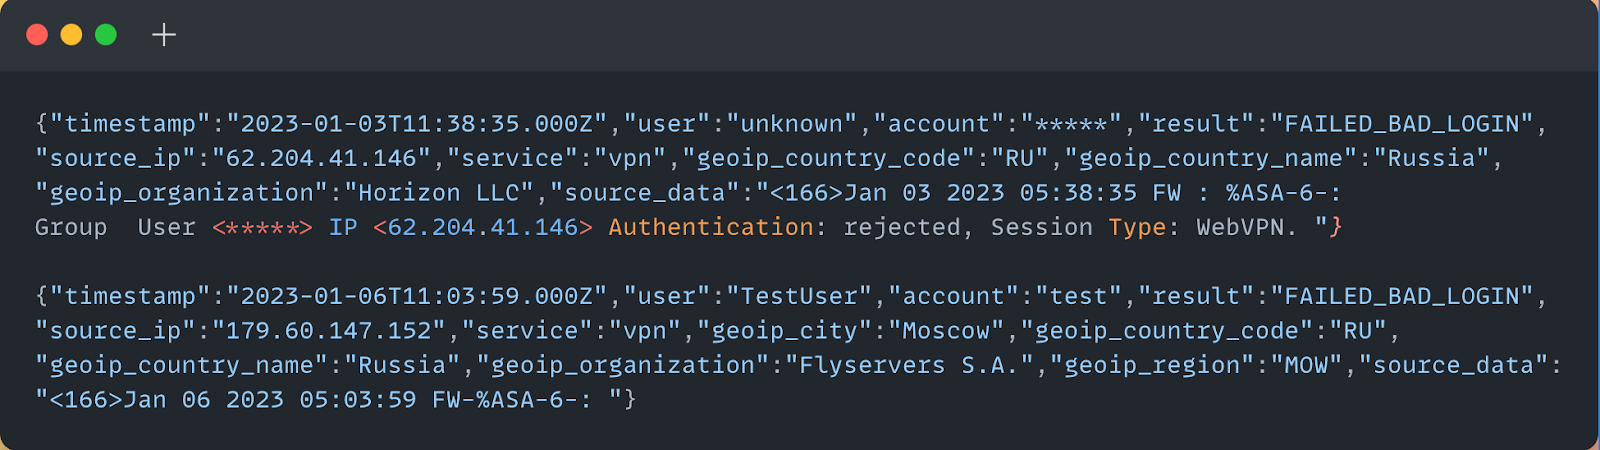
The below image is an anonymized log entry where an attacker attempts a (failed) login to the Cisco ASA SSL VPN service. In our analysis of log files across different incident response cases, we frequently observed failed login attempts occurring within milliseconds of one another, which points at automated attacks.
In most of the incidents we investigated, threat actors attempted to log into ASA appliances with a common set of usernames, including:
admin
adminadmin
backupadmin
kali
cisco
guest
accounting
developer
ftp user
training
test
printer
echo
security
inspector
test test
snmp
The above is a fairly standard list of accounts that may point at use of a brute forcing tool. In some cases, the usernames in login attempts belonged to actual domain users. While we have no specific evidence of leaked victim credentials, we are aware that it’s possible to attempt to brute force a Cisco ASA service with the path +CSCOE+/logon.htm. VPN group names are also visible in the source code of the VPN endpoint login page and can be easily extracted, which can aid brute forcing attacks.
Upon successful authentication to internal assets, threat actors deployed set.bat. Execution of set.bat resulted in the installation and execution of the remote desktop application AnyDesk, with a set password of greenday#@!. In some cases, nd.exe was executed on systems to dump NTDS.DIT, as well as the SAM and SYSTEM hives, which may have given the adversary access to additional domain user credentials. The threat actors performed further lateral movement and binary executions across other systems within target environments to increase the scope of compromise. As mentioned previously, several of the intrusions culminated in the deployment and execution of Akira or LockBit-related ransomware binaries.
Dark web activity
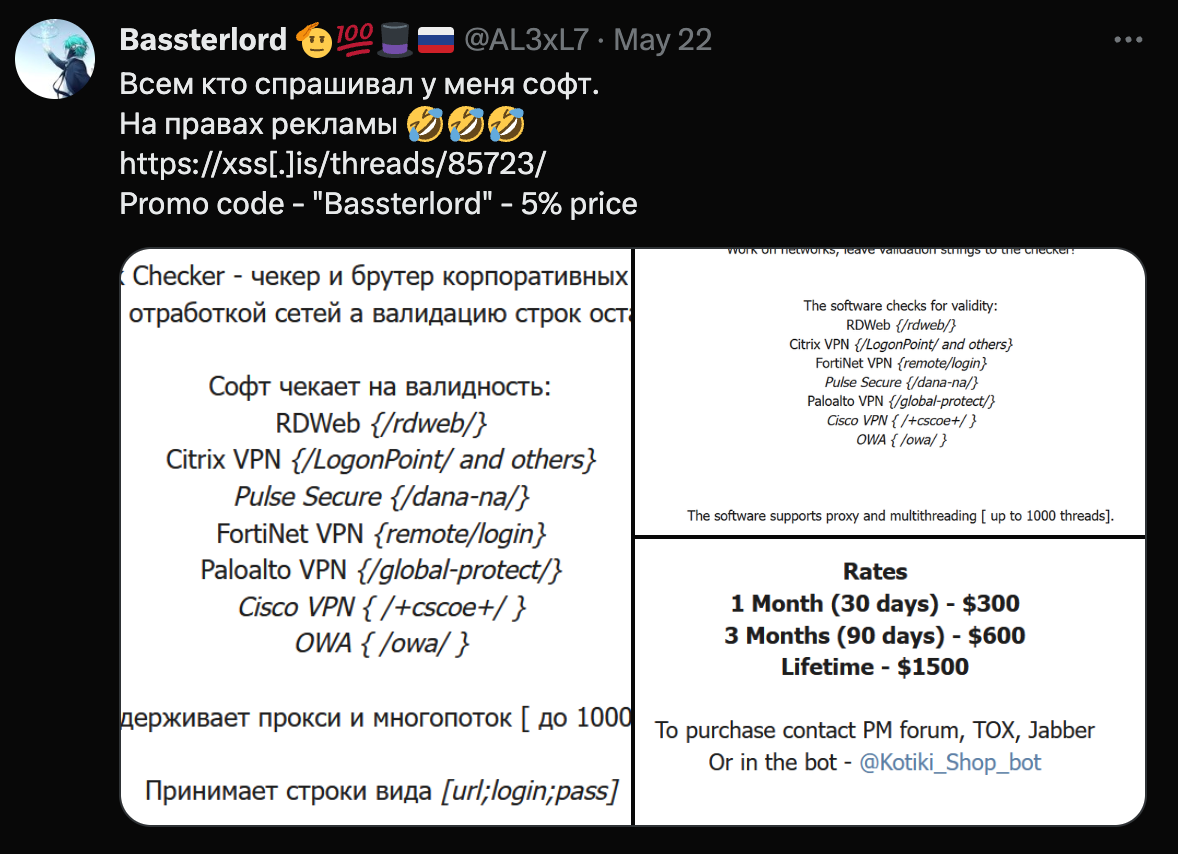
In parallel with incident response investigations into ASA-based intrusions, Rapid7 threat intelligence teams have been monitoring underground forums and Telegram channels for threat actor discussion about these types of attacks. In February 2023, a well-known initial access broker called “Bassterlord” was observed in XSS forums selling a guide on breaking into corporate networks. The guide, which included chapters on SSL VPN brute forcing, was being sold for $10,000 USD.
When several other forums started leaking information from the guide, Bassterlord posted on Twitter about shifting to a content rental model rather than selling the guide wholesale:
Rapid7 obtained a leaked copy of the manual and analyzed its content. Notably, the author claimed they had compromised 4,865 Cisco SSL VPN services and 9,870 Fortinet VPN services with the username/password combination test:test. It’s possible that, given the timing of the dark web discussion and the increased threat activity we observed, the manual’s instruction contributed to the uptick in brute force attacks targeting Cisco ASA VPNs.
Indicators of compromise
Rapid7 identified the following IP addresses associated with source authentication events to compromised internal assets, as well as outbound connections from AnyDesk:
161.35.92.242
173.208.205.10
185.157.162.21
185.193.64.226
149.93.239.176
158.255.215.236
95.181.150.173
94.232.44.118
194.28.112.157
5.61.43.231
5.183.253.129
45.80.107.220
193.233.230.161
149.57.12.131
149.57.15.181
193.233.228.183
45.66.209.122
95.181.148.101
193.233.228.86
176.124.201.200
162.35.92.242
144.217.86.109
Other IP addresses that were observed conducting brute force attempts:
31.184.236.63
31.184.236.71
31.184.236.79
194.28.112.149
62.233.50.19
194.28.112.156
45.227.255.51
185.92.72.135
80.66.66.175
62.233.50.11
62.233.50.13
194.28.115.124
62.233.50.81
152.89.196.185
91.240.118.9
185.81.68.45
152.89.196.186
185.81.68.46
185.81.68.74
62.233.50.25
62.233.50.17
62.233.50.23
62.233.50.101
62.233.50.102
62.233.50.95
62.233.50.103
92.255.57.202
91.240.118.5
91.240.118.8
91.240.118.7
91.240.118.4
161.35.92.242
45.227.252.237
147.78.47.245
46.161.27.123
94.232.43.143
94.232.43.250
80.66.76.18
94.232.42.109
179.60.147.152
185.81.68.197
185.81.68.75
Many of the IP addresses above were hosted by the following providers:
Chang Way Technologies Co. Limited
Flyservers S.A.
Xhost Internet Solutions Lp
NFOrce Entertainment B.V.
VDSina Hosting
Log-based indicators:
Login attempts with invalid username and password combinations (%ASA-6-113015)
RAVPN session creation (attempts) for unexpected profiles/TGs (%ASA-4-113019, %ASA-4-722041, %ASA-7-734003)
Mitigation guidance
As Rapid7’s mid-year threat review noted, nearly 40% of all incidents our managed services teams responded to in the first half of 2023 stemmed from lack of MFA on VPN or virtual desktop infrastructure. These incidents reinforce that use of weak or default credentials remains common, and that credentials in general are often not protected as a result of lax MFA enforcement in corporate networks.
To mitigate the risk of the attacker behavior outlined in this blog, organizations should:
Ensure default accounts have been disabled or passwords have been reset from the default.
Ensure MFA is enforced across all VPN users, limiting exceptions to this policy as much as possible.
Enable logging on VPNs: Cisco has information on doing this for ASA specifically here, along with guidance on collecting forensic evidence from ASA devices here.
Monitor VPN logs for authentication attempts occurring outside expected locations of employees.
Monitor VPN logs for failed authentications, looking for brute forcing and password spraying patterns.
As a best practice, keep current on patches for security issues in VPNs, virtual desktop infrastructure, and other gateway devices.
Rapid7 is monitoring MDR customers for anomalous authentication events and signs of brute forcing and password spraying. For InsightIDR and MDR customers, the following non-exhaustive list of detection rules are deployed and alerting on activity related to the attack patterns in this blog:
Ingress Auth by Local ASA Account
Attacker Technique – NTDS File Access
Attacker Tool – Impacket Lateral Movement
Process Spawned By SoftPerfect Network Scanner
Execution From Root of ProgramData
Various sources have recently published pieces noting that ransomware groups appear to be targeting Cisco VPNs to gain access to corporate networks. Rapid7 strongly recommends reviewing the IOCs and related information in this blog and in Cisco’s PSIRT blog and taking action to strengthen security posture for VPN implementations.
“Ще се разпищят ли твоите гласоподаватели, ако им спрем топлия обяд?” “Ти знаеш ли дали са мои гласоподаватели? Чу ли се с всичките?”. Това е чат между кмета на район…
The OpenChain site carries the sad news of the
passing of Satoru Ueda. Your editor first met Ueda San at the 2007 Linux Foundation Japan Symposium, where a
small group of dedicated developers and managers was working hard to bring
open-source development practices to the country. Ueda San was always a
strong advocate for this cause and deserves much credit for the success of
Linux and open source in Japan. He was also always a warm and welcoming
person; he will be much missed.
In January 2023, we announced support for Managed Service Providers (MSPs) and other businesses to create 'parent-child' and account-level policy configurations when deploying Cloudflare for DNS filtering. Specifically, organizations leverage the integration between our Tenant API and Cloudflare Gateway, our Secure Web Gateway (SWG) to protect their remote or office end users with web filtering and inspection. Already, customers like the US federal government, MalwareBytes, and a large global ISP take advantage of this integration to enable simpler, more flexible policy management across larger deployments across their end customers
Today, we're excited to showcase another similar story: Meter, a provider of Internet infrastructure, is leveraging the Tenant API integration for DNS filtering to help their clients enforce acceptable Internet use policies.
How Meter deploys Cloudflare to secure Internet browsing
Meter, headquartered in San Francisco and founded in 2015, provides Internet infrastructure that includes routing, switching, wireless, and applications. They help deliver faster, more efficient, more secure networking experiences for a diverse range of corporate spaces, including offices, warehouses, retail, manufacturing, biotech, and education institutions.
Meter integrates with the Cloudflare Tenant API to provide DNS filtering to their customers. With the Meter dashboard, Meter customers can set policies to block or allow Internet traffic to domains, categorized by security risks (phishing, malware, DGA, etc.) or content theme (adult, gambling, shopping, etc.)
Across this customer base, having parent-child relationships in security policies is often critical. For example, specific schools within an overall district may have different policies about what Internet browsing is or is not acceptable.
Cloudflare’s parent-child configurability means that Meter administrators are equipped to set differential, granular policies for specific offices, retail locations, or warehouses (‘child accounts’) within a larger business (‘parent account’). DNS queries are first filtered against parent account policies before filtering against more specific child account policies.
At a more technical level, each “child” customer account can have its own users and tokens to manage accounts. Customers of Meter can set up their DNS endpoints via Gateway locations and may be defined as IPv4, IPv6, DoH, and DoT endpoints. DNS policies can be defined for these Gateway locations. In addition to this, each customer of Meter can customize their block page and even upload their own certificates to serve their custom block page.
What’s next
MSPs and infrastructure companies like Meter play a vital role in bringing cybersecurity solutions to customers of all sizes and needs. Cloudflare will continue to invest in our tenant architecture to equip MSPs with the flexibility and simplicity they need to serve their end customers.
DNS filtering to protect users on the Internet is a valuable solution for MSPs to deliver with Cloudflare. But DNS filtering is just the first of several Zero Trust services that Cloudflare intends to support via our tenant platform, so stay tuned for more.
If you are an MSP or an Infrastructure company looking to deliver Cloudflare security for your end customers, learn more here.
The collective thoughts of the interwebz
Manage Consent
To provide the best experiences, we use technologies like cookies to store and/or access device information. Consenting to these technologies will allow us to process data such as browsing behavior or unique IDs on this site. Not consenting or withdrawing consent, may adversely affect certain features and functions.
Functional
Always active
The technical storage or access is strictly necessary for the legitimate purpose of enabling the use of a specific service explicitly requested by the subscriber or user, or for the sole purpose of carrying out the transmission of a communication over an electronic communications network.
Preferences
The technical storage or access is necessary for the legitimate purpose of storing preferences that are not requested by the subscriber or user.
Statistics
The technical storage or access that is used exclusively for statistical purposes.The technical storage or access that is used exclusively for anonymous statistical purposes. Without a subpoena, voluntary compliance on the part of your Internet Service Provider, or additional records from a third party, information stored or retrieved for this purpose alone cannot usually be used to identify you.
Marketing
The technical storage or access is required to create user profiles to send advertising, or to track the user on a website or across several websites for similar marketing purposes.


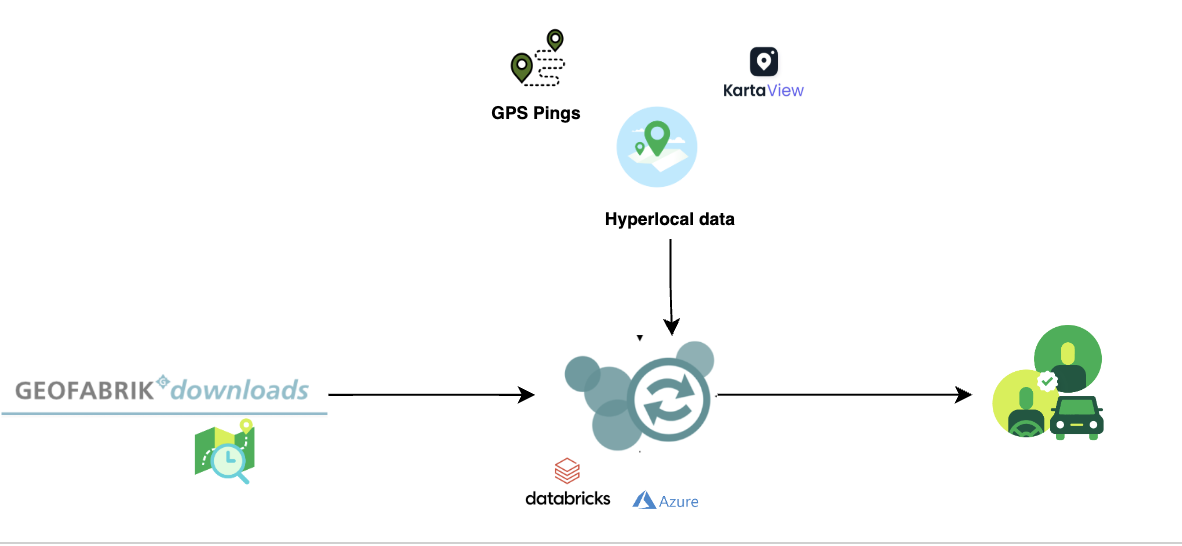
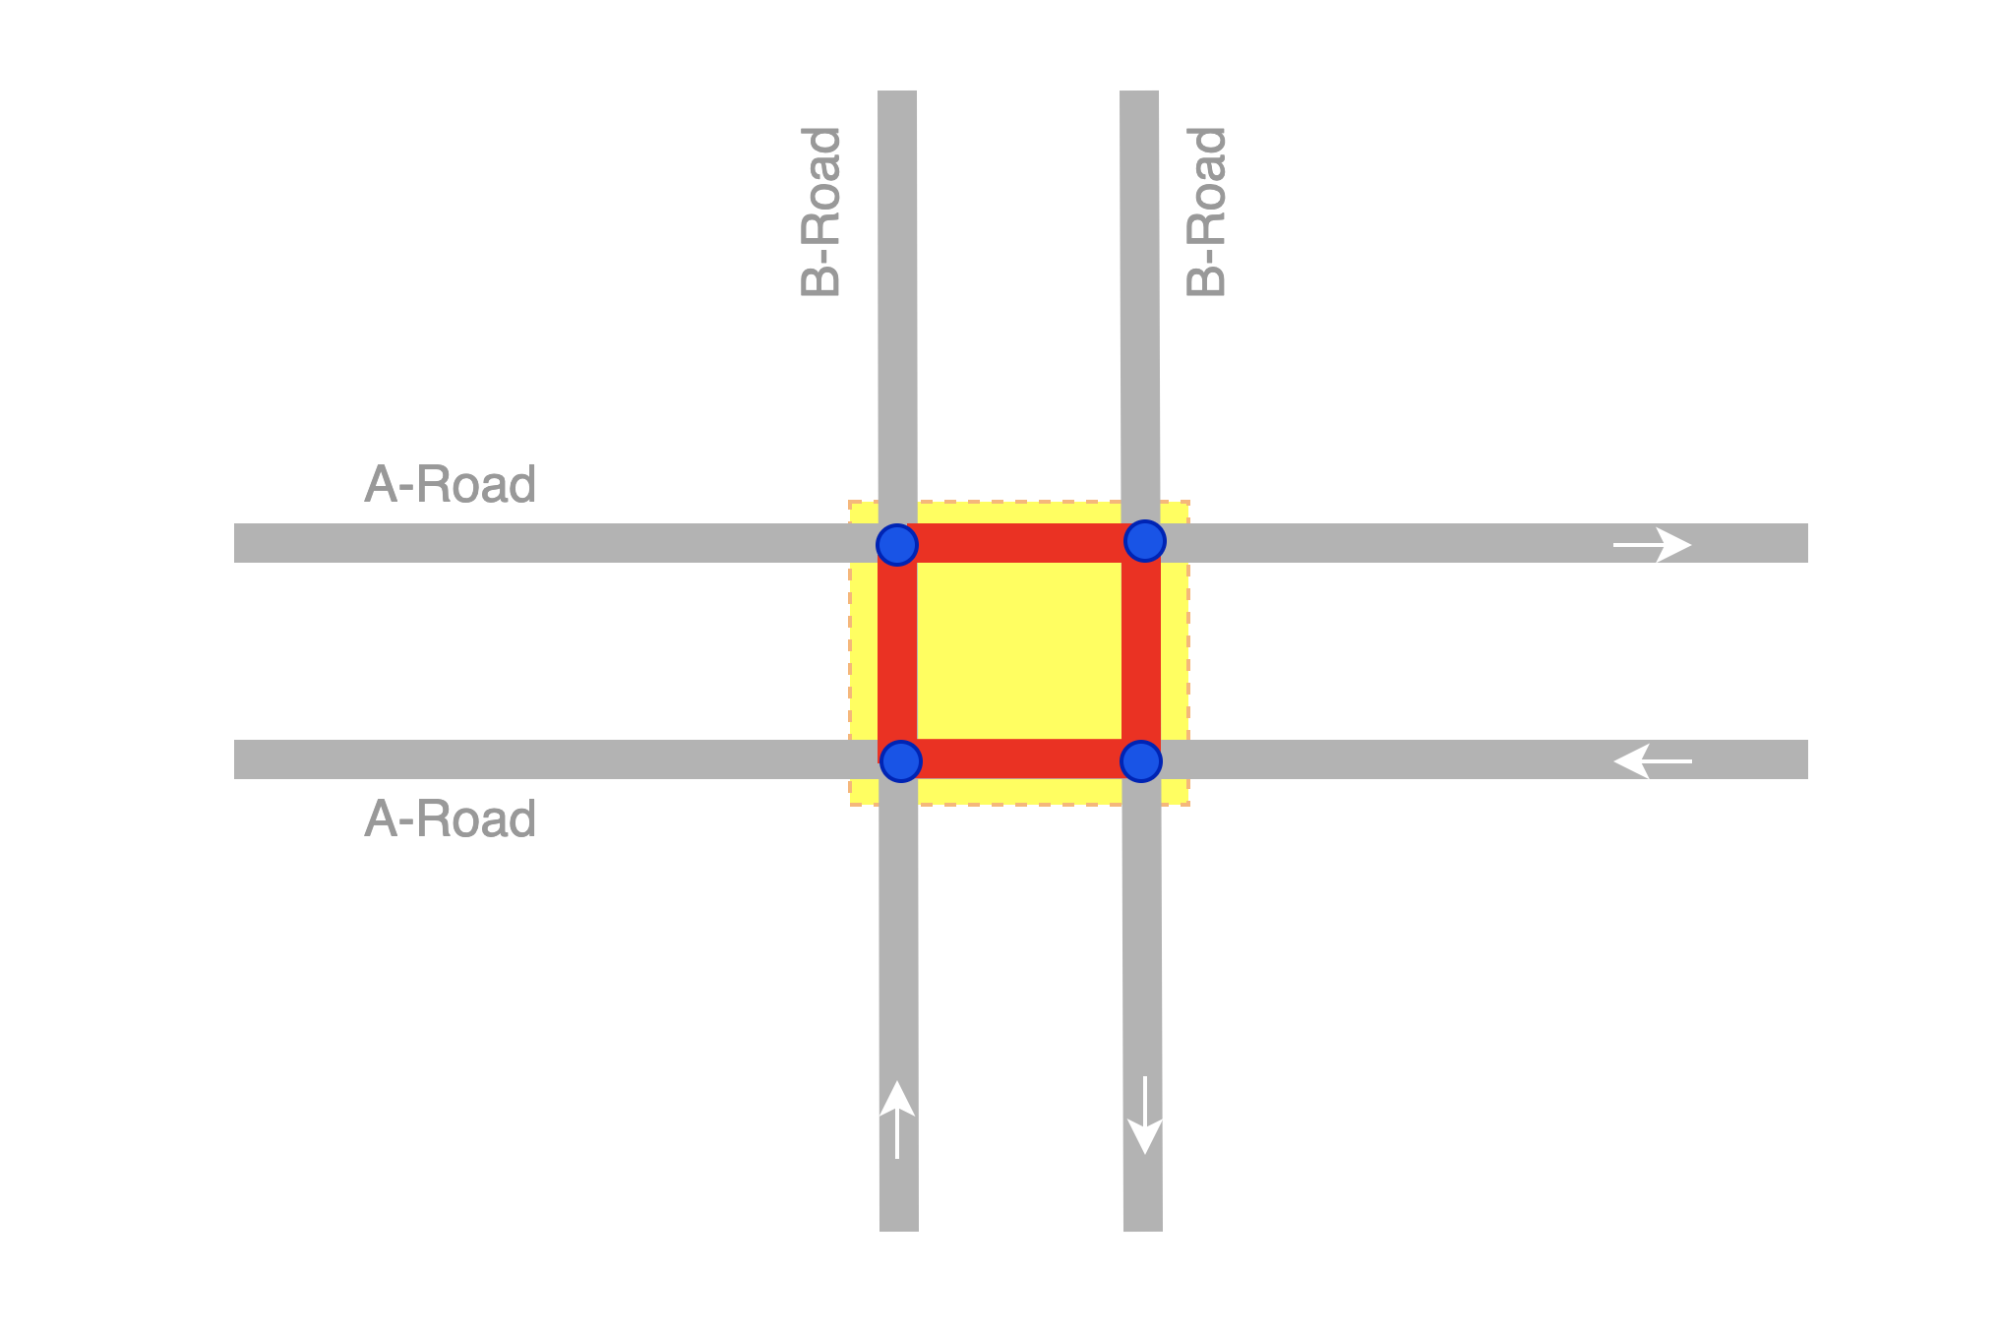
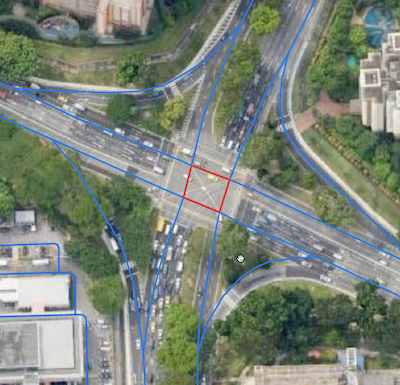
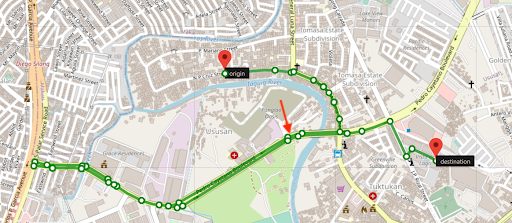
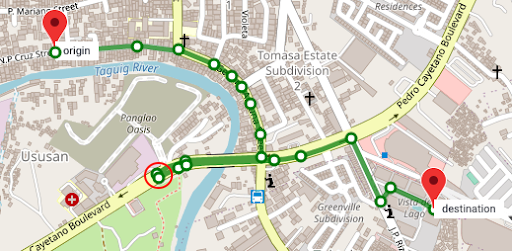
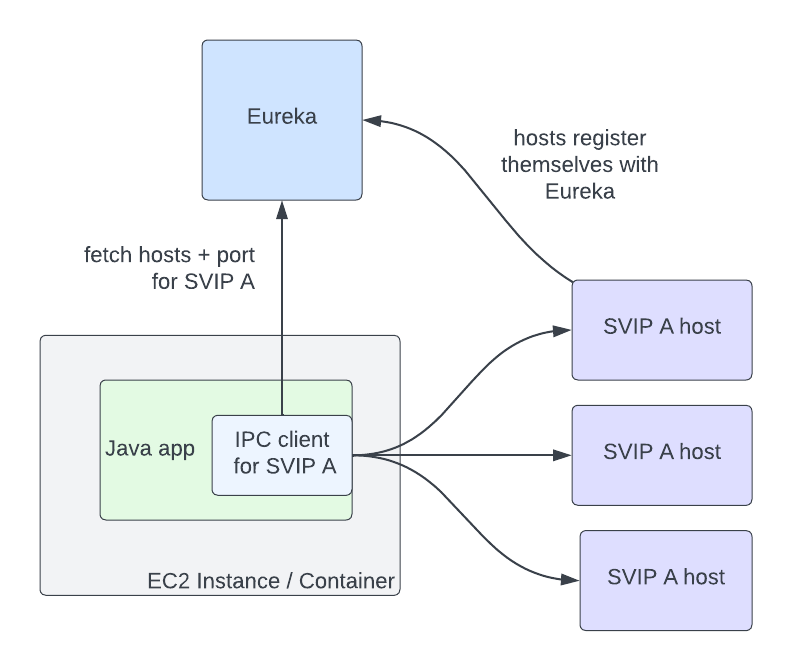
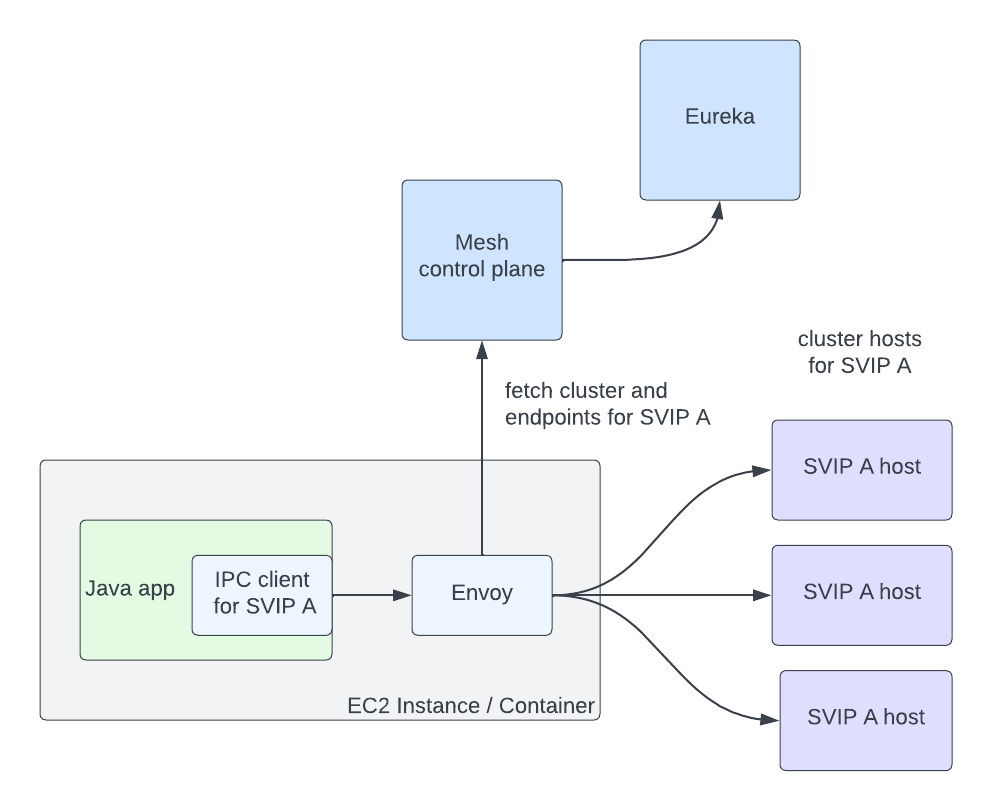


 Raj Ramasubbu is a Senior Analytics Specialist Solutions Architect focused on big data and analytics and AI/ML with Amazon Web Services. He helps customers architect and build highly scalable, performant, and secure cloud-based solutions on AWS. Raj provided technical expertise and leadership in building data engineering, big data analytics, business intelligence, and data science solutions for over 18 years prior to joining AWS. He helped customers in various industry verticals like healthcare, medical devices, life science, retail, asset management, car insurance, residential REIT, agriculture, title insurance, supply chain, document management, and real estate.