Post Syndicated from The History Guy: History Deserves to Be Remembered original https://www.youtube.com/watch?v=i9i9NS0sSnQ
Корупция без граници: “Биволъ” с видео, документи, подробности за скандалния мегапроект Властта с натиск урежда соларен парк на В.Златев върху 144 ха защитена зона край морето
Post Syndicated from Екип на Биволъ original https://bivol.bg/%D0%B2%D0%BB%D0%B0%D1%81%D1%82%D1%82%D0%B0-%D1%81-%D0%BD%D0%B0%D1%82%D0%B8%D1%81%D0%BA-%D1%83%D1%80%D0%B5%D0%B6%D0%B4%D0%B0-%D1%81%D0%BE%D0%BB%D0%B0%D1%80%D0%B5%D0%BD-%D0%BF%D0%B0%D1%80%D0%BA-%D0%BD.html
петък 6 януари 2023

Бившият изпълнителен директор на “Лукойл България” Валентин Златев успя да уреди узаконяването на мегапроекта си за изграждане на най-големия соларен парк в България. Бъдещият строеж на фотоволтаична електрическа централа е планиран…
Euler Diagrams
Post Syndicated from original https://xkcd.com/2721/

Stripe CEO Patrick Collison on Supercharging Science in the U.S. | Progress Summit 2022
Post Syndicated from The Atlantic original https://www.youtube.com/watch?v=LeEA3A05R_g
Amazon S3 Encrypts New Objects By Default
Post Syndicated from Sébastien Stormacq original https://aws.amazon.com/blogs/aws/amazon-s3-encrypts-new-objects-by-default/
At AWS, security is job zero. Starting today, Amazon Simple Storage Service (Amazon S3) encrypts all new objects by default. Now, S3 automatically applies server-side encryption (SSE-S3) for each new object, unless you specify a different encryption option. SSE-S3 was first launched in 2011. As Jeff wrote at the time: “Amazon S3 server-side encryption handles all encryption, decryption, and key management in a totally transparent fashion. When you PUT an object, we generate a unique key, encrypt your data with the key, and then encrypt the key with a [root] key.”
This change puts another security best practice into effect automatically—with no impact on performance and no action required on your side. S3 buckets that do not use default encryption will now automatically apply SSE-S3 as the default setting. Existing buckets currently using S3 default encryption will not change.
As always, you can choose to encrypt your objects using one of the three encryption options we provide: S3 default encryption (SSE-S3, the new default), customer-provided encryption keys (SSE-C), or AWS Key Management Service keys (SSE-KMS). To have an additional layer of encryption, you might also encrypt objects on the client side, using client libraries such as the Amazon S3 encryption client.
While it was simple to enable, the opt-in nature of SSE-S3 meant that you had to be certain that it was always configured on new buckets and verify that it remained configured properly over time. For organizations that require all their objects to remain encrypted at rest with SSE-S3, this update helps meet their encryption compliance requirements without any additional tools or client configuration changes.
With today’s announcement, we have now made it “zero click” for you to apply this base level of encryption on every S3 bucket.
Verify Your Objects Are Encrypted
The change is visible today in AWS CloudTrail data event logs. You will see the changes in the S3 section of the AWS Management Console, Amazon S3 Inventory, Amazon S3 Storage Lens, and as an additional header in the AWS CLI and in the AWS SDKs over the next few weeks. We will update this blog post and documentation when the encryption status is available in these tools in all AWS Regions.
To verify the change is effective on your buckets today, you can configure CloudTrail to log data events. By default, trails do not log data events, and there is an extra cost to enable it. Data events show the resource operations performed on or within a resource, such as when a user uploads a file to an S3 bucket. You can log data events for Amazon S3 buckets, AWS Lambda functions, Amazon DynamoDB tables, or a combination of those.
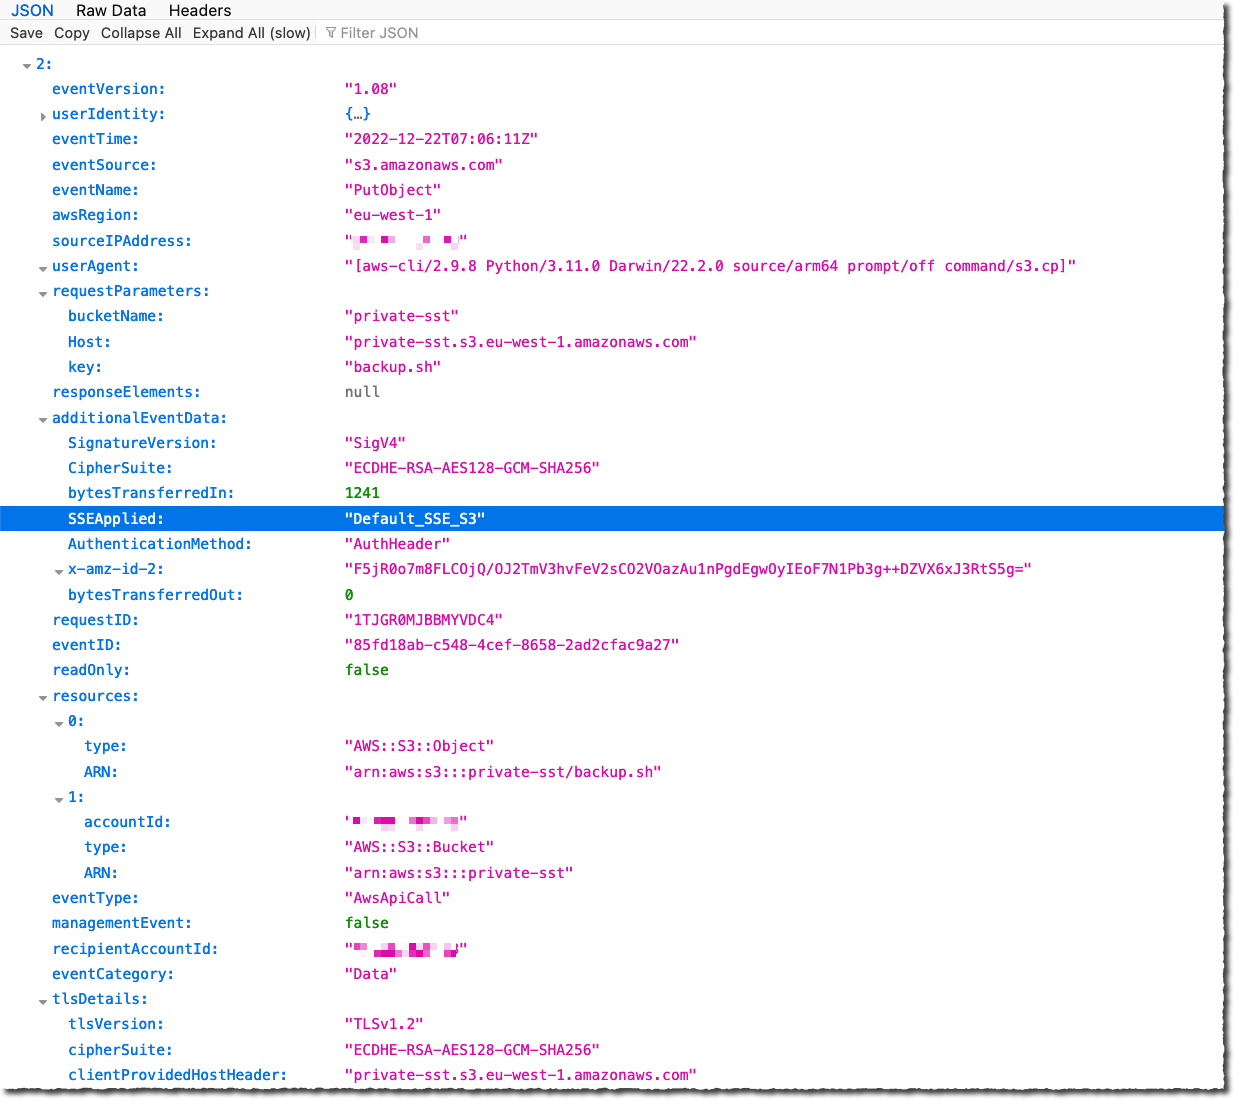
Once enabled, search for PutObject API for file uploads or InitiateMultipartUpload for multipart uploads. When Amazon S3 automatically encrypts an object using the default encryption settings, the log includes the following field as the name-value pair: "SSEApplied":"Default_SSE_S3". Here is an example of a CloudTrail log (with data event logging enabled) when I uploaded a file to one of my buckets using the AWS CLI command aws s3 cp backup.sh s3://private-sst.
Amazon S3 Encryption Options
As I wrote earlier, SSE-S3 is now the new base level of encryption when no other encryption-type is specified. SSE-S3 uses Advanced Encryption Standard (AES) encryption with 256-bit keys managed by AWS.
You can choose to encrypt your objects using SSE-C or SSE-KMS rather than with SSE-S3, either as “one click” default encryption settings on the bucket, or for individual objects in PUT requests.
SSE-C lets Amazon S3 perform the encryption and decryption of your objects while you retain control of the keys used to encrypt objects. With SSE-C, you don’t need to implement or use a client-side library to perform the encryption and decryption of objects you store in Amazon S3, but you do need to manage the keys that you send to Amazon S3 to encrypt and decrypt objects.
With SSE-KMS, AWS Key Management Service (AWS KMS) manages your encryption keys. Using AWS KMS to manage your keys provides several additional benefits. With AWS KMS, there are separate permissions for the use of the KMS key, providing an additional layer of control as well as protection against unauthorized access to your objects stored in Amazon S3. AWS KMS provides an audit trail so you can see who used your key to access which object and when, as well as view failed attempts to access data from users without permission to decrypt the data.
When using an encryption client library, such as the Amazon S3 encryption client, you retain control of the keys and complete the encryption and decryption of objects client-side using an encryption library of your choice. You encrypt the objects before they are sent to Amazon S3 for storage. The Java, .Net, Ruby, PHP, Go, and C++ AWS SDKs support client-side encryption.
You can follow the instructions in this blog post if you want to retroactively encrypt existing objects in your buckets.
Available Now
This change is effective now, in all AWS Regions, including on AWS GovCloud (US) and AWS China Regions. There is no additional cost for default object-level encryption.
What’s the Diff: Image-Based Backup vs. File-Based Backup
Post Syndicated from Kari Rivas original https://www.backblaze.com/blog/whats-the-diff-image-based-backup-vs-file-based-backup/
When you’re planning your backup strategy, one important decision to make is whether to use image-based or file-based backups. Both methods have pros and cons and both are useful in different situations. Think of it like packing for a trip: Sometimes you need to take everything plus the kitchen sink (image-based), and sometimes you only need the essentials (file-based). It’s not a perfect metaphor, but it will make more sense once you understand the differences between these two backup types. Let’s dig in.
The TLDR: What’s the Difference Between Image-Based and File-Based Backups?
The short answer is this: An image-based backup (also known as a bare metal backup, which is a deeply cool name) is a backup of an entire machine or server, including the operating system (OS) and applications as well as all of the files. A file-based backup only includes the files. We’ll dig deeper into the implications of each below, but that should give you a good base of knowledge to start.
First, Some Basic Backup Best Practices
In addition to understanding the difference between file-based and image-based backups and when to use them, there are a few key elements of a backup strategy you should have in your playbook:
- Setting up a 3-2-1 plan for your backups. A 3-2-1 strategy means keeping three copies of your data on two different media with one offsite and preferably geographically distanced from your other backups.
- Configuring frequency of full (or synthetic full) and incremental backups. Nailing this cadence can also help you optimize your cloud storage usage and costs.
- Organizing your backup plan according to grandfather-father-son. This approach helps you plan your approach to creating full and incremental backups to further optimize your costs.
Want a Deeper Dive?
Check out “Server Backup: A Comprehensive Guide to Protecting The Data on Your Servers” for an in-depth look at creating a bulletproof backup strategy.

Why Is Your Backup Configuration Important?
Properly configuring your backups, including when to use file-based versus image-based backups, is important for a couple reasons. First, it enables you to optimize your cloud storage usage and costs. Image-based backups are typically larger than file-based backups, so they’ll cost more to store. File-based backups are smaller and cost less to store, but they’re also not as robust. Finding the right mix is important as you’re planning your cloud storage strategy.
It’s also important to properly configure your backups so that you can recover more effectively in the case of a disaster. Restoring from an image-based backup will allow you to bring your entire operation back online. Understanding how each type of backup works will help you decide which to use when (and when you should use both).
What Is a File-Based Backup?
A file-based backup, sometimes called a file backup or a file-level backup, is a backup of a single file, multiple files, or even all the files on your system. The biggest distinction from an image-based backup is that it does not include a backup of the OS.
When configuring a file-based backup, you can choose which files you want to back up. For instance, you might choose to back up only certain file types, like Word documents or databases. Or you might choose to back up a particular set of files for one department, such as accounting files.
To understand when to use a file-based backup, it helps to know the pros and cons. We’ll dig into those next.
Advantages of File-Based Backup
File-based backups are simple and straightforward—you just need to back up files versus the entire system. Advantages of this type of backup include:
- More control over what gets backed up. You can choose specific files or folders that get backed up or sent to cloud storage.
- More control over what you recover. You can be more granular when it comes to choosing which files you need to restore should you need to.
- Less storage utilization and faster backups. Since file-based backups are typically smaller in size than image-based, they take up less storage space and can be faster to run.
- Ability to customize. Some backup applications allow you to set customized backup cadences for different types of files. For example, you could back up accounting files daily, but other project files weekly. Or, you could back up all files on a specific schedule.
Disadvantages of File-Based Backup
There are two main disadvantages of file-based backups:
- The files are saved, but not the applications that created them. If you need to restore files to a different machine, you need to make sure that machine has all of the appropriate applications to read and use the files.
- File-based backups are very limited in a disaster recovery scenario. If you need to restore an entire environment after a natural disaster or a ransomware attack, you would need to recover all of your files, then spend additional time reconstructing your OS, reinstalling all of your applications, reconfiguring them, etc.
What Is an Image-Based Backup?
An image-based backup, also known as a bare metal backup, disk backup, disk image backup, or mirror backup, allows you to back up all of the volumes on your server, creating a copy of your whole system.
As opposed to a file-based backup, an image-based backup backs up your entire OS, including settings, applications, configurations, and executable programs.
An image-based backup is more robust, which makes it larger. That comes with some advantages and disadvantages as well.
Advantages of Image-Based Backup
Image-based backups are comprehensive. Going back to our packing metaphor, this is the kitchen sink method. Advantages of this type of backup include:
- The ability to restore a server in its entirety. This is great when you need to protect your entire server, including the OS.
- The flexibility to restore individual files or the entire system. With an image-based backup, you get the same restore capabilities as a file-based backup, but with the added option to restore the entire disk if needed.
- Faster recoveries. If you need to meet specific recovery time objectives (RTOs), image-based backups can save you time. You don’t need to reinstall and patch the OS.
Disadvantages of Image-Based Backup
There are a few disadvantages of image-based backups, including:
- More time-consuming and bandwidth-hogging during backup. Since you’re backing up everything, image-based backups are going to take longer and use more internet bandwidth when you’re saving them to cloud storage. Backing up after work hours is typically recommended.
- More expensive to store. Image-based backups take up more cloud storage space and hence cost more to store.
- Could be overkill for day-to-day recovery needs. When you only need to recover a file that’s accidentally been deleted or corrupted, you don’t need a full image-based backup.
Image-Based vs. File-Based: How to Choose?
Now that you know the difference between image-based and file-based backups, how do you know when to use each type? Here are a few basic guidelines.
Choose a file-based backup for the following scenarios:
- If you have a virtualized environment. When you can reimage a new OS quickly in a virtualized environment, you may not want or need to back up the full OS.
- To back up employee workstations. Employees will most often need to restore individual files, and a file-based backup will cover this use case. If you ever needed to do a full restore, chances are good that you can just reinstall the OS easily.
Choose an image-based backup for the following scenarios:
- For servers with mission-critical data. If you can’t function without it, you should do a full image-based backup.
- For anything that would take a long time to configure. In a recovery situation, you don’t want to be spending time reconfiguring settings and reinstalling applications.
Why Not Use Both? Optimizing for Cost and Utility
Rather than choosing between file-based or image-based, you could design a backup strategy that employs both. This allows you to manage your storage usage and costs while maximizing your ability to recover quickly. For example, you could consider doing an image-based backup monthly and file-based backups more frequently. Or you could do an image-based backup of your mission critical servers and file-based backups of employee workstations. The right combination will help you to keep your costs low while maintaining the fidelity of your environment in a disaster scenario.
Storing Backups in the Cloud
Whether you choose image-based or file-based backups, you need somewhere safe to store them. According to the 3-2-1 backup strategy, one of those copies should live off-site in a geographically distant location, and cloud storage is a great fit. Check out server backup solutions from Backblaze B2 to learn more about storing your image-based and file-based backups in the cloud.
The post What’s the Diff: Image-Based Backup vs. File-Based Backup appeared first on Backblaze Blog | Cloud Storage & Cloud Backup.
Green Flag uses Amazon QuickSight to democratize data and enable self-serve insights to all employees
Post Syndicated from Jeremy Bristow original https://aws.amazon.com/blogs/big-data/green-flag-uses-amazon-quicksight-to-democratize-data-and-enable-self-serve-insights-to-all-employees/
This is a guest post by Jeremy Bristow, Head of Product at Green Flag.
In the US, there’s a saying: “Sooner or later, you’ll break down and call Triple A.” In the UK, that same saying might be “Sooner or later, you’ll break down and call Green Flag.”
Green Flag has been assisting stranded motorists all over Europe for more than 50 years. Having started in the UK in 1971, with the first office located above a fish and chip shop, we have built an expansive network of automobile service providers to assist customers. With that network in place, Green Flag customers need only make a single phone call, or request service via the Green Flag app, to quickly contact a local repair garage, no matter where they’ve broken down.
Green Flag’s commitment to providing world-class service to its customers has consistently earned a Net Promoter Score (NPS) of over 70. We were also recently rated as the top breakdown provider in the H1 2022 UK Customer Satisfaction Index report, which is a national benchmark of customer satisfaction covering 13 sectors and based on 45,000 customer responses.
Unlike most breakdown providers in the UK, Green Flag doesn’t currently own a large fleet of trucks to provide roadside assistance to our 3 million plus customers. Our established network of over 200 locally operated businesses provides in-depth knowledge and expertise related to their specific areas. Our overall mission is simple: “Make motoring stress-free, safe, and simple, for every driver.”
Tech transformation to democratize data
Over the past 4 years, Green Flag has been undertaking a technology transformation with the end goal of enabling data democratization and faster data-driven decisions. This has been a massive undertaking, requiring the business to replace our entire systems architecture, which we’ve done while remaining open 24/7, 365 days a year, maintaining our industry-leading customer service standards and growing the business. Building the plane while flying it is an apt analogy, but it felt more like performing open-heart surgery while running a marathon.
Early on during our tech transformation, we made the decision to develop natively with AWS, using our in-house development team. When it came time to decide on a new business intelligence (BI) tool, it was an easy decision to switch to Amazon QuickSight.
In this post, we discuss what influenced the decision to implement QuickSight and why doing so has made a significant impact on our efficiency and agility.
Changing the game with self-serve insights
Prior to embarking on this transformation, technology had consistently been a blocker to us being able to quickly serve our customers. Our old stack was slow, hard to change, and consistently prevented us from gaining valuable and timely insights from our datasets. We were data rich, but insight poor. It was clear that the status quo was not compatible with our ambitions to grow and trade in an increasingly digital world. We needed a BI tool to bring new and meaningful insights to our data, which would help us leverage our new technologies to deliver meaningful business change.
Although going with QuickSight was an easy decision, we considered the following factors to ensure our needs would be met:
- Alignment to AWS architecture – We didn’t want to invest time and development resources into complicated implementations—we wanted a seamless integration that would cause no headaches.
- Ease of use – We needed an intuitive, user-friendly interface that would make it easy for any user, no matter their tech background or level of expertise in pulling data insights.
- Cost – Affordability is always a concern. With AWS, we can monitor daily usage and the associated costs via our console, so there were never any surprises or hidden costs post-implementation.
Although these considerations were all top of mind, the primary driver for switching to QuickSight is rooted in the data democratization goal within our tech transformation initiative. Providing self-serve access to data and insights to everyone, no matter their tech background, has been a game changer. With QuickSight, we can now present data and insights in a meaningful, easy-to-understand format via near-real-time embedded dashboards that anyone from any tech background can easily build.
Evolving our data culture with QuickSight
Because all employees are now empowered to make data-driven decisions, our data culture has begun to evolve. Having consistent, accurate dashboards that access standardized datasets brings with it a new level of confidence in decision-making. We’re no longer wasting time on discussions about data sources or the risks of inaccuracy. QuickSight and the data governance processes we have built around its use have shifted the discussion to focus on the insights, what they tell us, and what our next steps should be.
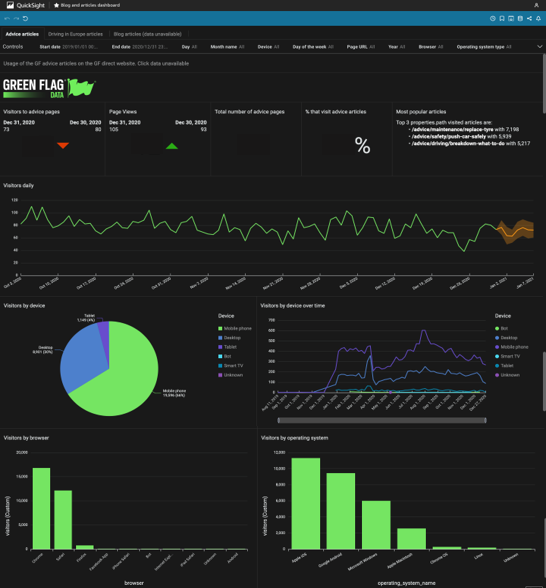
The following screenshot shows one of Green Flag’s custom-built dashboards.
Additionally, because QuickSight is so easy to use that self-service requires minimal training and no specialized skills, our data experts can now shift from responding to constant requests for information to focusing on more valuable projects that require their technical depth and expertise. We can now work more efficiently, producing actionable insights that have never before been available, at a pace that enables us to make better decisions, faster.
Mapping our next analytics adventure
The next features that the Green Flag team plan to test and then roll out is Amazon QuickSight Q, which should allow both our data teams and business users to have a more frictionless experience with our data. The feature should enable users to interrogate complex data using simple conversational questions as if they were talking to a colleague, producing results that are then customizable. This will further empower our self-serve strategy by enabling non-technical experts to pose business questions rather than rely on technical expertise and experience.
To learn more about how you can embed customized data visuals, interactive dashboards, and natural language querying into any application, visit Amazon QuickSight Embedded.
About the Author
 Jeremy “Jez” Bristow is Head of Product at Green Flag. He has been working at Green Flag, part of Direct Line Group, for over 4 years and has been co-responsible for delivering the digital transformation programme within Green Flag. They have built a cloud-based ecosystem of micro-services supported by a data platform within AWS to enable the delivery of better customer outcomes to grow their business.
Accelerate your data exploration and experimentation with the AWS Analytics Reference Architecture library
Post Syndicated from Lotfi Mouhib original https://aws.amazon.com/blogs/big-data/accelerate-your-data-exploration-and-experimentation-with-the-aws-analytics-reference-architecture-library/
Organizations use their data to solve complex problems by starting small, running iterative experiments, and refining the solution. Although the power of experiments can’t be ignored, organizations have to be cautious about the cost-effectiveness of such experiments. If time is spent creating the underlying infrastructure for enabling experiments, it further adds to the cost.
Developers need an integrated development environment (IDE) for data exploration and debugging of workflows, and different compute profiles for running these workflows. If you choose Amazon EMR for such use cases, you can use an IDE called Amazon EMR Studio for data exploration, transformation, version control, and debugging, and run Spark jobs to process large volume of data. Deploying Amazon EMR on Amazon EKS simplifies management, reduces costs, and improves performance. However, a data engineer or IT administrator needs to spend time creating the underlying infrastructure, configuring security, and creating a managed endpoint for users to connect to. This means such projects have to wait until these experts create the infrastructure.
In this post, we show how a data engineer or IT administrator can use the AWS Analytics Reference Architecture (ARA) to accelerate infrastructure deployment, saving your organization both time and money spent on these data analytics experiments. We use the library to deploy an Amazon Elastic Kubernetes (Amazon EKS) cluster, configure it to use Amazon EMR on EKS, and deploy a virtual cluster and managed endpoints and EMR Studio. You can then either run jobs on the virtual cluster or run exploratory data analysis with Jupyter notebooks on Amazon EMR Studio and Amazon EMR on EKS. The architecture below represent the infrastructure you will deploy with the AWS Analytics Reference Architecture.

Prerequisites
To follow along, you need to have an AWS account that is bootstrapped with the AWS Cloud Development Kit (AWS CDK). For instructions, refer to Bootstrapping. The following tutorial uses TypeScript, and requires version 2 or later of the AWS CDK. If you don’t have the AWS CDK installed, refer to Install the AWS CDK.
Set up an AWS CDK project
To deploy resources using the ARA, you first need to set up an AWS CDK project and install the ARA library. Complete the following steps:
- Create a folder named emr-eks-app:
- Initialize an AWS CDK project in an empty directory and run the following command:
- Install the ARA library:
- In lib/emr-eks-app.ts, import the ARA library as follows. The first line calls the ARA library, the second one defines AWS Identity and Access Management (IAM) policies:
Create and define an EKS cluster and compute capacity
To create an EMR on EKS virtual cluster, you first need to deploy an EKS cluster. The ARA library defines a construct called EmrEksCluster. The construct provisions an EKS cluster, enables IAM roles for service accounts, and deploys a set of supporting controllers like certificate manager controller (needed by the managed endpoint that is used by Amazon EMR Studio) as well as a cluster auto scaler to have an elastic cluster and save on cost when no job is submitted to the cluster.
In lib/emr-eks-app.ts, add the following line:
To learn more about the properties you can customize, refer to EmrEksClusterProps. There are two mandatory parameters in EmrEksCluster construct: The first is eksAdminRoleArn role is mandatory and is the role you use to interact with the Kubernetes control plane. This role must have administrative permissions to create or update the cluster. The second parameter is autoscaling, this parameter allows you to select the autoscaling mechanism, either Karpenter or native Kubernetes Cluster Autoscaler. In this blog we will use Karpenter and we recommend its use due to faster autoscaling, simplified node management and provisioning. Now you’re ready to define the compute capacity.
One way to define worker nodes in Amazon EKS is to use managed node groups. We use one node group called tooling, which hosts the coredns, ingress controller, certificate manager, Karpenter and any other pod that is necessary for the running EMR on EKS jobs or ManagedEndpoint. We also define default Karpenter Provisioners that define capacity to be used for jobs submitted by EMR on EKS. These Provisioners are optimized for different Spark use cases (critical jobs, non-critical job, experimentation and interactive sessions). The construct also allows you to submit your own provisioner defined by a Kubernetes manifest through a method called addKarpenterProvisioner. Let’s discuss the predefined Provisioners.
Default Provisioners configurations
The default provisioners are set for rapid experimentation and are always created by default. However, if you don’t want to use them, you can set the defaultNodeGroups parameter to false in the EmrEksCluster properties at creation time. The Provisioners are defined as follows and are created in each of the subnets that are used by Amazon EKS:
- Critical provisioner – It is dedicated to supporting jobs with aggressive SLAs and are time sensitive. The provisioner uses On-Demand Instances, which aren’t stopped, unlike Spot Instances, and their lifecycle follows through one of the jobs. The nodes use instance stores, which are NVMe disks physically attached to the host, which offer a high I/O throughput that allow better Spark performance, because it’s used as temporary storage for disk spill and shuffle. The instance types used in the node are of the m6gd family. The instances use the AWS Graviton processor, which offers better price/performance than x86 processors. To use this provisioner in your jobs, you can use the following sample configuration, which is referenced in the configuration override of the EMR on EKS job submission.
- Non-critical provisioner – This Provisioner leverage Spot Instances to save costs for jobs that aren’t time sensitive or jobs that are used for experiments. This node use Spot Instances because the jobs aren’t critical and can be interrupted. These instances can be stopped if the instance is reclaimed. The instance types used in the node are of the m6gd family, the driver is On-Demand and executors are on spot instances.
- Notebook provisioner – The Provisioner is for running managed endpoints that are used by Amazon EMR Studio for data exploration using Amazon EMR on EKS. The instances are of t3 family and are On-Demand for driver and Spot Instances for executors to keep the cost low. If the executor instances are stopped, new ones are started by Karpenter. If the executor instances are stopped too often, you can define your own that use On-Demand instances.
The following link provides more details about how each of the provisioner are defined. One import property that is defined in the default Provisioners is there is one for each AZ. This is important because it allows you to reduce inter-AZ network transfer cost when Spark runs a shuffle.
For this post, we use the default Provisioners, so you don’t need to add any lines of code for this section. If you want yo add your own Provisioners you can leverage the method addKarpenterProvisioner to apply your own manifests. You can use helper methods in Utils class like readYamlDocument to read YAML document and loadYaml load YAML files and pass them as arguments to addKarpenterProvisioner method.
Deploy the virtual cluster and an execution role
A virtual cluster is a Kubernetes namespace that Amazon EMR is registered with; when you submit a job, the driver and executor pods are running in the associated namespace. The EmrEksCluster construct offers a method called addEmrVirtualCluster, which creates the virtual cluster for you. The method takes EmrVirtualClusterOptions as a parameter, which has the following attributes:
- name – The name of your virtual cluster.
- createNamespace – An optional field that creates the EKS namespace. This is of type Boolean and by default it doesn’t create a separate EKS namespace, so your virtual cluster is created in the default namespace.
- eksNamespace – The name of the EKS namespace to be linked with the virtual EMR cluster. If no namespace is supplied, the construct uses the default namespace.
- In
lib/emr-eks-app.ts, add the following line to create your virtual cluster:Now we create the execution role, which is an IAM role that is used by the driver and executor to interact with AWS services. Before we can create the execution role for Amazon EMR, we need to first create the
ManagedPolicy. Note that in the following code, we create a policy to allow access to the Amazon Simple Storage Service (Amazon S3) bucket and Amazon CloudWatch logs. - In
lib/emr-eks-app.ts, add the following line to create the policy:If you want to use the AWS Glue Data Catalog, add its permission in the preceding policy.
Now we create the execution role for Amazon EMR on EKS using the policy defined in the previous step using the
createExecutionRoleinstance method. The driver and executor pods can then assume this role to access and process data. The role is scoped in such a way that only pods in the virtual cluster namespace can assume it. To learn more about the condition implemented by this method to restrict access to the role to only pods that are created by Amazon EMR on EKS in the namespace of the virtual cluster, refer to Using job execution roles with Amazon EMR on EKS. - In
lib/emr-eks-app.ts, add the following line to create the execution role:The preceding code produces an IAM role called
execRoleJobwith the IAM policy defined inemrekspolicyand scoped to the namespacedataanalysis. - Lastly, we output parameters that are important for the job run:
Deploy Amazon EMR Studio and provision users
To deploy an EMR Studio for data exploration and job authoring, the ARA library has a construct called NotebookPlatform. This construct allows you to deploy as many EMR Studios as you need (within the account limit) and set them up with the authentication mode that is suitable for you and assign users to them. To learn more about the authentication modes available in Amazon EMR Studio, refer to Choose an authentication mode for Amazon EMR Studio.
The construct creates all the necessary IAM roles and policies needed by Amazon EMR Studio. It also creates an S3 bucket where all the notebooks are stored by Amazon EMR Studio. The bucket is encrypted with a customer managed key (CMK) generated by the AWS CDK stack. The following steps show you how to create your own EMR Studio with the construct.
The notebook platform construct takes NotebookPlatformProps as a property, which allows you to define your EMR Studio, a namespace, the name of the EMR Studio, and its authentication mode.
- In
lib/emr-eks-app.ts, add the following line:For this post, we use IAM users so that you can easily reproduce it in your own account. However, if you have IAM federation or single sign-on (SSO) already in place, you can use them instead of IAM users.To learn more about the parameters of
NotebookPlatformProps, refer to NotebookPlatformProps.Next, we need to create and assign users to the Amazon EMR Studio. For this, the construct has a method called
addUserthat takes a list of users and either assigns them to Amazon EMR Studio in case of SSO or updates the IAM policy to allows access to Amazon EMR Studio for the provided IAM users. The user can also have multiple managed endpoints, and each user can have their Amazon EMR version defined. They can use a different set of Amazon Elastic Compute Cloud (Amazon EC2) instances and different permissions using job execution roles. - In
lib/emr-eks-app.ts, add the following line:In the preceding code, for the sake of brevity, we reuse the same IAM policy that we created in the execution role.
Note that the construct optimizes the number of managed endpoints that are created. If two endpoints have the same name, then only one is created.
- Now that we have defined our deployment, we can deploy it:
You can find a sample project that contains all the steps of the walk through in the following GitHub repository.
When the deployment is complete, the output contains the S3 bucket containing the assets for podTemplate, the link for the EMR Studio, and the EMR Studio virtual cluster ID. The following screenshot shows the output of the AWS CDK after the deployment is complete.

Submit jobs

Because we’re using the default Provisioners, we will use the podTemplate that is defined by the construct available on the ARA GitHub repository. These are uploaded for you by the construct to an S3 bucket called <clustername>-emr-eks-assets; you only need to refer to them in your Spark job. In this job, you also use the job parameters in the output at the end of the AWS CDK deployment. These parameters allow you to use the AWS Glue Data Catalog and implement Spark on Kubernetes best practices like dynamicAllocation and pod collocation. At the end of cdk deploy ARA will output job sample configurations with the best practices listed before that you can use to submit a job. You can submit a job as follows.
A job run is a unit of work such as a Spark JAR file that is submitted to the EMR on EKS cluster. We start a job using the start-job-run command. Note you can use SparkSubmitParameters to specify the Amazon S3 path to the pod template, as shown in the following command:
The code takes the following values:
- <CLUSTER-ID> – The EMR virtual cluster ID
- <SPARK-JOB-NAME> – The name of your Spark job
- <ROLE-ARN> – The execution role you created
- <S3URI-SPARK-JOB> – The Amazon S3 URI of your Spark job
- <S3URI-CRITICAL-DRIVER> – The Amazon S3 URI of the driver pod template, which you get from the AWS CDK output
- <S3URI-CRITICAL-EXECUTOR> – The Amazon S3 URI of the executor pod template
- <Log_Group_Name> – Your CloudWatch log group name
- <Log_Stream_Prefix> – Your CloudWatch log stream prefix
You can go to the Amazon EMR console to check the status of your job and to view logs. You can also check the status by running the describe-job-run command:
Explore data using Amazon EMR Studio
In this section, we show how you can create a workspace in Amazon EMR Studio and connect to the Amazon EKS managed endpoint from the workspace. From the output, use the link to Amazon EMR Studio to navigate to the EMR Studio deployment. You must sign in with the IAM username you provided in the addUser method.
Create a Workspace
To create a Workspace, complete the following steps:
- Log in to the EMR Studio created by the AWS CDK.
- Choose Create Workspace.
- Enter a workspace name and an optional description.
- Select Allow Workspace Collaboration if you want to work with other Studio users in this Workspace in real time.
- Choose Create Workspace.

After you create the Workspace, choose it from the list of Workspaces to open the JupyterLab environment.

The following screenshot shows what the terminal looks like. For more information about the user interface, refer to Understand the Workspace user interface.

Connect to an EMR on EKS managed endpoint
You can easily connect to the EMR on EKS managed endpoint from the Workspace.
- In the navigation pane, on the Clusters menu, select EMR Cluster on EKS for Cluster type.
The virtual clusters appear on the EMR Cluster on EKS drop-down menu, and the endpoint appears on the Endpoint drop-down menu. If there are multiple endpoints, they appear here, and you can easily switch between endpoints from the Workspace. - Select the appropriate endpoint and choose Attach.


Work with a notebook
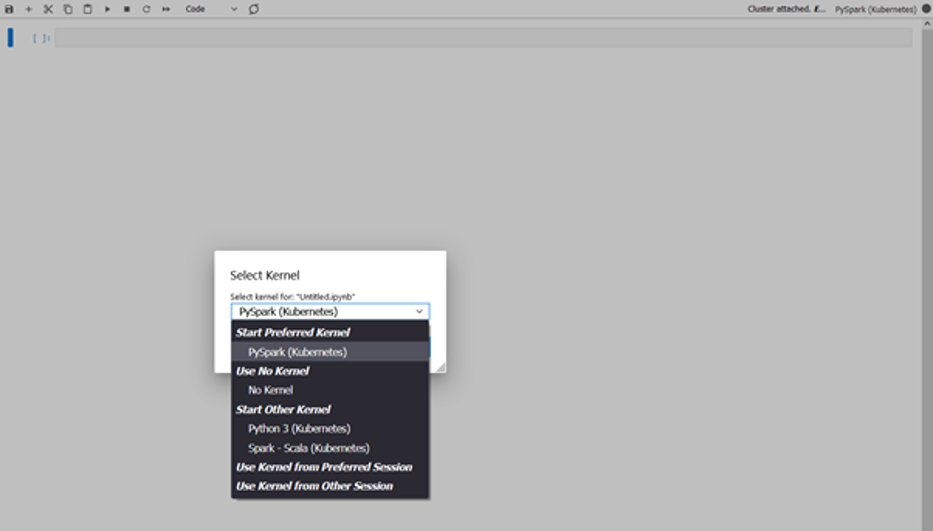
You can now open a notebook and connect to a preferred kernel to do your tasks. For instance, you can select a PySpark kernel, as shown in the following screenshot.
Explore your data
The first step of our data exploration exercise is to create a Spark session and then load the New York taxi dataset from the S3 bucket into a data frame. Use the following code block to load the data into a data frame. Copy the Amazon S3 URI for the location where the dataset resides in Amazon S3.
After we load the data into a data frame, we replace the data of the current_date column with the actual current date, count the number of rows, and save the data into a Parquet file:
The following screenshot shows the result of our notebook running on Amazon EMR Studio and with PySpark running on Amazon EMR on EKS.

Clean up
To clean up after this post, run cdk destroy.
Conclusion
In this post, we showed how you can use the ARA to quickly deploy a data analytics infrastructure and start experimenting with your data. You can find the full example referenced in this post in the GitHub repository. The AWS Analytics Reference Architecture implements common Analytics pattern and AWS best practices to offer you ready to use constructs to for your experiments. One of the patterns is the data mesh, which you can consult how to use in this blog post.
You can also explore other constructs offered in this library to experiment with AWS Analytics services before transitioning your workload for production.
About the Authors
 Lotfi Mouhib is a Senior Solutions Architect working for the Public Sector team with Amazon Web Services. He helps public sector customers across EMEA realize their ideas, build new services, and innovate for citizens. In his spare time, Lotfi enjoys cycling and running.
 Sandipan Bhaumik is a Senior Analytics Specialist Solutions Architect based in London. He has worked with customers in different industries like Banking & Financial Services, Healthcare, Power & Utilities, Manufacturing and Retail helping them solve complex challenges with large-scale data platforms. At AWS he focuses on strategic accounts in the UK and Ireland and helps customers to accelerate their journey to the cloud and innovate using AWS analytics and machine learning services. He loves playing badminton, and reading books.
The Lenovo ThinkCentre neo 50q Gen 4 is a New 1L 13th Gen Intel Tiny with a Catch
Post Syndicated from Cliff Robinson original https://www.servethehome.com/__trashed-2/
The Lenovo ThinkCentre neo 50q Gen 4 is a new 1L PC option based on the 13th Gen Intel Core series, but its CES 2023 announcement has a catch
The post The Lenovo ThinkCentre neo 50q Gen 4 is a New 1L 13th Gen Intel Tiny with a Catch appeared first on ServeTheHome.
[$] Per-extent encrypted keys for fscrypt
Post Syndicated from original https://lwn.net/Articles/918893/
The kernel’s fscrypt
subsystem enables filesystems to store files and
directories in encrypted form, protecting them against offline attacks. A
few filesystems support encryption with fscrypt currently, but Btrfs is an
exception, despite a number of attempts to add this feature. The problem
is that, as so often seems to be the case, Btrfs works differently and does
not fit well with one of the key assumptions in the design of fscrypt. With this
patch series, Sweet Tea Dorminy is working to enhance fscrypt to be a
better fit for filesystems like Btrfs.
Year in Review: Rapid7 Cybersecurity Research
Post Syndicated from Tom Caiazza original https://blog.rapid7.com/2023/01/05/year-in-review-rapid7-cybersecurity-research/

Welcome to 2023, a year that sounds so futuristic it is hard to believe it is real. But real it is, and make no mistake, threat actors are still out there, working hard to get into networks the world over. So, at the start of the new year, I am reminded of two particular phrases: Those who do not learn from their past are doomed to repeat it, and history doesn’t repeat itself, but it rhymes.
With those cautionary words in mind, let’s take a brief look back at a smattering of the research we conducted in 2022. Hopefully, you will find some overlooked lessons from the past to keep your organizations safe here <cue excessive reverb> in the future.
Trends Gonna Trend
Some of Rapid7’s most important research is focused on the current state of cybersecurity and threat landscape. This research is designed to glean critical insights into threat actor tactics and how the security industry works to combat them. Below are four reports based on this type of research.
Vulnerability Intelligence Report
One of our most pored over reports, the Vulnerability Intelligence Report looks at threats that emerged in the previous year. This year, we identified many worrying (and some downright critical) trends in the vulnerability management space. For example, we found that widespread threats were up 130% from 202o and roughly half of them were zero-day exploits. Additionally, the time to known exploitation of vulnerabilities shrunk to under a week. It’s a sobering report, without a doubt.
Cloud Misconfigurations Report
Securing cloud instances has become a major part of keeping organizations safe from risk. That’s not exactly an earth-shattering statement. We all know how important cloud security is. However, our Cloud Misconfiguration Report found that even some of the world’s largest (and resource rich) organizations neglect to put some basic, common sense protections in place. So, clearly, there is still work to be done.
Pain Points: Ransomware Data Disclosure Trends
Ransomware has been on the rise for several years and continues to evolve as quickly as cybersecurity professionals find ways to combat it. One way it has evolved over the last few years is with the rise in double extortion. In this type of attack, threat actors exfiltrate an organization’s data before encrypting it. Then, they threaten to leak or sell that data unless a ransom is paid.
In this first of its kind report, we looked at data disclosures associated with double extortion campaigns and extracted some interesting trends including the industries most affected by these attacks, who is conducting them, and when they occur.
Passwords, we’ve all got them, but that doesn’t mean we are great at using them to their full potential. We cross referenced well-known password repositories with our own honeypots for SSH and RDP credentials to determine how well organizations use secure credentialing. The results were grim. This report details the results of our research and offers some tips on how to improve passwords (password managers to the front!).
All Cybersecurity is Local
Global trends are important, but keeping it local can help us understand the intricacies of security in our own neck of the woods. In this report, we took a deep dive into one geographical region to provide critical insights that improve security.
We took a look at the ASX200, the stock market index of companies listed on the Australian Stock Exchange. We found that though there is always room for improvement, by and large, the ASX200 companies are on equal security footing as some of their larger counterparts around the globe. And to further dispel any lingering FUD, they’ve measurably improved since the last time we looked at this sector in 2021, so go on ya, Aussie infosec pros!
The Future of Cybersecurity
At Rapid7, we don’t just look at the current state of the cybersecurity industry, we actively strive to improve it. Often, that means deep research into the future of cybersecurity tools and practices. This year was no exception. We’re quite proud of these reports and the potential they have to make us all a little bit safer.
Optimising Vulnerability Triage in DAST with Deep Learning
This may sound like the title to a formal academic paper (and vaguely British) and that’s because it is. Rapid7 was honored to have a research paper on machine learning techniques to improve false positives in DAST solutions accepted by a journal published by the Association for Computing Machinery.
Our researchers created a machine learning technique that can reduce false positives in DAST solutions by 96% allowing security professionals more time to focus on triaging actual threats and remediating them, rather than heading on wild goose chases caused by false positives.
Delivering Enterprise IoT Solutions Securely: The Domino’s Pizza Story
Companies large and small struggle with securing their IoT infrastructure from attackers. So, when the opportunity came to observe (and dissect) one company that seems to be doing it right, we jumped at the chance. In this report we partnered with Domino’s Pizza to look at their IoT operation and they were gracious enough to allow our expert pentesters and code auditors to tear it apart and see how they do it. It’s an excellent read for anyone looking to see some of the best practices in IoT security in use today.
2023 Here We Come
These are just a few of the great research papers we released last year. It has long been our mission to not only provide the best security platform and services available, but to help the entire cybersecurity community close the security achievement gap.
Our research departments take that mission very seriously and you can bet that we will be entering 2023 with a big ol’ list of research papers looking at the latest in cybersecurity innovation and best practices. We are grateful that you joined us on our journey last year and hope that you’ll be along for the ride again this year.
Security updates for Thursday
Post Syndicated from original https://lwn.net/Articles/919112/
Security updates have been issued by Fedora (binwalk), Oracle (kernel and webkit2gtk3), Red Hat (webkit2gtk3), Slackware (vim), and Ubuntu (libksba and nautilus).
The most visited AWS DevOps blogs in 2022
Post Syndicated from original https://aws.amazon.com/blogs/devops/the-most-visited-aws-devops-blogs-in-2022/
As we kick off 2023, I wanted to take a moment to highlight the top posts from 2022. Without further ado, here are the top 10 AWS DevOps Blog posts of 2022.
#1: Integrating with GitHub Actions – CI/CD pipeline to deploy a Web App to Amazon EC2
Coming in at #1, Mahesh Biradar, Solutions Architect and Suresh Moolya, Cloud Application Architect use GitHub Actions and AWS CodeDeploy to deploy a sample application to Amazon Elastic Compute Cloud (Amazon EC2).

#2: Deploy and Manage GitLab Runners on Amazon EC2
Sylvia Qi, Senior DevOps Architect, and Sebastian Carreras, Senior Cloud Application Architect, guide us through utilizing infrastructure as code (IaC) to automate GitLab Runner deployment on Amazon EC2.

#3 Multi-Region Terraform Deployments with AWS CodePipeline using Terraform Built CI/CD
Lerna Ekmekcioglu, Senior Solutions Architect, and Jack Iu, Global Solutions Architect, demonstrate best practices for multi-Region deployments using HashiCorp Terraform, AWS CodeBuild, and AWS CodePipeline.

#4 Use the AWS Toolkit for Azure DevOps to automate your deployments to AWS
Mahmoud Abid, Senior Customer Delivery Architect, leverages the AWS Toolkit for Azure DevOps to deploy AWS CloudFormation stacks.

#5 Deploy and manage OpenAPI/Swagger RESTful APIs with the AWS Cloud Development Kit
Luke Popplewell, Solutions Architect, demonstrates using AWS Cloud Development Kit (AWS CDK) to build and deploy Amazon API Gateway resources using the OpenAPI specification.

#6: How to unit test and deploy AWS Glue jobs using AWS CodePipeline
Praveen Kumar Jeyarajan, Senior DevOps Consultant, and Vaidyanathan Ganesa Sankaran, Sr Modernization Architect, discuss unit testing Python-based AWS Glue Jobs in AWS CodePipeline.

#7: Jenkins high availability and disaster recovery on AWS
James Bland, APN Global Tech Lead for DevOps, and Welly Siauw, Sr. Partner solutions architect, discuss the challenges of architecting Jenkins for scale and high availability (HA).

#8: Monitor AWS resources created by Terraform in Amazon DevOps Guru using tfdevops
Harish Vaswani, Senior Cloud Application Architect, and Rafael Ramos, Solutions Architect, explain how you can configure and use tfdevops to easily enable Amazon DevOps Guru for your existing AWS resources created by Terraform.

#9: Manage application security and compliance with the AWS Cloud Development Kit and cdk-nag
Arun Donti, Senior Software Engineer with Twitch, demonstrates how to integrate cdk-nag into an AWS Cloud Development Kit (AWS CDK) application to provide continual feedback and help align your applications with best practices.

#10: Smithy Server and Client Generator for TypeScript (Developer Preview)
Adam Thomas, Senior Software Development Engineer, demonstrate how you can use Smithy to define services and SDKs and deploy them to AWS Lambda using a generated client.

A big thank you to all our readers! Your feedback and collaboration are appreciated and help us produce better content.
About the author:
Gender Balance in Computing — the big picture
Post Syndicated from Sue Sentance original https://www.raspberrypi.org/blog/gender-balance-in-computing-big-picture/
Improving gender balance in computing is part of our work to ensure equitable learning opportunities for all young people. Our Gender Balance in Computing (GBIC) research programme has been the largest effort to date to explore ways to encourage more girls and young women to engage with Computing.

Commissioned by the Department for Education in England and led by the Raspberry Pi Foundation as part of our National Centre for Computing Education work, the GBIC programme was a collaborative effort involving the Behavioural Insights Team, Apps for Good, and the WISE Campaign.
Gender Balance in Computing ran from 2019 to 2022 and comprised seven studies relating to five different research areas:
- Teaching Approach:
- Peer Instruction: Collaborative teaching approach in lower secondary
- Pair Programming: Working collaboratively in upper primary
- Storytelling: Connecting computing to storytelling with 6- to 7-year-olds
- Belonging: Supporting learners to feel that they “belong” in computer science
- Non-formal Learning: Establishing the connections between in-school and out-of-school computing
- Relevance: Making computing relatable to everyday life
- Subject Choice: How computer science is presented to young people as a subject choice
In December we published the last of seven reports describing the results of the programme. In this blog post I summarise our overall findings and reflect on what we’ve learned through doing this research.
Gender balance in computing is not a new problem
I was fascinated to read a paper by Deborah Butler from 2000 which starts by summarising themes from research into gender balance in computing from the 1980s and 1990s, for example that boys may have access to more role models in computing and may receive more encouragement to pursue the subject, and that software may be developed with a bias towards interests traditionally considered to be male. Butler’s paper summarises research from at least two decades ago — have we really made progress?

In England, it’s true that making Computing a mandatory subject from age 5 means we have taken great strides forward; the need for young people to make a choice about studying the subject only arises at age 14. However, statistics for England’s externally assessed high-stakes Computer Science courses taken at ages 14–16 (GCSE) and 16–18 (A level) clearly show that, although there is a small upwards trend in the proportion of female students, particularly for A level, gender balance among the students achieving GCSE/A level qualifications remains an issue:
| Computer Science qualification (England): | In 2018: | In 2021: | In 2022: |
| GCSE (age 16) | 20.41% | 20.77% | 21.37% |
| A level (age 18) | 11.74% | 14.71% | 15.17% |
What did we do in the Gender Balance in Computing programme?
In GBIC, we carried out a range of research studies involving more than 14,500 pupils and 725 teachers in England. Implementation teams came from the Foundation, Apps For Good, the WISE Campaign, and the Behavioural Insights Team (BIT). A separate team at BIT acted as the independent evaluators of all the studies.
In total we conducted the following studies:
- Two feasibility studies: Storytelling; Relevance, which led to a full randomised controlled trial (RCT)
- Five RCTs: Belonging; Peer Instruction; Pair Programming; Relevance, which was preceded by a feasibility study; Non-formal Learning (primary)
- One quasi-experimental study: Non-formal Learning (secondary)
- One exploratory research study: Subject Choice (Subject choice evenings and option booklets)
Each study (apart from the exploratory research study) involved a 12-week intervention in schools. Bespoke materials were developed for all the studies, and teachers received training on how to deliver the intervention they were a part of. For the RCTs, randomisation was done at school level: schools were randomly divided into treatment and control groups. The independent evaluators collected both quantitative and qualitative data to ensure that we gained comprehensive insights from the schools’ experiences of the interventions. The evaluators’ reports and our associated blog posts give full details of each study.
The impact of the pandemic
The research programme ran from 2019 to 2022, and as it was based in schools, we faced a lot of challenges due to the coronavirus pandemic. Many research programmes meant to take place in school were cancelled as soon as schools shut during the pandemic.

Although we were fortunate that GBIC was allowed to continue, we were not allowed to extend the end date of the programme. Thus our studies were compressed into the period after schools reopened and primarily delivered in the academic year 2021/2022. When schools were open again, the implementation of the studies was affected by teacher and pupil absences, and by schools necessarily focusing on making up some of the lost time for learning.
The overall results of Gender Balance in Computing
Quantitatively, none of the RCTs showed a statistically significant impact on the primary outcome measured, which was different in different trials but related to either learners’ attitudes to computer science or their intention to study computer science. Most of the RCTs showed a positive impact that fell just short of statistical significance. The evaluators went to great lengths to control for pandemic-related attrition, and the implementation teams worked hard to support teachers in still delivering the interventions as designed, but attrition and disruptions due to the pandemic may have played a part in the results.

The qualitative research results were more encouraging. Teachers were enthusiastic about the approaches we had chosen in order to address known barriers to gender balance, and the qualitative data indicated that pupils reacted positively to the interventions. One key theme across the Teaching Approach (and other) studies was that girls valued collaboration and teamwork. The data also offered insights that enable us to improve on the interventions.
We designed the studies so they could act as pilots that may be rolled out at a national scale. While we have gained sufficient understanding of what works to be able to run the interventions at a larger scale, two particular learnings shape our view of what a large-scale study should look like:
1. A single intervention may not be enough to have an impact
The GBIC results highlight that there is no quick fix and suggest that we should combine some of the approaches we’ve been trialling to provide a more holistic approach to teaching Computing in an equitable way. We would recommend that schools adopt several of the approaches we’ve tested; the materials associated with each intervention are freely available (see our blog posts for links).
2. Age matters
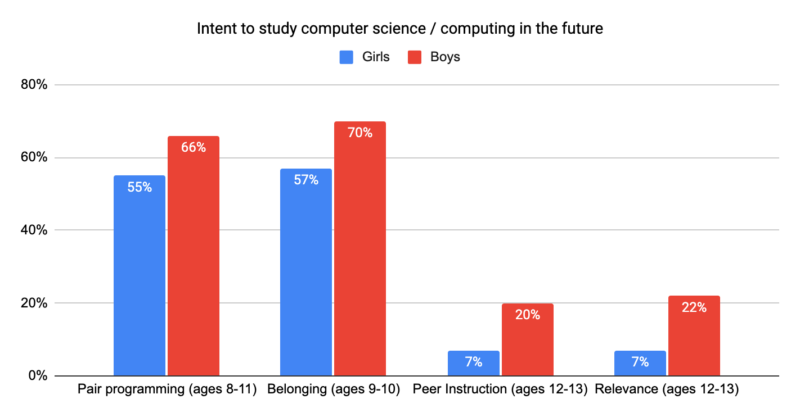
One of the very interesting overall findings from this research programme was the difference in intent to study Computing between primary school and secondary school learners; fewer secondary school learners reported intent to study the subject further. This difference was observed for both girls and boys, but was more marked for girls, as shown in the graph below. This suggests that we need to double down on supporting children, especially girls, to maintain their interest in Computing as they enter secondary school at age 11. It also points to a need for more longitudinal research to understand more about the transition period from primary to secondary school and how it impacts children’s engagement with computer science and technology in general.
What’s next?
We think that more time (in excess of 12 weeks) is needed to both deliver the interventions and measure their outcome, as the change in learners’ attitudes may be slow to appear, and we’re hoping to engage in more longitudinal research moving forward.

We know that an understanding of computer science can improve young people’s access to highly skilled jobs involving technology and their understanding of societal issues, and we need that to be available to all. However, gender balance relating to computing and technology is a deeply structural issue that has existed for decades throughout the computing education and workplace ecosystem. That’s why we intend to pursue more work around a holistic approach to improving gender balance, aligning with our ongoing research into making computing education culturally relevant.
Stay in touch
We are very keen to continue to build on our research on gender balance in computing. If you’d like to support us in any way, we’d love to hear from you. To explore the research projects we’re currently involved in, check out our research pages and visit the website of the Raspberry Pi Computing Education Research Centre at the University of Cambridge.
The post Gender Balance in Computing — the big picture appeared first on Raspberry Pi.
Nikon 85mm F1.2S Z Lens
Post Syndicated from Matt Granger original https://www.youtube.com/watch?v=qHi5b2GUoe8
Changing firmware config that doesn’t want to be changed
Post Syndicated from original https://mjg59.dreamwidth.org/63787.html
Today I had to deal with a system that had an irritating restriction – a firmware configuration option I really wanted to be able to change appeared as a greyed out entry in the configuration menu. Some emails revealed that this was a deliberate choice on the part of the system vendor, so that seemed to be that. Thankfully in this case there was a way around that.
One of the things UEFI introduced was a mechanism to generically describe firmware configuration options, called Visual Forms Representation (or VFR). At the most straightforward level, this lets you define a set of forms containing questions, with each question associated with a value in a variable. Questions can be made dependent upon the answers to other questions, so you can have options that appear or disappear based on how other questions were answered. An example in this language might be something like:
CheckBox Prompt: "Console Redirection", Help: "Console Redirection Enable or Disable.", QuestionFlags: 0x10, QuestionId: 53, VarStoreId: 1, VarStoreOffset: 0x39, Flags: 0x0
In which question 53 asks whether console redirection should be enabled or disabled. Other questions can then rely on the answer to question 53 to influence whether or not they’re relevant (eg, if console redirection is disabled, there’s no point in asking which port it should be redirected to). As a checkbox, if it’s set then the value will be set to 1, and 0 otherwise. But where’s that stored? Earlier we have another declaration:
VarStore GUID: EC87D643-EBA4-4BB5-A1E5-3F3E36B20DA9, VarStoreId: 1, Size: 0xF4, Name: "Setup"
A UEFI variable called “Setup” and with GUID EC87D643-EBA4-4BB5-A1E5-3F3E36B20DA9 is declared as VarStoreId 1 (matching the declaration in the question) and is 0xf4 bytes long. The question indicates that the offset for that variable is 0x39. Rewriting Setup-EC87D643-EBA4-4BB5-A1E5-3F3E36B20DA9 with a modified value in offset 0x39 will allow direct manipulation of the config option.
But how do we get this data in the first place? VFR isn’t built into the firmware directly – instead it’s turned into something called Intermediate Forms Representation, or IFR. UEFI firmware images are typically in a standardised format, and you can use UEFITool to extract individual components from that firmware. If you use UEFITool to search for “Setup” there’s a good chance you’ll be able to find the component that implements the setup UI. Running IFRExtractor-RS against it will then pull out any IFR data it finds, and decompile that into something resembling the original VFR. And now you have the list of variables and offsets and the configuration associated with them, even if your firmware has chosen to hide those options from you.
Given that a bunch of these config values may be security relevant, this seems a little concerning – what stops an attacker who has access to the OS from simply modifying these variables directly? UEFI avoids this by having two separate stages of boot, one where the full firmware (“Boot Services”) is available, and one where only a subset (“Runtime Services”) is available. The transition is triggered by the OS calling ExitBootServices, indicating the handoff from the firmware owning the hardware to the OS owning the hardware. This is also considered a security boundary – before ExitBootServices everything running has been subject to any secure boot restrictions, and afterwards applications can do whatever they want. UEFI variables can be flagged as being visible in both Boot and Runtime Services, or can be flagged as Boot Services only. As long as all the security critical variables are Boot Services only, an attacker should never be able to run untrusted code that could alter them.
In my case, the firmware option I wanted to alter had been enclosed in “GrayOutIf True” blocks. But the questions were still defined and the code that acted on those options was still present, so simply modifying the variables while still inside Boot Services gave me what I wanted. Note that this isn’t a given! The presence of configuration options in the IFR data doesn’t mean that anything will later actually read and make use of that variable – a vendor may have flagged options as unavailable and then removed the code, but never actually removed the config data. And also please do note that the reason stuff was removed may have been that it doesn’t actually work, and altering any of these variables risks bricking your hardware in a way that’s extremely difficult to recover. And there’s also no requirement that vendors use IFR to describe their configuration, so you may not get any help here anyway.
In summary: if you do this you may break your computer. If you don’t break your computer, it might not work anyway. I’m not going to help you try to break your computer. And I didn’t come up with any of this, I just didn’t find it all written down in one place while I was researching it.
 comments
AMD Instinct MI300 Breaks Cover at CES 2023
Post Syndicated from Patrick Kennedy original https://www.servethehome.com/amd-instinct-mi300-breaks-cover-at-ces-2023/
The AMD Instinct MI300 was shown at CES 2023 this year along with new details about the multi-chip CPU, GPU, and HBM3 memory part
The post AMD Instinct MI300 Breaks Cover at CES 2023 appeared first on ServeTheHome.
AMD Genoa-X Trending to Over 1.1GB of L3 Cache Based on New AMD Ryzen 7950X3D
Post Syndicated from Cliff Robinson original https://www.servethehome.com/amd-genoa-x-trending-to-over-1-1gb-of-l3-cache-based-on-new-amd-ryzen-7950x3d/
The launch of the new 16-core AMD Ryzen 9 7950X3D, 12-core 7900X3D, and 8-core 7800X3D points to AMD Genoa-X having over 1.1GB of L3 cache
The post AMD Genoa-X Trending to Over 1.1GB of L3 Cache Based on New AMD Ryzen 7950X3D appeared first on ServeTheHome.
Graph service platform
Post Syndicated from Grab Tech original https://engineering.grab.com/graph-service-platform
Introduction
In earlier articles of this series, we covered the importance of graph networks, graph concepts, how graph visualisation makes fraud investigations easier and more effective, and how graphs for fraud detection work. In this article, we elaborate on the need for a graph service platform and how it works.
In the present age, data linkages can generate significant business value. Whether we want to learn about the relationships between users in online social networks, between users and products in e-commerce, or understand credit relationships in financial networks, the capability to understand and analyse large amounts of highly interrelated data is becoming more important to businesses.
As the amount of consumer data grows, the GrabDefence team must continuously enhance fraud detection on mobile devices to proactively identify the presence of fraudulent or malicious users. Even simple financial transactions between users must be monitored for transaction loops and money laundering. To preemptively detect such scenarios, we need a graph service platform to help discover data linkages.
Background
As mentioned in an earlier article, a graph is a model representation of the association of entities and holds knowledge in a structured way by marginalising entities and relationships. In other words, graphs hold a natural interpretability of linked data and graph technology plays an important role. Since the early days, large tech companies started to create their own graph technology infrastructure, which is used for things like social relationship mining, web search, and sorting and recommendation systems with great commercial success.
As graph technology was developed, the amount of data gathered from graphs started to grow as well, leading to a need for graph databases. Graph databases1 are used to store, manipulate, and access graph data on the basis of graph models. It is similar to the relational database with the feature of Online Transactional Processing (OLTP), which supports transactions, persistence, and other features.
A key concept of graphs is the edge or relationship between entities. The graph relates the data items in the store to a collection of nodes and edges, the edges representing the relationships between the nodes. These relationships allow data in the store to be linked directly and retrieved with one operation.
With graph databases, relationships between data can be queried fast as they are perpetually stored in the database. Additionally, relationships can be intuitively visualised using graph databases, making them useful for heavily interconnected data. To have real-time graph search capabilities, we must leverage the graph service platform and graph databases.
Architecture details
Graph services with graph databases are Platforms as a Service (PaaS) that encapsulate the underlying implementation of graph technology and support easier discovery of data association relationships with graph technologies.
They also provide universal graph operation APIs and service management for users. This means that users do not need to build graph runtime environments independently and can explore the value of data with graph service directly.
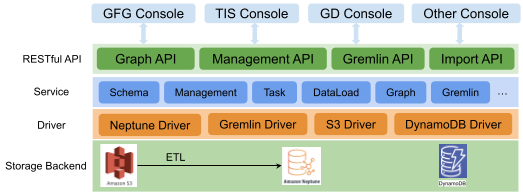
As shown in Fig. 1, the system can be divided into four layers:
- Storage backend – Different forms of data (for example, CSV files) are stored in Amazon S3, graph data stores in Neptune and meta configuration stores in DynamoDB.
- Driver – Contains drivers such as Gremlin, Neptune, S3, and DynamoDB.
- Service – Manages clusters, instances, databases etc, provides management API, includes schema and data load management, graph operation logic, and other graph algorithms.
- RESTful APIs – Currently supports the standard and uniform formats provided by the system, the Management API, Search API for OLTP, and Analysis API for online analytical processing (OLAP).
How it works
Graph flow
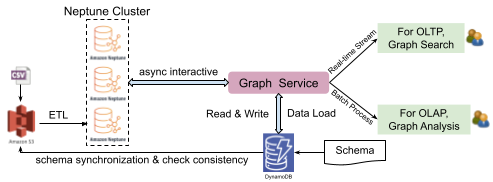
CSV files stored in Amazon S3 are processed by extract, transform, and load (ETL) tools to generate graph data. This data is then managed by an Amazon Neptune DB cluster, which can only be accessed by users through graph service. Graph service converts user requests into asynchronous interactions with Neptune Cluster, which returns the results to users.
When users launch data load tasks, graph service synchronises the entity and attribute information with the CSV file in S3, and the schema stored in DynamoDB. The data is only imported into Neptune if there are no inconsistencies.
The most important component in the system is the graph service, which provides RESTful APIs for two scenarios: graph search for real-time streams and graph analysis for batch processing. At the same time, the graph service manages clusters, databases, instances, users, tasks, and meta configurations stored in DynamoDB, which implements features of service monitor and data loading offline or stream ingress online.
Use case in fraud detection
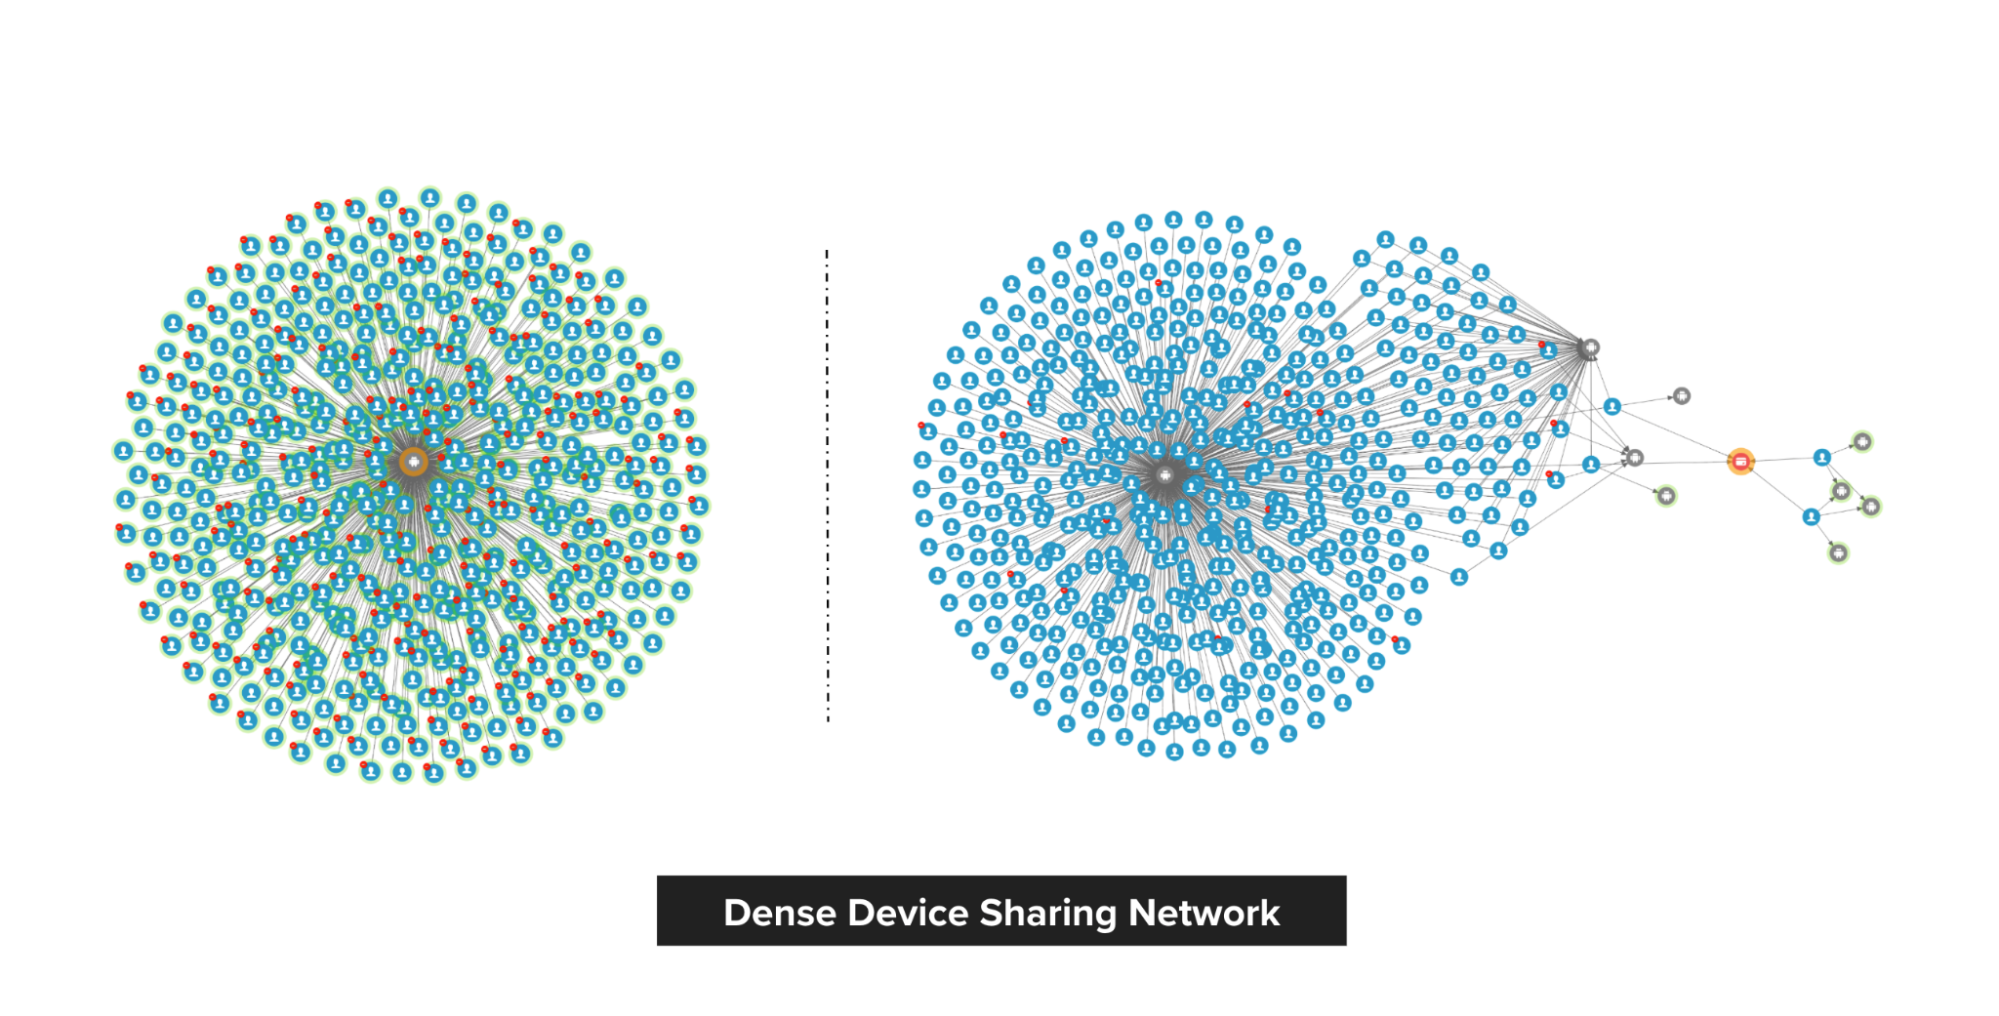
In Grab’s mobility business, we have come across situations where multiple accounts use shared physical devices to maximise their earning potential. With the graph capabilities provided by the graph service platform, we can clearly see the connections between multiple accounts and shared devices.
Historical device and account data are stored in the graph service platform via offline data loading or online stream injection. If the device and account data exists in the graph service platform, we can find the adjacent account IDs or the shared device IDs by using the device ID or account ID respectively specified in the user request.
In our experience, fraudsters tend to share physical resources to maximise their revenue. The following image shows a device that is shared by many users. With our Graph Visualisation platform based on graph service, you can see exactly what this pattern looks like.
Data injection
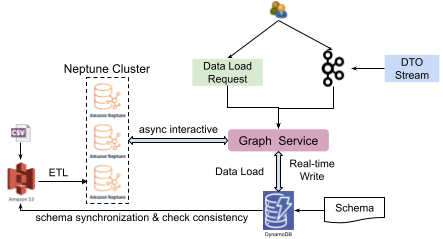
Graph service also supports data injection features, including data load by request (task with a type of data load) and real-time stream write by Kafka.
When connected to GrabDefence’s infrastructure, Confluent with Kafka is used as the streaming engine. The purpose of using Kafka as a streaming write engine is two-fold: to provide primary user authentication and to relieve the pressure on Neptune.
Impact
Graph service supports data management of Labelled Property Graphs and provides the capability to add, delete, update, and get vertices, edges, and properties for some graph models. Graph traversal and searching relationships with RESTful APIs are also more convenient with graph service.
Businesses usually do not need to focus on the underlying data storage, just designing graph schemas for model definition according to their needs. With the graph service platform, platforms or systems can be built for personalised search, intelligent Q&A, financial fraud, etc.
For big organisations, extensive graph algorithms provide the power to mine various entity connectivity relationships in massive amounts of data. The growth and expansion of new businesses is driven by discovering the value of data.
What’s next?
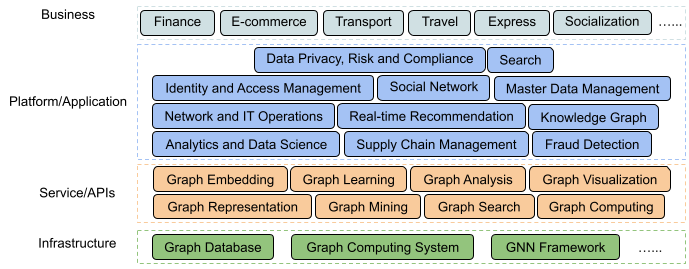
We are building an integrated graph ecosystem inside and outside Grab. The infrastructure and service, or APIs are key components in graph-centric ecosystems; they provide graph arithmetic and basic capabilities of graphs in relation to search, computing, analysis etc. Besides that, we will also consider incorporating applications such as risk prediction and fraud detection in order to serve our current business needs.
Join us
Grab is the leading superapp platform in Southeast Asia, providing everyday services that matter to consumers. More than just a ride-hailing and food delivery app, Grab offers a wide range of on-demand services in the region, including mobility, food, package and grocery delivery services, mobile payments, and financial services across 428 cities in eight countries.
Powered by technology and driven by heart, our mission is to drive Southeast Asia forward by creating economic empowerment for everyone. If this mission speaks to you, join our team today!
References
[$] LWN.net Weekly Edition for January 5, 2023
Post Syndicated from original https://lwn.net/Articles/918367/
The LWN.net Weekly Edition for January 5, 2023 is available.