Post Syndicated from The History Guy: History Deserves to Be Remembered original https://www.youtube.com/shorts/Vd3p3ZZ2mWQ
Interoperability
Post Syndicated from xkcd.com original https://xkcd.com/3105/
Streamline Operational Troubleshooting with Amazon Q Developer CLI
Post Syndicated from Kirankumar Chandrashekar original https://aws.amazon.com/blogs/devops/streamline-operational-troubleshooting-with-amazon-q-developer-cli/
Amazon Q Developer is the most capable generative AI–powered assistant for software development, helping developers perform complex workflows. Amazon Q Developer command-line interface (CLI) combines conversational AI with direct access to AWS services, helping you understand, build, and operate applications more effectively. The Amazon Q Developer CLI executes commands, analyzes outputs, and provides contextual recommendations based on best practices for troubleshooting tools and platforms available on your local machine.
In today’s cloud-native environments, troubleshooting production issues often involves juggling multiple terminal windows, parsing through extensive log files, and navigating numerous AWS console pages. This constant context-switching delays problem resolution and adds cognitive burden to teams managing cloud infrastructure.
In this blog post, you will explore how Amazon Q Developer CLI transforms the troubleshooting experience by streamlining challenging scenarios through conversational interactions.
The Traditional Troubleshooting Experience
When issues arise, engineers typically spend hours manually examining infrastructure configurations, reviewing logs across services, and analyzing error patterns. The process requires switching between multiple interfaces, correlating information from various sources, and deep AWS knowledge. This complex workflow often extends problem resolution from hours into days and increase the burden on the infrastructure teams.
Solution: Amazon Q Developer CLI
Amazon Q Developer CLI streamlines the entire troubleshooting process, from initial investigation to problem resolution, making complex AWS troubleshooting accessible and efficient through simple conversations.
How Amazon Q Developer CLI works:
- Natural Language Interface: Execute AWS CLI commands and interact with AWS services using conversational prompts
- Automated Discovery: Map out infrastructure and analyze configurations
- Intelligent Log Analysis: Parse, correlate, and analyze logs across services
- Root Cause Identification: Pinpoint issues through AI-powered reasoning
- Guided Remediation: Implement fixes with minimal human intervention
- Validation: Test solutions and explain complex issues simply
One of the built-in tools within the Amazon Q Developer CLI, use_aws, enables natural language interaction with AWS services, as shown in Figure 1. This tool leverages the AWS CLI permissions configured on your local machine, allowing secure and authorized access to your AWS resources.

Figure 1: Tools selection in Amazon Q Developer CLI
Real-World Troubleshooting Scenario
Demonstration Environment Setup
This demonstration was performed with the following environment configuration:
- Application and infrastructure code available locally
- Amazon Q Developer CLI installed
- AWS CLI configured with demo-profile
- AWS permissions configured for: Amazon Elastic Container Service(ECS), Amazon CloudWatch Logs, Application Load Balancer (ALB), and AWS Cloud Development Kit(CDK) deployment
- Amazon Q Developer CLI launched within the project directory
The environment includes a local development machine with necessary tools, appropriate AWS account permissions, and terminal access. By starting Amazon Q Developer CLI in the project directory, it has immediate access to relevant code and configuration files.
Scenario: Troubleshooting NGINX 5XX Errors
The scenario demonstrates troubleshooting a multi-tier application architecture as shown in figure 2 deployed on Amazon ECS Fargate with:
- Application Load Balancer (ALB) distributing traffic across availability zones
- NGINX reverse proxy service handling incoming requests
- Node.js backend service processing business logic
- Service discovery enabling internal communication
- CloudWatch Logs providing centralized logging

Figure 2: AWS Architecture diagram for the app used in this blog post
Traditional Troubleshooting Steps
For the architecture in figure 2, when 502 Gateway Timeout errors occur, traditional troubleshooting requires:
- Checking ALB target group health
- Examining ECS service status across multiple consoles
- Analyzing CloudWatch logs from different log groups
- Correlating error patterns between services
- Reviewing infrastructure code for configuration issues
- Implementing and deploying fixes
Amazon Q Developer CLI Approach
Instead, let’s see how Amazon Q Developer CLI handles this systematically, step by step:
Step1: Initial Problem Report
Amazon Q Developer CLI is provided with the initial prompt as a problem statement within the application project directory as shown in the following screenshot in figure 3. Amazon Q Developer responds back and says it is going investigate the 502 Gateway Timeout errors in the NGINX application.
Prompt:
Our production NGINX application is experiencing 502 Gateway Timeout errors.
I have checked out the application and infrastructure code locally and the AWS CLI
profile 'demo-profile' is configured with access to the AWS account where the
infrastructure and application is deployed to. Can you help investigate and diagnose the issue?
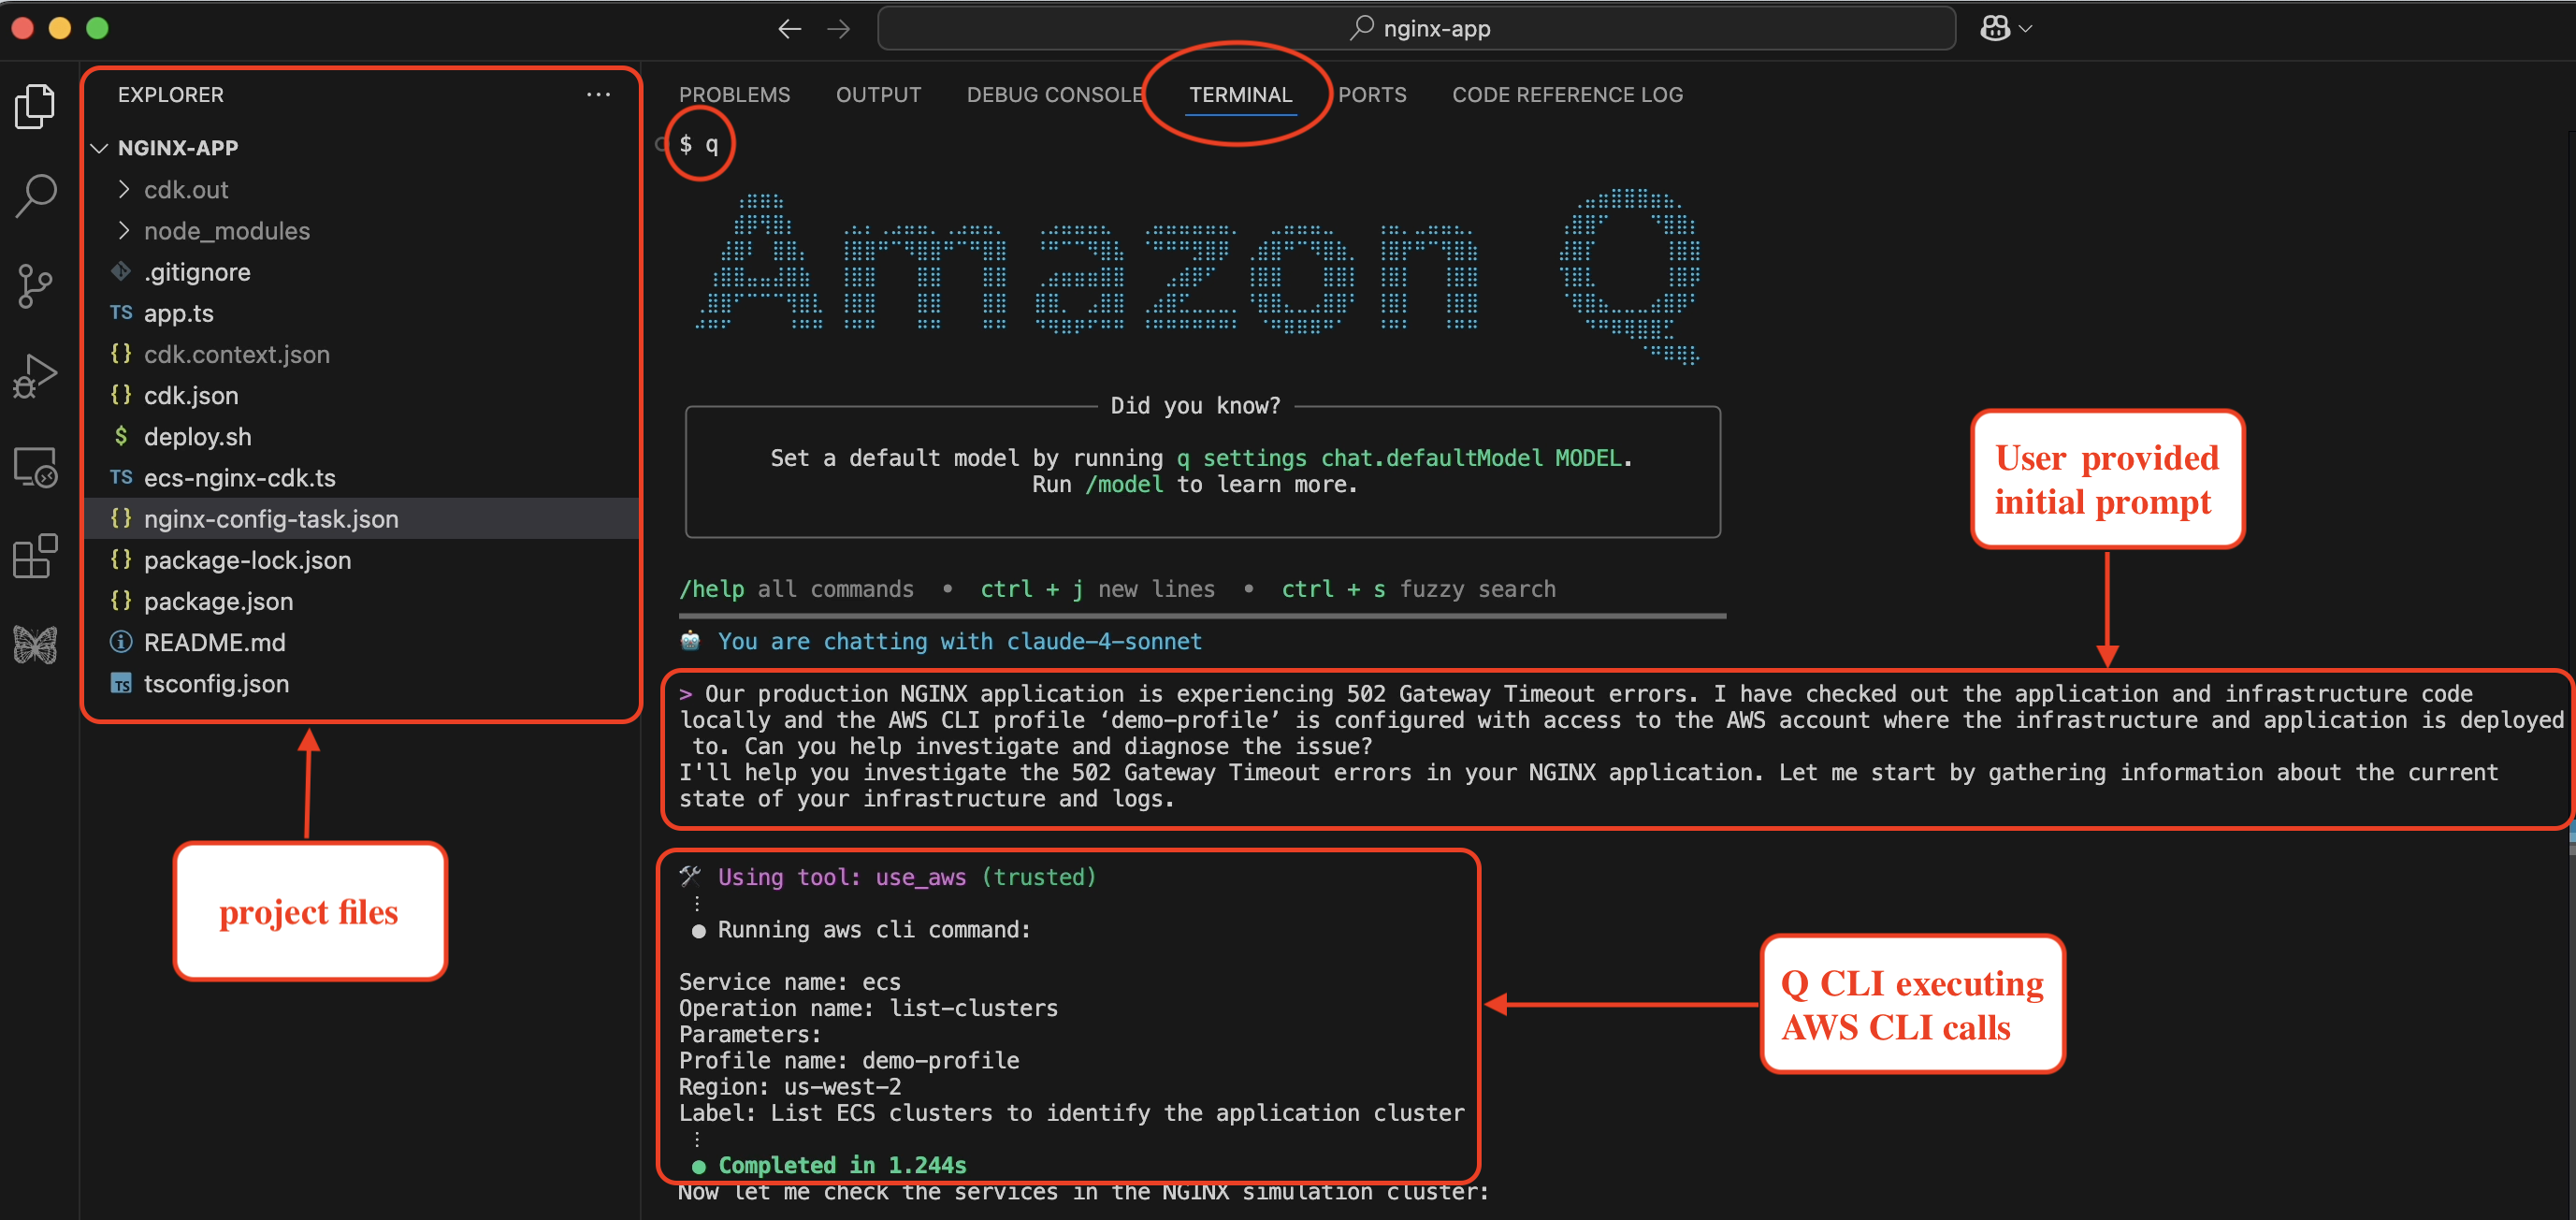
Figure 3: Amazon Q Developer CLI with initial prompt and problem statement
Step2: Systematic Infrastructure Discovery
Amazon Q Developer CLI start to systematically discovering the infrastructure as shown in the following screenshot in figure 4. If you see the initial prompt did not include that the app is hosted on ECS, but Amazon Q Developer CLI understood the context and executes the AWS CLI calls to describe the Cluster and the services within it. It made sure that the ECS tasks are running for both the services within the Cluster. It is a key discovery that both services show healthy status (1/1 desired count), indicating the issue isn’t service availability.

Figure 4: AWS Infrastructure discovery by Amazon Q Developer CLI
Step 3: Intelligent Log Analysis
Amazon Q Developer CLI retrieves and analyzes recent CloudWatch logs from the NGINX container, immediately identifying the critical error pattern as shown in the following screenshot in figure 5, where Amazon Q Developer responds: “Perfect! I found the issue. The NGINX logs show clear 504 gateway timeout with upstream timeout messages.”

Figure 5: CloudWatch Log analysis by Amazon Q Developer CLI
Step 4: Amazon Q Developer CLI Analysis and Root Cause Identification
Amazon Q Developer examines backend service logs and discovers a mismatch between the backend service response time and NGINX timeout settings, as seen in the following screenshot in figure 6.

Figure 6: Root cause identification by Amazon Q Developer CLI
Step 5: Amazon Q Developer CLI Root Cause Analysis
Amazon Q Developer CLI examines the ECS task definitions to identify the exact configuration mismatch, as shown in the following screenshot in figure 7. Amazon Q Developer finds that:
- Backend service is configured with response_delay=15000 (15 secs)
- NGINX proxy is configured with proxy_read_timeout 10s
This mismatch causes 504 gateway timeout errors when the backend response exceeds NGINX’s timeout threshold.

Figure 7: Root cause analysis and issue detection by Amazon Q Developer CLI
Step 6: Automated Code Fix
Here’s where Amazon Q Developer CLI truly excels—it doesn’t just diagnose; it implements the fix. Since Amazon Q Developer CLI is started within the project where the CDK code for ECS task definition is defined, it identified the code configuration and also modified it, as shown in the following screenshot in figure 8.

Figure 8: CDK code fix by Amazon Q Developer CLI
Step 7: Deployment
Amazon Q Developer CLI builds and deploys the fix by executing cdk synth and cdk deploy using the ‘demo-profile‘ AWS CLI profile that was initially provided in the prompt, as shown in the following screenshot in figure 9.

Figure 9: CDK code build and deployment by Amazon Q Developer CLI
Step 8: Validation
Amazon Q Developer CLI validates the solution by sending a curl request to the ALB endpoint after the successful deployment, as shown in the following screenshot in figure 10.

Figure 10: Fix validation by Amazon Q Developer CLI
In addition to that, Amazon Q Developer also sends a request to the health check endpoint and validates everything is working after the fix was deployed, as shown in the following screenshot in figure 11.

Figure 11: Health endpoint validation by Amazon Q Developer CLI
What Amazon Q Developer CLI Accomplished
Using just conversational commands, Amazon Q Developer CLI performed a complete troubleshooting cycle:
- Infrastructure Discovery: Automatically mapped ECS clusters, services, and dependencies
- Log Correlation: Analyzed thousands of log entries across multiple services
- Root Cause Analysis: Identified exact configuration mismatch between NGINX’s timeout (10s) and the backend’s response delay (15s)
- Code-Level Diagnosis: Located problematic timeout setting in CDK infrastructure code
- Automated Implementation: Modified infrastructure code to increase the NGINX timeout
- End-to-End Deployment: Built, deployed, and validated the complete solution
- Comprehensive Testing: Verified both fix effectiveness and overall system health
Amazon Q Developer CLI handles troubleshooting tasks through a single, conversational interface, eliminating the need for multiple tools or AWS CLI commands.
Conclusion
Amazon Q Developer CLI represents a significant evolution in how we troubleshoot cloud infrastructure issues. By combining natural language understanding with powerful command execution capabilities, it transforms complex troubleshooting workflows into efficient, action-oriented dialogues. Whether you’re dealing with NGINX 5XX errors or similar issues across other AWS services, Amazon Q Developer CLI can help you diagnose issues, implement fixes, and validate solutions—all through a conversational interface that feels natural and intuitive.
Give Amazon Q Developer CLI a try the next time you encounter a troubleshooting challenge, and experience the difference it can make in your operational workflow.
To learn more about Amazon Q Developer’s features and pricing details, visit the Amazon Q Developer product page.
About the Author

Kirankumar Chandrashekar is a Generative AI Specialist Solutions Architect at AWS, focusing on Amazon Q Developer. Bringing deep expertise in AWS cloud services, DevOps, modernization, and infrastructure as code, he helps customers accelerate their development cycles and elevate developer productivity through innovative AI-powered solutions. By leveraging Amazon Q Developer, he enables teams to build applications faster, automate routine tasks, and streamline development workflows. Kirankumar is dedicated to enhancing developer efficiency while solving complex customer challenges, and enjoys music, cooking, and traveling.
Announcing the new AWS CDK EKS v2 L2 Constructs
Post Syndicated from Matteo Luigi Restelli original https://aws.amazon.com/blogs/devops/announcing-the-new-aws-cdk-eks-v2-l2-constructs/
Introduction
Today, we’re announcing the release of aws-eks-v2 construct, a new alpha version of AWS Cloud Development Kit (CDK) L2 construct for Amazon Elastic Kubernetes Service (EKS). This construct represents a significant change in how developers can define and manage their EKS environments using infrastructure as code. While maintaining the powerful capabilities of its predecessor library for creating and managing EKS clusters, this alpha release introduces key architectural improvements that enhance both flexibility and maintainability.
The AWS Cloud Development Kit (AWS CDK) is an open-source software development framework that enables you to define your cloud infrastructure using familiar programming languages and deploy it through AWS CloudFormation.
The CDK uses constructs – a layered abstraction concept where Layer 1 (L1) constructs map directly to CloudFormation resources, while Layer 2 (L2) constructs provide intuitive APIs, helper functions, best-practice defaults, and generate a lot of the boilerplate code and glue logic for you. This layered approach means you can seamlessly move between high-level abstractions for common use cases and low-level resource definitions when you need fine-grained control. The result is an Infrastructure as Code (IaC) experience that helps you maintain productivity while ensuring you have access to the full power of AWS services when you need it.
You can read more about constructs and their benefits in the CDK user guide.
In this post we’ll explore:
- The reasoning behind the creation of a new L2 construct for EKS and the improvements introduced by this new library
- How to use the new EKS v2 construct
Background
Amazon EKS is a managed Kubernetes service that makes it easy to run Kubernetes on AWS without needing to manage the control plane or nodes. EKS automatically handles critical tasks like patching, node provisioning, and upgrades. You can run EKS using EC2 instances for worker nodes, AWS Fargate for serverless containers, or a combination of both, providing the flexibility to choose the right compute option for your workloads.
While the existing EKS L2 construct has served customers well, we identified opportunities to further enhance the developer experience and operational efficiency based on their feedback. The new aws-eks-v2 construct delivers significant improvements through native AWS CloudFormation resources, modern Access Entry-based authentication, and enhanced architectural flexibility. Key benefits include reduced deployment overhead, simplified cluster access management, support for multiple EKS clusters within a single stack, and granular control over resource creation with features like the optional kubectl Lambda handler.
These improvements help customers build and manage their EKS infrastructure more efficiently while maintaining the robust functionality they expect from AWS CDK constructs.
Using the L2
Given that this construct is in the alpha stage, you’ll need to install and import the construct using the experimental construct libraries process. During the alpha stage, the CDK team is actively gathering customer feedback and iterating on the implementation. Once the construct meets our bar for general availability, we’ll integrate it directly into the AWS CDK core library, making it as easily accessible as our other L1 and L2 constructs. This approach allows us to rapidly deliver new capabilities while ensuring they meet the high standards our customers expect.
Deploying EKS Cluster with Default Configuration
Let’s explore how to create an Amazon EKS cluster using AWS CDK aws-eks-v2 construct with minimal configuration requirements. The following example demonstrates the most straightforward way to define an EKS cluster, leveraging the power of CDK’s opinionated defaults.
Creating a new cluster is done using the Cluster construct. The only required property is the Kubernetes version.
import * as eksv2 from '@aws-cdk/aws-eks-v2-alpha';

// Creating an EKS Cluster with default properties
const eksCluster = new eksv2.Cluster(this, 'EksCluster', {
    version: eksv2.KubernetesVersion.V1_32
});
This translates in the following Architecture as shown in figure 1:
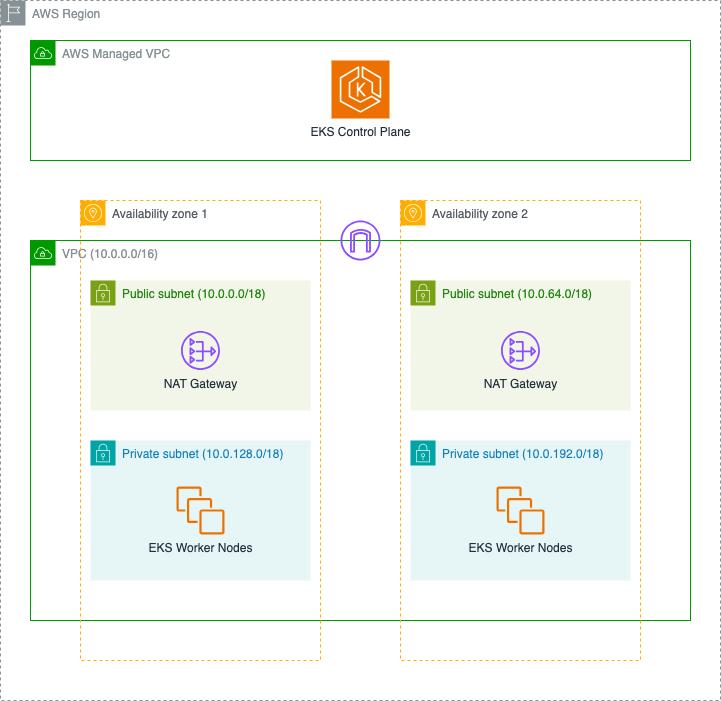
Figure 1 – L2 CDK construct v2 for EKS, Default Architecture
- Amazon Virtual Private Cloud (VPC) – A logically isolated section of the AWS Cloud that spans across two Availability Zones, equipped with an Internet Gateway to enable secure communication with the internet. This multi-AZ design helps ensure your applications remain available even if an Availability Zone experiences issues.
- Amazon EKS Control Plane – A fully managed Kubernetes control plane deployed in an AWS-managed VPC , providing high availability and automatic version management for the Kubernetes control plane components.
- Public Subnet Infrastructure – Two public subnets, each with its own NAT Gateway Instance, enabling your cluster components to securely access the internet for essential operations like pulling container images and downloading updates. These NAT Gateways provide a secure outbound path while protecting your workloads from direct internet exposure.
- Private Subnet Configuration – Two private subnets optimized for running your EKS worker nodes, offering enhanced security by isolating your workloads from direct internet access while maintaining the ability to communicate with AWS services and the internet through the NAT Gateways.
- IAM Security Foundation – A comprehensive set of IAM roles and policies that implement the principle of least privilege:
- Control plane service role that enables EKS to manage AWS resources on your behalf
- Node IAM role that allows worker nodes to interact with other AWS services and join the EKS cluster
You can also use FargateCluster to provision a cluster that uses only Fargate workers.
import * as eksv2 from '@aws-cdk/aws-eks-v2-alpha';

// Creating an EKS Cluster with default properties and Fargate workers
const eksFargateCluster = new eksv2.FargateCluster(this, 'EksFargateCluster', {
   version: eksv2.KubernetesVersion.V1_32,
});
To help our customers maintain better control over their cluster access patterns, the Kubectl Handler is not automatically deployed with the default configuration. You can easily enable this functionality by configuring the kubectlProviderOptions property when you need kubectl access management as shown below.
import * as eksv2 from '@aws-cdk/aws-eks-v2-alpha';
import { KubectlV32Layer } from '@aws-cdk/lambda-layer-kubectl-v32'

// Creating an EKS Cluster with default properties and kubectl handler
const eksCluster = new eksv2.Cluster(this, 'EksCluster', {
   version: eksv2.KubernetesVersion.V1_32,
   kubectlProviderOptions: {
      kubectlLayer: new KubectlV32Layer(this, 'KubectlLayer')
   },
});
Deploying EKS Cluster with AutoMode
EKS Auto Mode represents a significant advancement in how Amazon EKS manages compute capacity for Kubernetes clusters. This intelligent capacity management system automatically provisions and scales node groups based on workload demands, removing the need for manual capacity planning.
When you create a new cluster with the aws-eks-v2 construct, EKS Automode is activated by default, by means that DefaultCapacityType.AUTOMODE is automatically set as the default capacity type for the EKS Cluster. If you prefer, you can specify the defaultCapacityType to AutoMode:
import * as eksv2 from '@aws-cdk/aws-eks-v2-alpha';

// Creating an EKS Cluster with AutoMode
const eksCluster = new eksv2.Cluster(this, 'EksCluster', {
   version: eksv2.KubernetesVersion.V1_32,
   defaultCapacityType: eksv2.DefaultCapacityType.AUTOMODE, // default value
});
After deploying the Stack containing the construct instance, in the EKS Console you’ll be able to see that an EKS Cluster has been created with AutoMode enabled:
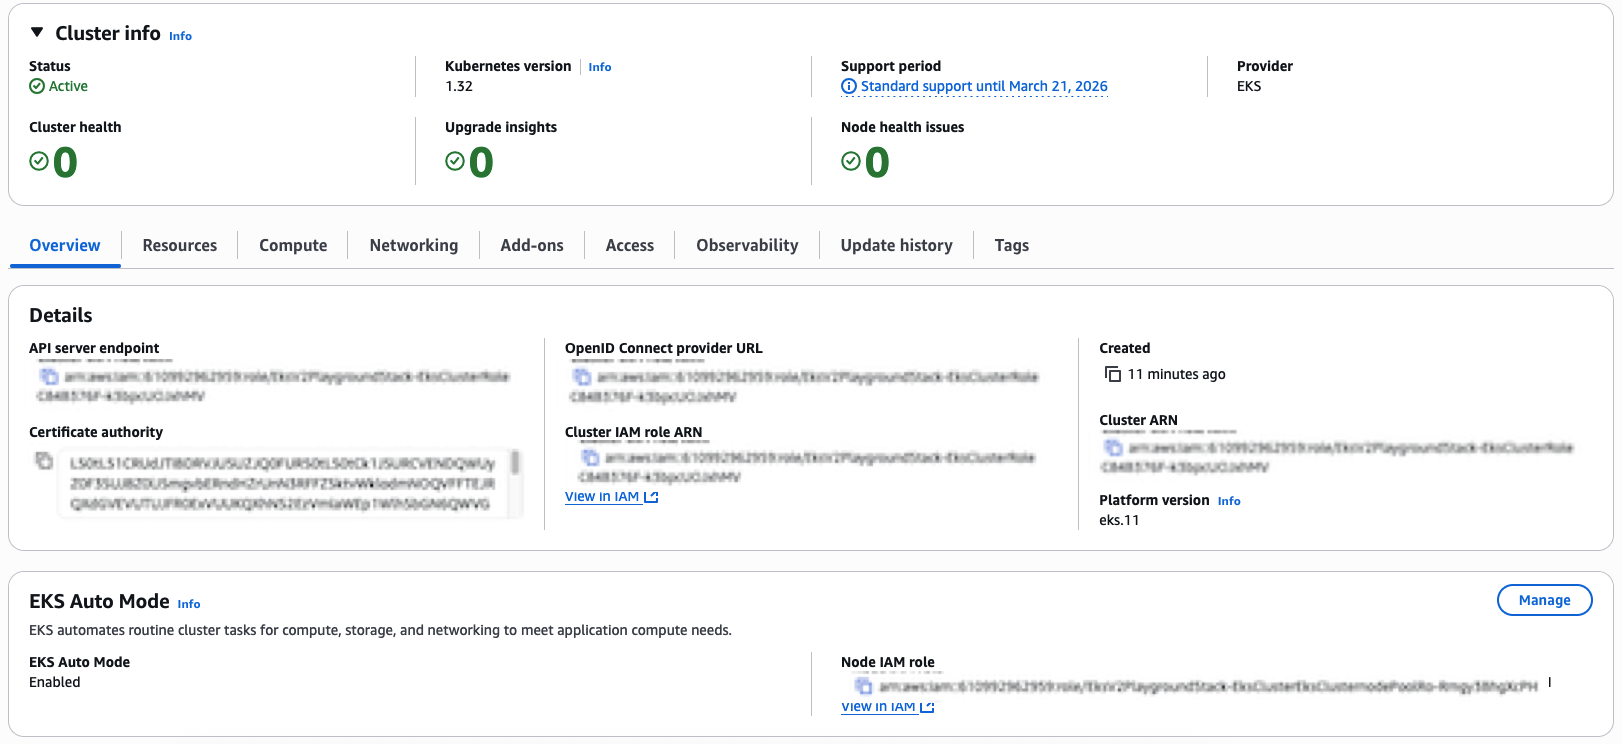
Figure 2 – EKS Cluster Deployed with Automode
Auto Mode enhances your Amazon EKS experience by automatically configuring two strategically designed node pools out of the box:
- A system node pool optimized for running critical cluster system components and add-ons, ensuring reliable cluster operations.
- A general node pool specifically tuned for your application workloads, providing the flexibility needed for diverse containerized applications.
You can configure which node pools to enable through the compute property:
import * as eksv2 from '@aws-cdk/aws-eks-v2-alpha';

// Creating an EKS Cluster with Automode and selecting nodePools
const eksCluster = new eksv2.Cluster(this, 'EksCluster', {
   version: eksv2.KubernetesVersion.V1_32,
   defaultCapacityType: eksv2.DefaultCapacityType.AUTOMODE,
   compute: {
      nodePools: ['system', 'general-purpose'],
   },
});
Deploying EKS Cluster with Managed Node Groups
Amazon EKS Managed Node Groups deliver a seamless compute management experience for your Kubernetes clusters. This powerful capability eliminates operational complexity by automating the end-to-end lifecycle of Amazon EC2 instances that power your containerized applications.
Behind the scenes, Amazon EKS managed node groups intelligently orchestrate these changes, ensuring zero-disruption to your applications through graceful node draining. The service automatically leverages the latest Amazon EKS-optimized AMIs, providing a secure and optimized foundation for your workloads.
By setting defaultCapacityType to NODEGROUP, customers can leverage the traditional managed node group management approach:
import * as eksv2 from '@aws-cdk/aws-eks-v2-alpha';

// Creating an EKS Cluster with Managed Node Groups and default instance types
const eksCluster = new eksv2.Cluster(this, 'EksCluster', {
   version: eksv2.KubernetesVersion.V1_32,
   defaultCapacityType: eksv2.DefaultCapacityType.NODEGROUP,
});
By default, when using DefaultCapacityType.NODEGROUP, this library will allocate a managed node group with two m5.large instances.
After deploying the above code, you can check the EKS Console to see that an EKS Cluster has been deployed as shown in figure 3:
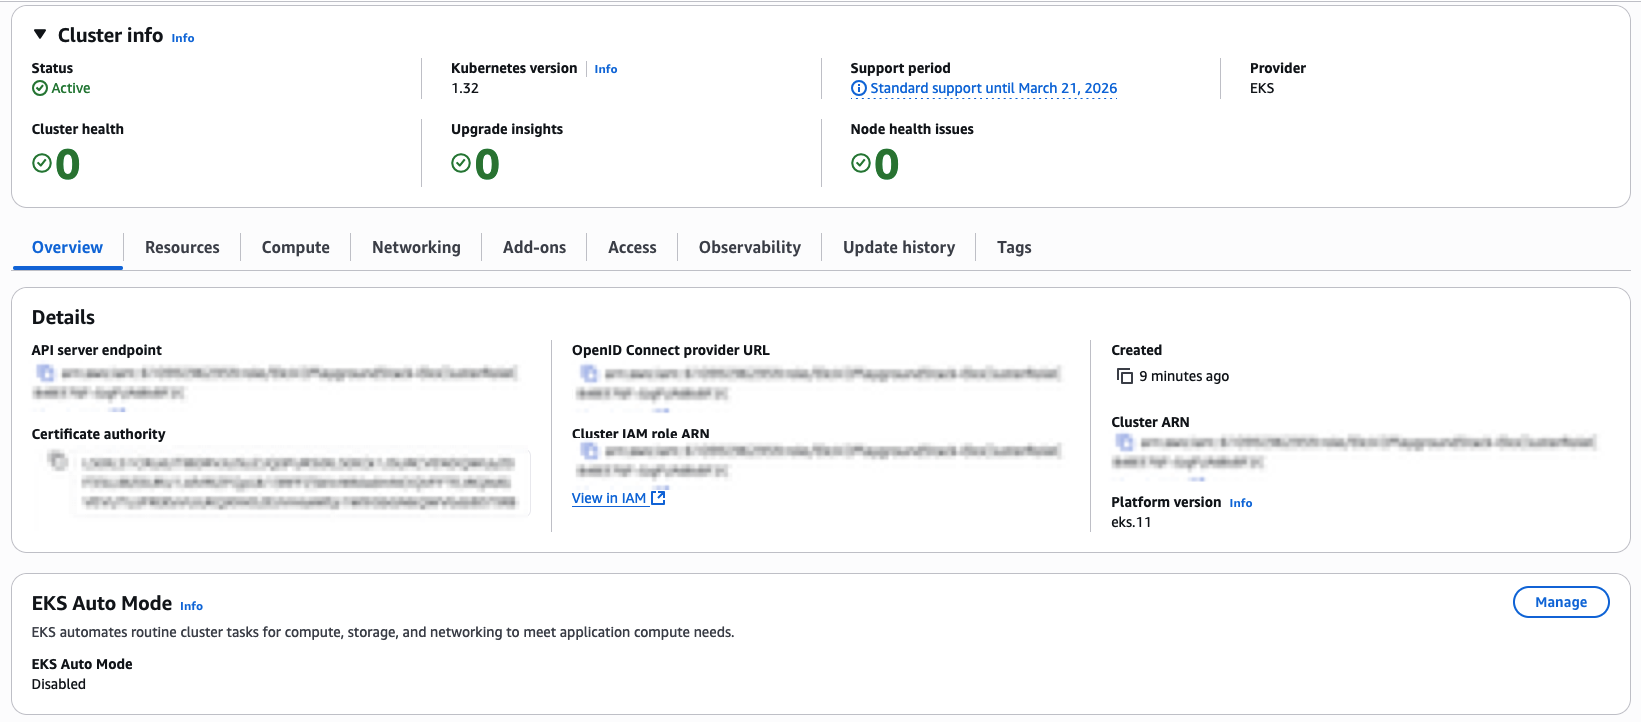
Figure 3 – EKS Cluster Deployed with Managed Node Groups
You can also check the Compute tab and see the Managed Node Group Configuration as shown in figure 4:

Figure 4 – EKS Cluster Managed Node Group Default Configuration
If you want to have control over instance types of a Managed Node Group, you can specify the default EC2 type as property of the construct:
import * as eksv2 from '@aws-cdk/aws-eks-v2-alpha';
import * as ec2 from 'aws-cdk-lib/aws-ec2'

// Creating an EKS Cluster with Managed Node Groups and specific instance types
const eksCluster = new eksv2.Cluster(this, 'EksCluster', {
   version: eksv2.KubernetesVersion.V1_32,
   defaultCapacityType: eksv2.DefaultCapacityType.NODEGROUP,
   defaultCapacity: 5,
   defaultCapacityInstance: ec2.InstanceType.of(ec2.InstanceClass.M5, ec2.InstanceSize.SMALL),
});
You can also specify additional customizations after the EKS cluster declaration, via the addNodegroupCapacity method:
import * as eksv2 from '@aws-cdk/aws-eks-v2-alpha';
import * as ec2 from 'aws-cdk-lib/aws-ec2'

// Creating an EKS Cluster with Managed Node Groups and specific instance types
const eksCluster = new eksv2.Cluster(this, 'EksCluster', {
   version: eksv2.KubernetesVersion.V1_32,
   defaultCapacityType: eksv2.DefaultCapacityType.NODEGROUP,
   defaultCapacity: 0,
});

eksCluster.addNodegroupCapacity('custom-node-group', {
  instanceTypes: [new ec2.InstanceType('m5.large')],
  minSize: 4,
  diskSize: 100,
});
Managing Permissions through Access Entries
The new aws-eks-v2 construct transitions away from the previous ConfigMap-based authentication (which is deprecated in EKS) in favor of the Access Entries Authentication mode. This change introduces Access Entry as the standardized method for managing cluster permissions, offering a more streamlined and secure approach to granting cluster access to IAM users and roles.
You can define Access Policies through the AccessPolicy construct and you can adjust the scope of the Access Policy to the entire EKS cluster or to specific EKS Namespaces:
import * as eksv2 from '@aws-cdk/aws-eks-v2-alpha';

// AmazonEKSClusterAdminPolicy with `cluster` scope
eks.AccessPolicy.fromAccessPolicyName('AmazonEKSClusterAdminPolicy', {
   accessScopeType: eks.AccessScopeType.CLUSTER,
});

// AmazonEKSAdminPolicy with `namespace` scope
eks.AccessPolicy.fromAccessPolicyName('AmazonEKSAdminPolicy', {
   accessScopeType: eks.AccessScopeType.NAMESPACE,
   namespaces: ['foo', 'bar']
});
You can then grant access to specific IAM Roles using the grantAccess method:
import * as iam from 'aws-cdk-lib/aws-iam'

// Defining a IAM Role
const clusterAdminRole = new iam.Role(this, 'ClusterAdminRole', {
   assumedBy: new iam.ArnPrincipal('arn_for_trusted_principal'),
});

// Creating an EKS Cluster with AutoMode
const eksCluster = new eksv2.Cluster(this, 'EksCluster', {
   version: eksv2.KubernetesVersion.V1_32,
   defaultCapacityType: eksv2.DefaultCapacityType.AUTOMODE,
});

// Cluster Admin role for this cluster
eksCluster.grantAccess('clusterAdminAccess', clusterAdminRole.roleArn, [
	eks.AccessPolicy.fromAccessPolicyName('AmazonEKSClusterAdminPolicy', {
   	    accessScopeType: eks.AccessScopeType.CLUSTER,
    }),
]);
When the Principal assumes the ClusterAdminRole, it receives seamless access to the EKS cluster through a carefully orchestrated permission chain. This access is governed by the AmazonEKSClusterAdminPolicy, which is automatically attached to the Access Policy linked to the IAM Role.
Conclusion
In this post, we introduced the new AWS CDK L2 construct (aws-eks-v2) for Amazon EKS, demonstrating how it simplifies cluster deployment while offering enhanced flexibility and operational efficiency. Through practical examples, we showcased how customers can leverage the construct’s intelligent defaults and customization options to build production-ready Kubernetes environments on AWS
The new L2 construct for Amazon EKS delivers significant improvements that help customers accelerate their container adoption journey:
- Enhanced Performance: Eliminates dependency on Custom Resources and AWS Lambda functions by utilizing native AWS CloudFormation resources, resulting in faster and more reliable deployments.
- Modern Authentication: Implements Access Entry-based authentication, replacing the deprecated ConfigMap approach with a more secure and programmable solution.
- Improved Scalability: Removes the single-cluster-per-stack limitation and eliminates nested stacks, enabling more flexible architectural patterns.
- Optimized Resource Creation: Makes the kubectl Lambda handler optional, giving customers fine-grained control over their infrastructure components.
- Streamlined Operations: Provides automated node group management with intelligent defaults while maintaining full customer control when needed.
To get started with the new EKS L2 construct, visit the AWS CDK documentation. If you have specific features you’d like to see added, we encourage you to submit a feature request in the aws-cdk GitHub repository. Your feedback helps us continue innovating on your behalf.
About the author
Accelerate development with secure access to Amazon Q Developer using PingIdentity
Post Syndicated from Sid Vantair original https://aws.amazon.com/blogs/devops/accelerate-development-with-secure-access-to-amazon-q-developer-using-pingidentity/
Overview
Customers adopting Amazon Q Developer, a generative AI-powered coding companion, often need authentication through existing identity providers like PingIdentity. By leveraging AWS IAM Identity Center, organizations can enable their developers to access Amazon Q Developer with their existing PingIdentity credentials, streamlining authentication and removing the need for separate login procedures. Amazon Q Developer can chat about code, provide inline code completions, and generate new code. It also scans your code for security vulnerabilities and makes code improvements, including language updates, debugging, and optimizations. Amazon Q Developer comes in two tiers. The Free Tier is available at no cost for individual use. The Pro Tier is a paid version offering enterprise access controls, an analytics dashboard, customization, and higher usage limits. Organizations that enable the Pro tier of Amazon Q Developer for their developers typically authenticate with AWS IAM Identity Center. This approach is popular due to its ability to federate with external identity providers. In this blog, we will show you how to set up PingIdentity as an external IdP for IAM Identity Center and allow developers to access Amazon Q Developer using their existing PingIdentity login credentials.
How it works

Figure 1 – Solution Overview
The authentication workflow is as follows:
- The developer initiates an access request to Amazon Q Developer.
- IAM Identity center checks authentication status.
- If not authenticated, redirects to PingIdentity login.
- Developer provides PingIdentity Credentials.
- PingIdentity validates credentials and sends SAML response.
- IAM Identity Center verifies the SAML response.
- Upon successful verification, grants Amazon Q Developer access.
- Developer begins using Amazon Q Developer.
Prerequisites
- AWS account
- PingIdentity environment with users and groups already setup for Amazon Q Developer access
- IAM identity center
- Pro Tier subscription of Amazon Q Developer
Walkthrough
In this section, we demonstrate how to create a SAML-based connection between PingIdentity and IAM Identity Center, enabling you to access Amazon Q Developer seamlessly using your PingIdentity credentials.
Note: You will need to switch between PingIdentity portal and IAM Identity Center in your browser. We recommend opening a new browser tab for each console.
Step 1: Enable AWS Single Sign-On in PingIdentity
This step involves enabling AWS Single Sign-On application within PingIdentity.
-
- In the PingIdentity console, Navigate to the Applications Tab > Application Catalog
- Browse catalog for AWS Single Sign-On and select + to start the Quick Setup.

Figure 2 – PingIdentity Application Catalog
Alt Text: Screenshot of the PingIdentity Application Catalog interface. The search term “aws” is entered in the search bar, displaying three results: Amazon Web Services – AWS, AWS Gov-Cloud, and AWS Single Sign-On. The “AWS Single Sign-On” option is outlined with a red box and includes a plus button to add the application
-
- Provide Name, SSO Region and SSO Tenant ID and choose Next
- Name – Input an appropriate name for the connection
- SSO Region – Input the appropriate region
- Tenant ID – Identity Store ID
You can run the following CLI command to retrieve the value. It’s a 10-digit alphanumeric prefixed by “d-“.
- Provide Name, SSO Region and SSO Tenant ID and choose Next
-
- Navigate to PingOne Mappings and select Email Address from the drop down.

Figure 3 – AWS Single Sign-On attribute mapping
Alt Text: Screenshot of the AWS Single Sign-On configuration in PingIdentity. The screen shows Step 2 of the setup process where the SAML attribute SAML_SUBJECT is mapped to the PingOne attribute “Email Address”. A red box highlights the mapping section under “PingOne Mappings”.
-
- Search and select the group that you have created earlier for enabling access to Amazon Q Developer and select + to add the group.
- Choose Save

Figure 4 – Select PingIdentity directory Groups for Amazon Q Developer access
Alt Text: Screenshot of Step 3 in the AWS Single Sign-On setup process in PingIdentity. The screen shows the group selection interface where the “Amazon Q” group is listed. A plus icon is shown next to the group to add it, and a blue “Save” button is highlighted in the bottom-right corner to confirm the configuration.
Step 2: Connecting PingIdentity with IAM identity Center
This step involves configuring PingIdentity with the AWS IAM Identity Center sign-on details to complete the authentication setup.
- In the PingIdentity console, Navigate to the Applications Tab > Applications and select the application you created earlier in Step 1
- Select Enable Advanced Configuration and choose Enable.

Figure 5 – Enable Advanced configuration for AWS single Sign-On application
Alt Text: Screenshot of the PingIdentity Applications dashboard showing the AWS Single Sign-On application selected. The overview panel displays key configuration sections including protocol (SAML), mapped attributes, selected policies, and access group (Amazon Q). The option “Enable Advanced Configuration” is highlighted near the bottom of the panel.
- Scroll down and select Download Metadata. This will save the Metadata file to your local computer, which you will use later during the configuration process.
- In another browser tab login to your AWS IAM Identity Center console and Select Choose your identity source.
- Under Identity source, select Change identity source from the Actions drop-down menu.

Figure 6 – Change identity source in IAM Identity Center Console
Alt Text: Screenshot of the IAM Identity Center settings page, focused on the “Identity source” tab. The page displays details such as identity source, authentication method, AWS access portal URL, issuer URL, and identity store ID. A dropdown menu labeled “Actions” is expanded in the top-right corner, showing options to “Customize AWS access portal URL” and “Change identity source,” highlighted with a red box.
- On the next page, select External identity provider and choose Next.
- Under Service provider metadata copy the IAM Identity Center Assertion Consumer Service (ACS) URL.

Figure 7 – Copy IAM Identity Center ACS URL

Alt Text: Screenshot of the “Configure external identity provider” step in the AWS IAM Identity Center setup process. The screen displays service provider metadata including the AWS access portal sign-in URL, IAM Identity Center Assertion Consumer Service (ACS) URL (highlighted with a red box), and IAM Identity Center issuer URL. A button labeled “Download metadata file” is shown in the upper right.
- Now go back to the PingIdentity browser tab and Navigate to the Configuration tab and select pencil icon to edit the details.
- Paste the ACS URL you copied from the IAM identity center console and choose Save.

Figure 8 – Configuring AWS Single Sign-On SAML Settings in PingIdentity console
Alt Text: Two screenshots showing the configuration and editing of SAML settings for AWS Single Sign-On in PingIdentity. The first image displays the static configuration view, listing the ACS URL, signing key (“PingOne SSO Certificate for Administrators environment”), signing method (“Response”), and signing algorithm. The second image shows the editable configuration screen with the ACS URL input field highlighted in red, alongside dropdowns for selecting the signing key, options for signing method (Assertion, Response, or both), and the RSA_SHA256 signing algorithm. These screens guide users through setting up secure SAML integration with AWS SSO.
Step 3: Configure PingIdentity as external IdP in IAM identity Center
This step involves setting up PingIdentity as an external IdP in IAM Identity Center to enable federated access.
- Navigate back to the previous browser tab where you had IAM Identity Center console open.
- Upload the downloaded PingIdentity IdP SAML metadata file from step 3 of previous section and select Next.

Figure 9 – AWS IAM Identity Center metadata
Alt Text: Screenshot of the AWS Identity Center configuration screen where the user uploads the IdP SAML metadata XML file. The metadata file is shown as successfully selected. Below are empty fields for optional manual entry of IdP sign-in URL, IdP issuer URL, and IdP certificate. The “Next” button is highlighted in orange at the bottom right, indicating the next step in the setup process.
- Review the list of changes. Once you are ready to proceed, type ACCEPT, then select Change identity source.
Step 4: Enable provisioning and identity-aware sessions in IAM identity Center
This step involves configuring user provisioning and enabling identity-aware sessions in AWS IAM Identity Center to support dynamic access control.
- In IAM Identity Center Console, Choose Settings in the left navigation pane.
- On the Settings page, locate and enable automatic provisioning. This immediately enabled automatic provisioning in IAM Identity Center and displays the necessary SCIM endpoint and access token information.
- In the Inbound automatic provisioning dialog box, copy each of the values for the following options. You will need to paste these later when you configure provisioning in PingIdentity.
- SCIM endpoint
- Access token
- Choose Close.
- Next enable identity-aware sessions and automatic provisioning.

Figure 10 – IAM Identity Center Settings for identity aware sessions and automatic provisioning
Alt Text: Two options are displayed for further configuration: “Enable identity-aware sessions” and “Automatic provisioning.” Both options have an “Enable” button on the right-hand side, highlighted in red.
Step 5: Configure connections provisioning in PingIdentity
This step involves setting up connection provisioning in PingIdentity to enable automatic user and group management.
- In the PingIdentity console, Navigate to the Integrations > Provisioning.
- Select plus icon > New Connection
- Under connection type Select Identity Store.

Figure 11 – PingIdentity connection provisioning
Alt Text: PingIdentity Provisioning configuration screen. The left sidebar highlights the “Provisioning” tab. The main panel shows the “Create a New Connection” dialog with two connection type options: “Identity Store” and “Gateway.” The “Identity Store” option is selected using the “Select” button on the right. A plus (+) icon at the top indicates the option to add a new provisioning connection.
- Select SCIM outbound from the list of options and select Next.
- Provide a name for the connection and select Next.
- Paste the SCIM endpoint URL into the SCIM BASE URL field.
- Navigate to Authentication Method and select OAuth 2 Bearer Token.
- Paste the Access token into the Oauth Access Token field.
- Select Test Connection to validate the connectivity and select Next.

Figure 12 – Configure authentication details
Alt Text: PingIdentity interface showing the “Configure Authentication” step in the “Create a New Connection” wizard. Key fields include the SCIM Base URL, SCIM Version (2.0), Authentication Method (OAuth 2 Bearer Token), OAuth Access Token (obscured), and resource paths for Users and Groups. The “Test Connection” and “Next” buttons are visible at the bottom.
- Navigate to User Filter Expression and change to userName Eq “%s”.
- Choose Save. By default, the connection is created in a Disabled state.

Figure 13 – Edit UserFilter Expressions for the connection
Alt Text: Final step in the PingIdentity “Create a New Connection” wizard showing the “Configure Preferences” screen. The highlighted fields include “User Filter Expression” with the value userName Eq “%s”, “User Identifier” set to userName, and group membership handling options (“Merge” and “Overwrite” with “Overwrite” selected). A “Save” button is highlighted at the bottom right.
- Select the connection you created and select the toggle switch to enable the connection.

Figure 14 – Enable the connection
Alt Text: PingIdentity configuration screen showing the IAM Identity Store integration. The page displays the identity store name, and tabs for “Overview” and “Configuration.” A toggle switch in the top-right corner is highlighted, indicating the integration is currently enabled.
Step 6: Configure rules provisioning in PingIdentity
This step involves setting up provisioning rules in PingIdentity to define how users and groups are synchronized.
- In the PingIdentity console, Navigate to the Integrations > Provisioning.
- Select plus icon > New Rule
- Provide a Name and Description for the rule.
- Choose Create.
- Select plus icon to select the Connection you created in the previous step.
- Choose Save.

Figure 15 – Add the IAM identity center connection to the rule
Alt Text: Screenshots showing the final steps in connecting the IAM Identity Center to the IAM identity store using PingIdentity. The first image shows the IAM Identity Store connection listed under “Available Connections” with a plus (+) icon to initiate the link. The second image shows the selected connection from the PingOne Directory (P1) as the source and IAM identity store (SCIM) as the target, with the option to “Save” the configuration.
- If you want to sync users from your PingIdentity directory, create a user filter. To do so, navigate to User Filter and select pencil icon to edit the settings.
- Choose the appropriate filter from the drop down based on your use case and select Save. I have chosen Group Name which has been designated for Amazon Q Developer access.

Figure 16 – PingIdentity user filter
Alt Text: Screenshot of the “Edit User Filter” interface in IAM Identity Center. The user filter is configured to provision users who belong to a group with names that contain “Amazon Q Developer.” The condition logic is set to match if “Any” of the conditions are true.
- If you want to sync a group from your PingIdentity directory, create group provisioning. To do so, navigate to Group Provisioning and select pencil icon to edit the settings.
- Select the appropriate group which has been designated for Amazon Q Developer access and choose Save.

Figure 17 – PingIdentity Group Provisioning
Alt Text: Screenshot of the “Edit Group Provisioning” screen in IAM Identity Center. The group “Amazon Q Developer” is selected for outbound provisioning. A “Save” button is highlighted in the bottom-left corner.
- Navigate to Attribute Mapping and select the pencil icon to edit the settings.
- Delete the PingOne Directory attribute Primary Phone.
- Add a new attribute and select Username as PingOne Directory and displayName as IAM identity Store.
- Choose Save.

Figure 18 – PingIdentity attribute mapping
Alt Text: Two screenshots showing the editing of attribute mappings in IAM Identity Center. The first image displays default mappings such as ‘Email Address’ to ‘workEmail’ and ‘Username’ to ‘userName’, with an option to delete or update each field. The second image shows the addition of a new attribute mapping from ‘Username’ to ‘displayName’, along with highlighted ‘Add’ and ‘Save’ buttons.
- Select the rule you created and select the toggle switch to enable the rule.
- This automatically provisions the users/groups from PingIdentity to IAM identity Center using SCIM.

Figure 19 – PingIdentity Users and Groups Sync status using SCIM
Alt Text: IAM Identity Center sync summary showing successful user and group provisioning. The first image highlights two users impacted and successfully synced. The second image highlights one group impacted and successfully synced. Sync status is marked ‘ACTIVE’ in both views, confirming successful integration between PingOne and AWS IAM Identity Center.
Step 7: Provide access to Amazon Q Developer
This step involves locating and subscribing the groups that need permission to use Amazon Q Developer.
- In the Amazon Q Developer console, under Subscriptions add the IAM identity center groups which require access to Amazon Q Developer.
- Select Subscribe and search for the group name.
- Select Assign.

Figure 20 – Amazon Q Developer subscriptions page
Alt Text: Screenshot of the Amazon Q Developer Subscriptions page in the AWS Management Console. The “Groups” tab is selected, displaying “Amazon Q Developer,” with a subscription status of “Subscribed.” The “Amazon Q Developer” group is highlighted with a red box.
Setup Amazon Q Developer with IAM Identity Center
This section guides you through installing the Amazon Q Developer extension and setting up authentication with IAM Identity Center.
- To set up Amazon Q Developer extension in your integrated development environment (IDE), complete the steps in AWS documentation.
- Once extension is installed Choose Amazon Q icon in your IDE.
- Choose a sign-in option.
- Select Use with Pro license and choose
- Continue.
- Provide the Start URL. You can retrieve this AWS access portal URL from the IAM Identity Center Console.

Figure 21 – IAM identity center access portal URL
Alt Text: Screenshot of the IAM Identity Center settings page in the AWS Console, displaying the identity source configuration. It shows that the identity source is set to “External identity provider” with SAML 2.0 authentication and SCIM provisioning. The highlighted section includes the AWS access portal URL and the Identity Store ID. The “Settings” tab is selected in the left navigation pane.
- Provide the region that hosts the identity directory and choose Continue
- Select Open on the resulting pop up which redirects to your browser.
- The browser redirects you to the Pingone URL where you enter your PingIdentity credentials and select Sign On.
- Upon successful authentication, select Allow access on the resulting pop up to login successfully.

Figure 22 – Setup Visual Studio Code Amazon Q Developer extension
Alt Text: A screen recording of Visual Studio Code where the user selects the Amazon Q icon from the sidebar. The screen transitions to a login prompt indicating that the user must authenticate using their PingIdentity credentials via IAM Identity Center before accessing Amazon Q Developer features. The message highlights that authentication is required to continue.
Test Configuration
Upon successfully completing the previous step, you can now leverage the code suggestions by Amazon Q Developer.

Figure 23 – Amazon Q Developer example
Alt Text: A screen recording of Visual Studio Code where Amazon Q Developer generates a sample code inline.
Clean Up
To avoid ongoing charges after testing this solution, follow these steps to remove all provisioned resources:1. Remove PingIdentity Application Configuration
- In the PingIdentity console, navigate to Applications.
- Locate and delete the AWS Single Sign-On application that was configured for IAM Identity Center integration.
2. Reset IAM Identity Center Configuration
- In the AWS IAM Identity Center console:
- Navigate to Settings > Identity source.
- Change the identity source back to the default IAM Identity Center directory if no longer using PingIdentity.
- Remove any external metadata and configuration uploaded during the setup.
3. Revoke Subscriptions and Access
- In the Amazon Q Developer console:
- Go to Subscriptions and remove assigned groups such as Amazon Q Developer or code whisperer trial.
- This will deactivate access and prevent any future charges tied to those subscriptions.
4. Remove Amazon Q Developer Extension
- If desired, uninstall the Amazon Q Developer extension from Visual Studio Code to fully revert the development environment.
Conclusion
In this post, we demonstrated how to use existing PingIdentity credentials to access Amazon Q Developer through integration with IAM Identity Center. We provided a step-by-step guide for configuring PingIdentity as an external identity provider (IdP) with IAM Identity Center. Lastly, we demonstrated how to connect Amazon Q Developer extension within your IDE to AWS using your PingIdentity credentials, allowing seamless access to Amazon Q Developer.If you have any comments or questions, share them in the comments section.
To learn more about AWS Services
AWS Toolkit for Visual Studio Code
About the author
 Sid Vantair is a Solutions Architect with AWS covering Strategic accounts. He thrives on resolving complex technical issues to overcome customer hurdles. Outside of work, he cherishes spending time with his family and fostering inquisitiveness in his children.
Secure access to a cross-account Amazon MSK cluster from Amazon MSK Connect using IAM authentication
Post Syndicated from Venkata Sai Mahesh Swargam original https://aws.amazon.com/blogs/big-data/secure-access-to-a-cross-account-amazon-msk-cluster-from-amazon-msk-connect-using-iam-authentication/
Amazon Managed Streaming for Apache Kafka (MSK) Connect is a fully managed, scalable, and highly available service that enables the streaming of data between Apache Kafka and other data systems. Amazon MSK Connect is built on top of Kafka Connect, an open-source framework that provides a standard way to connect Kafka with external data systems. Kafka Connect supports a variety of connectors, which are used to stream data in and out of Kafka. MSK Connect extends the capabilities of Kafka Connect by providing a managed service with added security features, straightforward configuration, and automatic scaling capabilities, enabling businesses to focus on their data streaming needs without the overhead of managing the underlying infrastructure.
In some use cases, you might need to use an MSK cluster in one AWS account, but MSK Connect is located in a separate account. In this post, we demonstrate how to create a connector to achieve this use case. At the time of writing, MSK Connect connectors can be created only for MSK clusters that have AWS Identity and Access Management (IAM) role-based authentication or no authentication. We demonstrate how to implement IAM authentication after establishing network connectivity. IAM provides enhanced security measures, making sure your systems are protected against unauthorized access.
Solution overview
The connector can be configured for a variety of purposes, such as sinking data to an Amazon Simple Storage Service (Amazon S3) bucket, tracking the source database changes, or serving as a migration tool such as MirrorMaker2 on MSK Connect to transfer data from a source cluster to a target cluster this is located in a different account.
The following diagram illustrates a use case using Debezium and Amazon S3 source connectors.

The following diagram illustrates using S3 Sink and migration to a cross-account failover cluster using a MirrorMaker connector deployed on MSK Connect.

Currently MSK Connect connectors can be created only for MSK clusters which have IAM role-based authentication or no authentication. In this blog, I’ll guide you through the essential steps for implementing the industry-recommended IAM (Identity and Access Management) authentication after establishing network connectivity. IAM provides enhanced security measures, ensuring your systems are protected against unauthorized access.
The launch of multi-VPC private connectivity (powered by AWS PrivateLink) and cluster policy support for MSK clusters simplifies the connectivity of Kafka clients to brokers. By enabling this feature on the MSK cluster, you can use the cluster-based policy to manage all access control centrally in one place. In this post, we cover the process of enabling this feature on the source MSK cluster.
We don’t fully utilize the multi-VPC connectivity provided by this new feature because that requires you to use different bootstrap URLs with port numbers (14001:3) that are not supported by MSK Connect as of writing of this post. We explore a secure network connectivity solution that uses private connectivity patterns, as detailed in How Goldman Sachs builds cross-account connectivity to their Amazon MSK clusters with AWS PrivateLink.
Connecting to a cross-account MSK cluster from MSK Connect involves the following steps.
Steps to configure the MSK cluster in Account A:
- Enable the multi-VPC private connectivity(Private Link) feature for IAM authentication scheme that is enabled for your MSK cluster.
- Configure the cluster policy to allow a cross-account connector.
- Implement one of the preceding network connectivity patterns according to your use case to establish the connectivity with the Account B VPC and make network changes accordingly.
Steps to configure the MSK connector in Account B:
- Create an MSK connector in private subnets using the AWS Command Line Interface (AWS CLI).
- Verify the network connectivity from Account A and make network changes accordingly.
- Check the destination service to verify the incoming data.
Prerequisites
To follow along with this post, you should have an MSK cluster in one AWS account and MSK Connect in a separate account.
Set up the MSK cluster setup in Account A:
In this post, we only show the important steps that are required to enable the multi-VPC feature on an MSK cluster:
- Create a provisioned MSK cluster in Account A’s VPC with the following considerations, which are required for the multi-VPC feature:
- Cluster version must be 2.7.1 or higher.
- Instance type must be m5.large or higher.
- Authentication should be IAM (you must not enable unauthenticated access for this cluster).
- After you create the cluster, go to the Networking settings section of your cluster and choose Edit. Then choose Turn on multi-VPC connectivity.

- Select IAM role-based authentication and choose Turn on selection.
It might take around 30 minutes to enable. This step is required to enable the cluster policy feature that allows the cross-account connector to access the MSK cluster.

- After it has been enabled, scroll down to Security settings and choose Edit cluster policy.
- Define your cluster policy and choose Save changes.

- The new cluster policy allows for defining a Basic or Advanced cluster policy. With the Basic option, it only allows
CreateVPCConnection,GetBootstrapBrokers,DescribeCluster, andDescribeClusterV2actions that are required for creating the cross-VPC connectivity to your cluster. However, we have to use Advanced to allow more actions that are required by the MSK Connector. The policy should be as follows:
You might need to modify the preceding permissions to limit access to your resources (topics, groups). Also, you can restrict access to a specific connector by giving the connector IAM role, or you can mention the account number to allow the connectors in that account.
Now the cluster is ready. However, you need to make sure of the network connectivity between the cross-account connector VPC and the MSK cluster VPC.
If you’re using VPC peering or Transit Gateway while connecting to MSK Connect either from cross-account or the same account, do not configure your connector to reach the peered VPC resources with IPs in the following CIDR ranges (for more details, see Connecting from connectors):
- 10.99.0.0/16
- 192.168.0.0/16
- 172.21.0.0/16
In the MSK cluster security group, make sure you allowed port 9098 from Account B network resources and make changes in the subnets according to your network connectivity pattern.
Set up the MSK connector in Account B:
In this section, we demonstrate how to use the S3 Sink connector. However, you can use a different connector according to your use case and make the changes accordingly.
- Create an S3 bucket (or use an existing bucket).
- Make sure that the VPC that you’re using in this account has a security group and private subnets. If your connector for MSK Connect needs access to the internet, refer to Enable internet access for Amazon MSK Connect.
- Verify the network connectivity between Account A and Account B by using the telnet command to the broker endpoints with port 9098.
- Create an S3 VPC endpoint.
- Create a connector plugin according to your connector plugin provider (confluent or lenses). Make a note of the custom plugin Amazon Resource Name (ARN) to use in a later step.
- Create an IAM role for your connector to allow access to your S3 bucket and the MSK cluster.
- The IAM role’s trust relationship should be as follows:
- Add the following S3 access policy to your IAM role:
- The following policy contains the required actions by the connector:
- The IAM role’s trust relationship should be as follows:
You might need to modify the preceding permissions to limit access to your resources (topics, groups)
Finally, it’s time to create the MSK connector. Because the Amazon MSK console doesn’t allow viewing MSK clusters in other accounts, we show you how to use the AWS CLI instead. We also use basic Amazon S3 configuration for testing purposes. You might need to modify the configuration according to your connector’s use case.
- Create a connector using the AWS CLI with the following command with the required parameters of the connector, along with Account A’s MSK cluster broker endpoints:
- After you create the connector, connect the producer to your topic and insert data into it. In the following code, we use a Kafka client to insert data for testing purposes:
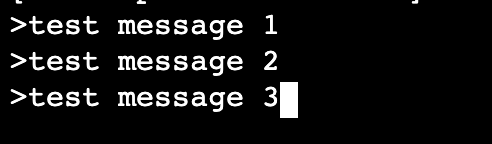
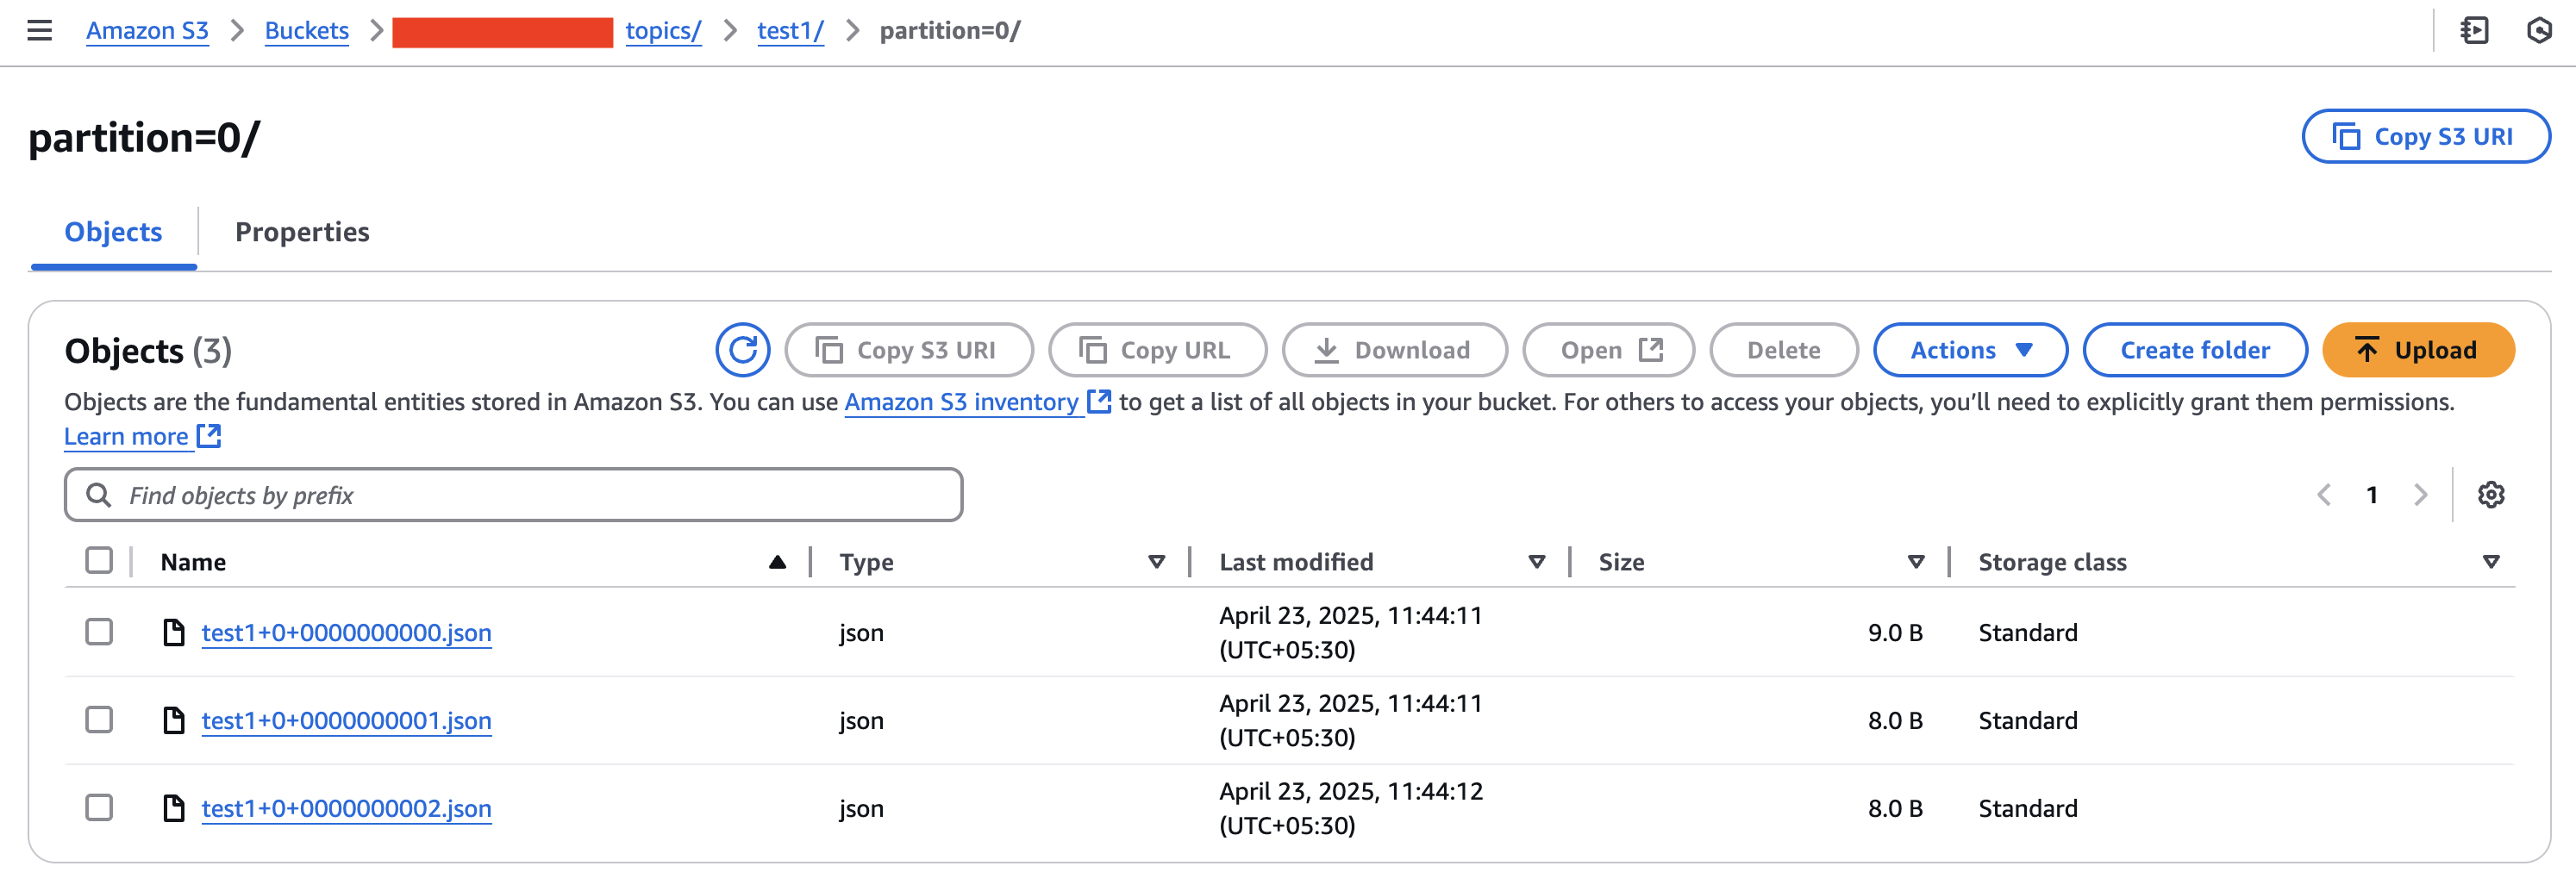
If everything is set up correctly, you should see the data in your destination S3 bucket. If not, check the troubleshooting tips in the following section.
Troubleshooting tips
After deploying the connector, if it’s in the CREATING state on the connector details page, access the Amazon CloudWatch log group specified in your connector creation request. Review the logs for any errors. If no errors are found, wait for the connector to complete its creation process.
Additionally, make sure the IAM roles have their required permissions, and check the security groups and NACLs for proper connectivity between VPCs.
Clean up
When you’re done testing this solution, clean up any unwanted resources to avoid ongoing charges
Conclusion
In this post, we demonstrated how to create an MSK connector when you need to use an MSK cluster in one AWS account, but MSK Connect is located in a separate account. This architecture includes an S3 Sink connector for demonstration purposes, but it can accommodate other types of sink and source connectors. Additionally, this architecture focuses solely on IAM authenticated connectors. If an unauthenticated connector is desired, the multi-VPC connectivity (PrivateLink) and cluster policy components can be ignored. The remaining process, which involves creating a network connection between the account VPCs, remains the same.
Try out the solution for yourself, and let us know your questions and feedback in the comments section.
Check out more AWS Partners or contact an AWS Representative to learn how we can help accelerate your business.
About the Author
 Venkata Sai Mahesh Swargam is a Cloud Engineer at AWS in Hyderabad. He specializes in Amazon MSK and Amazon Kinesis services. Mahesh is dedicated to helping customers by providing technical guidance and solving issues related to their Amazon MSK architectures. In his free time, he enjoys being with family and traveling around the world.
Build a multi-Region analytics solution with Amazon Redshift, Amazon S3, and Amazon QuickSight
Post Syndicated from Donatas Kuchalskis original https://aws.amazon.com/blogs/big-data/build-a-multi-region-analytics-solution-with-amazon-redshift-amazon-s3-and-amazon-quicksight/
Organizations increasingly face complex requirements balancing regional data sovereignty with global analytics needs. Regulatory frameworks like GDPR, HIPAA, and local data protection laws often mandate storing data in specific geographic regions, and business operations require global teams to access and analyze this data efficiently.
This post explores how to effectively architect a solution that addresses this specific challenge: enabling comprehensive analytics capabilities for global teams while making sure that your data remains in the AWS Regions required by your compliance framework. We use a variety of AWS services, including Amazon Redshift, Amazon Simple Storage Service (Amazon S3), and Amazon QuickSight.
It’s important to note that this solution focuses primarily on data residency (where data is stored) and not on preventing data from being in transit between Regions. Organizations with strict data transit restrictions might need additional controls beyond what’s covered here. We show how you can configure AWS across Regions to help meet business needs and regulatory requirements simultaneously.
Cross-Region architecture requirements
Before implementing a cross-Region solution, it’s important to understand when this approach is actually necessary. Although single-Region deployments offer simplicity and cost advantages, several specific business and regulatory scenarios warrant a cross-Region approach:
- Data sovereignty and residency requirements – When regulations like GDPR, HIPAA, or local data sovereignty laws require data to remain in specific geographic boundaries while still enabling global analytics capabilities
- Global operations with local compliance – When your organization operates globally, but needs to adhere to regional compliance frameworks while maintaining unified analytics
- Performance optimization for global users – When your organization needs to optimize analytics performance for users in different geographic areas while centralizing data governance
- Enhanced business continuity – When your analytics capabilities need higher availability and Regional redundancy to support mission-critical business processes
Use case: Financial services analytics with Regional data residency
Consider a financial services company with the following business and regulatory requirements:
- Data residency requirement – All customer financial data must remain in the Bahrain Region (me-south-1) to comply with local financial regulations.
- Global analytics capability – The organization’s data science team operates from European offices and needs to access and analyze the financial data without moving it out of its mandated storage Region.
- Advanced analytics requirements – Business leaders need interactive data exploration and natural language query capabilities to derive insights from financial data.
- Performance requirement – Specific dashboard queries require subsecond response times for both local executives and the global management team.
This specific combination of requirements can’t be met with a single-Region deployment. Let’s explore how to architect a solution.
Solution overview
The following architecture is designed to address the specific challenge of using QuickSight in one Region while maintaining data in another Region.

As shown in the architecture diagram, data engineers based in Bahrain (me-south-1) work with local data, whereas data engineers in Stockholm (eu-north-1) and analysts in Ireland (eu-west-1) can securely access the same data through Redshift datashares and virtual private cloud (VPC) peering connections. This approach maintains data residency in me-south-1 while enabling global access.
The solution consists of the following key components:
- Primary data Region (me-south-1):
- Redshift cluster (primary data repository)
- S3 buckets for data lake storage
- Private and public subnets with appropriate security controls
- Data must remain in this Region for compliance reasons
- Analytics services Region (eu-west-1):
- QuickSight deployment
- Cross-Region VPC peering connection to the primary Region
- Data access using Redshift datashares (no data replication)
- Data engineering Region (eu-north-1):
- Redshift consumer cluster for data engineering workloads
- Data access using Redshift datashares from me-south-1
- Makes it possible for data engineering teams in eu-north-1 to access and work with data while maintaining compliance
Before implementing this architecture, evaluate whether:
- Your requirements actually necessitate a cross-Region approach
- The performance impact is acceptable for your use case
- The additional cost is justified by your business requirements
For most analytics workloads, a single-Region architecture remains the recommended approach for simplicity, performance, and cost-effectiveness. Consider cross-Region architectures only when specific business and compliance requirements make them necessary.
Establish cross-Region network connectivity: Amazon Redshift to QuickSight
The foundation of a cross-Region solution is secure, reliable network connectivity. VPC peering provides a straightforward approach for connecting VPCs across Regions. To implement VPC peering in Amazon Virtual Private Cloud (Amazon VPC), complete the following steps:
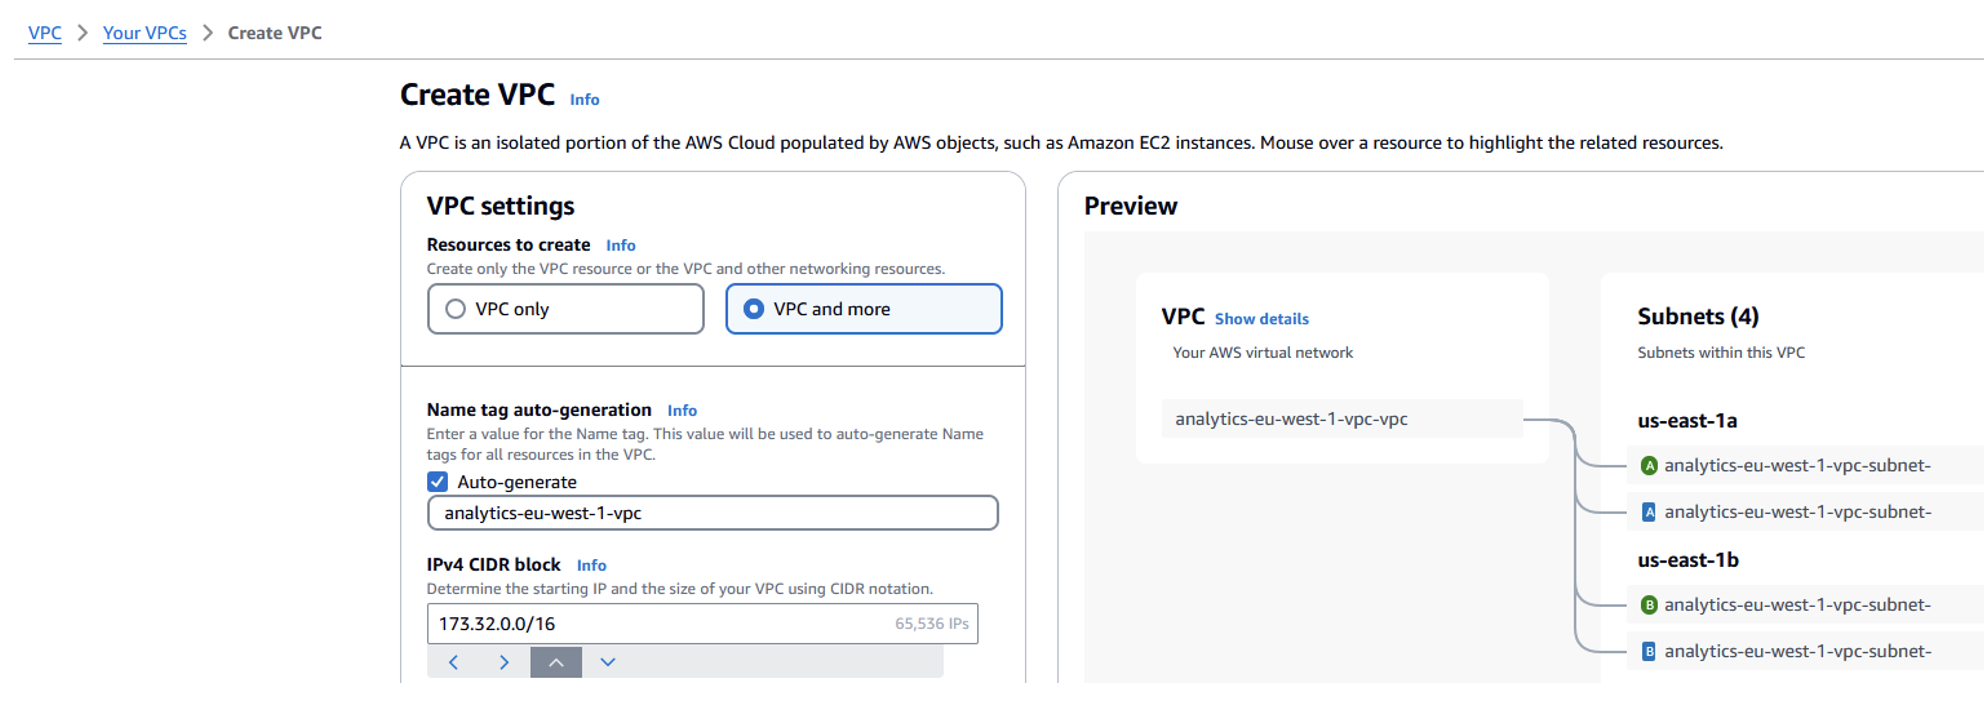
- Create a new VPC in the secondary Region (eu-west-1):
- Open the Amazon VPC console in the eu-west-1 Region.
- Choose Create VPC.
- Set IPv4 CIDR block to 172.32.0.0/16 (verify there is no overlap with the primary Region VPC).
- Select Auto-generate to create subnets automatically within this new VPC.
- Leave other settings as default and choose Create VPC.
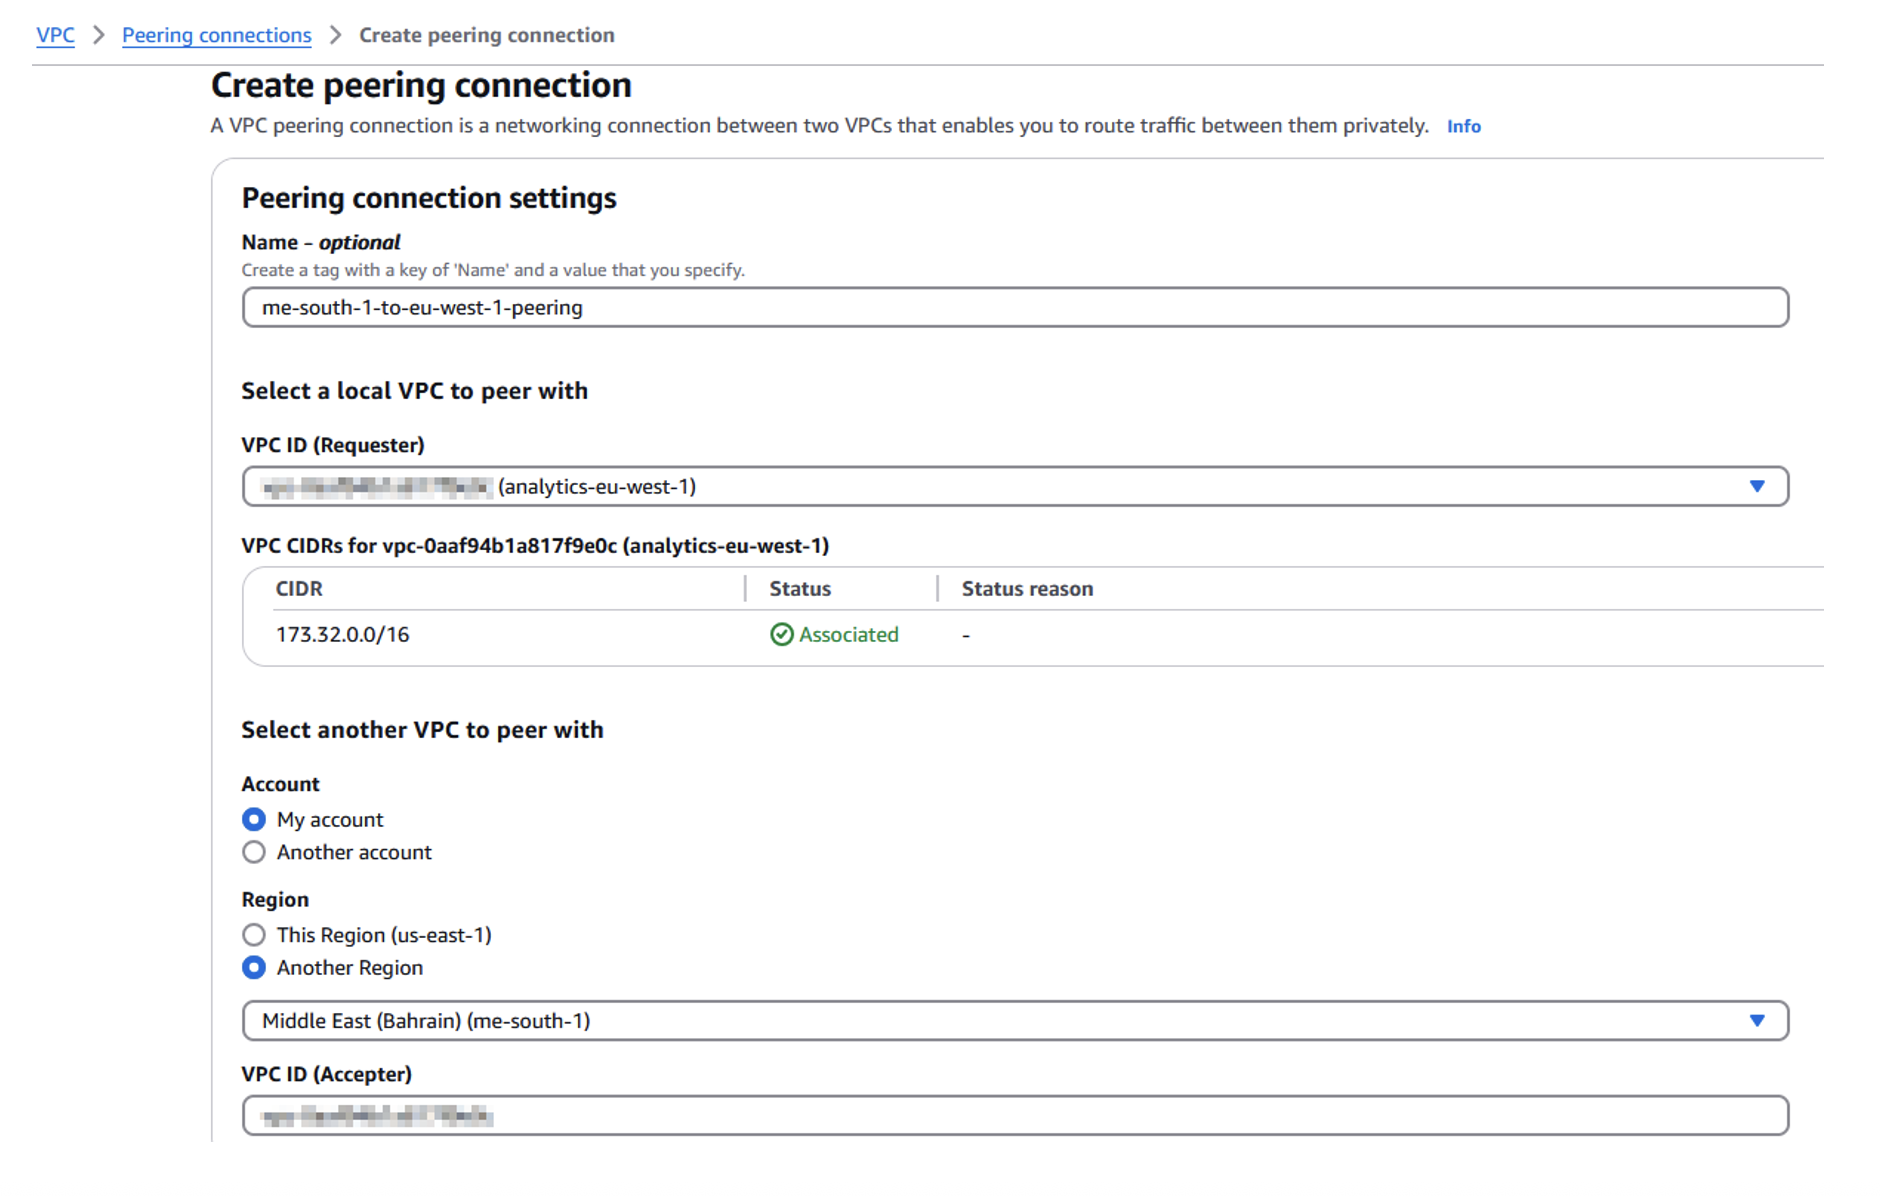
- Set up VPC peering:
- On the Amazon VPC console, choose Peering connections in the navigation pane and choose Create peering connection.
- Select the new eu-west-1 VPC as the requester.
- For Select another VPC to peer with, select My account and Another Region.
- Choose the primary Region (me-south-1) and enter the VPC ID.
- Choose Create peering connection.
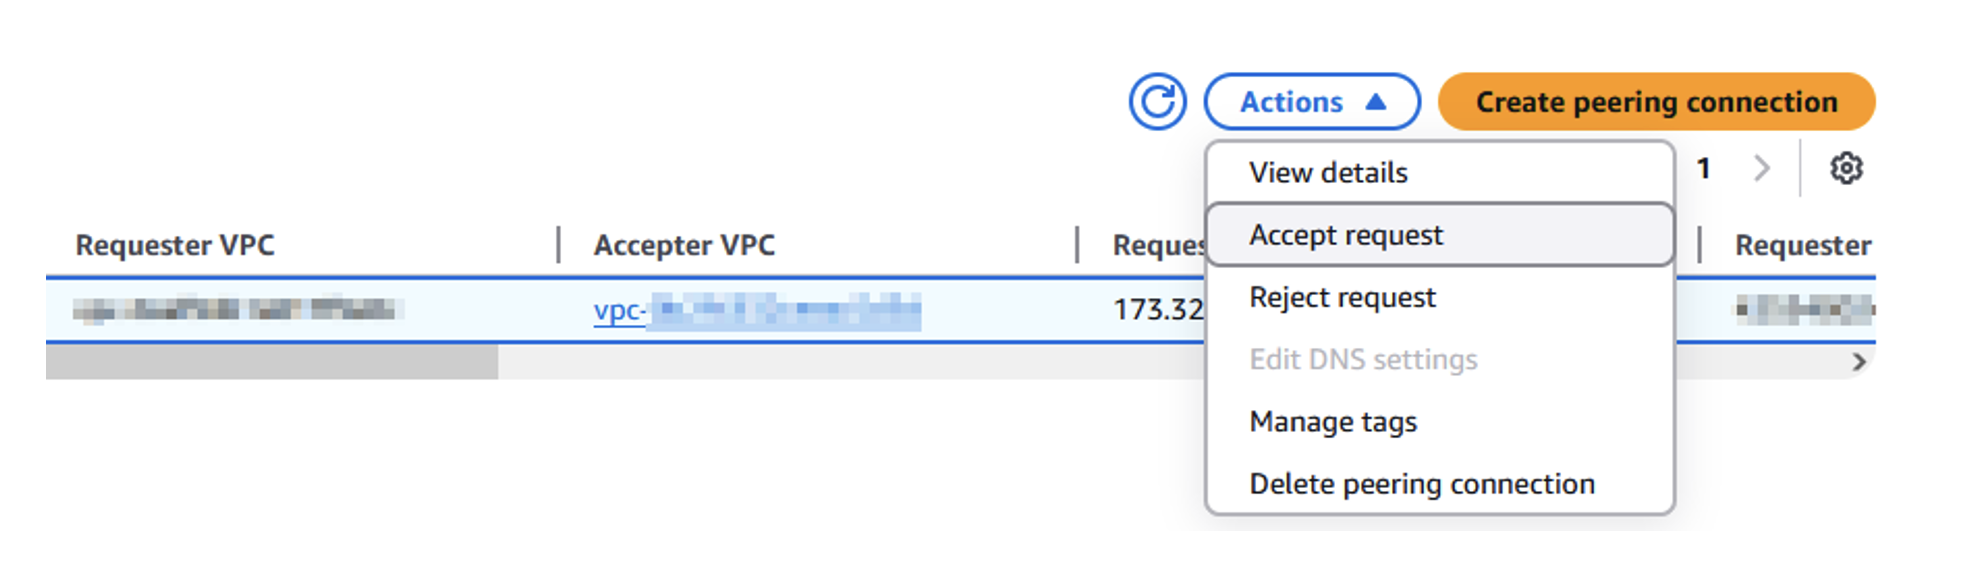
- Accept the VPC peering connection:
- Switch to the primary Region on the Amazon VPC console.
- Choose Peering connections in the navigation pane and select the pending connection.
- On the Actions dropdown menu, choose Accept request.
- Update the route tables:
- On the secondary Region Amazon VPC console, choose Route tables in the navigation pane.
- Choose the route table for the new VPC.
- Choose Edit routes and add a new route:
- Destination: Primary Region VPC CIDR (e.g., 172.31.0.0/16).
- Target: Choose the peering connection.
- On the primary Region Amazon VPC console, repeat the process, adding a route to the secondary Region VPC CIDR (172.32.0.0/16) using the peering connection.

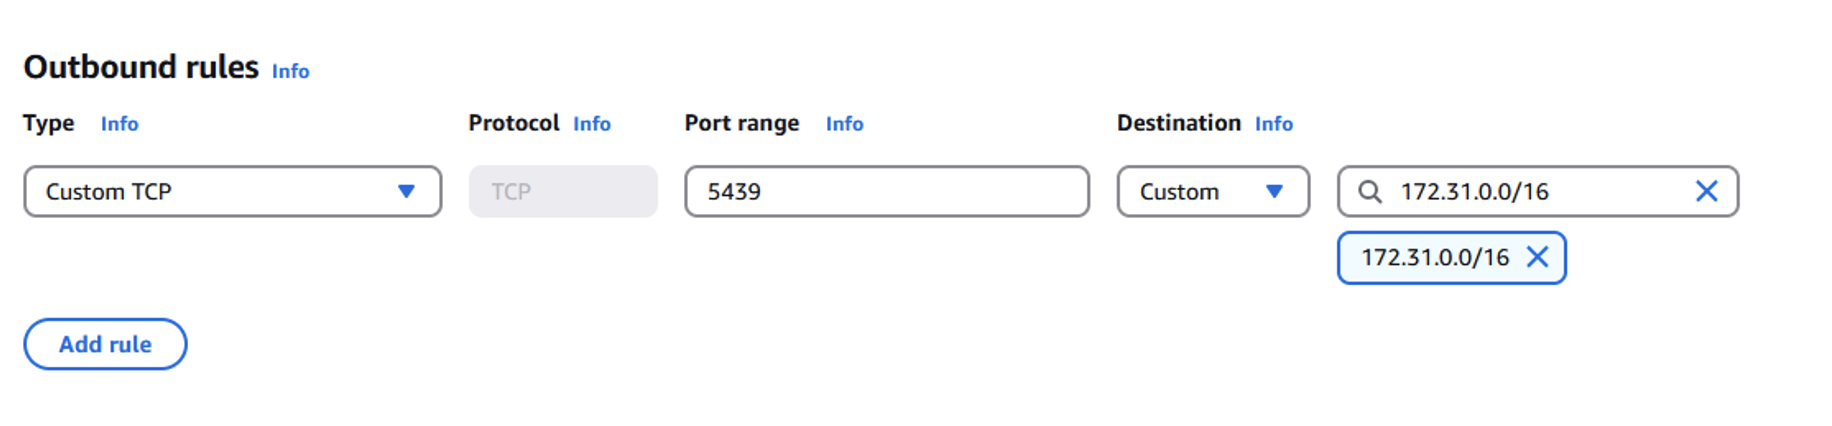
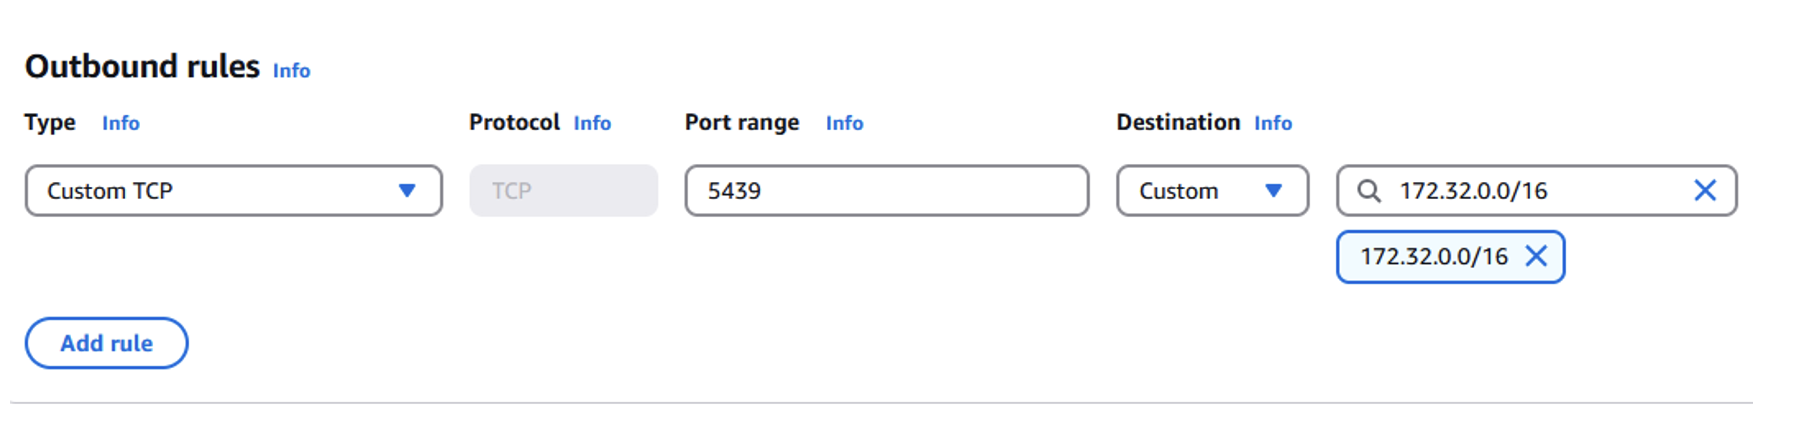
- Configure security groups:
- On the secondary Region Amazon VPC console, choose Security groups in the navigation pane and create a new security group.
- Add an outbound rule:
- Type: Custom TCP
- Port range: 5439
- Destination: Primary Region VPC CIDR

- On the primary Region Amazon VPC console, locate the Redshift cluster’s security group.
- Add an inbound rule:
- Type: Custom TCP
- Port range: 5439
- Source: Secondary Region VPC CIDR
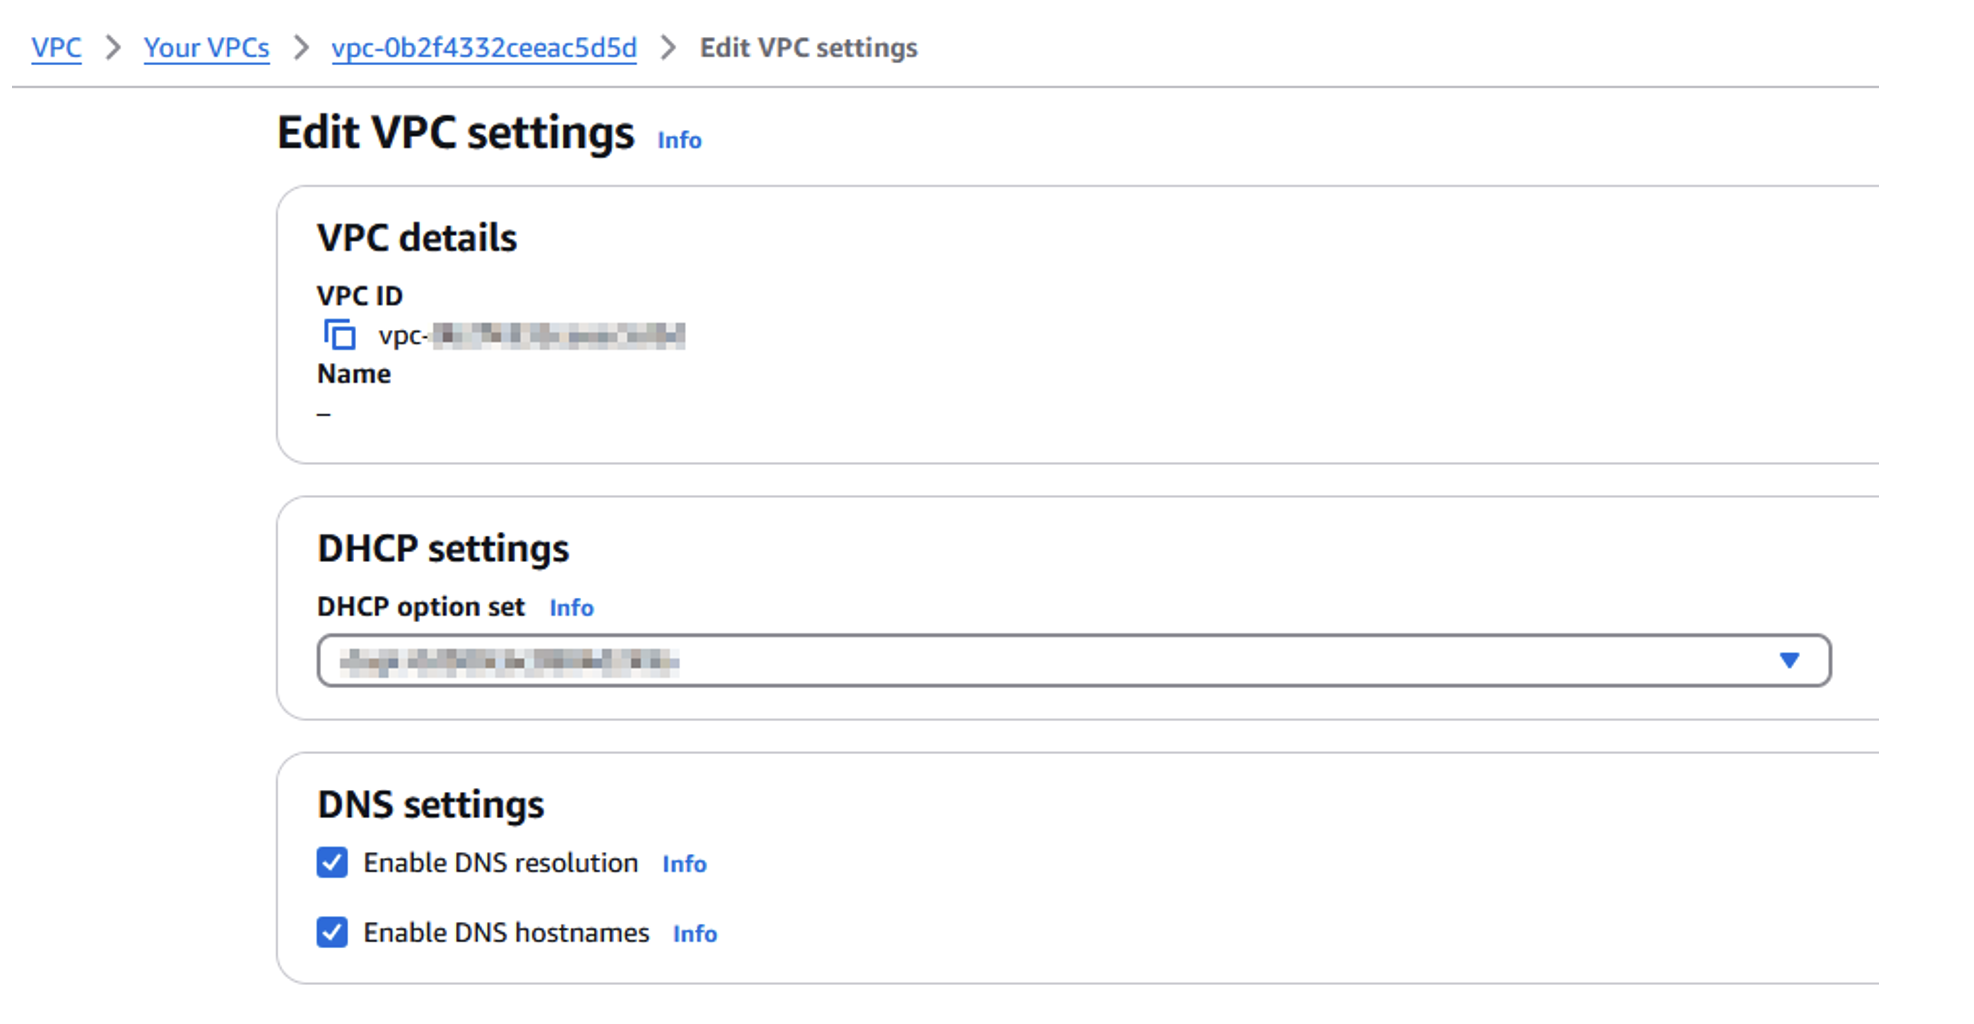
- Configure DNS settings:
- On the Amazon VPC console for both Regions, choose Your VPCs in the navigation pane.
- Select each VPC, and on the Actions dropdown menu, choose Edit DNS hostnames.
- Select Enable DNS resolution and Enable DNS hostnames.
Implement cross-Region data sharing
Rather than replicating data, which could create compliance issues, you can use Redshift datashares to provide secure, read-only access to data across Regions. Complete the following steps to set up your datashares:
- Create producer datashares in the primary Region:
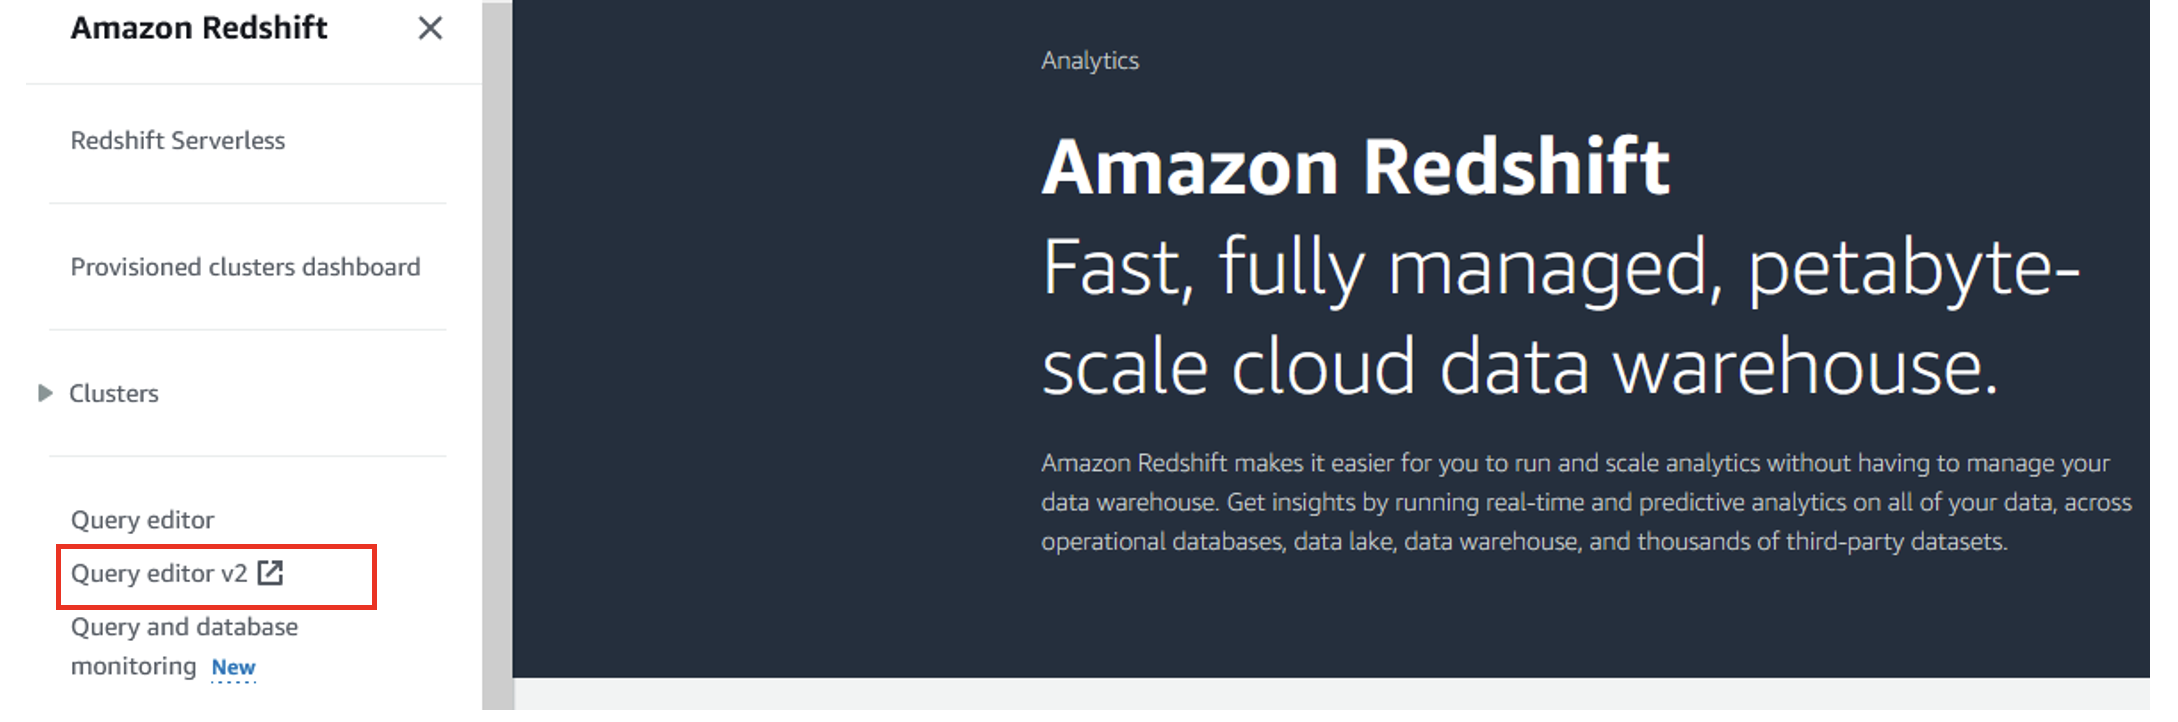
- On the Amazon Redshift console, choose Query editor v2 in the navigation pane to connect to your primary Region Redshift cluster (me-south-1).

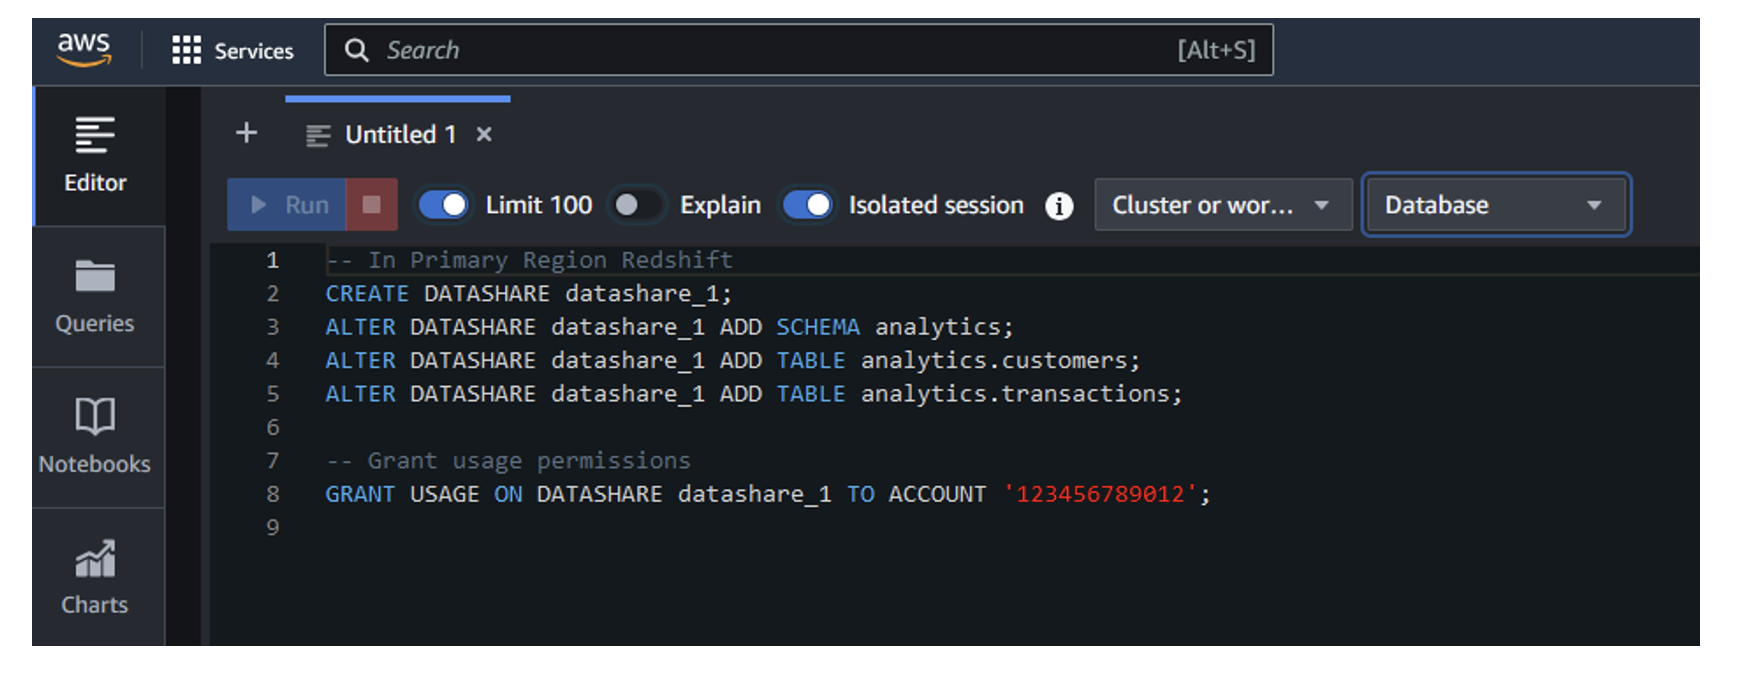
- Run the following commands:
-- In Primary Region Redshift

CREATE DATASHARE datashare_1;
ALTER DATASHARE datashare_1 ADD SCHEMA analytics;
ALTER DATASHARE datashare_1 ADD TABLE analytics.customers;
ALTER DATASHARE datashare_1 ADD TABLE analytics.transactions;

-- Grant usage permissions

GRANT USAGE ON DATASHARE datashare_1 TO ACCOUNT '123456789012';
- On the Amazon Redshift console, choose Query editor v2 in the navigation pane to connect to your primary Region Redshift cluster (me-south-1).
- Create a consumer database in the secondary Region:
- Connect to your secondary Region Redshift cluster (eu-west-1) using the query editor and run the following commands:
-- In Secondary Region Redshift CREATE DATABASE consumer_db FROM DATASHARE datashare_1 OF ACCOUNT '123456789012'REGION 'me-south-1'; - Verify the datashare configuration with the following code:
-- In Secondary Region Redshift

SELECT * FROM SVV_DATASHARE_CONSUMERS;
SELECT * FROM SVV_DATASHARE_OBJECTS;
This approach maintains data residency in the primary Region while enabling analytics access from another Region, addressing the core challenge of Regional service limitations. For our financial services company example, this makes sure that customer financial data remains in Bahrain (me-south-1) while making it securely accessible to the data science team in Europe (eu-west-1).
Configure QuickSight in the analytics Region
With network connectivity and data sharing established, complete the following steps to configure QuickSight to securely access the Redshift data:
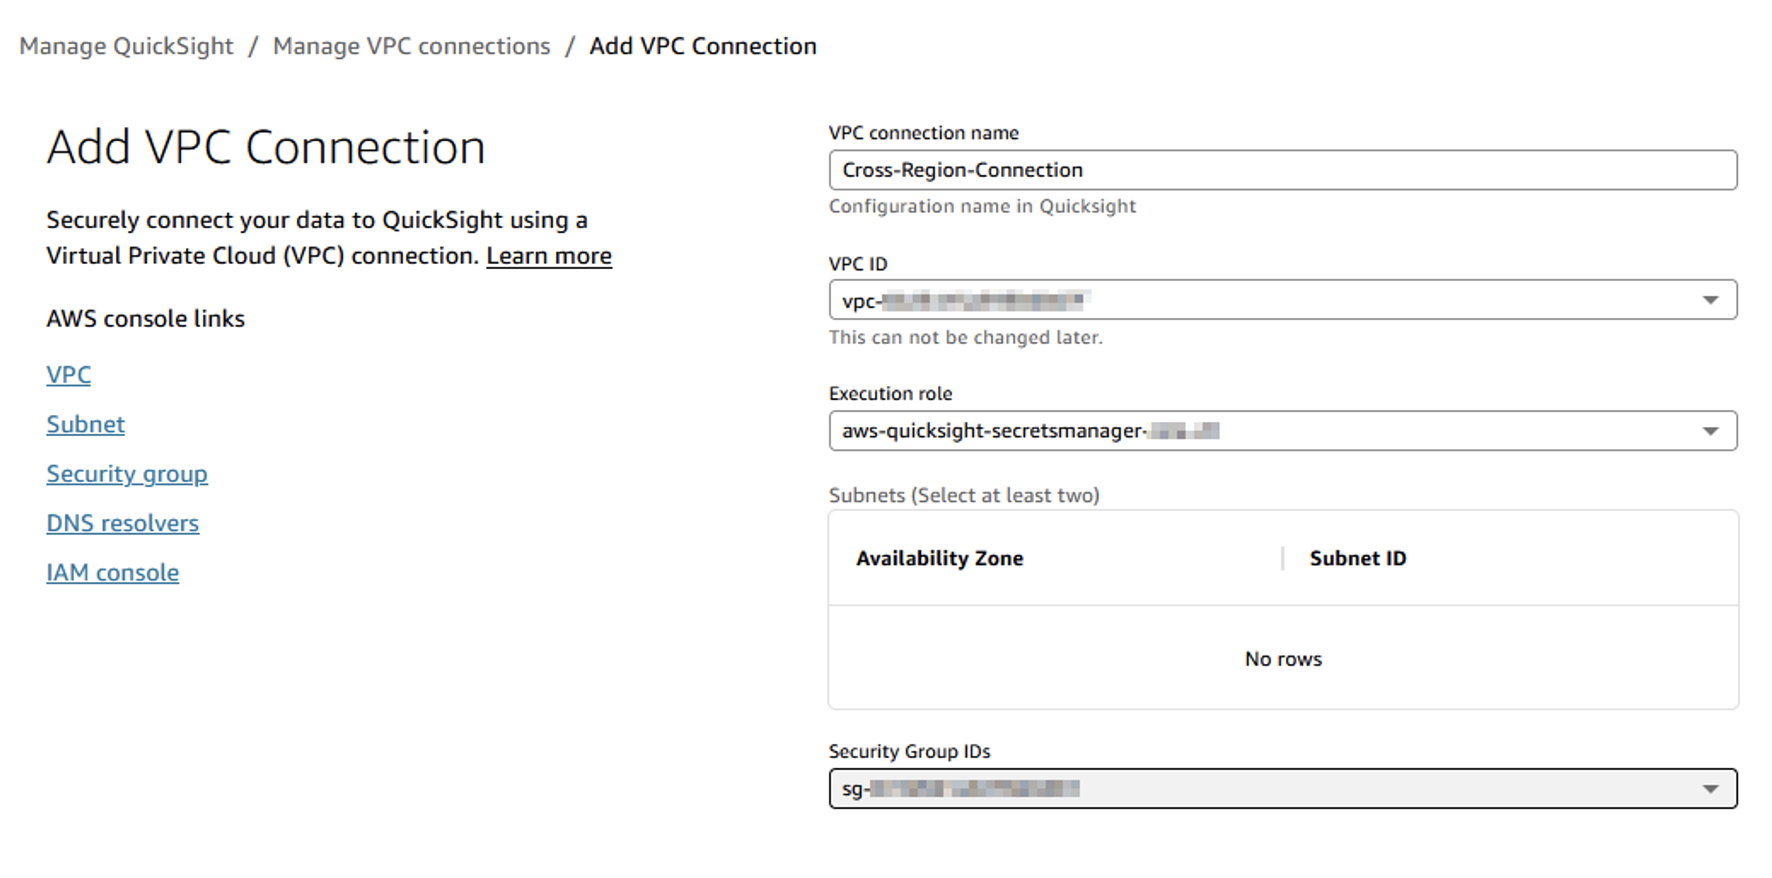
- Set up a QuickSight VPC connection:
- Open the QuickSight console in the secondary Region.
- Choose Manage QuickSight, VPC connections, and Add VPC connection.
- Configure the connection:
- Name: Enter a name (for example, Cross-Region-Connection).
- VPC: Choose the secondary Region VPC.
- Subnet: Choose the automatically created subnets.
- Security group: Choose the security group created for cross-Region access.
- Add a QuickSight IP range to the data source security group:
- Open the Amazon Elastic Compute Cloud (Amazon EC2) console in the primary Region.
- Choose Security groups in the navigation pane and find the security group for your data source.
- Edit the inbound rules.
- Add a new rule:
- Type: HTTPS (443)
- Protocol: TCP
- Port range: 443
- Source: QuickSight IP range for the secondary Region (for example, 52.210.255.224/27 for eu-west-1).
QuickSight IP ranges can change over time. Refer to AWS Regions, websites, IP address ranges, and endpoints for current IP ranges.
- Create a QuickSight data source:
- On the QuickSight console, choose Datasets in the navigation pane.
- Choose New dataset, then choose Redshift.
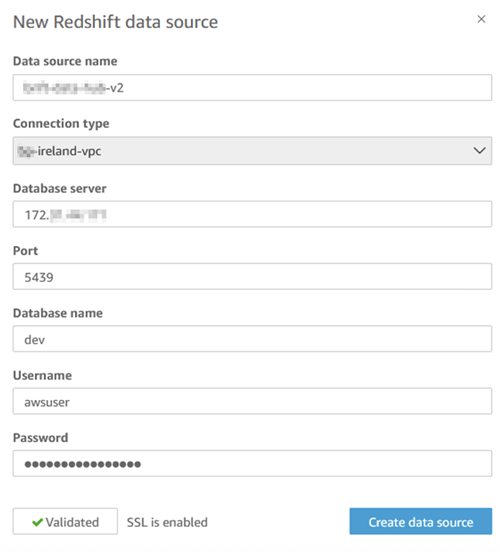
- Configure the connection:
- Data source name: Enter a descriptive name.
- Connection type: Choose the VPC connection.
- Database server: Enter the Redshift cluster endpoint from the primary Region.
- Port: 5439
- Database name: Enter the consumer database name.
- Username and Password: Enter credentials (consider using AWS Secrets Manager).
- Choose Validate connection to test.
- Choose Create data source.
- Verify the connection and create datasets:
- Choose the schema and tables from the consumer database.
- Configure appropriate refresh schedules.
- Create calculations and visualizations as needed.
Performance considerations for cross-Region analytics
When implementing a cross-Region analytics architecture, be aware of the following performance implications:
- Query performance impact – Cross-Region queries can experience higher latency than single-Region queries. To mitigate this, consider the following:
- Use SPICE for QuickSight – Import frequently-used datasets into SPICE (Super-fast, Parallel, In-memory Calculation Engine) to help avoid repeated cross-Region queries. SPICE is the QuickSight in-memory engine that enables fast, interactive visualizations by precomputing and storing datasets locally in the QuickSight Region.
- Implement efficient query patterns – Minimize the amount of data transferred between Regions.
- Use appropriate caching – Enable result caching where possible.
- Monitoring cross-Region performance – Implement monitoring to identify and address performance issues:
- Set up Amazon CloudWatch metrics to track cross-Region query performance
- Create dashboards to visualize latency trends
- Establish performance baselines and alerts for degradation
Security considerations
Maintaining security in a cross-Region architecture requires additional attention:
- Network security:
- Limit VPC peering connections to only necessary VPCs
- Implement restrictive security groups that allow only required traffic
- Consider using VPC endpoints for service access when possible
- Data access controls:
- Use AWS Identity and Access Management (IAM) policies consistently across Regions
- Implement fine-grained access controls in Redshift datashares
- Enable audit logging in relevant Regions
- Compliance monitoring:
- Implement AWS CloudTrail in all Regions
- Create centralized logging for cross-Region activities
- Regularly review cross-Region access patterns
Cost implications
Before implementing a cross-Region architecture, consider these cost factors:
- Data transfer costs – Data transfer between Regions incurs charges
- Additional infrastructure – You might need Redshift clusters in multiple Regions
- VPC peering costs – Data transfer costs are associated with VPC peering
- Operational overhead – Managing multi-Region deployments requires additional resources
- Workload-based sizing – You should size each Regional Redshift cluster according to the specific workloads it will handle
Conclusion
The cross-Region architecture described in this post addresses specific challenges related to Regional compliance requirements and global analytics needs, particularly in the following scenarios:
- Your data must remain in a specific Region for compliance reasons
- You have teams in different Regions who need to access and analyze this data
- Different user groups have distinct workload requirements
The datasharing capabilities of Amazon Redshift and Regional storage options in Amazon S3 are key enablers of this solution, allowing data to remain in the required Region while still being accessible for analytics across Regions. However, it’s worth emphasizing that this architecture supports data storage in specific Regions but doesn’t prevent data from traveling between Regions during processing. Organizations concerned about data transit restrictions should evaluate additional controls to address those specific requirements. Combined with secure VPC peering connections and QuickSight visualizations, this architecture creates a complete solution that satisfies both compliance requirements and business needs.
For our financial services example, this architecture successfully enables the company to keep its customer financial data in Bahrain while providing seamless analytics capabilities to the European data science team and delivering interactive dashboards to global business leaders.
For more information, refer to Building a Cloud Security Posture Dashboard with Amazon QuickSight. For hands-on experience, explore the Amazon QuickSight Workshops. Visit the Amazon Redshift console or Amazon QuickSight console to start building your first dashboard, and explore our AWS Big Data Blog for more customer success stories and implementation patterns
Try out this solution for your own use case, and share your thoughts in the comments.
About the Authors
 Donatas Kuchalskis is a Cloud Operations Architect at AWS, based in London, focusing on Financial Services customers in the UK. He helps customers optimize their AWS environments for cost, security, and resiliency while providing strategic cloud guidance. Prior to this role, he served as a Prototyping Architect specializing in Big Data and as a Specialist Solutions Architect for Retail. Before joining AWS, Donatas spent 6 years as a technical consultant in the retail sector.
 Jumana Nagaria is a Prototyping Architect at AWS. She builds innovative prototypes with customers to solve their business challenges. She is passionate about cloud computing and data analytics. Outside of work, Jumana enjoys travelling, reading, painting, and spending quality time with friends and family.
Juvenile Justice & Race #lastweektonight
Post Syndicated from LastWeekTonight original https://www.youtube.com/shorts/c0z_cDojbQs
How to prioritize security risks using AWS Security Hub exposure findings
Post Syndicated from Shahna Campbell original https://aws.amazon.com/blogs/security/how-to-prioritize-security-risks-using-aws-security-hub-exposure-findings/
At re:Inforce 2025, AWS unveiled an enhanced AWS Security Hub that transforms how organizations prioritize their most critical security issues and respond at scale to protect their cloud environments. In this blog post, we discuss how you can use Security Hub to prioritize these issues with exposure findings. The enhanced Security Hub now uses advanced analytics to automatically correlate, enrich, and prioritize security signals across your cloud environment. Security Hub seamlessly integrates with Amazon GuardDuty, Amazon Inspector, Amazon Macie, and AWS Security Hub Cloud Security Posture Management (CSPM), formerly known as AWS Security Hub. Through these integrations, it provides comprehensive threat detection and vulnerability assessment. This intelligent integration helps organizations quickly identify critical security issues, from potential credential compromises to unintended resource exposures, enabling security teams to focus on what matters most.
What is Security Hub?
Security Hub delivers three key security capabilities to help you strengthen your cloud security posture through a unified cloud security solution:
- Provides visibility across your organization through centralized management and continuous monitoring.
- Enriches security signals from services such as Amazon Inspector and AWS Security Hub CSPM to surface active risks specific to your environment, so you can prioritize with confidence and streamline response.
- Delivers integrated risk analysis by correlating findings from Amazon Inspector, AWS Security Hub CSPM, Amazon Macie, and other AWS services to help identify potential attack paths, surface exploitable vulnerabilities and misconfigurations, and provide actionable remediation guidance.
A top concern for customers is: How do I know where to prioritize response first? Managing large volumes of findings across multiple accounts and regions becomes more challenging when security findings are viewed in isolation, making it difficult to determine true priority and impact. Security Hub solves this by providing context-driven analysis. It surfaces the most critical risks by correlating related vulnerabilities, threats, and misconfigurations to reveal exploitable paths. This can help you make informed decisions about which issues to address first.
With exposure findings, you can prioritize critical security issues and respond at scale. Exposures are based on an analysis of findings and traits from Security Hub CSPM, Amazon Inspector (which scans for vulnerabilities), and Amazon Macie (which discovers and protects sensitive data). They are defined as potential security issues, and they are generated by different exposure traits.
Without automated correlation and enriched signals, security teams can struggle to effectively prioritize issues. For example, a vulnerability that Amazon Inspector detects might become critically important when combined with misconfigurations that Security Hub CSPM identifies. However, manually analyzing relationships across thousands of signals is time-consuming and prone to missing critical security context. Teams often build custom solutions to achieve this, but this approach requires significant analyst time and maintenance, which can cause critical security relationships to be overlooked.
Security Hub reduces this complexity by providing native integration across these AWS services in a unified cloud security center, without the operational overhead of log collection and aggregation. For security teams, this means they can help identify and respond to their most critical exposures before the exposures can lead to business impact, rather than spending valuable time manually piecing together individual security signals. Automated correlation and enriched context can help you make faster, more informed decisions about where to focus your efforts. This ultimately helps protect your cloud environment more effectively.
Exposure findings identify security risks in your environment by providing a comprehensive view of your security posture. These findings enable you to understand and address potential risks. Through this consolidated approach, you can efficiently prioritize your remediation efforts by focusing on the most critical exposure findings first,.
Exposure findings are formatted in the Open Cybersecurity Schema Framework (OCSF) schema, an open-source standard that enables security tools to share data seamlessly. The adoption of OCSF by Security Hub has several advantages. As an open, standardized schema that is part of the Linux Foundation, OCSF enables interoperability across multiple security tools and services, both within and outside of the AWS environment. It provides enhanced data normalization with consistent field naming and categorization, making it more straightforward to integrate with third-party security tools.
Partners who already support or intend to support the OCSF schema to receive findings from Security Hub include companies such as Arctic Wolf; CrowdStrike; DataBee, a Comcast company; Datadog; DTEX Systems; Dynatrace; Fortinet; IBM; Netskope; Orca Security; Rapid7; Securonix; SentinelOne; Splunk, a Cisco Company; Sumo Logic; Tines; Trellix; and Wiz. Additionally, service partners such as Accenture, Caylent, Deloitte, IBM, and Optiv can help you adopt Security Hub and the OCSF schema.
Prioritizing security risks
When you navigate to Security Hub, you will see the summary dashboard, which includes an exposure summary widget, as shown in Figure 1. This widget shows your exposures by severity and frequency. Security Hub assigns each exposure finding a default severity of Critical, High, Medium, or Low. Exposure findings with a severity of Informational are not published.
Security Hub calculates exposure finding severity by analyzing and correlating multiple security traits across AWS services. Instead of evaluating these factors in isolation, Security Hub uses a contextual approach, assigning a severity rating based on how these factors are correlated. For example, a resource with an identified vulnerability might receive a higher severity rating if it’s exploitable from the internet or has access to sensitive data.
Security Hub uses several factors to determine the default severity of an exposure finding:
- Ease of discovery – The availability of automated tools, such as port scans or internet searches to discover the resource at risk.
- Ease of exploit – The ease with which a threat actor can exploit the risk. For example, if there are open network paths or misconfigured metadata, a threat actor can more quickly exploit the risk.
- Likelihood of exploit – Security Hub uses both external signals, such as the Exploit Prediction Scoring System (EPSS)—a data-driven scoring system that estimates the probability of a vulnerability being exploited—and internal threat intelligence to determine the probability that the risk is exploited. This comprehensive approach applies to exposure findings for Amazon Elastic Compute Cloud (EC2) instances and AWS Lambda functions.
- Awareness – The extent to which the risk is not merely theoretical but has publicly available or automated exploits. This factor applies to exposure findings for EC2 instances and Lambda functions.
- Impact – The potential harm if the exploit is carried out. For example, an exposure could lead to loss of confidentiality from data exposure, loss of integrity from data corruption, loss of availability, or loss of accountability.
The list of risks in this widget is limited to the eight highest risks with the greatest number of critical findings. If two or more risks have an equal number of critical findings, the list automatically groups those findings behind more recent critical findings.

Figure 1 : Exposure summary widget
From the widget, you can pivot to the exposure dashboard to see to a pre-filtered view of your exposures for continued analysis of potential security issues. You can filter by severity by selecting the number associated with each severity, view a specific exposure by selecting from the list, or select View all exposure findings to see a dashboard of new exposures that are currently open, as shown in Figure 2.

Figure 2: Exposure dashboard
The exposure console shows findings by their title and ranked by decreasing severity. It’s organized by the filter criteria and grouped by finding title. On the left-hand side, Quick filters provide a fast way to filter through exposures based on severity, the top 10 attributes based on the most common values across your findings, top 10 accounts, and top 10 resource types, as shown in Figure 2. In addition to using filters, you can use the Group by dropdown to group exposure findings by a specific attribute, such as AWS account ID, resource type, or product name.
To review the exposure, expand the findings, as shown in Figure 3 for the correlation of resources, status, attributes, and traits such as software vulnerabilities, misconfigurations, and reachability. These are also referred to as trait types. For a particular exposure finding, a trait can be associated with one or more signals, and a signal can contain one or more indicators.

Figure 3: Exposure findings
As shown in Figure 3, the Potential Credential Stealing: Internet reachable EC2 instance with administrative instance profile has network-exploitable software vulnerabilities with a high likelihood of exploitation finding indicates that there are misconfigurations, vulnerabilities, and reachability (indication of an open network path to a resource) associated with the instance. To find out more about the signal, select anywhere in the line associated with the risk, and you will see an overview panel, as shown in Figure 4.

Figure 4: Exposure finding overview
This example highlights a critical-severity finding for an internet-reachable EC2 instance with software vulnerabilities in the us-east-1 Region. This visualization is powerful because the Potential attack path diagram helps you see what matters by mapping out how potential threat actors could exploit these vulnerabilities to access your resources. The finding also includes critical metadata such as the resource identifier, creation time, reachability, vulnerability, and misconfigurations.
Using the finding, you can quickly understand complex security relationships, assess risk context, and determine remediation priorities, so you can better protect your workloads in the cloud and make more informed security decisions. To prioritize your security response efforts, you can also set finding severity levels and update status, and export findings in OCSF format.
To understand why an exposure is present, you can select the Traits tab, as shown in Figure 5. This will list traits such as Misconfiguration or Vulnerability. If you select By signal, in the Traits tab, you have a full list of the signals associated with the exposure finding. These signals are the underlying findings that were created from different services, such as Security Hub CSPM and Amazon Inspector, that were correlated together to determine the risk associated with the exposure finding.

Figure 5: Exposure finding traits
If you select the Resources tab, you will see the resources associated with the exposure finding, as shown in Figure 6.

Figure 6: Exposure finding resources
For this example, we have an EC2 instance, but you might have a combination of resources such as an EC2 instance, Amazon Simple Storage Service (Amazon S3) bucket, and AWS Identity and Access Management (IAM) role. This list of resources will help you determine what needs to be remediated in your environment to mitigate the risk attributed to this finding.
Finally, with the Create ticket option, Security Hub helps streamline the incident management process through its native integrations with popular ticketing systems such as Jira and ServiceNow. This integration minimizes the need for manual ticket creation and reduces the time between finding and fixing security issues. Organizations can use a Security Hub Automation Rule to automatically create and track tickets for security findings directly from the Security Hub console, helping to make sure that no critical security exposure goes unaddressed. Integration with these widely-used ticketing systems helps maintain a consistent workflow, enables better tracking of remediation efforts, and improves collaboration between security and operations teams. This can help you make your security operations more efficient by providing a streamlined path from detection to resolution.
Conclusion
The enhanced exposure findings capabilities in Security Hub represent a significant advancement in how organizations can secure their cloud environments. By automatically correlating and analyzing security signals across multiple AWS services, Security Hub helps you prioritize your most critical security issues confidently and respond at scale. The intuitive visualization of potential attack paths, combined with intelligent severity rankings and comprehensive trait analysis, enables security teams to make data-driven decisions about risk prioritization.
Security Hub exposure findings help organizations move from reactive to proactive security postures by:
- Automatically discovering and evaluating publicly accessible resources
- Providing clear visibility into security capabilities and configurations
- Correlating multiple security signals to identify critical risks
- Delivering actionable remediation guidance
- Offering intuitive filtering and grouping options for efficient analysis
As cloud environments continue to grow in complexity, exposure findings provide the automation, intelligence, and context needed to stay ahead of potential security issues. This enables security teams to focus their valuable time on addressing the most critical risks first, ultimately helping organizations maintain a stronger security posture across their cloud environment.
Whether you’re managing a small deployment or a large enterprise environment, exposure findings in Security Hub provide the insights needed to effectively protect your AWS workloads and maintain a robust security position in an ever-evolving landscape.
If you have feedback about this post, submit comments in the Comments section below. If you have questions about this post, start a new thread on AWS Security, Identity, and Compliance re:Post or contact AWS Support.
[$] Asterinas: a new Linux-compatible kernel project
Post Syndicated from corbet original https://lwn.net/Articles/1022920/
Born from research at the Southern University of Science and
Technology (SUSTech) in Shenzen, China, Asterinas is a new
Linux-ABI-compatible kernel project written in Rust, based on what the
authors call a “framekernel architecture”. The project overlaps somewhat
with the goals of the Rust for Linux
project, but approaches the problem space from a different direction by
trying to get the best from both monolithic and microkernel designs.
UniFi Passkeys Make Logging In Super Easy!
Post Syndicated from Crosstalk Solutions original https://www.youtube.com/shorts/sxc53bBGMiA
Stable kernels 6.15.3, 6.12.34, and 6.6.94
Post Syndicated from jake original https://lwn.net/Articles/1026008/
Greg Kroah-Hartman has announced the release of the 6.15.3, 6.12.34, and 6.6.94 stable kernels. Each contains a
relatively large number of important fixes throughout the kernel tree.
From Basic to Jaw-Dropping: Hidden Home Theater Transformation
Post Syndicated from The Hook Up original https://www.youtube.com/watch?v=qPkKWKxulNM
Security updates for Thursday
Post Syndicated from jake original https://lwn.net/Articles/1026007/
Security updates have been issued by AlmaLinux (gvisor-tap-vsock), Debian (activemq and chromium), Fedora (kea, python-django4.2, python-django5, python-setuptools, and rust-git-interactive-rebase-tool), Oracle (ipa and kernel), Red Hat (buildah, container-tools:rhel8, containernetworking-plugins, git-lfs, go-toolset:rhel8, golang, golang-github-openprinting-ipp-usb, grafana, grafana-pcp, gvisor-tap-vsock, podman, and skopeo), Slackware (libblockdev and xorg), SUSE (gdm, gstreamer-plugins-base, ignition, kernel, pam, redis, s390-tools, screen, systemd, and xorg-x11-server), and Ubuntu (godot, golang-1.22, libblockdev, node-express, pam, samba, and udisks2).
Everything you need to know about NIST’s new guidance in “SP 1800-35: Implementing a Zero Trust Architecture”
Post Syndicated from Aaron McAllister original https://blog.cloudflare.com/nist-sp-1300-85/
For decades, the United States National Institute of Standards and Technology (NIST) has been guiding industry efforts through the many publications in its Computer Security Resource Center. NIST has played an especially important role in the adoption of Zero Trust architecture, through its series of publications that began with NIST SP 800-207: Zero Trust Architecture, released in 2020.
NIST has released another Special Publication in this series, SP 1800-35, titled “Implementing a Zero Trust Architecture (ZTA)” which aims to provide practical steps and best practices for deploying ZTA across various environments. NIST’s publications about ZTA have been extremely influential across the industry, but are often lengthy and highly detailed, so this blog provides a short and easier-to-read summary of NIST’s latest guidance on ZTA.
And so, in this blog post:
-
We summarize the key items you need to know about this new NIST publication, which presents a reference architecture for Zero Trust Architecture (ZTA) along with a series of “Builds” that demonstrate how different products from various vendors can be combined to construct a ZTA that complies with the reference architecture.
-
We show how Cloudflare’s Zero Trust product suite can be integrated with offerings from other vendors to support a Zero Trust Architecture that maps to the NIST’s reference architecture.
-
We highlight a few key features of Cloudflare’s Zero Trust platform that are especially valuable to customers seeking compliance with NIST’s ZTA reference architecture, including compliance with FedRAMP and new post-quantum cryptography standards.
Let’s dive into NIST’s special publication!
In SP 1800-35, NIST reminds us that:
A zero-trust architecture (ZTA) enables secure authorized access to assets — machines, applications and services running on them, and associated data and resources — whether located on-premises or in the cloud, for a hybrid workforce and partners based on an organization’s defined access policy.
NIST uses the term Subject to refer to entities (i.e. employees, developers, devices) that require access to Resources (i.e. computers, databases, servers, applications). SP 1800-35 focuses on developing and demonstrating various ZTA implementations that allow Subjects to access Resources. Specifically, the reference architecture in SP 1800-35 focuses mainly on EIG or “Enhanced Identity Governance”, a specific approach to Zero Trust Architecture, which is defined by NIST in SP 800-207 as follows:
For [the EIG] approach, enterprise resource access policies are based on identity and assigned attributes.
The primary requirement for [R]esource access is based on the access privileges granted to the given [S]ubject. Other factors such as device used, asset status, and environmental factors may alter the final confidence level calculation … or tailor the result in some way, such as granting only partial access to a given [Resource] based on network location.
Individual [R]esources or [policy enforcement points (PEP)] must have a way to forward requests to a policy engine service or authenticate the [S]ubject and approve the request before granting access.
While there are other approaches to ZTA mentioned in the original NIST SP 800-207, we omit those here because SP 1800-35 focuses mostly on EIG.
The ZTA reference architecture from SP 1800-35 focuses on EIG approaches as a set of logical components as shown in the figure below. Each component in the reference architecture does not necessarily correspond directly to physical (hardware or software) components, or products sold by a single vendor, but rather to the logical functionality of the component.
Figure 1: General ZTA Reference Architecture. Source: NIST, Special Publication 1800-35, “Implementing a Zero Trust Architecture (ZTA)”, 2025.
The logical components in the reference architecture are all related to the implementation of policy. Policy is crucial for ZTA because the whole point of a ZTA is to apply policies that determine who has access to what, when and under what conditions.
The core components of the reference architecture are as follows:
| Policy Enforcement Point(PEP) | The PEP protects the “trust zones” that host enterprise Resources, and handles enabling, monitoring, and eventually terminating connections between Subjects and Resources. You can think of the PEP as the dataplane that supports the Subject’s access to the Resources.
|
Policy Enforcement Point |
The PEP protects the “trust zones” that host enterprise Resources, and handles enabling, monitoring, and eventually terminating connections between Subjects and Resources. You can think of the PEP as the dataplane that supports the Subject’s access to the Resources. |
|
Policy Engine (PE) |
The PE handles the ultimate decision to grant, deny, or revoke access to a Resource for a given Subject, and calculates the trust scores/confidence levels and ultimate access decisions based on enterprise policy and information from supporting components. |
|
Policy Administrator (PA) |
The PA executes the PE’s policy decision by sending commands to the PEP to establish and terminate the communications path between the Subject and the Resource. |
|
Policy Decision Point (PDP) |
The PDP is where the decision as to whether or not to permit a Subject to access a Resource is made. The PIP included the Policy Engine (PE) and the Policy Administrator (PA). You can think of the PDP as the control plane that controls the Subject’s access to the Resources. |
The PDP operates on inputs from Policy Information Points (PIPs) which are supporting components that provide critical data and policy rules to the Policy Decision Point (PDP).
|
Policy Information Point (PIP) |
The PIPs provide various types of telemetry and other information needed for the PDP to make informed access decisions. Some PIPs include:
NIST’s figure might suggest that supporting components in the PIP are mere plug-ins responding in real-time to the PDP. However, for many vendors, the ICAM, EDR/EPP, security analytics, and data security PIPs often represent complex and distributed infrastructures. |
Next, the SP 1800-35 introduces two more detailed reference architectures, the “Crawl Phase” and the “Run Phase”. The “Run Phase” corresponds to the reference architecture that is shown in the figure above. The “Crawl Phase” is a simplified version of this reference architecture that only deals with protecting on-premise Resources, and omits cloud Resources. Both of these phases focused on Enhanced Identity Governance approaches to ZTA, as we defined above. NIST stated, “We are skipping the EIG walk phase and have proceeded directly to the run phase“.
The SP 1800-35 then provides a sequence of detailed instructions, called “Builds”, that show how to implement “Crawl Phase” and “Run Phase” reference architectures using products sold by various vendors.
Since Cloudflare’s Zero Trust platform natively supports access to both cloud and on-premise resources, we will skip over the “Crawl Phase” and move directly to showing how Cloudflare’s Zero Trust platform can be used to support “Run Phase” of the reference architecture.
Nothing in NIST SP 1800-35 represents an endorsement of specific vendor technologies. Instead, the intent of the publication is to offer a general architecture that applies regardless of the technologies or vendors an organization chooses to deploy. It also includes a series of “Builds” using a variety of technologies from different vendors, that allow organizations to achieve a ZTA. This section describes how Cloudflare fits in with a ZTA, enabling you to accelerate your ZTA deployment from Crawl directly to Run.
Regarding the “Builds” in SP 1800-35, this section can be viewed as an aggregation of the following three specific builds:
-
Enterprise 1 Build 3 (E1B3): Software-Defined Perimeter (SDP) with Cloudflare as the Policy Engine (PE).
-
Enterprise 2 Build 4 (E2B4): SDP and Secure Access Service Edge (SASE) with Cloudflare Secure Web Gateway, Cloudflare Zero Trust Network Access (ZTNA), and Cloudflare Cloud Access Security Broker as PEs.
-
Enterprise 3 Build 5 (E3B5): SDP and SASE with Microsoft Entra Conditional Access (formerly known as Azure AD Conditional Access) and Cloudflare Zero Trust as PEs.
Now let’s see how we can map Cloudflare’s Zero Trust platform to the ZTA reference architecture:
Figure 2: General ZTA Reference Architecture Mapped to Cloudflare Zero Trust & Key Integrations. Source: NIST, Special Publication 1800-35, “Implementing a Zero Trust Architecture (ZTA)”, 2025, with modification by Cloudflare.
Cloudflare’s platform simplifies complexity by delivering the PEP via our global anycast network and the PDP via our Software-as-a-Service (SaaS) management console, which also serves as a global unified control plane. A complete ZTA involves integrating Cloudflare with PIPs provided by other vendors, as shown in the figure above.
Now let’s look at several key points in the figure.
In the bottom right corner of the figure are Resources, which may reside on-premise, in private data centers, or across multiple cloud environments. Resources are made securely accessible through Cloudflare’s global anycast network via Cloudflare Tunnel (as shown in the figure) or Magic WAN (not shown). Resources are shielded from direct exposure to the public Internet by placing them behind Cloudflare Access and Cloudflare Gateway, which are PEPs that enforce zero-trust principles by granting access to Subjects that conform to policy requirements.
In the bottom left corner of the figure are Subjects, both human and non-human, that need access to Resources. With Cloudflare’s platform, there are multiple ways that Subjects can again access to Resources, including:
-
Agentless approaches that allow end users to access Resources directly from their web browsers. Alternatively, Cloudflare’s Magic WAN can be used to support connections from enterprise networks directly to Cloudflare’s global anycast network via IPsec tunnels, GRE tunnels or Cloudflare Network Interconnect (CNI).
-
Agent-based approaches use Cloudflare’s lightweight WARP client, which protects corporate devices by securely and privately sending traffic to Cloudflare’s global network.
Now we move onto the PEP (the Policy Enforcement Point), which is the dataplane of our ZTA. Cloudflare Access is a modern Zero Trust Network Access solution that serves as a dynamic PEP, enforcing user-specific application access policies based on identity, device posture, context, and other factors. Cloudflare Gateway is a Secure Web Gateway for filtering and inspecting traffic sent to the public Internet, serving as a dynamic PEP that provides DNS, HTTP and network traffic filtering, DNS resolver policies, and egress IP policies.
Both Cloudflare Access and Cloudflare Gateway rely on Cloudflare’s control plane, which acts as a PDP offering a policy engine (PE) and policy administrator (PA). This PDP takes in inputs from PIPs provided by integrations with other vendors for ICAM, endpoint security, and security analytics. Let’s dig into some of these integrations.
-
ICAM: Cloudflare’s control plane integrates with many ICAM providers that provide Single Sign On (SSO) and Multi-Factor Authentication (MFA). The ICAM provider authenticates human Subjects and passes information about authenticated users and groups back to Cloudflare’s control plane using Security Assertion Markup Language (SAML) or OpenID Connect (OIDC) integrations. Cloudflare’s ICAM integration also supports AI/ML powered behavior-based user risk scoring, exchange, and re-evaluation.
In the figure above, we depicted Okta as the ICAM provider, but Cloudflare supports many other ICAM vendors (e.g. Microsoft Entra, Jumpcloud, GitHub SSO, PingOne). For non-human Subjects — such as service accounts, Internet of Things (IoT) devices, or machine identities — authentication can be performed through certificates, service tokens, or other cryptographic methods.
-
Endpoint security: Cloudflare’s control plane integrates with many endpoint security providers to exchange signals, such as device posture checks and user risk levels. Cloudflare facilitates this through integrations with endpoint detection and response EDR/EPP solutions, such as CrowdStrike, Microsoft, SentinelOne, and more. When posture checks are enabled with one of these vendors such as Microsoft, device state changes, ‘noncompliant’, can be sent to Cloudflare Zero Trust, automatically restricting access to Resources. Additionally, Cloudflare Zero Trust enables the ability to synchronize the Microsoft Entra ID risky users list and apply more stringent Zero Trust policies to users at higher risk.
-
Security Analytics: Cloudflare’s control plane integrates with real-time logging and analytics for persistent monitoring. Cloudflare’s own analytics and logging features monitor access requests and security events. Optionally, these events can be sent to a Security Information and Event Management (SIEM) solution such as, CrowdStrike, Datadog, IBM QRadar, Microsoft Sentinel, New Relic, Splunk, and more using Cloudflare’s logpush integration.
Cloudflare’s user risk scoring system is built on the OpenID Shared Signals Framework (SSF) Specification, which allows integration with existing and future providers that support this standard. SSF focuses on the exchange of Security Event Tokens (SETs), a specialized type of JSON Web Token (JWT). By using SETs, providers can share user risk information, creating a network of real-time, shared security intelligence. In the context of NIST’s Zero Trust Architecture, this system functions as a PIP, which is responsible for gathering information about the Subject and their context, such as risk scores, device posture, or threat intelligence. This information is then provided to the PDP, which evaluates access requests and determines the appropriate policy actions. The PEP uses these decisions to allow or deny access, completing the cycle of secure, dynamic access control.
-
Data security: Cloudflare’s Zero Trust offering provides robust data security capabilities across data-in-transit, data-in-use, and data-at-rest. Its Data Loss Prevention (DLP) safeguards sensitive information in transit by inspecting and blocking unauthorized data movement. Remote Browser Isolation (RBI) protects data-in-use by preventing malware, phishing, and unauthorized exfiltration while enabling secure web access. Meanwhile, Cloud Access Security Broker (CASB) ensures data-at-rest security by enforcing granular controls over SaaS applications, preventing unauthorized access and data leakage. Together, these capabilities provide comprehensive protection for modern enterprises operating in a cloud-first environment.
By leveraging Cloudflare’s Zero Trust platform, enterprises can simplify and enhance their ZTA implementation, securing diverse environments and endpoints while ensuring scalability and ease of deployment. This approach ensures that all access requests—regardless of where the Subjects or Resources are located—adhere to robust security policies, reducing risks and improving compliance with modern security standards.
Cloudflare works with multiple enterprises, and federal and state agencies that rely on NIST guidelines to secure their networks. So we take a brief detour to describe some unique features of Cloudflare’s Zero Trust platform that we’ve found to be valuable to these enterprises.
-
FedRAMP data centers. Many government agencies and commercial enterprises have FedRAMP requirements, and Cloudflare is well-equipped to support them. FedRAMPs requirements sometimes require organizations to self-host software and services inside their own network perimeter, which can result in higher latency, degraded performance and increased cost. At Cloudflare, we take a different approach. Organizations can still benefit from Cloudflare’s global network and unparalleled performance while remaining Fedramp compliant. To support FedRAMP customers, Cloudflare’s dataplane (aka our PEP, or Policy Enforcement Point) consists of data centers in over 330 cities where customers can send their encrypted traffic, and 32 FedRAMP datacenters where traffic is sent to when sensitive dataplane operations are required (e.g. TLS inspection). This architecture means that our customers do not need to self-host a PEP and incur the associated cost, latency, and performance degradation.
-
Post-quantum cryptography. NIST has announced that by 2030 all conventional cryptography (RSA and ECDSA) must be deprecated and upgraded to post-quantum cryptography. But upgrading cryptography is hard and takes time, so Cloudflare aims to take on the burden of managing cryptography upgrades for our customers. That’s why organizations can tunnel their corporate network traffic though Cloudflare’s Zero Trust platform, protecting it against quantum adversaries without the hassle of individually upgrading each and every corporate application, system, or network connection. End-to-end quantum safety is available for communications from end-user devices, via web browser (today) or Cloudflare’s WARP device client (mid-2025), to secure applications connected with Cloudflare Tunnel.
NIST’s latest publication, SP 1800-35, provides a structured approach to implementing Zero Trust, emphasizing the importance of policy enforcement, continuous authentication, and secure access management. Cloudflare’s Zero Trust platform simplifies this complex framework by delivering a scalable, globally distributed solution that is FedRAMP-compliant and integrates with industry-leading providers like Okta, Microsoft, Ping, CrowdStrike, and SentinelOne to ensure comprehensive protection.
A key differentiator of Cloudflare’s Zero Trust solution is our global anycast network, one of the world’s largest and most interconnected networks. Spanning 330+ cities across 120+ countries, this network provides unparalleled performance, resilience, and scalability for enforcing Zero Trust policies without negatively impacting the end user experience. By leveraging Cloudflare’s network-level enforcement of security controls, organizations can ensure that access control, data protection, and security analytics operate at the speed of the Internet — without backhauling traffic through centralized choke points. This architecture enables low-latency, highly available enforcement of security policies, allowing enterprises to seamlessly protect users, devices, and applications across on-prem, cloud, and hybrid environments.
Now is the time to take action. You can start implementing Zero Trust today by leveraging Cloudflare’s platform in alignment with NIST’s reference architecture. Whether you are beginning your Zero Trust journey or enhancing an existing framework, Cloudflare provides the tools, network, and integrations to help you succeed. Sign up for Cloudflare Zero Trust, explore our integrations, and secure your organization with a modern, globally distributed approach to cybersecurity.
Defending the Internet: how Cloudflare blocked a monumental 7.3 Tbps DDoS attack
Post Syndicated from Omer Yoachimik original https://blog.cloudflare.com/defending-the-internet-how-cloudflare-blocked-a-monumental-7-3-tbps-ddos/
In mid-May 2025, Cloudflare blocked the largest DDoS attack ever recorded: a staggering 7.3 terabits per second (Tbps). This comes shortly after the publication of our DDoS threat report for 2025 Q1 on April 27, 2025, where we highlighted attacks reaching 6.5 Tbps and 4.8 billion packets per second (pps). The 7.3 Tbps attack is 12% larger than our previous record and 1 Tbps greater than a recent attack reported by cyber security reporter Brian Krebs at KrebsOnSecurity.
New world record: 7.3 Tbps DDoS attack autonomously blocked by Cloudflare
The attack targeted a Cloudflare customer, a hosting provider, that uses Magic Transit to defend their IP network. Hosting providers and critical Internet infrastructure have increasingly become targets of DDoS attacks, as we reported in our latest DDoS threat report. Pictured below is an attack campaign from January and February 2025 that blasted over 13.5 million DDoS attacks against Cloudflare’s infrastructure and hosting providers protected by Cloudflare.
DDoS attack campaign target Cloudflare infrastructure and hosting providers protected by Cloudflare
Let’s start with some stats, and then we’ll dive into how our systems detected and mitigated this attack.
37.4 terabytes is not a staggering figure in today’s scales, but blasting 37.4 terabytes in just 45 seconds is. It’s the equivalent to flooding your network with over 9,350 full-length HD movies, or streaming 7,480 hours of high-definition video nonstop (that’s nearly a year of back-to-back binge-watching) in just 45 seconds. If it were music, you’d be downloading about 9.35 million songs in under a minute, enough to keep a listener busy for 57 years straight. Think of snapping 12.5 million high-resolution photos on your smartphone and never running out of storage—even if you took one shot every day, you’d be clicking away for 4,000 years — but in 45 seconds.
The record-breaking 7.3 Tbps DDoS attack delivered 37.4 TB in 45 seconds
The attack carpet-bombed an average of 21,925 destination ports of a single IP address owned and used by our customer, with a peak of 34,517 destination ports per second. The attack also originated from a similar distribution of source ports.
Distribution of destination ports
The 7.3 Tbps attack was a multivector DDoS attack. Around 99.996% of the attack traffic was categorized as UDP floods. However, the remaining 0.004%, which accounted for 1.3 GB of the attack traffic, were identified as QOTD reflection attacks, Echo reflection attack, NTP reflection attack, Mirai UDP flood attack, Portmap flood, and RIPv1 amplification attacks.
The attack vectors other than UDP floods
Below are details about the various attack vectors seen in this attack, how organizations can avoid becoming a reflection and amplification participant, and recommendations on how to defend against these attacks whilst avoiding impact to legitimate traffic. Cloudflare’s customers are protected against these attacks.
UDP DDoS attack
-
Type: Flood
-
How it works: A high volume of UDP packets is sent to random or specific ports on the target IP address(es). It may attempt to saturate the Internet link or overwhelm its in-line appliances with more packets than it can handle.
-
How to defend against the attack: Deploy cloud-based volumetric DDoS protection, apply smart rate-limiting on UDP traffic, and drop unwanted UDP traffic altogether.
-
How to avoid unintended impact: Aggressive filtering may disrupt legitimate UDP services such as VoIP, video conferencing, or online games. Apply thresholds carefully.
QOTD DDoS attack
-
Type: Reflection + Amplification
-
How it works: Abuses the Quote of the Day (QOTD) Protocol, which listens on UDP port 17 and responds with a short quote or message. Attackers send QOTD requests to exposed servers from a spoofed IP address, causing amplified responses to flood the victim.
-
How to prevent becoming a reflection / amplification element: Disable the QOTD service and block UDP/17 on all servers and firewalls.
-
How to defend against the attack: Block inbound UDP/17. Drop abnormal small-packet UDP request spikes.
-
How to avoid unintended impact: QOTD is an obsolete diagnostic/debugging protocol and is not used by modern applications. Disabling it should not have any negative effect on legitimate services.
Echo DDoS attack
-
Type: Reflection + Amplification
-
How it works: Exploits the Echo protocol (UDP/TCP port 7), which replies with the same data it receives. Attackers spoof the victim’s IP address, causing devices to reflect the data back, amplifying the attack.
-
How to prevent becoming a reflection / amplification element: Disable the Echo service on all devices. Block UDP/TCP port 7 at the edge.
-
How to defend against the attack: Disable the Echo service and block TCP/UDP port 7 at the network perimeter.
-
How to avoid unintended impact: Echo is an obsolete diagnostic tool; disabling or blocking it has no negative effect on modern systems.
NTP DDoS attack
-
Type: Reflection + Amplification
-
How it works: Abuses the Network Time Protocol (NTP), used to sync clocks over the Internet. Attackers exploit the monlist command on old NTP servers (UDP/123) which returns a large list of recent connections. Spoofed requests cause amplified reflections.
-
How to prevent becoming a reflection / amplification element: Upgrade or configure NTP servers to disable monlist. Restrict NTP queries to trusted IP addresses only.
-
How to defend against the attack: Disable the monlist command, update NTP software, and filter or rate-limit UDP/123 traffic.
-
How to avoid unintended impact: Disabling monlist has no effect on time synchronization. However, filtering or blocking UDP/123 could affect time syncing if done too broadly — ensure only untrusted or external sources are blocked.
Mirai UDP attack
-
Type: Flood
-
How it works: The Mirai botnet, made up of compromised IoT devices, floods victims using random or service-specific UDP packets (e.g., DNS, game services).
-
How to prevent becoming part of the botnet: Secure your IoT devices, change default passwords, upgrade to the latest firmware versions, and follow IoT security best practices to avoid becoming part of the botnet. When possible, monitor outbound traffic to detect irregularities.
-
How to defend against the attack: Deploy cloud-based volumetric DDoS protection and rate-limiting for UDP traffic.
-
How to avoid unintended impact: First, understand your network and the type of traffic that you receive, specifically the protocols, their sources and their destinations. Identify services that run over UDP that you want to avoid impacting. Once you have identified those, you can apply rate-limiting in a way that excludes those end points, or takes into account your regular traffic levels. Otherwise, aggressively rate-limiting UDP traffic can impact your legitimate traffic and impact services that run over UDP such as VoIP calls and VPN traffic.
Portmap DDoS attack
-
Type: Reflection + Amplification
-
How it works: Targets the Portmapper service (UDP/111) used by Remote Procedure Call (RPC)-based applications to identify available services. Spoofed requests result in reflected responses.
-
How to prevent becoming a reflection / amplification element: Disable the Portmapper service if not required. If needed internally, restrict it to trusted IP addresses only.
-
How to defend against the attack: Disable the Portmapper service if not needed, block inbound UDP/111 traffic. Use Access Control Lists (ACLs) or firewalls to restrict access to known RPC services.
-
How to avoid unintended impact: Disabling Portmapper may disrupt applications relying on RPC (e.g., Network File System protocol). Validate service dependencies before removal.
RIPv1 DDoS attack
-
Type: Reflection + (Low) Amplification
-
How it works: Exploits the Routing Information protocol version 1 (RIPv1), an old unauthenticated distance-vector routing protocol that uses UDP/520. Attackers send spoofed routing updates to flood or confuse networks.
-
How to prevent becoming a reflection / amplification element: Disable RIPv1 on routers. Use RIPv2 with authentication where routing is needed.
-
How to defend against the attack: Block inbound UDP/520 from untrusted networks. Monitor for unexpected routing updates.
-
How to avoid unintended impact: RIPv1 is mostly obsolete; disabling it is generally safe. If legacy systems rely on it, validate routing behavior before changes.
All recommendations here should be taken into consideration with the context and behavior of each unique network or application to avoid any unintended impact to legitimate traffic.
The attack originated from over 122,145 source IP addresses spanning 5,433 Autonomous Systems (AS) across 161 countries.
Almost half of the attack traffic originated from Brazil and Vietnam, with approximately a quarter each. Another third, in aggregate, originated from Taiwan, China, Indonesia, Ukraine, Ecuador, Thailand, the United States, and Saudi Arabia.
Top 10 source countries of the attack traffic
The average number of unique source IP addresses per second was 26,855 with a peak of 45,097.
Distribution of unique source IP addresses
The attack originated from 5,433 different networks (ASes). Telefonica Brazil (AS27699) accounted for the largest portion of the DDoS attack traffic, responsible for 10.5% of the total. Viettel Group (AS7552) follows closely with 9.8%, while China Unicom (AS4837) and Chunghwa Telecom (AS3462) contributed 3.9% and 2.9% respectively. China Telecom (AS4134) accounted for 2.8% of the traffic. The remaining ASNs in the top 10, including Claro NXT (AS28573), VNPT Corp (AS45899), UFINET Panama (AS52468), STC (AS25019), and FPT Telecom Company (AS18403), each contributed between 1.3% and 1.8% of the total DDoS attack traffic.
Top 10 source autonomous systems
To help hosting providers, cloud computing providers, and any Internet service providers identify and take down the abusive accounts that launch these attacks, we leverage Cloudflare’s unique vantage point to provide a free DDoS Botnet Threat Feed for Service Providers. Over 600 organizations worldwide have already signed up for this feed. It gives service providers a list of offending IP addresses from within their ASN that we see launching HTTP DDoS attacks. It’s completely free and all it takes is opening a free Cloudflare account, authenticating the ASN via PeeringDB, and then fetching the feed via API.
The attacked IP address was advertised from Cloudflare’s network using global anycast. This means that the attack packets that targeted the IP were routed to the closest Cloudflare data center. Using global anycast allows us to spread the attack traffic and use its distributed nature against it, enabling us to mitigate close to the botnet nodes and continue serving users from the data centers closest to them. In the case of this attack, it was detected and mitigated in 477 data centers across 293 locations around the world. In high-traffic locations, we have presence in multiple data centers.
The Cloudflare global network runs every service in every data center. This includes our DDoS detection and mitigation systems. This means that attacks can be detected and mitigated fully autonomously, regardless of where they originate from.
When a packet enters our data center, it is intelligently load-balanced to an available server. We then sample packets directly from within the depths of the Linux kernel, from the eXpress Data Path (XDP) using an extended Berkley Packer Filter (eBPF) program to route packet samples to the user space where we run the analysis.
Our system analyzes the packet samples to identify suspicious patterns based on our unique heuristic engine named dosd (denial of service daemon). Dosd looks for patterns in the packet samples, such as finding commonality in the packet header fields and looking for packet anomalies, as well as applying other proprietary techniques.
Flow diagram of the real-time fingerprint generation
To our customers, this complex fingerprinting system is encapsulated as a user-friendly group of managed rules, the DDoS Protection Managed Rulesets.
When patterns are detected by dosd, it generates multiple permutations of those fingerprints in order to find the most accurate fingerprint that will have the highest mitigation efficacy and accuracy, i.e. to try and surgically match against attack traffic without impacting legitimate traffic.
Diagram of Cloudflare’s DDoS Protection systems
We count the various packet samples that match each fingerprint permutation, and using a data streaming algorithm, we bubble up the fingerprint with the most hits. When activation thresholds are exceeded, to avoid false positives, a mitigation rule using the fingerprint syntax is compiled as an eBPF program to drop packets that match the attack pattern. Once the attack ends, the rule times out and is automatically removed.
As we mentioned, each server detects and mitigates attacks fully autonomously — making our network highly efficient, resilient, and fast at blocking attacks. In addition, each server gossips (multicasts) the top fingerprint permutations within a data center, and globally. This sharing of real-time threat intelligence helps improve the mitigation efficacy within a data center and globally.
Our systems successfully blocked this record-breaking 7.3 Tbps DDoS attack fully autonomously without requiring any human intervention, without triggering any alerts, and without causing any incidents. This demonstrates the effectiveness of our world-leading DDoS protection systems. We built this system as part of our mission to help build a better Internet committed to provide free unmetered DDoS protection.
Self-Driving Car Video Footage
Post Syndicated from Bruce Schneier original https://www.schneier.com/blog/archives/2025/06/self-driving-car-video-footage.html
Two articles crossed my path recently. First, a discussion of all the video Waymo has from outside its cars: in this case related to the LA protests. Second, a discussion of all the video Tesla has from inside its cars.
Lots of things are collecting lots of video of lots of other things. How and under what rules that video is used and reused will be a continuing source of debate.
Change Your Personality
Post Syndicated from The Atlantic original https://www.youtube.com/watch?v=ghVYSFAVJ84
Ужасите в поредните „домове“ пак ни изненадаха
Post Syndicated from Светла Енчева original https://www.toest.bg/uzhasite-v-porednite-domove-pak-ni-iznenadaha/

„Първият сняг пак ни изненада“, гласи ироничното клише. Макар по нашите климатични ширини да е нормално през зимата да завали сняг, всяка година някоя институция не е готова за появата му и много се изненадва.
По аналогичен начин стоят нещата и с т.нар. домове в България, или резидентната грижа, какъвто е административният неологизъм за този вид места – все едно дали са хосписи, за възрастни хора, за деца, за възрастни с физически или умствени увреждания, за хора с деменция и т.н. Година след година излизат данни за нечовешки условия, унизително отношение и много смъртни случаи. И всеки път ужасно се изненадваме и възмущаваме… за да забравим след някоя и друга седмица. До следващия подобен случай.
„Изненадата“ с незаконните старчески домове
Така правосъдният министър Георги Георгиев беше много изненадан, след като открил в какви нечовешки условия живеят и умират над 70 обитатели на незаконен старчески дом в старозагорското село Ягода. Отвратителна хигиена, липса на медицинска помощ, принудително откъсване от външния свят чрез отнемане на телефоните и личните документи, връзване, заключване, упояване, локви кръв… Мястото се сдоби с прозвището „дом на ужасите“.
След този случай държавата взе на прицел домовете за възрастни без лиценз и се зае да спасява обитателите им, като ги извежда от тях. Няколко дни по-късно във Варненска област бяха открити още три подобни институции с общо 130 „потребители“. Същевременно излязоха данни и за такъв „дом“ в Говедарци.
Техники за обществено разсейване от истинските проблеми
Водещото послание по отношение на „домовете на ужасите“ са, че те са незаконни. Създава се впечатлението, че след извеждането на обитателите им от тях всичко ще се оправи. Хвърля се вина върху близките на възрастните хора, че не са проявили достатъчно интерес дали съответният старчески дом има лиценз и какви са условията в него. По този начин институциите бягат от отговорност и се „замитат“ редица проблеми:
- Като се сочат с пръст незаконните домове, обществото остава с впечатлението, че в законните всичко ще да е наред. А това не е вярно.
- Ако един старчески дом съществува от години, намира се в населено място, има си уебсайт, посещава се от лекар (дори само за да издава съобщенията за смърт на починалите обитатели), няма как никоя институция да не е разбрала за него. По-скоро става въпрос за затваряне на очите.
- Като се изведат обитателите, къде ще отидат? В държавните институции за резидентна грижа няма място, а частните са непосилно скъпи. Близките на възрастните хора може да нямат възможност да се грижат сами за тях, защото работят, с крехко здраве са, живеят в чужбина и т.н. А някои нямат близки, продали са жилището си, подведени от фалшиви реклами, че в дома условията са прекрасни, ще се грижат добре за тях – и остават бездомни.
- Как един средностатистически човек да се ориентира коя резидентна грижа има актуален лиценз и коя – не? Къде може да намери достъпна информация по темата? Експеримент на „Дневник“ констатира, че регистърът на социалните услуги на сайта на Агенцията за социално подпомагане, който е удобен за използване, не е обновяван от 2020 г. Актуалният регистър е на страницата на Агенцията за качество на социалните услуги заедно със списък на санкционираните домове без лиценз. Тези документи обаче са във вид на екселски таблици, които трябва да се свалят на компютър. Те „изискват допълнителна квалификация за работа с таблици, както и познаване на терминологията на социалните служби“, пише „Дневник“. Още едно затруднение – в таблиците фигурират не имената на самите домове, а на търговските дружества, получили или неполучили лиценз, и се изискват допълнителни усилия да се разбере кое дружество кой дом притежава. Експериментът показва също, че не може да се получи информация по телефона.
Кратко опресняване на паметта
При търсене на определение за резидентна грижа изкуственият интелект услужливо предлага следното:
Резидентна грижа (resident care) означава услуга, при която се предоставя местожителство и денонощни грижи за хора, нуждаещи се от подкрепа, например деца, младежи, възрастни хора или лица с увреждания. Целта е да се осигури безопасна и подкрепяща среда, близка до семейната, в която резидентите получават необходимата индивидуализирана грижа, психологическа подкрепа и подпомагане в развитието на умения за самостоятелен живот.
Това описание по-скоро отговаря на въпроса каква би трябвало да бъде въпросната социална услуга. В България обаче тя често повече прилича на концлагер. Според социолога Венелин Стойчев това се дължи на наследството на социализма, който превръща обществото в „извратена казарма“. А хората, които не отговарят на стандартите поради болест, увреждане и т.н., се държат далеч от погледа на „нормалните“.
Няколко примера за законна „грижа“ и за реакциите на институциите
За нечовешкото отношение към обитатели на домове у нас се вдигна шум през 2007 г., когато излезе филмът на журналистката от BBC Кейт Блюет за дома за деца с увреждания в Могилино „Изоставените деца на България“. Каква беше тогава реакцията на институциите? Социалната министърка Емилия Масларова каза, че тези деца „толкова си могат“. Тоест, щом са с увреждания, това, което могат, е да живеят в нечовешки условия и да умират от недохранване и занемаряване. А президентът Георги Първанов заяви, че филмът на BBC „не е направен с любов към България и е щрих от антибългарска кампания“, макар да не отрече, че в него „има неща, които ние си ги знаем не по-зле“.
Дванайсет години по-късно Блюет снима нов филм, в който проследява как се е развил животът на оцелелите деца от дома в „Могилино“, междувременно затворен през 2009 г. Журналистката стига до извода, че вече порасналите деца продължават да живеят в „центрове от семеен тип“, чиято основна разлика със старите домове е, че са по-малки. Иначе нивото на хуманност и грижи в тях или липсата им зависи не от налагането на стандарти, а от личността на управляващите съответния дом.
Междувременно отношението към хората с увреждания става тема на три филма на Миролюба Бенатова, за които не се вдига такъв шум, колкото за „Изоставените деца на България“. Може би защото са на български език.
А помните ли държавния дом за хора с деменция край Горско Косово, в който за една година починаха близо половината обитатели – в резултат на занемаряване и ужасни условия? Според директорката му обаче хората в него си умират от само себе си, а не защото за тях не се полагат грижи.
В психиатриите не е много по-различно. В продължение на година двама пациенти в психиатрични клиники във Варна и Ловеч загинаха при пожар, след като са били затворени в изолатор и никой не им се е притекъл на помощ. Освен че е бил заключен в т.нар. мека стая (т.е. в изолатора), мъжът от Ловеч е бил и вързан на леглото. Защо? За наказание – защото не се е държал по правилния според персонала начин.
Това са само няколко от многото случаи на нечовешко и унизително отношение към хора в домове, хосписи или психиатрии.
Защо се случват такива неща и защо все ги забравяме?
В България работата в областта на социалните услуги е зле платена, поради което упражняващите я са малко. Няма и практика да се изисква прилагането на определени стандарти в отношението към потребителите им. Не става дума само те да са измити, облечени и нахранени (въпреки че понякога дори това не се прави), а да се зачита свободната им воля, да се поощрява самостоятелността им, да им се осигурява подходящ социален живот, дори да им се казва „моля“ и „благодаря“. Какво остава да им се говори на Вие.
Материалните условия също са въпрос не просто на финанси, а и на отношение. Ако например се допуска, че на 60 души са им достатъчни една-две бани и тоалетни, че клиентите на резидентната грижа нямат нужда от спално бельо и не е проблем да им се слагат използвани памперси, това говори за липса не толкова на пари, колкото на хуманност. Защото ако няма средства да се отговори дори на най-елементарните човешки потребности, по-добре въпросната услуга изобщо да не се предлага.
При липса на стандарти, за чието прилагане да се следи, персоналът на домове и психиатрии действа според собствените си разбирания. Ако има положителни примери, те се дължат на ръководството и на екипа.
Не че работещите на такива места (или поне повечето от тях) са лоши хора – такъв им е хоризонтът. Както казва една от респондентките в изследване по темата за сексуалността на жените с увреждания, „все едно им е дали се грижат за наранена сърничка, или за човек с увреждане“.
Друга особеност е култът към дисциплината.
Френският социален мислител Мишел Фуко определя болниците, „лудниците“ (както се наричаха до неотдавна) и затворите като дисциплинарни институции. От училището, през психиатрията, та до болницата – в България дълбоки корени е пуснало „казарменото“ (по Венелин Стойчев) разбиране за изключителната важност на дисциплината.
Дисциплината се изразява в пасивно подчинение. А който не се държи по съответния начин, бива наказван. Затова пациенти и потребители на социални услуги биват връзвани, заключвани и упоявани. Понякога и бити.
Не на последно място, такива неща се случват заради отношението на обществото.
А то също е свързано с остарелите практики хората, които с нещо са различни от общоприетото и/или не могат да се грижат сами за себе си, да се скриват от обществения поглед. И да не искаме да знаем за тях. Поради това и толкова бързо забравяме. А като научим за поредния „дом на ужасите“, искрено се изненадваме.
Затова и има протести срещу изграждането на домове за хора с увреждания, особено с умствени – било във Варна, в бургаското село Желязово или другаде. Самото присъствие на такива хора се схваща като опасност за „нормалното“ население. Друг въпрос е, че страховете на местните нерядко се експлоатират политически, какъвто е случаят във Варна.
А как би могло да бъде
Най-добре би било, ако всички работещи в социалните услуги за резидентна грижа възприемат потребителите им като личности с човешко достойнство и се държат с тях по съответния начин. Това обаче трудно ще стане, докато липсва както политическа воля, така и потребност от страна на обществото. Въпреки че на членовете на същото това общество им се налага понякога да опрат до въпросните „услуги“.
Един от основните проблеми всъщност е, че потребителите на социални услуги се схващат като обекти на грижа, не като субекти, които могат сами да решават какво да се случва с тях, поне в известна степен. Това обаче предполага друг тип общество и друго равнище на социална солидарност и доверие между хората.
В Германия например са широко разпространени т.нар. жилищни проекти (Wohnprojekte).
Те представляват различни форми на организация на съжителство между хора според конкретни принципи. Този принцип може да е, примерно, взаимопомощ и общуване между представителите на различни поколения. В една кооперация пенсионерите да се грижат за децата на работещите, а родителите да пазаруват на трудноподвижните възрастни хора. Друг жилищен проект може да е за хора с увреждания, които разполагат с професионална подкрепа, организират социалния си живот и са полезни с работата си на жителите на квартала. Има жилищни проекти за какви ли не групи – за възрастни, за ЛГБТИ хора или просто за такива, за които общуването е важно.
Често архитектурата на жилищните проекти е свързана с целта им. Например ако целта е общуването, може да се предвидят повече общи пространства, а индивидуални да останат само спалните. Ако проектът е за възрастни или за хора с увреждания, жилищата са подходящи за инвалидни колички.
Понеже актуалният скандал е за старчески домове,
да си представим, че група възрастни хора в България решат да се самоорганизират.
Те продават жилищата си, но вместо да дадат парите на дом срещу съмнителна „грижа“, ги инвестират в сграда с едностайни и двустайни апартаменти, достъпни за хора с увреждания. Сами наемат персонал, за предпочитане все още работоспособни пенсионери от собствената им група, медицински сестри и пр. Организират се кой кога да готви, чисти или пазарува, оказват подкрепа на по-безпомощните. Ако някой апартамент се освободи, приемат нови членове.
Разбира се, този вариант не е универсален – не всички, които се нуждаят от резидентна грижа, могат да я вземат в свои ръце. Но е опит за излизане от калъпа на възприемането на хората, които имат нужда от подкрепа, като безпомощни пасивни обекти.
На този етап идеята все още звучи утопично, защото българското общество не е като германското. Тук хората са по-изолирани, по-рядко си имат доверие, по-трудно се самоорганизират, свикнали са да разчитат на държавата и институциите дори когато те не се справят.
От друга страна, в България вече има подобни прецеденти на самоорганизация. Липсата на места в детски градини вдъхнови създаването на т.нар. родителски кооперативи, в които децата се възпитават, обучават и за тях се полагат грижи според разбиранията – и с участието – на родителите им. Родителските кооперативи също не са универсално решение, но са алтернативна форма за отглеждане на малки деца.
Може би когато създателите на родителските кооперативи се пенсионират, ще започнат да възникват и жилищни проекти за възрастни хора. Въпросът обаче е колко дълго ще продължават циклите на изненадано възмущение от нечовешкото отношение в този или онзи дом и бързото забравяне… До следващата изненада и следващото забравяне.
How to give your students structure as they learn programming skills
Post Syndicated from Jan Ander original https://www.raspberrypi.org/blog/how-to-give-your-students-structure-as-they-learn-programming-skills/
Creating a computer program involves many different skills — knowing how to code is just one part. When we teach programming to young people, we want to guide them to learn these skills in a structured way. The ‘levels of abstraction’ framework is a great tool for doing that. This blog describes how using the framework will benefit you and your learners in the computing classroom.

We’re also excited to share our new Pedagogy Quick Read, which you can download for free to:
- Find practical tips for using the ‘levels of abstraction’ framework with your learners
- Read a summary of the research behind the framework
Learning to program: Everything at once?
Creating a program from the ground up can be daunting, especially for new learners. Without support, they’ll likely get stuck sooner or later; programs rarely work the first time round. And the more complex the problem that a program is addressing, the more likely it is that the first version of the program won’t work.

One reason that learning to program can be challenging is that it involves understanding a lot of specific concepts and applying many varied skills. From early on in their learning journey, young people need to have a firm grasp of concepts such as repetition, selection, variables, and functions. Also fundamental to learning to program well is the skill of abstraction: understanding a task and identifying which details are relevant and which can be ignored.
To get to grips with all these different concepts and skills, young people need structure — otherwise they’ll try to hold everything in their head at once, and likely feel overwhelmed by the cognitive load. This sort of experience may cause them to disengage instead of persisting. They may even decide that programming is not for them.
In light of these challenges, the ‘levels of abstraction’ framework is a great tool for teaching.
The benefits of the ‘levels of abstraction’ framework
The framework breaks programming down into four levels, each focusing on a different aspect of creating a program:
- Problem: Analysing the problem or task the program should address, to understand and record the requirements.
- Design: Turning the analysis into an algorithm — a set of steps for the computer to follow to create the desired output. This can involve flowcharts or storyboards, but importantly no code.
- Code: Developing the code based on the design (and building the physical components if any are involved).
- Running the code: Testing the code, checking outputs, and debugging where necessary.
Throughout the processes of developing a program, learners (and professional programmers) move between these levels as they implement their designs and debug them, sometimes even returning to the problem level if more analysis or clarification is needed.

Potential benefits of the ‘levels of abstraction’ framework for teachers:
- It helps you break down the activity of programming into discrete parts.
- It helps you engage your learners, as you can show them that programming involves more than knowing how to code.
- If your learners get stuck with their programming, the framework can help you guide them to a solution.
Potential benefits for learners:
- The framework will help them think through all the steps needed to create a program that works, and practise their problem-solving skills and analytical thinking.
- They will more readily see how programming connects to their world — at the problem level — and find aspects of programming where they have strengths and can use their creativity.
- They will gain a stronger idea of how software is built in the tech sector.
Our new Quick Read shares tips on how to best use the framework in your teaching.
Things to aim for when using the framework with your learners:
- Be aware of what level they are working at and when it’s time to switch to a different one.
- Understand that, when they encounter an issue with their program, they can step back and use the framework to figure out where the issue comes from. The issue might be a bug in the code, the algorithm not working as intended, or a description of the problem not taking into account something important.
We hope you find the framework useful. If you have ideas for how to use it in your teaching, why not share them in the comments?
Teaching programming: The wider context
When following the ‘levels of abstraction’ approach, learners need to explain how programs work and debug them. That means program comprehension is a key skill here. You may have already helped your learners to develop and practise this skill, for example with the PRIMM approach. The Block Model is another useful tool for helping your learners talk about various aspects of a program. And if you use the pair programming approach in programming activities, your learners can improve their program comprehension by talking about their code with each other. On our website, you’ll find more guidance on the best ways to teach programming and computing.

And what about generative artificial intelligence (AI) tools for programmers? In the age of AI, we think young people still need to learn to code because it empowers them to navigate and think critically about all digital technologies, including AI. And while generative AI tools can help a skilled programmer create quality code more quickly, more research is needed to show whether such tools help school-age young people build their understanding as they learn to code. You can see some of the great work being done in this area if you catch up with our 2024 research seminar series.
The ‘levels of abstraction’ framework is useful in your teaching no matter what tools young people use to create programs. Even with an AI tool, they will still need to work at all four levels of abstraction to program effectively.
The post How to give your students structure as they learn programming skills appeared first on Raspberry Pi Foundation.