Worker 앱을 구축하는 개발자는 필요한 인프라에 대해 걱정하지 않고 구축 중인 앱에만 집중하고 Cloudflare 네트워크의 이점을 활용할 수 있습니다. 개인 프로젝트부터 비즈니스 크리티컬 워크로드에 이르기까지 많은 앱에는 영구적인 데이터가 필요합니다. Workers는 키-값 및 개체 스토리지와 같이 개발자의 필요에 맞는 다양한 데이터베이스 및 스토리지 옵션을 제공합니다.
오늘날 많은 앱은 관계형 데이터베이스를 기반으로 구축됩니다. 이제 모든 사용자는 Cloudflare의 관계형 데이터베이스를 보완하는 D1을 이용할 수 있습니다. 2022년 말 알파 버전에서 2024년 4월 정식 출시(GA) 버전에 이르는 여정은 개발자가 관계형 데이터와 SQL에 익숙한 상태에서 프로덕션 워크로드를 구축할 수 있도록 하는 데 중점을 두었습니다.
D1이란 무엇인가요?
D1은 Cloudflare의 기본 제공 서버리스 관계형 데이터베이스입니다. Worker 앱의 경우, D1은 SQLite의 SQL 방언을 사용하는 SQL의 표현성과 Drizzle ORM과 같은 객체-관계 매퍼(ORM)를 비롯한 개발자 도구 통합을 제공합니다. D1은 Workers 또는 HTTP API를 통해 액세스할 수 있습니다.
서버리스는 프로비저닝이 필요 없고 Time Travel을 통한 기본적인 재해 복구와 사용량 기반 요금제를 의미합니다. D1에는 개발자가 프로덕션으로 전환하기 전에 D1을 실험해 볼 수 있는 넉넉한 무료 티어가 포함되어 있습니다.
데이터를 글로벌화하는 방법은 무엇일까요?
D1 GA는 안정성과 개발자 경험의 만족도를 높이는 데 주력해 왔습니다. 이제 Cloudflare는 전 세계에 분산되어 있는 앱에 더 나은 지원을 제공하기 위해 D1을 확장할 계획입니다.
Workers 모델에서 요청이 수신되면 가장 가까운 데이터 센터에서 서버리스 실행을 호출합니다. Worker 앱은 사용자 요청에 따라 전 세계적으로 확장할 수 있습니다. 그러나 앱 데이터는 중앙 집중식 데이터베이스에 저장되며, 글로벌 사용자 트래픽은 데이터 위치에 액세스하기 위해 왕복해야 합니다. 예를 들어, 오늘날 D1 데이터베이스는 단일 위치에 있습니다.
Workers는 자주 액세스하는 데이터 위치를 고려하기 위해 Smart Placement를 지원합니다. Smart Placement는 데이터베이스와 같은 중앙 집중식 백엔드 서비스에 더 가까운 곳에 있는 Worker를 호출하여 대기 시간을 줄이고 앱 성능을 개선합니다. Cloudflare는 글로벌 앱에서 Worker 배치를 다뤘지만, 데이터 배치 문제도 처리해야 합니다.
그렇다면 Cloudflare의 기본 제공 데이터베이스 솔루션인 D1이 어떻게 글로벌 앱의 데이터 배치를 더욱 효과적으로 지원할 수 있을까요? 해답은 비동기 읽기 복제에 있습니다.
비동기 읽기 복제란 무엇인가요?
Postgres, MySQL, SQL Server 또는 Oracle과 같은 데이터베이스에는 읽기복제본이라는 서버 유형이 있습니다. 이 서버는 거의 최신 상태의 읽기 전용 사본 역할을 하는 별도의 기본 데이터베이스 서버입니다. 관리자는 주 서버의 스냅샷에서 새 서버를 시작하고 주 서버가 복제본 서버에 업데이트를 비동기적으로 전송하도록 구성하여 읽기 복제본을 만듭니다. 업데이트가 비동기적으로 이루어지기 때문에 읽기 복제본은 주 서버의 현재 상태보다 늦어질 수 있습니다. 기본 서버와 복제본 서버 사이의 이러한 지연을 복제본지연이라고 하며, 읽기 복제본을 두 개 이상 보유할 수 있습니다.
비동기 읽기 복제는 데이터베이스 성능을 개선하기 위해 긴 시간 동안 검증된 솔루션입니다.
여러 복제본에 부하를 분산하여 처리량을 늘릴 수 있습니다.
복제본이 쿼리를 수행하는 사용자와 가까운 곳에 있으면 쿼리 대기 시간을 줄일 수 있습니다.
일부 데이터베이스 시스템은 동기 복제 기능도 제공합니다. 동기 복제 시스템에서는 모든 복제본이 쓰기를 확인할 때까지 기다려야 합니다. 동기 복제 시스템은 가장 느린 복제본과 같은 속도로 실행될 수 있으며 복제본에 장애가 발생하면 작업이 중단될 수 있습니다. 따라서 글로벌 규모로 성능을 개선하고 싶다면 동기 복제 사용을 최소화하는 것이 좋습니다!
읽기 복제본은 독립적으로 업데이트되기 때문에 각 복제본의 내용은 언제든지 달라질 수 있습니다. 주 복제본이든 읽기 복제본이든 모든 쿼리가 동일한 서버로 전송되는 경우 기본 데이터베이스가 지원하는 일관성 모델에 따라 결과가 일관성 있게 유지되어야 합니다. 읽기 복제본을 사용하는 경우 결과는 다소 오래된 것일 수도 있습니다.
읽기 복제본이 있는 서버 기반 데이터베이스를 사용할 때는 세션 내의 모든 쿼리에 동일한 서버를 일관되게 사용하는 것이 중요합니다. 동일한 세션 내에서 서로 다른 읽기 복제본으로 전환하게 되면 앱에서 설정된 일관성 모델이 손상될 수 있습니다. 이로 인해 데이터베이스 작동 방식에 대한 가정을 위반하여 앱에서 잘못된 결과가 반환될 수도 있습니다!
예시 A와 B라는 두 개의 복제본이 있다고 가정해 보겠습니다. 복제본 A는 기본 데이터베이스보다 100밀리초가, 복제본 B는 2초 지연됩니다. 사용자가 다음과 같은 상황을 원한다고 가정해 보겠습니다.
쿼리 1 실행
1a. 쿼리 1 결과를 기반으로 일부 계산
(1a)의 계산 결과를 기반으로 쿼리 2 실행
시간 t=10초가 되면 쿼리 1이 복제본 A로 이동하여 반환됩니다. 쿼리 1은 t=9.9초에서 기본 데이터베이스의 상태를 반영합니다. 계산을 처리하는 데 500밀리초가 걸린다고 가정하면, t=10.5초에서 쿼리 2가 복제본 B로 전송됩니다. 복제본 B는 기본 데이터베이스보다 2초 지연되므로, t=10.5초가 되면 쿼리 2는 t=8.5초의 데이터베이스 상태를 반영합니다. 앱의 관점에서 보면 쿼리 2의 결과는 마치 데이터베이스가 시간을 거슬러 올라간 것처럼 보입니다!
공식적으로 쿼리는 커밋된 데이터만 확인하기 때문에 이를 읽기 커밋된 일관성(read committed consistency)이라고 합니다. 그러나 다른 보장은 없으며, 심지어 사용자가 직접 작성한 데이터를 읽을 수도 없습니다. 읽기 커밋은 유효한 일관성 모델이지만, 읽기 커밋 모델이 허용하는 모든 잠재적 경쟁 조건을 추론하기는 어렵기 때문에 앱을 올바르게 작성하기 어렵습니다.
스냅샷 격리는 대부분의 개발자가 잘 알고 있으면서 쉽게 사용할 수 있는 일관성 모델입니다. Cloudflare는 D1 데이터베이스의 활성 복제본을 최대 하나로 유지하고 모든 HTTP 요청을 해당 단일 데이터베이스로 라우팅하는 방식으로 이 모델을 D1에 구현했습니다. D1 데이터베이스의 활성 복제본이 하나만 있도록 하는 것은 분산 시스템에서 복잡한 문제를 야기하지만, Cloudflare는 Durable Objects를 사용하여 D1을 구축함으로써 이 문제를 성공적으로 해결했습니다. Durable Objects는 전 세계적인 유일성을 보장하기 때문에 Cloudflare가 Durable Objects를 사용하게 되면, HTTP 요청을 D1 Durable Objects로 전송함으로써 쉽게 라우팅할 수 있습니다.
이 방법은 데이터베이스의 활성 복제본이 여러 개 있는 경우에는 효과가 없습니다. 이러한 경우, 수신되는 일반 HTTP 요청을 매번 동일한 복제본으로 일관되게 라우팅하는 100% 신뢰할 수 있는 방법이 없기 때문입니다. 이전 섹션의 예시에서 살펴본 것처럼, 관련 요청을 100% 동일한 복제본으로 라우팅하지 못하면 Cloudflare가 제공할 수 있는 최상의 일관성 모델은 읽기 커밋이 되는 결과를 초래합니다.
특정 복제본으로 일관되게 라우팅할 수 없는 경우, 또 다른 접근 방식은 요청을 임의의 복제본으로 라우팅하고 선택한 복제본이 프로그래머에게 ‘논리적인’ 일관성 모델에 따라 요청에 응답하도록 하는 것입니다. Cloudflare가 요청에 램포트 타임스탬프를 포함하면 어떤 복제본을 사용하든 ‘순차적 일관성’을 구현할 수 있습니다. 순차적 일관성 모델에는 ‘내가 쓴 것 읽기’, ‘읽기 작업 이후에 쓰기’와 같은 중요한 속성과 전체 쓰기 순서라는 속성이 있습니다. 전체 쓰기 순서는 모든 복제본이 동일한 순서로 트랜잭션이 커밋되는 것을 목격한다는 의미이며, 이는 Cloudflare가 트랜잭션 시스템에서 원하는 것과 정확히 일치합니다. 순차적 일관성에는 시스템의 개별 엔터티가 임의로 최신 상태가 아닐 수 있기에 주의해야 하지만, Cloudflare가 API를 설계할 때 복제본 지연을 고려할 수 있다는 점에서 이점이 되기도 합니다.
D1이 모든 데이터베이스 쿼리마다 앱에 램포트 타임스탬프를 제공하고 해당 앱이 마지막으로 확인한 램포트 타임스탬프를 D1에 알리면, Cloudflare는 각 복제본이 순차적 일관성 모델에 따라 쿼리의 작동 방식을 결정하도록 할 수 있다는 아이디어입니다.
복제본의 순차적 일관성을 달성하는 간단하면서도 효과적인 방법은 다음과 같습니다.
데이터베이스에 대한 모든 단일 요청에 램포트 타임스탬프를 할당합니다. 이 경우 값이 감소하기보다는 항상 단조적으로 증가하는(monotonically) 커밋 토큰이 원활하게 작동합니다.
전체 쓰기 작업 순서를 유지하려면 모든 쓰기 쿼리를 메인 데이터베이스로 전송합니다.
모든 복제본에 읽기 쿼리를 전송하되, 복제본이 쿼리의 램포트 타임스탬프 이후에 발생한 기본 데이터베이스의 업데이트를 받을 때까지 쿼리 서비스를 지연해야 합니다.
이 구현의 장점은 특히 읽기 중심 워크로드를 동일한 복제본으로 일관되게 전송하는 일반적인 경우에 속도가 빠르며, 다른 복제본으로 라우팅하는 요청도 처리할 수 있다는 점입니다.
미리 보기: 세션을 통해 D1에 읽기 복제 지원하기
D1에 읽기 복제를 도입하기 위해 세션이라는 새로운 개념을 통해 D1 API를 확장할 예정입니다. 세션은 앱의 단일 논리적 세션에 속하는 모든 쿼리를 캡슐화하는 역할을 합니다. 예를 들어, 세션은 특정 웹 브라우저나 모바일 앱에서 발생하는 모든 요청을 나타낼 수 있습니다. 세션을 사용하는 경우 쿼리에서는 기본 데이터베이스나 가까운 복제본 중 요청에 가장 적합한 D1 데이터베이스 복제본이 사용됩니다. D1의 세션 구현은 세션 내의 모든 쿼리에 대해 순차적 일관성을 보장합니다.
세션 API는 D1의 일관성 모델을 변경하므로 개발자는 새로운 API를 사용하도록 옵트인해야 합니다. 기존 D1 API 메서드는 동일하게 유지되며 이전과 동일한 스냅샷 격리 일관성 모델을 계속 사용할 수 있습니다. 그러나 신규 세션 API를 사용하여 만든 쿼리만 복제본을 사용합니다.
다음은 D1 세션 API의 예시입니다.
export default {
  async fetch(request: Request, env: Env) {
    // When we create a D1 Session, we can continue where we left off
    // from a previous Session if we have that Session's last commit
    // token.  This Worker will return the commit token back to the
    // browser, so that it can send it back on the next request to
    // continue the Session.
    //
    // If we don't have a commit token, make the first query in this
    // session an "unconditional" query that will use the state of the
    // database at whatever replica we land on.
    const token = request.headers.get('x-d1-token') ?? 'first-unconditional'
    const session = env.DB.withSession(token)


    // Use this Session for all our Workers' routes.
    const response = await handleRequest(request, session)


    if (response.status === 200) {
      // Set the token so we can continue the Session in another request.
      response.headers.set('x-d1-token', session.latestCommitToken)
    }
    return response
  }
}


async function handleRequest(request: Request, session: D1DatabaseSession) {
  const { pathname } = new URL(request.url)


  if (pathname === '/api/orders/list') {
    // This statement is a read query, so it will execute on any
    // replica that has a commit equal or later than `token` we used
    // to create the Session.
    const { results } = await session.prepare('SELECT * FROM Orders').all()


    return Response.json(results)
  } else if (pathname === '/api/orders/add') {
    const order = await request.json<Order>()


    // This statement is a write query, so D1 will send the query to
    // the primary, which always has the latest commit token.
    await session
      .prepare('INSERT INTO Orders VALUES (?, ?, ?)')
      .bind(order.orderName, order.customer, order.value)
      .run()


    // In order for the application to be correct, this SELECT
    // statement must see the results of the INSERT statement above.
    // The Session API keeps track of commit tokens for queries
    // within the session and will ensure that we won't execute this
    // query until whatever replica we're using has seen the results
    // of the INSERT.
    const { results } = await session
      .prepare('SELECT COUNT(*) FROM Orders')
      .all()


    return Response.json(results)
  }


  return new Response('Not found', { status: 404 })
}
D1은 세션 구현 시 커밋 토큰을 사용합니다. 커밋 토큰은 데이터베이스에 커밋된 특정 쿼리를 식별합니다. 세션 내에서 D1은 커밋 토큰을 사용하여 쿼리가 올바른 순서로 정렬되도록 보장합니다. 위 예시에서, Cloudflare가 대기 기간 동안 복제본을 전환하더라도 D1 세션은 신규 순서의 “INSERT” 이후에 “SELECT COUNT(*)” 쿼리가 실행되도록 합니다.
Workers 가져오기 핸들러에서 세션을 시작하는 방법에는 몇 가지 옵션이 있습니다. db.withSession(<condition>) 을 사용하면 다음과 같은 인수를 사용할 수 있습니다.
condition 인수
동작
<commit_token>
(1) 주어진 커밋 토큰으로 세션 시작
(2) 후속 쿼리가 순차적으로 일관성이 있는 경우
first-unconditional
(1) 첫 번째 쿼리가 읽기인 경우, 현재 복제본이 무엇이든 해당 쿼리를 읽고 해당 읽기의 커밋 토큰을 후속 쿼리의 기준으로 사용합니다. 첫 번째 쿼리가 쓰기인 경우, 쿼리를 기본으로 전달하고 쓰기의 커밋 토큰을 후속 쿼리의 기준으로 사용합니다.
(2) 후속 쿼리가 순차적으로 일관성이 있는 경우
first-primary
(1) 기본 쿼리(읽기 또는 쓰기)에 대해 첫 번째 쿼리 실행
(2) 후속 쿼리가 순차적으로 일관성이 있는 경우
null 또는 누락된 인수
first-unconditional 처럼 취급
세션의 마지막 쿼리에서 커밋 토큰을 ‘왕복(round-tripping)’하고 이를 사용하여 신규 세션을 시작하면 한 세션이 여러 요청에 걸쳐 있도록 할 수 있습니다. 이렇게 하면 웹 앱이나 모바일 앱과 같은 개별 사용자 에이전트가 사용자에게 일관된 순서로 쿼리를 표시할 수 있습니다.
D1의 읽기 복제는 추가 사용량이나 스토리지에 따른 비용 없이 기본으로 제공되며 복제본 구성이 필요하지 않습니다. Cloudflare는 앱의 D1 트래픽을 모니터링하고 데이터베이스 복제본을 자동으로 생성하여 사용자 트래픽을 사용자와 가까운 여러 서버로 분산합니다. Cloudflare의 서버리스 모델에 따라, D1 개발자는 복제본 프로비저닝 및 관리에 대해 걱정할 필요가 없습니다. 대신 개발자는 복제 및 데이터 일관성 절충안을 위한 앱 설계에 집중해야 합니다.
Cloudflare는 글로벌 읽기 복제 및 앞서 언급한 제안을 실현하기 위해 적극적으로 노력하고 있습니다(Cloudflare Developer Discord의 #d1 채널에서 피드백을 공유해 주세요). 그동안 D1 GA에는 몇 가지 흥미로운 새 기능이 추가될 예정입니다.
D1 GA 확인하기
2023년 10월 D1의 오픈 베타 이후, Cloudflare는 핵심 서비스에 필요한 안정성, 확장성, 개발자 경험에 집중해 왔습니다. 당사는 개발자가 D1으로 앱을 더 빠르게 빌드하고 디버깅할 수 있도록 몇 가지 새로운 기능에 투자했습니다.
더 큰 규모의 데이터베이스로 더 크게 구축하기 Cloudflare는 더 큰 데이터베이스가 필요하다는 개발자들의 의견에 귀를 기울였습니다. 그 결과, D1은 이제 최대 10GB 크기의 데이터베이스를 지원하며, Workers 유료 요금제에서는 사용자가 최대 50,000개의 데이터베이스를 보유할 수 있습니다. D1의 수평적 확장을 통해 앱은 각 비즈니스 엔터티의 데이터베이스 사용 사례를 모델링할 수 있습니다. 특히, 새로운 D1 데이터베이스는 베타 출시 이후 특정 기간 내에 D1 알파 데이터베이스에 비해 40배 더 많은 요청을 처리하는 것으로 나타났습니다.
가져오기 및 대용량 데이터 내보내기 개발자는 다음과 같은 여러 가지 이유로 데이터를 가져오거나 내보냅니다.
서로 다른 데이터베이스 시스템 간 데이터베이스 마이그레이션 테스트
로컬 개발 또는 테스트를 위한 데이터 복사
규정 준수와 같은 사용자 지정 요구 사항을 위한 수동 백업
이전에는 D1에 대해 SQL 파일을 실행할 수 있었습니다. 그러나 Cloudflare는 wrangler d1 execute –file=<filename> 을 개선하여 데이터베이스가 불완전한 상태로 남지 않도록 보장하고 있습니다. 또한 원격 프로덕션 데이터베이스를 보호하기 위해 이제 wrangler d1 execute 가 로컬 우선으로 기본 설정됩니다.
npx wrangler d1 create northwind-traders

# omit --remote to run on a local database for development
npx wrangler d1 execute northwind-traders --remote --file=./schema.sql

npx wrangler d1 execute northwind-traders --remote --file=./data.sql
다음 방법을 통해 D1 데이터베이스 데이터 및 스키마, 스키마 전용 또는 데이터 전용을 SQL 파일로 내보낼 수 있습니다.
# database schema & data
npx wrangler d1 export northwind-traders --remote --output=./database.sql

# single table schema & data
npx wrangler d1 export northwind-traders --remote --table='Employee' --output=./table.sql

# database schema only
npx wrangler d1 export <database_name> --remote --output=./database-schema.sql --no-data=true
쿼리 성능 디버깅 SQL 쿼리 성능을 이해하고 느린 쿼리를 디버깅하는 것은 프로덕션 워크로드에서 매우 중요한 단계입니다. Cloudflare는 개발자가 GraphQL API를 통해서도 쿼리 성능 메트릭을 분석할 수 있도록 실험적인 `wrangler d1 insights`를 추가했습니다.
# To find top 10 queries by average execution time:
npx wrangler d1 insights <database_name> --sort-type=avg --sort-by=time --count=10
개발자 도구 D1은 다양한 커뮤니티 개발자 프로젝트의 지원을 받고 있습니다. 이제 버전 5.12.0에서는 Prisma ORM을 비롯한 새로운 기능이 추가되어 Workers와 D1을 지원합니다.
다음 단계
현재 글로벌 읽기 복제 설계와 함께 정식 출시(GA)를 통해 제공되는 기능은 개발자 앱의 SQL 데이터베이스 요구 사항을 충족하기 위한 시작에 불과합니다. 아직 D1을 사용해 보지 않으셨다면 지금 바로 시작하시거나, D1의 개발자 문서를 방문하여 아이디어를 얻거나, Cloudflare Developer Discord의 #d1 채널에 참여하여 다른 D1 개발자 및 당사의 제품 엔지니어링 팀과 이야기를 나눌 수 있습니다.
A common theme in early-days anti-Linux FUD was that, since anybody can
contribute to the code, it cannot be trusted. Over two decades later, one
rarely hears that line anymore; experience has shown that free-software
communities are not prone to shipping overtly hostile code. But, as the backdooring of XZ has reminded us, the
embedding of malicious code is, unfortunately, not limited to the
proprietary realm. Our community will be busy analyzing this incident for
some time to come, but clear conclusions may be hard to come by.
You can use Amazon Data Firehose to aggregate and deliver log events from your applications and services captured in Amazon CloudWatch Logs to your Amazon Simple Storage Service (Amazon S3) bucket and Splunk destinations, for use cases such as data analytics, security analysis, application troubleshooting etc. By default, CloudWatch Logs are delivered as gzip-compressed objects. You might want the data to be decompressed, or want logs to be delivered to Splunk, which requires decompressed data input, for application monitoring and auditing.
AWS released a feature to support decompression of CloudWatch Logs in Firehose. With this new feature, you can specify an option in Firehose to decompress CloudWatch Logs. You no longer have to perform additional processing using AWS Lambda or post-processing to get decompressed logs, and can deliver decompressed data to Splunk. Additionally, you can use optional Firehose features such as record format conversion to convert CloudWatch Logs to Parquet or ORC, and dynamic partitioning to automatically group streaming records based on keys in the data (for example, by month) and deliver the grouped records to corresponding Amazon S3 prefixes.
In this post, we look at how to enable the decompression feature for Splunk and Amazon S3 destinations. We start with Splunk and then Amazon S3 for new streams, then we address migration steps to take advantage of this feature and simplify your existing pipeline.
Decompress CloudWatch Logs for Splunk
You can use subscription filter in CloudWatch log groups to ingest data directly to Firehose or through Amazon Kinesis Data Streams.
Note: For the CloudWatch Logs decompression feature, you need a HTTP Event Collector (HEC) data input created in Splunk, with indexer acknowledgement enabled and the source type. This is required to map to the right source type for the decompressed logs. When creating the HEC input, include the source type mapping (for example, aws:cloudtrail).
To create a Firehose delivery stream for the decompression feature, complete the following steps:
Provide your destination settings and select Raw endpoint as endpoint type.
You can use a raw endpoint for the decompression feature to ingest both raw and JSON-formatted event data to Splunk. For example, VPC Flow Logs data is raw data, and AWS CloudTrail data is in JSON format.
Enter the HEC token for Authentication token.
To enable decompression feature, deselect Transform source records with AWS Lambda under Transform records.
Select Turn on decompression and Turn on message extraction for Decompress source records from Amazon CloudWatch Logs.
Select Turn on message extraction for the Splunk destination.
Message extraction feature
After decompression, CloudWatch Logs are in JSON format, as shown in the following figure. You can see the decompressed data has metadata information such as logGroup, logStream, and subscriptionFilters, and the actual data is included within the message field under logEvents (the following example shows an example of CloudTrail events in the CloudWatch Logs).
When you enable message extraction, Firehose will extract just the contents of the message fields and concatenate the contents with a new line between them, as shown in following figure. With the CloudWatch Logs metadata filtered out with this feature, Splunk will successfully parse the actual log data and map to the source type configured in HEC token.
Additionally, If you want to deliver these CloudWatch events to your Splunk destination in real time, you can use zero buffering, a new feature that was launched recently in Firehose. You can use this feature to set up 0 seconds as the buffer interval or any time interval between 0–60 seconds to deliver data to the Splunk destination in real time within seconds.
With these settings, you can now seamlessly ingest decompressed CloudWatch log data into Splunk using Firehose.
Decompress CloudWatch Logs for Amazon S3
The CloudWatch Logs decompression feature for an Amazon S3 destination works similar to Splunk, where you can turn off data transformation using Lambda and turn on the decompression and message extraction options. You can use the decompression feature to write the log data as a text file to the Amazon S3 destination or use with other Amazon S3 destination features like record format conversion using Parquet or ORC, or dynamic partitioning to partition the data.
Dynamic partitioning with decompression
For Amazon S3 destination, Firehose supports dynamic partitioning, which enables you to continuously partition streaming data by using keys within data, and then deliver the data grouped by these keys into corresponding Amazon S3 prefixes. This enables you to run high-performance, cost-efficient analytics on streaming data in Amazon S3 using services such as Amazon Athena, Amazon EMR, Amazon Redshift Spectrum, and Amazon QuickSight. Partitioning your data minimizes the amount of data scanned, optimizes performance, and reduces costs of your analytics queries on Amazon S3.
With the new decompression feature, you can perform dynamic partitioning without any Lambda function for mapping the partitioning keys on CloudWatch Logs. You can enable the Inline parsing for JSON option, scan the decompressed log data, and select the partitioning keys. The following screenshot shows an example where inline parsing is enabled for CloudTrail log data with a partitioning schema selected for account ID and AWS Region in the CloudTrail record.
Record format conversion with decompression
For CloudWatch Logs data, you can use the record format conversion feature on decompressed data for Amazon S3 destination. Firehose can convert the input data format from JSON to Apache Parquet or Apache ORC before storing the data in Amazon S3. Parquet and ORC are columnar data formats that save space and enable faster queries compared to row-oriented formats like JSON. You can use the features for record format conversion under the Transform and convert records settings to convert the CloudWatch log data to Parquet or ORC format. The following screenshot shows an example of record format conversion settings for Parquet format using an AWS Glue schema and table for CloudTrail log data. When the dynamic partitioning settings are configured, record format conversion works along with dynamic partitioning to create the files in the output format with a partition folder structure in the target S3 bucket.
Migrate existing delivery streams for decompression
If you want to migrate an existing Firehose stream that uses Lambda for decompression to this new decompression feature of Firehose, refer to the steps outlined in Enabling and disabling decompression.
Pricing
The Firehose decompression feature decompress the data and charges per GB of decompressed data. To understand decompression pricing, refer to Amazon Data Firehose pricing.
Clean up
To avoid incurring future charges, delete the resources you created in the following order:
Delete the CloudWatch Logs subscription filter.
Delete the Firehose delivery stream.
Delete the S3 buckets.
Conclusion
The decompression and message extraction feature of Firehose simplifies delivery of CloudWatch Logs to Amazon S3 and Splunk destinations without requiring any code development or additional processing. For an Amazon S3 destination, you can use Parquet or ORC conversion and dynamic partitioning capabilities on decompressed data.
For more information, refer to the following resources:
Ranjit Kalidasan is a Senior Solutions Architect with Amazon Web Services based in Boston, Massachusetts. He is a Partner Solutions Architect helping security ISV partners co-build and co-market solutions with AWS. He brings over 25 years of experience in information technology helping global customers implement complex solutions for security and analytics. You can connect with Ranjit on LinkedIn.
Phaneendra Vuliyaragoli is a Product Management Lead for Amazon Data Firehose at AWS. In this role, Phaneendra leads the product and go-to-market strategy for Amazon Data Firehose.
You probably wouldn’t buy a car without knowing its horsepower. The metric might not matter as much to you as things like fuel efficiency, safety, or spiffy good looks. It might not even matter at all, but it’s still something you want to know before driving off the lot.
Similarly, you probably wouldn’t buy cloud storage without knowing a little bit about how it performs. Whether you need the metaphorical Ferrari of cloud providers, the safety features of a Volvo, or the towing capacity of a semitruck, understanding how each performs can significantly impact your cloud storage decisions. And to understand cloud performance, you have to understand the difference between bandwidth and throughput.
In this blog, I’ll explain what bandwidth and throughput are and how they differ, as well as other key concepts like threading, multi-threading, and throttling—all of which can add more complexity and potential confusion to a cloud storage decision and the efficiency of data transfers.
Bandwidth, Throughput, and Latency: A Primer
Three critical components form the cornerstone of cloud performance: bandwidth, throughput, and latency. To easily understand their impact, imagine the flow of data to water moving through a pipe—an analogy that paints a visual picture of how data travels across a network.
Bandwidth: The diameter of the pipe represents bandwidth. It’s the maximum width that dictates how much water (data) can flow through it at any given time. In technical terms, bandwidth is the data transfer rate that a network connection can support. It’s usually measured in bits per second (bps). A wider pipe (higher bandwidth) means more data can flow, similar to having a multi-lane road where more vehicles can travel side by side.
Throughput: If bandwidth is the pipe’s width, then throughput is the rate at which water moves through the pipe successfully. In the context of data, throughput is the actual data transfer rate that is sent over a network. It is also measured in bits per second (bps). Various factors can affect throughput—such as network traffic, processing power, packet loss, etc. While bandwidth is the potential capacity, throughput is the reality of performance, which is often less than the theoretical maximum due to real-world constraints.
Latency: Now, consider the time it takes for water to start flowing from the pipe’s opening after the tap is turned on. That time delay can be considered as latency. It’s the time it takes for a packet of data to travel from the source to the destination. Latency is crucial in use cases where time is of the essence, and even a slight delay can be detrimental to the user experience.
Understanding how bandwidth, throughput, and latency are interrelated is vital for anyone relying on cloud storage services. Bandwidth sets the stage for potential performance, but it’s the throughput that delivers actual results. Meanwhile, latency is a measure of how long it takes data to be delivered to the end user in real time.
Threading and Multi-Threading in Cloud Storage
When we talk about moving data in the cloud, two concepts often come up: threading and multi-threading. These might sound very technical, but they’re actually pretty straightforward once broken down into simpler terms.
First of all, threads go by many different names. Different applications may refer to them as streams, concurrent threads, parallel threads, concurrent uploads, parallelism, etc. But what all these terms refer to when we’re discussing cloud storage is the process of uploading files. To understand threads, think of a big pipe with a bunch of garden hoses running through it. The garden hose is a single thread in our pipe analogy. The hose carries water (your data) from one point to another—say from your computer to the cloud or vice versa. In simple terms, it’s the pathway your data takes. Each hose represents an individual pathway through which data can move between a storage device and the network.
Cloud storage systems use sophisticated algorithms to manage and prioritize threads. This ensures that resources are allocated efficiently to optimize data flow. Threads can be prioritized based on various criteria such as the type of data being transferred, network conditions, and overall load on the system.
Multi-Threading
Now, imagine: instead of just one garden hose within a pipe, you have several in parallel to each other. This setup is multi-threading. It lets multiple streams of water (data) flow at the same time, significantly speeding up the entire process. In the context of cloud storage, multi-threading enables the simultaneous transfer of multiple data streams, significantly speeding up data upload and download.
Cloud storage takes advantage of multithreading. It can take pretty much as many threads as you can throw at it and its performance should scale accordingly. But it doesn’t do so automatically—because the effectiveness of multi-threading depends on the underlying network infrastructure and the ability of the software to efficiently manage multiple threads.
Chances are most devices can’t handle or take advantage of the maximum number of threads cloud storage can handle as it puts additional load on your network and device. Therefore, it often takes a trial-and-error approach to find the sweet spot to get optimal performance without severely affecting the usability of your device.
Managing Thread Count
Certain applications automatically manage threading and adjust the number of threads for optimal performance. When you’re using cloud storage with an integration like backup software or a network attached storage (NAS) device, the multi-threading setting is typically found in the integration’s settings.
Many backup tools, like Veeam, are already set to multi-thread by default. However, some applications might default to using a single thread unless manually configured otherwise.
That said, there are limitations associated with managing multiple threads. The gains from increasing the number of threads are limited by the bandwidth, processing power, and memory. Additionally, not all tasks are suitable for multi-threading; some processes need to be executed sequentially to maintain data integrity and dependencies between tasks.
In essence, threading is about creating a pathway for your data and multi-threading is about creating multiple pathways to move more data at the same time. This makes storing and accessing files in the cloud much faster and more efficient.
The Role of Throttling
Throttling is the deliberate slowing down of internet speed by service providers. In the pipe analogy, it’s similar to turning down the water flow from a faucet. Service providers use throttling to manage network traffic and prevent the system from becoming overloaded. By controlling the flow, they ensure that no single user or application monopolizes the bandwidth.
Why Do Cloud Service Providers Throttle?
The primary reason cloud service providers would throttle is to maintain an equitable distribution of network resources. During peak usage times, networks can become congested, much like roads during rush hour. Throttling helps manage these peak loads, ensuring all users have access to the network without significant drops in quality or service. It’s a balancing act, aiming to provide a steady, reliable service to as many users as possible.
Scenarios Where Throttling Can Be a Hindrance
While throttling aims to manage network traffic for fairness purposes, it can be frustrating in certain situations. For heavy data users, such as businesses that rely on real-time data access and media teams uploading and downloading large files, throttling can slow operations and impact productivity. Additionally, for services not directly causing any congestion, throttling can seem unnecessary and restrictive.
Do CSPs Have to Throttle?
As a quick plug, Backblaze does not throttle, so customers can take advantage of all their bandwidth while uploading to B2 Cloud Storage. Many other public cloud storage providers do throttle, although they certainly may not make it widely known. If you’re considering a cloud storage provider and your use case demands high throughput or fast transfer times, it’s smart to ask the question upfront.
Optimizing Cloud Storage Performance
Achieving optimal performance in cloud storage involves more than just selecting a service; it requires a clear understanding of how bandwidth, throughput, latency, threading, and throttling interact and affect data transfer. Tailoring these elements to your specific needs can significantly enhance your cloud storage experience.
Balancing bandwidth, throughput, and latency: The key to optimizing cloud performance lies in your use case. For real-time applications like video conferencing or gaming, low latency is crucial, whereas, for backup use cases, high throughput might be more important. Assessing the types of files you’re transferring and their size along with content delivery networks (CDN) can help in optimizing and achieving peak performance.
Effective use of threading and multi-threading: Utilizing multi-threading effectively means understanding when it can be beneficial and when it might lead to diminishing returns. For large file transfers, multi-threading can significantly reduce transfer times. However, for smaller files, the overhead of managing multiple threads might outweigh the benefits. Using tools that automatically adjust the number of threads based on file size and network conditions can offer the best of both worlds.
Navigating throttling for optimal performance: When selecting a cloud storage provider (CSP), it’s crucial to consider their throttling policies. Providers vary in how and when they throttle data transfer speeds, affecting performance. Understanding these policies upfront can help you choose a provider that aligns with your performance needs.
In essence, optimizing cloud storage performance is an ongoing process of adjustment and adaptation. By carefully considering your specific needs, experimenting with settings, and staying informed about your provider’s policies, you can maximize the efficiency and effectiveness of your cloud storage solutions.
Security updates have been issued by Fedora (kernel and webkitgtk), Mageia (unixODBC and w3m), and SUSE (libvirt, netty, netty-tcnative, and perl-DBD-SQLite).
Starting a career for the first time in a new country can be intimidating. For Rudina Tafhasaj, her path to Senior Application Engineer at Rapid7 was paved with both unique challenges, and incredible rewards.
Growing up, Rudina was inspired to get into technology by her older brother. “He loved computers, and he was always opening up our big PC. I was curious, and would sneak around to see what he was doing,” Rudina says. “As I grew more, I saw that advances in technology were helping improve lives in so many ways. I knew it was going to be a big part of the future, and wanted to be involved.”
But technology wasn’t her only passion at a young age.
“Deep down my dream and passion is to be an actress – which is totally different! As I grew more, what I realized was that I actually loved the creativity involved in acting, and having the opportunity to network and work with other people.” While there may not always be cameras rolling, Rudina feels there are often similarities between her love of acting and her role today. “I can be creative in code, I can role play different scenarios, and this career is a way for me to tap into both of my passions. I am able to work on really impactful technology in a way that allows me to be creative while also partnering with all kinds of different people and teams along the way.”
At the very beginning of her career, Rudina faced a unique challenge that included relocating from her home in Albania to a new city in the Czech Republic. “It wasn’t easy moving to Prague. I had a tough time adjusting because I had never traveled, never lived on my own, and never had a professional job – and here I was tackling all three at once!” As the only daughter in a family with three brothers, she notes how she had to advocate for herself with her family in making such a big life change. While working as a Junior Developer, she had to work hard to overcome challenges and make an impact in her work.
“At my first job, as I was navigating all of this change, I got a really critical piece of feedback from my manager. I wasn’t developing my skills as much as he expected to see. I was in danger of losing my job if I didn’t make some dramatic improvements.”
This hard conversation served as a wakeup call for Rudina, and ignited her commitment to invest in learning and strengthening her skills so she could achieve her goals. While the feedback was hard to hear, Rudina notes that her manager continued to be supportive of her growth and wanted to help her succeed. “For 6 months, I woke up, went to work, came home, ate dinner, and then studied until it was time for bed. After doing that on repeat, my manager was able to see a dramatic improvement in the rate in which I was learning and growing. While there was still more to learn, he was impressed with my dedication and I continued to grow in my role.”
Rudina’s hard work paid off, and two years later, she took her career a step further with a position as a Salesforce Developer at Barclays. “I am so grateful to have had a manager that was able to give me the feedback I needed, while also encouraging me to stick with it and offer support along the way.”
Now a Senior Software Engineer at Rapid7, she reflects on her journey with a strong sense of pride and accomplishment. “Whatever challenges I went through in previous employers has made me the best person for Rapid7, and I’m grateful for all of my past experiences.” Overcoming challenges can sometimes feel uncomfortable, but it is often necessary to grow and move our careers forward. “It’s a continuous cycle too, as you grow and get more experience, you continue to set your goals higher and seek out the next challenge. There is always more to learn and more ways to grow in your career, especially in technology.”
Her appetite for continued growth is what ultimately brought her to Rapid7’s newest office in Prague in 2023. “I felt like I was ready for new challenges that would continue to accelerate my growth.” When looking at where to go next, she had three requirements that she was looking for in her next employer.
A clear development plan with support from her manager
A culture rooted in honesty and trust
Competitive and fair compensation for her work. Growing her earning potential alongside the growth of her career as she continued to advance.
“When interviewing for the role at Rapid7, I found evidence of everything on my list, and so much more as well. What really stands out the most is the trust and responsibility given to me by the business analysts or project managers that I partner with. They will share what they are looking to do, and then give me the responsibility and the autonomy to go ahead and find a way to make it happen – even when I’m brand new. It feels good to be given that trust and to be able to work on business critical initiatives where my ideas are respected and valued.”
When asked what advice she would give others looking to take on a new role, she says to note down what your expectations and goals are. “Use the interview time to ask whatever questions you need to help understand if it’s the right move for you, or not.” Rudina says having things defined before the call helps you stay on track and get the most value as you weigh your options. “I had a lot of questions during my interview – but because I was able to get answers, I walked away with a really confident feeling that the role at Rapid7 was going to be just what I was looking for.”
For Rudina, growth and development was essential in her next role. As someone who embraces new challenges, and represents Rapid7’s core values every day through her actions and work, it didn’t take long for her to be offered yet another opportunity. Within her first three months, she was given the chance to serve as a team lead. She looks forward to continuing to make an impact in her work, grow her career, and support others through her participation in the Rapid7 Women Impact Group.
To learn more about career opportunities and what it’s like to work at Rapid7, visit our careers site.
Inference from fine-tuned LLMs with LoRAs is now in open beta
Today, we’re excited to announce that you can now run fine-tuned inference with LoRAs on Workers AI. This feature is in open beta and available for pre-trained LoRA adapters to be used with Mistral, Gemma, or Llama 2, with some limitations. Take a look at our product announcements blog post to get a high-level overview of our Bring Your Own (BYO) LoRAs feature.
In this post, we’ll do a deep dive into what fine-tuning and LoRAs are, show you how to use it on our Workers AI platform, and then delve into the technical details of how we implemented it on our platform.
What is fine-tuning?
Fine-tuning is a general term for modifying an AI model by continuing to train it with additional data. The goal of fine-tuning is to increase the probability that a generation is similar to your dataset. Training a model from scratch is not practical for many use cases given how expensive and time consuming they can be to train. By fine-tuning an existing pre-trained model, you benefit from its capabilities while also accomplishing your desired task. Low-Rank Adaptation (LoRA) is a specific fine-tuning method that can be applied to various model architectures, not just LLMs. It is common that the pre-trained model weights are directly modified or fused with additional fine-tune weights in traditional fine-tuning methods. LoRA, on the other hand, allows for the fine-tune weights and pre-trained model to remain separate, and for the pre-trained model to remain unchanged. The end result is that you can train models to be more accurate at specific tasks, such as generating code, having a specific personality, or generating images in a specific style. You can even fine-tune an existing LLM to understand additional information about a specific topic.
The approach of maintaining the original base model weights means that you can create new fine-tune weights with relatively little compute. You can take advantage of existing foundational models (such as Llama, Mistral, and Gemma), and adapt them for your needs.
How does fine-tuning work?
To better understand fine-tuning and why LoRA is so effective, we have to take a step back to understand how AI models work. AI models (like LLMs) are neural networks that are trained through deep learning techniques. In neural networks, there are a set of parameters that act as a mathematical representation of the model’s domain knowledge, made up of weights and biases – in simple terms, numbers. These parameters are usually represented as large matrices of numbers. The more parameters a model has, the larger the model is, so when you see models like llama-2-7b, you can read “7b” and know that the model has 7 billion parameters.
A model’s parameters define its behavior. When you train a model from scratch, these parameters usually start off as random numbers. As you train the model on a dataset, these parameters get adjusted bit-by-bit until the model reflects the dataset and exhibits the right behavior. Some parameters will be more important than others, so we apply a weight and use it to show more or less importance. Weights play a crucial role in the model’s ability to capture patterns and relationships in the data it is trained on.
Traditional fine-tuning will adjust all the parameters in the trained model with a new set of weights. As such, a fine-tuned model requires us to serve the same amount of parameters as the original model, which means it can take a lot of time and compute to train and run inference for a fully fine-tuned model. On top of that, new state-of-the-art models, or versions of existing models, are regularly released, meaning that fully fine-tuned models can become costly to train, maintain, and store.
LoRA is an efficient method of fine-tuning
In the simplest terms, LoRA avoids adjusting parameters in a pre-trained model and instead allows us to apply a small number of additional parameters. These additional parameters are applied temporarily to the base model to effectively control model behavior. Relative to traditional fine-tuning methods it takes a lot less time and compute to train these additional parameters, which are referred to as a LoRA adapter. After training, we package up the LoRA adapter as a separate model file that can then plug in to the base model it was trained from. A fully fine-tuned model can be tens of gigabytes in size, while these adapters are usually just a few megabytes. This makes it a lot easier to distribute, and serving fine-tuned inference with LoRA only adds ms of latency to total inference time.
If you’re curious to understand why LoRA is so effective, buckle up — we first have to go through a brief lesson on linear algebra. If that’s not a term you’ve thought about since university, don’t worry, we’ll walk you through it.
Show me the math
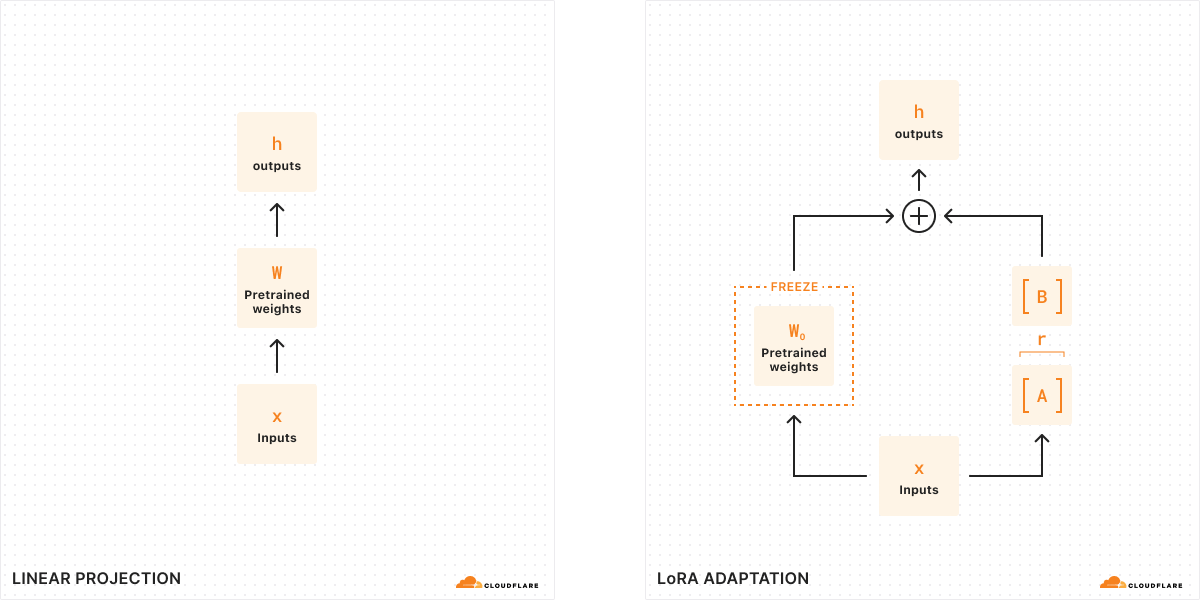
With traditional fine-tuning, we can take the weights of a model (W0) and tweak them to output a new set of weights — so the difference between the original model weights and the new weights is ΔW, representing the change in weights. Therefore, a tuned model will have a new set of weights which can be represented as the original model weights plus the change in weights, W0 + ΔW.
Remember, all of these model weights are actually represented as large matrices of numbers. In math, every matrix has a property called rank (r), which describes the number of linearly independent columns or rows in a matrix. When matrices are low-rank, they have only a few columns or rows that are “important”, so we can actually decompose or split them into two smaller matrices with the most important parameters (think of it like factoring in algebra). This technique is called rank decomposition, which allows us to greatly reduce and simplify matrices while keeping the most important bits. In the context of fine-tuning, rank determines how many parameters get changed from the original model – the higher the rank, the stronger the fine-tune, giving you more granularity over the output.
According to the original LoRA paper, researchers have found that when a model is low-rank, the matrix representing the change in weights is also low-rank. Therefore, we can apply rank decomposition to our matrix representing the change in weights ΔW to create two smaller matrices A, B, where ΔW = BA. Now, the change in the model can be represented by two smaller low-rank matrices. This is why this method of fine-tuning is called Low-Rank Adaptation.
When we run inference, we only need the smaller matrices A, B to change the behavior of the model. The model weights in A, B constitute our LoRA adapter (along with a config file). At runtime, we add the model weights together, combining the original model (W0) and the LoRA adapter (A, B). Adding and subtracting are simple mathematical operations, meaning that we can quickly swap out different LoRA adapters by adding and subtracting A, B from W0.. By temporarily adjusting the weights of the original model, we modify the model’s behavior and output and as a result, we get fine-tuned inference with minimal added latency.
According to the original LoRA paper, “LoRA can reduce the number of trainable parameters by 10,000 times and the GPU memory requirement by 3 times”. Because of this, LoRA is one of the most popular methods of fine-tuning since it’s a lot less computationally expensive than a fully fine-tuned model, doesn’t add any material inference time, and is much smaller and portable.
How can you use LoRAs with Workers AI?
Workers AI is very well-suited to run LoRAs because of the way we run serverless inference. The models in our catalog are always pre-loaded on our GPUs, meaning that we keep them warm so that your requests never encounter a cold start. This means that the base model is always available, and we can dynamically load and swap out LoRA adapters as needed. We can actually plug in multiple LoRA adapters to one base model, so we can serve multiple different fine-tuned inference requests at once.
When you fine-tune with LoRA, your output will be two files: your custom model weights (in safetensors format) and an adapter config file (in json format). To create these weights yourself, you can train a LoRA on your own data using the Hugging Face PEFT (Parameter-Efficient Fine-Tuning) library combined with the Hugging Face AutoTrain LLM library. You can also run your training tasks on services such as Auto Train and Google Colab. Alternatively, there are many open-source LoRA adapters available on Hugging Face today that cover a variety of use cases.
Eventually, we want to support the LoRA training workloads on our platform, but we’ll need you to bring your trained LoRA adapters to Workers AI today, which is why we’re calling this feature Bring Your Own (BYO) LoRAs.
For the initial open beta release, we are allowing people to use LoRAs with our Mistral, Llama, and Gemma models. We have set aside versions of these models which accept LoRAs, which you can access by appending -lora to the end of the model name. Your adapter must have been fine-tuned from one of our supported base models listed below:
@cf/meta-llama/llama-2-7b-chat-hf-lora
@cf/mistral/mistral-7b-instruct-v0.2-lora
@cf/google/gemma-2b-it-lora
@cf/google/gemma-7b-it-lora
As we are launching this feature in open beta, we have some limitations today to take note of: quantized LoRA models are not yet supported, LoRA adapters must be smaller than 100MB and have up to a max rank of 8, and you can try up to 30 LoRAs per account during our initial open beta. To get started with LoRAs on Workers AI, read the Developer Docs.
As always, we expect people to use Workers AI and our new BYO LoRA feature with our Terms of Service in mind, including any model-specific restrictions on use contained in the models’ license terms.
How did we build multi-tenant LoRA serving?
Serving multiple LoRA models simultaneously poses a challenge in terms of GPU resource utilization. While it is possible to batch inference requests to a base model, it is much more challenging to batch requests with the added complexity of serving unique LoRA adapters. To tackle this problem, we leverage the Punica CUDA kernel design in combination with global cache optimizations in order to handle the memory intensive workload of multi-tenant LoRA serving while offering low inference latency.
The Punica CUDA kernel was introduced in the paper Punica: Multi-Tenant LoRA Serving as a method to serve multiple, significantly different LoRA models applied to the same base model. In comparison to previous inference techniques, the method offers substantial throughput and latency improvements. This optimization is achieved in part through enabling request batching even across requests serving different LoRA adapters.
The core of the Punica kernel system is a new CUDA kernel called Segmented Gather Matrix-Vector Multiplication (SGMV). SGMV allows a GPU to store only a single copy of the pre-trained model while serving different LoRA models. The Punica kernel design system consolidates the batching of requests for unique LoRA models to improve performance by parallelizing the feature-weight multiplication of different requests in a batch. Requests for the same LoRA model are then grouped to increase operational intensity. Initially, the GPU loads the base model while reserving most of its GPU memory for KV Cache. The LoRA components (A and B matrices) are then loaded on demand from remote storage (Cloudflare’s cache or R2) when required by an incoming request. This on demand loading introduces only milliseconds of latency, which means that multiple LoRA adapters can be seamlessly fetched and served with minimal impact on inference performance. Frequently requested LoRA adapters are cached for the fastest possible inference.
Once a requested LoRA has been cached locally, the speed it can be made available for inference is constrained only by PCIe bandwidth. Regardless, given that each request may require its own LoRA, it becomes critical that LoRA downloads and memory copy operations are performed asynchronously. The Punica scheduler tackles this exact challenge, batching only requests which currently have required LoRA weights available in GPU memory, and queueing requests that do not until the required weights are available and the request can efficiently join a batch.
By effectively managing KV cache and batching these requests, it is possible to handle significant multi-tenant LoRA-serving workloads. A further and important optimization is the use of continuous batching. Common batching methods require all requests to the same adapter to reach their stopping condition before being released. Continuous batching allows a request in a batch to be released early so that it does not need to wait for the longest running request.
Given that LLMs deployed to Cloudflare’s network are available globally, it is important that LoRA adapter models are as well. Very soon, we will implement remote model files that are cached at Cloudflare’s edge to further reduce inference latency.
A roadmap for fine-tuning on Workers AI
Launching support for LoRA adapters is an important step towards unlocking fine-tunes on our platform. In addition to the LLM fine-tunes available today, we look forward to supporting more models and a variety of task types, including image generation.
Our vision for Workers AI is to be the best place for developers to run their AI workloads — and this includes the process of fine-tuning itself. Eventually, we want to be able to run the fine-tuning training job as well as fully fine-tuned models directly on Workers AI. This unlocks many use cases for AI to be more relevant in organizations by empowering models to have more granularity and detail for specific tasks.
With AI Gateway, we will be able to help developers log their prompts and responses, which they can then use to fine-tune models with production data. Our vision is to have a one-click fine-tuning service, where log data from AI Gateway can be used to retrain a model (on Cloudflare) and then the fine-tuned model can be redeployed on Workers AI for inference. This will allow developers to personalize their AI models to fit their applications, allowing for granularity as low as a per-user level. The fine-tuned model can then be smaller and more optimized, helping users save time and money on AI inference – and the magic is that all of this can all happen within our very own Developer Platform.
We’re excited for you to try the open beta for BYO LoRAs! Read our Developer Docs for more details, and tell us what you think on Discord.
Welcome to Tuesday – our AI day of Developer Week 2024! In this blog post, we’re excited to share an overview of our new AI announcements and vision, including news about Workers AI officially going GA with improved pricing, a GPU hardware momentum update, an expansion of our Hugging Face partnership, Bring Your Own LoRA fine-tuned inference, Python support in Workers, more providers in AI Gateway, and Vectorize metadata filtering.
Workers AI GA
Today, we’re excited to announce that our Workers AI inference platform is now Generally Available. After months of being in open beta, we’ve improved our service with greater reliability and performance, unveiled pricing, and added many more models to our catalog.
Improved performance & reliability
With Workers AI, our goal is to make AI inference as reliable and easy to use as the rest of Cloudflare’s network. Under the hood, we’ve upgraded the load balancing that is built into Workers AI. Requests can now be routed to more GPUs in more cities, and each city is aware of the total available capacity for AI inference. If the request would have to wait in a queue in the current city, it can instead be routed to another location, getting results back to you faster when traffic is high. With this, we’ve increased rate limits across all our models – most LLMs now have a of 300 requests per minute, up from 50 requests per minute during our beta phase. Smaller models have a limit of 1500-3000 requests per minute. Check out our Developer Docs for the rate limits of individual models.
Lowering costs on popular models
Alongside our GA of Workers AI, we published a pricing calculator for our 10 non-beta models earlier this month. We want Workers AI to be one of the most affordable and accessible solutions to run inference, so we added a few optimizations to our models to make them more affordable. Now, Llama 2 is over 7x cheaper and Mistral 7B is over 14x cheaper to run than we had initially published on March 1. We want to continue to be the best platform for AI inference and will continue to roll out optimizations to our customers when we can.
As a reminder, our billing for Workers AI started on April 1st for our non-beta models, while beta models remain free and unlimited. We offer 10,000 neurons per day for free to all customers. Workers Free customers will encounter a hard rate limit after 10,000 neurons in 24 hours while Workers Paid customers will incur usage at $0.011 per 1000 additional neurons. Read our Workers AI Pricing Developer Docs for the most up-to-date information on pricing.
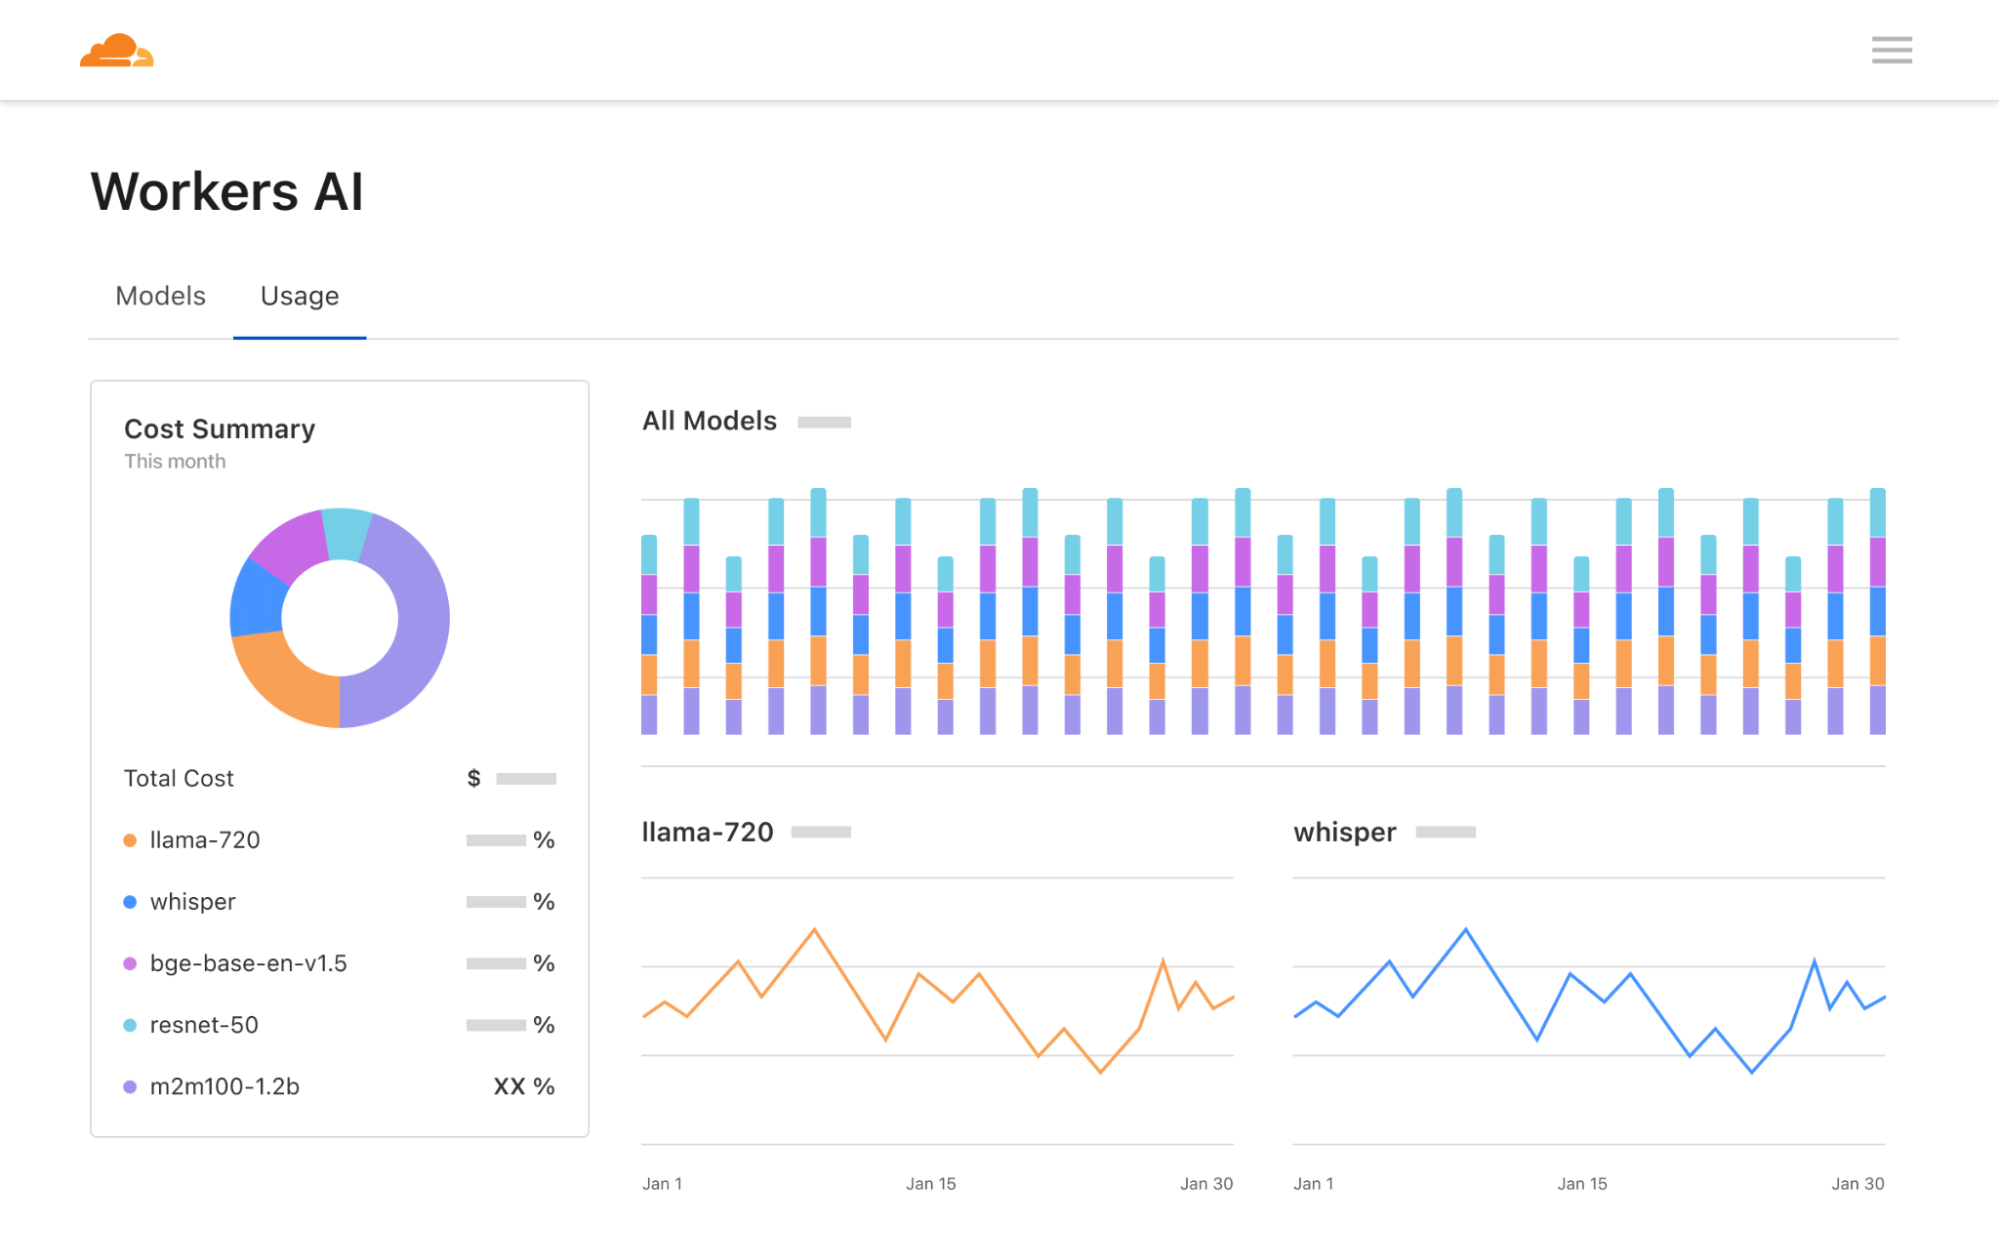
New dashboard and playground
Lastly, we’ve revamped our Workers AI dashboard and AI playground. The Workers AI page in the Cloudflare dashboard now shows analytics for usage across models, including neuron calculations to help you better predict pricing. The AI playground lets you quickly test and compare different models and configure prompts and parameters. We hope these new tools help developers start building on Workers AI seamlessly – go try them out!
Run inference on GPUs in over 150 cities around the world
When we announced Workers AI back in September 2023, we set out to deploy GPUs to our data centers around the world. We plan to deliver on that promise and deploy inference-tuned GPUs almost everywhere by the end of 2024, making us the most widely distributed cloud-AI inference platform. We have over 150 cities with GPUs today and will continue to roll out more throughout the year.
We also have our next generation of compute servers with GPUs launching in Q2 2024, which means better performance, power efficiency, and improved reliability over previous generations. We provided a preview of our Gen 12 Compute servers design in a December 2023 blog post, with more details to come. With Gen 12 and future planned hardware launches, the next step is to support larger machine learning models and offer fine-tuning on our platform. This will allow us to achieve higher inference throughput, lower latency and greater availability for production workloads, as well as expanding support to new categories of workloads such as fine-tuning.
Hugging Face Partnership
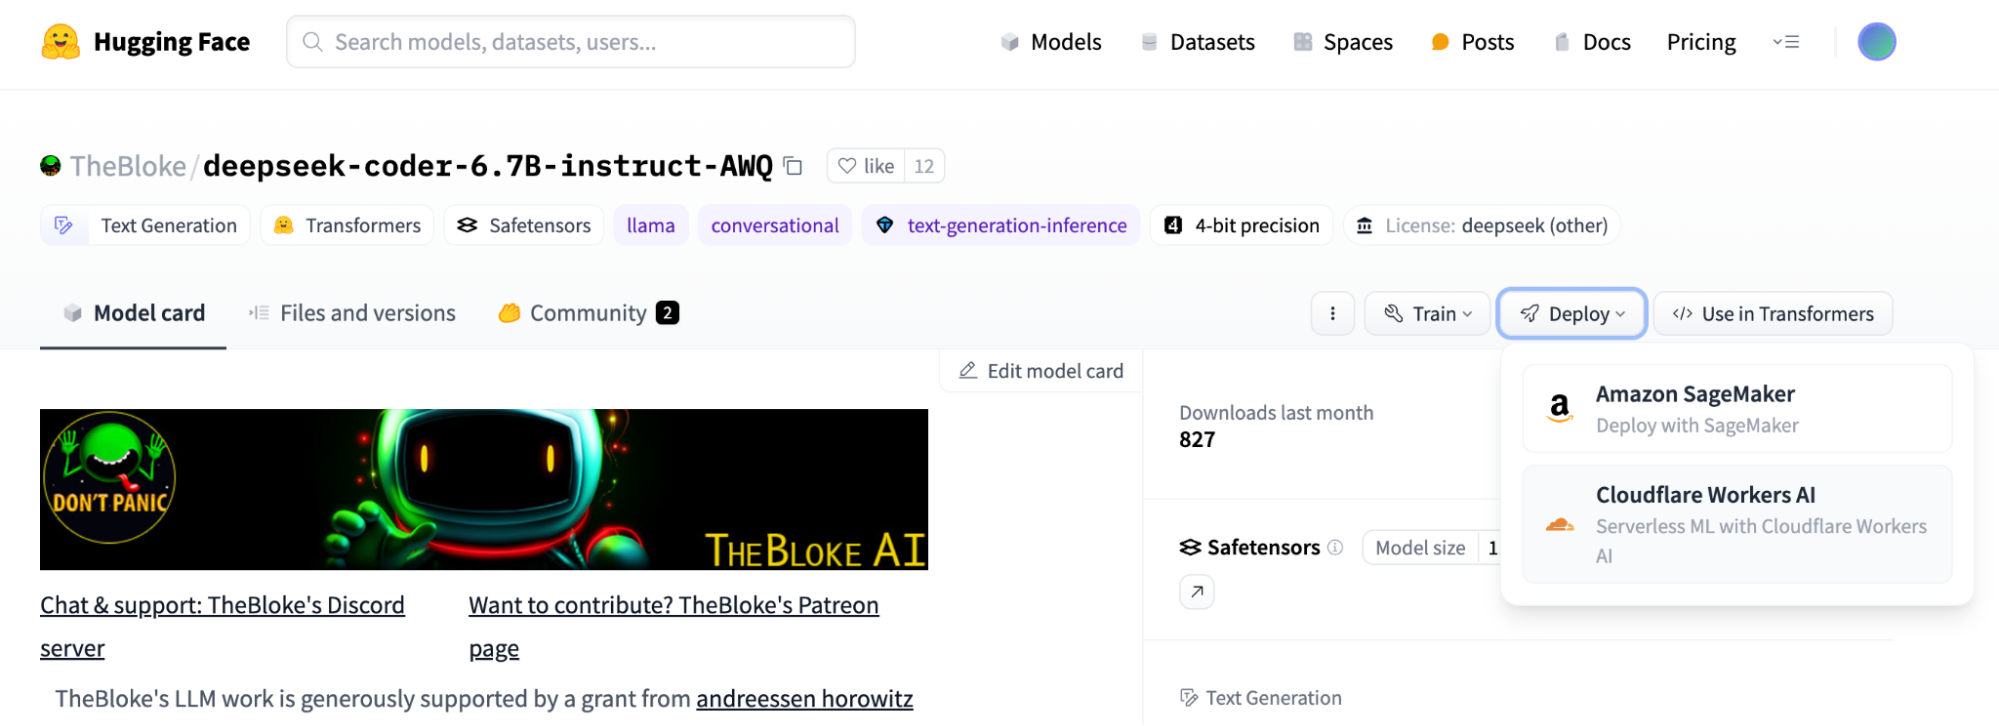
We’re also excited to continue our partnership with Hugging Face in the spirit of bringing the best of open-source to our customers. Now, you can visit some of the most popular models on Hugging Face and easily click to run the model on Workers AI if it is available on our platform.
We’re happy to announce that we’ve added 4 more models to our platform in conjunction with Hugging Face. You can now access the new Mistral 7B v0.2 model with improved context windows, Nous Research’s Hermes 2 Pro fine-tuned version of Mistral 7B, Google’s Gemma 7B, and Starling-LM-7B-beta fine-tuned from OpenChat. There are currently 14 models that we’ve curated with Hugging Face to be available for serverless GPU inference powered by Cloudflare’s Workers AI platform, with more coming soon. These models are all served using Hugging Face’s technology with a TGI backend, and we work closely with the Hugging Face team to curate, optimize, and deploy these models.
“We are excited to work with Cloudflare to make AI more accessible to developers. Offering the most popular open models with a serverless API, powered by a global fleet of GPUs is an amazing proposition for the Hugging Face community, and I can’t wait to see what they build with it.” – Julien Chaumond, Co-founder and CTO, Hugging Face
You can find all of the open models supported in Workers AI in this Hugging Face Collection, and the “Deploy to Cloudflare Workers AI” button is at the top of each model card. To learn more, read Hugging Face’s blog post and take a look at our Developer Docs to get started. Have a model you want to see on Workers AI? Send us a message on Discord with your request.
Supporting fine-tuned inference – BYO LoRAs
Fine-tuned inference is one of our most requested features for Workers AI, and we’re one step closer now with Bring Your Own (BYO) LoRAs. Using the popular Low-Rank Adaptation method, researchers have figured out how to take a model and adapt some model parameters to the task at hand, rather than rewriting all model parameters like you would for a fully fine-tuned model. This means that you can get fine-tuned model outputs without the computational expense of fully fine-tuning a model.
We now support bringing trained LoRAs to Workers AI, where we apply the LoRA adapter to a base model at runtime to give you fine-tuned inference, at a fraction of the cost, size, and speed of a fully fine-tuned model. In the future, we want to be able to support fine-tuning jobs and fully fine-tuned models directly on our platform, but we’re excited to be one step closer today with LoRAs.
const response = await ai.run(
  "@cf/mistralai/mistral-7b-instruct-v0.2-lora", //the model supporting LoRAs
  {
      messages: [{"role": "user", "content": "Hello world"],
      raw: true, //skip applying the default chat template
      lora: "00000000-0000-0000-0000-000000000", //the finetune id OR name
  }
);
BYO LoRAs is in open beta as of today for Gemma 2B and 7B, Llama 2 7B and Mistral 7B models with LoRA adapters up to 100MB in size and max rank of 8, and up to 30 total LoRAs per account. As always, we expect you to use Workers AI and our new BYO LoRA feature with our Terms of Service in mind, including any model-specific restrictions on use contained in the models’ license terms.
Python is the second most popular programming language in the world (after JavaScript) and the language of choice for building AI applications. And starting today, in open beta, you can now write Cloudflare Workers in Python. Python Workers support all bindings to resources on Cloudflare, including Vectorize, D1, KV, R2 and more.
…and are configured by simply pointing at a .py file in your wrangler.toml:
name = "hello-world-python-worker"
main = "src/entry.py"
compatibility_date = "2024-03-18"
compatibility_flags = ["python_workers"]
There are no extra toolchain or precompilation steps needed. The Pyodide Python execution environment is provided for you, directly by the Workers runtime, mirroring how Workers written in JavaScript already work.
There’s lots more to dive into — take a look at the docs, and check out our companion blog post for details about how Python Workers work behind the scenes.
AI Gateway now supports Anthropic, Azure, AWS Bedrock, Google Vertex, and Perplexity
Our AI Gateway product helps developers better control and observe their AI applications, with analytics, caching, rate limiting, and more. We are continuing to add more providers to the product, including Anthropic, Google Vertex, and Perplexity, which we’re excited to announce today. We quietly rolled out Azure and Amazon Bedrock support in December 2023, which means that the most popular providers are now supported via AI Gateway, including Workers AI itself.
Take a look at our Developer Docs to get started with AI Gateway.
Coming soon: Persistent Logs
In Q2 of 2024, we will be adding persistent logs so that you can push your logs (including prompts and responses) to object storage, custom metadata so that you can tag requests with user IDs or other identifiers, and secrets management so that you can securely manage your application’s API keys.
We want AI Gateway to be the control plane for your AI applications, allowing developers to dynamically evaluate and route requests to different models and providers. With our persistent logs feature, we want to enable developers to use their logged data to fine-tune models in one click, eventually running the fine-tune job and the fine-tuned model directly on our Workers AI platform. AI Gateway is just one product in our AI toolkit, but we’re excited about the workflows and use cases it can unlock for developers building on our platform, and we hope you’re excited about it too.
Vectorize metadata filtering and future GA of million vector indexes
Vectorize is another component of our toolkit for AI applications. In open beta since September 2023, Vectorize allows developers to persist embeddings (vectors), like those generated from Workers AI text embedding models, and query for the closest match to support use cases like similarity search or recommendations. Without a vector database, model output is forgotten and can’t be recalled without extra costs to re-run a model.
Since Vectorize’s open beta, we’ve added metadata filtering. Metadata filtering lets developers combine vector search with filtering for arbitrary metadata, supporting the query complexity in AI applications. We’re laser-focused on getting Vectorize ready for general availability, with an target launch date of June 2024, which will include support for multi-million vector indexes.
The most comprehensive Developer Platform to build AI applications
On Cloudflare’s Developer Platform, we believe that all developers should be able to quickly build and ship full-stack applications – and that includes AI experiences as well. With our GA of Workers AI, announcements for Python support in Workers, AI Gateway, and Vectorize, and our partnership with Hugging Face, we’ve expanded the world of possibilities for what you can build with AI on our platform. We hope you are as excited as we are – take a look at all our Developer Docs to get started, and let us know what you build.
This new support for Python is different from how Workers have historically supported languages beyond JavaScript — in this case, we have directly integrated a Python implementation into workerd, the open-source Workers runtime. All bindings, including bindings to Vectorize, Workers AI, R2, Durable Objects, and more are supported on day one. Python Workers can import a subset of popular Python packages including FastAPI, Langchain, Numpy and more. There are no extra build steps or external toolchains.
To do this, we’ve had to push the bounds of all of our systems, from the runtime itself, to our deployment system, to the contents of the Worker bundle that is published across our network. You can read the docs, and start using it today.
We want to use this post to pull back the curtain on the internal lifecycle of a Python Worker, share what we’ve learned in the process, and highlight where we’re going next.
Beyond “Just compile to WebAssembly”
Cloudflare Workers have supported WebAssembly since 2018 — each Worker is a V8 isolate, powered by the same JavaScript engine as the Chrome web browser. In principle, it’s been possible for years to write Workers in any language — including Python — so long as it first compiles to WebAssembly or to JavaScript.
In practice, just because something is possible doesn’t mean it’s simple. And just because “hello world” works doesn’t mean you can reliably build an application. Building full applications requires supporting an ecosystem of packages that developers are used to building with. For a platform to truly support a programming language, it’s necessary to go much further than showing how to compile code using external toolchains.
Python Workers are different from what we’ve done in the past. It’s early, and still in beta, but we think it shows what providing first-class support for programming languages beyond JavaScript can look like on Workers.
Create an isolate for your Worker, and automatically inject Pyodide
Serve your Python code using Pyodide
This all happens under the hood — no extra toolchain or precompilation steps needed. The Python execution environment is provided for you, mirroring how Workers written in JavaScript already work.
A Python interpreter built into the Workers runtime
Just as JavaScript has many engines, Python has many implementations that can execute Python code. CPython is the reference implementation of Python. If you’ve used Python before, this is almost certainly what you’ve used, and is commonly referred to as just “Python”.
Pyodide is a port of CPython to WebAssembly. It interprets Python code, without any need to precompile the Python code itself to any other format. It runs in a web browser — check out this REPL. It is true to the CPython that Python developers know and expect, providing most of the Python Standard Library. It provides a foreign function interface (FFI) to JavaScript, allowing you to call JavaScript APIs directly from Python — more on this below. It provides popular open-source packages, and can import pure Python packages directly from PyPI.
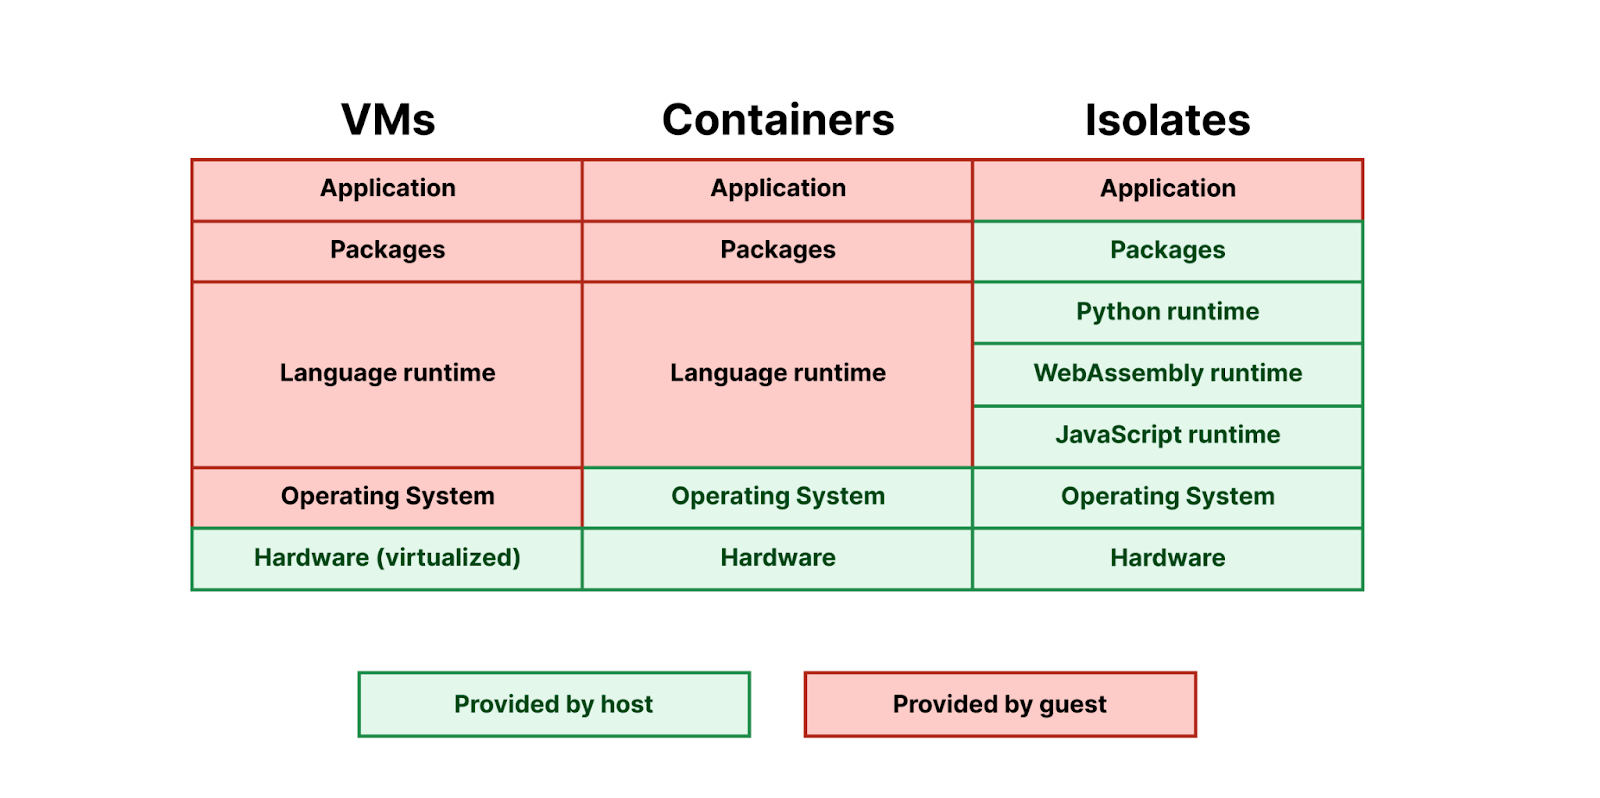
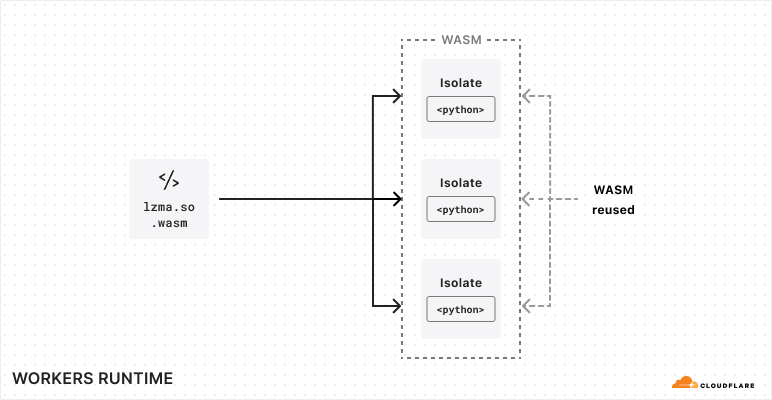
Pyodide struck us as the perfect fit for Workers. It is designed to allow the core interpreter and each native Python module to be built as separate WebAssembly modules, dynamically linked at runtime. This allows the code footprint for these modules to be shared among all Workers running on the same machine, rather than requiring each Worker to bring its own copy. This is essential to making WebAssembly work well in the Workers environment, where we often run thousands of Workers per machine — we need Workers using the same programming language to share their runtime code footprint. Running thousands of Workers on every machine is what makes it possible for us to deploy every application in every location at a reasonable price.
Just like with JavaScript Workers, with Python Workers we provide the runtime for you:
Pyodide is currently the exception — most languages that target WebAssembly do not yet support dynamic linking, so each application ends up bringing its own copy of its language runtime. We hope to see more languages support dynamic linking in the future, so that we can more effectively bring them to Workers.
How Pyodide works
Pyodide executes Python code in WebAssembly, which is a sandboxed environment, separated from the host runtime. Unlike running native code, all operations outside of pure computation (such as file reads) must be provided by a runtime environment, then imported by the WebAssembly module.
LLVM provides three target triples for WebAssembly:
wasm32-unknown-unknown – this backend provides no C standard library or system call interface; to support this backend, we would need to manually rewrite every system or library call to make use of imports we would define ourselves in the runtime.
wasm32-wasi – WASI is a standardized system interface, and defines a standard set of imports that are implemented in WASI runtimes such as wasmtime.
wasm32-unknown-emscripten – Like WASI, Emscripten defines the imports that a WebAssembly program needs to execute, but also outputs an accompanying JavaScript library that implements these imported functions.
Pyodide uses Emscripten, and provides three things:
A distribution of the CPython interpreter, compiled using Emscripten
A foreign function interface (FFI) between Python and JavaScript
A set of third-party Python packages, compiled using Emscripten’s compiler to WebAssembly.
Of these targets, only Emscripten currently supports dynamic linking, which, as we noted above, is essential to providing a shared language runtime for Python that is shared across isolates. Emscripten does this by providing implementations of dlopen and dlsym, which use the accompanying JavaScript library to modify the WebAssembly program’s table to link additional WebAssembly-compiled modules at runtime. WASI does not yet support the dlopen/dlsym dynamic linking abstractions used by CPython.
Pyodide and the magic of foreign function interfaces (FFI)
You might have noticed that in our Hello World Python Worker, we import Response from the js module:
Most Workers are written in JavaScript, and most of our engineering effort on the Workers runtime goes into improving JavaScript Workers. There is a risk in adding a second language that it might never reach feature parity with the first language and always be a second class citizen. Pyodide’s foreign function interface (FFI) is critical to avoiding this by providing access to all JavaScript functionality from Python. This can be used by the Worker author directly, and it is also used to make packages like FastAPI and Langchain work out-of-the-box, as we’ll show later in this post.
An FFI is a system for calling functions in one language that are implemented in another language. In most cases, an FFI is defined by a “higher-level” language in order to call functions implemented in a systems language, often C. Python’s ctypes module is such a system. These sorts of foreign function interfaces are often difficult to use because of the nature of C APIs.
Pyodide’s foreign function interface is an interface between Python and JavaScript, which are two high level object-oriented languages with a lot of design similarities. When passed from one language to another, immutable types such as strings and numbers are transparently translated. All mutable objects are wrapped in an appropriate proxy.
When a JavaScript object is passed into Python, Pyodide determines which JavaScript protocols the object supports and dynamically constructs an appropriate Python class that implements the corresponding Python protocols. For example, if the JavaScript object supports the JavaScript iteration protocol then the proxy will support the Python iteration protocol. If the JavaScript object is a Promise or other thenable, the Python object will be an awaitable.
from js import JSON

js_array = JSON.parse("[1,2,3]")

for entry in js_array:
   print(entry)
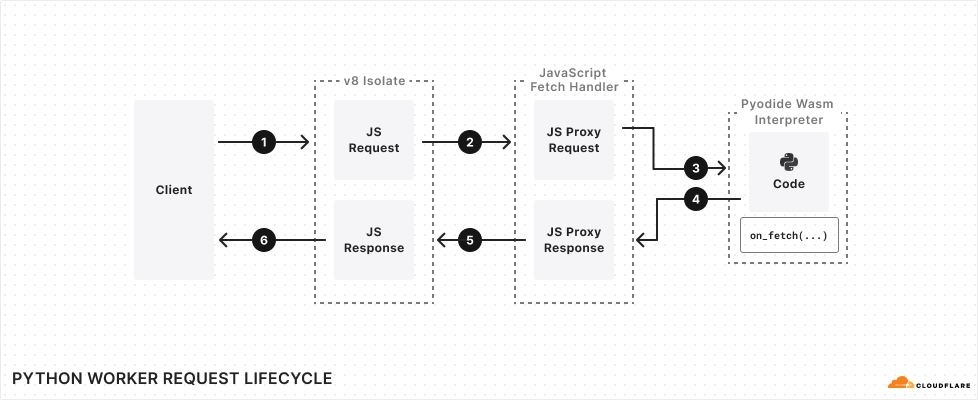
The lifecycle of a request to a Python Worker makes use of Pyodide’s FFI, wrapping the incoming JavaScript Request object in a JsProxy object that is accessible in your Python code. It then converts the value returned by the Python Worker’s handler into a JavaScript Response object that can be delivered back to the client:
Why dynamic linking is essential, and static linking isn’t enough
Python comes with a C FFI, and many Python packages use this FFI to import native libraries. These libraries are typically written in C, so they must first be compiled down to WebAssembly in order to work on the Workers runtime. As we noted above, Pyodide is built with Emscripten, which overrides Python’s C FFI — any time a package tries to load a native library, it is instead loaded from a WebAssembly module that is provided by the Workers runtime. Dynamic linking is what makes this possible — it is what lets us override Python’s C FFI, allowing Pyodide to support many Python packages that have native library dependencies.
Dynamic linking is “pay as you go”, while static linking is “pay upfront” — if code is statically linked into your binary, it must be loaded upfront in order for the binary to run, even if this code is never used.
Dynamic linking enables the Workers runtime to share the underlying WebAssembly modules of packages across different Workers that are running on the same machine.
We won’t go too much into detail on how dynamic linking works in Emscripten, but the main takeaway is that the Emscripten runtime fetches WebAssembly modules from a filesystem abstraction provided in JavaScript. For each Worker, we generate a filesystem at runtime, whose structure mimics a Python distribution that has the Worker’s dependencies installed, but whose underlying files are shared between Workers. This makes it possible to share Python and WebAssembly files between multiple Workers that import the same dependency. Today, we’re able to share these files across Workers, but copy them into each new isolate. We think we can go even further, by employing copy-on-write techniques to share the underlying resource across many Workers.
Supporting Server and Client libraries
Python has a wide variety of popular HTTP client libraries, including httpx, urllib3, requests and more. Unfortunately, none of them work out of the box in Pyodide. Adding support for these has been one of the longest running user requests for the Pyodide project. The Python HTTP client libraries all work with raw sockets, and the browser security model and CORS do not allow this, so we needed another way to make them work in the Workers runtime.
Async Client libraries
For libraries that can make requests asynchronously, including aiohttp and httpx, we can use the Fetch API to make requests. We do this by patching the library, instructing it to use the Fetch API from JavaScript — taking advantage of Pyodide’s FFI. The httpx patch ends up quite simple —fewer than 100 lines of code. Simplified even further, it looks like this:
Another challenge in supporting Python HTTP client libraries is that many Python APIs are synchronous. For these libraries, we cannot use the fetch API directly because it is asynchronous.
Thankfully, Joe Marshall recently landed a contribution to urllib3 that adds Pyodide support in web browsers by:
Checking if blocking with Atomics.wait() is possible a. If so, start a fetch worker thread b. Delegate the fetch operation to the worker thread and serialize the response into a SharedArrayBuffer c. In the Python thread, use Atomics.wait to block for the response in the SharedArrayBuffer
If Atomics.wait() doesn’t work, fall back to a synchronous XMLHttpRequest
Despite this, today Cloudflare Workers do not support worker threads or synchronous XMLHttpRequest, so neither of these two approaches will work in Python Workers. We do not support synchronous requests today, but there is a way forward…
FastAPI and Python’s Asynchronous Server Gateway Interface
FastAPI is one of the most popular libraries for defining Python servers. FastAPI applications use a protocol called the Asynchronous Server Gateway Interface (ASGI). This means that FastAPI never reads from or writes to a socket itself. An ASGI application expects to be hooked up to an ASGI server, typically uvicorn. The ASGI server handles all of the raw sockets on the application’s behalf.
Conveniently for us, this means that FastAPI works in Cloudflare Workers without any patches or changes to FastAPI itself. We simply need to replace uvicorn with an appropriate ASGI server that can run within a Worker. Our initial implementation lives here, in the fork of Pyodide that we maintain. We hope to add a more comprehensive feature set, add test coverage, and then upstream this implementation into Pyodide.
You can try this yourself by cloning cloudflare/python-workers-examples, and running npx wrangler@latest dev in the directory of the FastAPI example.
Importing Python Packages
Python Workers support a subset of Python packages, which are provided directly by Pyodide, including numpy, httpx, FastAPI, Langchain, and more. This ensures compatibility with the Pyodide runtime by pinning package versions to Pyodide versions, and allows Pyodide to patch internal implementations, as we showed above in the case of httpx.
To import a package, simply add it to your requirements.txt file, without adding a version number. A specific version of the package is provided directly by Pyodide. Today, you can use packages in local development, and in the coming weeks, you will be able to deploy Workers that define dependencies in a requirements.txt file. Later in this post, we’ll show how we’re thinking about managing new versions of Pyodide and packages.
We maintain our own fork of Pyodide, which allows us to provide patches specific to the Workers runtime, and to quickly expand our support for packages in Python Workers, while also committing to upstreaming our changes back to Pyodide, so that the whole ecosystem of developers can benefit.
Python packages are often big and memory hungry though, and they can do a lot of work at import time. How can we ensure that you can bring in the packages you need, while mitigating long cold start times?
Making cold starts faster with memory snapshots
In the example at the start of this post, in local development, we mentioned injecting Pyodide into your Worker. Pyodide itself is 6.4MB — and Python packages can also be quite large.
If we simply shoved Pyodide into your Worker and uploaded it to Cloudflare, that’d be quite a large Worker to load into a new isolate — cold starts would be slow. On a fast computer with a good network connection, Pyodide takes about two seconds to initialize in a web browser, one second of network time and one second of cpu time. It wouldn’t be acceptable to initialize it every time you update your code for every isolate your Worker runs in across Cloudflare’s network.
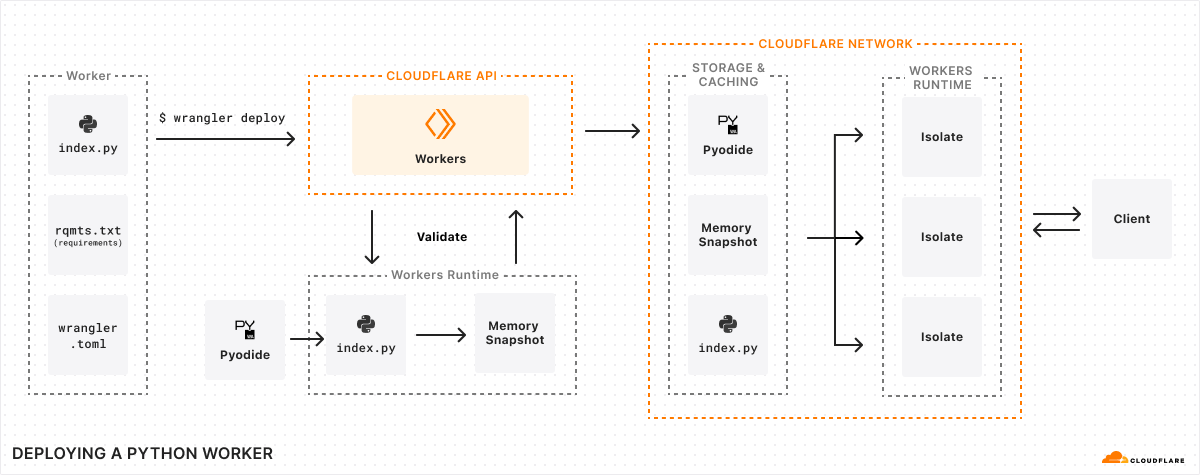
Wrangler uploads your Python code and your requirements.txt file to the Workers API
We send your Python code, and your requirements.txt file to the Workers runtime to be validated
We create a new isolate for your Worker, and automatically inject Pyodide plus any packages you’ve specified in your requirements.txt file.
We scan the Worker’s code for import statements, execute them, and then take a snapshot of the Worker’s WebAssembly linear memory. Effectively, we perform the expensive work of importing packages at deploy time, rather than at runtime.
We deploy this snapshot alongside your Worker’s Python code to Cloudflare’s network.
Just like a JavaScript Worker, we execute the Worker’s top-level scope.
When a request comes in to your Worker, we load this snapshot and use it to bootstrap your Worker in an isolate, avoiding expensive initialization time:
This takes cold starts for a basic Python Worker down to below 1 second. We’re not yet satisfied with this though. We’re confident that we can drive this down much, much further. How? By reusing memory snapshots.
Reusing Memory Snapshots
When you upload a Python Worker, we generate a single memory snapshot of the Worker’s top-level imports, including both Pyodide and any dependencies. This snapshot is specific to your Worker. It can’t be shared, even though most of its contents are the same as other Python Workers.
Instead, we can create a single, shared snapshot ahead of time, and preload it into a pool of “pre-warmed” isolates. These isolates would already have the Pyodide runtime loaded and ready — making a Python Worker work just like a JavaScript Worker. In both cases, the underlying interpreter and execution environment is provided by the Workers runtime, and available on-demand without delay. The only difference is that with Python, the interpreter runs in WebAssembly, within the Worker.
Snapshots are a common pattern across runtimes and execution environments. Node.js uses V8 snapshots to speed up startup time. You can take snapshots of Firecracker microVMs and resume execution in a different process. There’s lots more we can do here — not just for Python Workers, but for Workers written in JavaScript as well, caching snapshots of compiled code from top-level scope and the state of the isolate itself. Workers are so fast and efficient that to-date we haven’t had to take snapshots in this way, but we think there are still big performance gains to be had.
This is our biggest lever towards driving cold start times down over the rest of 2024.
Future proofing compatibility with Pyodide versions and Compatibility Dates
When you deploy a Worker to Cloudflare, you expect it to keep running indefinitely, even if you never update it again. There are Workers deployed in 2018 that are still running just fine in production.
We achieve this using Compatibility Dates and Compatibility Flags, which provide explicit opt-in mechanisms for new behavior and potentially backwards-incompatible changes, without impacting existing Workers.
This works in part because it mirrors how the Internet and web browsers work. You publish a web page with some JavaScript, and rightly expect it to work forever. Web browsers and Cloudflare Workers have the same type of commitment of stability to developers.
There is a challenge with Python though — both Pyodide and CPython are versioned. Updated versions are published regularly and can contain breaking changes. And Pyodide provides a set of built-in packages, each with a pinned version number. This presents a question — how should we allow you to update your Worker to a newer version of Pyodide?
A new version of Python is released every year in August, and a new version of Pyodide is released six (6) months later. When this new version of Pyodide is published, we will add it to Workers by gating it behind a Compatibility Flag, which is only enabled after a specified Compatibility Date. This lets us continually provide updates, without risk of breaking changes, extending the commitment we’ve made for JavaScript to Python.
Each Python release has a five (5) year support window. Once this support window has passed for a given version of Python, security patches are no longer applied, making this version unsafe to rely on. To mitigate this risk, while still trying to hold as true as possible to our commitment of stability and long-term support, after five years any Python Worker still on a Python release that is outside of the support window will be automatically moved forward to the next oldest Python release. Python is a mature and stable language, so we expect that in most cases, your Python Worker will continue running without issue. But we recommend updating the compatibility date of your Worker regularly, to stay within the support window.
In between Python releases, we also expect to update and add additional Python packages, using the same opt-in mechanism. A Compatibility Flag will be a combination of the Python version and the release date of a set of packages. For example, python_3.17_packages_2025_03_01.
How bindings work in Python Workers
We mentioned earlier that Pyodide provides a foreign function interface (FFI) to JavaScript — meaning that you can directly use JavaScript objects, methods, functions and more, directly from Python.
This means that from day one, all binding APIs to other Cloudflare resources are supported in Cloudflare Workers. The env object that is provided by handlers in Python Workers is a JavaScript object that Pyodide provides a proxy API to, handling type translations across languages automatically.
For example, to write to and read from a KV namespace from a Python Worker, you would write:
from js import Response

async def on_fetch(request, env):
    await env.FOO.put("bar", "baz")
    bar = await env.FOO.get("bar")
    return Response.new(bar) # returns "baz"
This works for Web APIs too — see how Response is imported from the js module? You can import any global from JavaScript this way.
Get this JavaScript out of my Python!
You’re probably reading this post because you want to write Python instead of JavaScript. from js import Response just isn’t Pythonic. We know — and we have actually tackled this challenge before for another language (Rust). And we think we can do this even better for Python.
We launched workers-rs in 2021 to make it possible to write Workers in Rust. For each JavaScript API in Workers, we, alongside open-source contributors, have written bindings that expose a more idiomatic Rust API.
We plan to do the same for Python Workers — starting with the bindings to Workers AI and Vectorize. But while workers-rs requires that you use and update an external dependency, the APIs we provide with Python Workers will be built into the Workers runtime directly. Just update your compatibility date, and get the latest, most Pythonic APIs.
This is about more than just making bindings to resources on Cloudflare more Pythonic though — it’s about compatibility with the ecosystem.
Similar to how we recently converted workers-rs to use types from the http crate, which makes it easy to use the axum crate for routing, we aim to do the same for Python Workers. For example, the Python standard library provides a raw socket API, which many Python packages depend on. Workers already provides connect(), a JavaScript API for working with raw sockets. We see ways to provide at least a subset of the Python standard library’s socket API in Workers, enabling a broader set of Python packages to work on Workers, with less of a need for patches.
But ultimately, we hope to kick start an effort to create a standardized serverless API for Python. One that is easy to use for any Python developer and offers the same capabilities as JavaScript.
We’re just getting started with Python Workers
Providing true support for a new programming language is a big investment that goes far beyond making “hello world” work. We chose Python very intentionally — it’s the second most popular programming language after JavaScript — and we are committed to continuing to improve performance and widen our support for Python packages.
We’re grateful to the Pyodide maintainers and the broader Python community — and we’d love to hear from you. Drop into the Python Workers channel in the Cloudflare Developers Discord, or start a discussion on Github about what you’d like to see next and which Python packages you’d like us to support.
Петдневната сага с блокажа на събарянето на незаконния сарай на олигарха Румен Гайтански – Вълка в ДЛС „Искър“, където е обикновен концесионер, приключи във вторник следобед. След…обаждането на репортер на…
Here at the Raspberry Pi Foundation, we believe that it’s important that our academic research has a practical application. An important area of research we are engaged in is broadening participation in computing education by investigating how the subject can be made more culturally relevant — we have published several studies in this area.
Licensed under the Open Government Licence.
However, we know that busy teachers do not have time to keep abreast of all the latest research. This is where our Pedagogy Quick Reads come in. They show teachers how an area of current research either has been or could be applied in practice.
Our new Pedagogy Quick Reads summarises the central tenets of culturally relevant pedagogy (the theory) and then lays out 10 areas of opportunity as concrete ways for you to put the theory into practice.
Computing remains an area where many groups of people are underrepresented, including those marginalised because of their gender, ethnicity, socio-economic background, additional educational needs, or age. For example, recent stats in the BCS’ Annual Diversity Report 2023 record that in the UK, the proportion of women working in tech was 20% in 2021, and Black women made up only 0.7% of tech specialists. Beyond gender and ethnicity, pupils who have fewer social and economic opportunities ‘don’t see Computing as a subject for somebody like them’, a recent report from Teach First found.
The fact that in the UK, 94% of girls and 79% of boys drop Computing at age 14 should be of particular concern for Computing educators. This last statistic makes it painfully clear that there is much work to be done to broaden the appeal of Computing in schools. One approach to make the subject more inclusive and attractive to young people is to make it more culturally relevant.
As part of our research to help teachers effectively adapt their curriculum materials to make them culturally relevant and engaging for their learners, we’ve identified 10 areas of opportunity — areas where teachers can choose to take actions to bring the latest research on culturally relevant pedagogy into their classrooms, right here, right now.
Applying the areas of opportunity in your classroom
The Pedagogy Quick Read gives teachers ideas for how they can use the areas of opportunity (AOs) to begin to review their own curriculum, teaching materials, and practices. We recommend picking one area initially, and focusing on that perhaps for a term. This helps you avoid being overwhelmed, and is particularly useful if you are trying to reach a particular group, for example, Year 9 girls, or low-attaining boys, or learners who lack confidence or motivation.
For example, one simple intervention is AO1 ‘Finding out more about our learners’. It’s all too easy for teachers to assume that they know what their students’ interests are. And getting to know your students can be especially tricky at secondary level, when teachers might only see a class once a fortnight or in a carousel.
However, finding out about your learners can be easily achieved in an online survey homework task, set at the beginning of a new academic year or term or unit of work. Using their interests, along with considerations of their backgrounds, families, and identities as inputs in curriculum planning can have tangible benefits: students may begin to feel an increased sense of belonging when they see their interests or identities reflected in the material later used.
How we’re using the AOs
The Quick Read presents two practical case studies of how we’ve used the 10 AO to adapt and assess different lesson materials to increase their relevance for learners.
Case study 1: Teachers in UK primary school adapt resources
As we’ve shared before, we implemented culturally relevant pedagogy as part of UK primary school teachers’ professional development in a recent research project. The Quick Read provides details of how we supported teachers to use the AOs to adapt teaching material to make it more culturally relevant to learners in their own contexts. Links to the resources used to review 2 units of work, lesson by lesson, to adapt tasks, learning material, and outcomes are included in the Quick Read.
Extract from the booklet used in a teacher professional development workshop to frame possible adaptations to lesson activities.
Case study 2: Reflecting on the adaption of resources for a vocational course for young adults in a Kenyan refugee camp
In a different project, we used the AOs to reflect on our adaptation of classroom materials from The Computing Curriculum, which we had designed for schools in England originally. Partnering with Amala Education, we adapted Computing Curriculum materials to create a 100-hour course for young adults at Kakuma refugee camp in Kenya who wanted to develop vocational digital literacy skills.
The diagram below shows our ratings of the importance of applying each AO while adapting materials for this particular context. In this case, the most important areas for making adaptations were to make the context more culturally relevant, and to improve the materials’ accessibility in terms of readability and output formats (text, animation, video, etc.).
Importance of the areas of opportunity to a course adaptation.
You can use this method of reflection as a way to evaluate your progress in addressing different AOs in a unit of work, across the materials for a whole year group, or even for your school’s whole approach. This may be useful for highlighting those areas which have, perhaps, been overlooked.
Applying research to practice with the AOs
The ‘Areas of opportunity’ Pedagogy Quick Read aims to help teachers apply research to their practice by summarising current research and giving practical examples of evidence-based teaching interventions and resources they can use.
The set of AOs was developed as part of a wider research project, and each one is itself research-informed. The Quick Read includes references to that research for everyone who wants to know more about culturally relevant pedagogy. This supporting evidence will be useful to teachers who want to address the topic of culturally relevant pedagogy with senior or subject leaders in their school, who often need to know that new initiatives are evidence-based.
Our goal for the Quick Read is to raise awareness of tried and tested pedagogies that increase accessibility and broaden the appeal of Computing education, so that all of our students can develop a sense of belonging and enjoyment of Computing.
Let us know if you have a story to tell about how you have applied one of the areas of opportunity in your classroom.
To date, our research in the field of culturally relevant pedagogy has been generously supported by funders including Cognizant and Google. We are very grateful to our partners for enabling us to learn more about how to make computing education inclusive for all.
This post was co-written with Luke Sudgen, Lead DevOps Engineer Post Trade, and Padraig Murphy, Solutions Architect Post Trade, from London Stock Exchange Group.
In this post, we’ll discuss some failure scenarios that were tested by London Stock Exchange Group (LSEG) Post Trade Technology teams during a chaos engineering event supported by AWS. Chaos engineering allows LSEG to simulate real-world failures in their cloud systems as part of controlled experiments. This methodology improves resilience and observability, which reduces risk and helps achieve compliance with regulators before deploying to production.
Introduction, tooling, and methodology
As a heavily regulated provider of global financial markets infrastructure, LSEG is always looking for opportunities to enhance workload resilience. LSEG and AWS teamed up to organize and run a 3-day AWS Experience-Based Acceleration (EBA) event to perform chaos engineering experiments against key workloads. The event was sponsored and led by the architecture function and included cross-functional Post Trade technical teams across various workstreams. The experiments were run using AWS Fault Injection Service (FIS) following the experiment methodology described in the Verify the resilience of your workloads using Chaos Engineering blog post.
Resilience of modern distributed cloud systems can be continuously improved through reviewing workload architectures and recovery, assessing standard operating procedures (SOPs), and building SOP alerts and recovery automations. AWS Resilience Hub provides a comprehensive tooling suite to get started on these activities.
Another key activity to validate and enhance your resilience posture is chaos engineering, a methodology that induces controlled chaos into customer systems through real-world controlled experiments. Chaos engineering helps customers create real-world failure conditions that can uncover hidden bugs, monitor blind spots, and manage bottlenecks that are difficult to find in distributed systems. This makes it a very useful tool in regulated industries such as financial services.
Architectural overview
The architectural diagram in Figure 1 comprises a three-tier application deployed in virtual private clouds (VPCs) with a multi-AZ setup.
Figure 1. Chaos engineering pattern for hybrid architecture (3-tier application)
Operating within a public subnet, the web application creates a hybrid architecture by using an Amazon Elastic Compute Cloud (Amazon EC2) Auto Scaling group and connecting to an Amazon Relational Database Service (Amazon RDS) database that’s located in a private subnet and connected with on-premises services. Additionally, a number of internal services are hosted in a separate VPC, housed within containers. FIS provides a controlled environment to validate the robustness of the architecture against various failure scenarios, such as:
Amazon EC2 instance failure that causes the application or container pod on the machine to also fail
The objective of this use case is to evaluate the resilience of the application or container pod running on Amazon EC2 instances and identify how the system can adapt itself and continue functioning during unexpected disruptions or instability of an instance. You can use aws:ec2:stop-instances or aws:ec2:terminate-instances FIS actions to mimic different EC2 instance failure modes. The response of running containers to the different instance failures was also assessed. If you’re running containers within a managed AWS service such as Amazon Elastic Container Service (Amazon ECS) or Amazon Elastic Kubernetes Service (Amazon EKS), you can use FIS failure scenarios for ECS tasks and EKS pods.
Amazon RDS failure
RDS failure is another common scenario you can use to identify and troubleshoot database managed service failures from failovers and node reboots at a large scale. FIS can be used to inject reboot/failover failure conditions into the managed RDS instances to understand the bottlenecks and issues from disaster failovers, sync failures, and other database-related problems.
Severe network latency degradation
Network latency degradation injects latency in the network interface that connects two systems. This helps you understand how these systems handle a data transfer delay and your operational response readiness (alerts, metrics, and correction). This FIS action (aws:ssm:send-command/AWSFIS-Run-Network-Latency) uses the Linux traffic control (tc) utility.
Network connectivity disruption
Connectivity issues like traffic disruption or other network issues can be simulated with FIS network actions. FIS supports the aws:network:disrupt-connectivity action to test your application’s resilience in the event of total or partial connectivity loss within its subnet, as well as disruption (including cross-Region) with other AWS networking components such as route tables or AWS Transit Gateway.
Amazon EBS volume failure (IOPS pause)
Disk failure is a problematic issue in real-time operations-based systems. It can lead to transactions failing due to I/O failures or storage failure during peak activity in heavy workloads. The EBS volume failure actions test system performance under different disk failure scenarios. FIS supports the aws:ebs:pause-volume-io action to pause I/O operations on target EBS volumes, as well as other failure modes. The target volumes must be in the same Availability Zone and must be attached to instances built on the AWS Nitro System.
Outcomes and conclusion
Following the experiment, the teams from LSEG successfully identified a series of architectural improvements to reduce application recovery time and enhance metric granularity and alerting. As a second tangible output, the teams now have a reusable chaos engineering methodology and toolset. Running regular in-person cross-functional events is a great way to implement a chaos engineering practice in your organization.
You can start your resilience journey on AWS today with AWS Resilience Hub.
In the evolving landscape of network security, safeguarding data as it exits your virtual environment is as crucial as protecting incoming traffic. In a previous post, we highlighted the significance of ingress TLS inspection in enhancing security within Amazon Web Services (AWS) environments. Building on that foundation, I focus on egress TLS inspection in this post.
Egress TLS decryption, a pivotal feature of AWS Network Firewall, offers a robust mechanism to decrypt, inspect the payload, and re-encrypt outbound SSL/TLS traffic. This process helps ensure that your sensitive data remains secure and aligned with your organizational policies as it traverses to external destinations. Whether you’re a seasoned AWS user or new to cloud security, understanding and implementing egress TLS inspection can bolster your security posture by helping you identify threats within encrypted communications.
In this post, we explore the setup of egress TLS inspection within Network Firewall. The discussion covers the key steps for configuration, highlights essential best practices, and delves into important considerations for maintaining both performance and security. By the end of this post, you will understand the role and implementation of egress TLS inspection, and be able to integrate this feature into your network security strategy.
Overview of egress TLS inspection
Egress TLS inspection is a critical component of network security because it helps you identify and mitigate risks that are hidden in encrypted traffic, such as data exfiltration or outbound communication with malicious sites (for example command and control servers). It involves the careful examination of outbound encrypted traffic to help ensure that data leaving your network aligns with security policies and doesn’t contain potential threats or sensitive information.
This process helps ensure that the confidentiality and integrity of your data are maintained while providing the visibility that you need for security analysis.
Figure 1 depicts the traffic flow of egress packets that don’t match the TLS inspection scope. Incoming packets that aren’t in scope of the TLS inspection pass through the stateless engine, and then the stateful engine, before being forwarded to the destination server. Because it isn’t within the scope for TLS inspection, the packet isn’t sent to the TLS engine.
Figure 1: Network Firewall packet handling, not in TLS scope
Now, compare that to Figure 2, which shows the traffic flow when egress TLS inspection is enabled. After passing through the stateless engine, traffic matches the TLS inspection scope. Network Firewall forwards the packet to the TLS engine, where it’s decrypted. Network Firewall passes the decrypted traffic to the stateful engine, where it’s inspected and passed back to the TLS engine for re-encryption. Network Firewall then forwards the packet to its destination.
Figure 2: Network Firewall packet handling, in TLS scope
Now consider the use of certificates for these connections. As shown in Figure 3, the egress TLS connections use a firewall-generated certificate on the client side and the target servers’ certificate on the server side. Network Firewall decrypts the packets that are internal to the firewall process and processes them in clear text through the stateful engine.
Figure 3: Egress TLS certificate usage
By implementing egress TLS inspection, you gain a more comprehensive view of your network traffic, so you can monitor and manage data flows more effectively. This enhanced visibility is crucial in detecting and responding to potential security threats that might otherwise remain hidden in encrypted traffic.
In the following sections, I guide you through the configuration of egress TLS inspection, discuss best practices, and highlight key considerations to help achieve a balance between robust security and optimal network performance.
Additional consideration: the challenge of SNI spoofing
Server Name Indication (SNI) spoofing can affect how well your TLS inspection works. SNI is a component of the TLS protocol that allows a client to specify which server it’s trying to connect to at the start of the handshake process.
SNI spoofing occurs when an entity manipulates the SNI field to disguise the true destination of the traffic. This is similar to requesting access to one site while intending to connect to a different, less secure site. SNI spoofing can pose significant challenges to network security measures, particularly those that rely on SNI information for traffic filtering and inspection.
In the context of egress TLS inspection, a threat actor can use SNI spoofing to circumvent security tools because these tools often use the SNI field to determine the legitimacy and safety of outbound connections. If the threat actor spoofs the SNI field successfully, unauthorized traffic could pass through the network, circumventing detection.
To effectively counteract SNI spoofing, use TLS inspection on Network Firewall. When you use TLS inspection on Network Firewall, spoofed SNIs on traffic within the scope of what TLS inspection looks at are dropped. The spoofed SNI traffic is dropped because Network Firewall validates the TLS server certificate to check the associated domains in it against the SNI.
Set up egress TLS inspection in Network Firewall
In this section, I guide you through the essential steps to set up egress TLS inspection in Network Firewall.
Prerequisites
The example used in this post uses a prebuilt environment. To learn more about the prebuilt environment and how to build a similar configuration in your own AWS environment, see Creating a TLS inspection configuration in Network Firewall. To follow along with this post, you will need a working topology with Network Firewall deployed and an Amazon Elastic Compute Cloud (Amazon EC2) instance deployed in a private subnet.
Additionally, you need to have a certificate generated that you will present to your clients when they make outbound TLS requests that match your inspection configuration. After you generate your certificate, note the certificate body, private key, and certificate chain because you will import these into ACM.
Obtain a certificate authority (CA) signed certificate, private key, and certificate chain.
Open the ACM console, and in the left navigation pane, choose Certificates.
Choose Import certificates.
In the Certificate details section, paste your certificate’s information, including the certificate body, certificate private key, and certificate chain, into the relevant fields.
Choose Next.
On the Add Tags page, add a tag to your certificate:
Note: It might take a few minutes for ACM to process the import request and show the certificate in the list. If the certificate doesn’t immediately appear, choose the refresh icon. Additionally, the Certificate Authority used to create the certificate you import to ACM can be public or private.
Review the imported certificate and do the following:
Note the Certificate ID. You will need this ID later when you assign the certificate to the TLS configuration.
Make sure that the status shows Issued. After ACM issues the certificate, you can use it in the TLS configuration.
Figure 4: Verify the certificate was issued in ACM
Create a TLS inspection configuration
The next step is to create a TLS inspection configuration. You will do this in two parts. First, you will create a rule group to define the stateful inspection criteria. Then you will create the TLS inspection configuration where you define what traffic you should decrypt for inspection and how you should handle revoked and expired certificates.
To create a rule group
Navigate to VPC > Network Firewall rule groups.
Choose Create rule group.
On the Choose rule group type page, do the following:
For Rule group type, select Stateful rule group. In this example, the stateless rule group that has already been created is being used.
For Rule group format, select Suricata compatible rule string.
Leave the other values as default and choose Next.
On the Describe rule group page, enter a name, description, and capacity for your rule group, and then choose Next.
Note: The capacity is the number of rules that you expect to have in this rule group. In our example, I set the value to 10, which is appropriate for a demo environment. Production environments require additional thought to the capacity before you create the rule group.
On the Configure rules page, in the Suricata compatible rule string section, enter your Suricata compatible rules line-by-line, and then choose Next.
On the Configure advanced settings – optional page, choose Next. You won’t use these settings in this walkthrough.
Add relevant tags by providing a key and a value for your tag, and then choose Next.
On the Review and create page, review your rule group and then choose Create rule group.
To create the TLS inspection configuration
Navigate to VPC > Network Firewall > TLS inspection configurations.
Choose Create TLS inspection configuration.
In the CA certificate for outbound SSL/TLS inspection – new section, from the dropdown menu, choose the certificate that you imported from ACM previously, and then choose Next.
Figure 5: Select the certificate for use with outbound SSL/TLS inspection
On the Describe TLS inspection configuration page, enter a name and description for the configuration, and then choose Next.
Define the scope—the traffic to include in decryption. For this walkthrough, you decrypt traffic that is on port 443. On the Define scope page, do the following:
For the Destination port range, in the dropdown, select Custom and then in the box, enter your port (in this example, 443). This is shown in Figure 6.
Figure 6: Specify a custom destination port in the TLS scope configuration
Choose Add scope configuration to add the scope configuration. This allows you to add multiple scopes. In this example, you have defined a scope indicating that the following traffic should be decrypted:
Source IP
Source Port
Destination IP
Destination Port
Any
Any
Any
443
In the Scope configuration section, verify that the scope is listed, as seen in Figure 7, and then choose Next.
Figure 7: Add the scope configuration to the SSL/TLS inspection policy
On the Advanced settings page, do the following to determine how to handle certificate revocation:
For Check certificate revocation status, select Enable.
In the Revoked – Action dropdown, select an action for revoked certificates. Your options are to Drop, Reject, or Pass. A drop occurs silently. A reject causes a TCP reset to be sent, indicating that the connection was dropped. Selecting pass allows the connection to establish.
In the Unknown status – Action section, select an action for certificates that have an unknown status. The same three options that are available for revoked certificates are also available for certificates with an unknown status.
Choose Next.
Note: The recommended best practice is to set the action to Reject for both revoked and unknown status. Later in this walkthrough, you will set these values to Drop and Allow to illustrate the behavior during testing. After testing, you should set both values to Reject.
Add relevant tags by providing a key and value for your tag, and then choose Next.
Review the configuration, and then choose Create TLS inspection configuration.
Add the configuration to a Network Firewall policy
The next step is to add your TLS inspection configuration to your firewall policy. This policy dictates how Network Firewall handles and applies the rules for your outbound traffic. As part of this configuration, your TLS inspection configuration defines what traffic is decrypted prior to inspection.
To add the configuration to a Network Firewall policy
Navigate to VPC > Network Firewall > Firewall policies.
Choose Create firewall policy.
In the Firewall policy details section, seen in Figure 8, enter a name and description, select a stream exception option for the policy, and then choose Next.
Figure 8: Define the firewall policy details
To attach a stateless rule group to the policy, choose Add stateless rule groups.
Select an existing policy, seen in Figure 9, and then choose Add rule groups.
Figure 9: Select a stateless policy from an existing rule group
In the Stateful rule group section, choose Add stateful rule groups.
Select the newly created TLS inspection rule group, and then choose Add rule group.
On the Add rule groups page, choose Next.
On the Configure advanced settings – optional page, choose Next. For this walkthrough, you will leave these settings at their default values.
On the Add TLS inspection configuration – optional section, seen in Figure 10, do the following:
Choose Add TLS inspection configuration.
From the dropdown, select your TLS inspection configuration.
Choose Next.
Figure 10: Add the TLS configuration to the firewall policy
Add relevant tags by providing a key and a value, and then choose Next.
Review the policy configuration, and choose Create firewall policy.
Associate the policy with your firewall
The final step is to associate this firewall policy, which includes your TLS inspection configuration, with your firewall. This association activates the egress TLS inspection, enforcing your defined rules and criteria on outbound traffic. When the policy is associated, packets from the existing stateful connections that match the TLS scope definition are immediately routed to the decryption engine where they are dropped. This occurs because decryption and encryption can only work for a connection when Network Firewall receives TCP and TLS handshake packets from the start.
Currently, you have an existing policy applied. Let’s briefly review the policy that exists and see how TLS traffic looks prior to applying your configuration. Then you will apply the TLS configuration and look at the difference.
To review the existing policy that doesn’t have TLS configuration
Navigate to VPC > Network Firewall > Firewalls
Choose the existing firewall, as seen in Figure 11.
Figure 11: Select the firewall to edit the policy
In the Firewall Policy section, make sure that your firewall policy is displayed. As shown in the example in Figure 12, the firewall policy DemoFirewallPolicy is applied—this policy doesn’t perform TLS inspection.
Figure 12: Identify the existing firewall policy associated with the firewall
From a test EC2 instance, navigate to an external site that requires TLS encryption. In this example, I use the site example.com. Examine the certificate that was issued. In this example, an external organization issued the certificate (it’s not the certificate that I imported into ACM). You can see this in Figure 13.
Figure 13: View of the certificate before TLS inspection is applied
Returning to the firewall configuration, change the policy to the one that you created with TLS inspection.
To change to the policy with TLS inspection
In the Firewall Policy section, choose Edit.
In the Edit firewall policy section, select the TLS Inspection policy, and then choose Save changes.
Note: It might take a moment for Network Firewall to update the firewall configuration.
Figure 14: Modify the policy applied to the firewall
Return to the test EC2 instance and test the site again. Notice that your customer certificate authority (CA) has issued the certificate. This indicates that the configuration is working as expected and you can see this in Figure 15.
Note: The test EC2 instance must trust the certificate that Network Firewall presents. The method to install the CA certificate on your host devices will vary based on the operating system. For this walkthrough, I installed the CA certificate before testing.
Figure 15: Verify the new certificate used by Network Firewall TLS inspection is seen
Another test that you can do is revoked certificate handling. Example.com provides URLs to sites with revoked or expired certificates that you can use to test.
To test revoked certificate handling
From the command line interface (CLI) of the EC2 instance, do a curl on this page.
Note: The curl -ikv command combines three options:
-i includes the HTTP response headers in the output
-k allows connections to SSL sites without certificates being validated
-v enables verbose mode, which displays detailed information about the request and response, including the full HTTP conversation. This is useful for debugging HTTPS connections.
The output should show that an error 104, Connection reset by peer, was sent.
*   Trying 203.0.113.10:443...
* Connected to revoked-rsa-dv.example.com (203.0.113.10) port 443
* ALPN: curl offers h2,http/1.1
* Cipher selection: ALL:!EXPORT:!EXPORT40:!EXPORT56:!aNULL:!LOW:!RC4:@STRENGTH
* TLSv1.2 (OUT), TLS handshake, Client hello (1):
* TLSv1.2 (IN), TLS handshake, Server hello (2):
* TLSv1.2 (IN), TLS handshake, Certificate (11):
* TLSv1.2 (IN), TLS handshake, Server key exchange (12):
* TLSv1.2 (IN), TLS handshake, Server finished (14):
* TLSv1.2 (OUT), TLS handshake, Client key exchange (16):
* TLSv1.2 (OUT), TLS change cipher, Change cipher spec (1):
* TLSv1.2 (OUT), TLS handshake, Finished (20):
* TLSv1.2 (IN), TLS change cipher, Change cipher spec (1):
* TLSv1.2 (IN), TLS handshake, Finished (20):
* SSL connection using TLSv1.2 / ECDHE-RSA-AES256-GCM-SHA384
* ALPN: server did not agree on a protocol. Uses default.
* Server certificate:
*  subject: CN=revoked-rsa-dv.example.com
*  start date: Feb 20 21:17:23 2024 GMT
*  expire date: Feb 19 21:17:23 2025 GMT
*  issuer: C=US; ST=VA; O=Custom Org; OU=Custom Unit; CN=Custom Intermediate CA; [email protected]
*  SSL certificate verify result: unable to get local issuer certificate (20), continuing anyway.
* using HTTP/1.x
> GET /?_gl=1*guvyqo*_gcl_au*MTczMzQyNzU3OC4xNzA4NTQ5OTgw HTTP/1.1
> Host: revoked-rsa-dv.example.com
> User-Agent: curl/8.3.0
> Accept: */*
>
* Recv failure: Connection reset by peer
* OpenSSL SSL_read: Connection reset by peer, errno 104
* Closing connection
* Send failure: Broken pipe
curl: (56) Recv failure: Connection reset by peer
sh-4.2$
As you configure egress TLS inspection, consider the specific types of traffic and the security requirements of your organization. By tailoring your configuration to these needs, you can help make your network’s security more robust, without adversely affecting performance.
Performance and security considerations for egress TLS inspection
Implementing egress TLS inspection in Network Firewall is an important step in securing your network, but it’s equally important to understand its impact on performance and security. Here are some key considerations:
Balance security and performance – Egress TLS inspection provides enhanced security by allowing you to monitor and control outbound encrypted traffic, but it can introduce additional processing overhead. It’s essential to balance the depth of inspection with the performance requirements of your network. Efficient rule configuration can help minimize performance impacts while still achieving the desired level of security.
Optimize rule sets – The effectiveness of egress TLS inspection largely depends on the rule sets that you configure. It’s important to optimize these rules to target specific security concerns relevant to your outbound traffic. Overly broad or complex rules can lead to unnecessary processing, which might affect network throughput.
Use monitoring and logging – Regular monitoring and logging are vital for maintaining the effectiveness of egress TLS inspection. They help in identifying potential security threats and also provide insights into the impact of TLS inspection on network performance. AWS provides tools and services that you can use to monitor the performance and security of your network firewall.
Considering these factors will help ensure that your use of egress TLS inspection strengthens your network’s security posture and aligns with your organization’s performance needs.
Best practices and recommendations for egress TLS inspection
Implementing egress TLS inspection requires a thoughtful approach. Here are some best practices and recommendations to help you make the most of this feature in Network Firewall:
Prioritize traffic for inspection – You might not need the same level of scrutiny for all your outbound traffic. Prioritize traffic based on sensitivity and risk. For example, traffic to known, trusted destinations might not need as stringent inspection as traffic to unknown or less secure sites.
Use managed rule groups wisely – AWS provides managed rule groups and regularly updates them to address emerging threats. You can use AWS managed rules with TLS decryption; however, the TLS keywords will no longer invoke for traffic that has been decrypted by the firewall, within the stateful inspection engine. You can still benefit from the non-TLS rules within managed rule groups, and gain increased visibility into those rules because the decrypted traffic is visible to the inspection engine. You can also create your own custom rules against the inner protocols that are now available for inspection—for example, matching against an HTTP header within the decrypted HTTPS stream. You can use managed rules to complement your custom rules, contributing to a robust and up-to-date security posture.
Regularly update custom rules – Keep your custom rule sets aligned with the evolving security landscape. Regularly review and update these rules to make sure that they address new threats and do not inadvertently block legitimate traffic.
Test configuration changes – Before you apply new rules or configurations in a production environment, test them in a controlled setting. This practice can help you identify potential issues that could impact network performance or security.
Monitor and analyze traffic patterns – Regular monitoring of outbound traffic patterns can provide valuable insights. Use AWS tools to analyze traffic logs, which can help you fine-tune your TLS inspection settings and rules for optimal performance and security.
Plan for scalability – As your network grows, make sure that your TLS inspection setup can scale accordingly. Consider the impact of increased traffic on performance and adjust your configurations to maintain efficiency.
Train your team – Make sure that your network and security teams are well informed about the TLS inspection process, including its benefits and implications. A well-informed team can better manage and respond to security events.
By following these best practices, you can implement egress TLS inspection in your AWS environment, helping to enhance your network’s security while maintaining performance.
Conclusion
Egress TLS inspection is a critical capability for securing your network by providing increased visibility and control over encrypted outbound traffic. In this post, you learned about the key concepts, configuration steps, performance considerations, and best practices for implementing egress TLS inspection with Network Firewall. By decrypting, inspecting, and re-encrypting selected outbound traffic, you can identify hidden threats and enforce security policies without compromising network efficiency.
Welcome to the 25th edition of the AWS Serverless ICYMI (in case you missed it) quarterly recap. Every quarter, we share all the most recent product launches, feature enhancements, blog posts, webinars, live streams, and other interesting things that you might have missed!
In case you missed our last ICYMI, check out what happened last quarter here.
2024 Q1 calendar
Adobe Summit
At the Adobe Summit, the AWS Serverless Developer Advocacy team showcased a solution developed for the NFL using AWS serverless technologies and Adobe Photoshop APIs. The system automates image processing tasks, including background removal and dynamic resizing, by integrating AWS Step Functions, AWS Lambda, Amazon EventBridge, and AI/ML capabilities via Amazon Rekognition. This solution reduced image processing time from weeks to minutes and saved the NFL significant costs. Combining cloud-based serverless architectures with advanced machine learning and API technologies can optimize digital workflows for cost-effective and agile digital asset management.
Adobe Summit ServerlessVideo
ServerlessVideo is a demo application to stream live videos and also perform advanced post-video processing. It uses several AWS services, including Step Functions, Lambda, EventBridge, Amazon ECS, and Amazon Bedrock in a serverless architecture that makes it fast, flexible, and cost-effective. The team used ServerlessVideo to interview attendees about the conference experience and Adobe and partners about how they use Adobe. Learn more about the project and watch videos from Adobe Summit 2024 at video.serverlessland.com.
AWS Lambda
AWS launched support for the latest long-term support release of .NET 8, which includes API enhancements, improved Native Ahead of Time (Native AOT) support, and improved performance.
The AWS Serverless Java Container has been updated. This makes it easier to modernize a legacy Java application written with frameworks such as Spring, Spring Boot, or JAX-RS/Jersey in Lambda with minimal code changes.
Chaos engineering is a popular practice for building confidence in system resilience. However, many existing tools assume the ability to alter infrastructure configurations, and cannot be easily applied to the serverless application paradigm. You can use the AWS Fault Injection Service (FIS) to automate and manage chaos experiments across different Lambda functions to provide a reusable testing method.
Amazon ECS and AWS Fargate
Amazon Elastic Container Service (Amazon ECS) now provides managed instance draining as a built-in feature of Amazon ECS capacity providers. This allows Amazon ECS to safely and automatically drain tasks from Amazon Elastic Compute Cloud (Amazon EC2) instances that are part of an Amazon EC2 Auto Scaling Group associated with an Amazon ECS capacity provider. This simplification allows you to remove custom lifecycle hooks previously used to drain Amazon EC2 instances. You can now perform infrastructure updates such as rolling out a new version of the ECS agent by seamlessly using Auto Scaling Group instance refresh, with Amazon ECS ensuring workloads are not interrupted.
Credentials Fetcher makes it easier to run containers that depend on Windows authentication when using Amazon EC2. Credentials Fetcher now integrates with Amazon ECS, using either the Amazon EC2 launch type, or AWS Fargate serverless compute launch type.
Amazon ECS Service Connect is a networking capability to simplify service discovery, connectivity, and traffic observability for Amazon ECS. You can now more easily integrate certificate management to encrypt service-to-service communication using Transport Layer Security (TLS). You do not need to modify your application code, add additional network infrastructure, or operate service mesh solutions.
See how to build preview environments for Amazon ECS applications with AWS Copilot. AWS Copilot is an open source command line interface that makes it easier to build, release, and operate production ready containerized applications.
AWS workloads sometimes require access to data stored in on-premises databases and storage locations. Traditional solutions to establish connectivity to the on-premises resources require inbound rules to firewalls, a VPN tunnel, or public endpoints. Discover how to use the MQTT protocol (AWS IoT Core) with AWS Step Functions to dispatch jobs to on-premises workers to access or retrieve data stored on-premises.
You can use Step Functions to orchestrate many business processes. Many industries are required to provide audit trails for decision and transactional systems. Learn how to build a serverless pipeline to create a reliable, performant, traceable, and durable pipeline for audit processing.
Amazon EventBridge
Amazon EventBridge now supports publishing events to AWS AppSync GraphQL APIs as native targets. The new integration allows you to publish events easily to a wider variety of consumers and simplifies updating clients with near real-time data.
Amazon EventBridge publishing events to AWS AppSync
Discover how to send and receive CloudEvents with EventBridge. CloudEvents is an open-source specification for describing event data in a common way. You can publish CloudEvents directly to EventBridge, filter and route them, and use input transformers and API Destinations to send CloudEvents to downstream AWS services and third-party APIs.
AWS Application Composer
AWS Application Composer lets you create infrastructure as code templates by dragging and dropping cards on a virtual canvas. These represent CloudFormation resources, which you can wire together to create permissions and references. Application Composer has now expanded to the VS Code IDE as part of the AWS Toolkit. This now includes a generative AI partner that helps you write infrastructure as code (IaC) for all 1100+ AWS CloudFormation resources that Application Composer now supports.
Visit the Serverless Land YouTube channel to find a list of serverless and serverless container sessions from reinvent 2023. Hear from experts like Chris Munns and Julian Wood in their popular session, Best practices for serverless developers, or Nathan Peck and Jessica Deen in Deploying multi-tenant SaaS applications on Amazon ECS and AWS Fargate.
The Serverless landing page has more information. The Lambda resources page contains case studies, webinars, whitepapers, customer stories, reference architectures, and even more Getting Started tutorials.
You can also follow the Serverless Developer Advocacy team on Twitter to see the latest news, follow conversations, and interact with the team.
At SCALE
this year Dan Schatzberg and Tejun Heo,
both from Meta, gave back-to-back talks about some
of the performance-engineering work that they do there. Schatzberg presented on
the extensible BPF scheduler, which has been
discussed extensively on the kernel mailing list.
Heo presented on IOCost — a control group (cgroup) I/O controller
optimized for solid-state disks (SSDs) — and the benchmark suite that is necessary to
make it work well on different models of disk.
The collective thoughts of the interwebz
Manage Consent
To provide the best experiences, we use technologies like cookies to store and/or access device information. Consenting to these technologies will allow us to process data such as browsing behavior or unique IDs on this site. Not consenting or withdrawing consent, may adversely affect certain features and functions.
Functional
Always active
The technical storage or access is strictly necessary for the legitimate purpose of enabling the use of a specific service explicitly requested by the subscriber or user, or for the sole purpose of carrying out the transmission of a communication over an electronic communications network.
Preferences
The technical storage or access is necessary for the legitimate purpose of storing preferences that are not requested by the subscriber or user.
Statistics
The technical storage or access that is used exclusively for statistical purposes.The technical storage or access that is used exclusively for anonymous statistical purposes. Without a subpoena, voluntary compliance on the part of your Internet Service Provider, or additional records from a third party, information stored or retrieved for this purpose alone cannot usually be used to identify you.
Marketing
The technical storage or access is required to create user profiles to send advertising, or to track the user on a website or across several websites for similar marketing purposes.


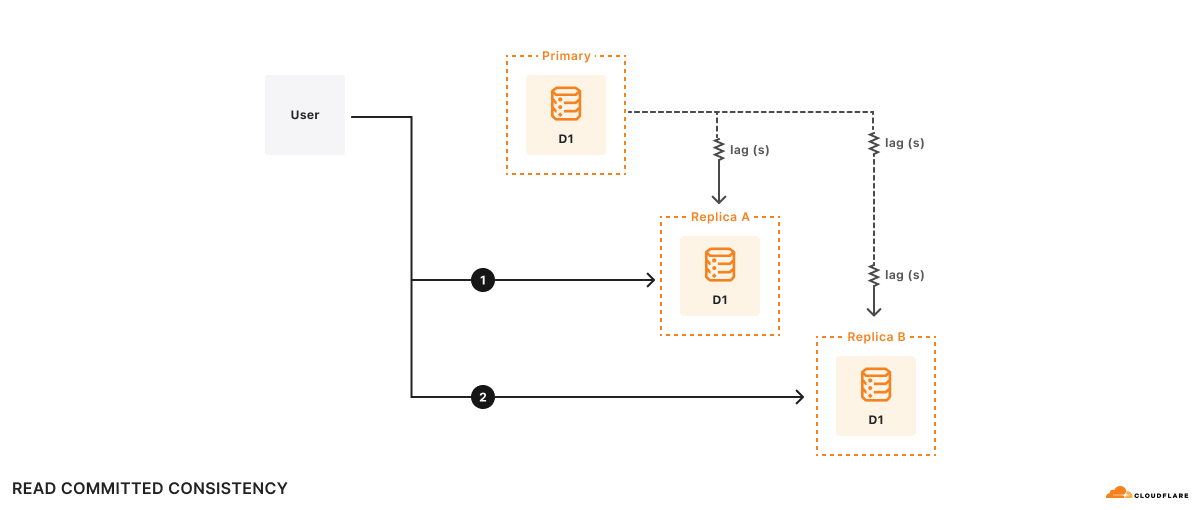


 Ranjit Kalidasan is a Senior Solutions Architect with Amazon Web Services based in Boston, Massachusetts. He is a Partner Solutions Architect helping security ISV partners co-build and co-market solutions with AWS. He brings over 25 years of experience in information technology helping global customers implement complex solutions for security and analytics. You can connect with Ranjit on
  Phaneendra Vuliyaragoli is a Product Management Lead for Amazon Data Firehose at AWS. In this role, Phaneendra leads the product and go-to-market strategy for Amazon Data Firehose.