AI as Sensemaking for Public Comments

Post Syndicated from Bruce Schneier original https://www.schneier.com/blog/archives/2023/06/ai-as-sensemaking-for-public-comments.html

It’s become fashionable to think of artificial intelligence as an inherently dehumanizing technology, a ruthless force of automation that has unleashed legions of virtual skilled laborers in faceless form. But what if AI turns out to be the one tool able to identify what makes your ideas special, recognizing your unique perspective and potential on the issues where it matters most?

You’d be forgiven if you’re distraught about society’s ability to grapple with this new technology. So far, there’s no lack of prognostications about the democratic doom that AI may wreak on the US system of government. There are legitimate reasons to be concerned that AI could spread misinformation, break public comment processes on regulations, inundate legislators with artificial constituent outreach, help to automate corporate lobbying, or even generate laws in a way tailored to benefit narrow interests.

But there are reasons to feel more sanguine as well. Many groups have started demonstrating the potential beneficial uses of AI for governance. A key constructive-use case for AI in democratic processes is to serve as discussion moderator and consensus builder.

To help democracy scale better in the face of growing, increasingly interconnected populations—as well as the wide availability of AI language tools that can generate reams of text at the click of a button—the US will need to leverage AI’s capability to rapidly digest, interpret and summarize this content.

There are two different ways to approach the use of generative AI to improve civic participation and governance. Each is likely to lead to drastically different experience for public policy advocates and other people trying to have their voice heard in a future system where AI chatbots are both the dominant readers and writers of public comment.

For example, consider individual letters to a representative, or comments as part of a regulatory rulemaking process. In both cases, we the people are telling the government what we think and want.

For more than half a century, agencies have been using human power to read through all the comments received, and to generate summaries and responses of their major themes. To be sure, digital technology has helped.

In 2021, the Council of Federal Chief Data Officers recommended modernizing the comment review process by implementing natural language processing tools for removing duplicates and clustering similar comments in processes governmentwide. These tools are simplistic by the standards of 2023 AI. They work by assessing the semantic similarity of comments based on metrics like word frequency (How often did you say “personhood”?) and clustering similar comments and giving reviewers a sense of what topic they relate to.

Think of this approach as collapsing public opinion. They take a big, hairy mass of comments from thousands of people and condense them into a tidy set of essential reading that generally suffices to represent the broad themes of community feedback. This is far easier for a small agency staff or legislative office to handle than it would be for staffers to actually read through that many individual perspectives.

But what’s lost in this collapsing is individuality, personality, and relationships. The reviewer of the condensed comments may miss the personal circumstances that led so many commenters to write in with a common point of view, and may overlook the arguments and anecdotes that might be the most persuasive content of the testimony.

Most importantly, the reviewers may miss out on the opportunity to recognize committed and knowledgeable advocates, whether interest groups or individuals, who could have long-term, productive relationships with the agency.

These drawbacks have real ramifications for the potential efficacy of those thousands of individual messages, undermining what all those people were doing it for. Still, practicality tips the balance toward of some kind of summarization approach. A passionate letter of advocacy doesn’t hold any value if regulators or legislators simply don’t have time to read it.

There is another approach. In addition to collapsing testimony through summarization, government staff can use modern AI techniques to explode it. They can automatically recover and recognize a distinctive argument from one piece of testimony that does not exist in the thousands of other testimonies received. They can discover the kinds of constituent stories and experiences that legislators love to repeat at hearings, town halls and campaign events. This approach can sustain the potential impact of individual public comment to shape legislation even as the volumes of testimony may rise exponentially.

In computing, there is a rich history of that type of automation task in what is called outlier detection. Traditional methods generally involve finding a simple model that explains most of the data in question, like a set of topics that well describe the vast majority of submitted comments. But then they go a step further by isolating those data points that fall outside the mold—comments that don’t use arguments that fit into the neat little clusters.

State-of-the-art AI language models aren’t necessary for identifying outliers in text document data sets, but using them could bring a greater degree of sophistication and flexibility to this procedure. AI language models can be tasked to identify novel perspectives within a large body of text through prompting alone. You simply need to tell the AI to find them.

In the absence of that ability to extract distinctive comments, lawmakers and regulators have no choice but to prioritize on other factors. If there is nothing better, “who donated the most to our campaign” or “which company employs the most of my former staffers” become reasonable metrics for prioritizing public comments. AI can help elected representatives do much better.

If Americans want AI to help revitalize the country’s ailing democracy, they need to think about how to align the incentives of elected leaders with those of individuals. Right now, as much as 90% of constituent communications are mass emails organized by advocacy groups, and they go largely ignored by staffers. People are channeling their passions into a vast digital warehouses where algorithms box up their expressions so they don’t have to be read. As a result, the incentive for citizens and advocacy groups is to fill that box up to the brim, so someone will notice it’s overflowing.

A talented, knowledgeable, engaged citizen should be able to articulate their ideas and share their personal experiences and distinctive points of view in a way that they can be both included with everyone else’s comments where they contribute to summarization and recognized individually among the other comments. An effective comment summarization process would extricate those unique points of view from the pile and put them into lawmakers’ hands.

This essay was written with Nathan Sanders, and previously appeared in the Conversation.

[$] Delegating privilege with BPF tokens

Post Syndicated from original https://lwn.net/Articles/935195/

The quest to enable limited use of BPF features in unprivileged processes
continues. In the previous episode, an
attempt to use authoritative Linux security module (LSM) hooks for this
purpose was strongly rejected by the LSM developers. BPF developer Andrii
Nakryiko has now returned with a new mechanism based on a
privilege-conveying token. That approach, too, has run into some
resistance, but a solution for the strongest concerns might be in sight.

AWS completes Police-Assured Secure Facilities (PASF) audit in Europe (London) Region

Post Syndicated from Vishal Pabari original https://aws.amazon.com/blogs/security/aws-completes-police-assured-secure-facilities-pasf-audit-in-europe-london-region/

We’re excited to announce that our Europe (London) Region has renewed our accreditation for United Kingdom (UK) Police-Assured Secure Facilities (PASF) for Official-Sensitive data. Since 2017, the Amazon Web Services (AWS) Europe (London) Region has been assured under the PASF program. This demonstrates our continuous commitment to adhere to the heightened expectations of customers with UK law enforcement workloads. Our UK law enforcement customers who require PASF can continue to run their applications in the PASF-assured Europe (London) Region in confidence.

The PASF is a long-established assurance process, used by UK law enforcement, as a method for assuring the security of facilities such as data centers or other locations that house critical business applications that process or hold police data. PASF consists of a control set of security requirements, an on-site inspection, and an audit interview with representatives of the facility.

The Police Digital Service (PDS) confirmed the renewal for AWS on May 5, 2023. The UK police force and law enforcement organizations can obtain confirmation of the compliance status of AWS through the Police Digital Service.

To learn more about our compliance and security programs, see AWS Compliance Programs. As always, we value your feedback and questions; reach out to the AWS Compliance team through the Contact Us page.

Please reach out to your AWS account team if you have questions or feedback about PASF compliance.

If you have feedback about this post, submit comments in the Comments section below.

Want more AWS Security news? Follow us on Twitter.

Vishal Pabari

Vishal Pabari

Vishal is a Security Assurance Program Manager at AWS, based in London, UK. Vishal is responsible for third-party and customer audits, attestations, certifications, and assessments across EMEA. Vishal previously worked in risk and control, and technology in the financial services industry.

Security updates for Thursday

Post Syndicated from original https://lwn.net/Articles/935872/

Security updates have been issued by Debian (avahi, hsqldb, hsqldb1.8.0, minidlna, trafficserver, and xmltooling), Oracle (.NET 6.0, .NET 7.0, 18, c-ares, firefox, kernel, less, libtiff, libvirt, python, python3.11, texlive, and thunderbird), Red Hat (c-ares, kernel, kernel-rt, kpatch-patch, less, libtiff, libvirt, openssl, and postgresql), Slackware (bind and kernel), SUSE (bluez, curl, geoipupdate, kernel, netty, netty-tcnative, ntp, open-vm-tools, php8, python-reportlab, rustup, Salt, salt, terraform-provider-aws, terraform-provider-null, and webkit2gtk3), and Ubuntu (bind9, linux-aws, linux-azure, linux-bluefield, linux-gcp, linux-gke,
linux-gkeop, linux-ibm, linux-kvm, linux-oracle, linux-raspi, linux-azure, linux-gcp, linux-ibm, linux-kvm, linux-oracle, and linux-ibm).

Speeding up your (WordPress) website is a few clicks away

Post Syndicated from Alex Krivit original http://blog.cloudflare.com/speeding-up-your-website-in-a-few-clicks/

Speeding up your (WordPress) website is a few clicks away

Speeding up your (WordPress) website is a few clicks away

Every day, website visitors spend far too much time waiting for websites to load in their browsers. This waiting is partially due to browsers not knowing which resources are critically important so they can prioritize them ahead of less-critical resources. In this blog we will outline how millions of websites across the Internet can improve their performance by specifying which critical content loads first with Cloudflare Workers and what Cloudflare will do to make this easier by default in the future.

Popular Content Management Systems (CMS) like WordPress have made attempts to influence website resource priority, for example through techniques like lazy loading images. When done correctly, the results are magical. Performance is optimized between the CMS and browser without needing to implement any changes or coding new prioritization strategies. However, we’ve seen that these default priorities have opportunities to improve greatly.

In this co-authored blog with Google’s Patrick Meenan we will explain where the opportunities exist to improve website performance, how to check if a specific site can improve performance, and provide a small JavaScript snippet which can be used with Cloudflare Workers to do this optimization for you.

What happens when a browser receives the response?

Before we dive into where the opportunities are to improve website performance, let’s take a step back to understand how browsers load website assets by default.

After the browser sends a HTTP request to a server, it receives a HTTP response containing information like status codes, headers, and the requested content. The browser carefully analyzes the response's status code and response headers to ensure proper handling of the content.

Next, the browser processes the content itself. For HTML responses, the browser extracts important information from the <head> section of the HTML, such as the page title, stylesheets, and scripts. Once this information is parsed, the browser moves on to the response <body> which has the actual page content. During this stage, the browser begins to present the webpage to the visitor.

Speeding up your (WordPress) website is a few clicks away

If the response includes additional 3rd party resources like CSS, JavaScript, or other content, the browser may need to fetch and integrate them into the webpage. Typically, browsers like Google Chrome delay loading images until after the resources in the HTML <head> have loaded. This is also known as “blocking” the render of the webpage. However, developers can override this blocking behavior using fetch priority or other methods to boost other content’s priority in the browser. By adjusting an important image's fetch priority, it can be loaded earlier, which can lead to significant improvements in crucial performance metrics like LCP (Largest Contentful Paint).

Images are so central to web pages that they have become an essential element in measuring website performance from Core Web Vitals. LCP measures the time it takes for the largest visible element, often an image, to be fully rendered on the screen. Optimizing the loading of critical images (like LCP images) can greatly enhance performance, improving the overall user experience and page performance.

But here's the challenge – a browser may not know which images are the most important for the visitor experience (like the LCP image) until rendering begins. If the developer can identify the LCP image or critical elements before it reaches the browser, its priority can be increased at the server to boost website performance instead of waiting for the browser to naturally discover the critical images.

In our Smart Hints blog, we describe how Cloudflare will soon be able to automatically prioritize content on behalf of website developers, but what happens if there’s a need to optimize the priority of the images right now? How do you know if a website is in a suboptimal state and what can you do to improve?

Using Cloudflare, developers should be able to improve image performance with heuristics that identify likely-important images before the browser parses them so these images can have increased priority and be loaded sooner.

Identifying Image Priority opportunities

Just increasing the fetch priority of all images won't help if they are lazy-loaded or not critical/LCP images. Lazy-loading is a method that developers use to generally improve the initial load of a webpage if it includes numerous out-of-view elements. For example, on Instagram, when you continually scroll down the application to see more images, it would only make sense to load those images when the user arrives at them otherwise the performance of the page load would be needlessly delayed by the browser eagerly loading these out-of-view images. Instead the highest priority should be given to the LCP image in the viewport to improve performance.

So developers are left in a situation where they need to know which images are on users' screens/viewports to increase their priority and which are off their screens to lazy-load them.

Recently, we’ve seen attempts to influence image priority on behalf of developers. For example, by default, in WordPress 5.5 all images with an IMG tag and aspect ratios were directed to be lazy-loaded. While there are plugins and other methods WordPress developers can use to boost the priority of LCP images, lazy-loading all images in a default manner and not knowing which are LCP images can cause artificial performance delays in website performance (they’re working on this though, and have partially resolved this for block themes).

So how do we identify the LCP image and other critical assets before they get to the browser?

To evaluate the opportunity to improve image performance, we turned to the HTTP Archive. Out of the approximately 22 million desktop pages tested in February 2023, 46% had an LCP element with an IMG tag. Meaning that for page load metrics, LCP had an image included about half the time. Though, among these desktop pages, 8.5 million had the image in the static HTML delivered with the page, indicating a total potential improvement opportunity of approximately 39% of the desktop pages within the dataset.

In the case of mobile pages, out of the ~28.5 million tested, 40% had an LCP element as an IMG tag. Among these mobile pages, 10.3 million had the image in the static HTML delivered with the page, suggesting a potential improvement opportunity in around 36% of the mobile pages within the dataset.

However, as previously discussed, prioritizing an image won't be effective if the image is lazy-loaded because the directives are contradictory. In the dataset,  approximately 1.8 million LCP desktop images and 2.4 million LCP mobile images were lazy-loaded.

Therefore, across the Internet, the opportunity to improve image performance would be about ~30% of pages that have an LCP image in the original HTML markup that weren’t lazy-loaded, but with a more advanced Cloudflare Worker, the additional 9% of lazy-loaded LCP images can also be improved improved by removing the lazy-load attribute.

If you’d like to determine which element on your website serves as the LCP element so you can increase the priority or remove any lazy-loading, you can use browser developer tools, or speed tests like Webpagetest or Cloudflare Observatory.

39% of desktop images seems like a lot of opportunity to improve image performance. So the next question is how can Cloudflare determine the LCP image across our network and automatically prioritize them?

Image Index

We thought that how soon the LCP image showed up in the HTML would serve as a useful indicator. So we analyzed the HTTP Archive dataset to see where the cumulative percentage of LCP images are discovered based on their position in the HTML, including lazy-loaded images.

We found that approximately 25% of the pages had the LCP image as the first image in the HTML (around 10% of all pages). Another 25% had the LCP image as the second image. WordPress seemed to arrive at a similar conclusion and recently released a development to remove the default lazy-load attribute from the first image on block themes, but there are opportunities to go further.

Our analysis revealed that implementing a straightforward rule like "do not lazy-load the first four images," either through the browser, a content management system (CMS), or a Cloudflare Worker could address approximately 75% of the issue of lazy-loading LCP images (example Worker below).

Ignoring small images

In trying to find other ways to identify likely LCP images we next turned to the size of the image. To increase the likelihood of getting the LCP image early in the HTML, we looked into ignoring “small” images as they are unlikely to be big enough to be a LCP element. We explored several sizes and 10,000 pixels (less than 100×100) was a pretty reliable threshold that didn’t skip many LCP images and avoided a good chunk of the non-LCP images.

By ignoring small images (<10,000px), we found that the first image became the LCP image in approximately 30-34% of cases. Adding the second image increased this percentage to 56-60% of pages.

Therefore, to improve image priority, a potential approach could involve assigning a higher priority to the first four "not-small" images.

Chrome 114 Image Prioritization Experiment

An experiment running in Chrome 114 does exactly what we described above. Within the browser there are a few different prioritization knobs to play with that aren’t web-exposed so we have the opportunity to assign a “medium” priority to images that we want to boost automatically (directly controlling priority with “fetch priority” lets you set high or low). This will let us move the images ahead of other images, async scripts and parser-blocking scripts late in the body but still keep the boosted image priority below any high-priority requests, particularly dynamically-injected blocking scripts.

We are experimenting with boosting the priority of varying numbers of images (2, 5 and 10) and with allowing one of those medium-priority images to load at a time during Chromes “tight” mode (when it is loading the render-blocking resources in the head) to increase the likelihood that the LCP image will be available when the first paint is done.

The data is still coming in and no “ship” decisions have been made yet but the early results are very promising, improving the LCP time across the entire web for all arms of the experiment (not by massive amounts but moving the metrics of the whole web is notoriously difficult).

How to use Cloudflare Workers to boost performance

Now that we’ve seen that there is a large opportunity across the Internet for helping prioritize images for performance and how to identify images on individual pages that are likely LCP images, the question becomes, what would the results be of implementing a network-wide rule that could boost image priority from this study?

We built a test worker and deployed it on some WordPress test sites with our friends at Rocket.net, a WordPress hosting platform focused on performance. This worker boosts the priority of the first four images while removing the lazy-load attribute, if present. When deployed we saw good performance results and the expected image prioritization.

export default {
  async fetch(request) {
    const response = await fetch(request);
 
    // Check if the response is HTML
    const contentType = response.headers.get('Content-Type');
    if (!contentType || !contentType.includes('text/html')) {
      return response;
    }
 
    const transformedResponse = transformResponse(response);
 
    // Return the transformed response with streaming enabled
    return transformedResponse;
  },
};
 
async function transformResponse(response) {
  // Create an HTMLRewriter instance and define the image transformation logic
  const rewriter = new HTMLRewriter()
    .on('img', new ImageElementHandler());
 
  const transformedBody = await rewriter.transform(response).text()
 
  const transformresponse = new Response(transformedBody, response)
 
  // Return the transformed response with streaming enabled
  return transformresponse
}
 
class ImageElementHandler {
  constructor() {
    this.imageCount = 0;
    this.processedImages = new Set();
  }
 
  element(element) {
    const imgSrc = element.getAttribute('src');
 
    // Check if the image is small based on Chrome's criteria
    if (imgSrc && this.imageCount < 4 && !this.processedImages.has(imgSrc) && !isImageSmall(element)) {
      element.removeAttribute('loading');
      element.setAttribute('fetchpriority', 'high');
      this.processedImages.add(imgSrc);
      this.imageCount++;
    }
  }
}
 
function isImageSmall(element) {
  // Check if the element has width and height attributes
  const width = element.getAttribute('width');
  const height = element.getAttribute('height');
 
  // If width or height is 0, or width * height < 10000, consider the image as small
  if ((width && parseInt(width, 10) === 0) || (height && parseInt(height, 10) === 0)) {
    return true;
  }
 
  if (width && height) {
    const area = parseInt(width, 10) * parseInt(height, 10);
    if (area < 10000) {
      return true;
    }
  }
 
  return false;
}

When testing the Worker, we saw that default image priority was boosted into “high” for the first four images and the fifth image remained “low.” This resulted in an LCP range of “good” from a speed test. While this initial test is not a dispositive indicator that the Worker will boost performance in every situation, the results are promising and we look forward to continuing to experiment with this idea.

Speeding up your (WordPress) website is a few clicks away

While we’ve experimented with WordPress sites to illustrate the issues and potential performance benefits, this issue is present across the Internet.

Website owners can help us experiment with the Worker above to improve the priority of images on their websites or edit it to be more specific by targeting likely LCP elements. Cloudflare will continue experimenting using a very similar process to understand how to safely implement a network-wide rule to ensure that images are correctly prioritized across the Internet and performance is boosted without the need to configure a specific Worker.

Automatic Platform OptimizationBut what about APO?

Cloudflare’s Automatic Platform Optimization (APO) is a plugin for WordPress which allows Cloudflare to deliver your entire WordPress site from our network ensuring consistent, fast performance for visitors. By serving cached sites, APO can improve performance metrics. APO does not currently have a way to prioritize images over other assets to improve browser render metrics or dynamically rewrite HTML, techniques we’ve discussed in this post. Although this presents a potential opportunity for future development, it requires thorough testing to ensure safe and reliable support.

In the future we’ll may look to include the techniques discussed today as part of APO, however in the meantime we recommend using Snippets (and Experiments) to test with the code example above to see the performance impact on your website.

Get in touch!

If you are interested in using the JavaScript above, we recommended testing with Workers or using Cloudflare Snippets. We’d love to hear from you on what your results were. Get in touch via social media and share your experiences.

Descale your network with Cloudflare’s enhanced Descaler Program

Post Syndicated from Corey Mahan original http://blog.cloudflare.com/descaler-program-update/

Descale your network with Cloudflare’s enhanced Descaler Program

Descale your network with Cloudflare’s enhanced Descaler Program

Speed matters, especially when it comes to exiting a slower service and transitioning to a new one. Back in March, 2023, we announced the Descaler Program, a frictionless path to migrate existing Zscaler customers to Cloudflare One. This program makes it easy for customers to make the switch to a faster, simpler, and more agile foundation for security and network transformation with Cloudflare.

Through repeated engagements with customers of all sizes, we've improved the Descaler tooling to allow Zscaler to Cloudflare configuration migrations to be completed in hours, not days. This accelerated transition has helped organizations meet migration deadlines and eliminate countless hours of manual migration effort without skipping a beat. Today we’re excited to share more stories from customers and the amount of time it took them to ‘descale’.

Cloudflare One and the Descaler Program

As a quick recap, Cloudflare One is our Secure Access Service Edge (SASE) platform that combines network connectivity services with Zero Trust security services on one of the fastest, most resilient and most composable global networks. The platform dynamically connects users to enterprise resources, with identity-based security controls delivered close to users, wherever they are.

At its core, the Descaler Program helps derisk change. It’s designed to be simple and straightforward, with resources to ensure a smooth transition and supporting technology to ensure the migration achieves your organization's goals. The magic of this process is in the technology and its simplicity. Following extract, transform, and load best practices, using supported and documented API calls to your current account, the Descaler toolkit will export your current configuration and settings and transform them to be Cloudflare One-compatible before migrating into a new Cloudflare One account.

A question almost every customer asked was “so, how long is this going to take?”. The answer? As soon as you can meet with the Cloudflare team.

Migrate in minutes, not months

The speed at which customers are able to move from Zscaler ZIA to Cloudflare Gateway continually gets faster. As the title of this blog post implies, it usually takes more time to set up a meeting with the right technical administrators than to migrate settings, configurations, lists, policies and more to Cloudflare. We’ve seen this time continue to get faster through Descaler engagements. But it wasn’t this way from the onset. To be the fastest at everything we do, it means iterating and learning from customers to find the best solution possible. Here are three customer stories of doing just that.

Customer migration time: seven days | “Is there a summary available?”

A UK ecommerce giant with 7,500 employees sought a solution that could provide them with faster, safer access to corporate resources and SaaS apps while eliminating the exorbitant costs associated with Zscaler. With Descaler, they achieved this goal in just one week. Our streamlined migration process ensured minimal disruption to their operations, empowering them to seamlessly transition to Cloudflare One before a tight renewal deadline. By reducing the time and cost involved in the migration, they were able to focus on what matters most—driving their business forward.

To better communicate what is available to be moved into Cloudflare Gateway, the team was curious on what objects they had active in their account in a simplified view. Based on this feedback, the Cloudflare team added the option for the Descaler tool to provide a summary of what will be moved to Cloudflare, as shown below.

Descale your network with Cloudflare’s enhanced Descaler Program
Sample Descaler summary output

Customer migration time: two days | Lots and lots of lists

For a US-based Fortune 100 oil and gas company with nearly 20,000 employees, the key priority was to streamline their application, network, and security services. With Descaler, they were able to move over more of their security service and achieved this objective in just under two days. Cloudflare’s intuitive dashboard provided them with a single pane of glass to manage all their services efficiently, simplifying their operations and enhancing their overall productivity. The speed at which Descaler facilitated their migration allowed them to seamlessly consolidate their services, unlocking new levels of efficiency and cost savings.

The team had also put a significant amount of effort into curating lists of IP addresses, hostnames, and URLs of sites and services used in their filtering policies. These thousands of items were transformed and loaded into their new Cloudflare production account almost instantly. With some minor testing, they were able to save hours of copying and retain their security intelligence.

Customer migration time: 24 hours | “What about Terraform?”

Recently a prominent Australian based telecommunications company that owns one of the countries largest fiber networks prioritized employee Internet security and the prevention of malware attacks. Descaler played a crucial role in their quest to protect users and block malware, with a configuration migration time of less than 24 hours. By migrating to Cloudflare One, they ensured their employees had access to robust security features and comprehensive protection, bolstering their defense against potential threats.

Having Terraform output was table stakes for this organization and many others the team interacted with. Terraform is a tool for building, changing, and versioning infrastructure, and provides components and documentation for building Cloudflare resources. Without the ability to manage their Cloudflare configuration as infrastructure-as-code, it meant breaking their normal workflows. From this feedback the Descaler team added the option to export the configuration in a shareable Terraform file which was then shared with the customer.

Descale your network with Cloudflare’s enhanced Descaler Program

How to get started

Migration times are still getting faster and the overall process even smoother due to iterations like the ones mentioned above. We’re excited to invite new customers to take advantage of the program by signing up using the link below. From there, the Cloudflare team will reach out to you with further enrollment details.

With the Descaler Program we’re excited to offer a clear path for customers to make the switch to Cloudflare One. To get started, sign up here.

Descale your network with Cloudflare’s enhanced Descaler Program

Understanding end user-connectivity and performance with Digital Experience Monitoring, now available in beta

Post Syndicated from Shruti Pokalori Nejad original http://blog.cloudflare.com/digital-experience-monitoring-beta/

Understanding end user-connectivity and performance with Digital Experience Monitoring, now available in beta

Understanding end user-connectivity and performance with Digital Experience Monitoring, now available in beta

Organizations that replace their corporate network and security appliances with a cloud-based solution trust that provider with how their employees work each and every day. Cloudflare One, our comprehensive Secure Access Service Edge (SASE) offering, helps more than 10,000 organizations deploy a remote access and Internet security solution that is faster than industry competitors. Starting today, administrators can measure that experience on their own and hold us accountable to that standard.

Cloudflare’s Digital Experience Monitoring (DEX) product gives teams of any size the same toolkit that we use to measure our own global network that powers nearly one-fourth of the Internet each day. Customers of Cloudflare One can now measure the experience that their team members have connecting to the Internet – whether they need that data for troubleshooting, evaluating carrier and ISP performance, or just understanding how their employees work.

We are excited to share today that DEX is now in open beta for all Cloudflare One customers. Administrators can begin running tests and evaluating network performance with any device enrolled using the Cloudflare One agent. Today’s announcement opens up these tools to every customer, but we are just getting started – we want your feedback to help us continue to improve the experience as we build more observability into Cloudflare’s SASE solution.

Monitor performance & availability of public or private applications with Synthetic Application Monitoring

Picture this: you're at the helm of a diverse team, using Google Mail as their main communication hub. When everyone worked from the same office, spotting a slowdown with Google Mail or its provider was relatively straightforward. But in today's remote environment, ensuring the consistent performance of such a critical resource can become a labyrinthine task.

Synthetic Application Monitoring shines a light through this maze. With the ability to schedule HTTP GET tests that target Gmail at specified intervals, you're not merely monitoring performance — you're safeguarding your team's access to crucial communication lines, irrespective of their global locations.

Understanding end user-connectivity and performance with Digital Experience Monitoring, now available in beta

What sets Synthetic Application Monitoring apart isn't just its user-friendly setup, but the powerful insights derived from Cloudflare's extensive network. With our network's global reach, you can track response time averages from various locations, painting a realistic picture of your application's performance as experienced by your users worldwide.

Understanding end user-connectivity and performance with Digital Experience Monitoring, now available in beta

Test results visualize resource fetch times, exemplifying the unique strengths of Cloudflare's expansive network. The HTTP GET tests harness the speed and reliability of the nearest data center in our network, providing an accurate reflection of your users' experiences. This graph translates raw data into an easy-to-read timeline, helping you identify trends, spot anomalies, and optimize application performance using the insights garnered.

Understanding end user-connectivity and performance with Digital Experience Monitoring, now available in beta

With DEX, you get a reliable and precise view of server and DNS response times from around the world. The time series format allows you to spot trends, identify peak periods, and pinpoint potential issues with ease. This isn't just data—it's actionable intelligence that helps you optimize server configurations, DNS settings, and ultimately, your users' digital experience. Essentially, these charts are more than visual aids; they are strategic tools, using Cloudflare's network to enhance your application's performance management.

Understanding end user-connectivity and performance with Digital Experience Monitoring, now available in beta

The time series chart depicting HTTP status codes is another powerful tool in the DEX arsenal. Drawing from the wealth of data traversing our globally distributed network, it lets you quickly visualize the frequency of each status code over time. This granular perspective allows you to detect and investigate anomalies, such as a sudden surge of client or server errors. By making HTTP status codes more comprehensible, it equips you to swiftly identify and troubleshoot potential issues that can impact user experience.

Synthetic Application Monitoring is more than a product; it's a strategic ally that harnesses the might of Cloudflare's network, ensuring your applications deliver the reliable, high-quality experience your users expect and deserve.

Understand the state of WARP-enrolled devices with Fleet Status

Zero Trust solutions replace legacy private networks with a model that assumes all connection attempts are suspicious. A Zero Trust network denies access attempts by default and forces every connection or request to prove that access should be granted.

A large component of proof is the identity of the end user, but the device itself also provides a signal about access rights. Whether the device is managed by the enterprise, healthy and patched, or assigned to a given user can determine permissions within Cloudflare One. For customers who rely on Cloudflare One to give their users a secure path to the rest of the Internet, the device also becomes an on-ramp for those team members connecting through Cloudflare.

We kept hearing from customers who wanted to better understand their device fleet using the data that Cloudflare could gather.

As part of today’s launch, we are introducing Fleet Status. Fleet Status provides real-time insights into the status of all of your client devices’ connection, mode, and location on both a global and per-device basis. This is achieved via Cloudflare WARP. Cloudflare WARP is a client which allows companies to protect corporate devices by securely and privately sending traffic from those devices to Cloudflare’s global network, where Cloudflare Gateway can apply advanced web filtering. The WARP client also makes it possible to apply advanced Zero Trust policies that check for a device’s health before it connects to corporate applications.

Understanding end user-connectivity and performance with Digital Experience Monitoring, now available in beta

Fleet Status, with its data visualizations, detailed per-device views, and time-series charts, transforms the way administrators understand their deployment. Picture a network administrator who oversees a fleet of WARP-enrolled devices scattered worldwide, each contributing to the organization's vital operations. Suddenly, an issue arises. A group of devices in a specific location is unexpectedly disconnecting or changing connection methods.

Understanding end user-connectivity and performance with Digital Experience Monitoring, now available in beta

With traditional methods, identifying the issue itself would be a time-consuming endeavor. However, Fleet Status enables real-time insights to be at the administrator's fingertips, quickly providing a global snapshot of devices, highlighting the ones experiencing anomalies.

The per-device view allows further investigation into these specific devices, presenting granular details like device location, client platform, version, client connection state, and connection methods. Meanwhile, time-series charts plot data over time, helping to identify if the disconnects or changes are an anomaly or a part of a recurring pattern.

Armed with these insights, the administrator can work proactively to ensure connectivity issues are addressed, leading to minimal disruption and maximum productivity. Fleet Status isn't just about presenting data; it's about empowering administrators with actionable insights when they need them most.

What’s next

Our journey doesn't end here. As we continue to build DEX, we are committed to adding more visibility and refining test customization. These enhancements will equip you with the resources to proactively troubleshoot issues and understand your Zero Trust Deployment.

Getting started with DEX is a breeze. If you're an existing Cloudflare One user, simply log in to your dashboard and navigate to the DEX beta section – no activation needed. We can’t wait for you to build tests and start leveraging DEX’s insights immediately!

If you're new to Cloudflare One, we've got you covered. Sign up for our free plan, which provides DEX for up to 50 users at no cost. For our Enterprise Plan users, ten synthetic application tests are part of your package. If you're on any other plan, you can create up to five tests.

We also need your feedback. Want to tell us more about what you would like to see next? Let us know at this form or this community forum post.

Benchmarking dashboard performance

Post Syndicated from Richard Nguyen original http://blog.cloudflare.com/benchmarking-dashboard-performance/

Benchmarking dashboard performance

Benchmarking dashboard performance

In preparation of Cloudflare Speed Week 2023, we spent the last few weeks benchmarking the performance of a Cloudflare product that has gone through many transformations throughout the years: the Cloudflare dashboard itself!

Limitations and scope

Optimizing for user-experience is vital to the long-term success of both Cloudflare and our customers. Reliability and availability of the dashboard are also important, since millions of customers depend on our services every day. To avoid any potential service interruptions while we made changes to the application’s architecture, we decided to gradually roll out the improvements, starting with the login page.

As a global company, we strive to deliver the best experience to all of our customers around the world. While we were aware that performance was regional, with regions furthest from our core data centers experiencing up to 10 times longer loading speeds, we wanted to focus on improvements that would benefit all of our users, no matter where they geographically connect to the Dashboard.

Finally, throughout this exercise, it was important to keep in mind that our overall goal was to improve the user experience of the dashboard, with regards to loading performance. We chose to use a Lighthouse Performance score as a metric to measure performance, but we were careful to not set a target score. Once a measure becomes a target, it ceases to be a good measure.

Initial Benchmarks

Using a combination of open-source tools offered by Google (Lighthouse and PageSpeed Insights) and our own homegrown solution (Cloudflare Speed Test), we benchmarked our Lighthouse performance scores starting in Q1 2023. We found the results were… somewhat disappointing:

  • Although the site’s initial render occurred quickly (200ms), it took more than two seconds for the site to finish loading and be fully interactive.
  • In that time, the page was blocked for more than 500ms while the browser executed long JavaScript tasks.
  • Over half of the JavaScript served for the login page was not necessary to render the login page itself.
Benchmarking dashboard performance

Improving what we've measured

The Cloudflare dashboard is a single page application that houses all of the UI for our wide portfolio of existing products, as well as the new features we're releasing every day. However, a less-than-performant experience is not acceptable to us; we owe it to our customers to deliver the best performance possible.

So what did we do?

Shipped less JavaScript

As obvious as it sounds, shipping less code to the user means they have to download fewer resources to load the application. In practice however, accomplishing this was harder than expected, especially for a five year old monolithic application.

We identified some of our largest dependencies with multiple versions, like lodash and our icon library, and deduped them. Bloated packages like the datacenter colo catalogs were refactored and drastically slimmed down. Packages containing unused code like development-only components, deprecated translations, and old Cloudflare Access UI components were removed entirely.

The result was a reduction in total assets being served to the user, going from 10MB (2.7MB gzipped) to 6.5MB (1.7MB gzipped). Lighthouse performance score improved to about 70. This was a good first step, but we could do better.

Identified and code split top-level boundaries

Code splitting is the process in which the application code is split into multiple bundles to be loaded on demand, reducing the initial amount of JavaScript a user downloads on page load. After logging in, as users navigate from account-level products like Workers and Pages, and then into specific zone-level products, like Page Shield for their domain, only the code necessary to render that particular page gets loaded dynamically.

Although most of the account-level and zone-level pages of the dashboard were properly code-split, the root application that imported these pages was not. It contained all of the code to bootstrap the application for both authenticated and unauthenticated users. This wasn’t a great experience for users who weren't even logged in yet, and we wanted to allow them to get into the main dashboard as quickly as possible.

So we split our monolithic application into two sub-applications: an authenticated and unauthenticated application. At a high level, on entrypoint initialization, we simply make an API request to check the user’s authentication state and dynamically load one sub-application or the other.

import React from 'react';
import { useAuth } from './useAuth';
const AuthenticatedAppLoadable = React.lazy(
  () => import('./AuthenticatedApp')
);
const UnauthenticatedAppLoadable = React.lazy(
  () => import('./UnauthenticatedApp')
);

// Fetch user auth state here and return user if logged in
// Render AuthenticatedApp or UnauthenticatedApp based on user
const Root: React.FC = () => {
  const { user } = useAuth();
  return user ? <AuthenticatedAppLoadable /> : <UnauthenticatedAppLoadable />;
};

That’s it! If a user is not logged in, we ship them a small bundle that only contains code necessary to render parts of the application related to login and signup, as well as a few global components. Code related to billing, account-level and zone-level products, sidebar navigation, and user profile settings are all bundled into a separate sub-application that only gets loaded once a user logs in.

Again, we saw significant improvements, especially to Largest Contentful Paint, pushing our performance scores to about 80. However, we ran a Chrome performance profile, and on closer inspection of the longest blocking task we noticed that there was still unnecessary code being parsed and evaluated, even though we never used it. For example, code for sidebar navigation was still loaded for unauthenticated users who never actually saw that component.

Benchmarking dashboard performance

Optimized dead-code elimination

It turned out that our configuration for dead-code elimination was not optimized. Dead-code elimination, or “tree-shaking”, is the process in which your JavaScript transpiler automatically removes unused module imports from the final bundle. Although most modern transpilers have that setting on by default today, optimizing dead-code elimination for an existing application as old as the Cloudflare dashboard is not as straightforward.

We had to go through each individual JavaScript import to identify modules that didn’t produce side-effects so they could be marked by the transpiler to be removed. We were able to optimize “tree-shaking” for the majority of the modules, but this will be an ongoing process as we make more performance improvements.

Key results

Although the performance of the dashboard is not yet where we want it to be, we were still able to roll out significant improvements for the majority of our users. The table below shows the performance benchmarks for US users hitting the login page for the first time before and after the performance improvements.

Desktop

Benchmarking dashboard performance

Mobile

Benchmarking dashboard performance

What’s next

Overall, we were able to get some quick wins, but we’re still not done! This is just the first step in our mission to continually improve performance for all of our dashboard users. Here’s a look at some next steps that we will be experimenting with and testing in the coming months: decoupling signup pages from the main application, redesigning SSO login experience, exploring microfrontends and edge-side rendering.

In the meantime, check out Cloudflare Speed Test to generate a performance report and receive recommendations on how to improve the performance of your site today.

Network performance update: Speed Week 2023

Post Syndicated from Onur Karaagaoglu original http://blog.cloudflare.com/speed-week-2023-network-performance-update/

Network performance update: Speed Week 2023

Network performance update: Speed Week 2023

We constantly measure our own and other networks' performance, and look for ways to improve our performance; and share our results.

In this post we are going to share the most recent updates, and tell you about our tools and processes that we use to monitor and improve our network performance.

First, the results

In July, 2022, we started taking a more granular look down to every single network and taking actions for the specific networks where we have some room for improvement. Cloudflare was already the fastest provider for most of the networks around the world (we define a network as country and AS number pair). Taking a closer look at the numbers, Cloudflare was ranked #1 in 33% of the networks and was within 2 ms or 5% of the #1 provider for 8% of the networks that we measured in terms of the 95th percentile TCP Connection Time. For reference, our closest competitor on that front was the fastest for 20% of networks.

As of May 31, 2023 those numbers have improved significantly. Today, Cloudflare is the fastest provider for 46% of networks—and was within 2 ms (95th percentile TCP Connection Time) or 5% of the fastest provider for 10% of the networks that we measured—whereas our closest competitor is now the fastest for 18% of networks.

Below is the change in percentage of networks that each provider is the fastest over time for Cloudflare and other services.

Network performance update: Speed Week 2023

Our tooling and process

We use Real User Measurements (RUM) and fetch a small file from Cloudflare, Akamai, CloudFront, Fastly and Google Cloud CDN. Browsers around the world report the performance of those providers from the perspective of the end-user network they are on. The goal is to provide an accurate picture of where different providers are faster, and more importantly, where Cloudflare can improve. You can read more about the methodology in the original Speed Week blog post here.

Using the RUM data, we are able to measure various performance metrics, such as TCP Connection Time, Time to First Byte (TTFB), Time to Last Byte (TTLB), for ourselves and other networks.

One of the most important tools that we use for measuring and improving our performance is what we call Performance Benchmarks Dashboard. That's the dashboard where we can analyze the data that we collect in different dimensions.

Here are the metrics that we monitor based on some of the dimensions.

The first metric we closely monitor is the percent of networks that we are ranked #1 in terms of TCP Connection Time. That's a key performance indicator that we evaluate ourselves against.

Network performance update: Speed Week 2023

The second metric we monitor is our overall performance in each country. This gives us visibility into the countries or regions that we need to pay closer attention to and take action towards improving our performance. Those actions will be listed later. Orange indicates the countries that Cloudflare is the fastest provider based on the TCP Connection Time.

Network performance update: Speed Week 2023

The third set of metrics we use are TCP Connection Time and TTLB. The number of networks where we are #1 in terms of 95th percentile TCP Connection Time is one of our key performance indicators. We actively monitor and work on improving that metric. More on that later.

Network performance update: Speed Week 2023

Using all the metrics listed above, the Performance Benchmarks Dashboard helps us to find networks where we can improve our performance. Our engineering teams monitor that dashboard and investigate the underlying reasons for degraded performance if there are any and the action items are displayed on the dashboard until they are resolved.

Network performance update: Speed Week 2023

Once we identify a particular network to improve, we investigate the root cause and document the action items to improve our performance. Those actions generally fall under three categories.

The first category is establishing peering with that network in a specific location so that users can take the optimum path. That’s a critical component of a better Internet! Here is our more detailed blog post about that from earlier this week.

The second category is expanding our compute capacity in a specific data center so that we can serve the users at the closest data center.

And finally, we apply traffic engineering actions to make sure that the network is served in the optimum way. Traffic engineering actions are generally manual configurations that we apply, in case the path that’s chosen by the routing protocols is not the most performant path.

What’s next

The data we collect gives us a granular view of every network that connects to Cloudflare and we constantly optimize our infrastructure to improve Cloudflare’s performance. We won’t rest until we’re #1 everywhere.

How we think about Zero Trust Performance

Post Syndicated from David Tuber original http://blog.cloudflare.com/how-we-think-about-zero-trust-performance/

How we think about Zero Trust Performance

How we think about Zero Trust Performance

Cloudflare has done several deep dives into Zero Trust performance in 2023 alone: one in January, one in March, and one for Speed Week. In each of them, we outline a series of tests we perform and then show that we’re the fastest. While some may think that this is a marketing stunt, it’s not: the tests we devised aren’t necessarily built to make us look the best, our network makes us look the best when we run the tests.

We’ve discussed why performance matters in our blogs before, but the short version is that poor performance is a threat vector: the last thing we want is for your users to turn off Zero Trust to get an experience that is usable for them. Our goal is to improve performance because it helps improve the security of your users, the security of the things that matter most to you, and enables your users to be more productive.

When we run Zero Trust performance tests, we start by measuring end-to-end latency from when a user sends a packet to when the Zero Trust proxy receives, forwards, and inspects the packet, to when the destination website processes the packet and all the way back to the user. This number, called HTTP Response, is often used in Application Services tests to measure the performance of CDNs. We use this to measure our Zero Trust services as well, but it’s not the only way to measure performance. Zscaler measures their performance through something called proxy latency, while Netskope measures theirs through a decrypted latency SLA. Some providers don’t think about performance at all!

There are many ways to view network performance. However, at Cloudflare we believe the best way to measure performance is to use end-to-end HTTP response measurements. In this blog, we’re going to talk about why end-to-end performance is the most important thing to look at, why other methods like proxy latency and decrypted latency SLAs are insufficient for performance evaluations, and how you can measure your Zero Trust performance like we do.

Let’s start at the very beginning

When evaluating performance for any scenario, the most important thing to consider is what exactly you’re supposed to be measuring. This may seem obvious, but oftentimes the things we’re evaluating don’t do a great job of actually measuring the impact users see. A great example of this is when users look at network speed tests: measuring bandwidth doesn’t accurately measure how fast your Internet connection is.

So we must ask ourselves a fundamental question: how do users interact with Zero Trust products? The answer is they shouldn’t: or they shouldn’t know they’re interacting with Zero Trust services. Users actually interact with websites and applications hosted somewhere on the Internet: maybe they’re interacting with a private instance of Microsoft Exchange, or maybe they’re accessing Salesforce in the cloud. In any case, the Zero Trust services that sit in between serve as a forward proxy: they receive the packets from the user, filter for security and access evaluations, and then send the packets along to their destination. If the services are doing their job correctly, users won’t notice their presence at all.

So when we look at Zero Trust services, we have to look at scenarios where transparency becomes opacity: when the Zero Trust services reveal themselves and result in high latency, or even application failures. In order to simulate these scenarios, we have to access sites users would access on a regular basis. If we simulate accessing those websites through a Zero Trust platform, we can look at what happens when Zero Trust is present in the request path.

Fortunately for us, we know exactly how to simulate user requests hitting websites. We have a lot of experience measuring performance for our Developer Platform, and for our Network Benchmarking analysis. By framing Zero Trust performance in the context of our other performance analysis initiatives, it’s easy to make performance better and ensure that all of our efforts are focused on making the most people as fast as possible. Just like our analyses of other Cloudflare products, this approach puts customers and users first and ensures they get the best performance.

Challenges of the open Internet

Zero Trust services naturally come at a disadvantage when it comes to performance: they automatically add an additional network hop between users and the services they’re trying to access. That’s because a forward proxy sits between the user and the public Internet to filter and protect traffic. This means that the Zero Trust service needs to maintain connectivity with end-user ISPs, maintain connectivity with cloud providers, and transit networks that connect services that send and receive most public Internet traffic. This is generally done through peering and interconnectivity relationships. In addition to maintaining all of that connectivity, there’s also the time it takes for the service to actually process rules and packet inspections. Given all of these challenges, performance management in this scenario is complex.

Some providers try to circumvent this by scoping performance down. This is essentially what Zscaler’s proxy latency and Netskope’s decrypted latency are: an attempt to remove parts of the network path that are difficult to control and only focus on the aspects of a request they can control. To be more specific, these latencies only focus on the time that a request spends on Zscaler’s or Netskope’s physical hardware. The upside of this is that it allows these providers to make some amount of guarantee in regards to latency. This line of thinking traditionally comes from trying to replace hardware firewalls and CASB services that may not process requests inline. Zscaler and Netskope are trying to prove that they can process rules and actions inline with a request and still be performant.

But as we showed with our blog back in January, the time spent on a machine in a Zero Trust network is only a small portion of the request time experienced by the end user. The majority of a requests’ time is spent on the wire between machines. When you look at performance, you need to look at it holistically and not at a single element, like on-box processing latency. So by scoping performance down to only looking at on-box processing latencies, you’re not actually looking at anything close to the full picture of performance. To be fast, providers need to look at every aspect of the network and how they function. So let’s talk about all the elements needed to make zero trust service performance better.

How do you get better Zero Trust performance?

A good way to think of Zero Trust performance is like driving on a highway. If you’re hungry and need to eat, you want to go to a place that’s close to the highway and fast. If a restaurant that serves burgers in one second is 15 minutes out of the way, it doesn’t matter how fast they serve the burgers: the time it takes to get to that restaurant isn’t worth the trip. A McDonald’s at a rest stop may take the same amount of time as the other restaurant, but is faster end-to-end. The restaurant you pick should be close to the highway AND serve food fast. Only looking at one of the two will impact your overall time if the other aspect is slow.

Based on this analogy, in addition to having good processing times, the best ways to improve  Zero Trust performance are to be well peered on the last mile, be well peered with networks that host important applications, and have diverse paths on the Internet to steer traffic around should things go wrong. Let’s go over each of those and why they’re important.

Last mile peering

We’ve talked before about how getting closer to users is critical to increase performance, but here’s a quick summary: Having a Zero Trust provider that receives your packets physically close to you straightens the path your packets take between your device and what applications you’re trying to access. Because Zero Trust networking will always incur an additional hop, if that hop is inline with the path your requests to your website would normally take, the overhead your Zero Trust network incurs is minimal.

How we think about Zero Trust Performance

In the diagram above, you can see three connectivity models: one from a user straight to a website, one going through a generic forward proxy, and one going through Cloudflare. The length of each line is representative of the point to point latency. Based on that, you can see that the forward proxy path is longer because the two segments add up to be longer than the direct connection is. This additional travel path is referred to as a hairpin in the networking world. The goal is to keep the line between user and website as straight as possible, because that’s the shortest distance between the two.

The closer your Zero Trust provider is to you, the easier keeping the path small is to achieve. This challenge is something we’re really good at, as we’re always investing to get closer to users no matter where they are by leveraging our over 12,000 peered networks.

Cloud peering

But getting close to users is only half the battle. Once the traffic is on the Zero Trust network, it needs to be delivered to the destination. Oftentimes, those destinations are hosted in hyperscale cloud providers like Azure, Amazon Web Services, or Google Cloud. These hyperscalers are global networks with hundreds of locations for users to store data and host services. If a Zero Trust network is not well peered with all of these networks in all of the places they offer compute, that straight path starts to diverge: less than it would on the last mile, but still enough to be noticeable by end-users.

Cloudflare helps out here by being peered with these major cloud providers where they are, ensuring that the handoff between Cloudflare and the respective cloud is short and seamless. Cloudflare has peering with the major cloud providers in over 40 different metros around the world, ensuring that wherever applications may be hosted, Cloudflare is there to connect to them.

Alternative paths for everything in between

If a Zero Trust network has good connectivity on the last mile and good connectivity to the clouds, the only thing left is being able to pass traffic between the two. Having diverse network paths within the Zero Trust network is incredibly valuable for being able to shift traffic around networking issues and provide private connectivity on the Zero Trust network that is reliable and performant. Cloudflare leverages our own private backbone for this purpose, and that backbone is what helps us deliver next-level performance for all scenario types.

Getting the measurements that matter

So now that we know what scenarios we’re trying to measure and how to make them faster, how are we measuring them? The answer is elegantly simple: we make HTTP calls through our Zero Trust services and measure the Response times. When we perform our Gateway tests, we configure a client program that periodically connects to a bunch of websites commonly used by enterprises through our Zero Trust client and measure the HTTP timings to calculate HTTP response.

As we discussed before, Response is the time it takes for a user to send a packet to the Zero Trust proxy which receives, forwards, and inspects the packet, then sends it to the destination website which processes the packet and returns a response all the way back to the user. This measurement is valuable because it allows us to focus specifically on network performance and not necessarily the ability of a web application to load and render content. We don’t measure things like Largest Contentful Paint because those have dependencies on the software stack on the destination, whether the destination is fronted by a CDN and how their performance is, or even the browser making the request. We want to measure how well the Zero Trust service can deliver packets from a device to a website and back. Our current measurement methodology is focused on the time to deliver a response to the client and ignores some client side processing like browser render time (Largest Contentful Paint) and application specific metrics like UDP Video delivery.

You can do it too

Measuring performance may seem complicated, but at Cloudflare we’re trying to make it easy. Your goals of measuring user experience and our goals of providing a faster experience are perfectly aligned, and the tools we build to view performance are not only user-facing but are used internally for performance improvements. We purpose-built our Digital Experience Monitoring product to not just show where things are going wrong, but to monitor your Zero Trust performance so that you can track your user experience right alongside us. We use this data to help identify regressions and issues on our network to help ensure that you are having a good experience. With DEX, you can make tests to measure endpoints you care about just like we do in our tests, and you can see the results for HTTP Response in the Cloudflare dashboard. And the more tests you make and better visibility you get into your experience, the more you’re helping us better see Zero Trust experiences across our network and the broader Internet.

Just like everything else at Cloudflare, our performance measurements are designed with users in mind. When we measure these numbers and investigate them, we know that by making these numbers look better, we’ll improve the end-to-end experience for Zero Trust users.

Globally distributed AI and a Constellation update

Post Syndicated from Rita Kozlov original http://blog.cloudflare.com/globally-distributed-ai-and-a-constellation-update/

Globally distributed AI and a Constellation update

Globally distributed AI and a Constellation update

During Cloudflare's 2023 Developer Week, we announced Constellation, a set of APIs that allow everyone to run fast, low-latency inference tasks using pre-trained machine learning/AI models, directly on Cloudflare’s network.

Constellation update

We now have a few thousand accounts onboarded in the Constellation private beta and have been listening to our customer's feedback to evolve and improve the platform. Today, one month after the announcement, we are upgrading Constellation with three new features:

Bigger models
We are increasing the size limit of your models from 10 MB to 50 MB. While still somewhat conservative during the private beta, this new limit opens doors to more pre-trained and optimized models you can use with Constellation.

Tensor caching
When you run a Constellation inference task, you pass multiple tensor objects as inputs, sometimes creating big data payloads. These inputs travel through the wire protocol back and forth when you repeat the same task, even when the input changes from multiple runs are minimal, creating unnecessary network and data parsing overhead.

The client API now supports caching input tensors resulting in even better network latency and faster inference times.

XGBoost runtime
Constellation started with the ONNX runtime, but our vision is to support multiple runtimes under a common API. Today we're adding the XGBoost runtime to the list.

XGBoost is an optimized distributed gradient boosting library designed to be highly efficient, flexible, and portable, and it's known for its performance in structured and tabular data tasks.

You can start uploading and using XGBoost models today.

Globally distributed AI and a Constellation update

You can find the updated documentation with these new features and an example on how to use the XGBoost runtime with Constellation in our Developers Documentation.

An era of globally distributed AI

Since Cloudflare’s network is globally distributed, Constellation is our first public release of globally distributed machine learning.

But what does this mean? You may not think of a global network as the place to deploy your machine learning tasks, but machine learning has been a core part of what’s enabled much of Cloudflare’s core functionality for many years. And we run it across our global network in 300 cities.

Is this large spike in traffic an attack or a Black Friday sale? What’s going to be the best way to route this request based on current traffic patterns? Is this request coming from a human or a bot? Is this HTTP traffic a zero-day? Being able to answer these questions using automated machine learning and AI, rather than human intervention, is one of the things that’s enabled Cloudflare to scale.

But this is just a small sample of what globally distributed machine learning enables. The reason this was so helpful for us was because we were able to run this machine learning as an integrated part of our stack, which is why we’re now in the process of opening it up to more and more developers with Constellation.

As Michelle Zatlyn, our co-founder likes to say, we’re just getting started (in this space) — every day we’re adding hundreds of new users to our Constellation beta, testing out and globally deploying new models, and beyond that, deploying new hardware to support the new types of workloads that AI will bring to the our global network.

With that, we wanted to share a few announcements and some use cases that help illustrate why we’re so excited about globally distributed AI. And since it’s Speed Week, it should be no surprise that, well, speed is at the crux of it all.

Custom tailored web experiences, powered by AI

We’ve long known about the importance of performance when it comes to web experiences — in e-commerce, every second of page load time can have as much as a 7% drop off effect on conversion. But being fast is not enough. It’s necessary, but not sufficient. You also have to be accurate.

That is, rather than serving one-size-fits-all experiences, users have come to expect that you know what they want before they do.

So you have to serve personalized experiences, and you have to do it fast. That’s where Constellation can come into play. With Constellation, as a part of your e-commerce application that may already be served from Cloudflare’s network through Workers or Pages, or even store data in D1, you can now perform tasks such as categorization (what demographic is this customer most likely in?) and personalization (if you bought this, you may also like that).

Making devices smarter wherever they are

Another use case where performance is critical is in interacting with the real world. Imagine a face recognition system that detects whether you’re human or not every time you go into your house. Every second of latency makes a difference (especially if you’re holding heavy groceries).

Running inference on Cloudflare’s network, means that within 95% of the world’s population, compute, and thus a decision, is never going to be more than 50ms away. This is in huge contrast to centralized compute, where if you live in Europe, but bought a doorbell system from a US-based company, may be up to hundreds of milliseconds round trip away.

You may be thinking, why not just run the compute on the device then?

For starters, running inference on the device doesn’t guarantee fast performance. Most devices with built in intelligence are run on microcontrollers, often with limited computational abilities (not a high-end GPU or server-grade CPU). Milliseconds become seconds; depending on the volume of workloads you need to process, the local inference might not be suitable. The compute that can be fit on devices is simply not powerful enough for high-volume complex operations, certainly not for operating at low-latency.

But even user experience aside (some devices don’t interface with a user directly), there are other downsides to running compute directly on devices.

The first is battery life — the longer the compute, the shorter the battery life. There's always a power consumption hit, even if you have a custom ASIC chip or a Tensor Processing Unit (TPU), meaning shorter battery life if that's one of your constraints. For consumer products, this means having to switch out your doorbell battery (lest you get locked out). For operating fleets of devices at scale (imagine watering devices in a field) this means costs of keeping up with, and swapping out batteries.

Lastly, device hardware, and even software, is harder to update. As new technologies or more efficient chips become available, upgrading fleets of hundreds or thousands of devices is challenging. And while software updates may be easier to manage, they’ll never be as easy as updating on-cloud software, where you can effortlessly ship updates multiple times a day!

Speaking of shipping software…

AI applications, easier than ever with Constellation

Speed Week is not just about making your applications or devices faster, but also your team!

For the past six years, our developer platform has been making it easy for developers to ship new code with Cloudflare Workers. With Constellation, it’s now just as easy to add Machine Learning to your existing application, with just a few commands.

And if you don’t believe us, don’t just take our word for it. We’re now in the process of opening up the beta to more and more customers. To request access, head on over to the Cloudflare Dashboard where you’ll see a new tab for Constellation. We encourage you to check out our tutorial for getting started with Constellation — this AI thing may be even easier than you expected it to be!

We’re just getting started

This is just the beginning of our journey for helping developers build AI driven applications, and we’re already thinking about what’s next.

We look forward to seeing what you build, and hearing your feedback.

Donning a MASQUE: building a new protocol into Cloudflare WARP

Post Syndicated from Mari Galicer original http://blog.cloudflare.com/masque-building-a-new-protocol-into-cloudflare-warp/

Donning a MASQUE: building a new protocol into Cloudflare WARP

Donning a MASQUE: building a new protocol into Cloudflare WARP

When we originally announced WARP, we knew we were launching a product that was different from other VPNs. Cloudflare has not only hundreds more data centers than your typical VPN provider, but also a unique purview into the adoption of open Internet standards. The confluence of these two factors have led us to today’s announcement: support for MASQUE, a cutting-edge new protocol for the beta version of our consumer WARP iOS app.

MASQUE is a set of mechanisms that extend HTTP/3 and leverage the unique properties of the QUIC transport protocol to efficiently proxy IP and UDP traffic. Most importantly, it will make your Internet browsing experience faster and more stable without sacrificing privacy.

Like many products at Cloudflare, we’re offering this first as a free, consumer offering. Once we’ve had an opportunity to learn from what it’s like to operate MASQUE on mobile devices, at scale, we plan to integrate it into our Zero Trust enterprise product suite.

We’re not saying goodbye to Wireguard

When we first built WARP we chose to go with Wireguard for many reasons – among them, simplicity. This is where Wireguard shines: ~4,000 lines of code that use public-key cryptography to create an encrypted tunnel between one computer and another. The cryptographic parts – encapsulation and decapsulation –  are fast, simple, and secure. This simplicity has allowed us to implement it cross-platform without much effort; today, we support Wireguard clients on iOS, Android, macOS, Windows, and Linux.

That being said, the protocol is not without its issues. Like many tradeoffs in technology, Wireguard’s strengths are also its drawbacks. While simple, it is also rigid: it’s not possible to extend it easily, for example, for session management, congestion control, or to recover more quickly from error-state behaviors we’re familiar with. Finally, neither the protocol nor the cryptography it uses are standards-based, making it difficult to keep up with the strongest known cryptography (post-quantum crypto, for example).

We want to move QUIC-ly

We’re excited about MASQUE because it fits into the way the Internet is evolving. According to this year’s usage report from our Radar team, HTTP/2 is currently the standard in use by the majority of Internet traffic, but HTTP/3 occupies a growing share – 28% as of June 2023. Cloudflare has always been dedicated towards adopting the cutting edge when it comes to standards: when RFC 9000 (the QUIC transport protocol) was published, we enabled it for all Cloudflare customers the very next day.

Donning a MASQUE: building a new protocol into Cloudflare WARP

So why do we think HTTP/3 is so promising? Well, a lot of it has to do with solving performance issues with HTTP/2. HTTP/3 promises a number of things.

Faster connection establishment: the TCP+TLS handshake of earlier HTTP versions typically takes two to three round trips. QUIC performs the transport and security handshake at the same time, cutting down on the total required round trips.

No more head of line blocking: when one packet of information does not make it to its destination, it will no longer block all streams of information.

Agility and evolution: QUIC has strong extension and version negotiation mechanisms. And because it encrypts all but a few bits of its wire image, deploying new transport features is easier and more practical. In contrast, TCP evolution was hampered by middleboxes that failed to keep up with the times.

Naturally, we’d want the proxying protocol we use for so many people’s everyday browsing to take advantage of these benefits. For example, the QUIC unreliable datagram extension doesn't help much for standard web traffic but it's ideal for tunneling UDP or IP packets that expect an unreliable substrate beneath them. Without the unreliable aspect, the protocols on top can get upset and start to perform badly. Datagrams help unlock QUIC's proxying potential.

MASQUE: A new era for VPN performance and flexibility

You may have heard of HTTP GET, POST, and PUT, but what about CONNECT? HTTP-CONNECT is a method that opens up a tunnel between servers and proxies traffic between them. For a deeper dive, check out our Primer on Proxies. Many Cloudflare services use this method like so:

Donning a MASQUE: building a new protocol into Cloudflare WARP

Clients send a CONNECT request, and if the proxy sends back a 2xx (success) status code, tunnel secured! Simple. However, remember that QUIC is UDP-based. Luckily, the MASQUE working group has figured out how to run multiple concurrently stream and datagram-based connections. Establishing one looks like this:

Donning a MASQUE: building a new protocol into Cloudflare WARP

Here’s what this MASQUE proxying looks like:

Donning a MASQUE: building a new protocol into Cloudflare WARP

From a development perspective, MASQUE also allows us to improve our performance in other ways: we’re already running it for iCloud Private Relay and other Privacy Proxy partners. The services that power these partnerships, from our Rust-based proxy framework to our open source QUIC implementation, are already deployed globally in our network and have proven to be fast, resilient, and reliable. We've already learned a lot about how to operate proxies at scale, but there’s plenty of room for improvement. The good news is that every performance improvement we make to speed up MASQUE-based connections for our WARP clients will also improve performance for our customers that use HTTP-CONNECT, and vice-versa.

From a protocol perspective, we also think that MASQUE will prove to be resilient over time. As you can see above, connections are made through port 443, which for both TCP and UDP blends in well with general HTTP/3 traffic and is less susceptible than Wireguard to blocking.

Finally, because MASQUE is an IETF standard, innovations via extensions are already underway. One we’re particularly excited about is Multipath QUIC, an extension whose implementation would allow us to use multiple concurrent network interfaces for a single logical QUIC connection. For example, using both LTE and WiFi on a single mobile device could allow for seamless switching between the two, helping to avoid pesky disruptions when you’re coming to and from work or home.

The magic of supporting MASQUE is that it combines some pretty cool (and very Cloudflare-y!) elements: a standards-based proxying protocol that provides real user-facing performance benefits, built upon Cloudflare’s widely available Anycast network, and encryption of that last-mile between that network and your phone.

So how can I use it?

If you’d like to join the waitlist for our beta tester program for MASQUE, you can sign up here.

You’ll first need to download Testflight on a valid iOS device. We will be sending out invites to download the app via Testflight first come, first served, as early as next week. Once you’ve downloaded the app, MASQUE will be available as the default connection in our beta iOS version, only available in iOS 17 (and up).

To toggle between Wireguard and MASQUE, go to Settings > Personalization > Protocol:

Donning a MASQUE: building a new protocol into Cloudflare WARP

Protocols come and go, but our privacy promise remains the same

While the protocols that dominate the Internet may change, our promise to consumers remains the same – a more private Internet, free of cost. When using WARP, we still route all DNS queries through 1.1.1.1, our privacy-respecting DNS resolver; we will never write user-identifiable log data to disk; we will never sell your browsing data or use it in any way to target you with advertising data; and you can still use WARP without providing any personal information like your name, phone number, or email address.

The Raspberry Pi Foundation and edX: A new way to learn about teaching computing

Post Syndicated from Ben Hall original https://www.raspberrypi.org/blog/the-raspberry-pi-foundation-and-edx-learn-about-teaching-computing/

We are delighted to announce that we’ve joined the partner network of edX, the global online learning platform. Through our free online courses we enable any educator to teach students about computing and how to create with digital technologies. Since 2017, over 250,000 people have taken our online courses, including 19,000 teachers in England alone. The move to edX builds on this success to help us bring high-quality training to many more teachers worldwide. 

“I feel that this course was essential in my understanding of where I may take my students on their journey as coders. Extremely practical advice and exercises.” – Online course participant

Free training to support all educators to teach computing

Supporting teachers and educators is crucial for our mission to enable young people to realise their full potential through the power of computing and digital technologies. Through our online courses educators can learn the skills, knowledge, and confidence to teach computing in an engaging way. As a result, they empower young people to in turn develop the knowledge, skills, and confidence to use digital technologies effectively, and to be able to critically evaluate these technologies and confidently engage with technological change.

Twenty of our most popular online courses are now available for sign-up on the edX platform. They will start in two blocks of ten in August and September, respectively. 

The courses are written with educators in mind, and are also useful to anyone with an interest in computing. The scope of topics is broad and includes programming in Python and Scratch, web development and design, cybersecurity, and machine learning and AI. Our aim is to support educators of all levels of experience to learn about computing, including teachers, club volunteers, youth workers, parents, and more. The courses also draw on content from our Computing Curriculum and provide support for teachers who want to engage their students with Experience AI, our pioneering education initiative about the field of AI.

“Our partnership with edX gives teachers everywhere a new way to engage with our free, expert-led computing education training. As people design and deploy new and powerful digital technologies, it’s important that no-one is left behind and we are all able to shape technology together.” – Sian Harris, Chief Education Officer at the Raspberry Pi Foundation

What are our courses like?

Designed, created, and facilitated by us, each of our courses is a cross-team project. When we put together a course we:

  • Use pedagogical best practice: we lead with concepts, model processes, and include activities that are ready for the classroom; add variety in terms of what content to present as text, images, or videos; and include opportunities to create projects
  • Use language carefully so that it is easy to follow for all participants, as are engaging with us online and may have English as an additional language
  • Put accessibility front and centre so that as many people as possible can learn with us

Offering our courses on the edX platform gives us flexibility in how we present the content, meaning we can better meet learner needs.

“Not only did the course present a thorough grounding in computing pedagogy, references were made to supporting research, and the structure and presentation was deceptively straightforward — despite dealing with some tricky concepts.” – Online course participant

We especially strive to exemplify the pedagogical approaches we recommend to teachers within the courses themselves. For example, semantic waves are woven throughout our learning resources and help learners to unpack new concepts, then repack them into more complex contexts to encourage knowledge acquisition. This teaching strategy, along with many others, is used widely in the courses and in all our teaching and learning resources.

How you can learn with us on edX

Taking our courses on edX you can:

  • Learn at your computer or on the edX mobile app
  • Join a course’s dedicated discussion are to discuss and collaborate with other participants
  • Ask our team questions — we’ll have experienced facilitators on hand

All the courses can be completed at your own pace, in your own time. Based on a commitment of between 1 to 2 hours per week, you can complete our courses in 2 to 4 weeks. You’re also welcome to work through them more quickly (or slowly) if you prefer.

Browse our selection of free courses and decide what your next learning adventure will be. 

We look forward to catching up with you in the course discussions on our new platform.

The post The Raspberry Pi Foundation and edX: A new way to learn about teaching computing appeared first on Raspberry Pi Foundation.

Да погледнем към Гърция

Post Syndicated from Александър Нуцов original https://www.toest.bg/da-poglednem-kum-gurtsiya/

Да погледнем към Гърция

На 21 май в Гърция се проведоха предсрочни парламентарни избори, спечелени убедително от дясноцентристката партия „Нова демокрация“ на Кириакос Мицотакис. След рулетката на мандатите за съставяне на правителство обаче такова не бе сформирано, а президентът насрочи нови избори за 25 юни. Какво и защо се случва в Гърция и влияе ли това на България? На тези въпроси ще потърсим отговор в следващите редове.

Преди изборите

На 22 април действащият тогава премиер Мицотакис официално поиска от президента Катерина Сакеларопулу да разпусне парламента и да насрочи нови избори. Формално четиригодишният мандат на правителството трябваше да изтече през юли, но според Мицотакис кабинетът бе изпълнил своята управленска програма предсрочно. Така по чл. 41 (ал. 2) от гръцката Конституция, във връзка с нуждата от разрешаване на национален въпрос от изключителна важност, парламентът беше разпуснат, а изборите се проведоха на 21 май 2023 г.

Конкретната тема от национално значение, изтъкната от Мицотакис, е свързана с усилията на Гърция да възвърне своя инвестиционен кредитен рейтинг в рамките на тази година. Такава заявка той направи още през януари, подчертавайки нуждата от провеждане на избори, които да осигурят политическа стабилност и дългосрочен мандат за управление.

Очакваше се Мицотакис да поиска нови избори още през април, но трагичната влакова катастрофа през февруари, отнела живота на 57 души, отложи намеренията на управляващите. Освен от натиска на последвалите протести срещу начина на управление на железопътния транспорт, майските избори бяха белязани от още няколко ключови събития.

През февруари гръцкият парламент забрани на партии, чиито ръководители са били осъждани, да участват в изборите. Така например най-популярната политическа партия в крайнодясното пространство „Златна зора“, обявена от съда през 2020 г. за криминална групировка по обвинения за извършени престъпления от омраза, беше възпряна да излъчи собствени кандидати. Правителството на Мицотакис беше подложено на продължителни атаки и заради скандала с подслушването на Никос Андрулакис – лидера на третата по големина парламентарна формация ПАСОК, както и на други високопоставени фигури и журналисти.

Демокрация по гръцки

Въпреки неблагоприятните обстоятелства и атаките от лявото, център-лявото и крайнодясното пространство „Нова демокрация“ драстично надмина очакванията на социологическите агенции и постигна повече от убедителна победа, получавайки 40,8% от гласовете (146 места в парламента) срещу само 20,1% за социалистите на Алексис Ципрас от СИРИЗА. На трето място с 11,5% се наредиха социалдемократите от ПАСОК, следвани от Комунистическата партия със 7,2% и дясната популистка формация „Гръцко решение“ с 4,5%. Анализатори отдават успеха на високия икономически ръст, възстановяването на страната след COVID кризата, понижаването на напрежението с Турция и цялостната стабилност по отношение на фискалната и икономическата политика.

Подобно на България, и Гърция се превърна в арена на остри политически и обществени сблъсъци през последните месеци. Въпреки това избирателната активност в южната ни съседка беше с над 20 процентни пункта по-висока, отколкото у нас (61,1% там срещу само 40,69% на последните избори тук). В сравнение с предходния парламентарен вот в Гърция през 2019 г., страната също бележи лек ръст – тогава избирателната активност възлизаше на 57,78%.

И макар сами по себе си тези числа да не са отлични за една добре функционираща демокрация, подобна избирателна активност изглежда като мираж за българската действителност. Основните причини за това са няколко. От една страна, съседите ни притежават по-солидна политическа и гражданска култура като част от богатото си демократично историческо наследство. От друга, изборите там произвеждат устойчиви парламентарни мнозинства и правителства, които (макар и не без перипетии и скандали) изпълняват своите мандати. Така в сравнение с българите гръцките граждани са много по-добре защитени от феномена „избирателна умора“ и чувството за безсмислие на изборния процес, неспособен да произведе устойчиво управление.

Най-важната разлика вероятно е тази, че гръцките партии и парламент отразяват много по-добре политическия спектър – от крайнолявото, през центъра, до крайнодясното, представлявайки широка палитра от обществени групи, които традиционно отъждествяват себе си с идеите на една или друга политически сила. Резултатът от вота през май и същността на парламентарно представените партии онагледяват това разнообразие. Поради конюнктурни специфики лявото и дясното в България се размиват, а вотът се опростява до протестен и непротестен, корупционен и антикорупционен, простатукво и антистатукво. Така партиите нямат дълбоки устои и лесно губят идентичността си при негативна за тях промяна на политическите обстоятелства, защото страдат от липса на идеи и визия, с които хората да се асоциират.

По обратния логически път може да обясним успеха на „Нова демокрация“. Център-дясната партия спечели кампанията с център-десни политики. Стъпвайки на идейните си начала, Мицотакис наблегна на постигнатите икономически успехи, намалените данъците върху доходите на бизнеса и физическите лица, по-ниската безработицата, ръста на чуждестранните инвестиции и балансираната бюджетна политика. Занапред той обеща допълнително орязване на данъците, повишаване на износа и по-високи заплати.

На този фон основните му конкуренти от СИРИЗА и ПАСОК (борещи се за сходен тип електорат в лявото пространство) наблегнаха на очерняща кампания срещу „Нова демокрация“, свързана със споменатите скандали. Те обаче не успяха да очертаят ясна политическа и икономическа визия като контрапункт на своите опоненти и претърпяха логичен изборен крах. И нито скандалите, нито трагичният железопътен инцидент, предизвикал гнева на десетки хиляди граждани, нито фактът, че цяло едно ново поколение от близо половин милион млади избиратели (традиционно привлечени от прогресивните идеи на лявото) за пръв път получиха право да гласуват, бяха в състояние да променят съдбата на безидейната опозиция. Събития, от които нашите политически сили определено могат да се поучат.

С ново изборно законодателство към нови избори

Само няколко мандата не достигнаха на „Нова демокрация“ да състави самостоятелно мнозинство в 300-местния гръцки парламент. След като и победителите, и победените отказаха да водят преговори за коалиционно управление, президентът насрочи нови избори за 25 юни и назначи служебно правителство начело с шефа на Сметната палата Йоанис Сармас.

Докато майските избори се проведоха по въведената от СИРИЗА през 2016 г. обикновена пропорционална система (подобна на тази в България), с изборите на 25 юни се завръща типичната за Гърция бонусна схема, възстановена от „Нова демокрация“ със законови поправки през 2020 г. Този модел доминира в Гърция през последните три десетилетия. При него мандатите се разпределят на пропорционален принцип, но с бонус за първата политическа сила под формата на допълнителен брой депутати.

Прагът за влизане в парламента остава 3%. При изборен резултат от над 25% победителят автоматично получава 20 допълнителни депутати – плюс един депутат за всеки половин процентен пункт над този резултат. Максималният брой допълнителни народни представители за първата политическа сила може да достигне 50. Това е и основната причина, поради която Мицотакис отказа да води преговори за коалиционно правителство и тласна страната към още едни избори, очаквайки да спечели стабилно мнозинство благодарение на бонусната система.

Бонусната схема не беше приложена на изборите през май поради конституционната поправка от 2019 г. Според нея промените в изборното законодателство влизат в сила не от следващите, а от по-следващите поред избори след тяхното приемане.

Българо-гръцките отношения

Със значителните промени в геополитическата обстановка през последните години отношенията между България и Гърция сякаш започнаха да процъфтяват. Още през лятото и есента на 2021 г., когато цените на енергоносителите започнаха да се покачват, двете страни осъзнаха необходимостта от по-тясно сътрудничество – най вече в сферата на енергетиката. Неслучайно един от приоритетите на коалиционния кабинет на Кирил Петков по това време беше да реабилитира и ускори строежа на газовия интерконектор между Стара Загора и Комотини, който се бавеше повече от десетилетие.

По този повод се проведоха множество двустранни срещи на най-високо равнище между премиерите Петков и Мицотакис, между енергийните министри, шефовете на газопреносните и газоразпределителните оператори и други високопоставени длъжностни лица. Проектът има стратегическо значение за енергийната сигурност на страната и вноса на евтин газ по договора с Азербайджан, особено след руската инвазия в Украйна и едностранното прекратяване на доставките от страна на „Газпром“.

В края на април 2022 г. започна и строежът на плаващия терминал за втечнен природен газ в Александруполис – ключов инфраструктурен проект за диверсификацията на газовите доставки в региона. В него България участва с дял от 20%, а първоначално запазеният от страната ни капацитет от 500 млн. куб.м газ на година беше удвоен до 1 млрд. куб.м годишно за период от десет години. Доставките за България трябва да започнат в началото на 2024 г., когато се очаква съоръжението да бъде пуснато в експлоатация.

В началото на тази година двете страни възродиха и позабравената идея за изграждане на петролен тръбопровод между Бургас и Александруполис. През февруари България и Гърция подписаха меморандум за сътрудничество, а по-късно съставиха и двустранна работна група. Целевият срок за завършване на проекта е краят на 2024 г., когато изтича дерогацията на България за внос на руски петрол по наложените на Русия европейски санкции. Освен това двете държави се споразумяха да складират гръцки газ в българското газохранилище в Чирен. Това се налага поради липсата на инфраструктура за съхранение в южната ни съседка, докато Европейският съюз изисква от страните членки да поддържат стратегически резерви в размер на 15% от годишното си потребление.

Както става ясно, през последните две години енергетиката измести по важност други традиционни сфери на сътрудничество между България и Гърция, каквито са туризмът и търговията. Това се дължи главно на нарастващата роля на енергетиката като част от националната сигурност на европейските държави след сътресенията с цените на енергоносителите, руската агресия в Украйна и използването на енергийните доставки като лост за изнудване и влияние. При тези обстоятелства и България, и Гърция имат интерес сътрудничеството им в енергетиката и други ключови сфери да продължи да се задълбочава независимо от състава на бъдещото управление в южната ни съседка.

Заглавно изображение: Смяна на караула пред гръцкия парламент в Атина. Източник: Canva

Вечният длъжник остава, въпреки новия закон за несъстоятелност на физическите лица. Кой може да се възползва от него на практика?

Post Syndicated from VassilKendov original http://kendov.com/debt_to_the_death/

Вечният длъжник остава, въпреки новия закон за несъстоятелност на физическите лица. Кой може да се възползва от него на практика?

Започвам направо

На какви условия трябва да отговаряте, за да се възползвате от този закон и какво можете да очаквате?

„Чл. 2. Законът не се прилага по отношение на физическите лица, които упражняват търговска дейност, стопанска дейност, занаят или свободна професия.”

За тези лица се прилагат разпоредбите на търговския закон. За тях в друг пост, за да не става сложно. Друг е въпросът, че това са най-реномираните професии и те реално не ползват процедури по фалит, камо ли път тази. Говорим за адвокати, архитекти, лекари, застрахователи, земеделски производители, търговци ЕТ, художници, артисти, попфолк тупалки и др…
Тоест, на практика тези хора отпадат от разпоредбите на този закон.
И понеже много знаещи и незнаещи ще се упражняват с мнения, тук ключовите думи са „НА ПРАКТИКА”. Защото на теория ще могат, но по стара традиция създаваме закони, които да са неприложими или да не си вършат работата. Та този закон е точно такъв. Той НА ПРАКТИКА няма да се прилага за посочените дейности!

За да се възползвате, трябва да отговаряте на определението – ДОБРОСЪВЕСТЕН!

Много обичам когато се дава определение за добросъвестност. Да знаете, че добросъвестността не е въпрост на съвест, а на юридическо определение. Ето по-точно какво е то:

„Добросъвестен е длъжникът, който поема задължения съобразно своето имуществено състояние и доходи и който със своите действия не уврежда умишлено или поради небрежност интересите на кредиторите си.

(2) Не се счита за добросъвестен длъжник, който:

  1. е осъден за злоупотреба на доверие, за престъпление срещу кредиторите или за престъпление срещу финансовата, данъчната или осигурителната системи, освен ако е реабилитиран;
  2. през последната година преди подаване на молбата за откриване на производството по несъстоятелност не е упражнявал трудова или стопанска дейност по занятие, която да е източник на доходи, независимо от начина на нейното възлагане и изпълнение и не търси активно работа;
  3. през последните 5 години преди подаване на молбата за откриване на производството по несъстоятелност не е извършил нарушение на задължение за деклариране на доходи или имущество;
  4. се е разпоредил безвъзмездно със свое имущество на значителна стойност през последните 5 години преди подаване на молбата за откриване на производство по несъстоятелност;
  5. през последните 5 години преди подаване на молбата за откриване на производство по несъстоятелност е поел задължение по договор за заем, договор за покупка на стоки и услуги или друг възмезден договор, който не е предназначен за задоволяване на негови или на членовете на семейството, които издържа, основни жизнени потребности и когато това задължение е явно несъобразено с имуществото и доходите му;
  6. е представил неверни или непълни данни, документи или доказателства за своето имущество пред съда или синдика във връзка с производство по несъстоятелност;
  7. не е оказал съдействие или е препятствал упражняването на правомощията на съда и на синдика относно проверката на имуществото му, опазването и попълването на масата на несъстоятелността;
  8. не е изпълнил задължения, предвидени в този закон, в одобрен погасителен план или в извънсъдебно споразумение с кредиторите, с което е създал опасност за интересите на кредиторите.

(3) Значителна стойност на имуществото по ал. 2, т. 4 е стойност, която надхвърля средния месечен доход на длъжника за последните 12 месеца, определена към момента на разпореждането.

(4) Явно несъобразено с имуществото и доходите на длъжника е задължение, чието изпълнение, самостоятелно или в съвкупност с други задължения на длъжника, е несъвместимо с разходите за задоволяване на жизнените потребности на длъжника и на членовете на неговото семейство, на които той дължи издръжка. При преценката на обстоятелствата по ал. 2, т. 5 се вземат предвид всички задължения на длъжника, както и имуществото и доходите на длъжника към момента на поемане на задължението.”

Аз не мисля, че има смисъл да коментирам горното, но мога да се закълна в 2 неща:

За  срещa с мен моля използвайте посочената форма.

[contact-form-7]

1. Това определение отхвърли възможността на 99% от хората да се възползват от тази процедура.

2. На останалия 1% от хората, ще им се отще да плащат адвокатски хонорари през следващите 3-4 години, само докато се докаже дали те са добросъвестни или не.

За да не разводняваме по-нататък анализа, искам да Ви обърна внимание на чл. 15, в който се казва, че ако се окаже, че сте подали молба, а не е трябвало, защото не отговаряте на горните определения освен сумата, която очевидно не можете да плащате, дължите и обезщетение на кредиторите.
Това винаги ми е било любимото когато изпаднеш в просрочие по банков кредит. Ти не можеш да погасяваш редовната главница и лихвите, но те ти начисляват допълнително такси, ЧСИ разноски и наказателни лихви, за да може дългът ти да нарастне още повече.

За финал, ето и текста на чл. 15 от новивия закон:

Чл. 15. (1) Длъжник, който подаде молба за откриване на производство по несъстоятелност, като знае, че няма основание за това, дължи обезщетение на кредиторите за претърпените във връзка с производството имуществени и неимуществени вреди, които са пряка и непосредствена последица от увреждането.

(2) Отговорността за заплащане на обезщетение по ал. 1 възниква, в случай че молбата на длъжника за откриване на производство по несъстоятелност е отхвърлена или образуваното производство по несъстоятелност е прекратено с влязло в сила решение поради недобросъвестност на длъжника.”

СИНДИКЪТ – новият душманин в закона за фалита на физическите лица

И ако сте стигнали до тук да знаете, че предварителната консултация е несравнимо по-евтина от бъдещите разходи и разправии

Васил Кендов – финансов съветник

За  срещa с мен моля използвайте посочената форма.

[contact-form-7]

The post Вечният длъжник остава, въпреки новия закон за несъстоятелност на физическите лица. Кой може да се възползва от него на практика? appeared first on Kendov.com.

Amazon OpenSearch Service’s vector database capabilities explained

Post Syndicated from Jon Handler original https://aws.amazon.com/blogs/big-data/amazon-opensearch-services-vector-database-capabilities-explained/

OpenSearch is a scalable, flexible, and extensible open-source software suite for search, analytics, security monitoring, and observability applications, licensed under the Apache 2.0 license. It comprises a search engine, OpenSearch, which delivers low-latency search and aggregations, OpenSearch Dashboards, a visualization and dashboarding tool, and a suite of plugins that provide advanced capabilities like alerting, fine-grained access control, observability, security monitoring, and vector storage and processing. Amazon OpenSearch Service is a fully managed service that makes it simple to deploy, scale, and operate OpenSearch in the AWS Cloud.

As an end-user, when you use OpenSearch’s search capabilities, you generally have a goal in mind—something you want to accomplish. Along the way, you use OpenSearch to gather information in support of achieving that goal (or maybe the information is the original goal). We’ve all become used to the “search box” interface, where you type some words, and the search engine brings back results based on word-to-word matching. Let’s say you want to buy a couch in order to spend cozy evenings with your family around the fire. You go to Amazon.com, and you type “a cozy place to sit by the fire.” Unfortunately, if you run that search on Amazon.com, you get items like fire pits, heating fans, and home decorations—not what you intended. The problem is that couch manufacturers probably didn’t use the words “cozy,” “place,” “sit,” and “fire” in their product titles or descriptions.

In recent years, machine learning (ML) techniques have become increasingly popular to enhance search. Among them are the use of embedding models, a type of model that can encode a large body of data into an n-dimensional space where each entity is encoded into a vector, a data point in that space, and organized such that similar entities are closer together. An embedding model, for instance, could encode the semantics of a corpus. By searching for the vectors nearest to an encoded document — k-nearest neighbor (k-NN) search — you can find the most semantically similar documents. Sophisticated embedding models can support multiple modalities, for instance, encoding the image and text of a product catalog and enabling similarity matching on both modalities.

A vector database provides efficient vector similarity search by providing specialized indexes like k-NN indexes. It also provides other database functionality like managing vector data alongside other data types, workload management, access control and more. OpenSearch’s k-NN plugin provides core vector database functionality for OpenSearch, so when your customer searches for “a cozy place to sit by the fire” in your catalog, you can encode that prompt and use OpenSearch to perform a nearest neighbor query to surface that 8-foot, blue couch with designer arranged photographs in front of fireplaces.

Using OpenSearch Service as a vector database

With OpenSearch Service’s vector database capabilities, you can implement semantic search, Retrieval Augmented Generation (RAG) with LLMs, recommendation engines, and search rich media.

Semantic search

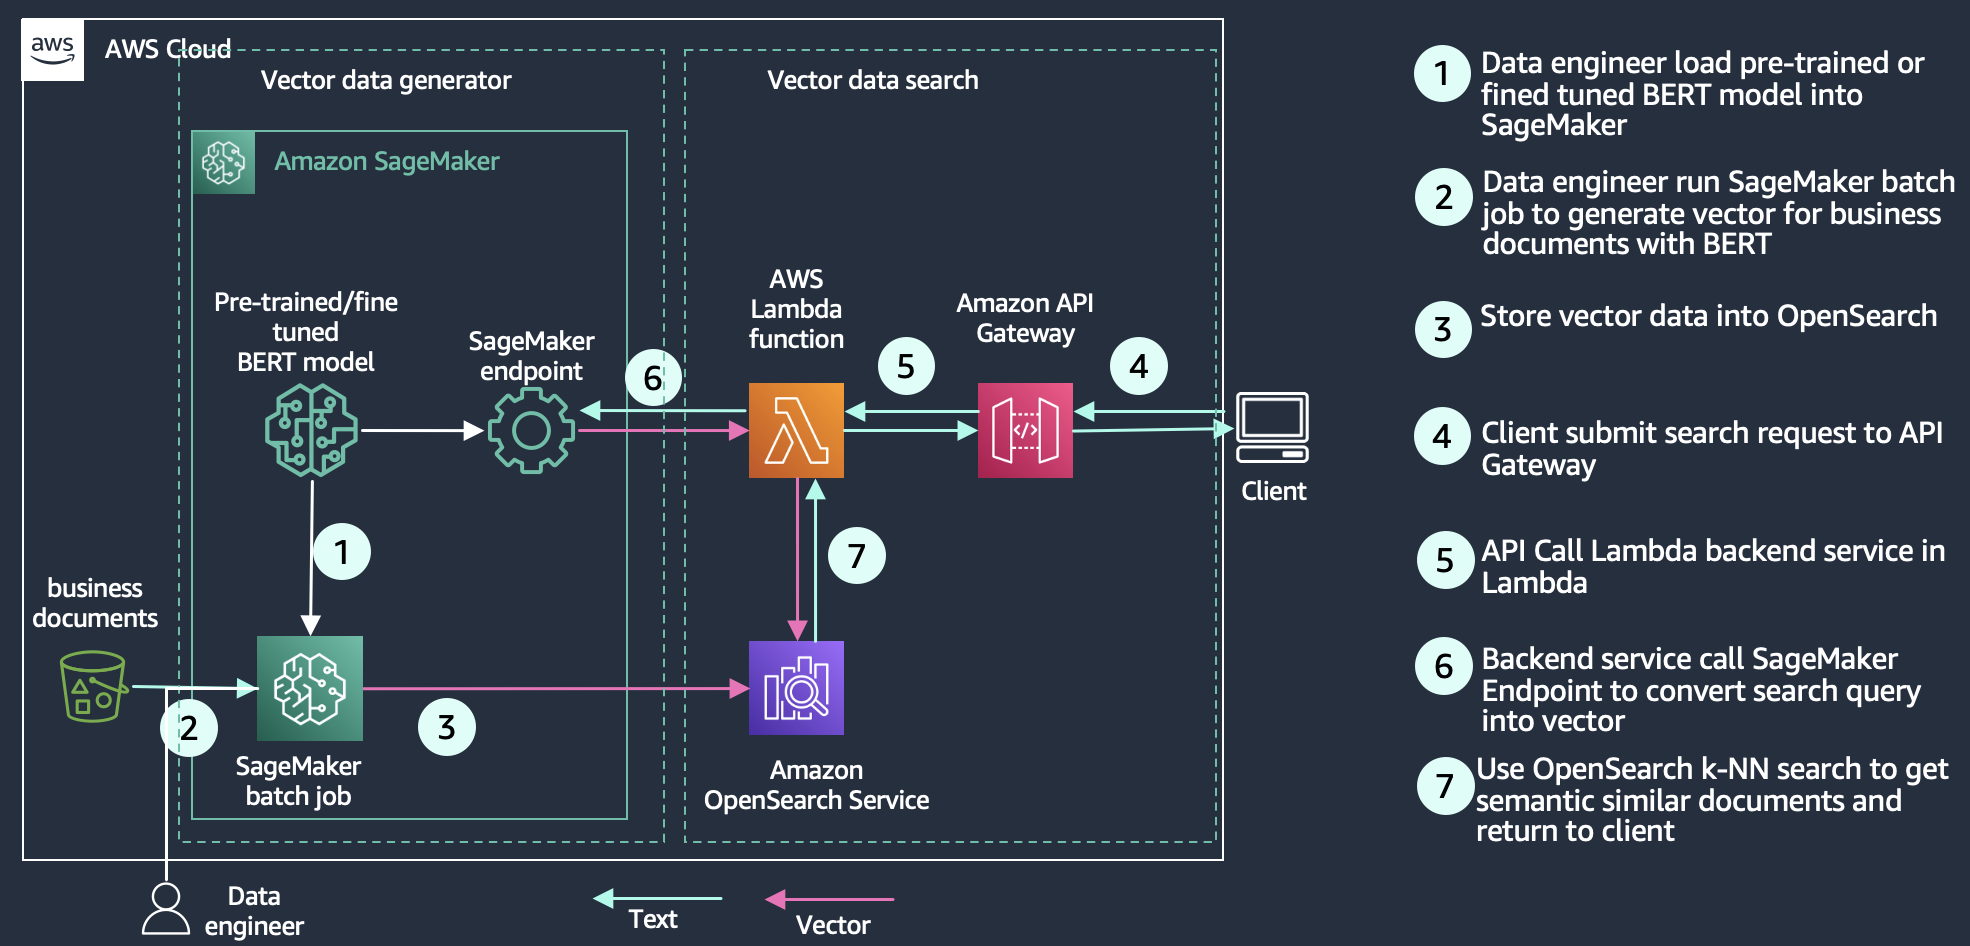
With semantic search, you improve the relevance of retrieved results using language-based embeddings on search documents. You enable your search customers to use natural language queries, like “a cozy place to sit by the fire” to find their 8-foot-long blue couch. For more information, refer to Building a semantic search engine in OpenSearch to learn how semantic search can deliver a 15% relevance improvement, as measured by normalized discounted cumulative gain (nDCG) metrics compared with keyword search. For a concrete example, our Improve search relevance with ML in Amazon OpenSearch Service workshop explores the difference between keyword and semantic search, based on a Bidirectional Encoder Representations from Transformers (BERT) model, hosted by Amazon SageMaker to generate vectors and store them in OpenSearch. The workshop uses product question answers as an example to show how keyword search using the keywords/phrases of the query leads to some irrelevant results. Semantic search is able to retrieve more relevant documents by matching the context and semantics of the query. The following diagram shows an example architecture for a semantic search application with OpenSearch Service as the vector database.

Architecture diagram showing how to use Amazon OpenSearch Service to perform semantic search to improve relevance

Retrieval Augmented Generation with LLMs

RAG is a method for building trustworthy generative AI chatbots using generative LLMs like OpenAI, ChatGPT, or Amazon Titan Text. With the rise of generative LLMs, application developers are looking for ways to take advantage of this innovative technology. One popular use case involves delivering conversational experiences through intelligent agents. Perhaps you’re a software provider with knowledge bases for product information, customer self-service, or industry domain knowledge like tax reporting rules or medical information about diseases and treatments. A conversational search experience provides an intuitive interface for users to sift through information through dialog and Q&A. Generative LLMs on their own are prone to hallucinations—a situation where the model generates a believable but factually incorrect response. RAG solves this problem by complementing generative LLMs with an external knowledge base that is typically built using a vector database hydrated with vector-encoded knowledge articles.

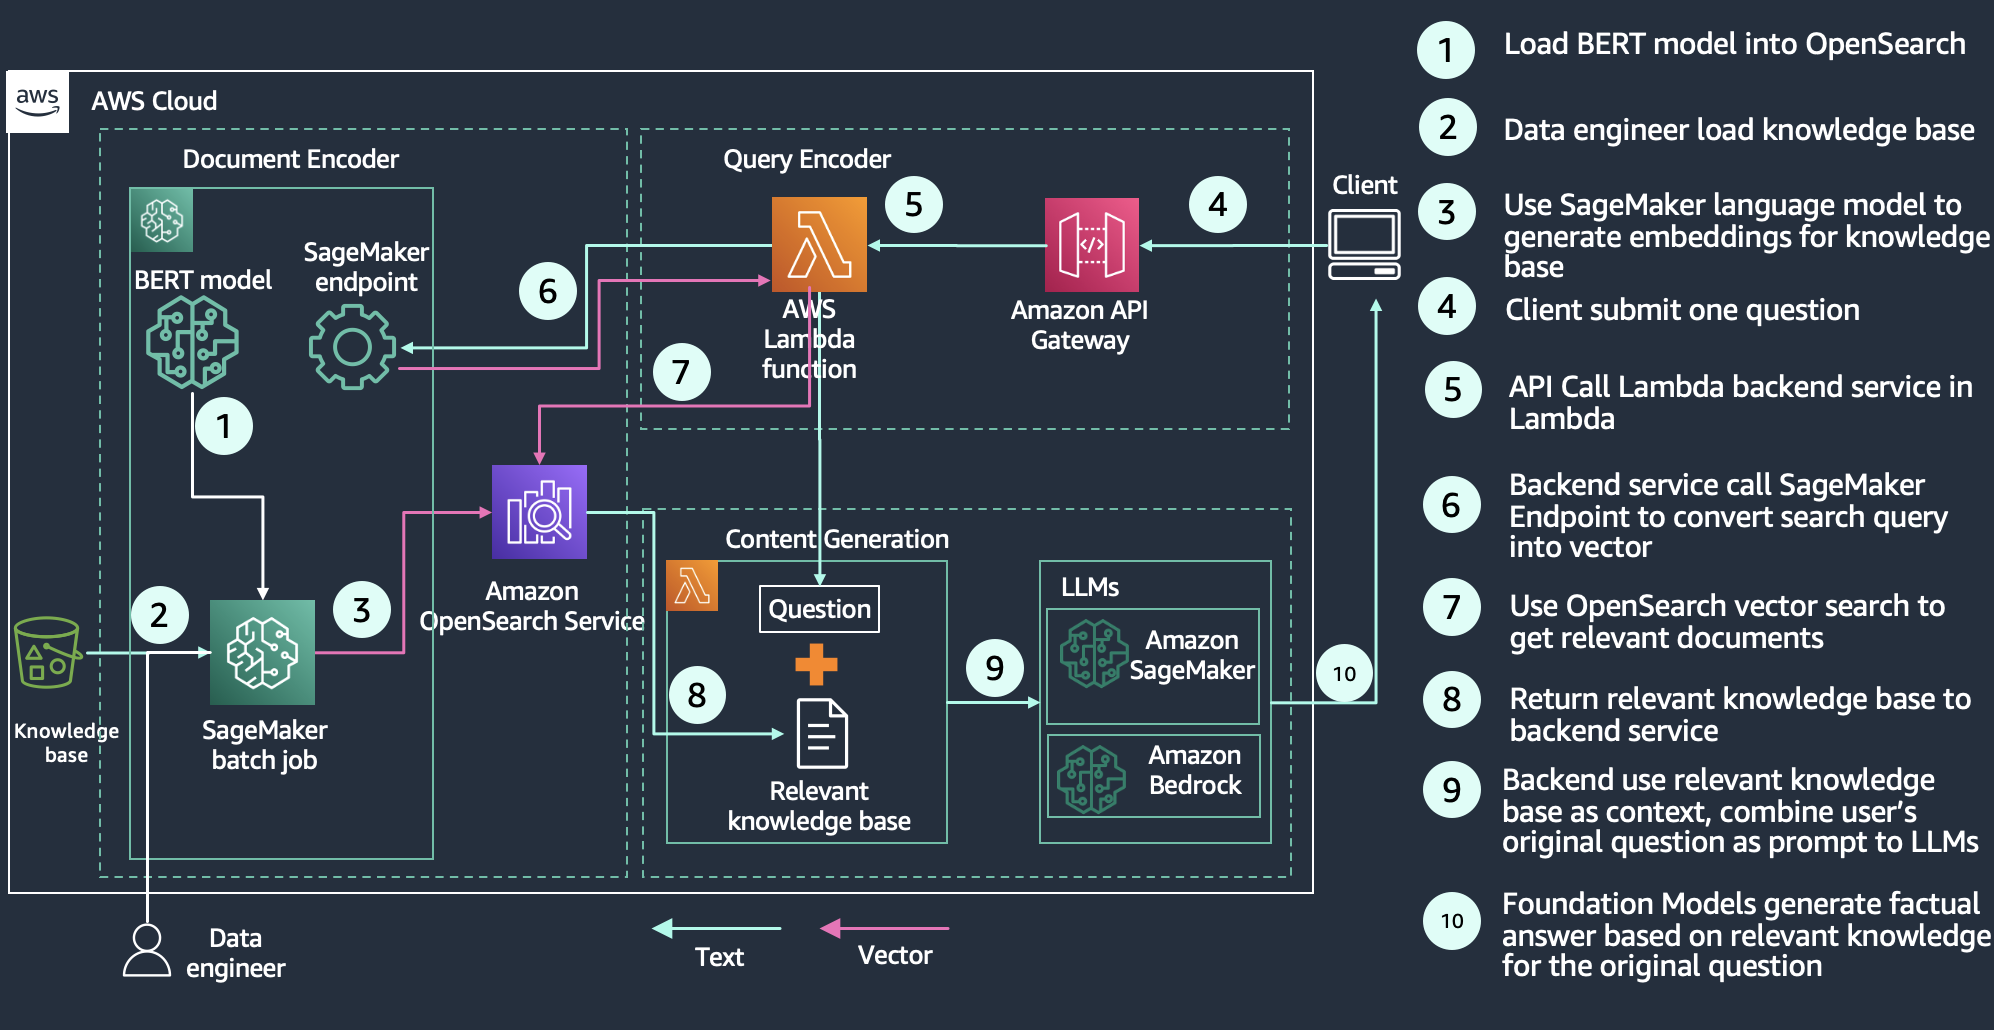
As illustrated in the following diagram, the query workflow starts with a question that is encoded and used to retrieve relevant knowledge articles from the vector database. Those results are sent to the generative LLM whose job is to augment those results, typically by summarizing the results as a conversational response. By complementing the generative model with a knowledge base, RAG grounds the model on facts to minimize hallucinations. You can learn more about building a RAG solution in the Retrieval Augmented Generation module of our semantic search workshop.

Architecture diagram showing how to use Amazon OpenSearch Service to perform retrieval-augmented generation

Recommendation engine

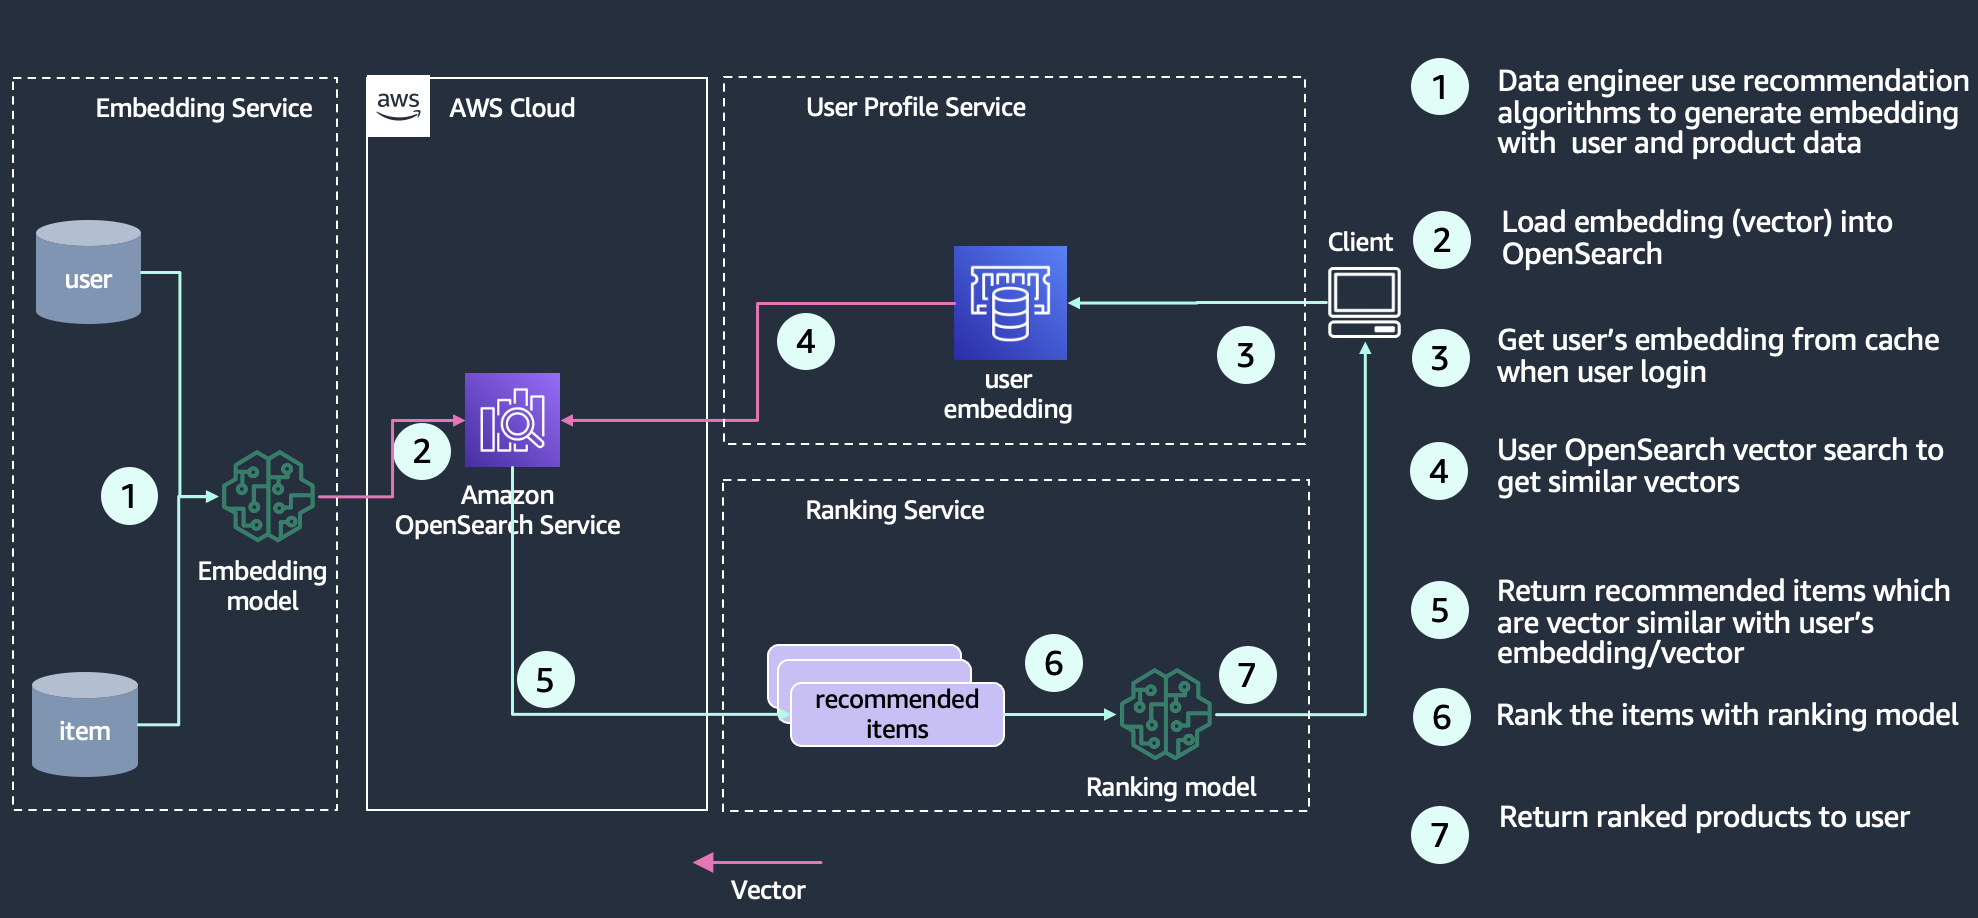
Recommendations are a common component in the search experience, especially for ecommerce applications. Adding a user experience feature like “more like this” or “customers who bought this also bought that” can drive additional revenue through getting customers what they want. Search architects employ many techniques and technologies to build recommendations, including Deep Neural Network (DNN) based recommendation algorithms such as the two-tower neural net model, YoutubeDNN. A trained embedding model encodes products, for example, into an embedding space where products that are frequently bought together are considered more similar, and therefore are represented as data points that are closer together in the embedding space. Another possibility
is that product embeddings are based on co-rating similarity instead of purchase activity. You can employ this affinity data through calculating the vector similarity between a particular user’s embedding and vectors in the database to return recommended items. The following diagram shows an example architecture of building a recommendation engine with OpenSearch as a vector store.

Architecture diagram showing how to use Amazon OpenSearch Service as a recommendation engine

Media search

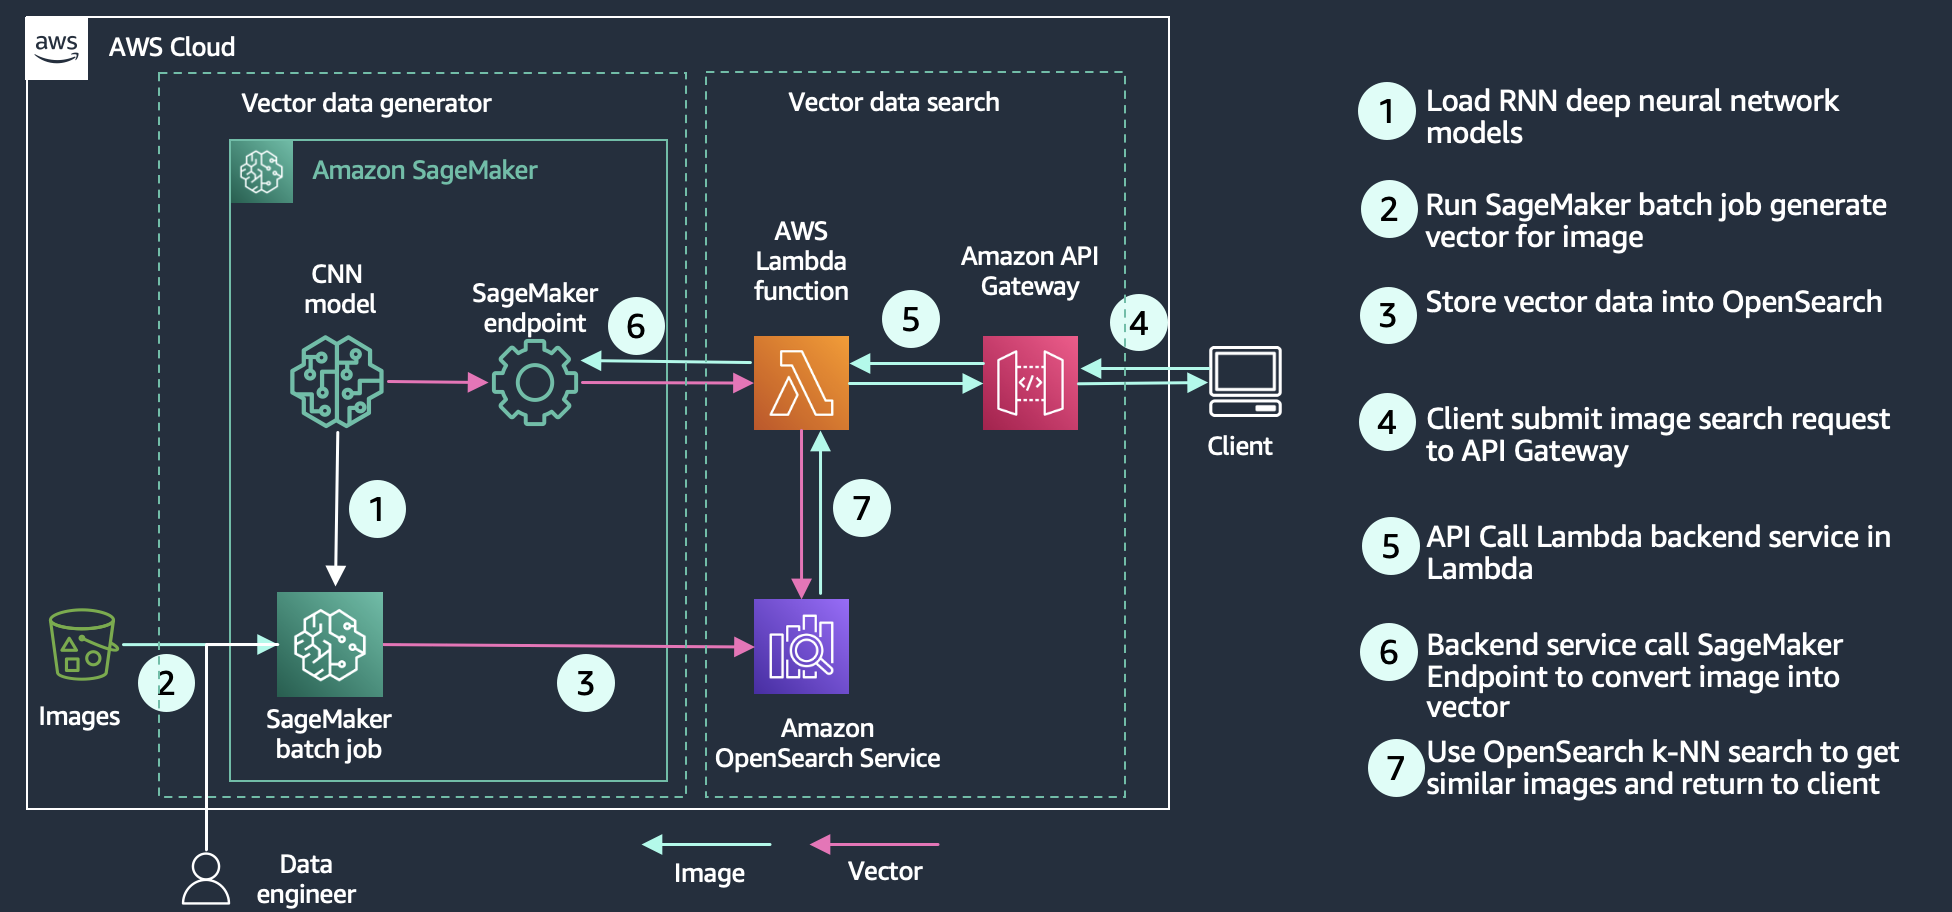
Media search enables users to query the search engine with rich media like images, audio, and video. Its implementation is similar to semantic search—you create vector embeddings for your search documents and then query OpenSearch Service with a vector. The difference is you use a computer vision deep neural network (e.g. Convolutional Neural Network (CNN)) such as ResNet to convert images into vectors. The following diagram shows an example architecture of building an image search with OpenSearch as the vector store.

Architecture diagram showing how to use Amazon OpenSearch Service to search rich media like images, videos, and audio files

Understanding the technology

OpenSearch uses approximate nearest neighbor (ANN) algorithms from the NMSLIB, FAISS, and Lucene libraries to power k-NN search. These search methods employ ANN to improve search latency for large datasets. Of the three search methods the k-NN plugin provides, this method offers the best search scalability for large datasets. The engine details are as follows:

  • Non-Metric Space Library (NMSLIB) – NMSLIB implements the HNSW ANN algorithm
  • Facebook AI Similarity Search (FAISS) – FAISS implements both HNSW and IVF ANN algorithms
  • Lucene – Lucene implements the HNSW algorithm

Each of the three engines used for approximate k-NN search has its own attributes that make one more sensible to use than the others in a given situation. You can follow the general information in this section to help determine which engine will best meet your requirements.

In general, NMSLIB and FAISS should be selected for large-scale use cases. Lucene is a good option for smaller deployments, but offers benefits like smart filtering where the optimal filtering strategy—pre-filtering, post-filtering, or exact k-NN—is automatically applied depending on the situation. The following table summarizes the differences between each option.

.

NMSLIB-HNSW

FAISS-HNSW

FAISS-IVF

Lucene-HNSW

Max Dimension

16,000

16,000

16,000

1024

Filter

Post filter

Post filter

Post filter

Filter while search

Training Required

No

No

Yes

No

Similarity Metrics

l2, innerproduct, cosinesimil, l1, linf

l2, innerproduct

l2, innerproduct

l2, cosinesimil

Vector Volume

Tens of billions

Tens of billions

Tens of billions

< Ten million

Indexing latency

Low

Low

Lowest

Low

Query Latency & Quality

Low latency & high quality

Low latency & high quality

Low latency & low quality

High latency & high quality

Vector Compression

Flat

Flat

Product Quantization

Flat

Product Quantization

Flat

Memory Consumption

High

High

Low with PQ

Medium

Low with PQ

High

Approximate and exact nearest-neighbor search

The OpenSearch Service k-NN plugin supports three different methods for obtaining the k-nearest neighbors from an index of vectors: approximate k-NN, score script (exact k-NN), and painless extensions (exact k-NN).

Approximate k-NN

The first method takes an approximate nearest neighbor approach—it uses one of several algorithms to return the approximate k-nearest neighbors to a query vector. Usually, these algorithms sacrifice indexing speed and search accuracy in return for performance benefits such as lower latency, smaller memory footprints, and more scalable search. Approximate k-NN is the best choice for searches over large indexes (that is, hundreds of thousands of vectors or more) that require low latency. You should not use approximate k-NN if you want to apply a filter on the index before the k-NN search, which greatly reduces the number of vectors to be searched. In this case, you should use either the score script method or painless extensions.

Score script

The second method extends the OpenSearch Service score script functionality to run a brute force, exact k-NN search over knn_vector fields or fields that can represent binary objects. With this approach, you can run k-NN search on a subset of vectors in your index (sometimes referred to as a pre-filter search). This approach is preferred for searches over smaller bodies of documents or when a pre-filter is needed. Using this approach on large indexes may lead to high latencies.

Painless extensions

The third method adds the distance functions as painless extensions that you can use in more complex combinations. Similar to the k-NN score script, you can use this method to perform a brute force, exact k-NN search across an index, which also supports pre-filtering. This approach has slightly slower query performance compared to the k-NN score script. If your use case requires more customization over the final score, you should use this approach over score script k-NN.

Vector search algorithms

The simple way to find similar vectors is to use k-nearest neighbors (k-NN) algorithms, which compute the distance between a query vector and the other vectors in the vector database. As we mentioned earlier, the score script k-NN and painless extensions search methods use the exact k-NN algorithms under the hood. However, in the case of extremely large datasets with high dimensionality, this creates a scaling problem that reduces the efficiency of the search. Approximate nearest neighbor (ANN) search methods can overcome this by employing tools that restructure indexes more efficiently and reduce the dimensionality of searchable vectors. There are different ANN search algorithms; for example, locality sensitive hashing, tree-based, cluster-based, and graph-based. OpenSearch implements two ANN algorithms: Hierarchical Navigable Small Worlds (HNSW) and Inverted File System (IVF). For a more detailed explanation of how the HNSW and IVF algorithms work in OpenSearch, see blog post “Choose the k-NN algorithm for your billion-scale use case with OpenSearch”.

Hierarchical Navigable Small Worlds

The HNSW algorithm is one of the most popular algorithms out there for ANN search. The core idea of the algorithm is to build a graph with edges connecting index vectors that are close to each other. Then, on search, this graph is partially traversed to find the approximate nearest neighbors to the query vector. To steer the traversal towards the query’s nearest neighbors, the algorithm always visits the closest candidate to the query vector next.

Inverted File

The IVF algorithm separates your index vectors into a set of buckets, then, to reduce your search time, only searches through a subset of these buckets. However, if the algorithm just randomly split up your vectors into different buckets, and only searched a subset of them, it would yield a poor approximation. The IVF algorithm uses a more elegant approach. First, before indexing begins, it assigns each bucket a representative vector. When a vector is indexed, it gets added to the bucket that has the closest representative vector. This way, vectors that are closer to each other are placed roughly in the same or nearby buckets.

Vector similarity metrics

All search engines use a similarity metric to rank and sort results and bring the most relevant results to the top. When you use a plain text query, the similarity metric is called TF-IDF, which measures the importance of the terms in the query and generates a score based on the number of textual matches. When your query includes a vector, the similarity metrics are spatial in nature, taking advantage of proximity in the vector space. OpenSearch supports several similarity or distance measures:

  • Euclidean distance – The straight-line distance between points.
  • L1 (Manhattan) distance – The sum of the differences of all of the vector components. L1 distance measures how many orthogonal city blocks you need to traverse from point A to point B.
  • L-infinity (chessboard) distance – The number of moves a King would make on an n-dimensional chessboard. It’s different than Euclidean distance on the diagonals—a diagonal step on a 2-dimensional chessboard is 1.41 Euclidean units away, but 2 L-infinity units away.
  • Inner product – The product of the magnitudes of two vectors and the cosine of the angle between them. Usually used for natural language processing (NLP) vector similarity.
  • Cosine similarity – The cosine of the angle between two vectors in a vector space.
  • Hamming distance – For binary-coded vectors, the number of bits that differ between the two vectors.

Advantage of OpenSearch as a vector database

When you use OpenSearch Service as a vector database, you can take advantage of the service’s features like usability, scalability, availability, interoperability, and security. More importantly, you can use OpenSearch’s search features to enhance the search experience. For example, you can use Learning to Rank in OpenSearch to integrate user clickthrough behavior data into your search application and improve search relevance. You can also combine OpenSearch text search and vector search capabilities to search documents with keyword and semantic similarity. You can also use other fields in the index to filter documents to improve relevance. For advanced users, you can use a hybrid scoring model to combine OpenSearch’s text-based relevance score, computed with the Okapi BM25 function and its vector search score to improve the ranking of your search results.

Scale and limits

OpenSearch as vector database support billions of vector records. Keep in mind the following calculator regarding number of vectors and dimensions to size your cluster.

Number of vectors

OpenSearch VectorDB takes advantage of the sharding capabilities of OpenSearch and can scale to billions of vectors at single-digit millisecond latencies by sharding vectors and scale horizontally by adding more nodes. The number of vectors that can fit in a single machine is a function of the off-heap memory availability on the machine. The number of nodes required will depend on the amount of memory that can be used for the algorithm per node and the total amount of memory required by the algorithm. The more nodes, the more memory and better performance. The amount of memory available per node is computed as memory_available = (node_memoryjvm_size) * circuit_breaker_limit, with the following parameters:

  • node_memory – The total memory of the instance.
  • jvm_size – The OpenSearch JVM heap size. This is set to half of the instance’s RAM, capped at approximately 32 GB.
  • circuit_breaker_limit – The native memory usage threshold for the circuit breaker. This is set to 0.5.

Total cluster memory estimation depends on total number of vector records and algorithms. HNSW and IVF have different memory requirements. You can refer to Memory Estimation for more details.

Number of dimensions

OpenSearch’s current dimension limit for the vector field knn_vector is 16,000 dimensions. Each dimension is represented as a 32-bit float. The more dimensions, the more memory you’ll need to index and search. The number of dimensions is usually determined by the embedding models that translate the entity to a vector. There are a lot of options to choose from when building your knn_vector field. To determine the correct methods and parameters to choose, refer to Choosing the right method.

Customer stories:

Amazon Music

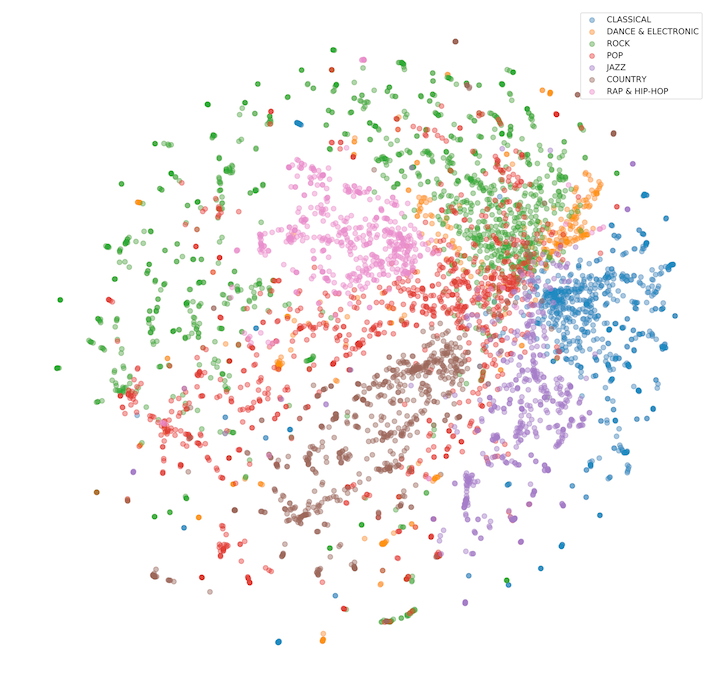
Amazon Music is always innovating to provide customers with unique and personalized experiences. One of Amazon Music’s approaches to music recommendations is a remix of a classic Amazon innovation, item-to-item collaborative filtering, and vector databases. Using data aggregated based on user listening behavior, Amazon Music has created an embedding model that encodes music tracks and customer representations into a vector space where neighboring vectors represent tracks that are similar. 100 million songs are encoded into vectors, indexed into OpenSearch, and served across multiple geographies to power real-time recommendations. OpenSearch currently manages 1.05 billion vectors and supports a peak load of 7,100 vector queries per second to power Amazon Music recommendations.

The item-to-item collaborative filter continues to be among the most popular methods for online product recommendations because of its effectiveness at scaling to large customer bases and product catalogs. OpenSearch makes it easier to operationalize and further the scalability of the recommender by providing scale-out infrastructure and k-NN indexes that grow linearly with respect to the number of tracks and similarity search in logarithmic time.

The following figure visualizes the high-dimensional space created by the vector embedding.

A visualization of the vector encoding of Amazon Music entries in the large vector space

Brand protection at Amazon

Amazon strives to deliver the world’s most trustworthy shopping experience, offering customers the widest possible selection of authentic products. To earn and maintain our customers’ trust, we strictly prohibit the sale of counterfeit products, and we continue to invest in innovations that ensure only authentic products reach our customers. Amazon’s brand protection programs build trust with brands by accurately representing and completely protecting their brand. We strive to ensure that public perception mirrors the trustworthy experience we deliver. Our brand protection strategy focuses on four pillars: (1) Proactive Controls (2) Powerful Tools to Protect Brands (3) Holding Bad Actors Accountable (4) Protecting and Educating Customers. Amazon OpenSearch Service is a key part of Amazon’s Proactive Controls.

In 2022, Amazon’s automated technology scanned more than 8 billion attempted changes daily to product detail pages for signs of potential abuse. Our proactive controls found more than 99% of blocked or removed listings before a brand ever had to find and report it. These listings were suspected of being fraudulent, infringing, counterfeit, or at risk of other forms of abuse. To perform these scans, Amazon created tooling that uses advanced and innovative techniques, including the use of advanced machine learning models to automate the detection of intellectual property infringements in listings across Amazon’s stores globally. A key technical challenge in implementing such automated system is the ability to search for protected intellectual property within a vast billion-vector corpus in a fast, scalable and cost effective manner. Leveraging Amazon OpenSearch Service’s scalable vector database capabilities and distributed architecture, we successfully developed an ingestion pipeline that has indexed a total of 68 billion, 128- and 1024-dimension vectors into OpenSearch Service to enable brands and automated systems to conduct infringement detection, in real-time, through a highly available and fast (sub-second) search API.

Conclusion

Whether you’re building a generative AI solution, searching rich media and audio, or bringing more semantic search to your existing search-based application, OpenSearch is a capable vector database. OpenSearch supports a variety of engines, algorithms, and distance measures that you can employ to build the right solution. OpenSearch provides a scalable engine that can support vector search at low latency and up to billions of vectors. With OpenSearch and its vector DB capabilities, your users can find that 8-foot-blue couch easily, and relax by a cozy fire.


About the Authors

Jon Handler is a Senior Principal Solutions Architect with AWSJon Handler is a Senior Principal Solutions Architect at Amazon Web Services based in Palo Alto, CA. Jon works closely with OpenSearch and Amazon OpenSearch Service, providing help and guidance to a broad range of customers who have search and log analytics workloads that they want to move to the AWS Cloud. Prior to joining AWS, Jon’s career as a software developer included four years of coding a large-scale, eCommerce search engine. Jon holds a Bachelor of the Arts from the University of Pennsylvania, and a Master of Science and a Ph. D. in Computer Science and Artificial Intelligence from Northwestern University.

Jianwei Li is a Principal Analytics Specialist TAM at Amazon Web Services. Jianwei provides consultant service for customers to help customer design and build modern data platform. Jianwei has been working in big data domain as software developer, consultant and tech leader.

Dylan Tong is a Senior Product Manager at AWS. He works with customers to help drive their success on the AWS platform through thought leadership and guidance on designing well architected solutions. He has spent most of his career building on his expertise in data management and analytics by working for leaders and innovators in the space.

Vamshi Vijay Nakkirtha is a Software Engineering Manager working on the OpenSearch Project and Amazon OpenSearch Service. His primary interests include distributed systems. He is an active contributor to various plugins, like k-NN, GeoSpatial, and dashboard-maps.

Let’s Architect! Open-source technologies on AWS

Post Syndicated from Vittorio Denti original https://aws.amazon.com/blogs/architecture/lets-architect-open-source-technologies-on-aws/

We brought you a Let’s Architect! blog post about open-source on AWS that covered some technologies with development led by AWS/Amazon, as well as well-known solutions available on managed AWS services. Today, we’re following the same approach to share more insights about the process itself for developing open-source. That’s why the first topic we discuss in this post is a re:Invent talk from Heitor Lessa, Principal Solutions Architect at AWS, explaining some interesting approaches for developing and scaling successful open-source projects.

This edition of Let’s Architect! also touches on observability with Open Telemetry, Apache Kafka on AWS, and Infrastructure as Code with an hands-on workshop on AWS Cloud Development Kit (AWS CDK).

Powertools for AWS Lambda: Lessons from the road to 10 million downloads

Powertools for AWS Lambda is an open-source library to help engineering teams implement serverless best practices. In two years, Powertools went from an initial prototype to a fast-growing project in the open-source world. Rapid growth along with support from a wide community led to challenges from balancing new features with operational excellence to triaging bug reports and RFCs and scaling and redesigning documentation.

In this session, you can learn about Powertools for AWS Lambda to understand what it is and the problems it solves. Moreover, there are many valuable lessons to learn how to create and scale a successful open-source project. From managing the trade-off between releasing new features and achieving operational stability to measuring the impact of the project, there are many challenges in open-source projects that require careful thought.

Take me to this video!

Heitor Lessa describing one the key lessons: development and releasing new features should be as important as the other activities (governance, operational excellence, and more)

Heitor Lessa describing one of the key lessons: development and releasing new features should be as important as the other activities (governance, operational excellence, and more).

Observability the open-source way

The recent blog post Let’s Architect! Monitoring production systems at scale talks about the importance of monitoring. Setting up observability is critical to maintain application and infrastructure health, but instrumenting applications to collect monitoring signals such as metrics and logs can be challenging when using vendor-specific SDKs.

This video introduces you to OpenTelemetry, an open-source observability framework. OpenTelemetry provides a flexible, single vendor-agnostic SDK based on open-source specifications that developers can use to instrument and collect signals from applications. This resource explains how it works in practice and how to monitor microservice-based applications with the OpenTelemetry SDK.

Take me to this video!

With AWS Distro for OpenTelemetry, you can collect data from your AWS resources.

With AWS Distro for OpenTelemetry, you can collect data from your AWS resources.

Best practices for right-sizing your Apache Kafka clusters to optimize performance and cost

Apache Kafka is an open-source streaming data store that decouples applications producing streaming data (producers) into its data store from applications consuming streaming data (consumers) from its data store. Amazon Managed Streaming for Apache Kafka (Amazon MSK) allows you to use the open-source version of Apache Kafka with the service managing infrastructure and operations for you.

This blog post explains how the underlying infrastructure configuration can affect Apache Kafka performance. You can learn strategies on how to size the clusters to meet the desired throughput, availability, and latency requirements. This resource helps you discover strategies to find the optimal sizing for your resources, and learn the mental models adopted to conduct the investigation and derive the conclusions.

Take me to this blog!

Comparisons of put latencies for three clusters with different broker sizes

Comparisons of put latencies for three clusters with different broker sizes

AWS Cloud Development Kit workshop

AWS Cloud Development Kit (AWS CDK) is an open-source software development framework that allows you to provision cloud resources programmatically (Infrastructure as Code or IaC) by using familiar programming languages such as Python, Typescript, Javascript, Java, Go, and C#/.Net.

CDK allows you to create reusable template and assets, test your infrastructure, make deployments repeatable, and make your cloud environment stable by removing manual (and error-prone) operations. This workshop introduces you to CDK, where you can learn how to provision an initial simple application as well as become familiar with more advanced concepts like CDK constructs.

Take me to this workshop!

This construct can be attached to any Lambda function that is used as an API Gateway backend. It counts how many requests were issued to each URL.

This construct can be attached to any Lambda function that is used as an API Gateway backend. It counts how many requests were issued to each URL.

See you next time!

Thanks for joining our conversation! To find all the blogs from this series, you can check out the Let’s Architect! list of content on the AWS Architecture Blog.

The collective thoughts of the interwebz