Post Syndicated from The Atlantic original https://www.youtube.com/watch?v=JD8-lFMiuWE
Can We Bend Tech’s Future Toward Abundance? | Progress Summit Morning Programming
Post Syndicated from The Atlantic original https://www.youtube.com/watch?v=HoO_-WCTmb8
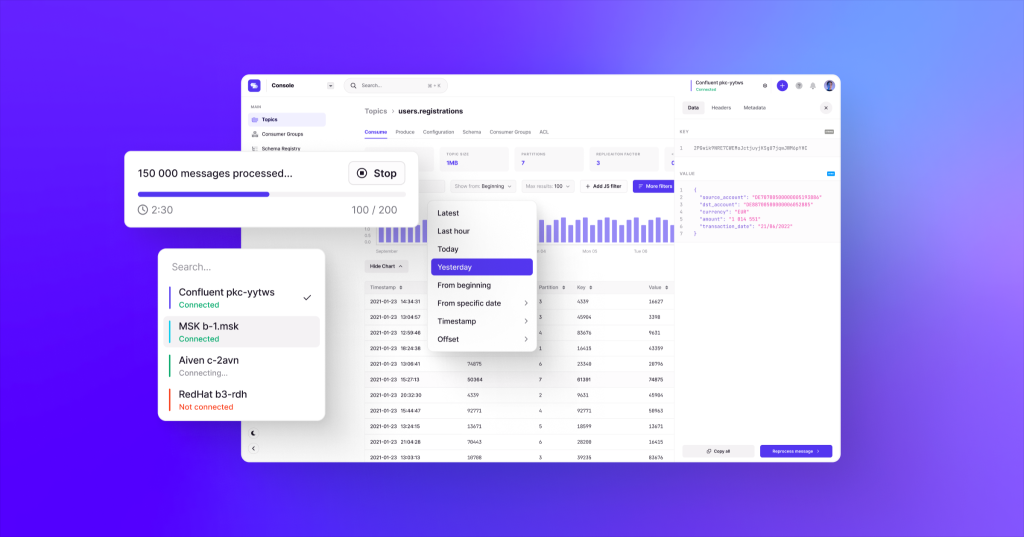
Gain visibility into your Amazon MSK cluster by deploying the Conduktor Platform
Post Syndicated from Stéphane Maarek original https://aws.amazon.com/blogs/big-data/gain-visibility-into-your-amazon-msk-cluster-by-deploying-the-conduktor-platform/
This is a guest post by AWS Data Hero and co-founder of Conduktor, Stephane Maarek.
Deploying Apache Kafka on AWS is now easier, thanks to Amazon Managed Streaming for Apache Kafka (Amazon MSK). In a few clicks, it provides you with a production-ready Kafka cluster on which you can run your applications and create data streams.
Apache Kafka is an open-source project, and no official user interfaces are available. The lack of visibility into Apache Kafka is a factor in the slow development of applications.
The recent announcement of the Conduktor Platform makes Amazon MSK operations simple, and you can solve Kafka issues end to end with solutions for testing, monitoring, data quality, governance, and security.
You can use the Conduktor Platform to monitor both types of MSK clusters, provisioned and serverless. In this post, we demonstrate how to use AWS Identity and Access Management (IAM) based security to administer our MSK cluster.
Solution overview
We look at how we can deploy the Conduktor Platform on Amazon MSK in a production-ready deployment so you can try it out today.
The solution is fully serverless and customizable. Everything is deployed using AWS CloudFormation templates.
The source code and CloudFormation templates used in this post are available in the GitHub repo.
To implement this solution, we complete the following high-level steps:
- Deploy a CloudFormation template to create our customized Docker image for the Conduktor Platform using AWS CodeBuild.
- Optionally, deploy an MSK cluster in provisioned or serverless mode using a CloudFormation template.
- Deploy the Conduktor Platform as an AWS Fargate container against our MSK cluster using a CloudFormation template.
Create a customized configuration for the Conduktor Platform
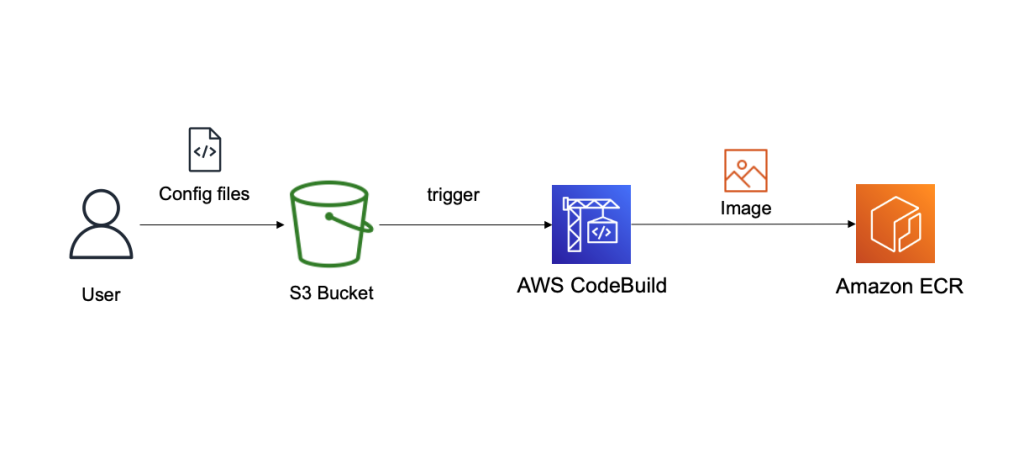
The Conduktor Platform uses a YAML configuration file to define the cluster connection endpoints. Therefore, we must create a customized Docker image of the Conduktor Platform that is able to connect to a cluster on Amazon MSK with a customized YAML file. For this, we use CodeBuild, and we store our configuration files in Amazon Simple Storage Service (Amazon S3). The final image is stored in Amazon Elastic Container Registry (Amazon ECR). The following diagram illustrates this workflow.
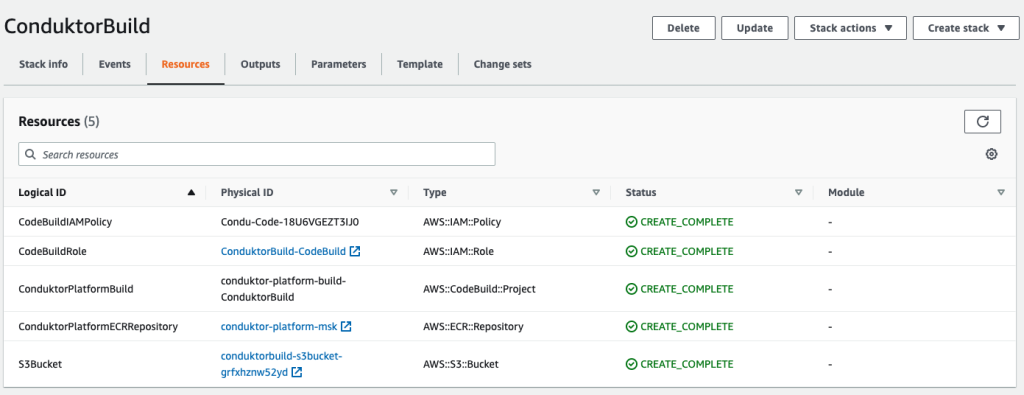
- Deploy the first CloudFormation template to create the following resources:
- An S3 bucket to store our configuration files.
- An ECR repository to store our final Docker image.
- A CodeBuild project to build that Docker image.
- An IAM role and policy to allow CodeBuild to perform the build.
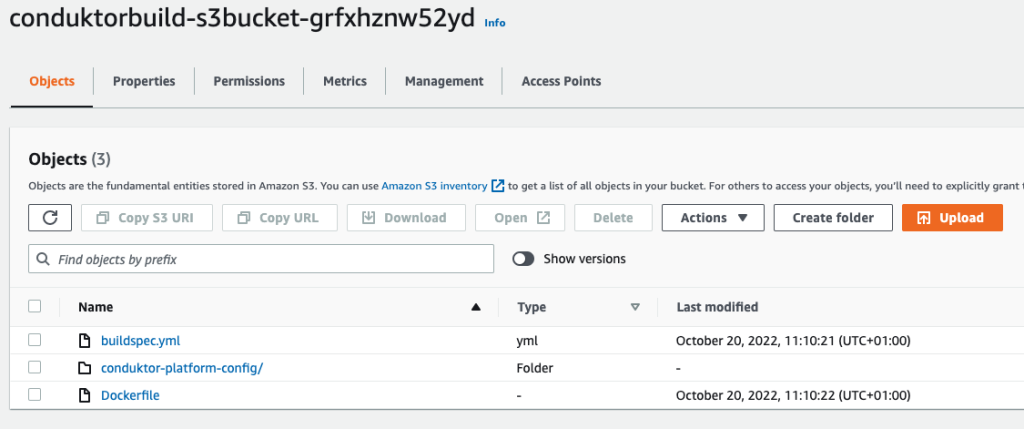
Now we need to upload our files into Amazon S3.
- Upload the following files:
- The file buildspec.yml, which is used by CodeBuild to build our primary Docker image.
- The Dockerfile, which contains instructions on how to build our final Docker image.
- The folder conduktor-platform-config (as is), which contains the configuration files to connect to Amazon MSK.
- At this stage, you can customize the
conduktor-platform.yamlfile, allowing you to connect to one MSK cluster:
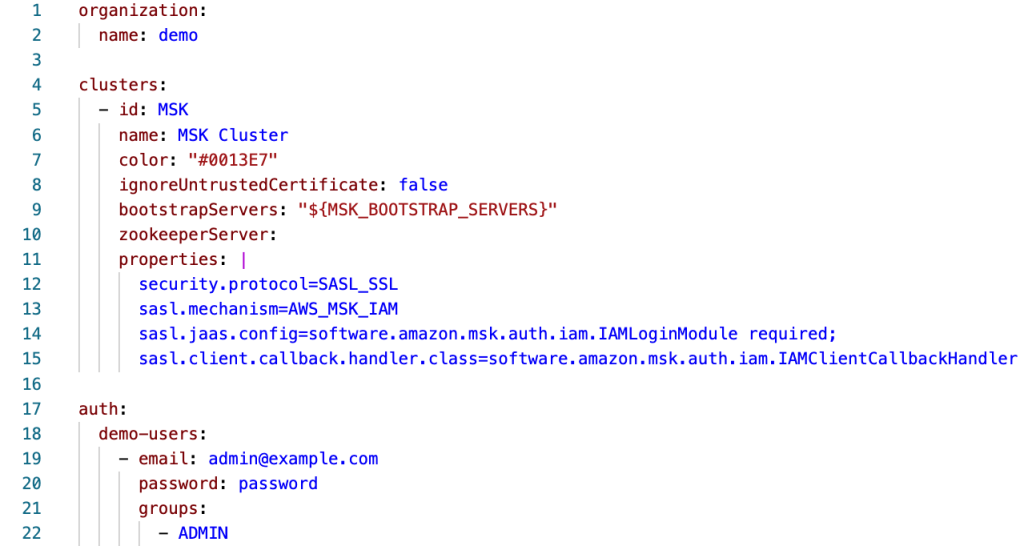
Alternatively, you can connect to multiple MSK clusters or external ones by specifying multiple Kafka bootstrap servers, as shown in the following code. You can also use the same configuration file to specify the schema registry URL, Kafka Connect connection details, and SSO.
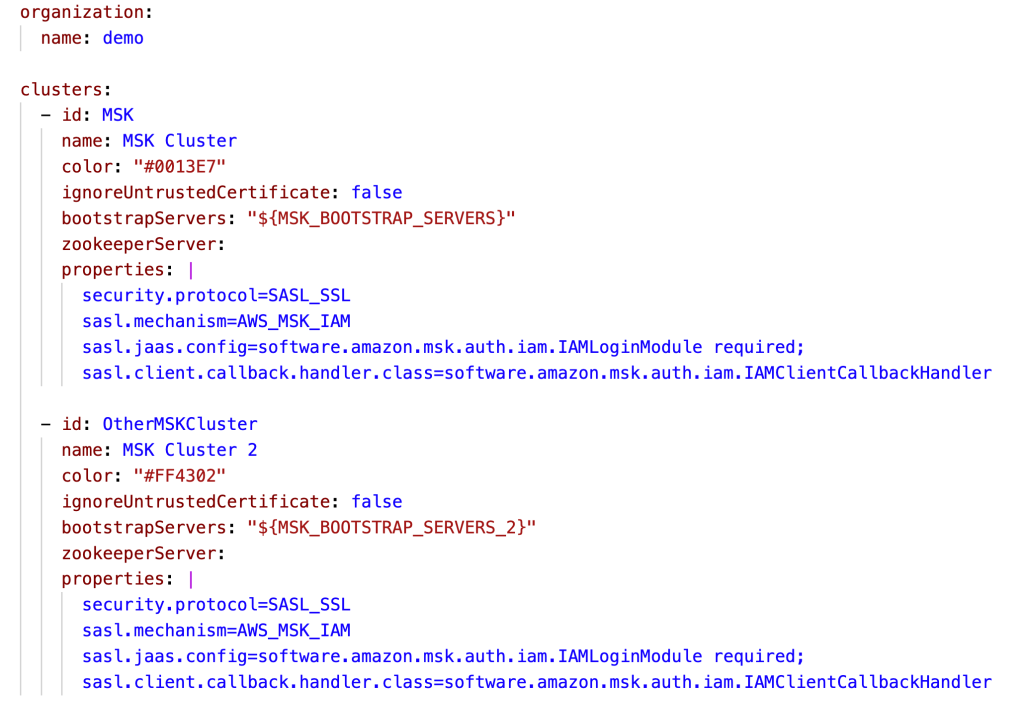
A single-Region Conduktor Platform deployment can work for multi-Region MSK clusters, although natural latency is expected. For latency-sensitive usage, you can deploy this solution in every Region in which you’re using Amazon MSK.
After uploading the files and configurations in your S3 bucket, let’s run CodeBuild to generate a new image.
- On the CodeBuild console, navigate to the project and choose Start build.
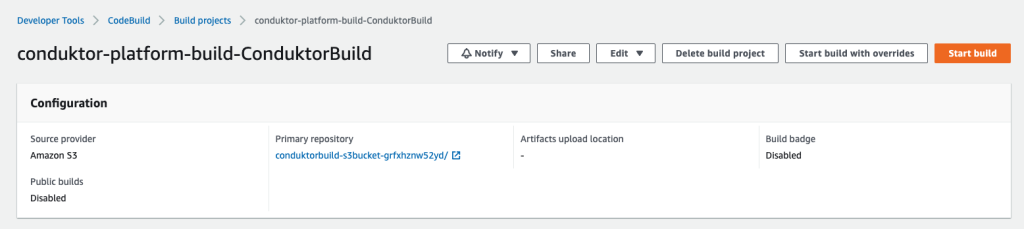
The build should complete in about 3 minutes.
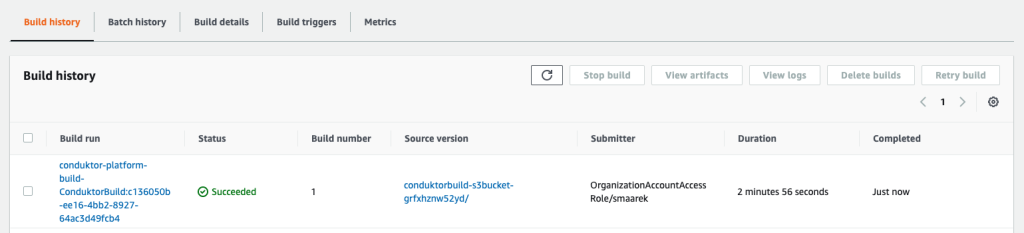
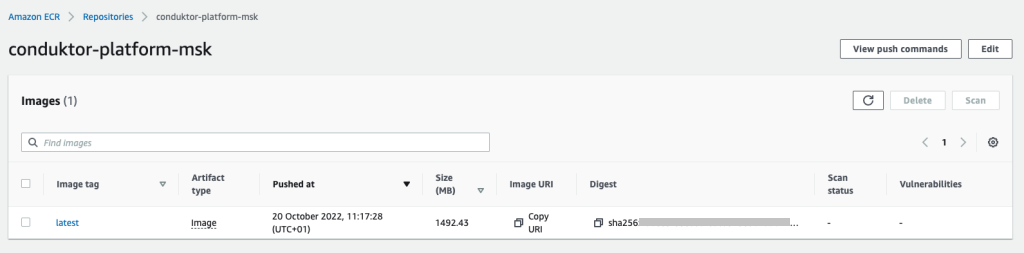
The final image is pushed to Amazon ECR thanks to the script hosted in our build-spec.yml script run by CodeBuild. We’re now done with our first step. Your Conduktor Platform setup can now fully connect to your MSK cluster.
Start the MSK cluster
If you already have an MSK cluster set up with IAM access control, you can skip this step. If not, you can create one using the provided CloudFormation template.
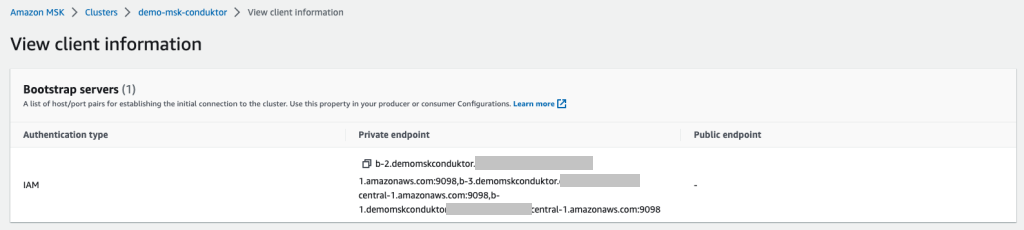
From the MSK cluster (the new one or existing one), retrieve two essential pieces of information:
- The bootstrap servers connection string, which is accessed by choosing Client Information
- The MSK security group ID (see the following screenshot)

We use IAM access control so that we only need to use IAM policies to connect to our cluster.
If you’re using another security mechanism (such as SASL/SCRAM), you need to modify the Conduktor configuration files with the right properties, upload them back into Amazon S3, and rebuild the Conduktor image using CodeBuild.
Conduktor supports every single Kafka authentication method, including the ones supported by Amazon MSK: IAM access control, mutual TLS authentication, and user name/password using SASL/SCRAM.
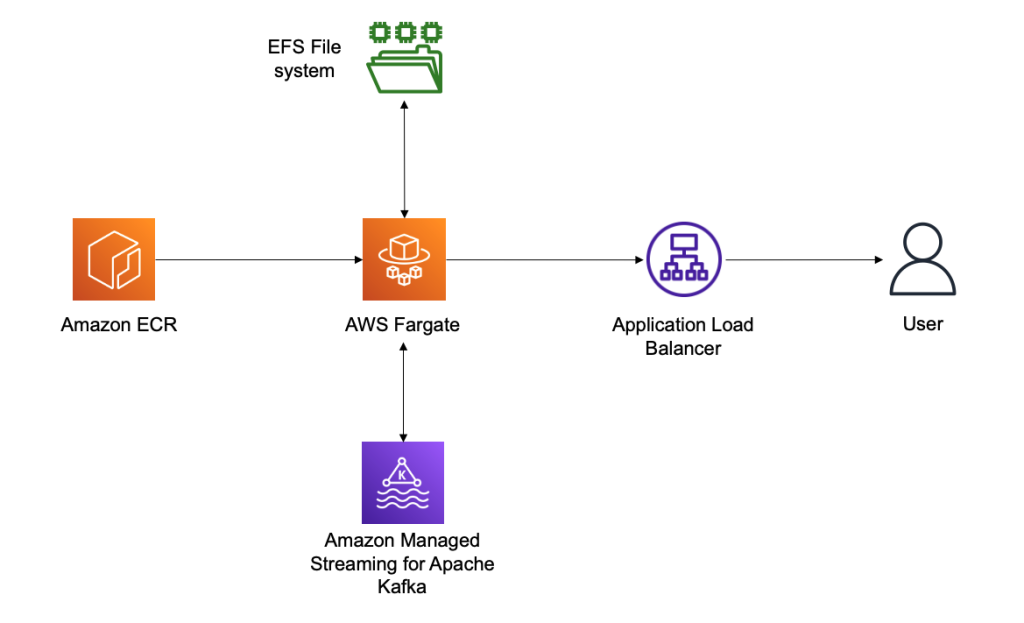
Deploy the Conduktor Platform on Amazon ECS with Fargate
The last step is to deploy the Conduktor Platform. For this, we prefer running serverless solutions using Amazon Elastic Container Service (Amazon ECS) with Fargate. This allows you to right-size your containers in the future in case your usage of Conduktor grows over time.
Conduktor stores persistent data in the /var/conduktor file system folder, to store configuration, cache computation results, store logs, and run an internal database (for example, if you start creating data masking rules). For the persistence layer, we use Amazon Elastic File System (Amazon EFS), an elastic network file system that can be mounted on Fargate to provide a persistence layer.
Finally, we expose our Fargate container through an Application Load Balancer, giving us a public static DNS endpoint to expose the Conduktor Platform and giving us complete control over the network security to access the Conduktor Platform. The following diagram illustrates our architecture.
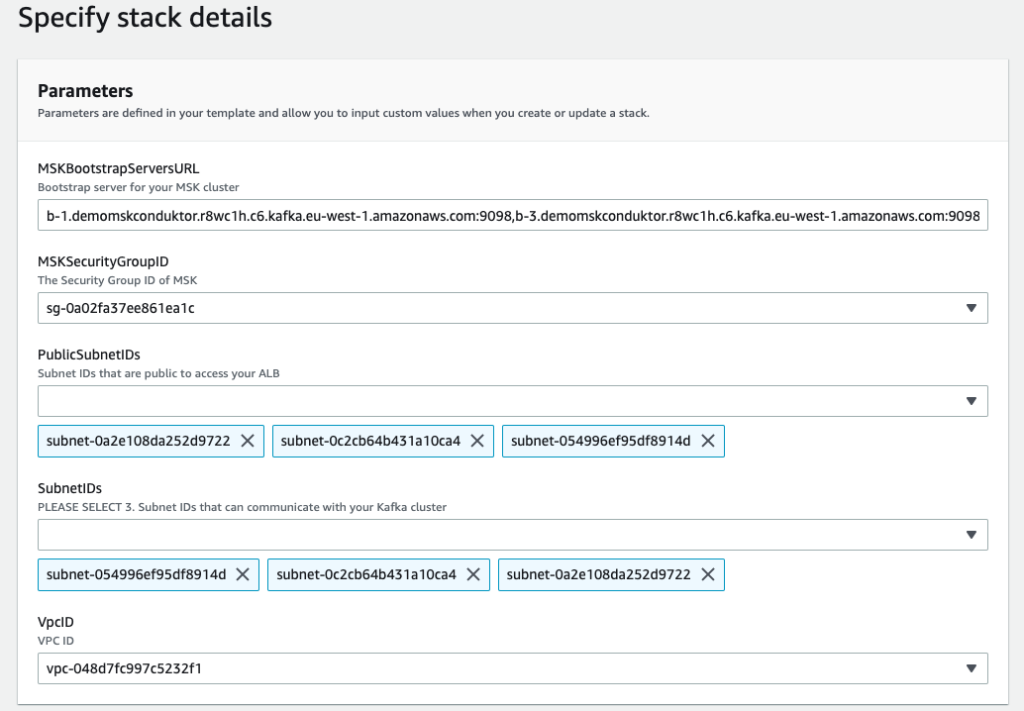
We deploy our last CloudFormation file and specify some important parameters:
- MSKBookstrapServersURL – This parameter is necessary to tell Conduktor which MSK cluster to connect to
- MSKSecurityGroupID – The MSK security group is necessary to allow the template to add a security group ingress rule to it, thereby allowing our ECS task
- PublicSubnetIDs – The public subnet IDs are for your Application Load Balancer
- SubnetIDs – The subnet IDs are for your ECS task and can be the same subnets or private subnets (as long as they have access to the MSK cluster and the other public subnets)
- VpcID – This is the VPC you’re deploying to
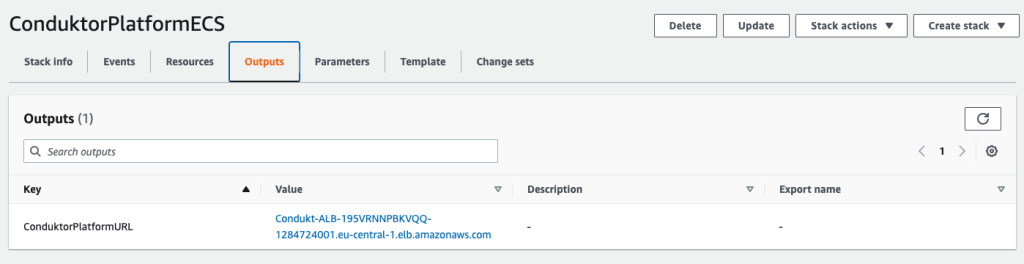
After deploying the template, on the Output tab of the stack, you can find the Application Load Balancer URL.
We use this URL and log in to the Conduktor Platform with the user name [email protected] and password password. These login credentials can be changed using the YAML configuration file, and you can even enable SSO and LDAP.
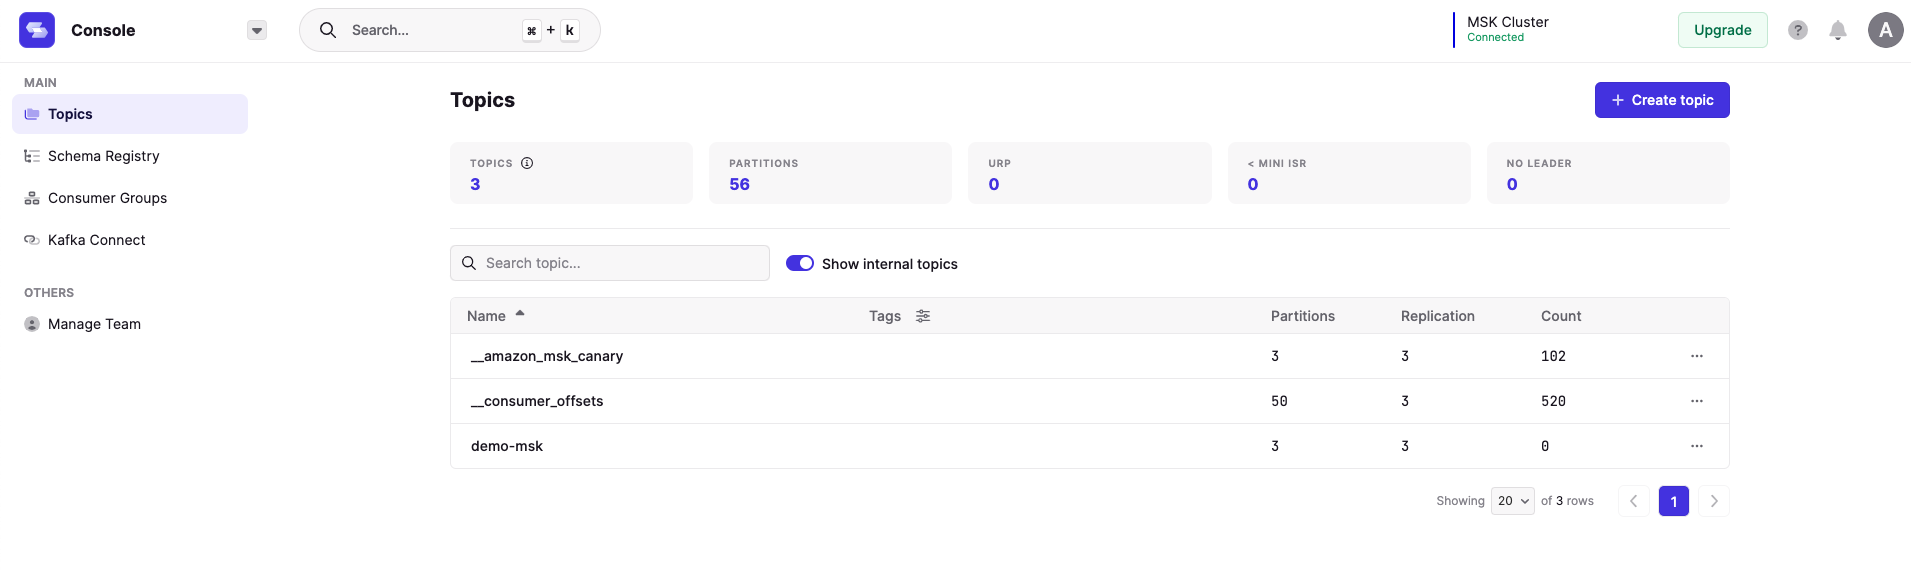
On the Conduktor console, you can start creating topics, producing data, consuming data, and much more! AWS Glue Schema Registry support is coming soon, and Confluent Schema Registry compatibility is already available.
Clean up
To clean up your AWS account, perform the following steps in order:
- Delete the third CloudFormation template (3 – create ECS Service.yaml).
- Delete the second CloudFormation template (2 – create MSK cluster.yaml).
- Empty the contents of your S3 bucket.
- Delete all your images in your ECR repository.
- Delete the first CloudFormation template (1 – base conduktor.yaml).
Conclusion
You can use the Conduktor Platform against as many MSK clusters as desired by editing the file conduktor-platform.yaml. You can even connect to your clusters running elsewhere, for example on Amazon Elastic Compute Cloud (Amazon EC2).
On our roadmap, we’re working on a complete integration with Amazon MSK, including AWS Glue Schema Registry support, Amazon MSK Connect support, and complete monitoring capabilities.
The Conduktor Platform offers a limited free tier with no time limit. Head to Conduktor’s Get Started page and create an account to start using the Platform alongside MSK clusters today.
About the Author
 Stéphane Maarek is the co-founder of Conduktor. He is also the lead instructor on Udemy for learning Apache Kafka and AWS Certifications, having taught these technologies to over 1.5 million learners. Through Conduktor, he wants to democratize access to Apache Kafka and make its usage seamless and enterprise-ready.
Amazon EMR launches support for Amazon EC2 C6i, M6i, I4i, R6i and R6id instances to improve cost performance for Spark workloads by 6–33%
Post Syndicated from Al MS original https://aws.amazon.com/blogs/big-data/amazon-emr-launches-support-for-amazon-ec2-c6i-m6i-i4i-r6i-and-r6id-instances-to-improve-cost-performance-for-spark-workloads-by-6-33/
Amazon EMR provides a managed service to easily run analytics applications using open-source frameworks such as Apache Spark, Hive, Presto, Trino, HBase, and Flink. The Amazon EMR runtime for Spark and Presto includes optimizations that provide over two times performance improvements over open-source Apache Spark and Presto, so that your applications run faster and at lower cost.
With Amazon EMR release 6.8, you can now use Amazon Elastic Compute Cloud (Amazon EC2) instances such as C6i, M6i, I4i, R6i, and R6id, which use the third-generation Intel Xeon scalable processors. Using these new instances with Amazon EMR improves cost-performance by an additional 5–33% over previous generation instances.
In this post, we describe how we estimated the cost-performance benefit from using Amazon EMR with these new instances compared to using equivalent previous generation instances.
Amazon EMR runtime performance improvements with EC2 I4i instances
We ran TPC-DS 3 TB benchmark queries on Amazon EMR 6.8 using the Amazon EMR runtime for Apache Spark (compatible with Apache Spark 3.3) with five node clusters of I4i instances with data in Amazon Simple Storage Service (Amazon S3), and compared it to equivalent sized I3 instances. We measured performance improvements using the total query runtime and geometric mean of query runtime across the TPC-DS 3 TB benchmark queries.
Our results showed between 36.41–44.39% improvement in total query runtime performance on I4i instance EMR clusters compared to equivalent I3 instance EMR clusters, and between 36–45.2% improvement in geometric mean. To measure cost improvement, we added up the Amazon EMR and Amazon EC2 cost per instance per hour (on-demand) and multiplied it by the total query runtime. Note that I4i 32XL instances were not benchmarked because I3 instances don’t have the 32 XL size available. We observed between 22.56–33.1% reduced instance hour cost on I4i instance EMR clusters compared to equivalent I3 instance EMR clusters to run the TPC-DS benchmark queries. All TPC-DS queries ran faster on I4i instance clusters compared to I3 instance clusters.
The following table shows the results from running TPC-DS 3 TB benchmark queries using Amazon EMR 6.8 over equivalent I3 and I4i instance EMR clusters.
| Instance Size | 16 XL | 8 XL | 4 XL | 2 XL | XL |
| Number of core instances in EMR cluster | 5 | 5 | 5 | 5 | 5 |
| Total query runtime on I3 (seconds) | 4752.15457 | 4506.43694 | 7110.03042 | 11853.40336 | 21333.05743 |
| Total query runtime on I4I (seconds) | 2642.77407 | 2812.05517 | 4415.0023 | 7537.52779 | 12981.20251 |
| Total query runtime improvement with I4I | 44.39% | 37.60% | 37.90% | 36.41% | 39.15% |
| Geometric mean query runtime on I3 (sec) | 34.99551 | 29.14821 | 41.53093 | 60.8069 | 95.46128 |
| Geometric mean query runtime on I4I (sec) | 19.17906 | 18.65311 | 25.66263 | 38.13503 | 56.95073 |
| Geometric mean query runtime improvement with I4I | 45.20% | 36.01% | 38.21% | 37.29% | 40.34% |
| EC2 I3 instance price ($ per hour) | $4.990 | $2.496 | $1.248 | $0.624 | $0.312 |
| EMR I3 instance price ($ per hour) | $0.270 | $0.270 | $0.270 | $0.156 | $0.078 |
| (EC2 + EMR) I3 instance price ($ per hour) | $5.260 | $2.766 | $1.518 | $0.780 | $0.390 |
| Cost of running on I3 ($ per instance) | $6.943 | $3.462 | $2.998 | $2.568 | $2.311 |
| EC2 I4I instance price ($ per hour) | $5.491 | $2.746 | $1.373 | $0.686 | $0.343 |
| EMR I4I price ($ per hour per instance) | $1.373 | $0.687 | $0.343 | $0.172 | $0.086 |
| (EC2 + EMR) I4I instance price ($ per hour) | $6.864 | $3.433 | $1.716 | $0.858 | $0.429 |
| Cost of running on I4I ($ per instance) | $5.039 | $2.681 | $2.105 | $1.795 | $1.546 |
| Total cost reduction with I4I including performance improvement | -27.43% | -22.56% | -29.79% | -30.09% | -33.10% |
The following graph shows per query improvements we observed on I4i 2XL instances with EMR Runtime for Spark on Amazon EMR version 6.8 compared to equivalent I3 2XL instances for the TPC-DS 3 TB benchmark.

Amazon EMR runtime performance improvements with EC2 M6i instances
M6i instances showed a similar performance improvement while running Apache Spark workloads compared to equivalent M5 instances. Our test results showed between 13.45–29.52% improvement in total query runtime for seven different instance sizes within the instance family, and between 7.98–25.37% improvement in geometric mean. On cost comparison, we observed 7.98–25.37% reduced instance hour cost on M6i instance EMR clusters compared to M5 EMR instance clusters to run the TPC-DS benchmark queries.
The following table shows the results from running TPC-DS 3 TB benchmark queries using Amazon EMR 6.8 over equivalent M6i and M5 instance EMR clusters.
| Instance Size | 24 XL | 16 XL | 12 XL | 8 XL | 4 XL | 2 XL | XL |
| Number of core instances in EMR cluster | 5 | 5 | 5 | 5 | 5 | 5 | 5 |
| Total query runtime on M5 (seconds) | 4027.58043 | 3782.10766 | 3348.05362 | 3516.4308 | 5621.22532 | 10075.45109 | 17278.15146 |
| Total query runtime on M6I (seconds) | 3106.43834 | 2665.70607 | 2714.69862 | 3043.5975 | 4195.02715 | 8226.88301 | 14515.50394 |
| Total query runtime improvement with M6I | 22.87% | 29.52% | 18.92% | 13.45% | 25.37% | 18.35% | 15.99% |
| Geometric mean query runtime M5 (sec) | 30.45437 | 28.5207 | 23.95314 | 23.55958 | 32.95975 | 49.43178 | 75.95984 |
| Geometric mean query runtime M6I (sec) | 23.76853 | 19.21783 | 19.16869 | 19.9574 | 24.23012 | 39.09965 | 60.79494 |
| Geometric mean query runtime improvement with M6I | 21.95% | 32.62% | 19.97% | 15.29% | 26.49% | 20.90% | 19.96% |
| EC2 M5 instance price ($ per hour) | $4.61 | $3.07 | $2.30 | $1.54 | $0.77 | $0.38 | $0.19 |
| EMR M5 instance price ($ per hour) | $0.27 | $0.27 | $0.27 | $0.27 | $0.19 | $0.10 | $0.05 |
| (EC2 + EMR) M5 instance price ($ per hour) | $4.88 | $3.34 | $2.57 | $1.81 | $0.96 | $0.48 | $0.24 |
| Cost of running on M5 ($ per instance) | $5.46 | $3.51 | $2.39 | $1.76 | $1.50 | $1.34 | $1.15 |
| EC2 M6I instance price ($ per hour) | $4.61 | $3.07 | $2.30 | $1.54 | $0.77 | $0.38 | $0.19 |
| EMR M6I price ($ per hour per instance) | $1.15 | $0.77 | $0.58 | $0.38 | $0.19 | $0.10 | $0.05 |
| (EC2 + EMR) M6I instance price ($ per hour) | $5.76 | $3.84 | $2.88 | $1.92 | $0.96 | $0.48 | $0.24 |
| Cost of running on M6I ($ per instance) | $4.97 | $2.84 | $2.17 | $1.62 | $1.12 | $1.10 | $0.97 |
| Total cost reduction with M6I including performance improvement | -8.92% | -19.02% | -9.28% | -7.98% | -25.37% | -18.35% | -15.99% |
Amazon EMR runtime performance improvements with EC2 R6i instances
R6i instances showed a similar performance improvement while running Apache Spark workloads compared to equivalent R5 instances. Our test results showed between 14.25–32.23% improvement in total query runtime for six different instance sizes within the instance family, and between 16.12–36.5% improvement in geometric mean. R5.xlarge instances didn’t have sufficient memory to run TPC-DS benchmark queries, and weren’t included in this comparison. On cost comparison, we observed 5.48–23.5% reduced instance hour cost on R6i instance EMR clusters compared to R5 EMR instance clusters to run the TPC-DS benchmark queries.
The following table shows the results from running TPC-DS 3 TB benchmark queries using Amazon EMR 6.8 over equivalent R6i and R5 instance EMR clusters.
| Instance Size | 24 XL | 16 XL | 12 XL | 8 XL | 4 XL | 2XL |
| Number of core instances in EMR cluster | 5 | 5 | 5 | 5 | 5 | 5 |
| Total query runtime on R5 (seconds) | 4024.4737 | 3715.74432 | 3552.97298 | 3535.69879 | 5379.73168 | 9121.41532 |
| Total query runtime on R6I (seconds) | 2865.83169 | 2518.24192 | 2513.4849 | 3031.71973 | 4544.44854 | 6977.9508 |
| Total query runtime improvement with R6I | 28.79% | 32.23% | 29.26% | 14.25% | 15.53% | 23.50% |
| Geometric mean query runtime R5 (sec) | 30.59066 | 28.30849 | 25.30903 | 23.85511 | 32.33391 | 47.28424 |
| Geometric mean query runtime R6I (sec) | 21.87897 | 17.97587 | 17.54117 | 20.00918 | 26.6277 | 34.52817 |
| Geometric mean query runtime improvement with R6I | 28.48% | 36.50% | 30.69% | 16.12% | 17.65% | 26.98% |
| EC2 R5 instance price ($ per hour) | $6.0480 | $4.0320 | $3.0240 | $2.0160 | $1.0080 | $0.5040 |
| EMR R5 instance price ($ per hour) | $0.2700 | $0.2700 | $0.2700 | $0.2700 | $0.2520 | $0.1260 |
| (EC2 + EMR) R5 instance price ($ per hour) | $6.3180 | $4.3020 | $3.2940 | $2.2860 | $1.2600 | $0.6300 |
| Cost of running on R5 ($ per instance) | $7.0630 | $4.4403 | $3.2510 | $2.2452 | $1.8829 | $1.5962 |
| EC2 R6I instance price ($ per hour) | $6.0480 | $4.0320 | $3.0240 | $2.0160 | $1.0080 | $0.5040 |
| EMR R6I price ($ per hour per instance) | $1.5120 | $1.0080 | $0.7560 | $0.5040 | $0.2520 | $0.1260 |
| (EC2 + EMR) R6I instance price ($ per hour) | $7.5600 | $5.0400 | $3.7800 | $2.5200 | $1.2600 | $0.6300 |
| Cost of running on R6I ($ per instance) | $6.0182 | $3.5255 | $2.6392 | $2.1222 | $1.5906 | $1.2211 |
| Total cost reduction with R6I including performance improvement | -14.79% | -20.60% | -18.82% | -5.48% | -15.53% | -23.50% |
Amazon EMR runtime performance improvements with EC2 C6i instances
C6i instances showed a similar performance improvement while running Apache Spark workloads compared to equivalent C5 instances. Our test results showed between 16.9–58.22% improvement in total query runtime for four different instance sizes within the instance family, and between 20.25–59.59% improvement in geometric mean. Only C6i 24, 12, 4, and 2xlarge sizes were benchmarked because C5 doesn’t have 32, 16 and 8 xlarge sizes. C5.xlarge instances didn’t have sufficient memory to run TPC-DS benchmark queries, and weren’t included in this comparison. On cost comparison, we observed 16.75–50.07% reduced instance hour cost on C6i instance EMR clusters compared to C5 EMR instance clusters to run the TPC-DS benchmark queries.
The following table shows the results from running TPC-DS 3 TB benchmark queries using Amazon EMR 6.8 over equivalent C6i and C5 instance EMR clusters.
| Instance Size * | 24 XL | 12 XL | 4 XL | 2 XL |
| Number of core instances in EMR cluster | 5 | 5 | 5 | 5 |
| Total query runtime on C5 (seconds) | 3435.59808 | 2900.84981 | 5945.12879 | 10173.00757 |
| Total query runtime on C6I (seconds) | 2711.16147 | 2471.86778 | 5195.30093 | 8787.43422 |
| Total query runtime improvement with C6I | 21.09% | 14.79% | 12.61% | 13.62% |
| Geometric mean query runtime C5 (sec) | 25.67058 | 20.06539 | 31.76582 | 46.78632 |
| Geometric mean query runtime C6I (sec) | 20.4458 | 17.14133 | 26.92196 | 39.32622 |
| Geometric mean query runtime improvement with C6I | 20.35% | 14.57% | 15.25% | 15.95% |
| EC2 C5 instance price ($ per hour) | $4.080 | $2.040 | $0.680 | $0.340 |
| EMR C5 instance price ($ per hour) | $0.270 | $0.270 | $0.170 | $0.085 |
| (EC2 + EMR) C5 instance price ($ per hour) | $4.35000 | $2.31000 | $0.85000 | $0.42500 |
| Cost of running on C5 ($ per instance) | $4.15135 | $1.86138 | $1.40371 | $1.20098 |
| EC2 C6I instance price ($ per hour) | $4.0800 | $2.0400 | $0.6800 | $0.3400 |
| EMR C6I price ($ per hour per instance) | $1.02000 | $0.51000 | $0.17000 | $0.08500 |
| (EC2 + EMR) C6I instance price ($ per hour) | $5.10000 | $2.55000 | $0.85000 | $0.42500 |
| Cost of running on C6I ($ per instance) | $3.84081 | $1.75091 | $1.22667 | $1.03741 |
| Total cost reduction with C6I including performance improvement | -7.48% | -5.93% | -12.61% | -13.62% |
Amazon EMR runtime performance improvements with EC2 R6id instances
R6id instances showed a similar performance improvement while running Apache Spark workloads compared to equivalent R5D instances. Our test results showed between 11.8–28.7% improvement in total query runtime for five different instance sizes within the instance family, and between 15.1–32.0% improvement in geometric mean. R6ID 32 XL instances were not benchmarked because R5D instances don’t have these sizes available. On cost comparison, we observed 6.8–11.5% reduced instance hour cost on R6ID instance EMR clusters compared to R5D EMR instance clusters to run the TPC-DS benchmark queries.
The following table shows the results from running TPC-DS 3 TB benchmark queries using Amazon EMR 6.8 over equivalent R6id and R5d instance EMR clusters.
| Instance Size | 24 XL | 16 XL | 12 XL | 8 XL | 4 XL | 2 XL | XL |
| Number of core instances in EMR cluster | 5 | 5 | 5 | 5 | 5 | 5 | 5 |
| Total query runtime on R5D (seconds) | 4054.4492975042 | 3691.7569385583 | 3598.6869168064 | 3532.7398928104 | 5397.5330161574 | 9281.2627059927 | 16862.8766838096 |
| Total query runtime on R6ID (seconds) | 2992.1198446983 | 2633.7131630720 | 2632.3186613402 | 2729.8860537867 | 4583.1040980373 | 7921.9960917943 | 14867.5391541445 |
| Total query runtime improvement with R6ID | 26.20% | 28.66% | 26.85% | 22.73% | 15.09% | 14.65% | 11.83% |
| Geometric mean query runtime R5D (sec) | 31.0238156851 | 28.1432927726 | 25.7532157307 | 24.0596427675 | 32.5800246829 | 48.2306670294 | 76.6771994376 |
| Geometric mean query runtime R6ID (sec) | 22.8681174894 | 19.1282742957 | 18.6161830746 | 18.0498249257 | 25.9500918360 | 39.6580341258 | 65.0947323858 |
| Geometric mean query runtime improvement with R6ID | 26.29% | 32.03% | 27.71% | 24.98% | 20.35% | 17.77% | 15.11% |
| EC2 R5D instance price ($ per hour) | $6.912000 | $4.608000 | $3.456000 | $2.304000 | $1.152000 | $0.576000 | $0.288000 |
| EMR R5D instance price ($ per hour) | $0.270000 | $0.270000 | $0.270000 | $0.270000 | $0.270000 | $0.144000 | $0.072000 |
| (EC2 + EMR) R5D instance price ($ per hour) | $7.182000 | $4.878000 | $3.726000 | $2.574000 | $1.422000 | $0.720000 | $0.360000 |
| Cost of running on R5D ($ per instance) | $8.088626 | $5.002331 | $3.724641 | $2.525909 | $2.132026 | $1.856253 | $1.686288 |
| EC2 R6ID instance price ($ per hour) | $7.257600 | $4.838400 | $3.628800 | $2.419200 | $1.209600 | $0.604800 | $0.302400 |
| EMR R6ID price ($ per hour per instance) | $1.814400 | $1.209600 | $0.907200 | $0.604800 | $0.302400 | $0.151200 | $0.075600 |
| (EC2 + EMR) R6ID instance price ($ per hour) | $9.072000 | $6.048000 | $4.536000 | $3.024000 | $1.512000 | $0.756000 | $0.378000 |
| Cost of running on R6ID ($ per instance) | $7.540142 | $4.424638 | $3.316722 | $2.293104 | $1.924904 | $1.663619 | $1.561092 |
| Total cost reduction with R6ID including performance improvement | -6.78% | -11.55% | -10.95% | -9.22% | -9.71% | -10.38% | -7.42% |
Benchmarking methodology
The benchmark used in this post is derived from the industry-standard TPC-DS benchmark, and uses queries from the Spark SQL Performance Tests GitHub repo with the following fixes applied.
We calculated TCO by multiplying cost per hour by number of instances in the cluster and time taken to run the queries on the cluster. We used the on-demand pricing in the US East (N. Virginia) Region for all instances.
Conclusion
In this post, we described how we estimated the cost-performance benefit from using Amazon EMR with C6i, M6i, I4i, R6i, and R6id, instances compared to using equivalent previous generation instances. Using these new instances with Amazon EMR improves cost-performance by an additional 5–33%.
About the authors
 Al MS is a product manager for Amazon EMR at Amazon Web Services.
 Kyeonghyun Ryoo is a Software Development Engineer for EMR at Amazon Web Services. He primarily works on designing and building automation tools for internal teams and customers to maximize their productivity. Outside of work, he is a retired world champion in professional gaming who still enjoy playing video games.
[$] Composefs for integrity protection and data sharing
Post Syndicated from original https://lwn.net/Articles/917097/
A read-only filesystem that will transparently share file data between disparate
directory trees, while also providing integrity verification for the data
and the
directory metadata, was recently posted as an
RFC
to the linux-kernel mailing list. Composefs was developed
by Alexander Larsson (who posted it) and Giuseppe Scrivano for use by podman containers and OSTree (or “libostree” as it
is now known) root directories, but there are likely others who want the
abilities
it provides. So far, there has been little response, either with feedback or
complaints, but it is a small patch set (around 2K lines of code) and
generally self-contained since it is a filesystem, so it would not be a
surprise to see it appear in some upcoming kernel.
GitHub Availability Report: November 2022
Post Syndicated from Jakub Oleksy original https://github.blog/2022-12-07-github-availability-report-november-2022/
In November, we experienced two incidents that resulted in degraded performance across GitHub services. This report also sheds light into an incident that impacted GitHub Codespaces in October.
November 25 16:34 UTC (lasting 1 hour and 56 minutes)
Our alerting systems detected an incident that impacted customers using GitHub Packages and Pages. Due to the recency of this incident, we are still investigating the contributing factors and will provide a more detailed update on cause and remediation in the January Availability Report, which we will publish the first Wednesday of January.
October 26 00:47 UTC (lasting 3 hours and 47 minutes)
On October 22, 2022 at 00:47 UTC, our alerting systems detected a decrease in success rates for creates and resumes of Codespaces in the East US region. We initially statused yellow, as the incident affected only the East US region. As the incident persisted for several hours, we provided guidance to customers in the affected region to manually change their location to a nearby healthy region at 01:55 UTC, and statused red at 2:34 UTC due to the prolonged outage.
During this incident, customers were unable to create or resume Codespaces in the East US region. Customers could manually select an alternate region in which to create Codespaces, but could not do so for resumes.
Codespaces uses a third-party database to store data for the service and the provider was experiencing an outage, which impacted Codespaces performance. We were unable to immediately communicate with our East US database because our service does not currently have any replication of its regional data. Our services in the East US region returned to healthy status as soon as Codespaces engineers were able to engage with the third party to help mitigate the outage.
We identified several ways to improve our database resilience to regional outages while working with the third party during this incident and in follow up internal discussions. We are implementing regional replication and failover so that we can mitigate this type of incident more quickly in the future.
November 3 16:10 UTC (lasting 1 hour and 2 minutes)
On November 3, 2022 at 16:10 UTC, our alerting systems detected an increase in the time it took GitHub Actions workflow runs to start. We initially statused GitHub Actions to red, and after assessing impact we statused to yellow at 16:11 UTC.
During this incident, customers experienced high latency in receiving webhook deliveries, starting GitHub Actions workflow runs, and receiving status updates for in-progress runs. They also experienced an increase in error responses from repositories, pull requests, Codespaces, and the GitHub API. At its peak, a majority of repositories attempting to run a GitHub Actions workflow experienced delays longer than five minutes.
GitHub Actions listens to webhooks to trigger workflow runs, and while investigating we found that the run start delays were caused by a backup in the webhooks queue. At 16:29 UTC, we scaled out and accelerated processing of the webhooks queue as a mitigation. By 17:12 UTC, the webhooks queue was fully drained and we statused back to green.
We found that the webhook delays were caused by an inefficient database query for checking repository security advisory access, which was triggered by a high volume of poorly optimized API calls. This caused a backup in background jobs running across GitHub, which is why multiple services were impacted in addition to webhooks and GitHub Actions.
Following our investigation, we fixed the inefficient query for the repository security advisory access. We also reviewed the rate limits for this particular endpoint (as well as limits in this area) to ensure they were in line with our performance expectations. Finally, we increased the default throttling of the webhooks queue to avoid potential backups in the future. As a longer-term improvement to our resiliency, we are investigating options to reduce the potential for other background jobs to impact GitHub Actions workflows. We’ll continue to run game days and conduct enhanced training for first responders to better assess impact for GitHub Actions and determine the appropriate level of statusing moving forward.
Please follow our status page for real-time updates on status changes. To learn more about what we’re working on, check out the GitHub Engineering Blog.
Let’s Architect! Optimizing the cost of your architecture
Post Syndicated from Luca Mezzalira original https://aws.amazon.com/blogs/architecture/lets-architect-optimizing-the-cost-of-your-architecture/
Written in collaboration with Ben Moses, AWS Senior Solutions Architect, and Michael Holtby, AWS Senior Manager Solutions Architecture
Designing an architecture is not a simple task. There are many dimensions and characteristics of a solution to consider, such as the availability, performance, or resilience.
In this Let’s Architect!, we explore cost optimization and ideas on how to rethink your AWS workloads, providing suggestions that span from compute to data transfer.
Migrating AWS Lambda functions to Arm-based AWS Graviton2 processors
AWS Graviton processors are custom silicon from Amazon’s Annapurna Labs. Based on the Arm processor architecture, they are optimized for performance and cost, which allows customers to get up to 34% better price performance.
This AWS Compute Blog post discusses some of the differences between the x86 and Arm architectures, as well as methods for developing Lambda functions on Graviton2, including performance benchmarking.
Many serverless workloads can benefit from Graviton2, especially when they are not using a library that requires an x86 architecture to run.
Choosing Graviton2 for AWS Lambda function in the AWS console
Key considerations in moving to Graviton2 for Amazon RDS and Amazon Aurora databases
Amazon Relational Database Service (Amazon RDS) and Amazon Aurora support a multitude of instance types to scale database workloads based on needs. Both services now support Arm-based AWS Graviton2 instances, which provide up to 52% price/performance improvement for Amazon RDS open-source databases, depending on database engine, version, and workload. They also provide up to 35% price/performance improvement for Amazon Aurora, depending on database size.
This AWS Database Blog post showcases strategies for updating RDS DB instances to make use of Graviton2 with minimal changes.
Take me to this Database post!

Choose your instance class that leverages Graviton2, such as db.r6g.large (the “g” stands for Graviton2)
Overview of Data Transfer Costs for Common Architectures
Data transfer charges are often overlooked while architecting an AWS solution. Considering data transfer charges while making architectural decisions can save costs. This AWS Architecture Blog post describes the different flows of traffic within a typical cloud architecture, showing where costs do and do not apply. For areas where cost applies, it shows best-practice strategies to minimize these expenses while retaining a healthy security posture.
Take me to this Architecture post!

Accessing AWS services in different Regions
Improve cost visibility and re-architect for cost optimization
This Architecture Blog post is a collection of best practices for cost management in AWS, including the relevant tools; plus, it is part of a series on cost optimization using an e-commerce example.
AWS Cost Explorer is used to first identify opportunities for optimizations, including data transfer, storage in Amazon Simple Storage Service and Amazon Elastic Block Store, idle resources, and the use of Graviton2 (Amazon’s Arm-based custom silicon). The post discusses establishing a FinOps culture and making use of Service Control Policies (SCPs) to control ongoing costs and guide deployment decisions, such as instance-type selection.
Take me to this Architecture post!

Applying SCPs on different environments for cost control
See you next time!
Thanks for joining us to discuss optimizing costs while architecting! This is the last Let’s Architect! post of 2022. We will see you again in 2023, when we explore even more architecture topics together.
Wishing you a happy holiday season and joyous new year!
Can’t get enough of Let’s Architect!?
Visit the Let’s Architect! page of the AWS Architecture Blog for access to the whole series.
Looking for more architecture content?
AWS Architecture Center provides reference architecture diagrams, vetted architecture solutions, Well-Architected best practices, patterns, icons, and more!
Home Assistant 2022.12 – Does Thread Matter?
Post Syndicated from BeardedTinker original https://www.youtube.com/watch?v=2ZdTIBSxXbs
Triton: Ice Volcanoes and Alien Oceans
Post Syndicated from Geographics original https://www.youtube.com/watch?v=hzcNH9HHwrE
Securing Lambda Function URLs using Amazon Cognito, Amazon CloudFront and AWS WAF
Post Syndicated from Marcia Villalba original https://aws.amazon.com/blogs/compute/securing-lambda-function-urls-using-amazon-cognito-amazon-cloudfront-and-aws-waf/
This post is written by Madhu Singh (Solutions Architect), and Krupanidhi Jay (Solutions Architect).
Lambda function URLs is a dedicated HTTPs endpoint for a AWS Lambda function. You can configure a function URL to have two methods of authentication: IAM and NONE. IAM authentication means that you are restricting access to the function URL (and in-turn access to invoke the Lambda function) to certain AWS principals (such as roles or users). Authentication type of NONE means that the Lambda function URL has no authentication and is open for anyone to invoke the function.
This blog shows how to use Lambda function URLs with an authentication type of NONE and use custom authorization logic as part of the function code, and to only allow requests that present valid Amazon Cognito credentials when invoking the function. You also learn ways to protect Lambda function URL against common security threats like DDoS using AWS WAF and Amazon CloudFront.
Lambda function URLs provides a simpler way to invoke your function using HTTP calls. However, it is not a replacement for Amazon API Gateway, which provides advanced features like request validation and rate throttling.
Solution overview
There are four core components in the example.
1. A Lambda function with function URLs enabled
At the core of the example is a Lambda function with the function URLs feature enabled with the authentication type of NONE. This function responds with a success message if a valid authorization code is passed during invocation. If not, it responds with a failure message.
2. Amazon Cognito User Pool
Amazon Cognito user pools enable user authentication on websites and mobile apps. You can also enable publicly accessible Login and Sign-Up pages in your applications using Amazon Cognito user pools’ feature called the hosted UI.
In this example, you use a user pool and the associated Hosted UI to enable user login and sign-up on the website used as entry point. This Lambda function validates the authorization code against this Amazon Cognito user pool.
3. CloudFront distribution using AWS WAF
CloudFront is a content delivery network (CDN) service that helps deliver content to end users with low latency, while also improving the security posture for your applications.
AWS WAF is a web application firewall that helps protect your web applications or APIs against common web exploits and bots and AWS Shield is a managed distributed denial of service (DDoS) protection service that safeguards applications running on AWS. AWS WAF inspects the incoming request according to the configured Web Access Control List (web ACL) rules.
Adding CloudFront in front of your Lambda function URL helps to cache content closer to the viewer, and activating AWS WAF and AWS Shield helps in increasing security posture against multiple types of attacks, including network and application layer DDoS attacks.
4. Public website that invokes the Lambda function
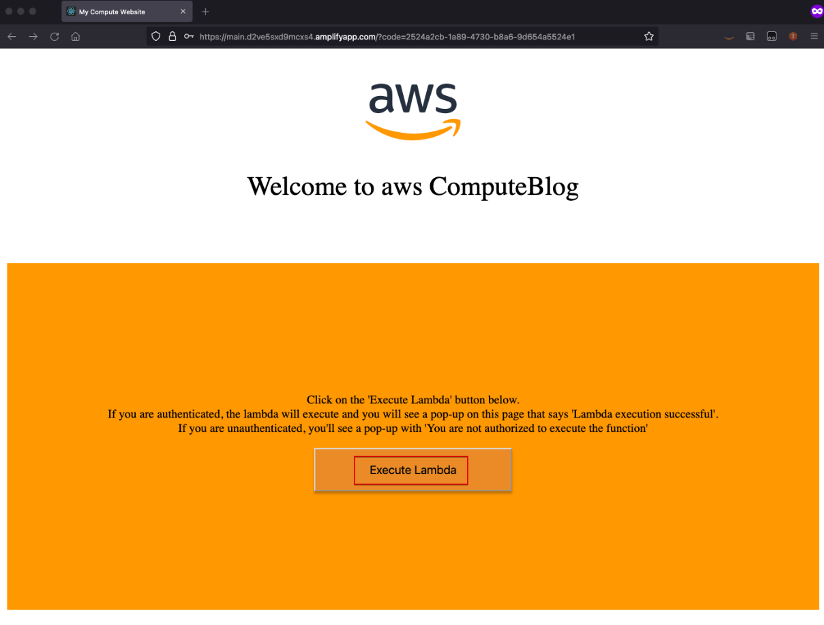
The example also creates a public website built on React JS and hosted in AWS Amplify as the entry point for the demo. This website works both in authenticated mode and in guest mode. For authentication, the website uses Amazon Cognito user pools hosted UI.
Solution architecture
This shows the architecture of the example and the information flow for user requests.

In the request flow:
- The entry point is the website hosted in AWS Amplify. In the home page, when you choose “sign in”, you are redirected to the Amazon Cognito hosted UI for the user pool.
- Upon successful login, Amazon Cognito returns the authorization code, which is stored as a cookie with the name “code”. The user is redirected back to the website, which has an “execute Lambda” button.
- When the user choose “execute Lambda”, the value from the “code” cookie is passed in the request body to the CloudFront distribution endpoint.
- The AWS WAF web ACL rules are configured to determine whether the request is originating from the US or Canada IP addresses and to determine if the request should be allowed to invoke Lambda function URL origin.
- Allowed requests are forwarded to the CloudFront distribution endpoint.
- CloudFront is configured to allow CORS headers and has the origin set to the Lambda function URL. The request that CloudFront receives is passed to the function URL.
- This invokes the Lambda function associated with the function URL, which validates the token.
- The function code does the following in order:
- Exchange the authorization code in the request body (passed as the event object to Lambda function) to access_token using Amazon Cognito’s token endpoint (check the documentation for more details).
- Amazon Cognito user pool’s attributes like user pool URL, Client ID and Secret are retrieved from AWS Systems Manager Parameter Store (SSM Parameters).
- These values are stored in SSM Parameter Store at the time these resources are deployed via AWS CDK (see “how to deploy” section)
- The access token is then verified to determine its authenticity.
- If valid, the Lambda function returns a message stating user is authenticated as <username> and execution was successful.
- If either the authorization code was not present, for example, the user was in “guest mode” on the website, or the code is invalid or expired, the Lambda function returns a message stating that the user is not authorized to execute the function.
- Exchange the authorization code in the request body (passed as the event object to Lambda function) to access_token using Amazon Cognito’s token endpoint (check the documentation for more details).
- The webpage displays the Lambda function return message as an alert.
Getting started
Pre-requisites:
Before deploying the solution, please follow the README from the GitHub repository and take the necessary steps to fulfill the pre-requisites.
Deploy the sample solution
1. From the code directory, download the dependencies:
$ npm install2. Start the deployment of the AWS resources required for the solution:
$ cdk deployNote:
- optionally pass in the –profile argument if needed
- The deployment can take up to 15 minutes
3. Once the deployment completes, the output looks similar to this:
Open the amplifyAppUrl from the output in your browser. This is the URL for the demo website. If you don’t see the “Welcome to Compute Blog” page, the Amplify app is still building, and the website is not available yet. Retry in a few minutes. This website works either in an authenticated or unauthenticated state.
Test the authenticated flow
- To test the authenticated flow, choose “Sign In”.

2. In the sign-in page, choose on sign-up (for the first time) and create a user name and password.
3. To use an existing an user name and password, enter those credentials and choose login.
4. Upon successful sign-in or sign up, you are redirected back to the webpage with “Execute Lambda” button.

5. Choose this button. In a few seconds, an alert pop-up shows the logged in user and that the Lambda execution is successful.
Testing the unauthenticated flow
1. To test the unauthenticated flow, from the Home page, choose “Continue”.

2. Choose “Execute Lambda” and in a few seconds, you see a message that you are not authorized to execute the Lambda function.

Testing the geo-block feature of AWS WAF
1. Access the website from a Region other than US or Canada. If you are physically in the US or Canada, you may use a VPN service to connect to a Region other than US or Canada.

2. Choose the “Execute Lambda” button. In the Network trace of browser, you can see the call to invoke Lambda function was blocked with Forbidden response.
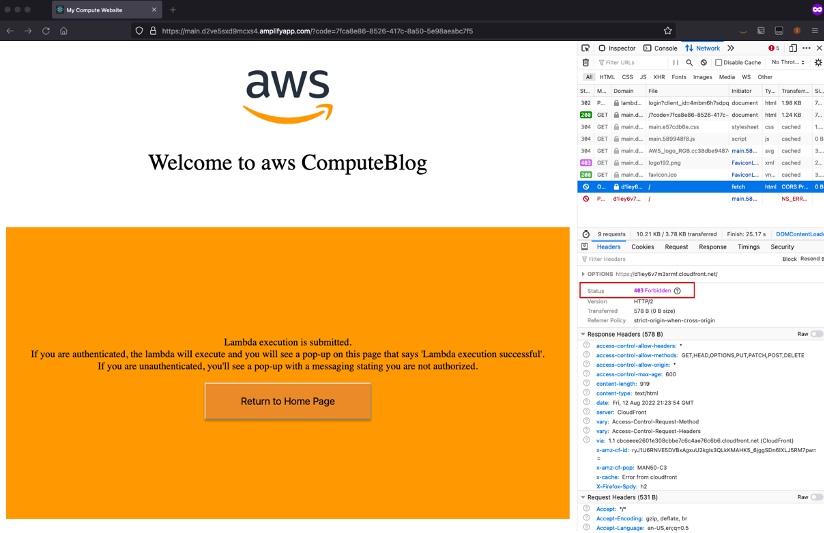
3. To try either the authenticated or unauthenticated flow again, choose “Return to Home Page” to go back to the home page with “Sign In” and “Continue” buttons.
Cleaning up
To delete the resources provisioned, run the cdk destroy command from the AWS CDK CLI.
Conclusion
In this blog, you create a Lambda function with function URLs enabled with NONE as the authentication type. You then implemented a custom authentication mechanism as part of your Lambda function code. You also increased the security of your Lambda function URL by setting it as Origin for the CloudFront distribution and using AWS WAF Geo and IP limiting rules for protection against common web threats, like DDoS.
For more serverless learning resources, visit Serverless Land.
USS California’s Four Medals of Honor
Post Syndicated from The History Guy: History Deserves to Be Remembered original https://www.youtube.com/watch?v=S-zKIdW7BRY
The Decoupling Principle
Post Syndicated from Bruce Schneier original https://www.schneier.com/blog/archives/2022/12/the-decoupling-principle.html
This is a really interesting paper that discusses what the authors call the Decoupling Principle:
The idea is simple, yet previously not clearly articulated: to ensure privacy, information should be divided architecturally and institutionally such that each entity has only the information they need to perform their relevant function. Architectural decoupling entails splitting functionality for different fundamental actions in a system, such as decoupling authentication (proving who is allowed to use the network) from connectivity (establishing session state for communicating). Institutional decoupling entails splitting what information remains between non-colluding entities, such as distinct companies or network operators, or between a user and network peers. This decoupling makes service providers individually breach-proof, as they each have little or no sensitive data that can be lost to hackers. Put simply, the Decoupling Principle suggests always separating who you are from what you do.
Lots of interesting details in the paper.
Reflecting on what we teach in computing education and how we teach it
Post Syndicated from James Robinson original https://www.raspberrypi.org/blog/reflecting-on-computing-education-hello-world-special-editions/
Reflecting is important within any line of work, and computing education is no different. Reflective practice is always valuable, whether you support learners in a non-formal setting, such as a Code Club or CoderDojo, or in a more formal environment, such as a school or college. When you reflect, you might for example evaluate a session or lesson and make changes for next time, or consider whether to reorder activities and learning across a longer time period, or even think broadly about what you teach and how you teach it.

This is where our two special editions of Hello World come in: The Big Book of Computing Content and The Big Book of Computing Pedagogy. Both available as free downloads, they help you reflect on what you teach within Computing and how you teach it.


What you teach: The Big Book of Computing Content
Computing is a broad and interdisciplinary subject, and different curricula and courses around the world focus on different aspects of it. For all of us, therefore, computing is framed by the curricula with which we are working and the terms which we’re using to talk about the subject. Over the past years at the Foundation, we have been developing a Computing taxonomy to help describe the different aspects of the subject. The Big Book of Computing Content is based on this taxonomy. The aim of this special edition of Hello World is to illustrate the breadth of Computing, and to model language that describes the different concepts, knowledge, and skills that comprise it.

We have organised this Big Book according to our taxonomy’s 11 content strands and also included progressive learning outcomes for each strand at different stages of learning. These outcomes are not prescriptive; instead they illustrate the wide applications of the subject by highlighting the kinds of knowledge and understanding that learners could develop in each area of Computing.


We hope that The Big Book of Computing Content encourages educators to reflect on all aspects of Computing and how they interconnect, as well as on the language we use to describe Computing. Whether the Big Book helps you to discover new aspects to Computing, to think about the subject differently, or simply to see the differences in how we as educators talk about our subject, the time you spend reflecting is important and valuable.
How you teach: The Big Book of Computing Pedagogy
One part of our work as educators is understanding the breadth of Computing and the specific ideas within it. The other part is reflecting on how we teach the subject: the specific methods, strategies, and practices we can use with our learners. The Big Book of Computing Pedagogy describes a range of teaching approaches framed around our 12 pedagogical principles for teaching Computing. Each research-informed principle either reflects how general-purpose pedagogy applies within Computing or explores pedagogies specific to Computing itself. This Big Book consists of research summaries as well as practical articles from educators which illustrate how you can apply the different pedagogies.

Rather than prescribing a set of principles that educators must follow, the aim of The Big Book of Computing Pedagogy is to help you develop your understanding of a range of pedagogical approaches which you can select, apply, and adapt to suit your context.
Reflect to develop your knowledge and agency
Ultimately we want to support all Computing and Computer Science educators to build their understanding of subject matter (that is, content) and pedagogy, or what is called pedagogical content knowledge (PCK, a term popularised by Lee Shulman). Combining your PCK with your grasp of the context of your learners, curricula, and setting will enable you to choose suitable practices for your content and context.

We hope that you find the two Big Books to be valuable reference tools to help you and your peers reflect on what it is you mean when you talk about Computing, and on how you teach the concepts, knowledge, and skills within it. Both books are available as free PDF downloads.
We would love to hear examples of how you have used The Big Book of Computing Pedagogy or The Big Book of Computing Content to inform your own teaching practice or to discuss practice with colleagues. Tell us in the comments.
The post Reflecting on what we teach in computing education and how we teach it appeared first on Raspberry Pi.
Security updates for Wednesday
Post Syndicated from original https://lwn.net/Articles/917208/
Security updates have been issued by Debian (cgal, ruby-rails-html-sanitizer, and xfce4-settings), Red Hat (dbus, grub2, kernel, pki-core, and usbguard), Scientific Linux (pki-core), SUSE (bcel, LibVNCServer, and xen), and Ubuntu (ca-certificates and u-boot).
Rust support coming to GCC
Post Syndicated from original https://lwn.net/Articles/917207/
Gccrs — the Rust front-end for GCC — has been approved
for merging into the GCC trunk. That means that the next GCC release will
be able to compile Rust, sort of; as gccrs developer Arthur Cohen warns:
“This is very much an extremely experimental compiler and will still get
“.
a lot of changes in the coming weeks and months up until the release
See this article and this one for more details on the current
status of gccrs.
Making an Orbic Speed RC400L autoboot when USB power is attached
Post Syndicated from original https://mjg59.dreamwidth.org/62419.html
As I mentioned a couple of weeks ago, I’ve been trying to hack an Orbic Speed RC400L mobile hotspot so it’ll automatically boot when power is attached. When plugged in it would flash a “Welcome” screen and then switch to a display showing the battery charging – it wouldn’t show up on USB, and didn’t turn on any networking. So, my initial assumption was that the bootloader was making a policy decision not to boot Linux. After getting root (as described in the previous post), I was able to cat /proc/mtd and see that partition 7 was titled “aboot”. Aboot is a commonly used Android bootloader, based on Little Kernel – LK provides the hardware interface, aboot is simply an app that runs on top of it. I was able to find the source code for Quectel’s aboot, which is intended to run on the same SoC that’s in this hotspot, so it was relatively easy to line up a bunch of the Ghidra decompilation with actual source (top tip: find interesting strings in your decompilation and paste them into github search, and see whether you get a repo back).
Unfortunately looking through this showed various cases where bootloader policy decisions were made, but all of them seemed to result in Linux booting. Patching them and flashing the patched loader back to the hotspot didn’t change the behaviour. So now I was confused: it seemed like Linux was loading, but there wasn’t an obvious point in the boot scripts where it then decided not to do stuff. No boot logs were retained between boots, which made things even more annoying. But then I realised that, well, I have root – I can just do my own logging. I hacked in an additional init script to dump dmesg to /var, powered it down, and then plugged in a USB cable. It booted to the charging screen. I hit the power button and it booted fully, appearing on USB. I adb shelled in, checked the logs, and saw that it had booted twice. So, we were definitely entering Linux before showing the charging screen. But what was the difference?
Diffing the dmesg showed that there was a major distinction on the kernel command line. The kernel command line is data populated by the bootloader and then passed to the kernel – it’s how you provide arguments that alter kernel behaviour without having to recompile it, but it’s also exposed to userland by the running kernel so it also serves as a way for the bootloader to pass information to the running userland. The boot that resulted in the charging screen had a androidboot.poweronreason=USB argument, the one that booted fully had androidboot.poweronreason=PWRKEY. Searching the filesystem for androidboot.poweronreason showed that the script that configures USB did not enable USB if poweronreason was USB, and the same string also showed up in a bunch of other applications. The bootloader was always booting Linux, but it was telling Linux why it had booted, and if that reason was “USB” then Linux was choosing not to enable USB and not starting the networking stack.
One approach would be to modify every application that parsed this data and make it work even if the power on reason was “USB”. That would have been tedious. It seemed easier to modify the bootloader. Looking for that string in Ghidra showed that it was reading a register from the power management controller and then interpreting that to determine the reason it had booted. In effect, it was doing something like:
boot_reason = read_pmic_boot_reason();
switch(boot_reason) {
case 0x10:
  bootparam = strdup("androidboot.poweronreason=PWRKEY");
  break;
case 0x20:
  bootparam = strdup("androidboot.poweronreason=USB");
  break;
default:
  bootparam = strdup("androidboot.poweronreason=Hard_Reset");
}
Changing the 0x20 to 0xff meant that the USB case would never be detected, and it would fall through to the default. All the userland code was happy to accept “Hard_Reset” as a legitimate reason to boot, and now plugging in USB results in the modem booting to a functional state. Woo.
If you want to do this yourself, dump the aboot partition from your device, and search for the hex sequence “03 02 00 0a 20″”. Change the final 0x20 to 0xff, copy it back to the device, and write it to mtdblock7. If it doesn’t work, feel free to curse me, but I’m almost certainly going to be no use to you whatsoever. Also, please, do not just attempt to mechanically apply this to other hotspots. It’s not going to end well.
![]() comments
comments
Какво научихме ние и не научи МВР от случая със Сашко?
Post Syndicated from original https://yurukov.net/blog/2022/%D0%BA%D0%B0%D0%BA%D0%B2%D0%BE-%D0%BD%D0%B0%D1%83%D1%87%D0%B8%D1%85%D0%BC%D0%B5-%D0%BD%D0%B8%D0%B5-%D0%B8-%D0%BD%D0%B5-%D0%BD%D0%B0%D1%83%D1%87%D0%B8-%D0%BC%D0%B2%D1%80-%D0%BE%D1%82-%D1%81%D0%BB%D1%83/
Статията е първо публикувана на 27 ноември в Капитал.
Има много неща, които държат един родител буден нощем. Несъмнено новинарските емисии, филмите и БГ Мама са развинтили предостатъчно въображението ни за опасностите, дебнещи децата ни от ранна възраст. Сред болестите, катастрофите и наркотиците се нарежда и изчезването. Едно дете да потъне вдън земя е колкото немислимо, толкова и ужасяващо. Затова и такива случаи като правило се приемат присърце.
Случаят на изчезналия Александър извади наяве както съпричастността на обществото и критичната роля на доброволчеството, така и тлеещите от десетилетия проблеми в комуникацията на полицията със същото това общество, но също и неподготвеността на самите масови медии да играят конструктивна роля в такива случаи.
На първо място трябва да кажем, че далеч не всички случаи са като този. Всъщност, в повечето няма нужда и дори би попречило на разследването да се обявява публично каквото и да е. Но когато това е нужно, то следва да става бързо, надеждно, без спекулации, с ясна навременна информация и координация. Такива са изчезванията не само на деца, но и на възрастни хора и такива в уязвимо състояние. Хора, които поради болест, възраст или принуда, трудно биха могли да помогнат сами на себе си.
Докато няма еднакви случаи, лесно може да се види, че проблемите в комуникацията е на институционално ниво. Разпознавайки този проблем преди 13 години, се опитах да намеря технологично решение създавайки проекта Lipsva. Амбицията му никога не е била да намира хора, макар надежда винаги да има, а да покаже, че съобщаването на случаите може да се прави по по-добър начин. В рамките на проекта направих карта, показваща всички известни активни случаи и анонимна статистика за решените, автоматично търсене в социалните мрежи на хора, отбелязали се близо до последното известно местоположение, и изпращане на готови за разпечатване плакати до магазини и кафенета в близост. Всичко това беше достъпно преди повече от 10 години и го предложих безвъзмезно на МВР.
Последваха няколко срещи и доста комуникация в опити за обща работа. Всички бяха много ентусиазирани и съгласни, че това има смисъл. Особено хората по места, чиято работа беше именно да решават тези случаи: тези, на които близките звъняха постоянно с надежда за добри новини, а в от един момент нататък – каквито и да е новини. След години опити и събиране на данни единственият резултат беше, че при всеки случай на изчезване медиите тикаха картата ми в лицето на тогавашния шеф на сектор “Издирване” и го питаха защо МВР не прави нещо подобно.
Причината за всичко това е същата, както множеството проблеми, които виждаме в полицията – дълбоката бюрократична машина и вкоренения от поколения страх от взимане на решения. МВР може да се е деполитизирана преди 30 години, но мисленето и работата не са мръднали особено от 80-те години насам. Това се вижда особено ясно в случаите на издирване. Има някакъв срам изглежда на ниво директор, когато се говори на тази тема и язвителна насмешка, когато хора вътре и извън системата настояват, че има по-добър начин. Това са все неща, с които се сблъсках сам, но трагичното е, че със същото се сблъскват родители на деца, които не спират да настояват на най-горно ниво за действе.
Тук следва да се отбележи, че подобрения в МВР все пак има. В последните няколко години са свързали многобройните си системи и търсенето на информация за издирвани се доближава доста до иначе нереалистичните очаквания, които холивудските филми са загнездили у нас. Докато това определено е подобрение, общуването с неправителствени организации, медии и въобще желаещи да помогнат е изключително затормозено до степен, в която самите издирващи са също толкова фрустрирани от системата, колкото и близките на изчезналите.
Друго нововъведение беше прословутата Amber Europe система, която беше шумно обявена в началото на 2018-та година. Това е мрежа от институции и НПО-та, които си съдействат с проекти, обмен на опит и информация за по-ефективно откриване на деца. Това,на което повечето медии обърнаха внимание, обаче е интеграцията с Facebook, където при изчезнало дете може на момента да се покаже снимката му и информация на всички потребители на мрежата в радиус от 200 км. Именно това стана с Александър, макар и с поне 8 часа закъснение след първата информация в медиите.
Всъщност, четири години след официалното включване в мрежата, това беше първият и единствен път, в който МВР я използва. Има още един случай от преди година, но той се разви в епизод на популярен български сериал. За сравнение Гърция е обявила и открила 40 деца за същия период от време със системата. Липсва и информация дали България се е включила по някакъв начин в обмена на опит, с изключение на няколко кратки споменавания за присъствие на делегати по срещи. Междувременно още от включването на МВР като организация, официалният сайт на Amber Europe все още показва като единствен източник на информация за подобни случаи в България социалните профили на Lipsva в Twitter и Facebook. Оттам не успяха да ми обяснят как се е случило това. Неофициално разбрах, че тези линкове са дадени от самите представители на МВР. Нищо, че активната работа по проекта спря преди 5 години.
Нито спешните реклами на Amber във Facebook, нито карти и технологични решения като Lipsva биха решили проблемите в комуникацията. Те са просто инструменти. МВР обмисляше през годините много други такива – MMS-и към таксиджиите, новини по таблата на метрото и спирките на градския транспорт, спешни бюлетини по радиото и телевизията и ред други шумно обявени, но неосъществени идеи. Докато за някои драматични случаи научаваме сравнително бързо от основните емисии, това става щедро напоено с кадри на страдащи близки и словохотливи съседи, дежурни експерти, бивши и настоящи служители на полицията. Нищо в това не показва както отговорност от стана на МВР, така и капка журналистическа етика от самите медии.
За повечето изчезвания обаче не научаваме дори от сайтовете на МВР. В някои райони на страната повечето такива се подават „ексклузивно“ на конкретни местни медии. Трудно ми е да преброя случаите, в които родители са ми споделяли, че се молят на полицията да разпространи информация по техните канали или да изкарат екипи за издирване. Когато става въпрос за възрастни и често безпомощни хора, ситуацията е най-тежка. Това, комбинирано с хаотичната система от сайтове и начини на публикуване на информация от РДВР-тата, прави изключително трудно намирането на каквато и да е информация за един или повече случаи на изчезване. Именно това целеше да подоби Lipsva и го правеше добре.
Всичкият този комуникационен хаос, но и честата циничност и ярка неподготвеност за боравене с такива случаи на приемащите сигнали създава съвсем очаквано крайно недоверие към способностите и желанието на полицията да се справи с такива случаи. Сензационното отразяване от страна на медиите и търсенето на ефирно време у дежурните експерти пък оставя впечатление, че постоянно изчезват хора и никой не ги открива. Втората цел на Lipsva беше да покаже, че всъщност мнозинството от случаите се решават успешно. Този аспект е изключително важен, защото именно доверието между близки и разследващи, както и вярата на доброволци и неправителствени организации, че решение и смисъл има е това, което неизменно ще повиши успеваемостта. Видяхме го и в случая на Александър.
Докато обаче повечето изчезвания се решават, сложните такива, когато трябва да се действа бързо, да се вземат на сериозно тревожни ранни сигнали или да се предпази уязвим човек от друга опасност е нещо, в което системата се проваля отдавна. Тези случаи са малко, често не са публични, но имат изключително драматичен ефект над семействата дори при иначе успешен край. Тук от критична важност са ясните стриктни процедури, добрата комуникация, малкото бюрокрация и подсилване решимостта и възможностите за действие на тези най-близо до случая – все неща, с които родната полиция не се слави.
Може да направим сравнение с болниците – хората си мислят, че добрите болници са онези с няколкото именити медицински величия способни да извършват невероятни процедури. Истината обаче е, че истинските добри болници са онези, които не позволяват например пациента да умре от вътрешноболнична инфекция след уникалната операция. А такива случаи има доста и продължавайки аналогията са също толкова срамна тема за институциите до степен, в която почти нищо не се прави. Предотвратяват се с ясни стриктни процедури, признаване на грешките и търсене на решения, комуникация и подсилване решимостта и възможностите на онези, които могат да се справят с проблема.
Александър беше открит и се води разследване. Това, което като общество научихме е, че имаме място и роля в тези издивания и не следва да очакваме полицията да се справи сама. Доброволчеството има смисъл, а и има нужда от продължителни постоянни действия тази насока. Това, което не очаквам, е промяна в работата на МВР или подходът на медиите по тези теми. След толкова години повтаряне на едно и съм говорил с много разследващи, които търсят някакво решение и искат промяна, но се сблъскват със същата стена на безразличие и бюрократичен унес, с която се сблъсква всеки от нас застанал пред гише.
Докато има технологични решения, които биха помогнали, нищо не може да замести добрата полицейска работа. Къде нарочно, къде от невежество на ръководството, тя се тика назад, за да не попречи на когото трябва или да не стъпи накриво с грешния прокурор или местен големец. Същото отношение се отразява неизменно и на издирващите, които далеч не се занимават само с установяване на безследно изчезнали.
Макар повечето от нас да не може да си представим, че нещо такова може да се случи точно на нас, неизменно поредният тиражиран из медиите случай ни кара да се замислим. Докато някой възприемат качеството на живот като удобства в дома, колата или почивката, още по-важна характеристика е да има система, процес и специалисти, на които са се облегнеш в безизходна ситуация. Това е както спешната помощ, включително в отдалечени райони, лечение на редки заболявания, реакция при природни бедствия и несъмнено издирване на потъналите в дън земя. Именно доверието в тези системи на помощ допринася значително за качеството на живота. Доверието идва както от наличието въобще и ефективността на тези системи, така и ясната комуникация и прозрачност за работата им. При търсенето на безследно изчезнали, както и при много други функции на МВР, именно това е ключова брънка, която упорито се отрича от ръководството заради институционални недъзи, его, чиновническо и офицерско мислене заровено в преливащите с хартия папки от 80-те.
The post Какво научихме ние и не научи МВР от случая със Сашко? first appeared on Блогът на Юруков.
Zero trust with Kafka
Post Syndicated from Grab Tech original https://engineering.grab.com/zero-trust-with-kafka
Introduction
Grab’s real-time data platform team, also known as Coban, has been operating large-scale Kafka clusters for all Grab verticals, with a strong focus on ensuring a best-in-class-performance and 99.99% availability.
Security has always been one of Grab’s top priorities and as fraudsters continue to evolve, there is an increased need to continue strengthening the security of our data streaming platform. One of the ways of doing this is to move from a pure network-based access control to state-of-the-art security and zero trust by default, such as:
- Authentication: The identity of any remote systems – clients and servers – is established and ascertained first, prior to any further communications.
- Authorisation: Access to Kafka is granted based on the principle of least privilege; no access is given by default. Kafka clients are associated with the whitelisted Kafka topics and permissions – consume or produce – they strictly need. Also, granted access is auditable.
- Confidentiality: All in-transit traffic is encrypted.
Solution
We decided to use mutual Transport Layer Security (mTLS) for authentication and encryption. mTLS enables clients to authenticate servers, and servers to reciprocally authenticate clients.
Kafka supports other authentication mechanisms, like OAuth, or Salted Challenge Response Authentication Mechanism (SCRAM), but we chose mTLS because it is able to verify the peer’s identity offline. This verification ability means that systems do not need an active connection to an authentication server to ascertain the identity of a peer. This enables operating in disparate network environments, where all parties do not necessarily have access to such a central authority.
We opted for Hashicorp Vault and its PKI engine to dynamically generate clients and servers’ certificates. This enables us to enforce the usage of short-lived certificates for clients, which is a way to mitigate the potential impact of a client certificate being compromised or maliciously shared. We said zero trust, right?
For authorisation, we chose Policy-Based Access Control (PBAC), a more scalable solution than Role-Based Access Control (RBAC), and the Open Policy Agent (OPA) as our policy engine, for its wide community support.
To integrate mTLS and the OPA with Kafka, we leveraged Strimzi, the Kafka on Kubernetes operator. In a previous article, we have alluded to Strimzi and hinted at how it would help with scalability and cloud agnosticism. Built-in security is undoubtedly an additional driver of our adoption of Strimzi.
Server authentication
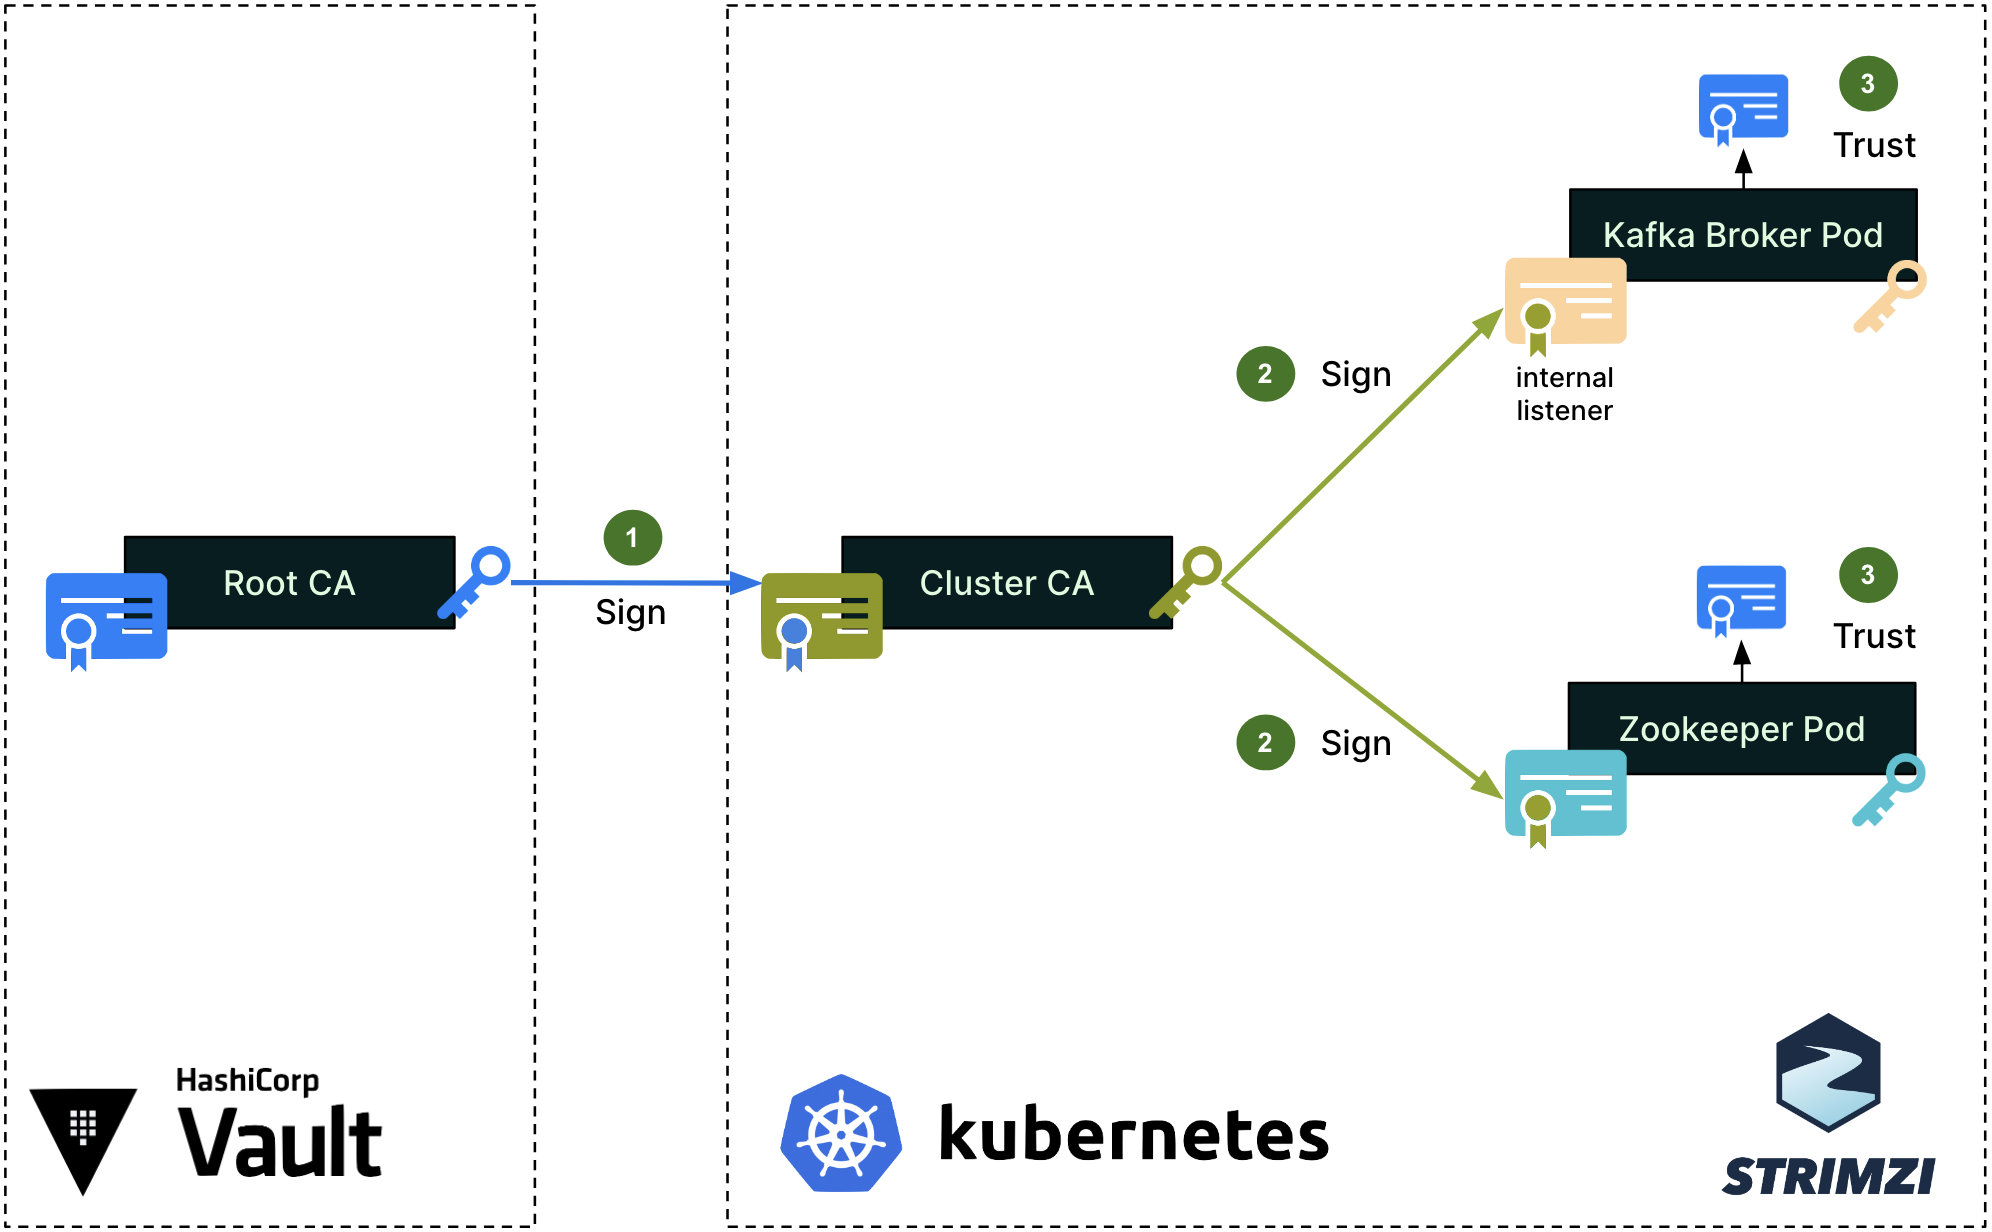
We first set up a single Root Certificate Authority (CA) for each environment (staging, production, etc.). This Root CA, in blue on the diagram, is securely managed by the Hashicorp Vault cluster. Note that the color of the certificates, keys, signing arrows and signatures on the diagrams are consistent throughout this article.
To secure the cluster’s internal communications, like the communications between the Kafka broker and Zookeeper pods, Strimzi sets up a Cluster CA, which is signed by the Root CA (step 1). The Cluster CA is then used to sign the individual Kafka broker and zookeeper certificates (step 2). Lastly, the Root CA’s public certificate is imported into the truststores of both the Kafka broker and Zookeeper (step 3), so that all pods can mutually verify their certificates when authenticating one with the other.
Strimzi’s embedded Cluster CA dynamically generates valid individual certificates when spinning up new Kafka and Zookeeper pods. The signing operation (step 2) is handled automatically by Strimzi.
For client access to Kafka brokers, Strimzi creates a different set of intermediate CA and server certificates, as shown in the next diagram.
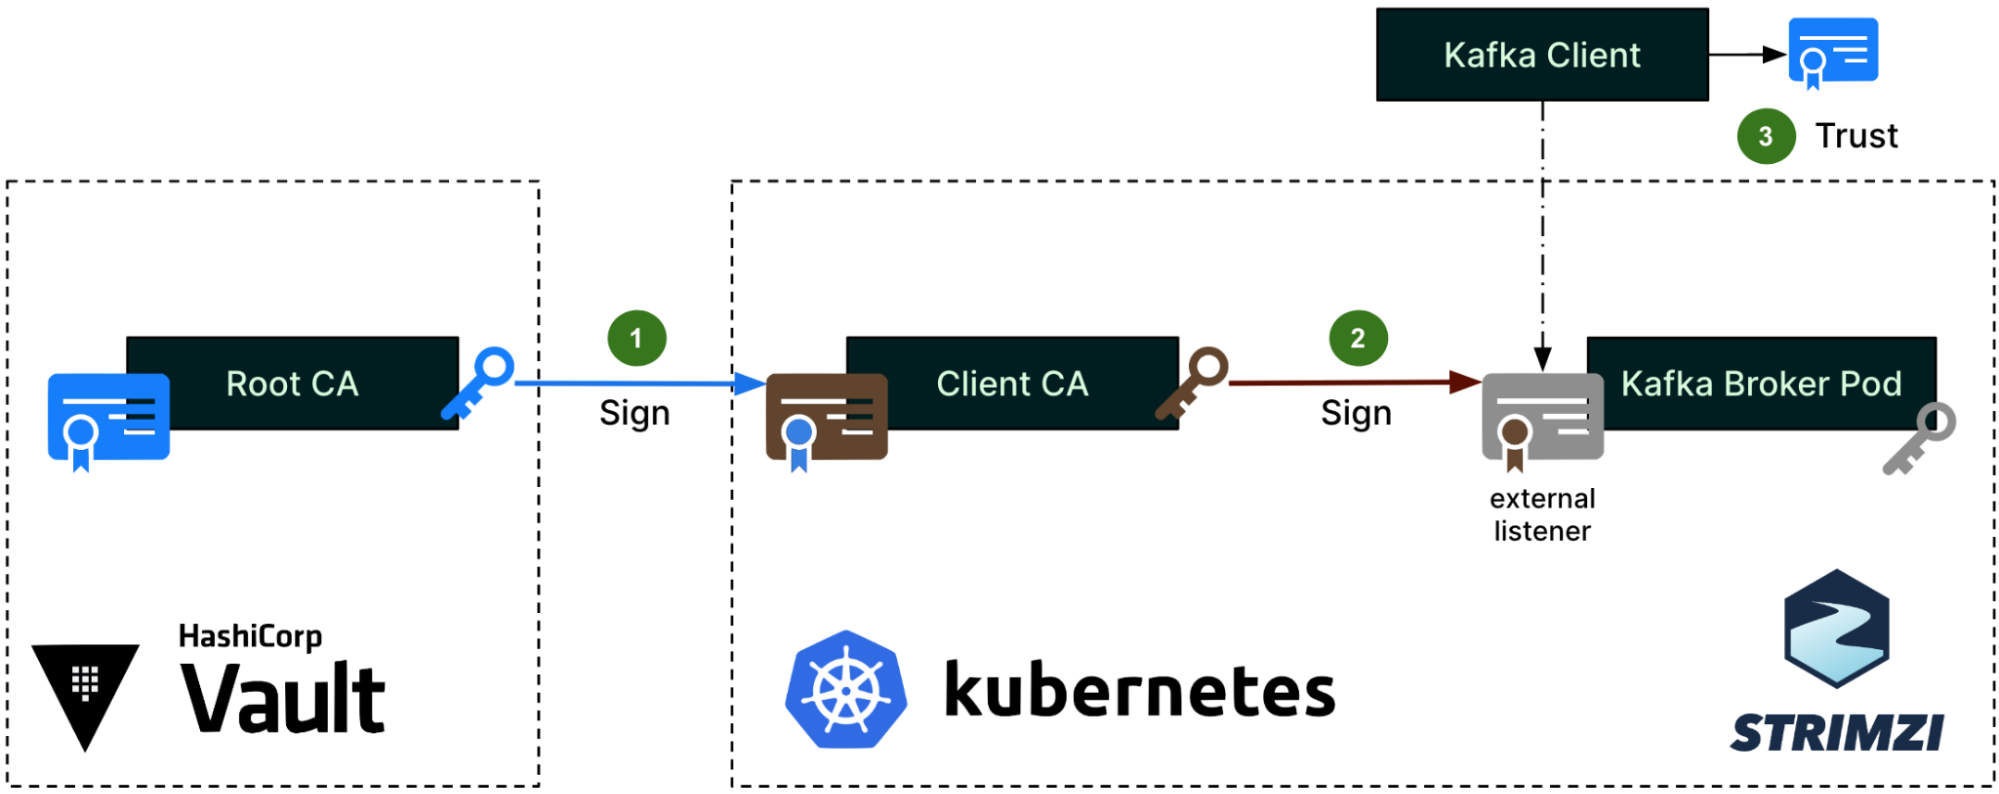
The same Root CA from Figure 1 now signs a different intermediate CA, which the Strimzi community calls the Client CA (step 1). This naming is misleading since it does not actually sign any client certificates, but only the server certificates (step 2) that are set up on the external listener of the Kafka brokers. These server certificates are for the Kafka clients to authenticate the servers. This time, the Root CA’s public certificate will be imported into the Kafka Client truststore (step 3).
Client authentication
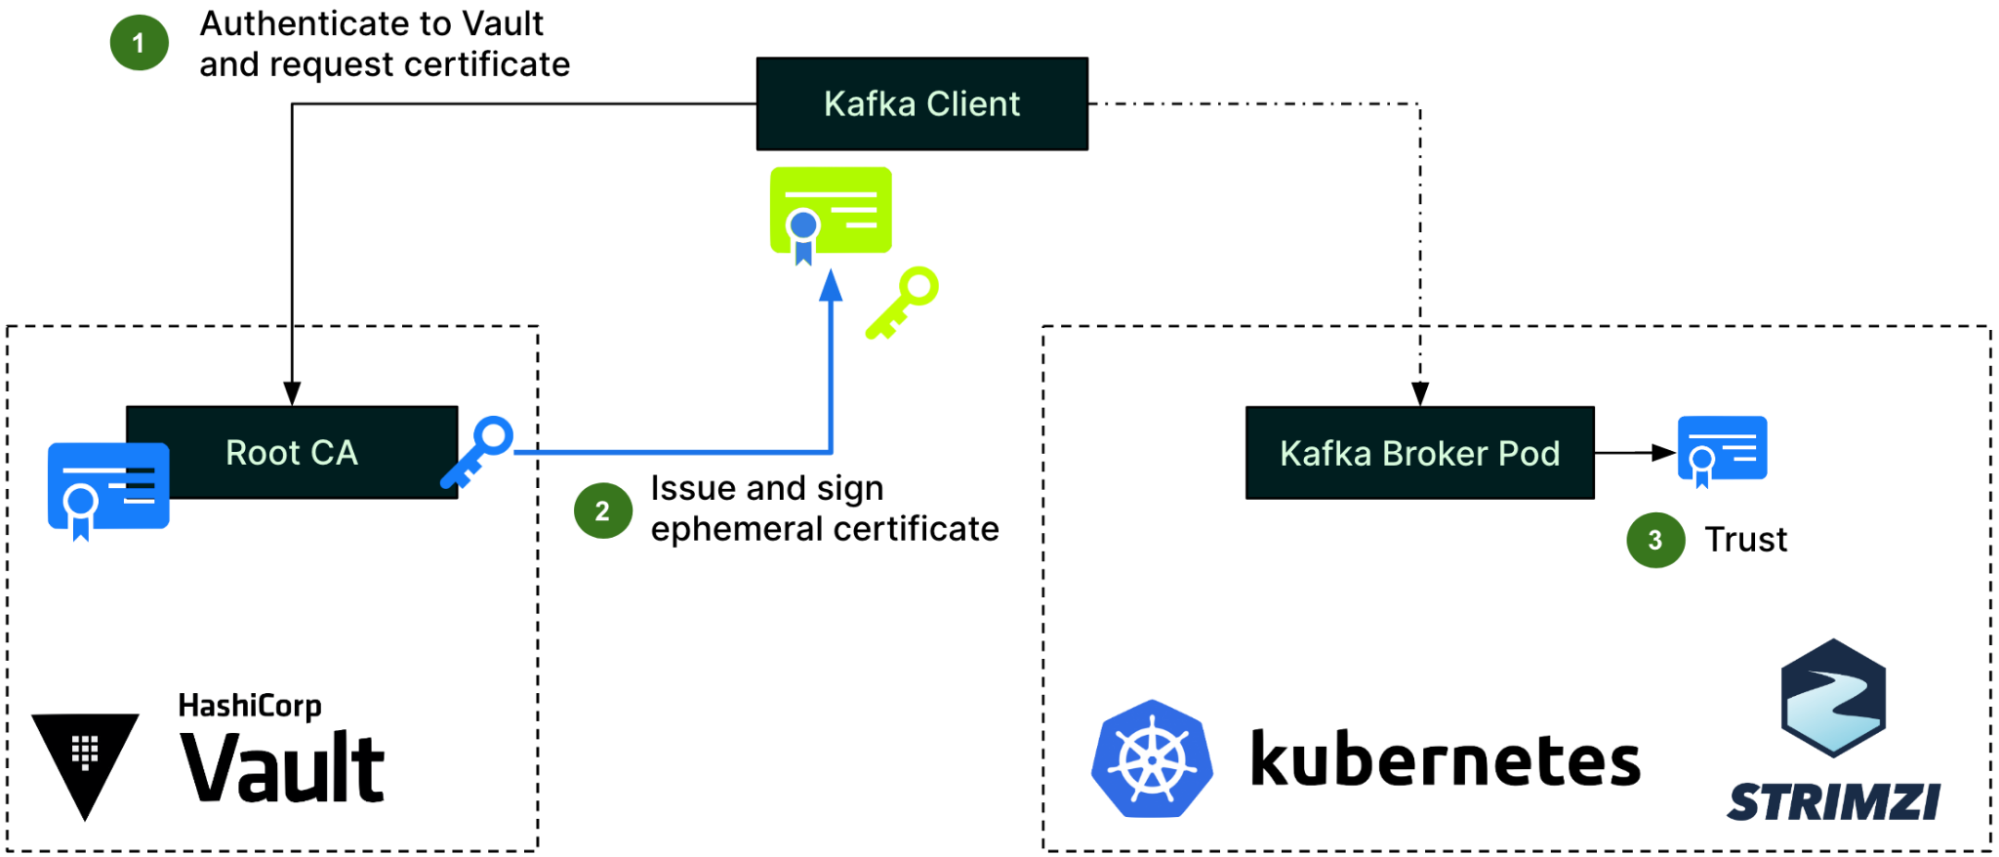
For client authentication, the Kafka client first needs to authenticate to Hashicorp Vault and request an ephemeral certificate from the Vault PKI engine (step 1). Vault then issues a certificate and signs it using its Root CA (step 2). With this certificate, the client can now authenticate to Kafka brokers, who will use the Root CA’s public certificate already in their truststore, as previously described (step 3).
CA tree
Putting together the three different authentication processes we have just covered, the CA tree now looks like this. Note that this is a simplified view for a single environment, a single cluster, and two clients only.
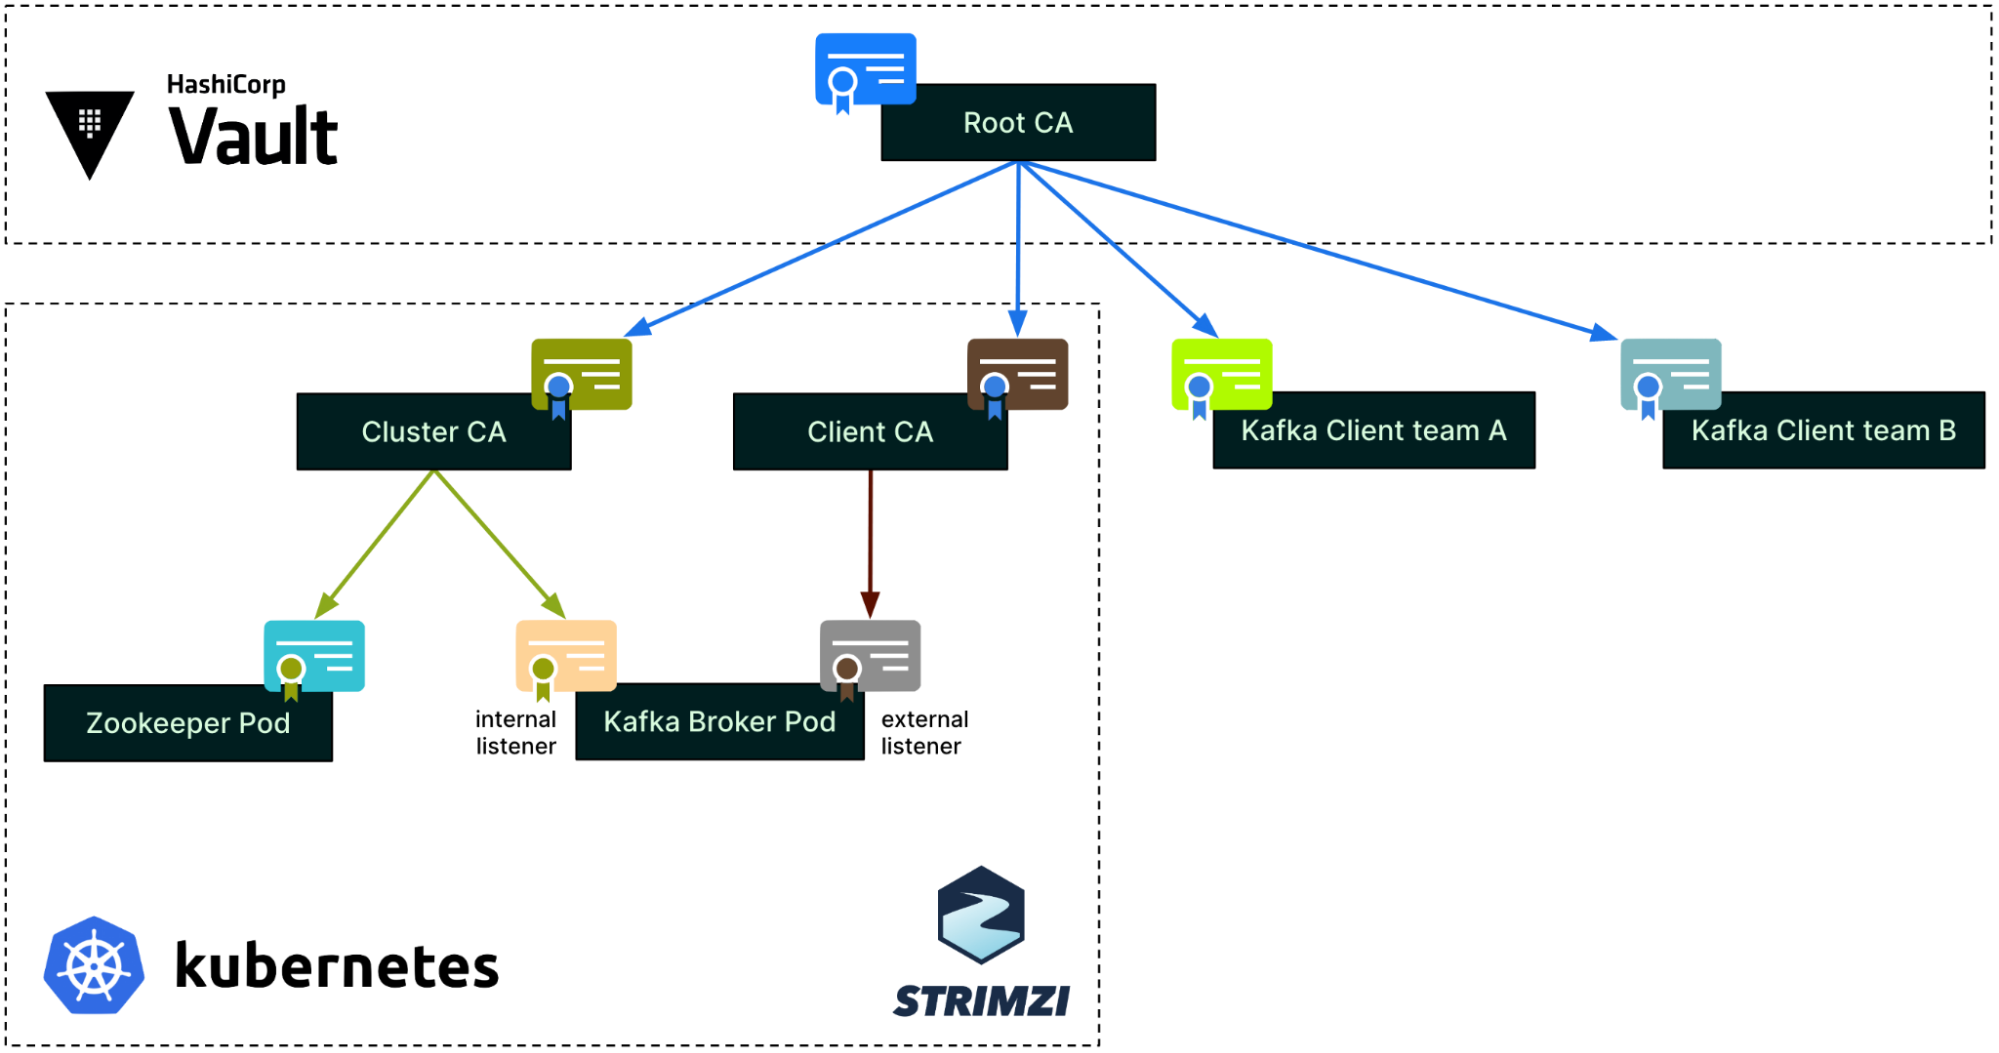
As mentioned earlier, each environment (staging, production, etc.) has its own Root CA. Within an environment, each Strimzi cluster has its own pair of intermediate CAs: the Cluster CA and the Client CA. At the leaf level, the Zookeeper and Kafka broker pods each have their own individual certificates.
On the right side of the diagram, each Kafka client can get an ephemeral certificate from Hashicorp Vault whenever they need to connect to Kafka. Each team or application has a dedicated Vault PKI role in Hashicorp Vault, restricting what can be requested for its certificate (e.g., Subject, TTL, etc.).
Strimzi deployment
We heavily use Terraform to manage and provision our Kafka and Kafka-related components. This enables us to quickly and reliably spin up new clusters and perform cluster scaling operations.
Under the hood, Strimzi Kafka deployment is a Kubernetes deployment. To increase the performance and the reliability of the Kafka cluster, we create dedicated Kubernetes nodes for each Strimzi Kafka broker and each Zookeeper pod, using Kubernetes taints and tolerations. This ensures that all resources of a single node are dedicated solely to either a single Kafka broker or a single Zookeeper pod.
We also decided to go with a single Kafka cluster by Kubernetes cluster to make the management easier.
Client setup
Coban provides backend microservice teams from all Grab verticals with a popular Kafka SDK in Golang, to standardise how teams utilise Coban Kafka clusters. Adding mTLS support mostly boils down to upgrading our SDK.
Our enhanced SDK provides a default mTLS configuration that works out of the box for most teams, while still allowing customisation, e.g., for teams that have their own Hashicorp Vault Infrastructure for compliance reasons. Similarly, clients can choose among various Vault auth methods such as AWS or Kubernetes to authenticate to Hashicorp Vault, or even implement their own logic for getting a valid client certificate.
To mitigate the potential risk of a user maliciously sharing their application’s certificate with other applications or users, we limit the maximum Time-To-Live (TTL) for any given certificate. This also removes the overhead of maintaining a Certificate Revocation List (CRL). Additionally, our SDK stores the certificate and its associated private key in memory only, never on disk, hence reducing the attack surface.
In our case, Hashicorp Vault is a dependency. To prevent it from reducing the overall availability of our data streaming platform, we have added two features to our SDK – a configurable retry mechanism and automatic renewal of clients’ short-lived certificates when two thirds of their TTL is reached. The upgraded SDK also produces new metrics around this certificate renewal process, enabling better monitoring and alerting.
Authorisation
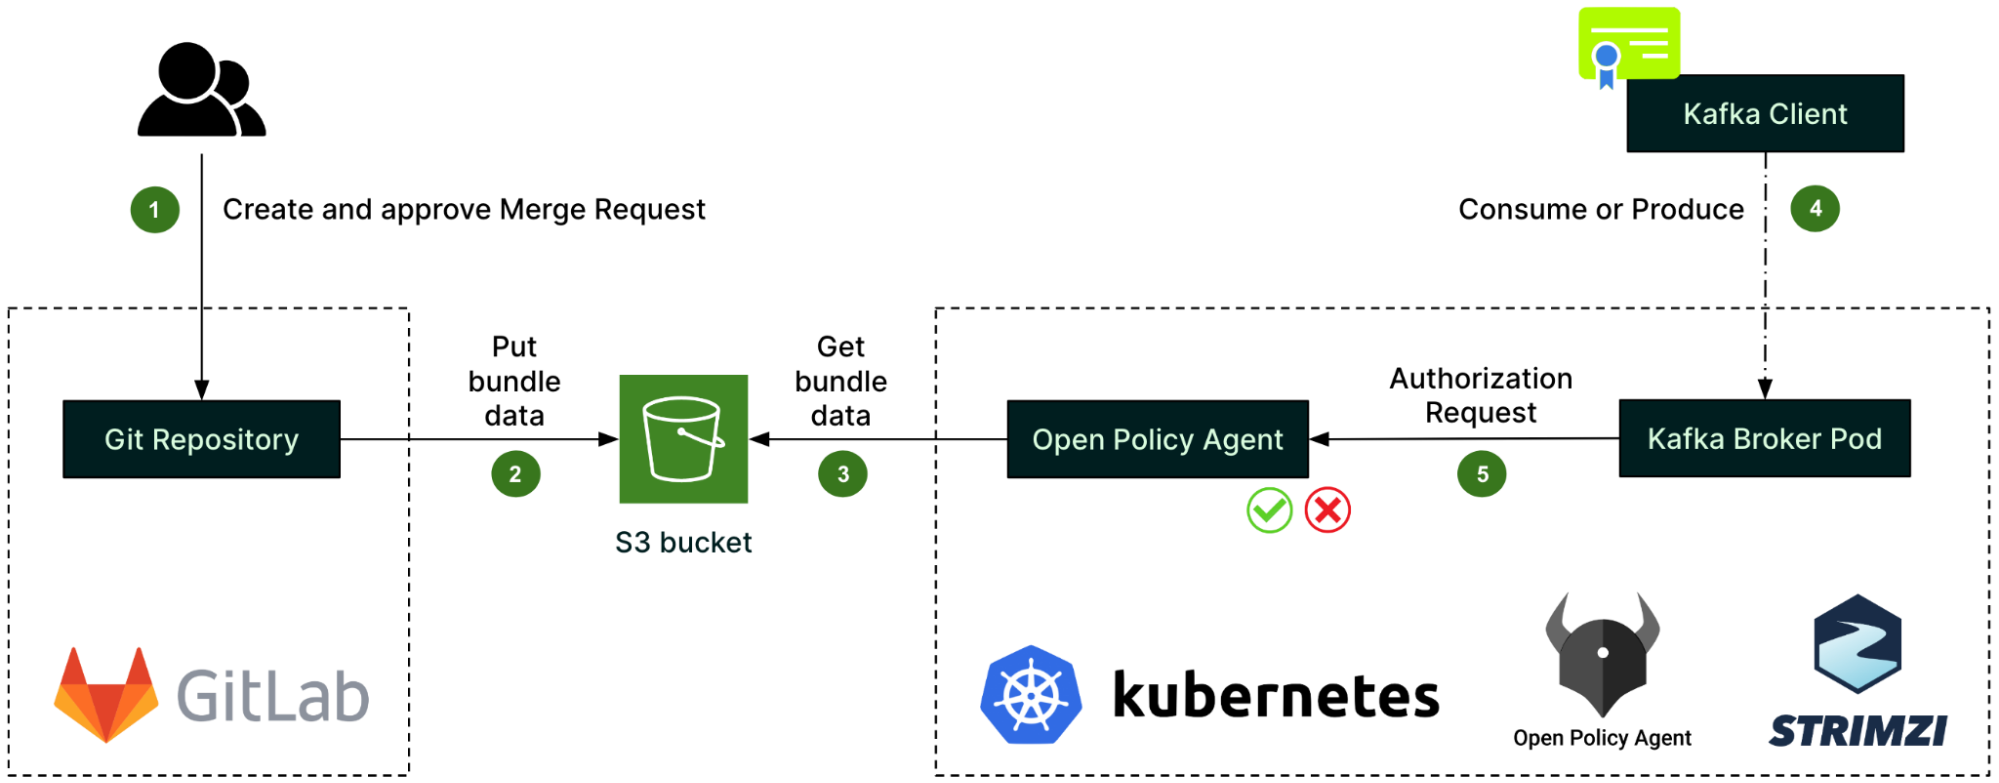
For authorisation, we set up the Open Policy Agent (OPA) as a standalone deployment in the Kubernetes cluster, and configured Strimzi to integrate the Kafka brokers with that OPA.
OPA policies – written in the Rego language – describe the authorisation logic. They are created in a GitLab repository along with the authorisation rules, called data sources (step 1). Whenever there is a change, a GitLab CI pipeline automatically creates a bundle of the policies and data sources, and pushes it to an S3 bucket (step 2). From there, it is fetched by the OPA (step 3).
When a client – identified by its TLS certificate’s Subject – attempts to consume or produce a Kafka record (step 4), the Kafka broker pod first issues an authorisation request to the OPA (step 5) before processing the client’s request. The outcome of the authorisation request is then cached by the Kafka broker pod to improve performance.
As the core component of the authorisation process, the OPA is deployed with the same high availability as the Kafka cluster itself, i.e. spread across the same number of Availability Zones. Also, we decided to go with one dedicated OPA by Kafka cluster instead of having a unique global OPA shared between multiple clusters. This is to reduce the blast radius of any OPA incidents.
For monitoring and alerting around authorisation, we submitted an Open Source contribution in the opa-kafka-plugin project in order to enable the OPA authoriser to expose some metrics. Our contribution to the open source code allows us to monitor various aspects of the OPA, such as the number of authorised and unauthorised requests, as well as the cache hit-and-miss rates. Also, we set up alerts for suspicious activity such as unauthorised requests.
Finally, as a platform team, we need to make authorisation a scalable, self-service process. Thus, we rely on the Git repository’s permissions to let Kafka topics’ owners approve the data source changes pertaining to their topics.
Teams who need their applications to access a Kafka topic would write and submit a JSON data source as simple as this:
{
 "example_topic": {
   "read": [
     "clientA.grab",
     "clientB.grab"
   ],
   "write": [
     "clientB.grab"
   ]
 }
}
GitLab CI unit tests and business logic checks are set up in the Git repository to ensure that the submitted changes are valid. After that, the change would be submitted to the topic’s owner for review and approval.
What’s next?
The performance impact of this security design is significant compared to unauthenticated, unauthorised, plaintext Kafka. We observed a drop in throughput, mostly due to the low performance of encryption and decryption in Java, and are currently benchmarking different encryption ciphers to mitigate this.
Also, on authorisation, our current PBAC design is pretty static, with a list of applications granted access for each topic. In the future, we plan to move to Attribute-Based Access Control (ABAC), creating dynamic policies based on teams and topics’ metadata. For example, teams could be granted read and write access to all of their own topics by default. Leveraging a versatile component such as the OPA as our authorisation controller enables this evolution.
Join us
Grab is the leading superapp platform in Southeast Asia, providing everyday services that matter to consumers. More than just a ride-hailing and food delivery app, Grab offers a wide range of on-demand services in the region, including mobility, food, package and grocery delivery services, mobile payments, and financial services across 428 cities in eight countries.
Powered by technology and driven by heart, our mission is to drive Southeast Asia forward by creating economic empowerment for everyone. If this mission speaks to you, join our team today!
Mystery Asterisk Destination
Post Syndicated from original https://xkcd.com/2708/

KernelCI now testing Linux Rust code (Collabora blog)
Post Syndicated from original https://lwn.net/Articles/917147/
Over on the Collabora blog, Adrian Ratiu writes about the addition of the kernel’s Rust code to the KernelCI automated kernel testing project. The blog post looks at what it took to add the support and on some plans for future additions, as well.
An interesting challenge for the rustc docker builds was the fact that the standard Rust method of installing toolchains is via curl https://sh.rustup.rs | sh which might be ok-ish for individual local development, but is a particularly bad idea in an automated CI system. Rustup itself does not (yet) do any signature verifications for its downloads.
Distros like Debian do not ship the version required by the kernel (v1.62), nor even rustup in some cases, and it’s unlikely the distro maintainers will keep the versions in sync with the mainline kernel which likely will become a moving target. Thankfully the Rust project provides standalone installers together with GPG signatures which are very useful for CI.