Join the preview for new memory-optimized, AWS Graviton4-powered Amazon EC2 instances (R8g)

Post Syndicated from Jeff Barr original https://aws.amazon.com/blogs/aws/join-the-preview-for-new-memory-optimized-aws-graviton4-powered-amazon-ec2-instances-r8g/

We are opening up a preview of the next generation of Amazon Elastic Compute Cloud (Amazon EC2) instances. Equipped with brand-new Graviton4 processors, the new R8g instances will deliver better price performance than any existing memory-optimized instance. The R8g instances are suitable for your most demanding memory-intensive workloads: big data analytics, high-performance databases, in-memory caches and so forth.

Graviton history
Let’s take a quick look back in time and recap the evolution of the Graviton processors:

November 2018 – The Graviton processor made its debut in the A1 instances, optimized for both performance and cost, and delivering cost reductions of up to 45% for scale-out workloads.

December 2019 – The Graviton2 processor debuted with the announcement of M6g, M6gd, C6g, C6gd, R6g, and R6gd instances with up to 40% better price performance than equivalent non-Graviton instances. The second-generation processor delivered up to 7x performance of the first one, including twice the floating point performance.

November 2021 – The Graviton3 processor made its debut with the announcement of the compute-optimized C7g instances. In addition to up to 25% better compute performance, this generation of processors once again doubled floating point and cryptographic performance when compared to the previous generation.

November 2022 – The Graviton 3E processor was announced, for use in the Hpc7g and C7gn instances, with up to 35% higher vector instruction processing performance than the Graviton3.

Today, every one of the top 100 Amazon Elastic Compute Cloud (EC2) customers makes use of Graviton, choosing between more than 150 Graviton-powered instances.

New Graviton4
I’m happy to be able to tell you about the latest in our series of innovative custom chip designs, the energy-efficient AWS Graviton4 processor.

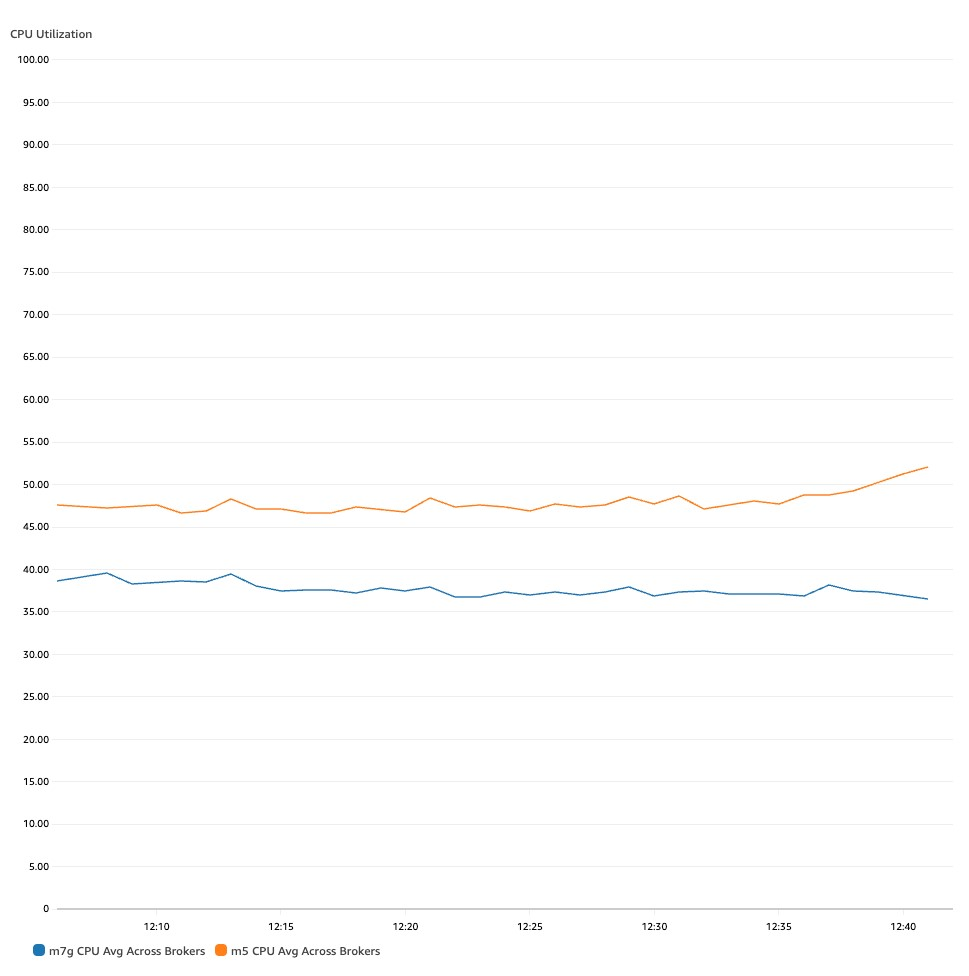
96 Neoverse V2 cores, 2 MB of L2 cache per core, and 12 DDR5-5600 channels work together to make the Graviton4 up to 40% faster for databases, 30% faster for web applications, and 45% faster for large Java applications than the Graviton3.

Graviton4 processors also support all of the security features from the previous generations, and includes some important new ones including encrypted high-speed hardware interfaces and Branch Target Identification (BTI).

R8g instance sizes
The 8th generation R8g instances will be available in multiple sizes with up to triple the number of vCPUs and triple the amount of memory of the 7th generation (R7g) of memory-optimized, Graviton3-powered instances.

Join the preview
R8g instances with Graviton4 processors

— Jeff;

Announcing the new Amazon S3 Express One Zone high performance storage class

Post Syndicated from Jeff Barr original https://aws.amazon.com/blogs/aws/new-amazon-s3-express-one-zone-high-performance-storage-class/

The new Amazon S3 Express One Zone storage class is designed to deliver up to 10x better performance than the S3 Standard storage class while handling hundreds of thousands of requests per second with consistent single-digit millisecond latency, making it a great fit for your most frequently accessed data and your most demanding applications. Objects are stored and replicated on purpose built hardware within a single AWS Availability Zone, allowing you to co-locate storage and compute (Amazon EC2, Amazon ECS, and Amazon EKS) resources to further reduce latency.

Amazon S3 Express One Zone
With very low latency between compute and storage, the Amazon S3 Express One Zone storage class can help to deliver a significant reduction in runtime for data-intensive applications, especially those that use hundreds or thousands of parallel compute nodes to process large amounts of data for AI/ML training, financial modeling, media processing, real-time ad placement, high performance computing, and so forth. These applications typically keep the data around for a relatively short period of time, but access it very frequently during that time.

This new storage class can handle objects of any size, but is especially awesome for smaller objects. This is because for smaller objects the time to first byte is very close to the time for last byte. In all storage systems, larger objects take longer to stream because there is more data to download during the transfer, and therefore the storage latency has less impact on the total time to read the object. As a result, smaller objects receive an outsized benefit from lower storage latency compared to large objects. Because of S3 Express One Zone’s consistent very low latency, small objects can be read up to 10x faster compared to S3 Standard.

The extremely low latency provided by Amazon S3 Express One Zone, combined with request costs that are 50% lower than for the S3 Standard storage class, means that your Spot and On-Demand compute resources are used more efficiently and can be shut down earlier, leading to an overall reduction in processing costs.

Each Amazon S3 Express One Zone directory bucket exists in a single Availability Zone that you choose, and can be accessed using the usual set of S3 API functions: CreateBucket, PutObject, GetObject, ListObjectsV2, and so forth. The buckets also support a carefully chosen set of S3 features including byte-range fetches, multi-part upload, multi-part copy, presigned URLs, and Access Analyzer for S3. You can upload objects directly, write code that uses CopyObject, or use S3 Batch Operations,

In order to reduce latency and to make this storage class as efficient & scalable as possible, we are introducing a new bucket type, a new authentication model, and a bucket naming convention:

New bucket type – The new directory buckets are specific to this storage class, and support hundreds of thousands of requests per second. They have a hierarchical namespace and store object key names in a directory-like manner. The path delimiter must be “/“, and any prefixes that you supply to ListObjectsV2 must end with a delimiter. Also, list operations return results without first sorting them, so you cannot do a “start after” retrieval.

New authentication model – The new CreateSession function returns a session token that grants access to a specific bucket for five minutes. You must include this token in the requests that you make to other S3 API functions that operate on the bucket or the objects in it, with the exception of CopyObject, which requires IAM credentials. The newest versions of the AWS SDKs handle session creation automatically.

Bucket naming – Directory bucket names must be unique within their AWS Region, and must specify an Availability Zone ID in a specially formed suffix. If my base bucket name is jbarr and it exists in Availability Zone use1-az5 (Availability Zone 5 in the US East (N. Virginia) Region) the name that I supply to CreateBucket would be jbarr--use1-az5--x-s3. Although the bucket exists within a specific Availability Zone, it is accessible from the other zones in the region, and there are no data transfer charges for requests from compute resources in one Availability Zone to directory buckets in another one in the same region.

Amazon S3 Express One Zone in action
Let’s put this new storage class to use. I will focus on the command line, but AWS Management Console and API access are also available.

My EC2 instance is running in my us-east-1f Availability Zone. I use jq to map this value to an Availability Zone Id:

$ aws ec2 describe-availability-zones --output json | \
  jq -r  '.AvailabilityZones[] | select(.ZoneName == "us-east-1f") | .ZoneId'
use1-az5

I create a bucket configuration (s3express-bucket-config.json) and include the Id:

{
        "Location" :
        {
                "Type" : "AvailabilityZone",
                "Name" : "use1-az5"
        },
        "Bucket":
        {
                "DataRedundancy" : "SingleAvailabilityZone",
                "Type"           : "Directory"
        }
}

After installing the newest version of the AWS Command Line Interface (AWS CLI), I create my directory bucket:

$ aws s3api create-bucket --bucket jbarr--use1-az5--x-s3 \
  --create-bucket-configuration file://s3express-bucket-config.json \
  --region us-east-1
-------------------------------------------------------------------------------------------
|                                       CreateBucket                                      |
+----------+------------------------------------------------------------------------------+
|  Location|  https://jbarr--use1-az5--x-s3.s3express-use1-az5.us-east-1.amazonaws.com/   |
+----------+------------------------------------------------------------------------------+

Then I can use the directory bucket as the destination for other CLI commands as usual (the second aws is the directory where I unzipped the AWS CLI):

$ aws s3 sync aws s3://jbarr--use1-az5--x-s3

When I list the directory bucket’s contents, I see that the StorageClass is EXPRESS_ONEZONE:

$ aws s3api list-objects-v2 --bucket jbarr--use1-az5--x-s3 --output json | \
  jq -r '.Contents[] | {Key: .Key, StorageClass: .StorageClass}'
...
{
  "Key": "install",
  "StorageClass": "EXPRESS_ONEZONE"
}
...

The Management Console for S3 shows General purpose buckets and Directory buckets on separate tabs:

I can import the contents of an existing bucket (or a prefixed subset of the contents) into a directory bucket using the Import button, as seen above. I select a source bucket, click Import, and enter the parameters that will be used to generate an inventory of the source bucket and to create and an S3 Batch Operations job.

The job is created and begins to execute:

Things to know
Here are some important things to know about this new S3 storage class:

Regions – Amazon S3 Express One Zone is available in the US East (N. Virginia), US West (Oregon), Asia Pacific (Tokyo), and Europe (Stockholm) Regions, with plans to expand to others over time.

Other AWS Services – You can use Amazon S3 Express One Zone with other AWS services including Amazon SageMaker Model Training, Amazon Athena, Amazon EMR, and AWS Glue Data Catalog to accelerate your machine learning and analytics workloads. You can also use Mountpoint for Amazon S3 to process your S3 objects in file-oriented fashion.

Pricing – Pricing, like the other S3 storage classes, is on a pay-as-you-go basis. You pay $0.16/GB/month in the US East (N. Virginia) Region, with a one-hour minimum billing time for each object, and additional charges for certain request types. You pay an additional per-GB fee for the portion of any request that exceeds 512 KB. For more information, see the Amazon S3 Pricing page.

Durability – In the unlikely case of the loss or damage to all or part of an AWS Availability Zone, data in a One Zone storage class may be lost. For example, events like fire and water damage could result in data loss. Apart from these types of events, our One Zone storage classes use similar engineering designs as our Regional storage classes to protect objects from independent disk, host, and rack-level failures, and each are designed to deliver 99.999999999% data durability.

SLA – Amazon S3 Express One Zone is designed to deliver 99.95% availability with an availability SLA of 99.9%; for information see the Amazon S3 Service Level Agreement page.

This new storage class is available now and you can start using it today!

Learn more
Amazon S3 Express One Zone

— Jeff;

Security updates for Tuesday

Post Syndicated from corbet original https://lwn.net/Articles/953099/

Security updates have been issued by Debian (cryptojs, fastdds, mediawiki, and minizip), Fedora (chromium, kubernetes, and thunderbird), Mageia (lilypond, mariadb, and packages), Red Hat (firefox, linux-firmware, and thunderbird), SUSE (compat-openssl098, gstreamer-plugins-bad, squashfs, squid, thunderbird, vim, and xerces-c), and Ubuntu (libtommath, linux-intel-iotg, linux-intel-iotg-5.15, linux-oracle, perl, and python3.8, python3.10, python3.11).

Security at multiple layers for web-administered apps

Post Syndicated from Guy Morton original https://aws.amazon.com/blogs/security/security-at-multiple-layers-for-web-administered-apps/

In this post, I will show you how to apply security at multiple layers of a web application hosted on AWS.

Apply security at all layers is a design principle of the Security pillar of the AWS Well-Architected Framework. It encourages you to apply security at the network edge, virtual private cloud (VPC), load balancer, compute instance (or service), operating system, application, and code.

Many popular web apps are designed with a single layer of security: the login page. Behind that login page is an in-built administration interface that is directly exposed to the internet. Admin interfaces for these apps typically have simple login mechanisms and often lack multi-factor authentication (MFA) support, which can make them an attractive target for threat actors.

The in-built admin interface can also be problematic if you want to horizontally scale across multiple servers. The admin interface is available on every server that runs the app, so it creates a large attack surface. Because the admin interface updates the software on its own server, you must synchronize updates across a fleet of instances.

Multi-layered security is about identifying (or creating) isolation boundaries around the parts of your architecture and minimizing what is permitted to cross each boundary. Adding more layers to your architecture gives you the opportunity to introduce additional controls at each layer, creating more boundaries where security controls can be enforced.

In the example app scenario in this post, you have the opportunity to add many additional layers of security.

Example of multi-layered security

This post demonstrates how you can use the Run Web-Administered Apps on AWS sample project to help address these challenges, by implementing a horizontally-scalable architecture with multi-layered security. The project builds and configures many different AWS services, each designed to help provide security at different layers.

By running this solution, you can produce a segmented architecture that separates the two functions of these apps into an unprivileged public-facing view and an admin view. This design limits access to the web app’s admin functions while creating a fleet of unprivileged instances to serve the app at scale.

Figure 1 summarizes how the different services in this solution work to help provide security at the following layers:

  1. At the network edge
  2. Within the VPC
  3. At the load balancer
  4. On the compute instances
  5. Within the operating system
Figure 1: Logical flow diagram to apply security at multiple layers

Figure 1: Logical flow diagram to apply security at multiple layers

Deep dive on a multi-layered architecture

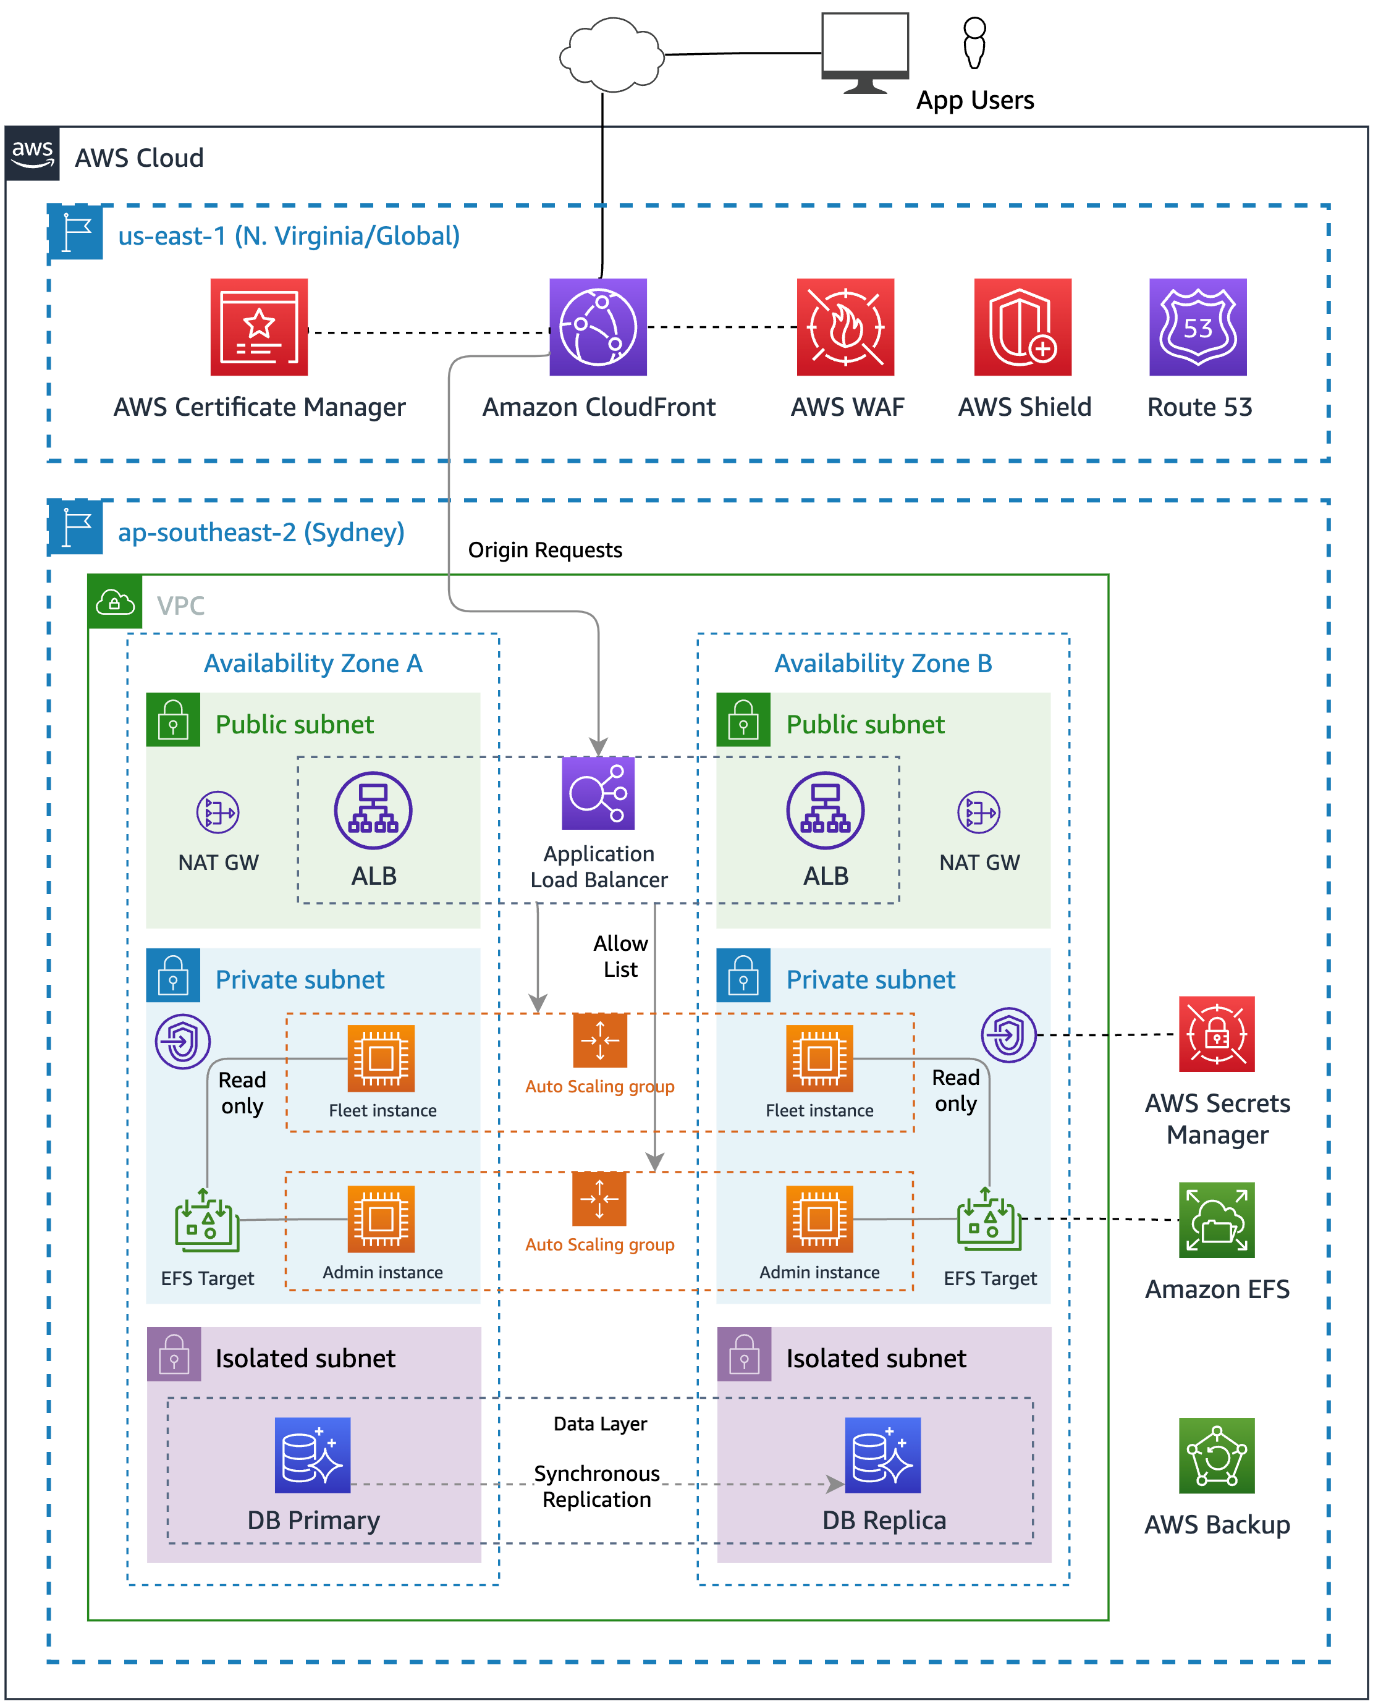
The following diagram shows the solution architecture deployed by Run Web-Administered Apps on AWS. The figure shows how the services deployed in this solution are deployed in different AWS Regions, and how requests flow from the application user through the different service layers.

Figure 2: Multi-layered architecture

Figure 2: Multi-layered architecture

This post will dive deeper into each of the architecture’s layers to see how security is added at each layer. But before we talk about the technology, let’s consider how infrastructure is built and managed — by people.

Perimeter 0 – Security at the people layer

Security starts with the people in your team and your organization’s operational practices. How your “people layer” builds and manages your infrastructure contributes significantly to your security posture.

A design principle of the Security pillar of the Well-Architected Framework is to automate security best practices. This helps in two ways: it reduces the effort required by people over time, and it helps prevent resources from being in inconsistent or misconfigured states. When people use manual processes to complete tasks, misconfigurations and missed steps are common.

The simplest way to automate security while reducing human effort is to adopt services that AWS manages for you, such as Amazon Relational Database Service (Amazon RDS). With Amazon RDS, AWS is responsible for the operating system and database software patching, and provides tools to make it simple for you to back up and restore your data.

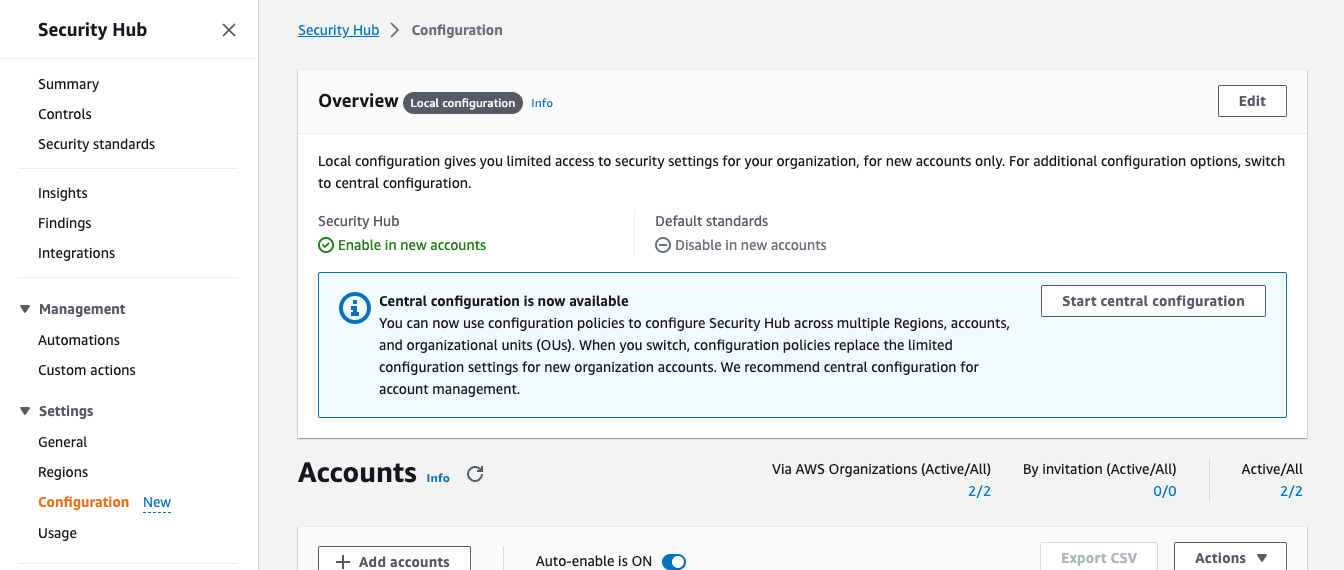
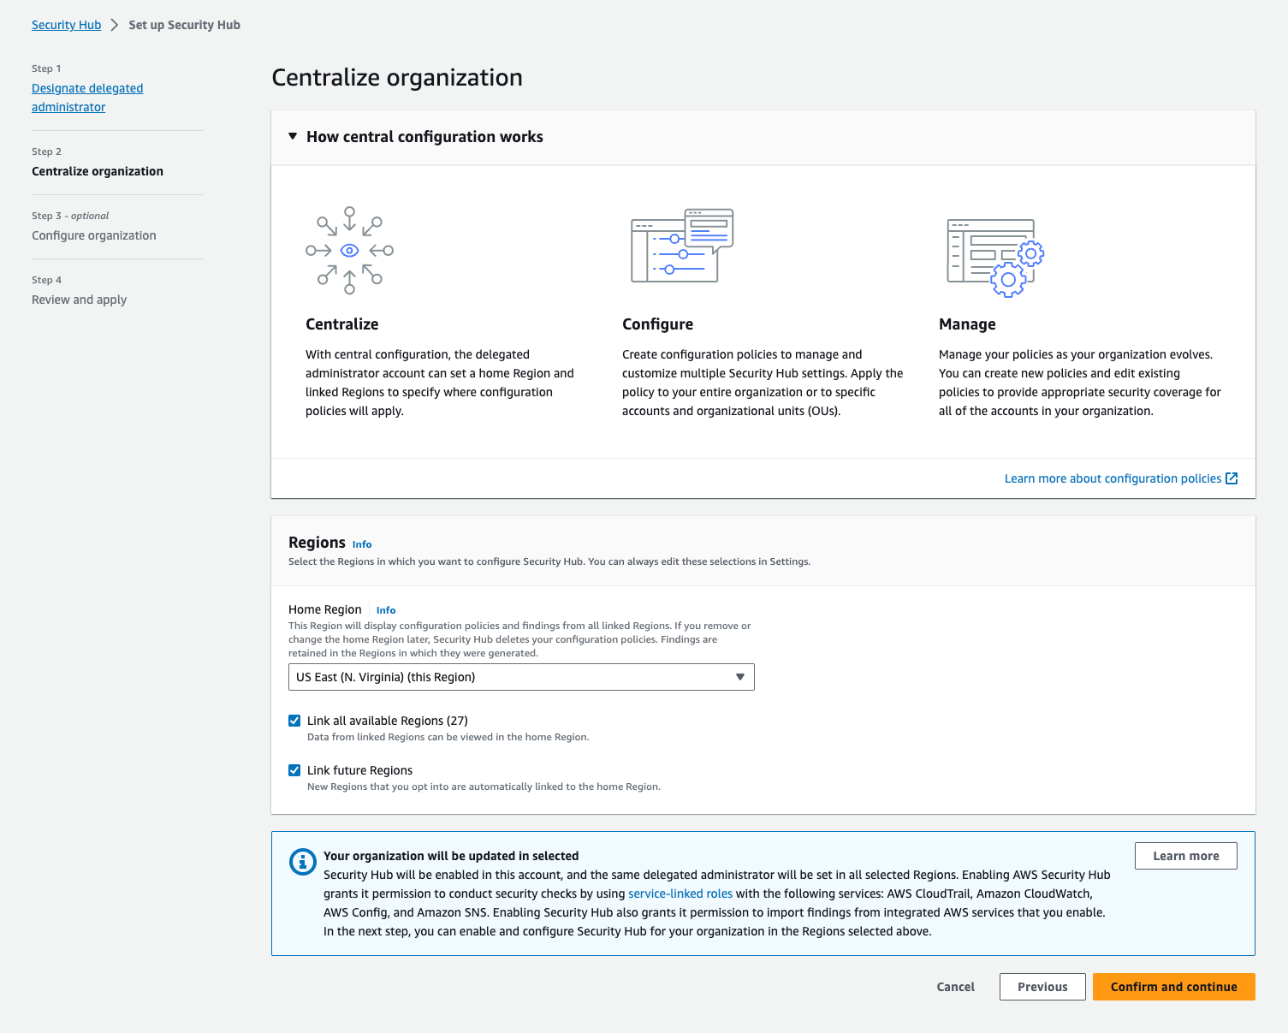
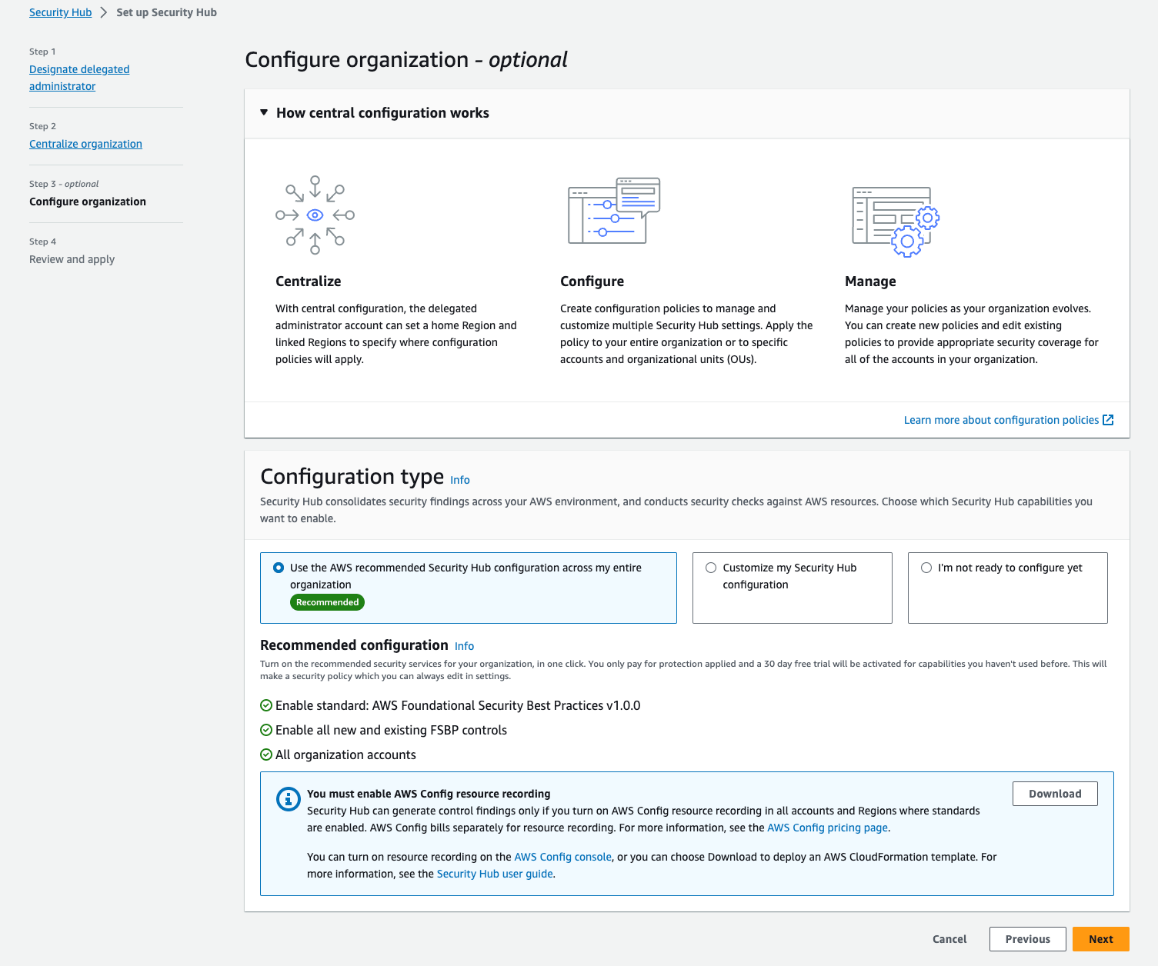
You can automate and integrate key security functions by using managed AWS security services, such as Amazon GuardDuty, AWS Config, Amazon Inspector, and AWS Security Hub. These services provide network monitoring, configuration management, and detection of software vulnerabilities and unintended network exposure. As your cloud environments grow in scale and complexity, automated security monitoring is critical.

Infrastructure as code (IaC) is a best practice that you can follow to automate the creation of infrastructure. By using IaC to define, configure, and deploy the AWS resources that you use, you reduce the likelihood of human error when building AWS infrastructure.

Adopting IaC can help you improve your security posture because it applies the rigor of application code development to infrastructure provisioning. Storing your infrastructure definition in a source control system (such as AWS CodeCommit) creates an auditable artifact. With version control, you can track changes made to it over time as your architecture evolves.

You can add automated testing to your IaC project to help ensure that your infrastructure is aligned with your organization’s security policies. If you ever need to recover from a disaster, you can redeploy the entire architecture from your IaC project.

Another people-layer discipline is to apply the principle of least privilege. AWS Identity and Access Management (IAM) is a flexible and fine-grained permissions system that you can use to grant the smallest set of actions that your solution needs. You can use IAM to control access for both humans and machines, and we use it in this project to grant the compute instances the least privileges required.

You can also adopt other IAM best practices such as using temporary credentials instead of long-lived ones (such as access keys), and regularly reviewing and removing unused users, roles, permissions, policies, and credentials.

Perimeter 1 – network protections

The internet is public and therefore untrusted, so you must proactively address the risks from threat actors and network-level attacks.

To reduce the risk of distributed denial of service (DDoS) attacks, this solution uses AWS Shield for managed protection at the network edge. AWS Shield Standard is automatically enabled for all AWS customers at no additional cost and is designed to provide protection from common network and transport layer DDoS attacks. For higher levels of protection against attacks that target your applications, subscribe to AWS Shield Advanced.

Amazon Route 53 resolves the hostnames that the solution uses and maps the hostnames as aliases to an Amazon CloudFront distribution. Route 53 is a robust and highly available globally distributed DNS service that inspects requests to protect against DNS-specific attack types, such as DNS amplification attacks.

Perimeter 2 – request processing

CloudFront also operates at the AWS network edge and caches, transforms, and forwards inbound requests to the relevant origin services across the low-latency AWS global network. The risk of DDoS attempts overwhelming your application servers is further reduced by caching web requests in CloudFront.

The solution configures CloudFront to add a shared secret to the origin request within a custom header. A CloudFront function copies the originating user’s IP to another custom header. These headers get checked when the request arrives at the load balancer.

AWS WAF, a web application firewall, blocks known bad traffic, including cross-site scripting (XSS) and SQL injection events that come into CloudFront. This project uses AWS Managed Rules, but you can add your own rules, as well. To restrict frontend access to permitted IP CIDR blocks, this project configures an IP restriction rule on the web application firewall.

Perimeter 3 – the VPC

After CloudFront and AWS WAF check the request, CloudFront forwards it to the compute services inside an Amazon Virtual Private Cloud (Amazon VPC). VPCs are logically isolated networks within your AWS account that you can use to control the network traffic that is allowed in and out. This project configures its VPC to use a private IPv4 CIDR block that cannot be directly routed to or from the internet, creating a network perimeter around your resources on AWS.

The Amazon Elastic Compute Cloud (Amazon EC2) instances are hosted in private subnets within the VPC that have no inbound route from the internet. Using a NAT gateway, instances can make necessary outbound requests. This design hosts the database instances in isolated subnets that don’t have inbound or outbound internet access. Amazon RDS is a managed service, so AWS manages patching of the server and database software.

The solution accesses AWS Secrets Manager by using an interface VPC endpoint. VPC endpoints use AWS PrivateLink to connect your VPC to AWS services as if they were in your VPC. In this way, resources in the VPC can communicate with Secrets Manager without traversing the internet.

The project configures VPC Flow Logs as part of the VPC setup. VPC flow logs capture information about the IP traffic going to and from network interfaces in your VPC. GuardDuty analyzes these logs and uses threat intelligence data to identify unexpected, potentially unauthorized, and malicious activity within your AWS environment.

Although using VPCs and subnets to segment parts of your application is a common strategy, there are other ways that you can achieve partitioning for application components:

  • You can use separate VPCs to restrict access to a database, and use VPC peering to route traffic between them.
  • You can use a multi-account strategy so that different security and compliance controls are applied in different accounts to create strong logical boundaries between parts of a system. You can route network requests between accounts by using services such as AWS Transit Gateway, and control them using AWS Network Firewall.

There are always trade-offs between complexity, convenience, and security, so the right level of isolation between components depends on your requirements.

Perimeter 4 – the load balancer

After the request is sent to the VPC, an Application Load Balancer (ALB) processes it. The ALB distributes requests to the underlying EC2 instances. The ALB uses TLS version 1.2 to encrypt incoming connections with an AWS Certificate Manager (ACM) certificate.

Public access to the load balancer isn’t allowed. A security group applied to the ALB only allows inbound traffic on port 443 from the CloudFront IP range. This is achieved by specifying the Region-specific AWS-managed CloudFront prefix list as the source in the security group rule.

The ALB uses rules to decide whether to forward the request to the target instances or reject the traffic. As an additional layer of security, it uses the custom headers that the CloudFront distribution added to make sure that the request is from CloudFront. In another rule, the ALB uses the originating user’s IP to decide which target group of Amazon EC2 instances should handle the request. In this way, you can direct admin users to instances that are configured to allow admin tasks.

If a request doesn’t match a valid rule, the ALB returns a 404 response to the user.

Perimeter 5 – compute instance network security

A security group creates an isolation boundary around the EC2 instances. The only traffic that reaches the instance is the traffic that the security group rules allow. In this solution, only the ALB is allowed to make inbound connections to the EC2 instances.

A common practice is for customers to also open ports, or to set up and manage bastion hosts to provide remote access to their compute instances. The risk in this approach is that the ports could be left open to the whole internet, exposing the instances to vulnerabilities in the remote access protocol. With remote work on the rise, there is an increased risk for the creation of these overly permissive inbound rules.

Using AWS Systems Manager Session Manager, you can remove the need for bastion hosts or open ports by creating secure temporary connections to your EC2 instances using the installed SSM agent. As with every software package that you install, you should check that the SSM agent aligns with your security and compliance requirements. To review the source code to the SSM agent, see amazon-ssm-agent GitHub repo.

The compute layer of this solution consists of two separate Amazon EC2 Auto Scaling groups of EC2 instances. One group handles requests from administrators, while the other handles requests from unprivileged users. This creates another isolation boundary by keeping the functions separate while also helping to protect the system from a failure in one component causing the whole system to fail. Each Amazon EC2 Auto Scaling group spans multiple Availability Zones (AZs), providing resilience in the event of an outage in an AZ.

By using managed database services, you can reduce the risk that database server instances haven’t been proactively patched for security updates. Managed infrastructure helps reduce the risk of security issues that result from the underlying operating system not receiving security patches in a timely manner and the risk of downtime from hardware failures.

Perimeter 6 – compute instance operating system

When instances are first launched, the operating system must be secure, and the instances must be updated as required when new security patches are released. We recommend that you create immutable servers that you build and harden by using a tool such as EC2 Image Builder. Instead of patching running instances in place, replace them when an updated Amazon Machine Image (AMI) is created. This approach works in our example scenario because the application code (which changes over time) is stored on Amazon Elastic File System (Amazon EFS), so when you replace the instances with a new AMI, you don’t need to update them with data that has changed after the initial deployment.

Another way that the solution helps improve security on your instances at the operating system is to use EC2 instance profiles to allow them to assume IAM roles. IAM roles grant temporary credentials to applications running on EC2, instead of using hard-coded credentials stored on the instance. Access to other AWS resources is provided using these temporary credentials.

The IAM roles have least privilege policies attached that grant permission to mount the EFS file system and access AWS Systems Manager. If a database secret exists in Secrets Manager, the IAM role is granted permission to access it.

Perimeter 7 – at the file system

Both Amazon EC2 Auto Scaling groups of EC2 instances share access to Amazon EFS, which hosts the files that the application uses. IAM authorization applies IAM file system policies to control the instance’s access to the file system. This creates another isolation boundary that helps prevent the non-admin instances from modifying the application’s files.

The admin group’s instances have the file system mounted in read-write mode. This is necessary so that the application can update itself, install add-ons, upload content, or make configuration changes. On the unprivileged instances, the file system is mounted in read-only mode. This means that these instances can’t make changes to the application code or configuration files.

The unprivileged instances have local file caching enabled. This caches files from the EFS file system on the local Amazon Elastic Block Store (Amazon EBS) volume to help improve scalability and performance.

Perimeter 8 – web server configuration

This solution applies different web server configurations to the instances running in each Amazon EC2 Auto Scaling group. This creates a further isolation boundary at the web server layer.

The admin instances use the default configuration for the application that permits access to the admin interface. Non-admin, public-facing instances block admin routes, such as wp-login.php, and will return a 403 Forbidden response. This creates an additional layer of protection for those routes.

Perimeter 9 – database security

The database layer is within two additional isolation boundaries. The solution uses Amazon RDS, with database instances deployed in isolated subnets. Isolated subnets have no inbound or outbound internet access and can only be reached through other network interfaces within the VPC. The RDS security group further isolates the database instances by only allowing inbound traffic from the EC2 instances on the database server port.

By using IAM authentication for the database access, you can add an additional layer of security by configuring the non-admin instances with less privileged database user credentials.

Perimeter 10 – Security at the application code layer

To apply security at the application code level, you should establish good practices around installing updates as they become available. Most applications have email lists that you can subscribe to that will notify you when updates become available.

You should evaluate the quality of an application before you adopt it. The following are some metrics to consider:

  • Number of developers who are actively working on it
  • Frequency of updates to it
  • How quickly the developers respond with patches when bugs are reported

Other steps that you can take

Use AWS Verified Access to help secure application access for human users. With Verified Access, you can add another user authentication stage, to help ensure that only verified users can access an application’s administrative functions.

Amazon GuardDuty is a threat detection service that continuously monitors your AWS accounts and workloads for malicious activity and delivers detailed security findings for visibility and remediation. It can detect communication with known malicious domains and IP addresses and identify anomalous behavior. GuardDuty Malware Protection helps you detect the potential presence of malware by scanning the EBS volumes that are attached to your EC2 instances.

Amazon Inspector is an automated vulnerability management service that automatically discovers the Amazon EC2 instances that are running and scans them for software vulnerabilities and unintended network exposure. To help ensure that your web server instances are updated when security patches are available, use AWS Systems Manager Patch Manager.

Deploy the sample project

We wrote the Run Web-Administered Apps on AWS project by using the AWS Cloud Development Kit (AWS CDK). With the AWS CDK, you can use the expressive power of familiar programming languages to define your application resources and accelerate development. The AWS CDK has support for multiple languages, including TypeScript, Python, .NET, Java, and Go.

This project uses Python. To deploy it, you need to have a working version of Python 3 on your computer. For instructions on how to install the AWS CDK, see Get Started with AWS CDK.

Configure the project

To enable this project to deploy multiple different web projects, you must do the configuration in the parameters.properties file. Two variables identify the configuration blocks: app (which identifies the web application to deploy) and env (which identifies whether the deployment is to a dev or test environment, or to production).

When you deploy the stacks, you specify the app and env variables as CDK context variables so that you can select between different configurations at deploy time. If you don’t specify a context, a [default] stanza in the parameters.properties file specifies the default app name and environment that will be deployed.

To name other stanzas, combine valid app and env values by using the format <app>-<env>. For each stanza, you can specify its own Regions, accounts, instance types, instance counts, hostnames, and more. For example, if you want to support three different WordPress deployments, you might specify the app name as wp, and for env, you might want dev, test, and prod, giving you three stanzas: wp-dev, wp-test, and wp-prod.

The project includes sample configuration items that are annotated with comments that explain their function.

Use CDK bootstrapping

Before you can use the AWS CDK to deploy stacks into your account, you need to use CDK bootstrapping to provision resources in each AWS environment (account and Region combination) that you plan to use. For this project, you need to bootstrap both the US East (N. Virginia) Region (us-east-1)  and the home Region in which you plan to host your application.

Create a hosted zone in the target account

You need to have a hosted zone in Route 53 to allow the creation of DNS records and certificates. You must manually create the hosted zone by using the AWS Management Console. You can delegate a domain that you control to Route 53 and use it with this project. You can also register a domain through Route 53 if you don’t currently have one.

Run the project

Clone the project to your local machine and navigate to the project root. To create the Python virtual environment (venv) and install the dependencies, follow the steps in the Generic CDK instructions.

To create and configure the parameters.properties file

Copy the parameters-template.properties file (in the root folder of the project) to a file called parameters.properties and save it in the root folder. Open it with a text editor and then do the following:

If you want to restrict public access to your site, change 192.0.2.0/24 to the IP range that you want to allow. By providing a comma-separated list of allowedIps, you can add multiple allowed CIDR blocks.

If you don’t want to restrict public access, set allowedIps=* instead.

If you have forked this project into your own private repository, you can commit the parameters.properties file to your repo. To do that, comment out the parameters.properties  line in the .gitignore file.

To install the custom resource helper

The solution uses an AWS CloudFormation custom resource for cross-Region configuration management. To install the needed Python package, run the following command in the custom_resource directory:

cd custom_resource
pip install crhelper -t .

To learn more about CloudFormation custom resource creation, see AWS CloudFormation custom resource creation with Python, AWS Lambda, and crhelper.

To configure the database layer

Before you deploy the stacks, decide whether you want to include a data layer as part of the deployment. The dbConfig parameter determines what will happen, as follows:

  • If dbConfig is left empty — no database will be created and no database credentials will be available in your compute stacks
  • If dbConfig is set to instance — you will get a new Amazon RDS instance
  • If dbConfig is set to cluster — you will get an Amazon Aurora cluster
  • If dbConfig is set to none — if you previously created a database in this stack, the database will be deleted

If you specify either instance or cluster, you should also configure the following database parameters to match your requirements:

  • dbEngine — set the database engine to either mysql or postgres
  • dbSnapshot — specify the named snapshot for your database
  • dbSecret — if you are using an existing database, specify the Amazon Resource Name (ARN) of the secret where the database credentials and DNS endpoint are located
  • dbMajorVersion — set the major version of the engine that you have chosen; leave blank to get the default version
  • dbFullVersion — set the minor version of the engine that you have chosen; leave blank to get the default version
  • dbInstanceType — set the instance type that you want (note that these vary by service); don’t prefix with db. because the CDK will automatically prepend it
  • dbClusterSize — if you request a cluster, set this parameter to determine how many Amazon Aurora replicas are created

You can choose between mysql or postgres for the database engine. Other settings that you can choose are determined by that choice.

You will need to use an Amazon Machine Image (AMI) that has the CLI preinstalled, such as Amazon Linux 2, or install the AWS Command Line Interface (AWS CLI) yourself with a user data command. If instead of creating a new, empty database, you want to create one from a snapshot, supply the snapshot name by using the dbSnapshot parameter.

To create the database secret

AWS automatically creates and stores the RDS instance or Aurora cluster credentials in a Secrets Manager secret when you create a new instance or cluster. You make these credentials available to the compute stack through the db_secret_command variable, which contains a single-line bash command that returns the JSON from the AWS CLI command aws secretsmanager get-secret-value. You can interpolate this variable into your user data commands as follows:

SECRET=$({db_secret_command})
USERNAME=`echo $SECRET | jq -r '.username'`
PASSWORD=`echo $SECRET | jq -r '.password'`
DBNAME=`echo $SECRET | jq -r '.dbname'`
HOST=`echo $SECRET | jq -r '.host'`

If you create a database from a snapshot, make sure that your Secrets Manager secret and Amazon RDS snapshot are in the target Region. If you supply the secret for an existing database, make sure that the secret contains at least the following four key-value pairs (replace the <placeholder values> with your values):

{
    "password":"<your-password>",
    "dbname":"<your-database-name>",
    "host":"<your-hostname>",
    "username":"<your-username>"
}

The name for the secret must match the app value followed by the env value (both in title case), followed by DatabaseSecret, so for app=wp and env=dev, your secret name should be WpDevDatabaseSecret.

To deploy the stacks

The following commands deploy the stacks defined in the CDK app. To deploy them individually, use the specific stack names (these will vary according to the info that you supplied previously), as shown in the following.

cdk deploy wp-dev-network-stack -c app=wp -c env=dev
cdk deploy wp-dev-database-stack -c app=wp -c env=dev
cdk deploy wp-dev-compute-stack -c app=wp -c env=dev
cdk deploy wp-dev-cdn-stack -c app=wp -c env=dev

To create a database stack, deploy the network and database stacks first.

cdk deploy wp-dev-network-stack -c app=wp -c env=dev
cdk deploy wp-dev-database-stack -c app=wp -c env=dev

You can then initiate the deployment of the compute stack.

cdk deploy wp-dev-compute-stack -c app=wp -c env=dev

After the compute stack deploys, you can deploy the stack that creates the CloudFront distribution.

cdk deploy wp-dev-cdn-stack -c env=dev

This deploys the CloudFront infrastructure to the US East (N. Virginia) Region (us-east-1). CloudFront is a global AWS service, which means that you must create it in this Region. The other stacks are deployed to the Region that you specified in your configuration stanza.

To test the results

If your stacks deploy successfully, your site appears at one of the following URLs:

  • subdomain.hostedZone (if you specified a value for the subdomain) — for example, www.example.com
  • appName-env.hostedZone (if you didn’t specify a value for the subdomain) — for example, wp-dev.example.com.

If you connect through the IP address that you configured in the adminIps configuration, you should be connected to the admin instance for your site. Because the admin instance can modify the file system, you should use it to do your administrative tasks.

Users who connect to your site from an IP that isn’t in your allowedIps list will be connected to your fleet instances and won’t be able to alter the file system (for example, they won’t be able to install plugins or upload media).

If you need to redeploy the same app-env combination, manually remove the parameter store items and the replicated secret that you created in us-east-1. You should also delete the cdk.context.json file because it caches values that you will be replacing.

One project, multiple configurations

You can modify the configuration file in this project to deploy different applications to different environments using the same project. Each app can have different configurations for dev, test, or production environments.

Using this mechanism, you can deploy sites for test and production into different accounts or even different Regions. The solution uses CDK context variables as command-line switches to select different configuration stanzas from the configuration file.

CDK projects allow for multiple deployments to coexist in one account by using unique names for the deployed stacks, based on their configuration.

Check the configuration file into your source control repo so that you track changes made to it over time.

Got a different web app that you want to deploy? Create a new configuration by copying and pasting one of the examples and then modify the build commands as needed for your use case.

Conclusion

In this post, you learned how to build an architecture on AWS that implements multi-layered security. You can use different AWS services to provide protections to your application at different stages of the request lifecycle.

You can learn more about the services used in this sample project by building it in your own account. It’s a great way to explore how the different services work and the full features that are available. By understanding how these AWS services work, you will be ready to use them to add security, at multiple layers, in your own architectures.

 
If you have feedback about this post, submit comments in the Comments section below. If you have questions about this post, contact AWS Support.

Want more AWS Security news? Follow us on Twitter.

Guy Morton

Guy Morton

Guy is a Senior Solutions Architect at AWS. He enjoys bringing his decades of experience as a full stack developer, architect, and people manager to helping customers build and scale their applications securely in the AWS Cloud. Guy has a passion for automation in all its forms, and is also an occasional songwriter and musician who performs under the pseudonym Whtsqr.

Better debugging for Cloudflare Workers, now with breakpoints

Post Syndicated from Adam Murray original http://blog.cloudflare.com/debugging-cloudflare-workers/


Better debugging for Cloudflare Workers, now with breakpoints

As developers, we’ve all experienced times when our code doesn’t work like we expect it to. Whatever the root cause is, being able to quickly dive in, diagnose the problem, and ship a fix is invaluable.

If you’re developing with Cloudflare Workers, we provide many tools to help you debug your applications; from your local environment all the way into production. This additional insight helps save you time and resources and provides visibility into how your application actually works — which can help you optimize and refactor code even before it goes live.

In this post, we’ll explore some of the tools we currently offer, and do a deep dive into one specific area — breakpoint debugging — looking at not only how to use it, but how we recently implemented it in our runtime, workerd.

Available Debugging Tools

Logs

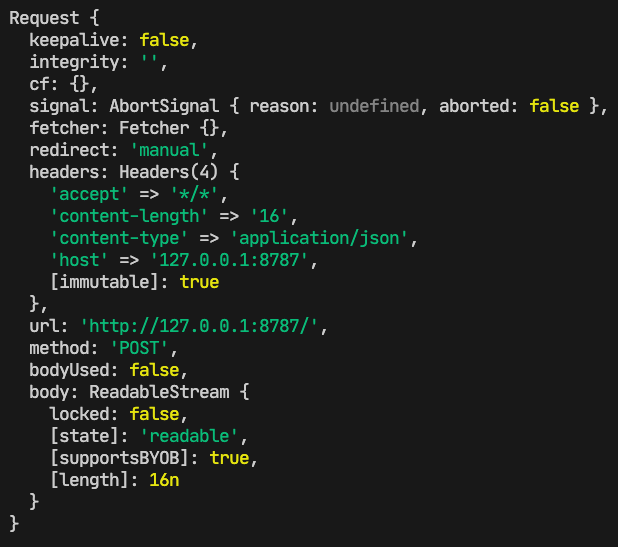
console.log. It might be the simplest tool for a developer to debug, but don’t underestimate it. Built into the Cloudflare runtime is node-like logging, which provides detailed, color-coded logs. Locally, you can view these logs in a terminal window, and they will look like this:

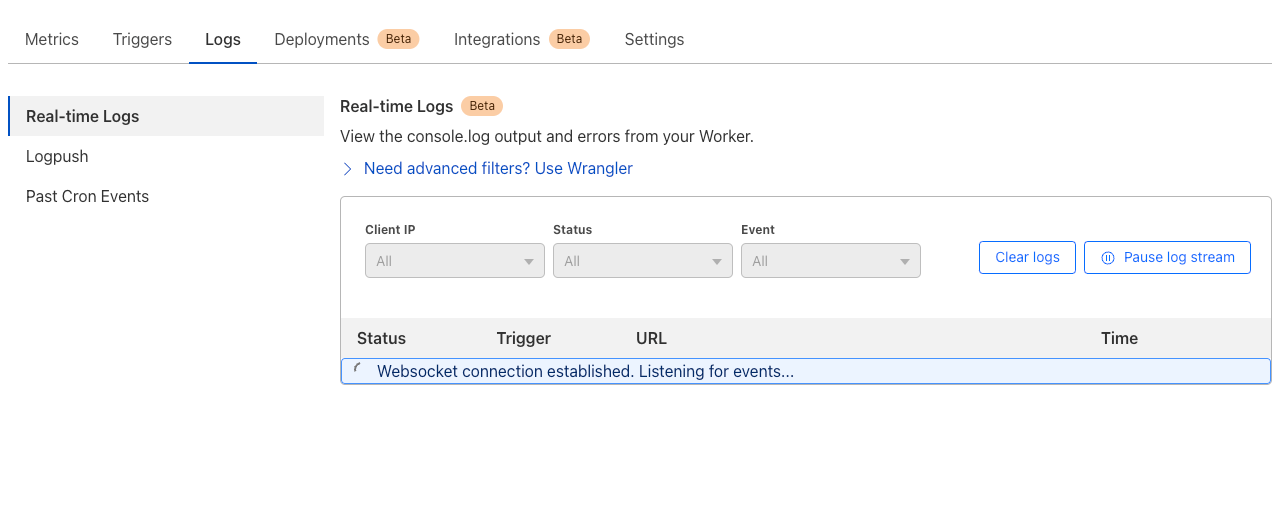
Outside local development, once your Worker is deployed, console.log statements are visible via the Real-time Logs interface in the Cloudflare Dashboard or via the Workers CLI tool, Wrangler, using the wrangler tail command. Each log that comes through wrangler tail is structured JSON, and the command has options to filter and search incoming logs to make results as relevant as possible.

If you’d like to send these logs to third-parties for processing and storage, you can leverage Workers Trace Events Logpush which supports a variety of destinations.

DevTools

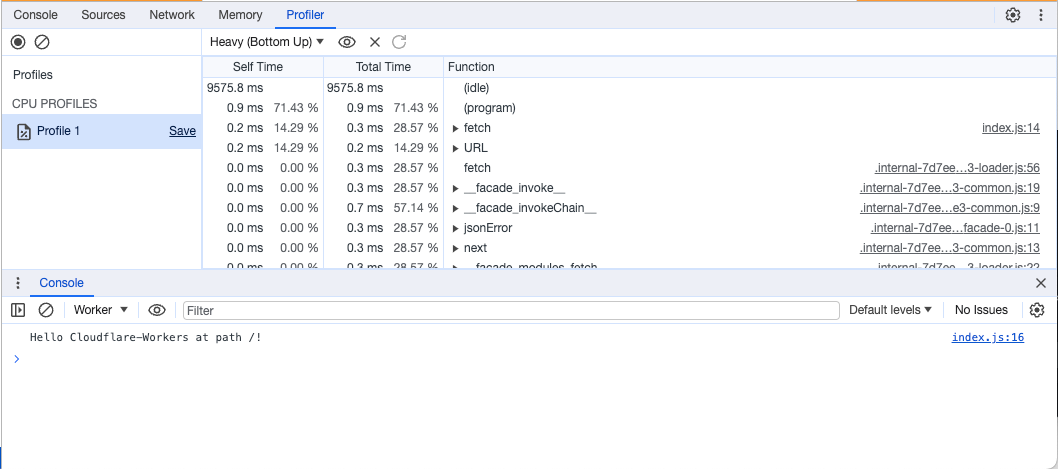
In addition to logging, you can also leverage our implementation of Chrome’s DevTools to do things like view and debug network requests, take memory heap snapshots, and monitor CPU usage.

This interactive tool provides even further insight and information about your Cloudflare Workers, and can be started from within Wrangler by running wrangler dev and pressing [d] once the dev server is spun up. It can also be accessed by the editor that is built into the Cloudflare Dashboard or the Workers Playground.

Breakpoints

Breakpoints allow developers to stop code execution at specific points (lines) to evaluate what is happening. This is great for situations where you might have a race condition or times when you don’t know exactly what is happening, and your code isn’t behaving as expected. Breakpoints allow you to walk through your code line by line to see how it behaves.

You can get started with breakpoint debugging from within the Wrangler CLI by running wrangler dev and pressing [d] to open up a DevTools debugger session. If you prefer to debug via your IDE, we support VSCode and WebStorm.

Setting up VSCode
To set up VSCode to debug Cloudflare Workers with breakpoints, you’ll need to create a new .vscode/launch.json file with the following content:

{
  "configurations": [
    {
  "name": "Wrangler",
  "type": "node",
  "request": "attach",
  "port": 9229,
  "cwd": "/",
  "resolveSourceMapLocations": null,
  "attachExistingChildren": false,
  "autoAttachChildProcesses": false
    }
  ]
}

Once you’ve created this configuration in launch.json, open your project in VSCode. Open a new terminal window from VSCode, and run npx wrangler dev to start a local dev server.

At the top of the Run & Debug panel, you should see an option to select a configuration. Choose Wrangler, and select the play icon. You should see Wrangler: Remote Process [0] show up in the Call Stack panel on the left. Go back to a .js or .ts file in your project and add at least one breakpoint.

Open your browser and go to the Worker’s local URL (default http://127.0.0.1:8787). The breakpoint should be hit, and you should see details about your code at the specified line.

Setting up WebStorm
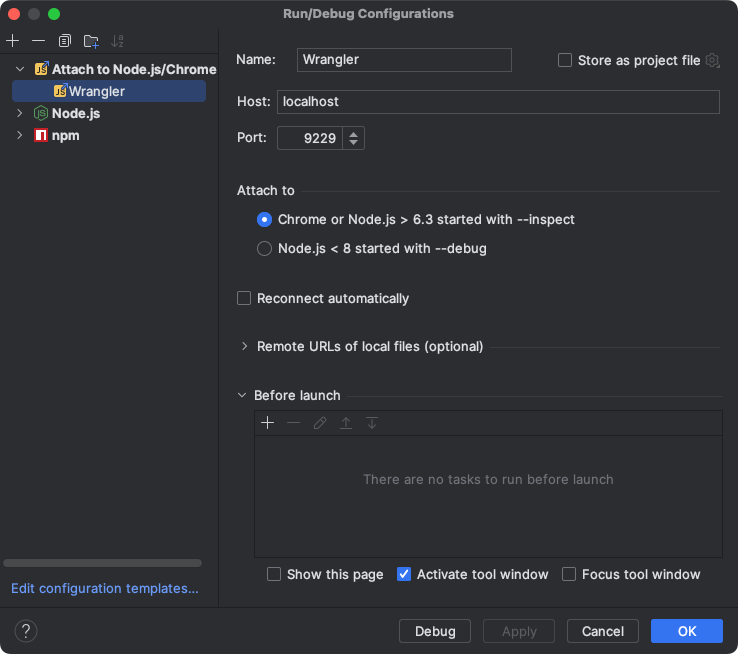
To set up WebStorm with breakpoint debugging, create a new “Attach to Node.js/Chrome” Debug Configuration, setting the port to 9229:

Run npx wrangler dev to start a local dev server, then start the Debug Configuration:

Add a breakpoint, then open your browser and go to the Worker’s local URL (default http://127.0.0.1:8787). The breakpoint should be hit, and you should see details about your code at the specified line.

How we enabled breakpoint debugging via workerd

Both workerd and Cloudflare Workers embed V8 to run workers code written in JavaScript and WASM. V8 is a component of the world’s most widely used web browser today, Google Chrome, and it is also widely used embedded into open source projects like Node.js.

The Google Chrome team has created a set of web developer tools, Chrome DevTools, that are built directly into the browser. These provide a wide range of features for inspecting, debugging, editing, and optimizing web pages. Chrome DevTools are exposed through a UI in Chrome that talks to the components of the browser, such as V8, using the Chrome DevTools Protocol (CDP). The protocol uses JSON-RPC transmitted over a websocket to exchange messages and notifications between clients, like the DevTools UI, and the components of Chrome. Within Chrome Devtools protocols are domains (DOM, Debugger, Media) that group related commands by functionality that can be implemented by different components in Chrome.

V8 supports the following CDP domains:

  • Runtime
  • Debugger
  • Profiler
  • HeapProfiler

These domains are available to all projects that embed V8, including workerd, so long as the embedding application is able to route messages between a DevTools client and V8. DevTools clients use the Debugger domain to implement debugging functionality. The Debugger domain exposes all the commands to debug an application, such as setting breakpoints. It also sends debugger events, like hitting a breakpoint, up to DevTools clients, so they can present the state of the script in a debugger UI.

While workerd has supported CDP since its first release, support for the Debugger domain is new. The Debugger domain differs from the other domains exposed by V8 because it requires the ability to suspend the execution of a script whilst it is being debugged. This presents a complication for introducing breakpoint debugging in workerd, because workerd runs each Worker in a V8 isolate in which there is just a single thread that receives incoming requests and runs the scripts associated with them.

Why is this a problem? Workerd uses an event-driven programming model and its single thread is responsible for both responding to incoming requests and for running JavaScript / WASM code. In practice, this is implemented via an event loop that sits at the bottom of the call stack that sends and receives network messages and calls event handlers that run JavaScript code. The thread needs to fall back into the event loop after running event handlers to be able to process network messages. However, the V8 API for handling breakpoints expects execution to be suspended within a method implemented by the embedder that is called from V8 when a breakpoint is hit. This method is called from the event handler that is running JavaScript in V8. Unfortunately, this prevents the workerd thread from falling back into the event loop and processing any incoming network events, including all CDP commands relating to debugging. So if a client asks to resume execution by sending a CDP command, it cannot be relayed to the executing thread because it is unable to fall into the eventloop whilst in a breakpoint.

We solved this event processing problem by adding an I/O thread to workerd. The I/O thread handles sending and receiving CDP messages, because the thread executing JavaScript can be suspended due to hitting a breakpoint or a JavaScript `debugger` statement. The I/O thread wakes the JavaScript thread when CDP commands arrive and also handles sending responses back to the CDP client. Conceptually, this was not difficult, but it required some careful synchronization to avoid dropped messages.

Use the Source

When debugging, JavaScript developers expect to see their source code in the debugger. For this to work, the embedded V8 needs to be able to locate sources. It is common for JavaScript code to be generated either by combining and minifying multiple JavaScript sources, or by transpiling to JavaScript from another language, such as TypeScript, Dart, CoffeeScript, or Elm. To render the source code in the debugger in its original form, the embedded V8 needs to know 1) where the source code came from and 2) how any given line of JavaScript visible to V8 maps back to the original sources before any transformation of the original sources was applied. The standard solution to this problem is to embed a source map into the JavaScript code that JavaScript engine runs. The embedding is performed through a special comment in the JavaScript running in the JavaScript engine:

//# sourceMappingURL=generated.js.map

This source map’s URL is resolved relative to the source URL. This can be set when instantiating a source file with the V8 API, or via another special comment:

//# sourceURL=file:///absolute/path/to/generated.js

An example source map looks something like this:

{
  "version": 3,
  "sources": ["../src/index.ts"],
  "sourcesContent": ["interface Env { ... }\n\nexport default ..."],
  "mappings": ";AAIA,IAAO,mBAA8B;AAAA,EACjC,MAAM,MAAM,SAAS,KAAK,KAAK;...",
  "names": []
}

Each of the relative paths in sources are resolved relative to the source map’s fully-qualified URL. When DevTools connects to V8 and enables the Debugger domain, V8 will send information on all parsed scripts including the source map’s fully-qualified URL. In our example, this would be file:///absolute/path/to/generated.js.map. DevTools needs to fetch this URL along with source URLs to perform source mapping. Unfortunately, our patched version of DevTools is hosted at https://devtools.devprod.cloudflare.dev/, and browsers prohibit fetching file:// URLs from non-file:// origins for security reasons. However, we need to use file:// URLs so IDEs like Visual Studio Code can match up source files from source maps to files on disk. To get around this, we used Wrangler’s inspector proxy to rewrite the CDP script parsed messages sent by V8 to use a different protocol if the User-Agent of the inspector WebSocket handshake is a browser.

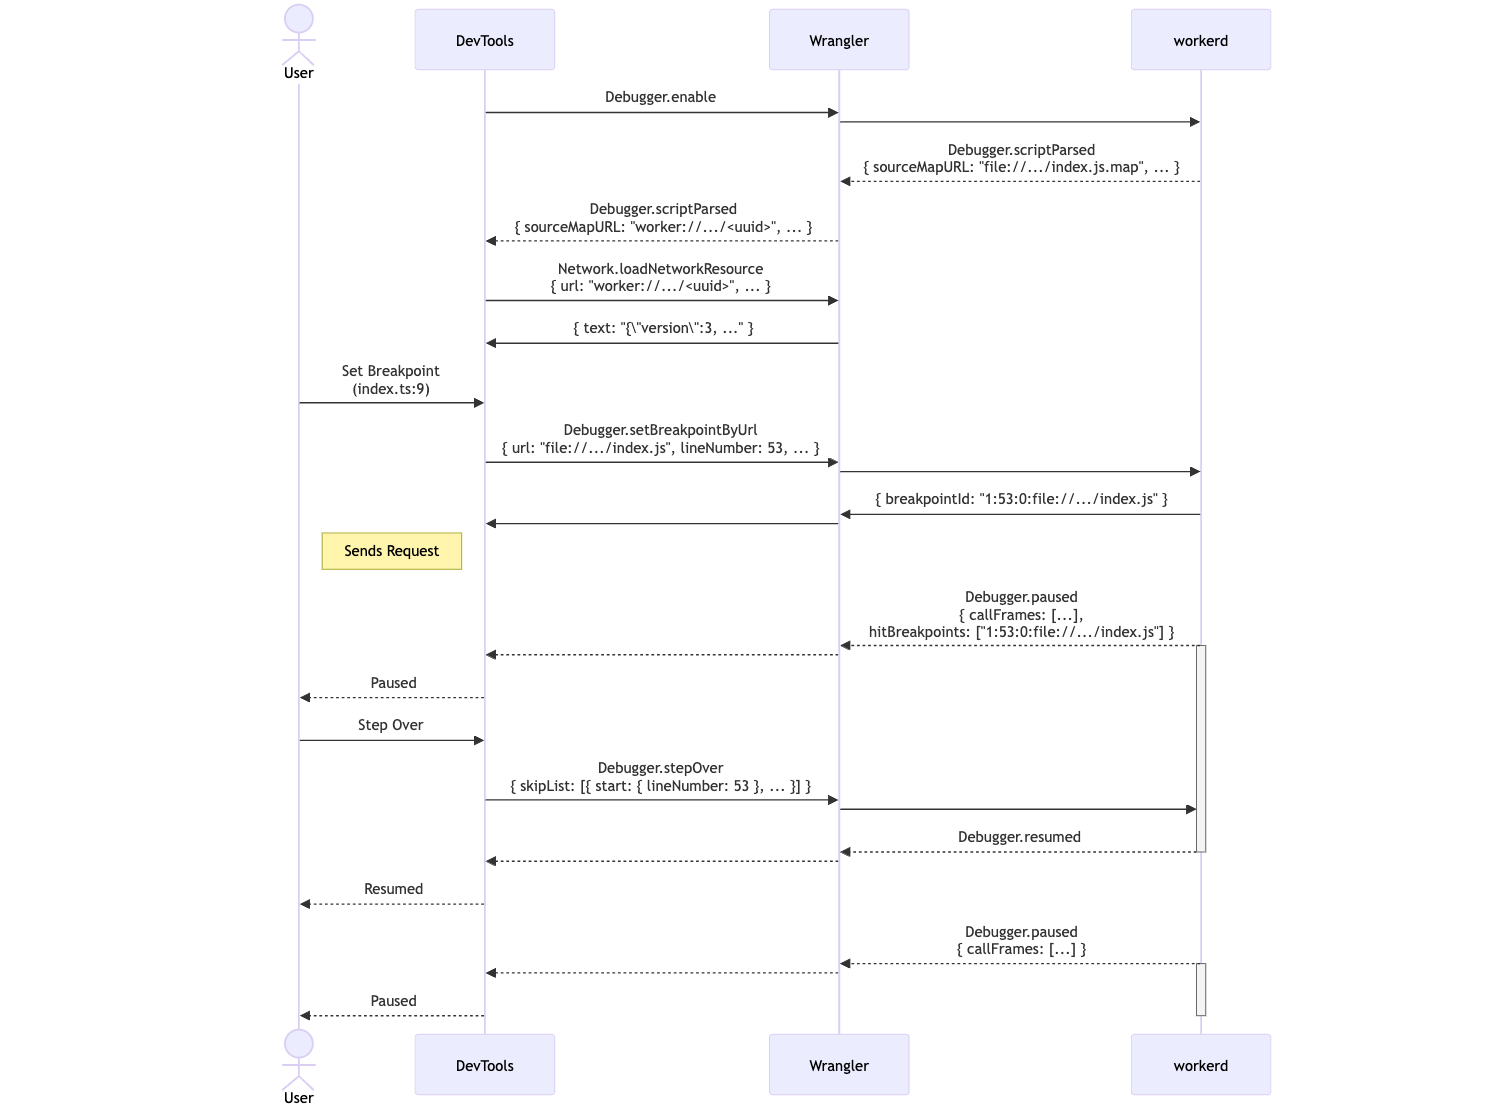
Now that we can set breakpoints and fetch source maps, DevTools works as normal. When a user tries to set a breakpoint in an original source file, DevTools will use the map’s mappings to find the location in the generated JavaScript file and set a breakpoint there. This is the opposite problem to source mapping error stack traces. When V8 hits this JavaScript breakpoint, DevTools will pause on the location in the original source file. Stepping through the source file requires mapping the stepped-over segment to generated code, sending the step-over command to V8, then mapping back the new paused location in generated code to the original source file.

(sequence diagram showing process of setting, hitting, and stepping over breakpoints) (mermaid URL)

Future Work

Both the Visual Studio Code and WebStorm configurations for breakpoint debugging require attaching to an existing dev server. It would be great if your IDE could launch the dev server too, and automatically attach to it.

When you debug a Node.js program in Visual Studio Code or WebStorm, an additional --require hook is added to the NODE_OPTIONS environment variable. This hook registers the process’s inspector URL with the editor over a well-known socket. This means if your Node.js process spawns another Node.js child process, your editor will debug that child process too. This is how Visual Studio Code’s JavaScript Debug Terminal works, and is how editors can debug Node.js processes started by npm scripts.

Our plan is to detect this --require hook, and register workerd child processes started by Wrangler and Miniflare. This will mean you can debug npm launch tasks, without having to worry about starting the dev server and then attaching to it.

Start debugging!

All the debugging tools listed above are ready to be used today. Logs and DevTools can be accessed either by logging into the Cloudflare dashboard or by downloading Wrangler, the command-line tool for the Cloudflare Developer Platform. Breakpoint debugging and Node-style logging is built into the latest version of Wrangler, and can be accessed by running npx wrangler@latest dev in a terminal window. Let us know what you think in the #wrangler channel on the Cloudflare Developers Discord, and please open a GitHub issue if you hit any unexpected behavior.

What’s Up, Home? – Monitor your ad blocker with Zabbix

Post Syndicated from Janne Pikkarainen original https://blog.zabbix.com/whats-up-home-monitor-your-ad-blocker-with-zabbix/26912/

Can you monitor your ad blocker with Zabbix? Of course, you can!

API defines it all

My home Asus router is running on Asuswrt-Merlin firmware, and with that, I have AdGuard Home ad blocker.

As AdGuard Home has an API, monitoring it with Zabbix is trivial.

Communicate with the API

Communicating with AdGuard Home API is easy: pass it Authorisation: Basic XXXXXXXXXXXX header, where XXXXXXXXXX is just a Base64 hash of your AdGuard username and password. You can generate that Base64 snippet with for example

echo -n "myuser:mypassword" | base64

Next, in Zabbix, create a new HTTP Agent type item, and point it to your AdGuard Home instance.

Create some items

You’ll get the info back as JSON, so next you can create some dependent items and start monitoring. I only added

  • Total number of DNS requests
  • Blocked # of DNS requests
  • Redirects to safe search
  • Parental advisory stuff
  • Average request processing time

For the dependent items, you’ll then just do some JSONPath processing.

Add triggers

Next, I added a few triggers to alert me if AdGuard starts to run slower than usual.

Add service

Finally, I added AdGuard as a new business service, so I’ll get an SLA for it.

And that’s it! From now on I’ll know more about how well my home router ad-blocker is working. (Well, it also has a Skynet firewall which probably filters stuff before AdGuard Home, but that’s another story….)

This post was originally published on the author’s page.

The post What’s Up, Home? – Monitor your ad blocker with Zabbix appeared first on Zabbix Blog.

Improve performance of workloads containing repetitive scan filters with multidimensional data layout sort keys in Amazon Redshift

Post Syndicated from Yanzhu Ji original https://aws.amazon.com/blogs/big-data/improve-performance-of-workloads-containing-repetitive-scan-filters-with-multidimensional-data-layout-sort-keys-in-amazon-redshift/

Amazon Redshift, the most widely used cloud data warehouse, has evolved significantly to meet the performance requirements of the most demanding workloads. This post covers one such new feature—the multidimensional data layout sort key.

Amazon Redshift now improves your query performance by supporting multidimensional data layout sort keys, which is a new type of sort key that sorts a table’s data by filter predicates instead of physical columns of the table. Multidimensional data layout sort keys will significantly improve the performance of table scans, especially when your query workload contains repetitive scan filters.

Amazon Redshift already provides the capability of automatic table optimization (ATO), which automatically optimizes the design of tables by applying sort and distribution keys without the need for administrator intervention. In this post, we introduce multidimensional data layout sort keys as an additional capability offered by ATO and fortified by Amazon Redshift’s sort key advisor algorithm.

Multidimensional data layout sort keys

When you define a table with the AUTO sort key, Amazon Redshift ATO will analyze your query history and automatically select either a single-column sort key or multidimensional data layout sort key for your table, based on which option is better for your workload. When multidimensional data layout is selected, Amazon Redshift will construct a multidimensional sort function that co-locates rows that are typically accessed by the same queries, and the sort function is subsequently used during query runs to skip data blocks and even skip scanning the individual predicate columns.

Consider the following user query, which is a dominant query pattern in the user’s workload:

SELECT season, sum(metric2) AS "__measure__0"
FROM titles
WHERE lower(subregion) like '%United States%'
GROUP BY 1
ORDER BY 1;

Amazon Redshift stores data for each column in 1 MB disk blocks and stores the minimum and maximum values in each block as part of the table’s metadata. If a query uses a range-restricted predicate, Amazon Redshift can use the minimum and maximum values to rapidly skip over large numbers of blocks during table scans. However, this query’s filter on the subregion column can’t be used to determine which blocks to skip based on minimum and maximum values, and as a result, Amazon Redshift scans all rows from the titles table:

SELECT table_name, input_rows, step_attribute
FROM sys_query_detail
WHERE query_id = 123456789;

When the user’s query was run with titles using a single-column sort key on subregion, the result of the preceding query is as follows:

  table_name | input_rows | step_attribute
-------------+------------+---------------
  titles     | 2164081640 | 
(1 rows)

This shows that the table scan read 2,164,081,640 rows.

To improve scans on the titles table, Amazon Redshift might automatically decide to use a multidimensional data layout sort key. All rows that satisfy the lower(subregion) like '%United States%' predicate would be co-located to a dedicated region of the table, and therefore Amazon Redshift will only scan data blocks that satisfy the predicate.

When the user’s query is run with titles using a multidimensional data layout sort key that includes lower(subregion) like '%United States%' as a predicate, the result of the sys_query_detail query is as follows:

  table_name | input_rows | step_attribute
-------------+------------+---------------
  titles     | 152324046  | multi-dimensional
(1 rows)

This shows that the table scan read 152,324,046 rows, which is only 7% of the original, and it used the multidimensional data layout sort key.

Note that this example uses a single query to showcase the multidimensional data layout feature, but Amazon Redshift will consider all the queries running against the table and can create multiple regions to satisfy the most commonly run predicates.

Let’s take another example, with more complex predicates and multiple queries this time.

Imagine having a table items (cost int, available int, demand int) with four rows as shown in the following example.

#id cost available demand
1 4 3 3
2 2 23 6
3 5 4 5
4 1 1 2

Your dominant workload consists of two queries:

  • 70% queries pattern:
    select * from items where cost > 3 and available < demand

  • 20% queries pattern:
    select avg(cost) from items where available < demand

With traditional sorting techniques, you might choose to sort the table over the cost column, such that the evaluation of cost > 3 will benefit from the sort. So, the items table after sorting using a single cost column will look like the following.

#id cost available demand
Region #1, with cost <= 3
Region #2, with cost > 3
#id cost available demand
4 1 1 2
2 2 23 6
1 4 3 3
3 5 4 5

By using this traditional sort, we can immediately exclude the top two (blue) rows with ID 4 and ID 2, because they don’t satisfy cost > 3.

On the other hand, with a multidimensional data layout sort key, the table will be sorted based on a combination of the two commonly occurring predicates in the user’s workload, which are cost > 3 and available < demand. As a result, the table’s rows are sorted into four regions.

#id cost available demand
Region #1, with cost <= 3 and available < demand
Region #2, with cost <= 3 and available >= demand
Region #3, with cost > 3 and available < demand
Region #4, with cost > 3 and available >= demand
#id cost available demand
4 1 1 2
2 2 23 6
3 5 4 5
1 4 3 3

This concept is even more powerful when applied to entire blocks instead of single rows, when applied to complex predicates that use operators not suitable for traditional sorting techniques (such as like), and when applied to more than two predicates.

System tables

The following Amazon Redshift system tables will show users if multidimensional data layouts are used on their tables and queries:

  • To determine if a particular table is using a multidimensional data layout sort key, you can check whether sortkey1 in svv_table_info is equal to AUTO(SORTKEY(padb_internal_mddl_key_col)).
  • To determine if a particular query uses multidimensional data layout to accelerate table scans, you can check step_attribute in the sys_query_detail view. The value will be equal to multi-dimensional if the table’s multidimensional data layout sort key was used during the scan.

Performance benchmarks

We performed internal benchmark testing for multiple workloads with repetitive scan filters and see that introducing multidimensional data layout sort keys produced the following results:

  • A 74% total runtime reduction compared to having no sort key.
  • A 40% total runtime reduction compared to having the best single-column sort key on each table.
  • A 80% reduction in total rows read from tables compared to having no sort key.
  • A 47% reduction in total rows read from tables compared to having the best single-column sort key on each table.

Feature comparison

With the introduction of multidimensional data layout sort keys, your tables can now be sorted by expressions based off of the commonly occurring filter predicates in your workload. The following table provides a feature comparison for Amazon Redshift against two competitors.

Feature Amazon Redshift Competitor A Competitor B
Support for sorting on columns Yes Yes Yes
Support for sorting by expression Yes Yes No
Automatic column selection for sorting Yes No Yes
Automatic expressions selection for sorting Yes No No
Automatic selection between columns sorting or expressions sorting Yes No No
Automatic use of sorting properties for expressions during scans Yes No No

Considerations

Keep in mind the following when using a multidimensional data layout:

  • Multidimensional data layout is enabled when you set your table as SORTKEY AUTO.
  • Amazon Redshift Advisor will automatically choose either a single-column sort key or multidimensional data layout for the table by analyzing your historical workload.
  • Amazon Redshift ATO adjusts the multidimensional data layout sorting results based on the manner in which ongoing queries interact with the workload.
  • Amazon Redshift ATO maintains multidimensional data layout sort keys the same way as it currently does for existing sort keys. Refer to Working with automatic table optimization for more details on ATO.
  • Multidimensional data layout sort keys will work with both provisioned clusters and serverless workgroups.
  • Multidimensional data layout sort keys will work with your existing data as long as the AUTO SORTKEY is enabled on your table and a workload with repetitive scan filters is detected. The table will be reorganized based on the results of multi-dimensional sort function.
  • To disable multidimensional data layout sort keys for a table, use alter table: ALTER TABLE table_name ALTER SORTKEY NONE. This disables the AUTO sort key feature on the table.
  • Multidimensional data layout sort keys are preserved when restoring or migrating your provisioned cluster to a serverless cluster or vice versa.

Conclusion

In this post, we showed that multidimensional data layout sort keys can significantly improve query runtime performance for workloads where dominant queries have repetitive scan filters.

To create a preview cluster from the Amazon Redshift console, navigate to the Clusters page and choose Create preview cluster. You can create a cluster in the US East (Ohio), US East (N. Virginia), US West (Oregon), Asia Pacific (Tokyo), Europe (Ireland), and Europe (Stockholm) Regions and test your workloads.

We would love to hear your feedback on this new feature and look forward to your comments on this post.


About the authors

Yanzhu Ji is a Product Manager in the Amazon Redshift team. She has experience in product vision and strategy in industry-leading data products and platforms. She has outstanding skill in building substantial software products using web development, system design, database, and distributed programming techniques. In her personal life, Yanzhu likes painting, photography, and playing tennis.

Milind Oke is a Data Warehouse Specialist Solutions Architect based out of New York. He has been building data warehouse solutions for over 15 years and specializes in Amazon Redshift.

Jialin Ding is an Applied Scientist in the Learned Systems Group, specializing in applying machine learning and optimization techniques to improve the performance of data systems such as Amazon Redshift.

Reserve quantum computers, get guidance and cutting-edge capabilities with Amazon Braket Direct

Post Syndicated from Channy Yun original https://aws.amazon.com/blogs/aws/reserve-quantum-computers-get-expertise-and-cutting-edge-capabilities-with-amazon-braket-direct/

Today, we are announcing the availability of Braket Direct, a new Amazon Braket program that helps quantum researchers dive deeper into quantum computing. This program lets you get dedicated, private access to the full capacity of various quantum processing units (QPUs) without any queues or wait times, connect with quantum computing specialists to receive expert guidance for your workloads, and get early access to features and devices with limited availability to conduct cutting-edge research on today’s noisy quantum devices.

Since its launch in 2020, Amazon Braket has democratized access to quantum computing by offering on-demand access to various QPUs using shared, public availability windows, where you only pay for the duration of your reservation.

You can now use Braket Direct to reserve the entire dedicated machine for a period of time on IonQ Aria, QuEra Aquila, and Rigetti Aspen-M-3 devices for running your most complex, long-running, time-sensitive workloads, or conducting live events such as training workshops and hackathons, where you pay only for what you reserve.

To further your research, you can now engage directly with Braket’s experts through free office hours or one-on-one, hands-on reservation prep sessions. For deeper research collaborations, you can connect with specialists from quantum hardware providers such as IonQ, Oxford Quantum Circuits, QuEra, Rigetti, or Amazon Quantum Solutions Lab, our dedicated professional services team.

Finally, to truly push the boundaries, you can gain access to experimental capabilities that have limited or reduced availability starting with IonQ’s highest fidelity, 30-qubit Forte device.

Braket Direct expands on our commitment to accelerate research and innovation in quantum computing without requiring any upfront fees or long-term commitments.

Getting started with Braket Direct
To get started, go to the Amazon Braket console and choose Braket Direct in the left pane. You can see new features such as quantum hardware reservation, expert advice and get access to next-generation quantum hardware and features.

1. Request a quantum hardware reservation
To create a reservation, choose Reserve device and select the Device that you would like to reserve. Provide your contact information, including your name and email address, any details about the workload that you would like to execute using your reservation, such as desired reservation length, relevant constraints, and desired schedule.

Braket Direct assures that you have the full capacity of the QPU during your reservation and the predictability that your workloads will execute when your reservation begins.

If you are interested in connecting with a Braket expert for a one-on-one reservation prep session after your reservation is confirmed, you can select that option at no additional cost.

Choose Submit to complete your reservation request. A Braket team member will email you within 2–3 business days, pending request verification. To make the most of your reservation, you can choose to pre-create your tasks and jobs prior to a reservation to maximize use of the time.

To learn more about your quantum tasks and hybrid jobs to execute in a device reservation, see Get started with Braket Direct in the AWS documentation.

2. Get support from quantum computing experts
You can get in touch with quantum experts and get advice about your workload. With Braket office hours, Braket experts can help you go from ideation to execution faster at no additional cost. Explore your device to fit your use case, identify options to make best use of Braket for your algorithm, and get recommendations on how to use certain Braket features like Hybrid Jobs, Braket Pulse, or Analog Hamiltonian Simulation.

To book an upcoming Braket office hours slot, choose Sign up and fill out your contact information, workload details, and any desired discussion topics. You will receive a calendar invitation to the next available slot by email.

To take advantage of experts from quantum hardware providers, choose Connect and browse their professional services listings on AWS Marketplace.

The Amazon Quantum Solutions Lab is a collaborative research and professional services team staffed with quantum computing experts who can assist you in more effectively exploring quantum computing, engaging in quantum research, and assessing the current performance of this technology. To contact the Quantum Solutions Lab, select Connect and fill out contact information and use case details. The team will email you with next steps.

3. Access to cutting-edge capabilities
To move your research quicker, you can get early access to innovative new capabilities. With Braket Direct, you can easily request access to cutting-edge capabilities, such as new quantum devices with limited availability, directly in the Braket console. Today, you can get reservation-only access to IonQ’s highest-fidelity Forte QPU. Due to its limited availability, this device is currently only available through Braket Direct reservations.

Now available
Braket Direct is now generally available in all AWS Regions where Amazon Braket is available. To learn more, see the Braket Direct page and pricing page.

Give it a try and send feedback to AWS re:Post for Amazon Braket, Quantum Computing Stack Exchange, or through your usual AWS Support contacts.

— Channy

AWS Step Functions Workflow Studio is now available in AWS Application Composer

Post Syndicated from Donnie Prakoso original https://aws.amazon.com/blogs/aws/aws-step-functions-workflow-studio-is-now-available-in-aws-application-composer/

Today, we’re announcing that AWS Step Functions Workflow Studio is now available in AWS Application Composer. This new integration brings together the development of workflows and application resources into a unified visual infrastructure as code (IaC) builder.

Now, you can have a seamless transition between authoring workflows with AWS Step Functions Workflow Studio and defining resources with AWS Application Composer. This announcement allows you to create and manage all resources at any stage of your development journey. You can visualize the full application in AWS Application Composer, then zoom into the workflow details with AWS Step Functions Workflow Studio—all within a single interface.

Seamlessly build workflow and modern application
To help you design and build modern applications, we launched AWS Application Composer in March 2023. With AWS Application Composer, you can use a visual builder to compose and configure serverless applications from AWS services backed by deployment-ready IaC.

In various use cases of building modern applications, you may also need to orchestrate microservices, automate mission-critical business processes, create event-driven applications that respond to infrastructure changes, or build machine learning (ML) pipelines. To solve these challenges, you can use AWS Step Functions, a fully managed service that makes it easier to coordinate distributed application components using visual workflows. To simplify workflow development, in 2021 we introduced AWS Step Functions Workflow Studio, a low-code visual tool for rapid workflow prototyping and development across 12,000+ API actions from over 220 AWS services.

While AWS Step Functions Workflow Studio brings simplicity to building workflows, customers that want to deploy workflows using IaC had to manually define their state machine resource and migrate their workflow definitions to the IaC template.

Better together: AWS Step Functions Workflow Studio in AWS Application Composer
With this new integration, you can now design AWS Step Functions workflows in AWS Application Composer using a drag-and-drop interface. This accelerates the path from prototyping to production deployment and iterating on existing workflows.

You can start by composing your modern application with AWS Application Composer. Within the canvas, you can add a workflow by adding an AWS Step Functions state machine resource. This new capability provides you with the ability to visually design and build a workflow with an intuitive interface to connect workflow steps to resources.

How it works
Let me walk you through how you can use AWS Step Functions Workflow Studio in AWS Application Composer. For this demo, let’s say that I need to improve handling e-commerce transactions by building a workflow and integrating with my existing serverless APIs.

First, I navigate to AWS Application Composer. Because I already have an existing project that includes application code and IaC templates from AWS Application Composer, I don’t need to build anything from scratch.

I open the menu and select Project folder to open the files in my local development machine.

Then, I select the path of my local folder, and AWS Application Composer automatically detects the IaC template that I currently have.

Then, AWS Application Composer visualizes the diagram in the canvas. What I really like about using this approach is that AWS Application Composer activates Local sync mode, which automatically syncs and saves any changes in IaC templates into my local project.

Here, I have a simple serverless API running on Amazon API Gateway, which invokes an AWS Lambda function and integrates with Amazon DynamoDB.

Now, I’m ready to make some changes to my serverless API. I configure another route on Amazon API Gateway and add AWS Step Functions state machine to start building my workflow.

When I configure my Step Functions state machine, I can start editing my workflow by selecting Edit in Workflow Studio.

This opens Step Functions Workflow Studio within the AWS Application Composer canvas. I have the same experience as Workflow Studio in the AWS Step Functions console. I can use the canvas to add actions, flows , and patterns into my Step Functions state machine.

I start building my workflow, and here’s the result that I exported using Export PNG image in Workflow Studio.

But here’s where this new capability really helps me as a developer. In the workflow definition, I use various AWS resources, such as AWS Lambda functions and Amazon DynamoDB. If I need to reference the AWS resources I defined in AWS Application Composer, I can use an AWS CloudFormation substitution.

With AWS CloudFormation substitutions, I can add a substitution using an AWS CloudFormation convention, which is a dynamic reference to a value that is provided in the IaC template. I am using a placeholder substitution here so I can map it with an AWS resource in the AWS Application Composer canvas in a later step.

I can also define the AWS CloudFormation substitution for my Amazon DynamoDB table.

At this stage, I’m happy with my workflow. To review the Amazon States Language as my AWS Step Functions state machine definition, I can also open the Code tab. Now I don’t need to manually copy and paste this definition into IaC templates. I only need to save my work and choose Return to Application Composer.

Here, I can see that my AWS Step Functions state machine is updated both in the visual diagram and in the state machine definition section.

If I scroll down, I will find AWS Cloudformation Definition Substitutions for resources that I defined in Workflow Studio. I can manually replace the mapping here, or I can use the canvas.

To use the canvas, I simply drag and drop the respective resources in my Step Functions state machine and in the Application Composer canvas. Here, I connect the Inventory Process task state with a new AWS Lambda function. Also, my Step Functions state machine tasks can reference existing resources.

When I choose Template, the state machine definition is integrated with other AWS Application Composer resources. With this IaC template I can easily deploy using AWS Serverless Application Model Command Line Interface (AWS SAM CLI) or CloudFormation.

Things to know
Here is some additional information for you:

Pricing – The AWS Step Functions Workflow Studio in AWS Application Composer comes at no additional cost.

Availability – This feature is available in all AWS Regions where Application Composer is available.

AWS Step Functions Workflow Studio in AWS Application Composer provides you with an easy-to-use experience to integrate your workflow into modern applications. Get started and learn more about this feature on the AWS Application Composer page.

Happy building!
— Donnie

Amazon CodeCatalyst introduces custom blueprints and a new enterprise tier

Post Syndicated from Irshad Buchh original https://aws.amazon.com/blogs/aws/amazon-codecatalyst-introduces-custom-blueprints-and-a-new-enterprise-tier/

Today, I’m excited to introduce the new Amazon CodeCatalyst enterprise tier and custom blueprints.

Amazon CodeCatalyst enterprise tier is a new pricing tier that offers features like custom blueprints and project lifecycle management. The enterprise tier is $20/user per month, and each enterprise tier space gets 1,500 compute minutes, 160 Dev Environment hours, and 64GB of Dev Environment storage per paying user. You can use custom blueprints to define best practices for your application code, workflows, and infrastructure. You can publish these blueprints to your CodeCatalyst space, utilizing them for project creation or applying standards to existing projects.

Blueprints help you set up projects in minutes so you can get to work on code immediately. With just a few clicks, you can set up project files and configure built-in, fully integrated tools (for example, source repository, issue management, and continuous integration and delivery (CI/CD) pipeline) with best practices for your particular type of project. You can swap in popular tools like GitHub if needed, while maintaining the unified experience. You spend less time on building, integrating, or operating developer tools over the project’s lifetime.

With custom blueprints, you can define various elements of your CodeCatalyst project, like workflow definitions, infrastructure as code (IaC), and application code. When custom blueprints are updated, those changes are reflected in any project using the blueprint as a pull request update. This streamlined process reduces overhead in setting up your projects and ensures that best practices are consistently applied across your projects. As an admin, you can easily view details about which projects are using each blueprint in your CodeCatalyst space, giving you visibility into how standards are being applied across your projects.

Creating a custom blueprint in CodeCatalyst
I open the CodeCatalyst console and then I navigate to my space. On the Settings tab, I choose Blueprints on the left navigation pane, and then I select Create blueprint. At this point, I codify my best practices in this blueprint. When ready, I’ll publish it back to my space so my teams can use it to create projects.

create-blueprint

After I publish my blueprint, I can view and manage it in my CodeCatalyst space in the Settings tab. In the left panel, I choose Blueprints. Then I select Space blueprints.

manage-blueprint

I select Create project > Space blueprints to create a CodeCatalyst project from my custom blueprint.

create-project

Availability

The Amazon CodeCatalyst enterprise tier is available in US West (Oregon) and Europe (Ireland) Regions, but you can deploy to any commercial Region. To learn more, visit the Amazon CodeCatalyst webpage.

Go build!

— Irshad

Amazon ElastiCache Serverless for Redis and Memcached is now available

Post Syndicated from Channy Yun original https://aws.amazon.com/blogs/aws/amazon-elasticache-serverless-for-redis-and-memcached-now-generally-available/

Today, we are announcing the availability of Amazon ElastiCache Serverless, a new serverless option that allows customers to create a cache in under a minute and instantly scale capacity based on application traffic patterns. ElastiCache Serverless is compatible with two popular open-source caching solutions, Redis and Memcached.

You can use ElastiCache Serverless to operate a cache for even the most demanding workloads without spending time in capacity planning or requiring caching expertise. ElastiCache Serverless constantly monitors your application’s memory, CPU, and network resource utilization and scales instantly to accommodate changes to the access patterns of workloads it serves. You can create a highly available cache with data automatically replicated across multiple Availability Zones and up to 99.99 percent availability Service Level Agreement (SLA) for all workloads, which saves you time and money.

Customers wanted to get radical simplicity to deploy and operate a cache. ElastiCache Serverless offers a simple endpoint experience abstracting the underlying cluster topology and cache infrastructure. You can reduce application complexity and have more operational excellence without handling reconnects and rediscovering nodes.

With ElastiCache Serverless, there are no upfront costs, and you pay for only the resources you use. You pay for the amount of cache data storage and ElastiCache Processing Units (ECPUs) resources consumed by your applications.

Getting started with Amazon ElastiCache Serverless
To get started, go to the ElastiCache console and choose Redis caches or Memcached caches in the left navigation pane. ElastiCache Serverless supports engine versions of Redis 7.1 or higher and Memcached 1.6 or higher.

For example, in the case of Redis caches, choose Create Redis cache.

You see two deployment options: either Serverless or Design your own cache to create a node-based cache cluster. Choose the Serverless option, the New cache method, and provide a name.

Use the default settings to create a cache in your default VPC, Availability Zones, service-owned encryption key, and security groups. We will automatically set recommended best practices. You don’t have to enter any additional settings.

If you want to customize default settings, you can set your own security groups, or enable automatic backups. You can also set maximum limits for your compute and memory usage to ensure your cache doesn’t grow beyond a certain size. When your cache reaches the memory limit, keys with a time to live (TTL) are evicted according to the least recently used (LRU) logic. When your compute limit is reached, ElastiCache will throttle requests, which will lead to elevated request latencies.

When you create a new serverless cache, you can see the details of settings for connectivity and data protection, including an endpoint and network environment.

Now, you can configure the ElastiCache Serverless endpoint in your application and connect using any Redis client that supports Redis in cluster mode, such as redis-cli.

$ redis-cli -h channy-redis-serverless.elasticache.amazonaws.com --tls -c -p 6379
set x Hello
OK
get x
"Hello"

You can manage the cache using AWS Command Line Interface (AWS CLI) or AWS SDKs. For more information, see Getting started with Amazon ElastiCache for Redis in the AWS documentation.

If you have an existing Redis cluster, you can migrate your data to ElastiCache Serverless by specifying the ElastiCache backups or Amazon S3 location of a backup file in a standard Redis rdb file format when creating your ElastiCache Serverless cache.

For a Memcached cache, you can create and use a new serverless cache in the same way as Redis.

If you use ElastiCache Serverless for Memcached, there are significant benefits of high availability and instant scaling because they are not natively available in the Memcached engine. You no longer have to write custom business logic, manage multiple caches, or use a third-party proxy layer to replicate data to get high availability with Memcached. Now you can get up to 99.99 percent availability SLA and data replication across multiple Availability Zones.

To connect to the Memcached endpoint, run the openssl client and Memcached commands as shown in the following example output:

$ /usr/bin/openssl s_client -connect channy-memcached-serverless.cache.amazonaws.com:11211 -crlf 
set a 0 0 5
hello
STORED
get a
VALUE a 0 5
hello
END

For more information, see Getting started with Amazon ElastiCache Serverless for Memcached in the AWS documentation.

Scaling and performance
ElastiCache Serverless scales without downtime or performance degradation to the application by allowing the cache to scale up and initiating a scale-out in parallel to meet capacity needs just in time.

To show ElastiCache Serverless’ performance we conducted a simple scaling test. We started with a typical Redis workload with an 80/20 ratio between reads and writes with a key size of 512 bytes. Our Redis client was configured to Read From Replica (RFR) using the READONLY Redis command, for optimal read performance. Our goal is to show how fast workloads can scale on ElastiCache Serverless without any impact on latency.

As you can see in the graph above, we were able to double the requests per second (RPS) every 10 minutes up until the test’s target request rate of 1M RPS. During this test, we observed that p50 GET latency remained around 751 microseconds and at all times below 860 microseconds. Similarly, we observed p50 SET latency remained around 1,050 microseconds, not crossing the 1,200 microseconds even during the rapid increase in throughput.

Things to know

  • Upgrading engine version – ElastiCache Serverless transparently applies new features, bug fixes, and security updates, including new minor and patch engine versions on your cache. When a new major version is available, ElastiCache Serverless will send you a notification in the console and an event in Amazon EventBridge. ElastiCache Serverless major version upgrades are designed for no disruption to your application.
  • Performance and monitoring – ElastiCache Serverless publishes a suite of metrics to Amazon CloudWatch, including memory usage (BytesUsedForCache), CPU usage (ElastiCacheProcessingUnits), and cache metrics, including CacheMissRate, CacheHitRate, CacheHits, CacheMisses, and ThrottledRequests. ElastiCache Serverless also publishes Amazon EventBridge events for significant events, including cache creation, deletion, and limit updates. For a full list of available metrics and events, see the documentation.
  • Security and compliance – ElastiCache Serverless caches are accessible from within a VPC. You can access the data plane using AWS Identity and Access Management (IAM). By default, only the AWS account creating the ElastiCache Serverless cache can access it. ElastiCache Serverless encrypts all data at rest and in-transit by transport layer security (TLS) encrypting each connection to ElastiCache Serverless. You can optionally choose to limit access to the cache within your VPCs, subnets, IAM access, and AWS Key Management Service (AWS KMS) key for encryption. ElastiCache Serverless is compliant with PCI-DSS, SOC, and ISO and is HIPAA eligible.

Now available
Amazon ElastiCache Serverless is now available in all commercial AWS Regions, including China. With ElastiCache Serverless, there are no upfront costs, and you pay for only the resources you use. You pay for cached data in GB-hours, ECPUs consumed, and Snapshot storage in GB-months.

To learn more, see the ElastiCache Serverless page and the pricing page. Give it a try, and please send feedback to AWS re:Post for Amazon ElastiCache or through your usual AWS support contacts.

— Channy

Join the preview of Amazon Aurora Limitless Database

Post Syndicated from Channy Yun original https://aws.amazon.com/blogs/aws/join-the-preview-amazon-aurora-limitless-database/

Today, we are announcing the preview of Amazon Aurora Limitless Database, a new capability supporting automated horizontal scaling to process millions of write transactions per second and manage petabytes of data in a single Aurora database.

Amazon Aurora read replicas allow you to increase the read capacity of your Aurora cluster beyond the limits of what a single database instance can provide. Now, Aurora Limitless Database scales write throughput and storage capacity of your database beyond the limits of a single Aurora writer instance. The compute and storage capacity that is used for Limitless Database is in addition to and independent of the capacity of your writer and reader instances in the cluster.

With Limitless Database, you can focus on building high-scale applications without having to build and maintain complex solutions for scaling your data across multiple database instances to support your workloads. Aurora Limitless Database scales based on the workload to support write throughput and storage capacity that, until today, would require multiple Aurora writer instances.

The architecture of Amazon Aurora Limitless Database
Limitless Database has a two-layer architecture consisting of multiple database nodes, either transaction routers or shards.

Shards are Aurora PostgreSQL DB instances that each store a subset of the data for your database, allowing for parallel processing to achieve higher write throughput. Transaction routers manage the distributed nature of the database and present a single database image to database clients.

Transaction routers maintain metadata about where data is stored, parse incoming SQL commands and send those commands to shards, aggregate data from shards to return a single result to the client, and manage distributed transactions to maintain consistency across the entire distributed database. All the nodes that make up your Limitless Database architecture are contained in a DB shard group. The DB shard group has a separate endpoint where your access your Limitless Database resources.

Getting started with Aurora Limitless Database
To get started with a preview of Aurora Limitless Database, you can sign up today and will be invited soon. The preview runs in a new Aurora PostgreSQL cluster with version 15 in the AWS US East (Ohio), US East (N. Virginia), US West (Oregon), Asia Pacific (Tokyo), and Europe (Ireland) Regions.

As part of the creation workflow for an Aurora cluster, choose the Limitless Database compatible version in the Amazon RDS console or the Amazon RDS API. Then you can add a DB shard group and create new Limitless Database tables. You can choose the maximum Aurora capacity units (ACUs).

After the DB shard group is created, you can view its details on the Databases page, including its endpoint.

To use Aurora Limitless Database, you should connect to a DB shard group endpoint, also called the limitless endpoint, using psql or any other connection utility that works with PostgreSQL.

There will be two types of tables that contain your data in Aurora Limitless Database:

  • Sharded tables – These tables are distributed across multiple shards. Data is split among the shards based on the values of designated columns in the table, called shard keys.
  • Reference tables – These tables have all their data present on every shard so that join queries can work faster by eliminating unnecessary data movement. They are commonly used for infrequently modified reference data, such as product catalogs and zip codes.

Once you have created a sharded or reference table, you can load massive data into Aurora Limitless Database and manipulate data in those tables using the standard PostgreSQL queries.

Join the preview
You can join the preview of Amazon Aurora Limitless Database to be among the first to experience all of this power.

Sign up now, give it a try, and please send feedback to AWS re:Post for Amazon Aurora or through your usual AWS support contacts.

— Channy

Steve Bray: Why I joined Cloudflare

Post Syndicated from Steve Bray original http://blog.cloudflare.com/steve-bray-why-i-joined-cloudflare/


Steve Bray: Why I joined Cloudflare.

I am excited to announce that I joined Cloudflare last month as Head of Australia & New Zealand, to continue to build on Cloudflare’s success in the region through extending our valuable relationships with our customers and partners.

My journey to Cloudflare

I’ve been fortunate over my 25-year career in the IT industry to have worked for some of the most recognised and innovative organisations such as Oracle, Salesforce, and Zendesk. It’s been exciting to be inside these businesses as they’ve taken new ideas about how software can be developed and delivered to solve real world problems for any organisation’s customers. I’ve learned a lot by being a part of the industry, but probably more importantly, I’ve learned the most from the smart, experienced, diverse groups of talented people that I’ve had the pleasure to work with in ANZ and across Asia Pacific. I have always been interested in the problems that organisations are trying to solve through technology — for example, responding to strategic challenges, reducing cost, improving revenue, reducing risk — and joining Cloudflare is an opportunity to stay focussed on addressing those critical issues with our customers and partners using Cloudflare’s innovative solutions.

So why Cloudflare?

Cloudflare’s mission is to help build a better Internet. So the question I asked myself is, “why is that so important?” In truth, the Internet has become such an integral part of our everyday lives that we take it for granted and forget that we are using it today in ways for which it was not originally designed or architected. It doesn’t have the security, performance, or reliability that is required to ensure the integrity that the modern world expects. Legacy solutions to solve these problems aren’t scalable or cost-effective. This became especially true once the cloud happened.

The solution has been a massive shift at the network layer as “as-a-service” delivery architecture evolves. Cloudflare is leading this transition through its extensive global network, providing security and enhancing the performance of business critical applications, while at the same time eliminating the cost and complexity of managing network hardware within a global cloud platform.

On this basis I’m convinced that Cloudflare, with its distributed network, continued focus on innovation, as well as our commitment to helping our customers, is in the best position to respond to the challenges being presented.

A little about me

I live in Melbourne and enjoy all the wonderful things that the city has to offer, from beautiful parks for some exercise, to its vibrant restaurant and bar scene, to the exciting array of major and global sporting events such as the AFL, Australian Open Tennis and Formula One Grand Prix. I love spending time with family and friends.

I’m looking forward to working with our customers and partners on their projects to deliver genuine business value. I believe that Cloudflare’s products and solutions will make a real difference to the way organisations in every part of ANZ’s economy can successfully respond to today’s security challenges.

Netflix Original Research: MIT CODE 2023

Post Syndicated from Netflix Technology Blog original https://netflixtechblog.com/netflix-original-research-mit-code-2023-9340b879176a

Netflix was thrilled to be the premier sponsor for the 2nd year in a row at the 2023 Conference on Digital Experimentation (CODE@MIT) in Cambridge, MA. The conference features a balanced blend of academic and industry research from some wicked smart folks, and we’re proud to have contributed a number of talks and posters along with a plenary session.

Our contributions kicked off with a concept that is crucial to our understanding of A/B tests: surrogates!

Our first talk was given by Aurelien Bibaut (with co-authors Nathan Kallus, Simon Ejdemyr and Michael Zhao) in which we discussed how to confidently measure long-term outcomes using short term surrogates in the presence of bias. For example, how do we estimate the effects of innovations on retention a year later without running all our experiments for a year? We proposed an estimation method using cross-fold procedures, and construct valid confidence intervals for long term effects before that effect is fully observed.

Later on, Michael Zhao (with Vickie Zhang, Anh Le and Nathan Kallus) spoke about the evaluation of surrogate index models for product decision making. Using 200 real A/B tests performed at Netflix, we showed that surrogate-index models, constructed using only 2 weeks of data, lead to the same product ship decisions ~95% of the time when compared to making a call based on 2 months of data. This means we can reliably run shorter tests with confidence without needing to wait months for results!

Our next topic focused on how to understand and balance competing engagement metrics; for example, should 1 hour of gaming equal 1 hour of streaming? Michael Zhao and Jordan Schafer shared a poster on how they built an Overall Evaluation Criterion (OEC) metric that provides holistic evaluation for A/B tests, appropriately weighting different engagement metrics to serve a single overall objective. This new framework has enabled fast and confident decision making in tests, and is being actively adapted as our business continues to expand into new areas.

In the second plenary session of the day, Martin Tingley took us on a compelling and fun journey of complexity, exploring key challenges in digital experimentation and how they differ from the challenges faced by agricultural researchers a century ago. He highlighted different areas of complexity and provided perspectives on how to tackle the right challenges based on business objectives.

Our final talk was given by Apoorva Lal (with co-authors Samir Khan and Johan Ugander) in which we show how partial identification of the dose-response function (DRF) under non-parametric assumptions can be used to provide more insightful analyses of experimental data than the standard ATE analysis does. We revisited a study that reduced like-minded content algorithmically, and showed how we could extend the binary ATE learning to answer how the amount of like-minded content a user sees affects their political attitudes.

We had a blast connecting with the CODE@MIT community and bonding over our shared enthusiasm for not only rigorous measurement in experimentation, but also stats-themed stickers and swag!

One of our stickers this year, can you guess what this is showing?!

We look forward to next year’s iteration of the conference and hope to see you there!

Psst! We’re hiring Data Scientists across a variety of domains at Netflix — check out our open roles.


Netflix Original Research: MIT CODE 2023 was originally published in Netflix TechBlog on Medium, where people are continuing the conversation by highlighting and responding to this story.

Amazon MSK now provides up to 29% more throughput and up to 24% lower costs with AWS Graviton3 support

Post Syndicated from Sai Maddali original https://aws.amazon.com/blogs/big-data/amazon-msk-now-provides-up-to-29-more-throughput-and-up-to-24-lower-costs-with-aws-graviton3-support/

Amazon Managed Streaming for Apache Kafka (Amazon MSK) is a fully managed service that enables you to build and run applications that use Apache Kafka to process streaming data.

Today, we’re excited to bring the benefits of Graviton3 to Kafka workloads, with Amazon MSK now offering M7g instances for new MSK provisioned clusters. AWS Graviton processors are custom Arm-based processors built by AWS to deliver the best price-performance for your cloud workloads. For example, when running an MSK provisioned cluster using M7g.4xlarge instances, you can achieve up to 27% reduction in CPU usage and up to 29% higher write and read throughput compared to M5.4xlarge instances. These performance improvements, along with M7g’s lower prices provide up to 24% in compute cost savings over M5 instances.

In February 2023, AWS launched new Graviton3-based M7g instances. M7g instances are equipped with DDR5 memory, which provides up to 50% higher memory bandwidth than the DDR4 memory used in previous generations. M7g instances also deliver up to 25% higher storage throughput and up to 88% increase in network throughput compared to similar sized M5 instances to deliver price-performance benefits for Kafka workloads. You can read more about M7g features in New Graviton3-Based General Purpose (m7g) and Memory-Optimized (r7g) Amazon EC2 Instances.

Here are the specs for the M7g instances on MSK:

Name vCPUs Memory Network Bandwidth Storage Bandwidth
M7g.large 2 8 GiB up to 12.5 Gbps up to 10 Gbps
M7g.xlarge 4 16 GiB up to 12.5 Gbps up to 10 Gbps
M7g.2xlarge 8 32 GiB up to 15 Gbps up to 10 Gbps
M7g.4xlarge 16 64 GiB up to 15 Gbps up to 10 Gbps
M7g.8xlarge 32 128 GiB 15 Gbps 10 Gbps
M7g.12xlarge 48 192 GiB 22.5 Gbps 15 Gbps
M7g.16xlarge 64 256 GiB 30 Gbps 20 Gbps

M7g instances on Amazon MSK

Organizations are adopting Amazon MSK to capture and analyze data in real time, run machine learning (ML) workflows, and build event-driven architectures. Amazon MSK enables you to reduce operational overhead and run your applications with higher availability and durability. It also offers a consistent reduction in price-performance with capabilities such as Tiered Storage. With compute making up a large portion of Kafka costs, customers wanted a way to optimize them further and see Graviton instances providing them the quickest path. Amazon MSK has fully tested and validated M7g on all Kafka versions starting with version 2.8.2, making it to run critical workloads and benefit from Gravition3 cost savings.
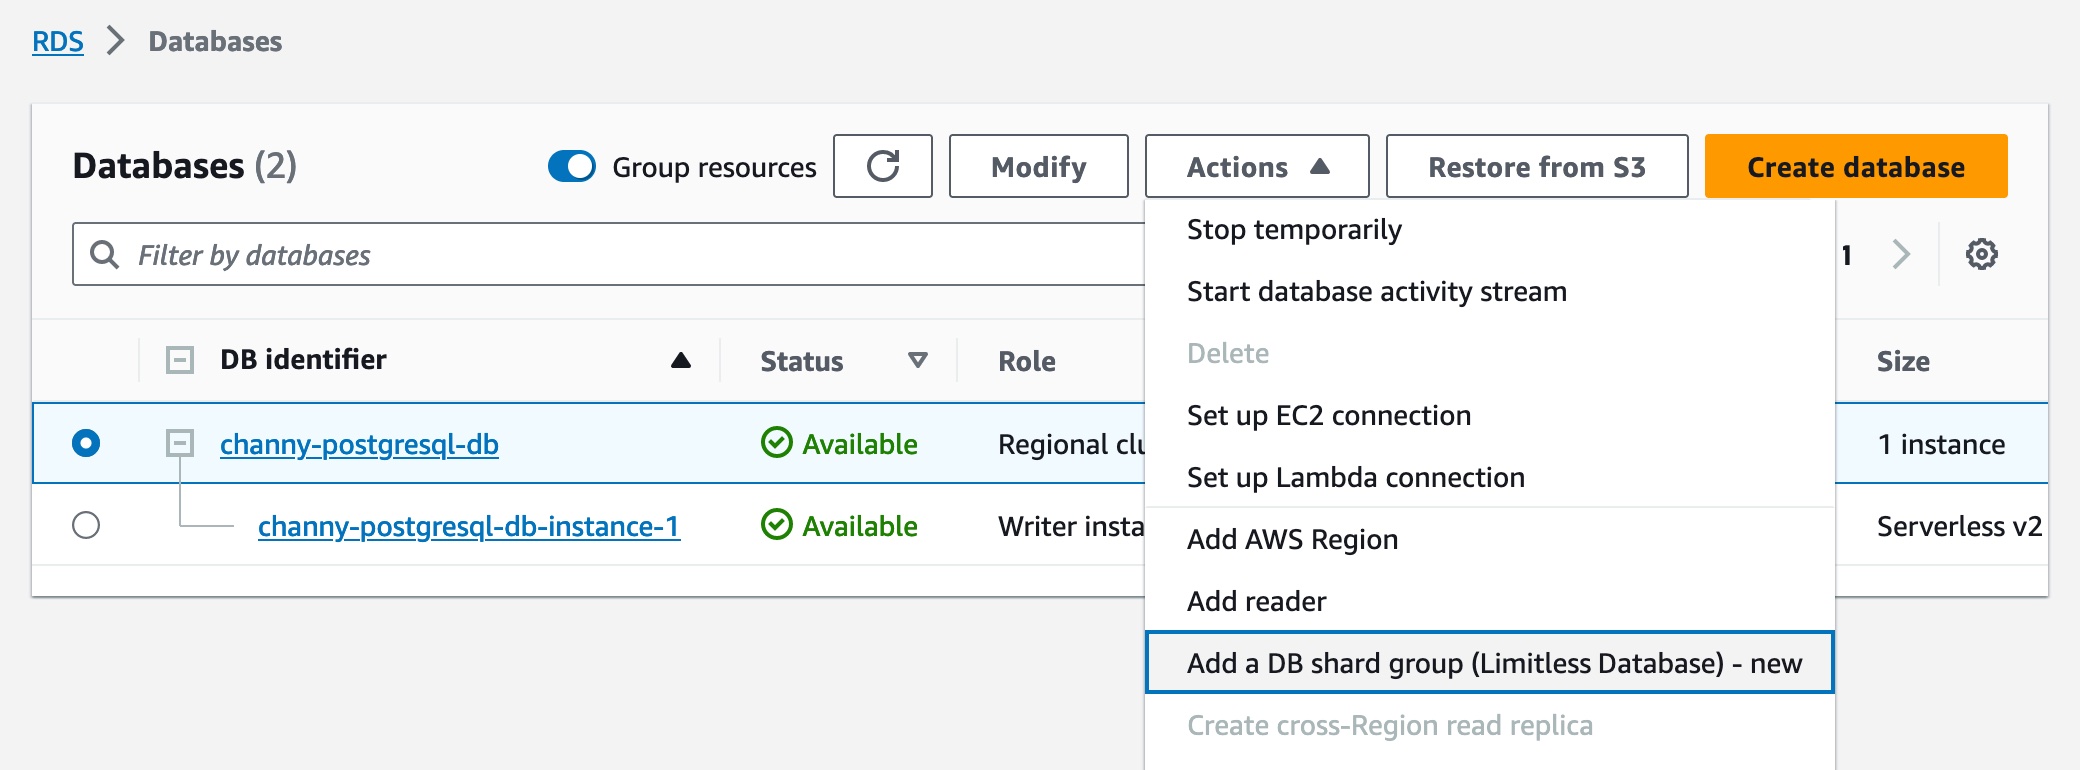
You can get started by provisioning new clusters with the Graviton3-based M7g instances as the broker type using the AWS Management Console, APIs via the AWS SDK, and the AWS Command Line Interface (AWS CLI). M7g instances support all Amazon MSK and Kafka features, making it straightforward for you to run all your existing Kafka workloads with minimal changes. Amazon MSK supports Graviton3-based M7g instances from large through 16xlarge sizes to run all Kafka workloads.

Let’s take the M7g instances on MSK provisioned clusters for a test drive and see how it compares with Amazon MSK M5 instances.

M7g instances in action

Customers run a wide variety of workloads on Amazon MSK; some are latency sensitive, and some are throughput bound. In this post, we focus on M7g performance impact on throughput-bound workloads. M7g comes with an increase in network and storage throughput, providing a higher throughput per broker compared to an M5-based cluster.

To understand the implications, let’s look at how Kafka uses available throughput for writing or reading data. Every broker in the MSK cluster comes with a bounded storage and network throughput entitlement. Predominantly, writes in Kafka consume both storage and network throughput, whereas reads consume mostly network throughput. This is because a Kafka consumer is typically reading real-time data from a page cache and occasionally goes to disk to process old data. Therefore, the overall throughput gains also change based on the workload’s write to read throughput ratios.

Let’s look at the throughput gains based on an example. Our setup includes an MSK cluster with M7g.4xlarge instances and another with M5.4xlarge instances, with three nodes in three different Availability Zones. We also enabled TLS encryption, AWS Identity and Access Management (IAM) authentication, and a replication factor of 3 across both M7g and M5 MSK clusters. We also applied Amazon MSK best practices for broker configurations, including num.network.threads = 8 and num.io.threads = 16. On the client side for writes, we optimized the batch size with appropriate linger.ms and batch.size configurations. For the workload, we assumed 6 topics each with 64 partitions (384 per broker). For ingestion, we generated load with an average message size of 512 bytes and with one consumer group per topic. The amount of load sent to the clusters was identical.

As we ingest more data into the MSK cluster, the M7g.4xlarge instance supports higher throughput per broker, as shown in the following graph. After an hour of consistent writes, M7g.4xlarge brokers support up to 54 MB/s of write throughput vs. 40 MB/s with M5-based brokers, which represents a 29% increase.

We also see another important observation: M7g-based brokers consume much fewer CPU resources than M5s, even though they support 29% higher throughput. As seen in the following chart, CPU utilization of an M7g-based broker is on average 40%, whereas on an M5-based broker, it’s 47%.

As covered previously, customers may see different performance improvements based on the number of consumer group, batch sizes, and instance size. We recommend referring to MSK Sizing and Pricing to calculate M7g performance gains for your use case or creating a cluster based on M7g instances and benchmark the gains on your own.

Lower costs, with lesser operational burden, and higher resiliency

Since its launch, Amazon MSK has made it cost-effective to run your Kafka workloads, while still improving overall resiliency. Since day 1, you have been able to run brokers in multiple Availability Zones without worrying about additional networking costs. In October 2022, we launched Tiered Storage, which provides virtually unlimited storage at up to 50% lower costs. When you use Tiered Storage, you not only save on overall storage cost but also improve the overall availability and elasticity of your cluster.

Continuing down this path, we are now reducing compute costs for customers while still providing performance improvements. With M7g instances, Amazon MSK provides 24% savings on compute costs compared to similar sized M5 instances. When you move to Amazon MSK, you can not only lower your operational overhead using features such as Amazon MSK Connect, Amazon MSK Replicator, and automatic Kafka version upgrades, but also improve over resiliency and reduce their infrastructure costs.

Pricing and Regions

M7g instances on Amazon MSK are available today in the US (Ohio, N. Virginia, N. California, Oregon), Asia Pacific (Hyderabad, Mumbai, Seoul, Singapore, Sydney, Tokyo), Canada (Central), and EU (Ireland, London, Spain, Stockholm) Regions.

Refer to Amazon MSK pricing to learn about Graivton3-based instances with Amazon MSK pricing.

Summary

In this post, we discussed the performance gains achieved while using Graviton-based M7g instances. These instances can provide significant improvement in read and write throughput compared to similar sized M5 instances for Amazon MSK workloads. To get started, create a new cluster with M7g brokers using the AWS Management Console, and read our documentation for more information.


About the Authors

Sai Maddali is a Senior Manager Product Management at AWS who leads the product team for Amazon MSK. He is passionate about understanding customer needs, and using technology to deliver services that empowers customers to build innovative applications. Besides work, he enjoys traveling, cooking, and running.

Umesh is a Streaming Solutions Architect at AWS. He works with AWS customers to design and build real time data processing systems. He has 13 years of working experience in software engineering including architecting, designing, and developing data analytics systems.

Lanre Afod is a Solutions Architect focused with Global Financial Services at AWS, passionate about helping customers with deploying secure, scalable, high available and resilient architectures within the AWS Cloud.

Introducing new central configuration capabilities in AWS Security Hub
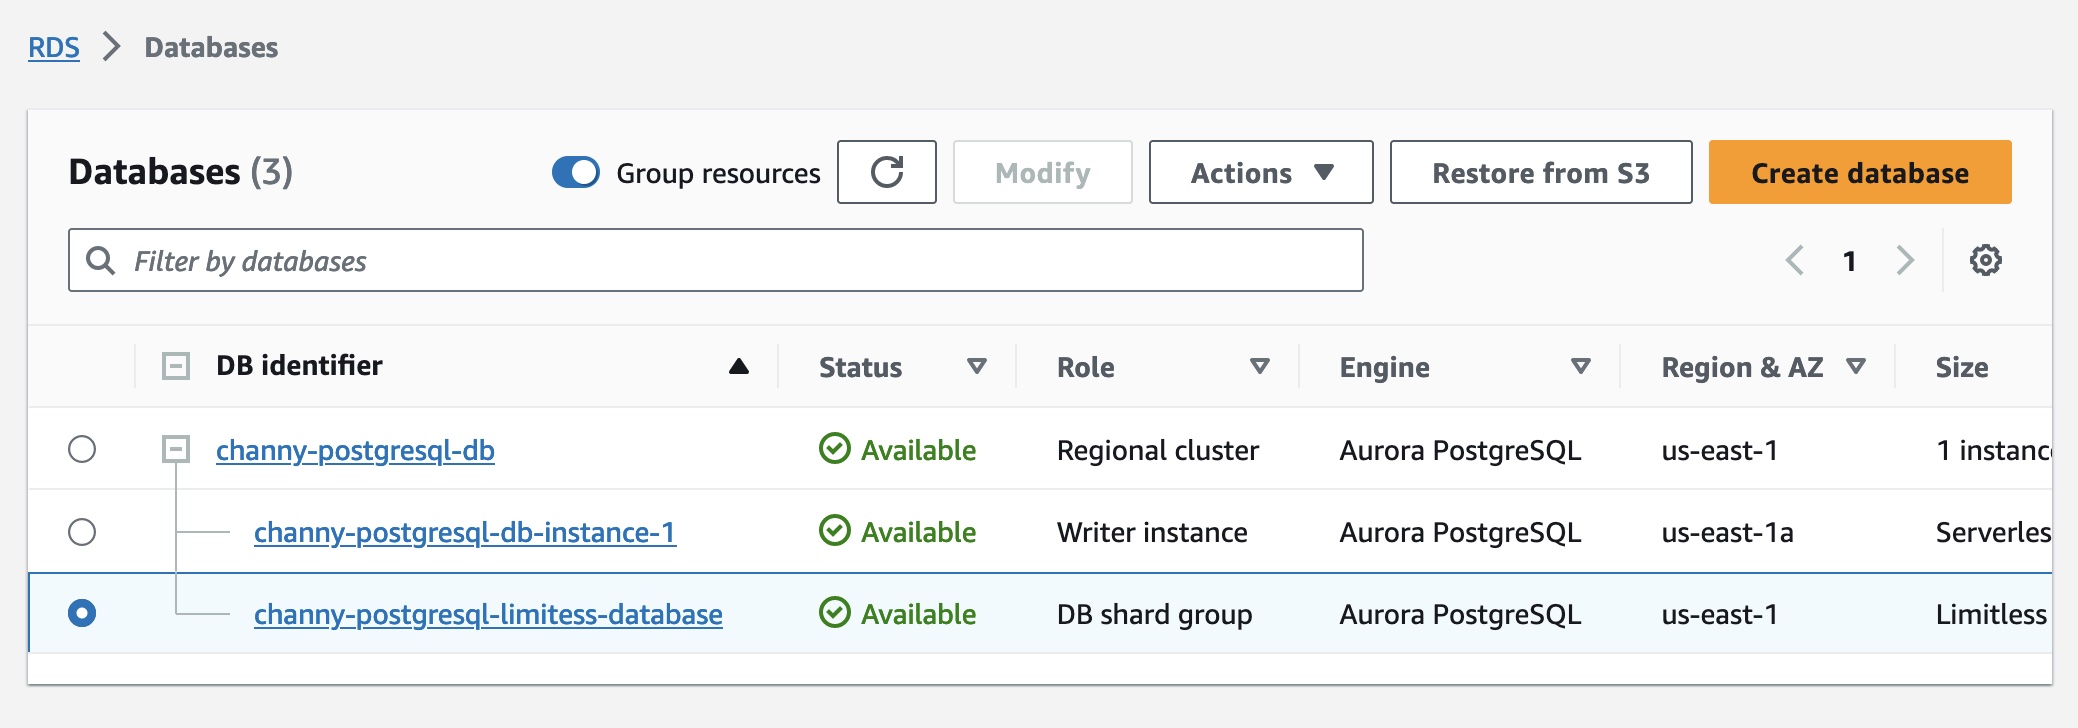
Post Syndicated from Nicholas Jaeger original https://aws.amazon.com/blogs/security/introducing-new-central-configuration-capabilities-in-aws-security-hub/

As cloud environments—and security risks associated with them—become more complex, it becomes increasingly critical to understand your cloud security posture so that you can quickly and efficiently mitigate security gaps. AWS Security Hub offers close to 300 automated controls that continuously check whether the configuration of your cloud resources aligns with the best practices identified by Amazon Web Services (AWS) security experts and with industry standards. Furthermore, you can manage your cloud security posture at scale by using a single action to enable Security Hub across your organization with the default settings, and by aggregating findings across your organization accounts and Regions to a single account and Region of your choice.

With the release of the new central configuration feature of Security Hub, the setup and management of control and policy configurations is simplified and centralized to the same account you have already been using to aggregate findings. In this blog post, we will explain the benefits of the new feature and describe how you can quickly onboard to it.

Central configuration overview

With the release of the new central configuration capabilities in Security Hub, you are now able to use your delegated administrator (DA) account (an AWS Organizations account designated to manage Security Hub throughout your organization) to centrally manage Security Hub controls and standards and to view your Security Hub configuration throughout your organization from a single place. To facilitate this functionality, central configuration allows you to set up policies that specify whether or not Security Hub should be enabled and which standards and controls should be turned on. You can then choose to associate your policies with your entire organization or with specific accounts or organizational units (OUs), with your policies applying automatically across linked Regions. Policies applied to specific OUs (or to the entire organization) are inherited by child accounts. This not only applies to existing accounts, but also to new accounts added to those OUs (or to the entire organization) after you created the policy. Furthermore, when you add a new linked Region to Security Hub, your existing policies will be applied to that Region immediately. This allows you to stop maintaining manual lists of accounts and Regions to which you’d like to apply your custom configurations; instead, you can maintain several policies for your organization, with each one being associated to a different set of accounts in your organization. As a result, by using the central configuration capabilities, you can significantly reduce the time spent on configuring Security Hub and switch your focus to remediating its findings.

After applying your policies, Security Hub also provides you with a view of your organization that shows the policy status per OU and account while also preventing drift. This means that after you set up your organization by using central configuration, account owners will not be able to deviate from your chosen settings—your policies will serve as the source of truth for your organizational configuration, and you can use them to understand how Security Hub is configured for your organization.

The use of the new central configuration feature is now the recommended approach to configuring Security Hub, and its standards and controls, across some or all AWS accounts in your AWS Organizations structure.

Prerequisites

To get started with central configuration, you need to complete three prerequisites:

  1. Enable AWS Config in the accounts and Regions where you plan to enable Security Hub. (For more information on how to optimize AWS Config configuration for Security Hub usage, see this blog post.)
  2. Turn on Security Hub in your AWS Organizations management account at least in one Region where you plan to use Security Hub.
  3. Use your Organizations management account to delegate an administrator account for Security Hub.

If you are new to Security Hub, simply navigate to it in the AWS Management Console from your organization management account, and the console will walk you through setting the last two prerequisites listed here. If you already use Security Hub, these can be configured from the Settings page in Security Hub. In both cases, upon completing these three prerequisites, you can proceed with the central configuration setup from the account you set as the DA.

Recommended setup

To begin the setup, open the Security Hub console from your AWS Organizations management account or from your Security Hub delegated administrator account. In the left navigation menu, choose Configuration to open the new Configuration page, shown in Figure 1. Choose Start central configuration.

Figure 1: The new Configuration page, where you can see your current organizational configuration and start using the new capabilities
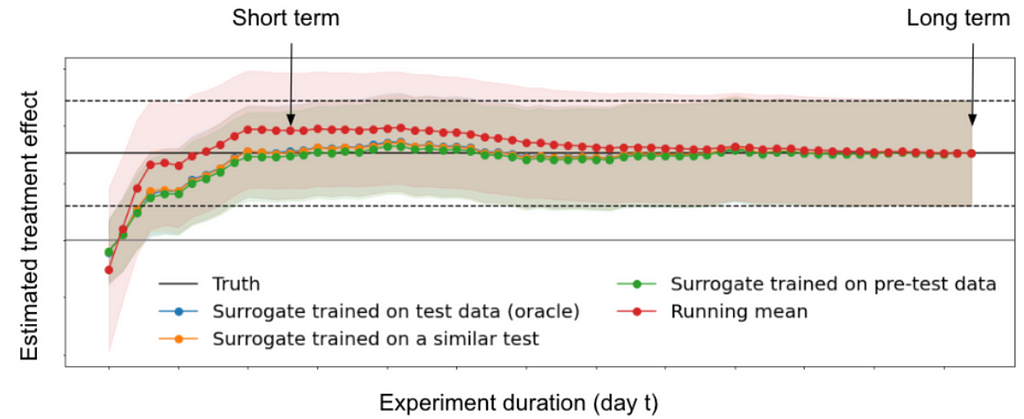
Figure 1: The new Configuration page, where you can see your current organizational configuration and start using the new capabilities
If you signed in to Security Hub using the AWS Organizations management account, you will be brought to step 1, Designate delegated administrator, where you will be able to designate a new delegated administrator or confirm your existing selection before continuing the setup. If you signed in to Security Hub using your existing delegated administrator account, you will be brought directly to step 2, Centralize organization, which is shown in Figure 2. In step 2, you are first asked to choose your home Region, which is the AWS Region you will use to create your configuration policies. By default, the current Region is selected as your home Region, unless you already use cross-Region finding aggregation — in which case, your existing aggregation Region is pre-selected as your home Region.

You are then prompted to select your linked Regions, which are the Regions you will configure by using central configuration. Regions that were already linked as part of your cross-Region aggregation settings will be pre-selected. You will also be able to add additional Regions or choose to include all AWS Regions, including future Regions. If your selection includes opt-in Regions, note that Security Hub will not be enabled in them until you enable those Regions directly.

Figure 2: The Centralize organization page

Figure 2: The Centralize organization page

Step 3, Configure organization, is shown in Figure 3. You will see a recommendation that you use the AWS recommended Security Hub configuration policy (SHCP) across your entire organization. This includes enabling the AWS Foundational Security Best Practices (FSBP) v1.0.0 standard and enabling new and existing FSBP controls in accounts in your AWS Organizations structure. This is the recommended configuration for most customers, because the AWS FSBP have been carefully curated by AWS security experts and represent trusted security practices for customers to build on.

Alternatively, if you already have a custom configuration in Security Hub and would like to import it into the new capabilities, choose Customize my Security Hub configuration and then choose Pre-populate configuration.

Figure 3: Step 3 – creating your first policy

Figure 3: Step 3 – creating your first policy

Step 4, Review and apply, is where you can review the policy you just created. Until you complete this step, your organization’s configuration will not be changed. This step will override previous account configurations and create and apply your new policy. After you choose Create policy and apply, you will be taken to the new Configuration page, which was previously shown in Figure 1. The user interface will now be updated to include three tabs — Organization, Policies, and Invitation account — where you can do the following:

  • On the Organization tab, which serves as a single pane of glass for your organization configuration in Security Hub, you can see the policy status for each account and OU and verify that your desired configuration is in effect.
  • On the Policies tab, you can view your policies, update them, and create new ones.

  • On the Invitation accounts tab, you can view and update findings for invitation accounts, which do not belong to your AWS Organizations structure. These accounts cannot be configured using the new central configuration capabilities.

Together, those tabs serve as a single pane of glass for your organization configuration in Security Hub. To that end, the organization chart you now see shows which of your accounts have already been affected by the policy you just created and which are still pending. Normally, an account will show as pending only for a few minutes after you create new policies or update existing ones. However, an account can stay in pending status for up to 24 hours. During this time, Security Hub will try to configure the account with your chosen policy settings.

If Security Hub determines that a policy cannot be successfully propagated to an account, it will show its status as failed (see Figure 4). This is most likely to happen when you missed completing the prerequisites in the account where the failure is showing. For example, if AWS Config is not yet enabled in an account, the policy will have a failed status. When you hover your pointer over the word “Failed”, Security Hub will show an error message with details about the issue. After you fix the error, you can try again to apply the policy by selecting the failed account and choosing the Re-apply policy button.

Figure 4: The Organization tab on the <strong>Configuration</strong> page shows all your organization accounts, if they are being managed by a policy, and the policy status for each account and OU” width=”780″ class=”size-full wp-image-32053″ style=”border: 1px solid #bebebe”></p>
<p id=Figure 4: The Organization tab on the Configuration page shows all your organization accounts, if they are being managed by a policy, and the policy status for each account and OU
Flexibility in onboarding to central configuration

As mentioned earlier, central configuration makes it significantly more accessible for you to centrally manage Security Hub and its controls and standards. This feature also gives you the granularity to choose the specific accounts to which your chosen settings will be applied. Even though we recommend to use central configuration to configure all your accounts, one advantage of the feature is that you can initially create a test configuration and then apply it across your organization. This is especially useful when you have already configured Security Hub using previously available methods and you would like to check that you have successfully imported your existing configuration.

When you onboard to central configuration, accounts in the organization are self-managed by default, which means that they still maintain their previous configuration until you apply a policy to them, to one of their parent OUs, or to the entire organization. This gives you the option to create a test policy when you onboard, apply it only to a test account or OU, and check that you achieved your desired outcome before applying it to other accounts in the organization.

Configure and deploy different policies per OU

Although we recommend that you use the policy recommended by Security Hub whenever possible, every customer has a different environment and some customization might be required. Central configuration does not require you to use the recommended policy, and you can instead create your own custom policies that specify how Security Hub is used across organization accounts and Regions. You can create one configuration policy for your entire organization, or multiple policies to customize Security Hub settings in different accounts.

In addition, you might need to implement different policies per OU. For example, you might need to do that when you have a finance account or OU in which you want to use Payment Card Industry Data Security Standard (PCI DSS) v3.2.1. In this case, you can go to the Policies tab, choose Create policy, specify the configuration you’d like to have, and apply it to those specific OUs or accounts, as shown in Figure 5. Note that each policy must be complete — which means that it must contain the full configuration settings you would like to apply to the chosen set of accounts or OUs. In particular, an account cannot inherit part of its settings from a policy associated with a parent OU, and the other part from its own policy. The benefit of this requirement is that each policy serves as the source of truth for the configuration of the accounts it is applied to. For more information on this behavior or on how to create new policies, see the Security Hub documentation.

Figure 5: Creation of a new policy with the FSBP and the PCI DSS standards

Figure 5: Creation of a new policy with the FSBP and the PCI DSS standards

You might find it necessary to exempt accounts from being centrally configured. You have the option to set an account or OU to self-managed status. Then only the account owner can configure the settings for that account. This is useful if your organization has teams that need to be able to set their own security coverage. Unless you disassociate self-managed accounts from your Security Hub organization, you will still see findings from self-managed accounts, giving you organization-wide visibility into your security posture. However, you won’t be able to view the configuration of those accounts, because they are not centrally managed.

Understand and manage where controls are applied

In addition to being able to centrally create and view your policies, you can use the control details page to define, review, and apply how policies are configured at a control level. To access the control details page, go to the left navigation menu in Security Hub, choose Controls, and then choose any individual control.

The control details page allows you to review the findings of a control in accounts where it is already enabled. Then, if you decide that these findings are not relevant to specific accounts and OUs, or if you decide that you want to use the control in additional accounts where it is not currently enabled, you can choose Configure, view the policies to which the control currently applies, and update the configuration accordingly as shown in Figure 6.

Figure 6: Configuring a control from the control details page

Figure 6: Configuring a control from the control details page

Organizational visibility

As you might already have noticed in the earlier screenshot of the Organization view (Figure 4), the new central configuration capability gives you a new view of the policies applied (and by extension, the controls and standards deployed) to each account and OU. If you need to customize this configuration, you can modify an existing policy or create a new policy to quickly apply to all or a subset of your accounts. At a glance, you can also see which accounts are self-managed or don’t have Security Hub turned on.

Conclusion

Security Hub central configuration helps you to seamlessly configure Security Hub and its controls and standards across your accounts and Regions so that your organization’s accounts have the level of security controls coverage that you want. AWS recommends that you use this feature when configuring, deploying, and managing controls in Security Hub across your organization’s accounts and Regions. Central configuration is now available in all commercial AWS Regions. Try it out today by visiting the new Configuration page in Security Hub from your DA. You can benefit from the Security Hub 30-day free trial even if you use central configuration, and the trial offer will be automatically applied to organization accounts in which you didn’t use Security Hub before.

 
If you have feedback about this post, submit comments in the Comments section below. If you have questions about this post, contact AWS Support.

Want more AWS Security news? Follow us on Twitter.

Nicholas Jaeger

Nicholas Jaeger

Nicholas is a Principal Security Solutions Architect at AWS. His background includes software engineering, teaching, solutions architecture, and AWS security. Today, he focuses on helping companies and organizations operate as securely as possible on AWS. Nicholas also hosts AWS Security Activation Days to provide customers with prescriptive guidance while using AWS security services to increase visibility and reduce risk.

Gal Ordo

Gal Ordo

Gal is a Senior Product Manager for AWS Security Hub at AWS. He has more than a decade of experience in cybersecurity, having focused on IoT, network, and cloud security throughout his career. He is passionate about making sure that customers can continue to scale and grow their environments without compromising on security. Outside of work, Gal enjoys video games, reading, and exploring new places.

The collective thoughts of the interwebz