Post Syndicated from Ramesh H Singh original https://aws.amazon.com/blogs/big-data/use-account-agnostic-reusable-project-profiles-in-amazon-sagemaker-to-streamline-governance/
Amazon SageMaker now supports account-agnostic project profiles, so you can create reusable project templates across multiple AWS accounts and organizational units. In this post, we demonstrate how account-agnostic project profiles can help you simplify and streamline the management of SageMaker project creation while maintaining security and governance features. We walk through the technical steps to configure account-agnostic, reusable project profiles, helping you maximize the flexibility of your SageMaker deployments.
New feature: Account-agnostic project profiles
Previously, SageMaker provided the ability to create project profiles, which required selecting an AWS account and AWS Region at the time of profile creation. This feature provides you the flexibility to insert the AWS account and Region dynamically when creating projects.
SageMaker now supports generic, account-agnostic project profiles (templates) in SageMaker domains, so domain administrators can define project configurations one time and reuse them across multiple AWS accounts and Regions.
Project profiles are no longer tied to a specific AWS account or Region. Instead, platform teams can reference an account pool—a new domain entity that enables dynamic account and Region selection at the time of project creation, based on custom enterprise authorization policies or user-specific logic. This decoupling of profile definitions from static deployment settings is designed to simplify governance, reduce duplication, and accelerate onboarding across large-scale data and machine learning (ML) environments.
Account-agnostic project profiles offer the following key benefits:
- Project creators benefit from a more flexible experience – During project creation, project creators can select from a personalized list of authorized AWS accounts and Regions, powered by custom resolution strategies or predefined account pools.
- The feature streamlines project profile governance – This model is intended to enable organizations operating across many different accounts to scale efficiently across those accounts, while preserving organization’s centralized control and permission boundaries.
Customer spotlight
As a large data-driven organization, Bayer AG looks to harness the power of data, analytics, and ML to help researchers and engineers accelerate pharmaceutical innovation. With the ability to create account agnostic templates and reusable templates in SageMaker, the research teams at Bayer can innovate faster without platform and engineering overhead.
“At Bayer, we use Amazon SageMaker Unified Studio as a unified, governed workspace that brings together data from multiple AWS accounts—enabling our users to run analytics, build pipelines, and train models as part of their day-to-day work. With the new capability to create account-agnostic templates, our platform team can publish reusable templates once, and teams can select the right authorized AWS account at project creation—without relying on platform hand-offs. This will support faster onboarding, improved agility, and consistent governance as we scale ML across our global operations.”
— Avinash Reddy Erupaka, Principal Engineering Lead, Drug Innovation Platform, Bayer
Solution overview
For our example use case, a leading pharmaceutical company has implemented SageMaker to manage their enterprise-wide data governance initiatives. The organization faces the complex challenge of managing thousands of AWS accounts across their global operations.
To streamline this process, their platform administrator needs to develop a system of reusable project profiles that map to specific account pools, organized according to the company’s organizational structure. For instance, they’ve created a specialized Corporate HR project profile tailored to meet the Corporate HR team’s specific requirements, as well as a comprehensive Data Engineer project profile designed for data engineering teams operating across North America, Asia-Pacific, and European Regions. This strategic approach helps data engineers efficiently create new projects using these preconfigured profiles while selecting from pre-authorized account and Region combinations. This structure strikes an optimal balance between operational flexibility and enhanced security and governance features.
In the following sections, we provide a detailed, step-by-step implementation guide for this solution.
Prerequisites
For this walkthrough, you must have the following prerequisites:
- An AWS account – If you don’t have an account, you can create one. The account should have permission to do the following:
- Create and manage SageMaker domains
- Create and manage AWS Identity and Access Management (IAM) roles
- Create and invoke AWS Lambda functions (optional)
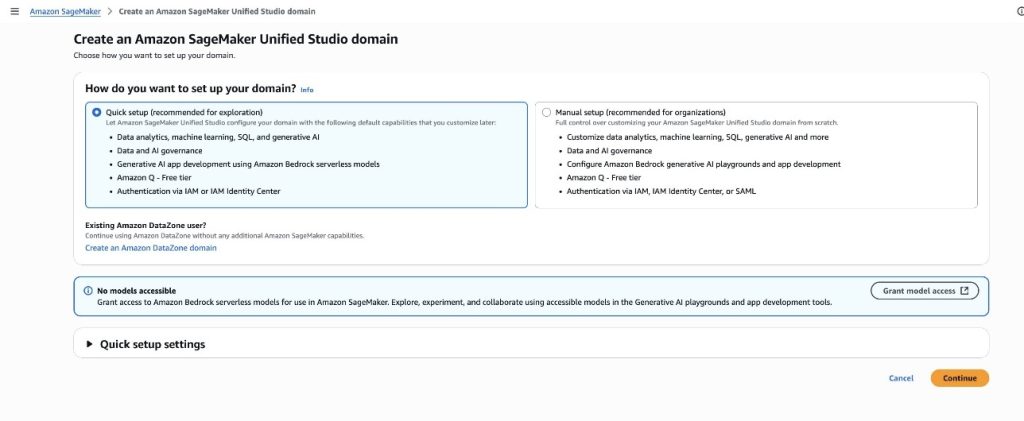
- SageMaker domain – For instructions, refer to Create a domain – quick setup.
- AWS CLI installed – The AWS Command Line Interface (AWS CLI) version 2.11 or later.
- Python installed – Python 3.8 or later (if using custom Lambda handlers).
- IAM permissions – The following IAM permissions are required:
sagemaker:CreateProjectsagemaker:CreateProjectProfiledatazone:CreateAccountPool
Platform administrator tasks
The platform administrator is responsible for two key setup tasks: creating account pools and establishing project profiles associated with these pools. This section provides the steps to accomplish both crucial processes.
Create account pools
There are two ways to create account pools:
- For static account sources, provide a list of accounts and Regions
- For dynamic account sources, use a custom Lambda handler to authorize account and Region pair information
As of this writing, the creation, update, and deletion of account pools are only supported in the AWS CLI.
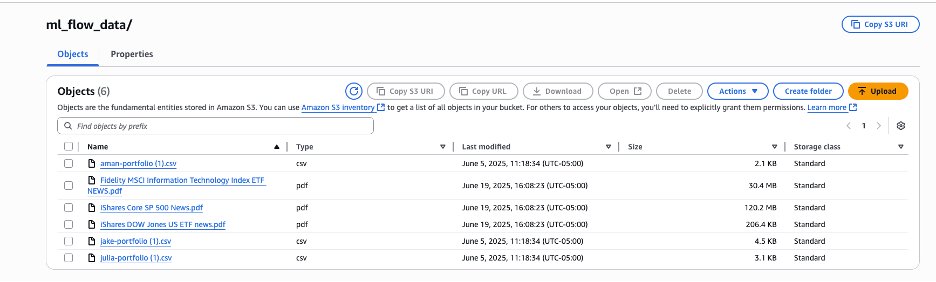
For creating account pools, use the create-account-pool command and provide the resources. We used the following commands to create account pools for our example use case. Replace the relevant values with your own resources, such as domain identifier, account, and Region.
First, create the account pool hr-accountpool with a single AWS account. In the following command, the parameter MANUAL refers to the mechanism by which an account is chosen from the pool at project creation time. Because the platform admin is manually choosing the accounts, the resolution strategy is set to MANUAL.
Next, create the account pool namer-data-engg-pool with multiple AWS accounts. Use the same code to create account pools for the EMEA and APAC Regions:
You will use these account pools in subsequent steps to create project profiles.
To verify account pool creation, use the following command:
If you have an external permissioning system, you can use the following custom Lambda command to create your account pool that will dynamically resolve during project creation:
Create project profiles and account pool assignments
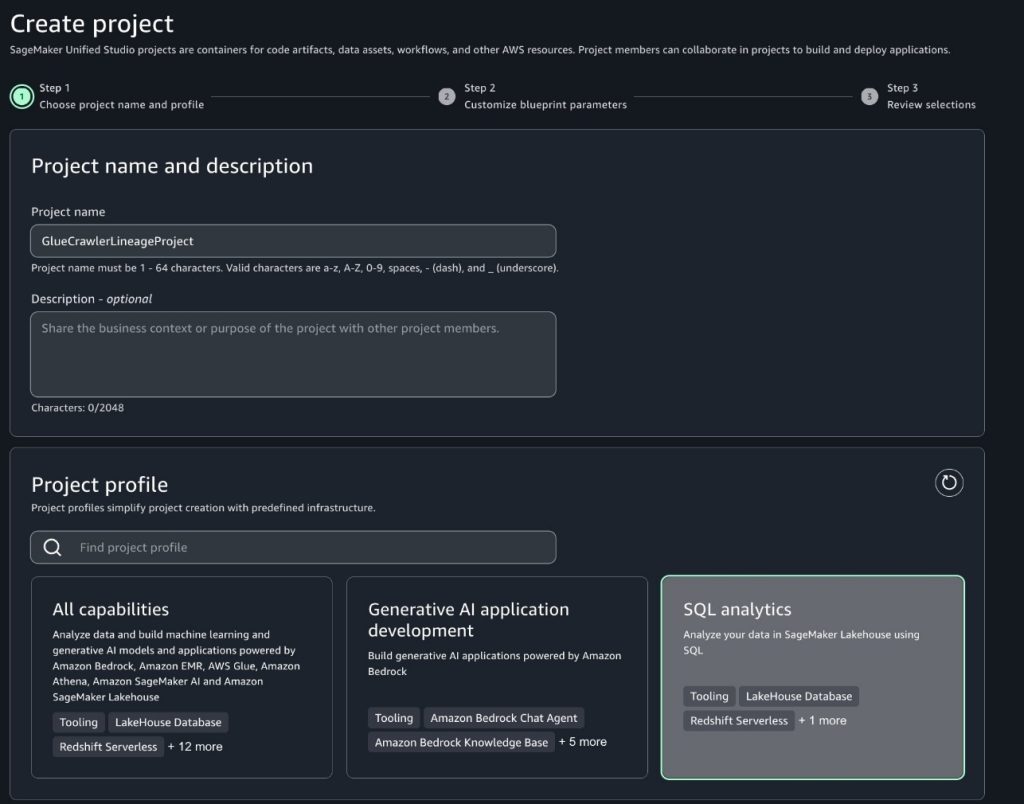
In this step, we establish project profiles and connect them to authorized account pools. There are three possible scenarios for setting up project profiles.
Scenario 1: Project profile associated with a single account pool
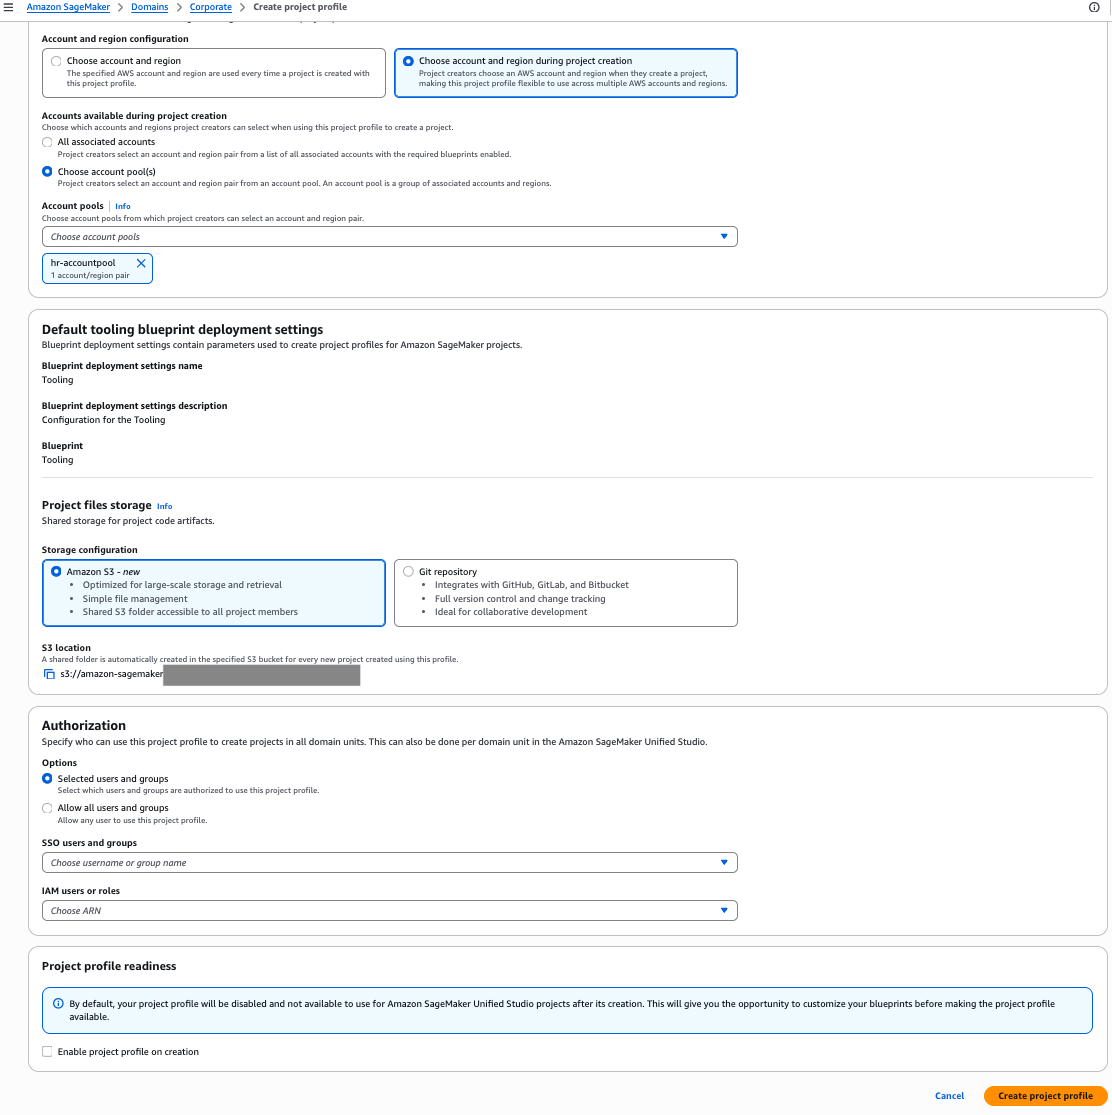
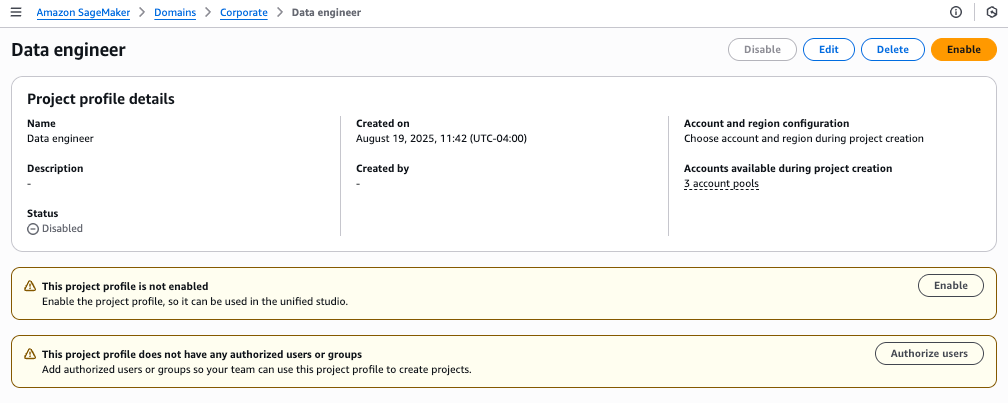
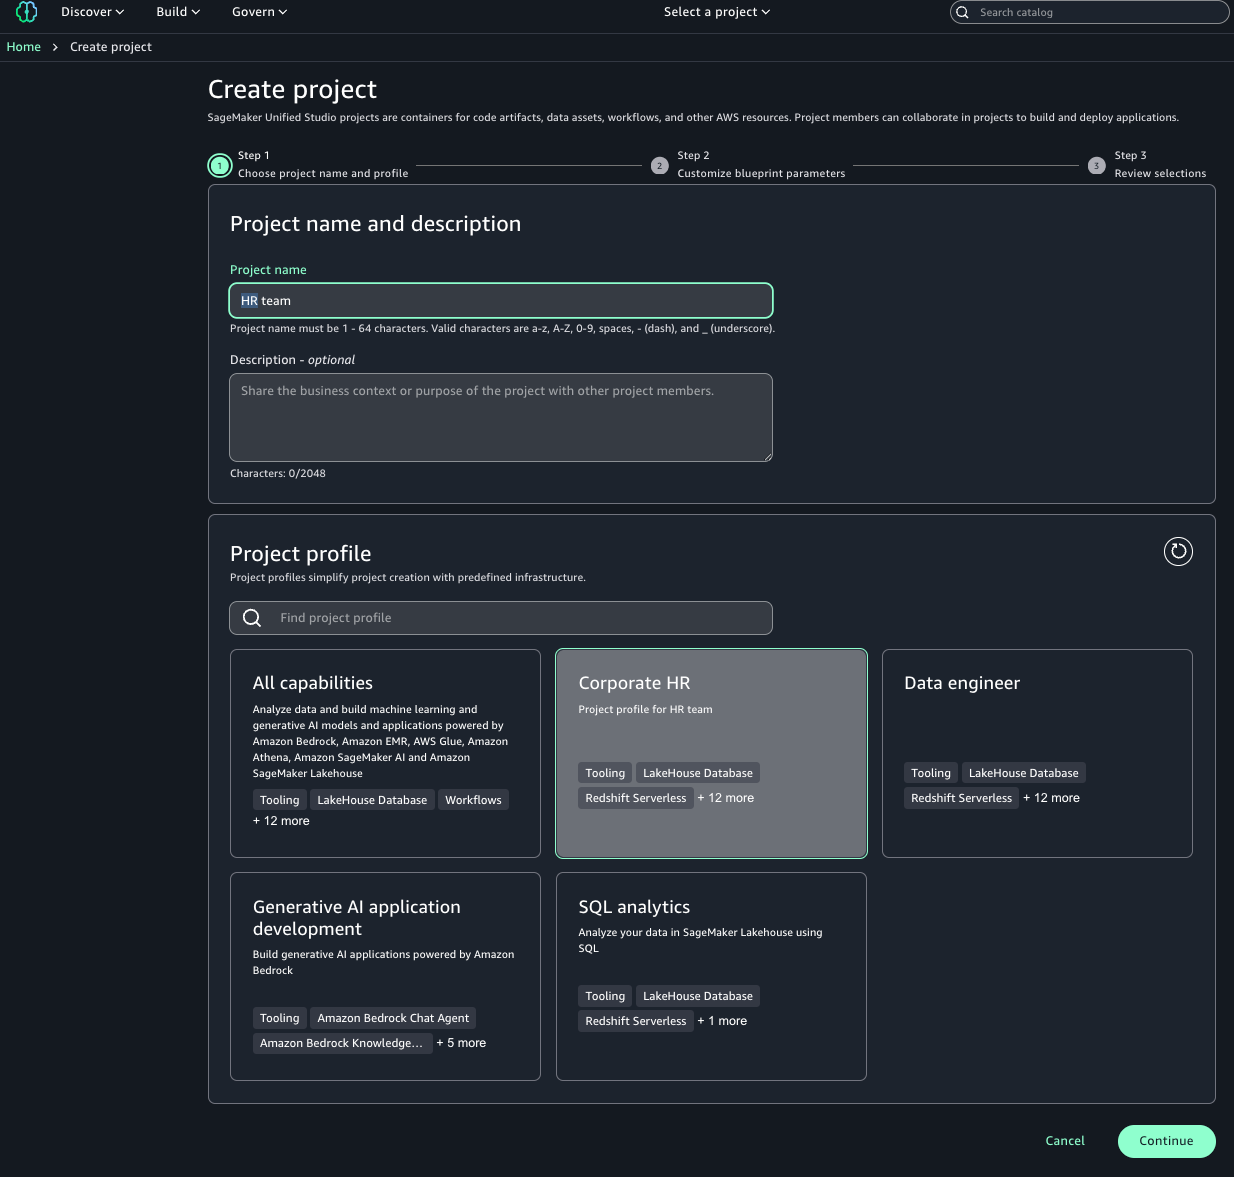
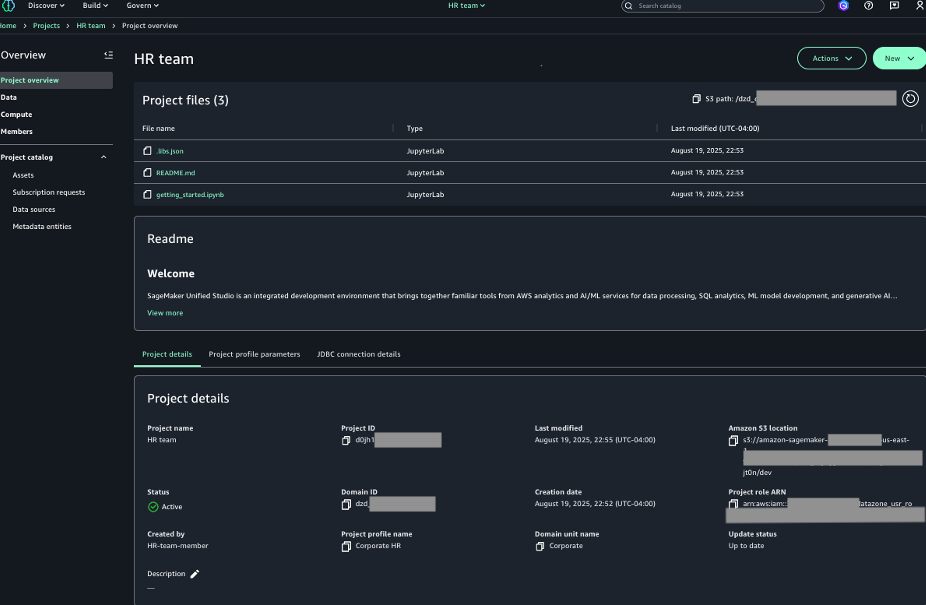
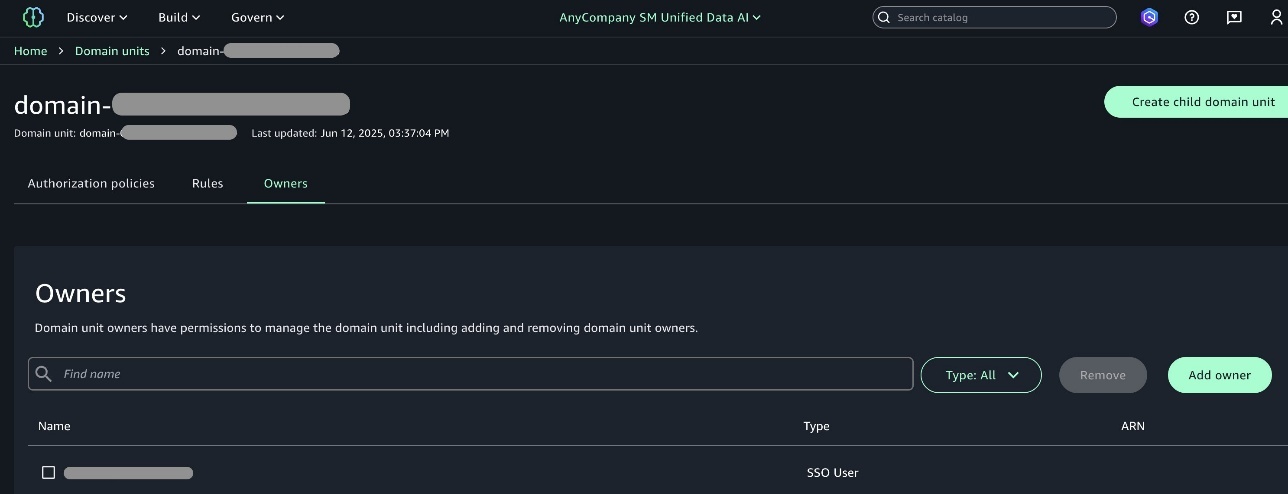
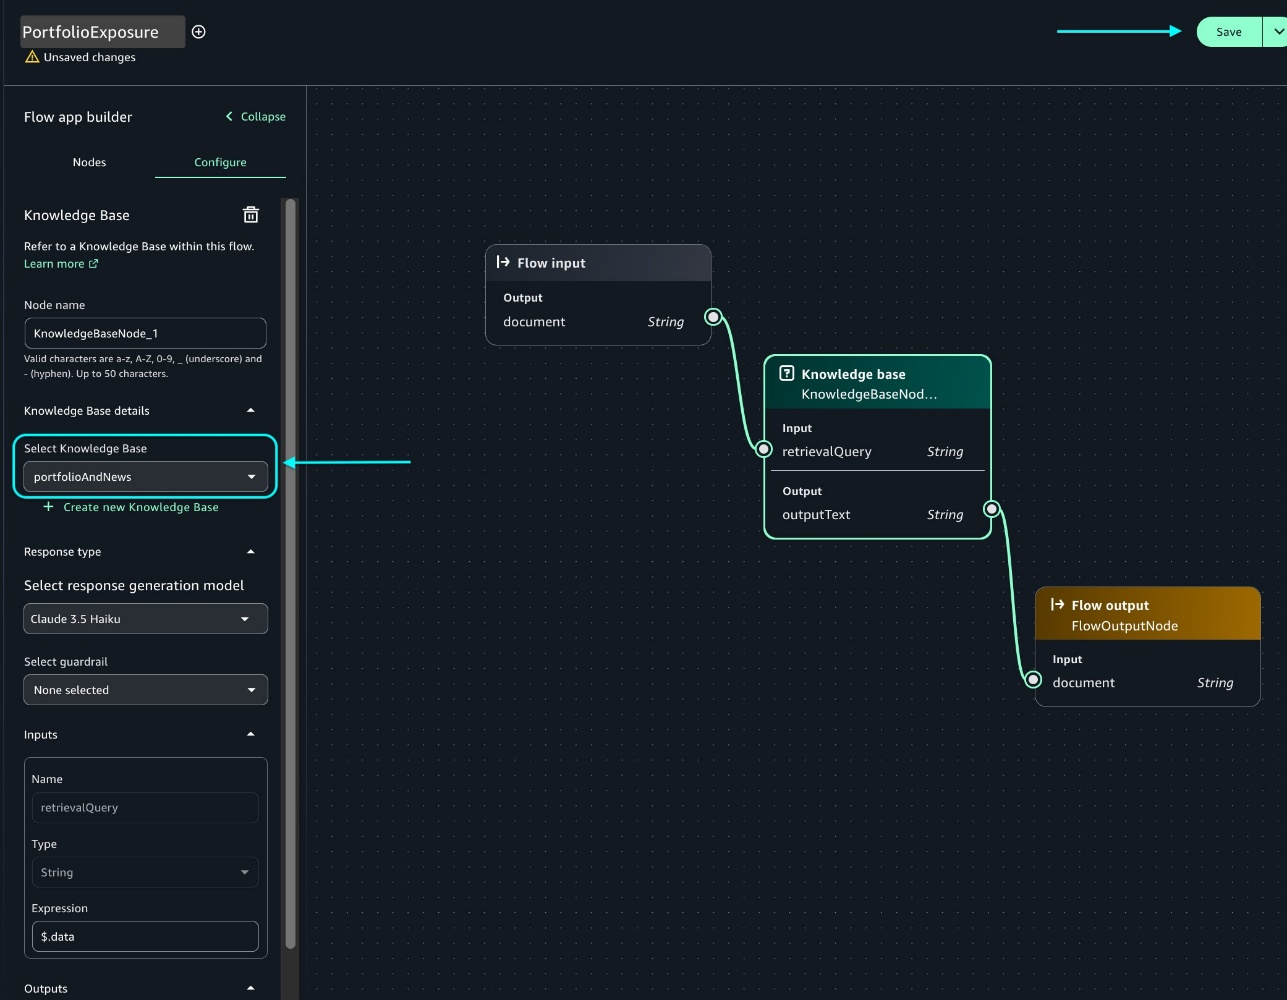
This is the simplest configuration, where one project profile is mapped to a single account pool. In the following steps, we create a project profile for the Corporate HR team and tie it to the HR account pool:
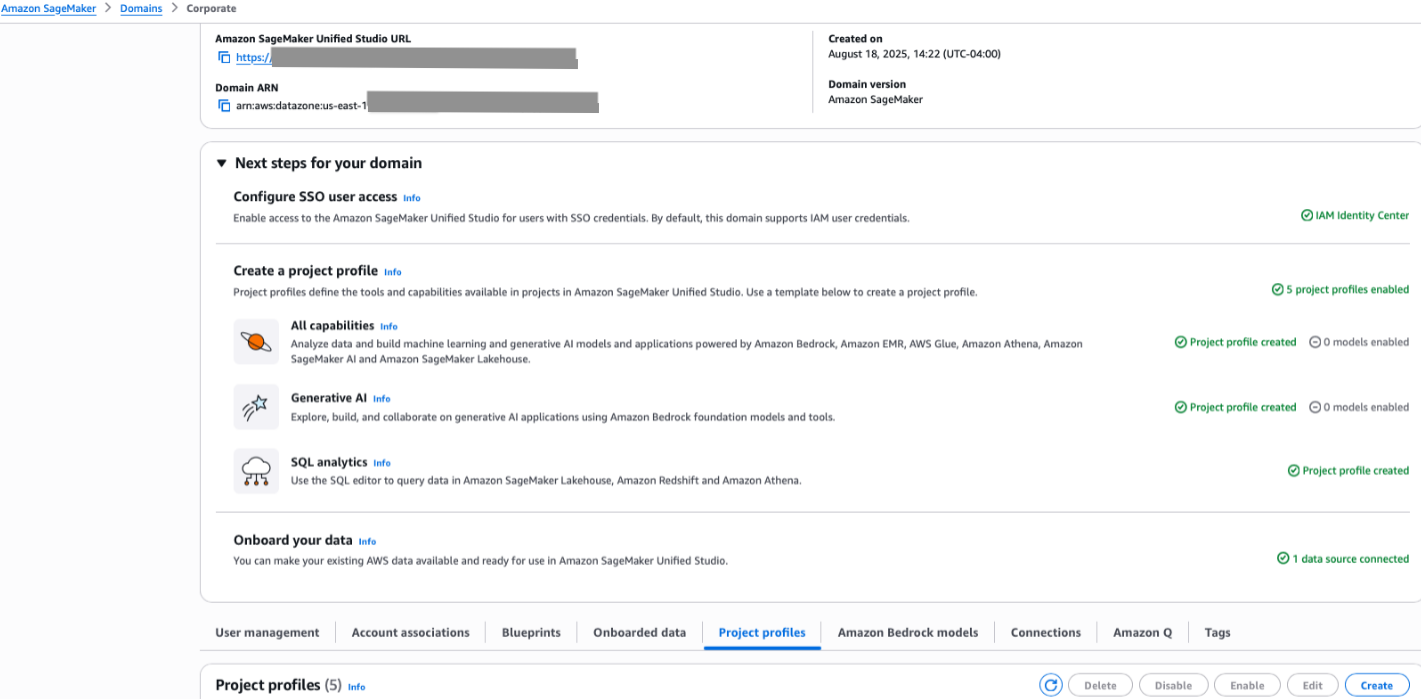
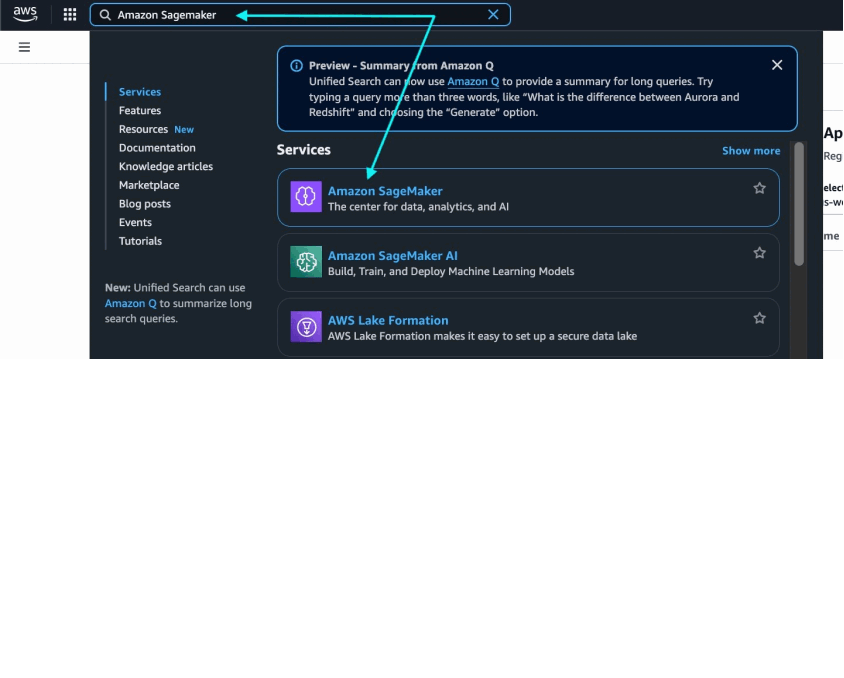
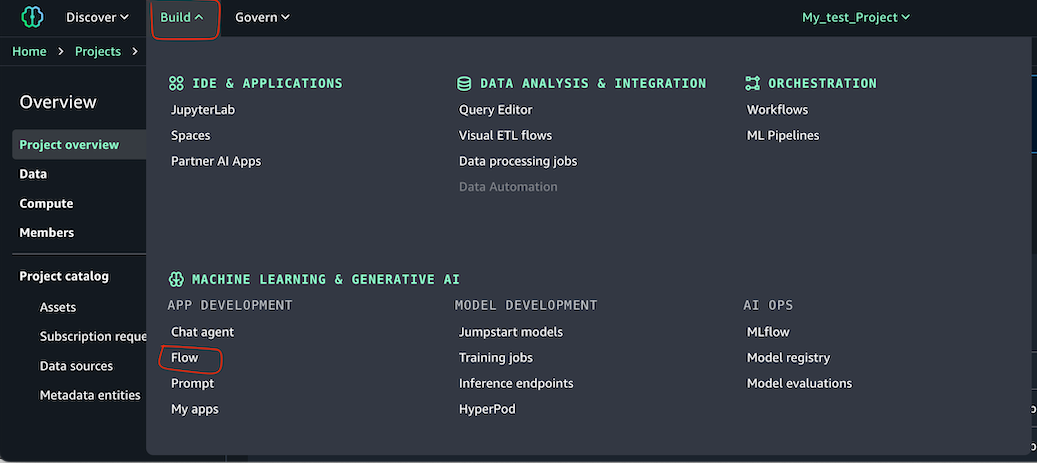
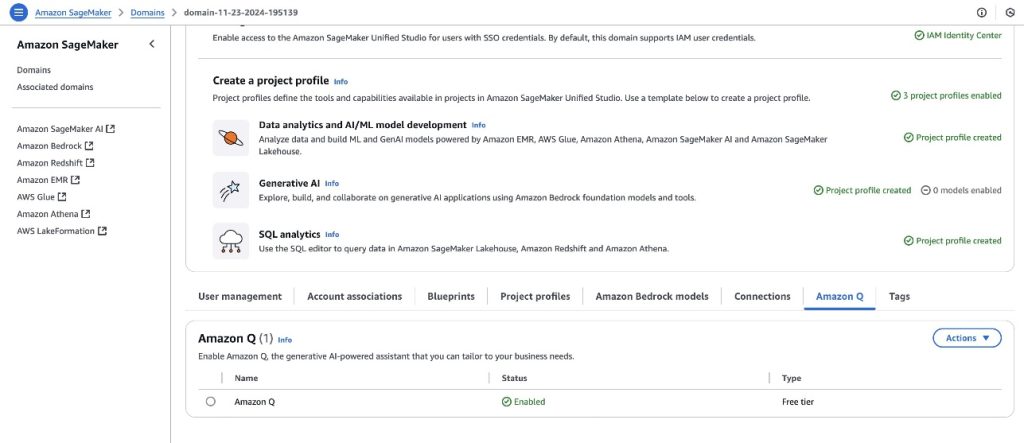
- On the SageMaker console, choose Domains in the navigation pane.
- On the Project profiles tab, choose Create.

- Enter a name and description for your profile.
- Choose an appropriate project profile template that aligns with your project’s needs.
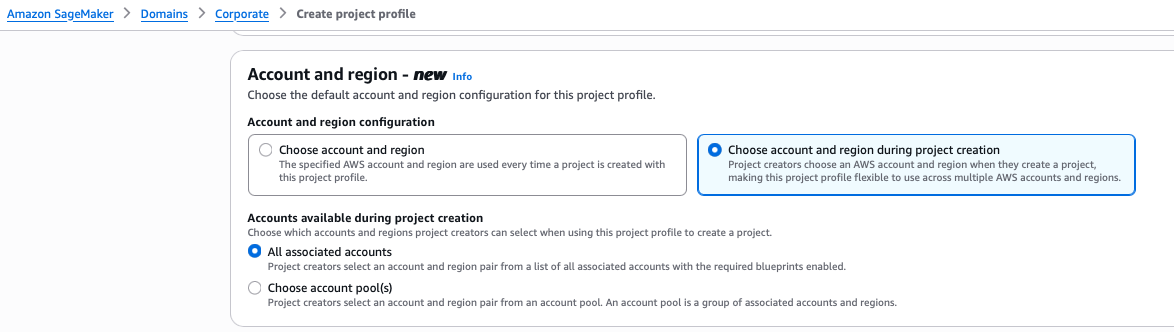
- Select Choose account and region during project creation.
- Select Choose account pool(s) and choose the account pool you created for the HR team.
- Leave the remaining settings as default and choose Create project profile.
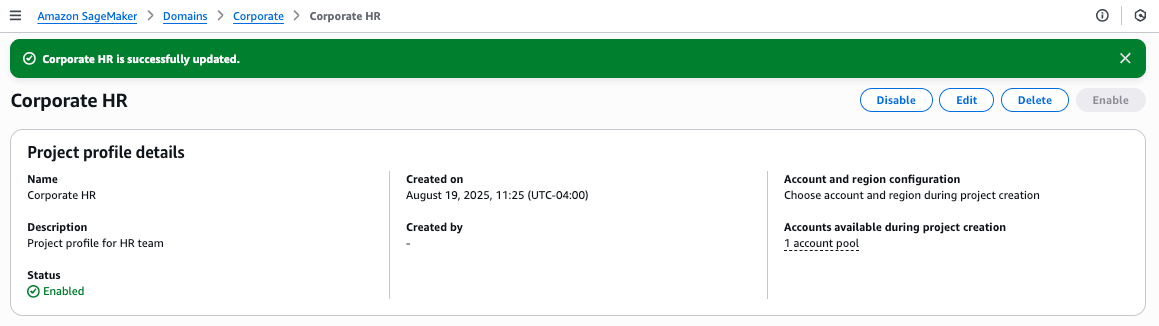
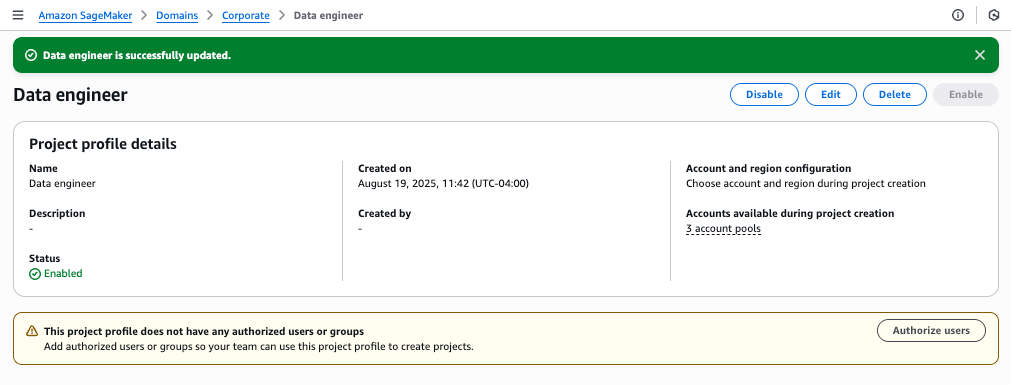
- On the project details page, choose Enable to activate your profile.
- Choose Enable in the confirmation pop-up to proceed.

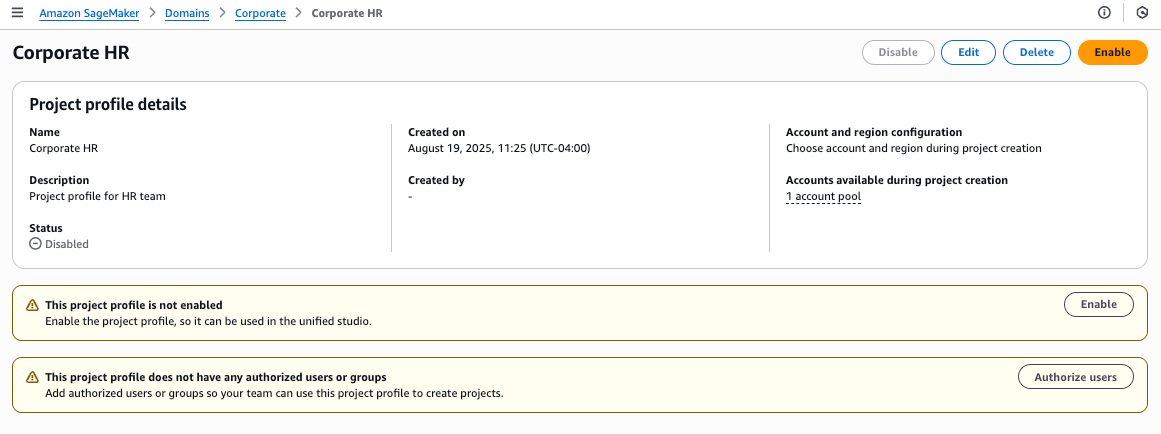
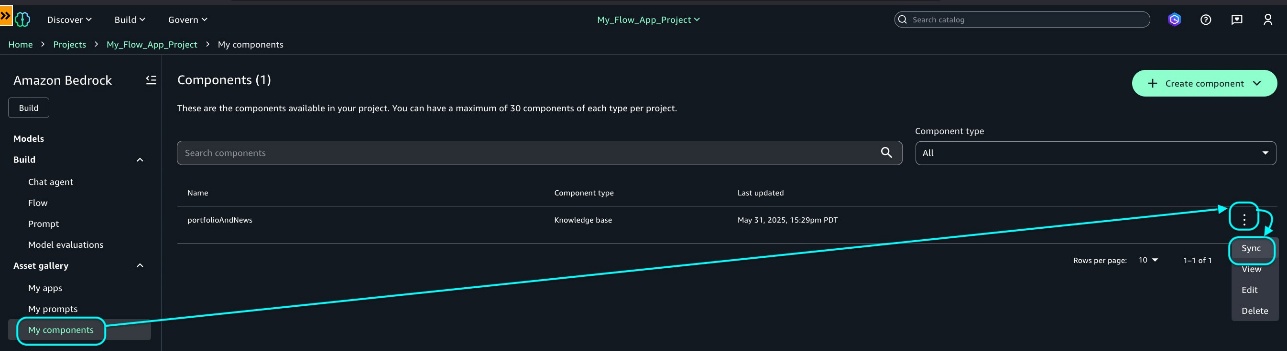
You will see a success message confirming that the Corporate HR profile has been created and linked to one account pool.
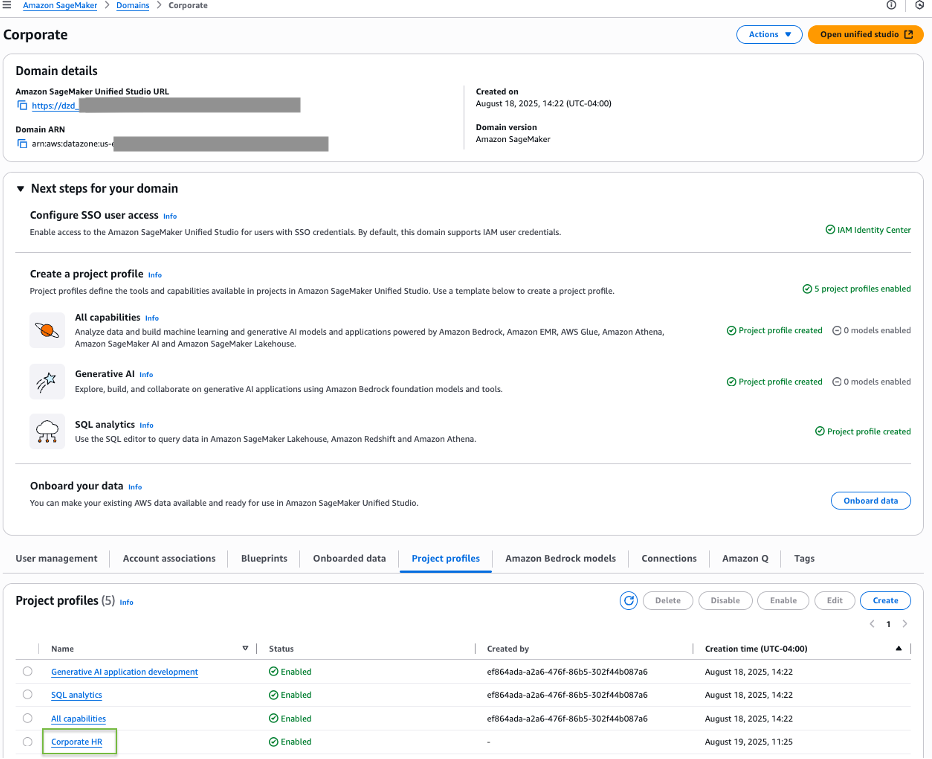
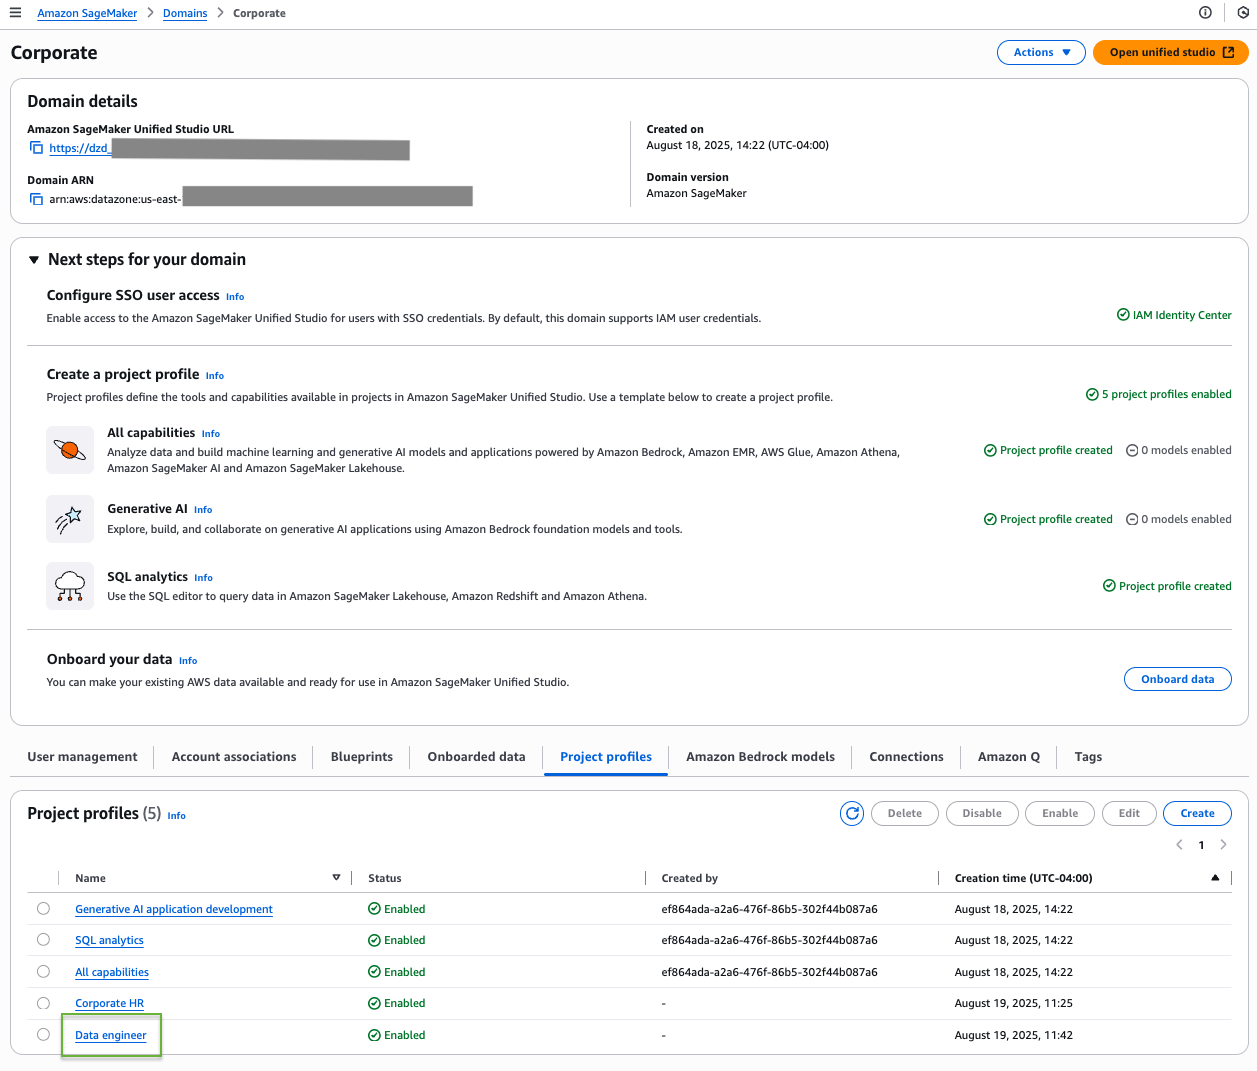
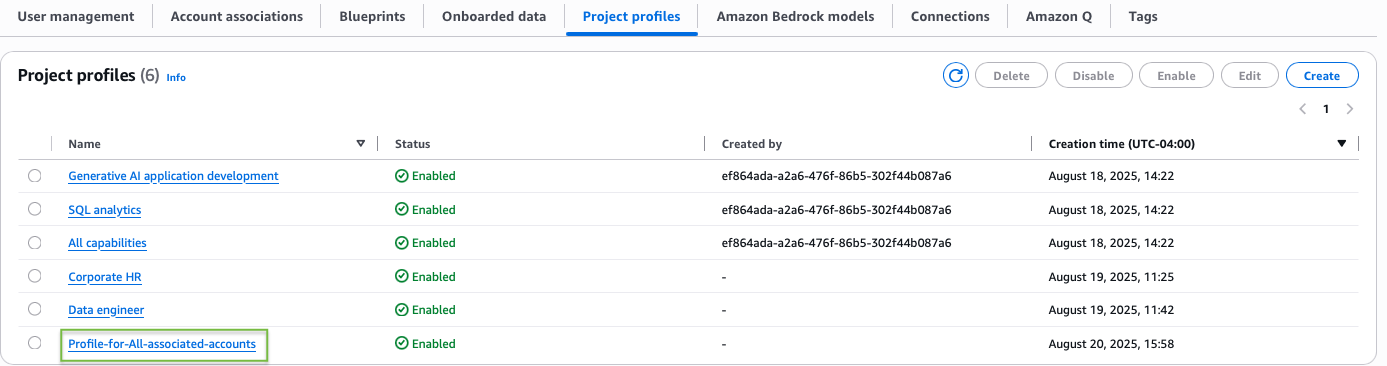
On the Project profiles tab, you should now see your newly created Corporate HR profile listed among the available project profiles.
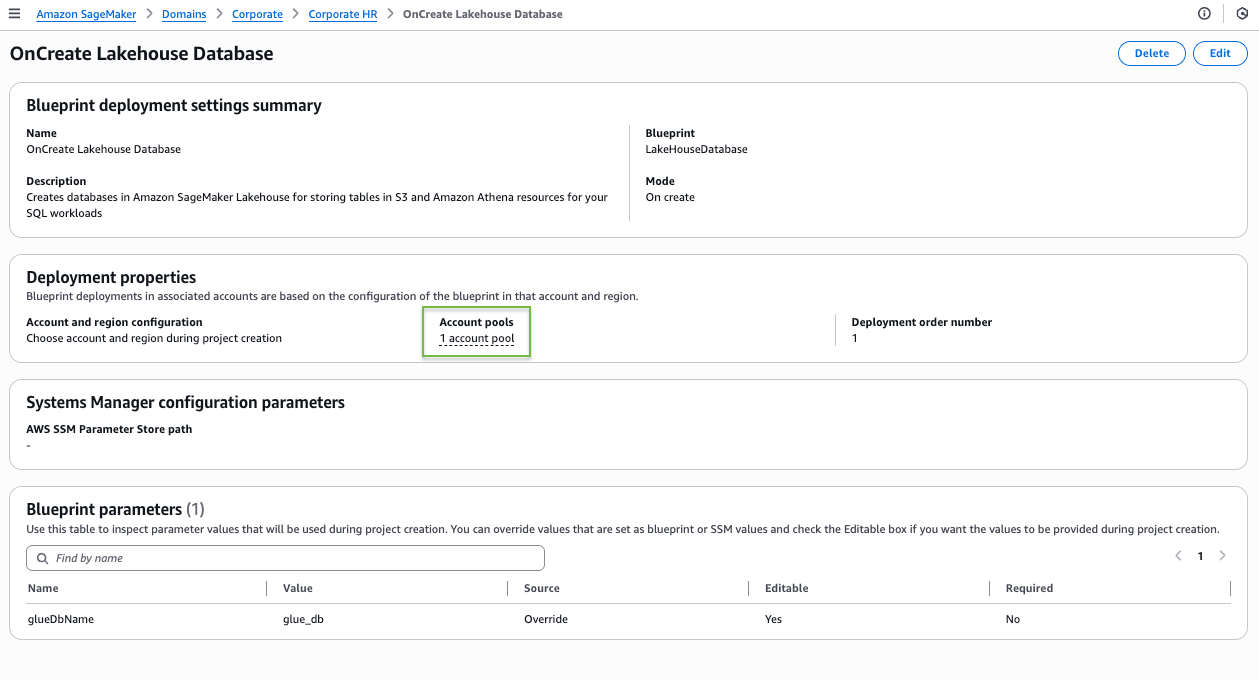
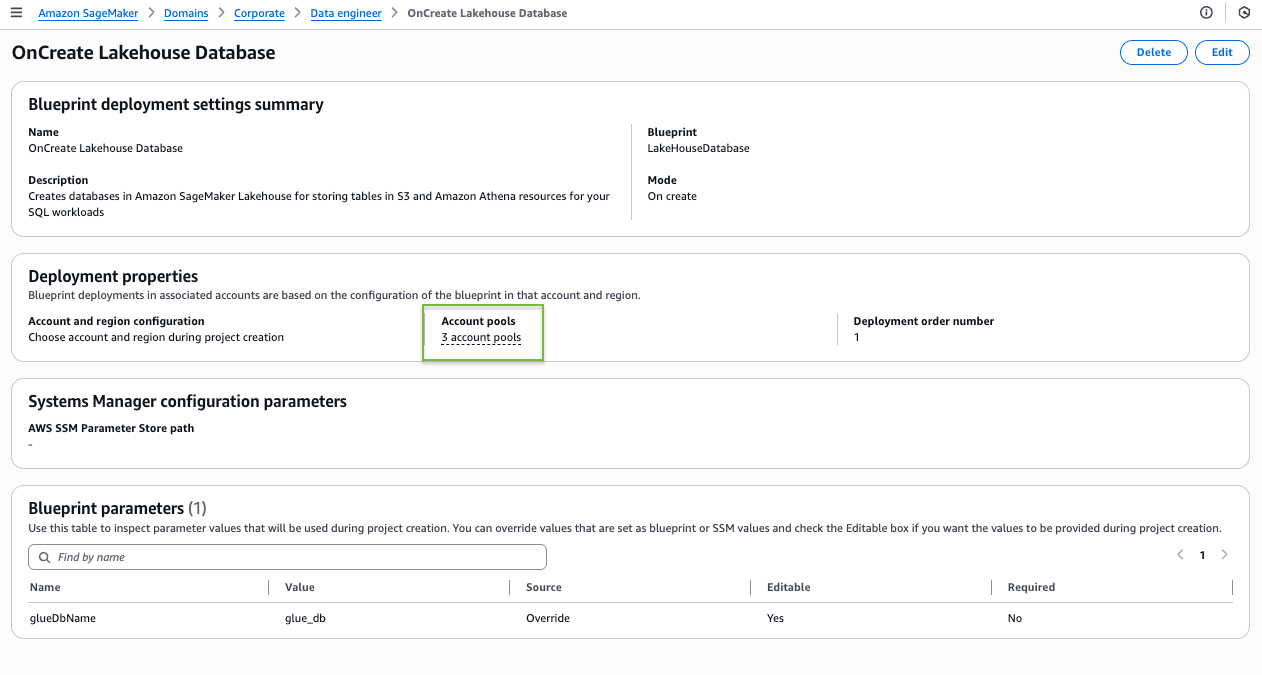
To explore further, navigate to the Corporate HR project profile and choose the Blueprints tab to see a list of available blueprints. Choose a blueprint to view its details.
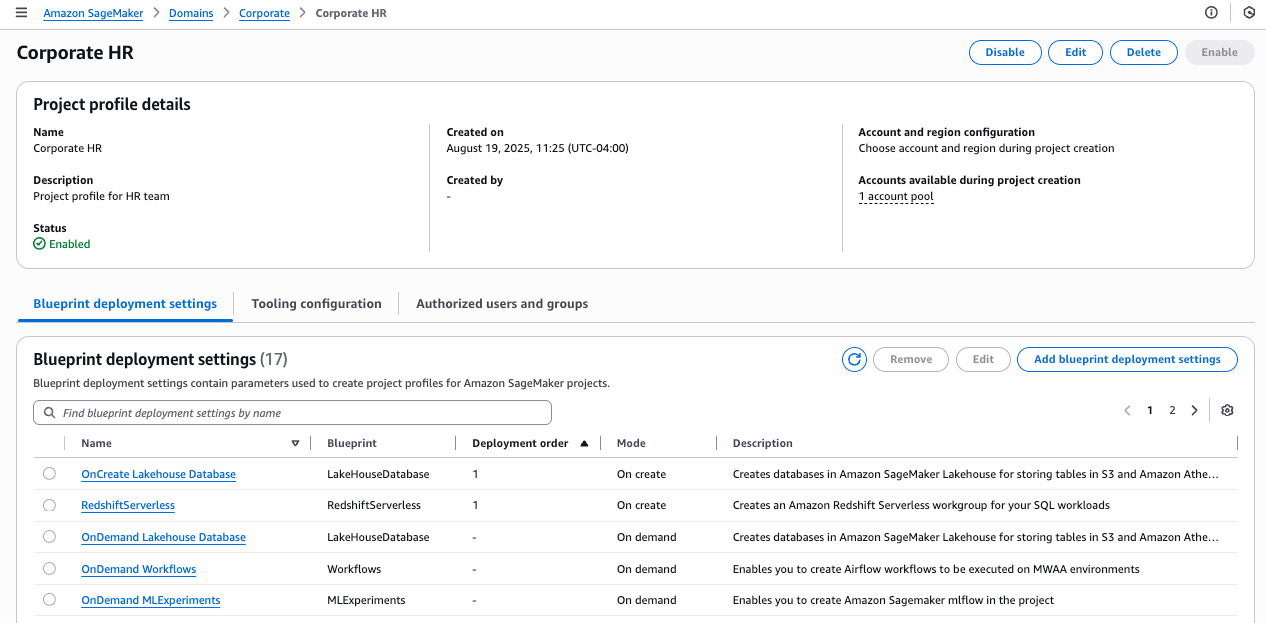
On the blueprint details page, the blueprint shows as deployable to the single account pool you associated with this project profile.
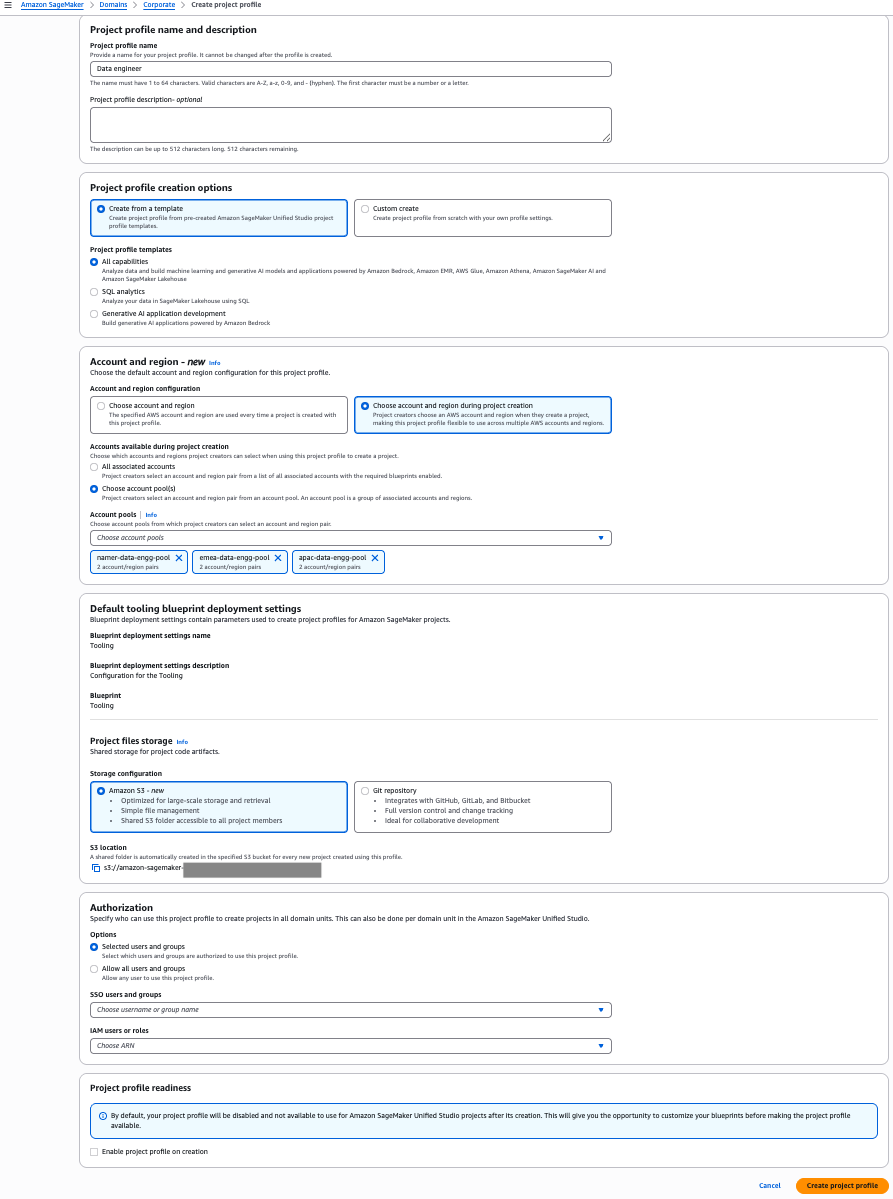
Scenario 2: Project profile associated with multiple account pools
In this example, we create a project profile for a global Data Engineering team, connecting it to three Regional account pools: NAMER (North America), APAC (Asia Pacific), and EMEA (Europe, Middle East, and Africa). Complete the following steps:
- On the SageMaker console, choose Domains in the navigation pane.
- On the Project profiles tab, choose Create.
- Enter a name and description for your profile.
- Choose an appropriate project profile template that aligns with your project’s needs.
- Select Choose account and region during project creation.
- Select Choose account pool(s) and choose all three Regional pools:
- NAMER Data Engineering team
- EMEA Data Engineering team
- APAC Data Engineering team
- Leave the remaining settings as default and choose Create project profile.
- On the project details page, choose Enable to activate your profile.
- Choose Enable in the confirmation pop-up to proceed.
You will see a success message confirming the Data Engineer profile creation. The profile will show connections to all three Regional account pools.
You can find your new profile listed on the Project profiles tab.
Navigate to your project profile and choose the Blueprints tab to see a list of available blueprints. Choose a blueprint to view its details.
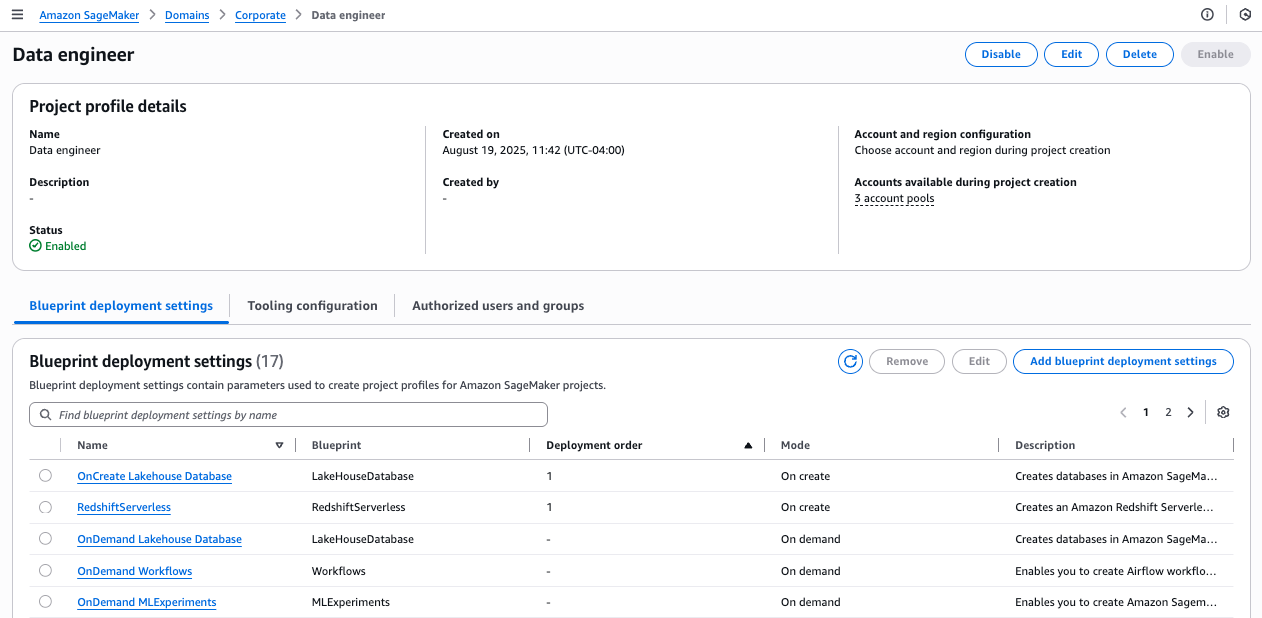
On the blueprint details page, the blueprint shows as deployable to the three account pools you associated with this project profile.
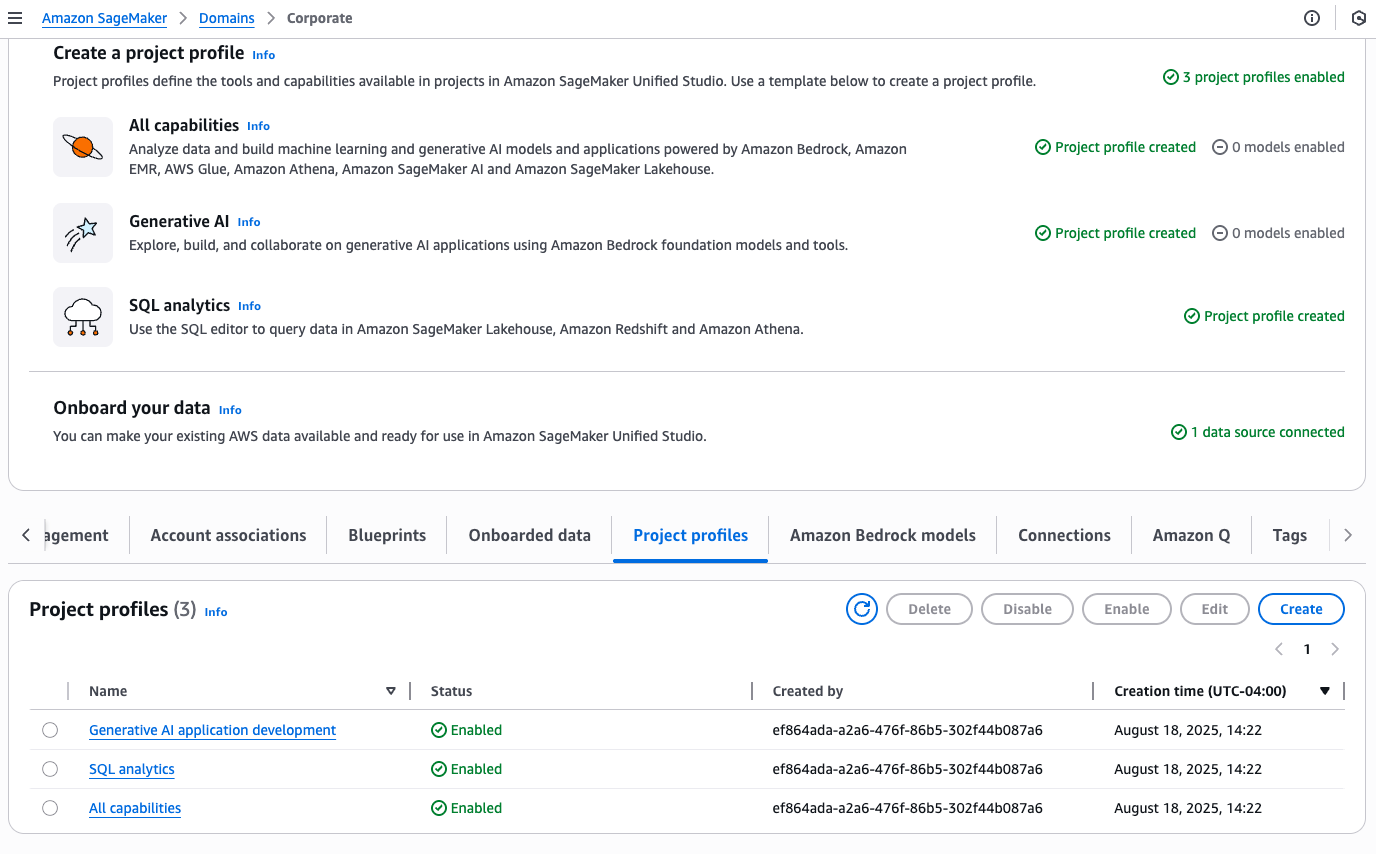
Scenario 3: Project profile with all associated accounts
In this scenario, we create a project profile linked to all the associated accounts for this domain. Complete the following steps:
- On the SageMaker console, choose Domains in the navigation pane.
- On the Project profiles tab, choose Create.
- Enter a name and description for your profile.
- Choose an appropriate project profile template that aligns with your project’s needs.
- Select Choose account and region during project creation.
- Select All associated accounts.
- Leave the remaining settings as default and choose Create project profile.
You can find your new profile listed on the Project profiles tab.
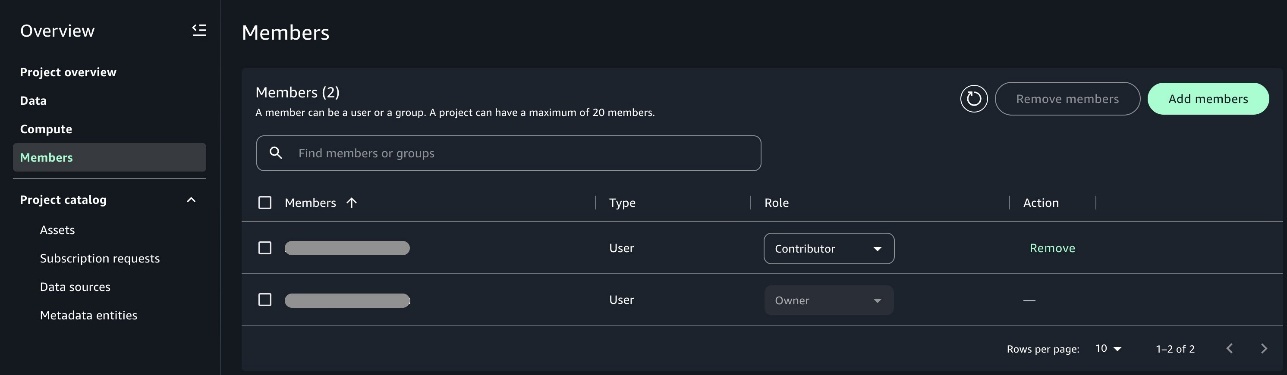
Project owner tasks
Now that the administrator has created project profiles for the account pools, project owners can log in to SageMaker to create projects for their account pools. In this section, we demonstrate the procedure to create a project using an account-agnostic project profile with a single account pool. You can use the same procedure to create projects using an account-agnostic project profile with multiple account pools.
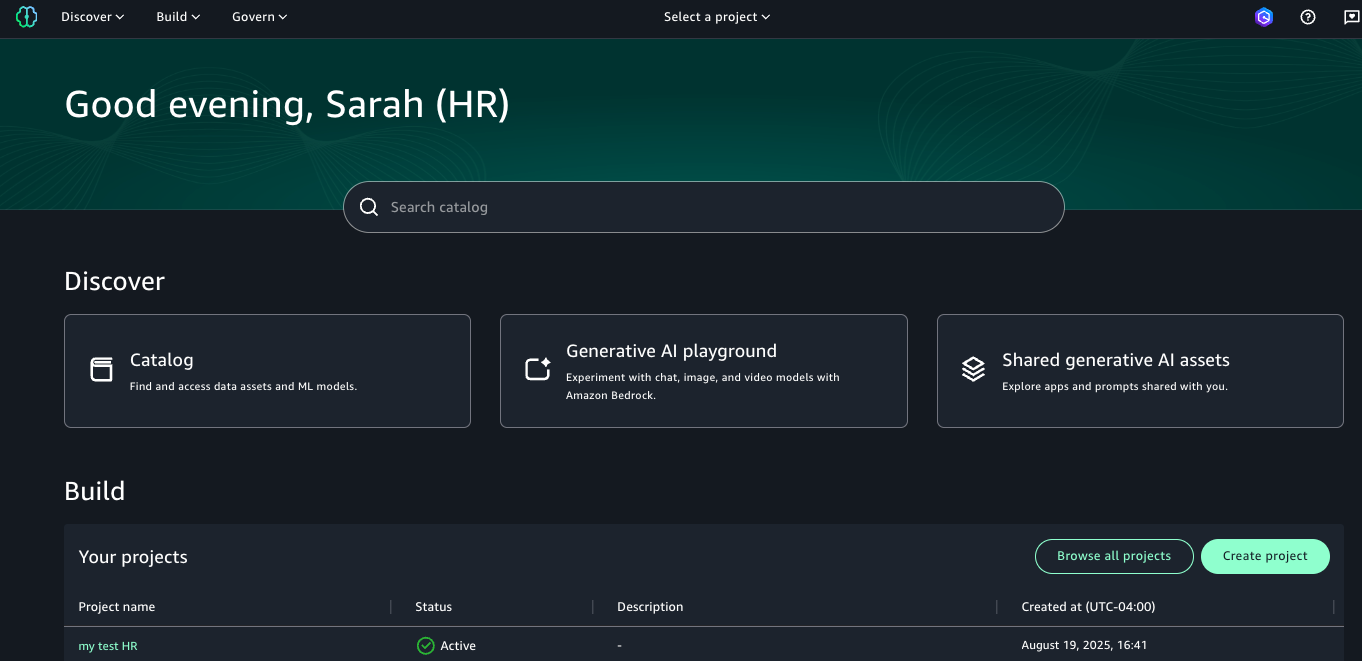
For this scenario, Sarah from HR will create a project for the HR team, using the Corporate HR team profile that is associated with the HR account pool.
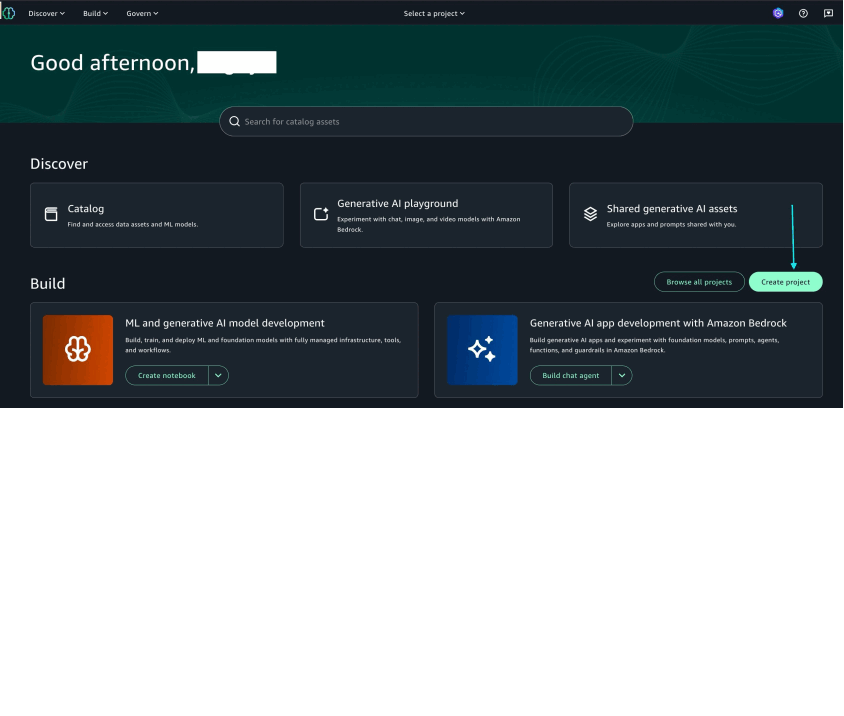
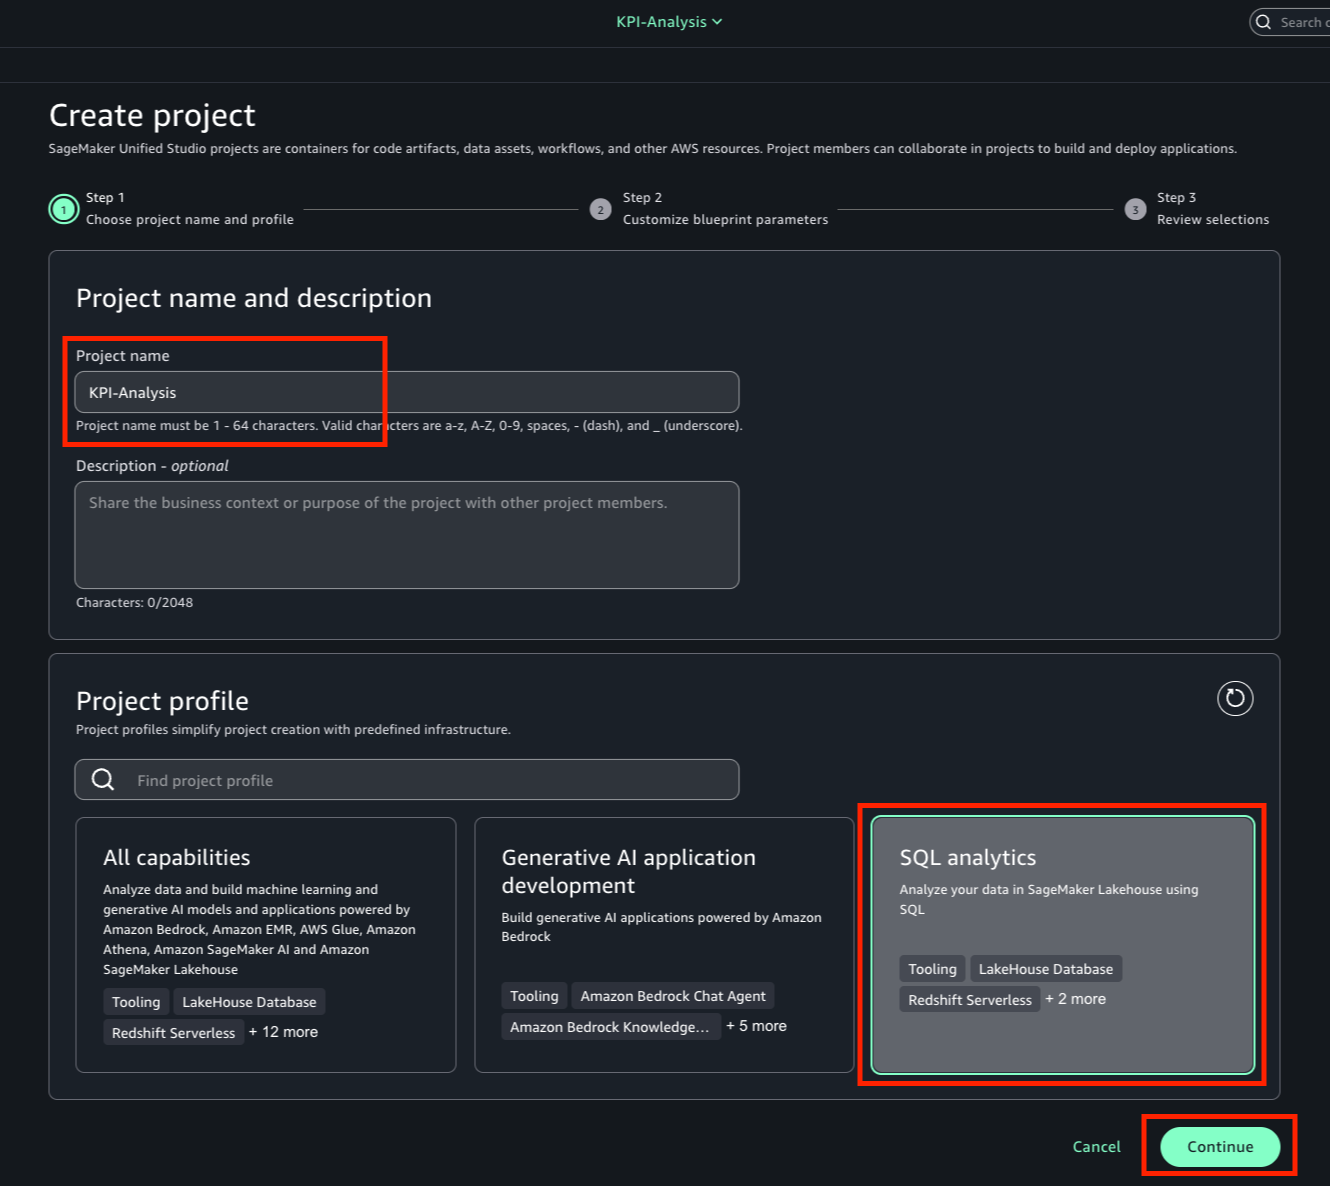
- On the SageMaker portal, choose Create project.
- Enter a name and optional description.
- Choose the Corporate HR project profile.
- Choose Continue.
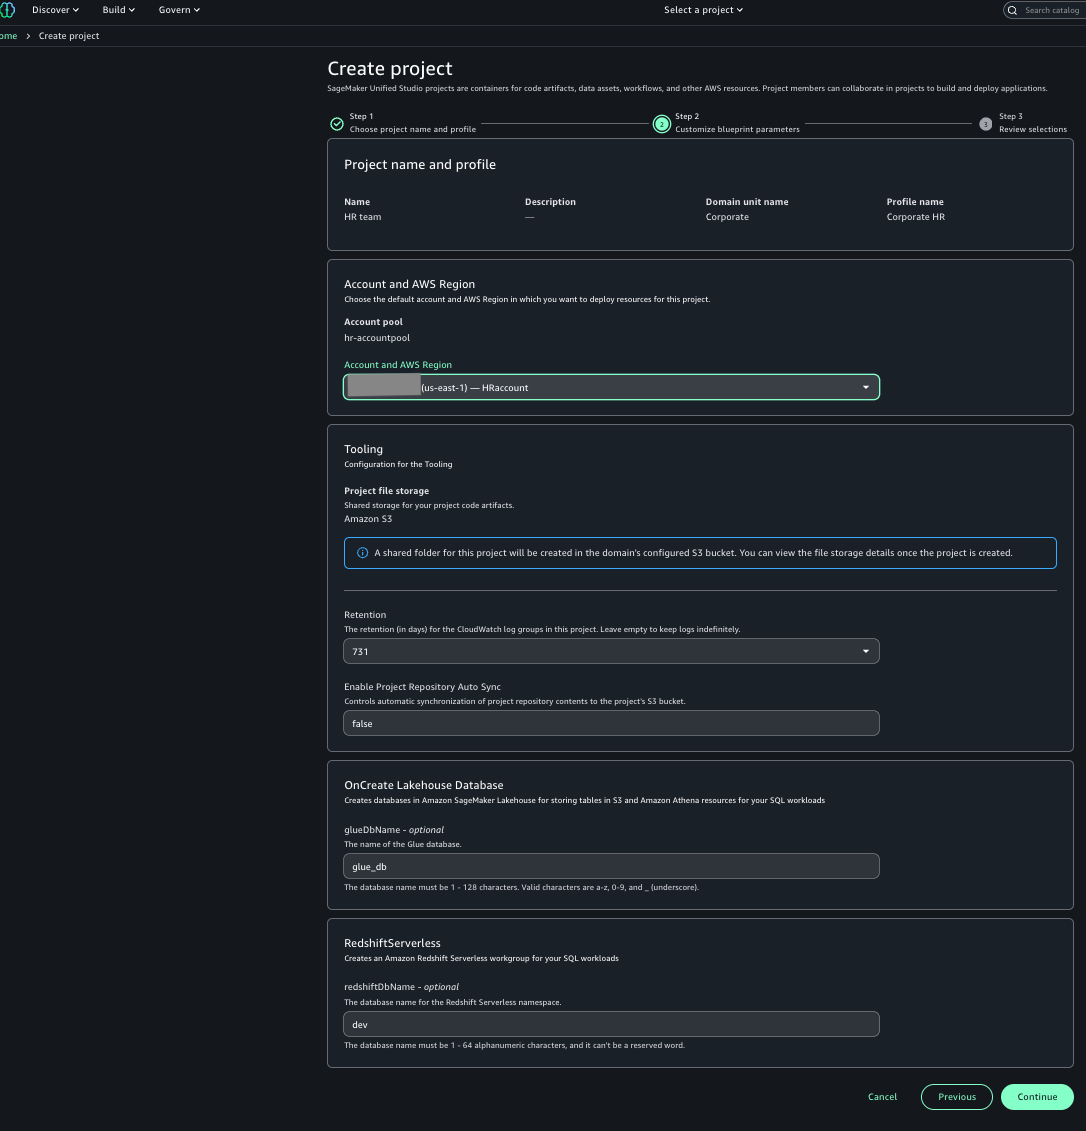
- For Account and AWS Region, choose the HR account.
- Choose Continue.
- Review the information and choose Create project.
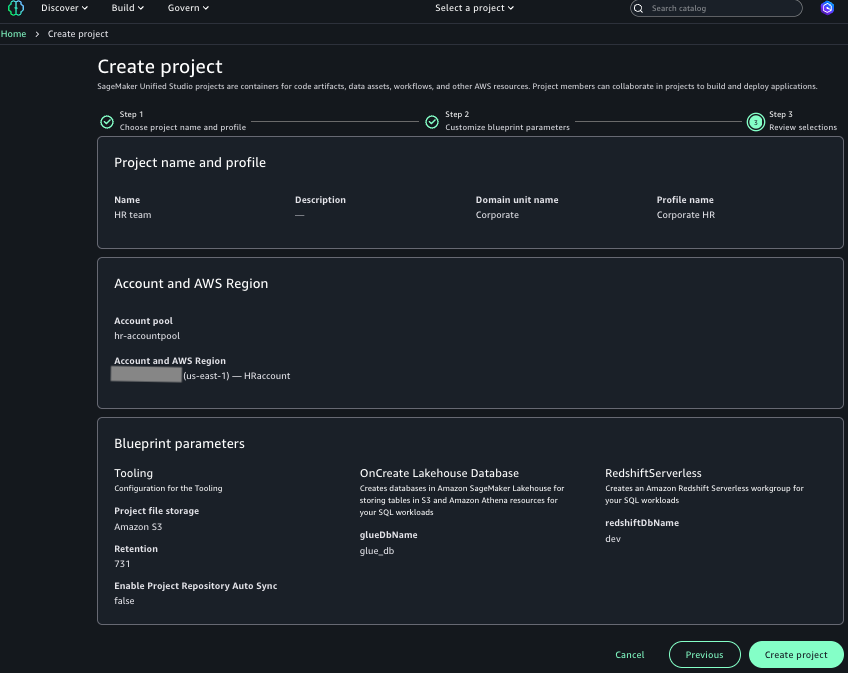
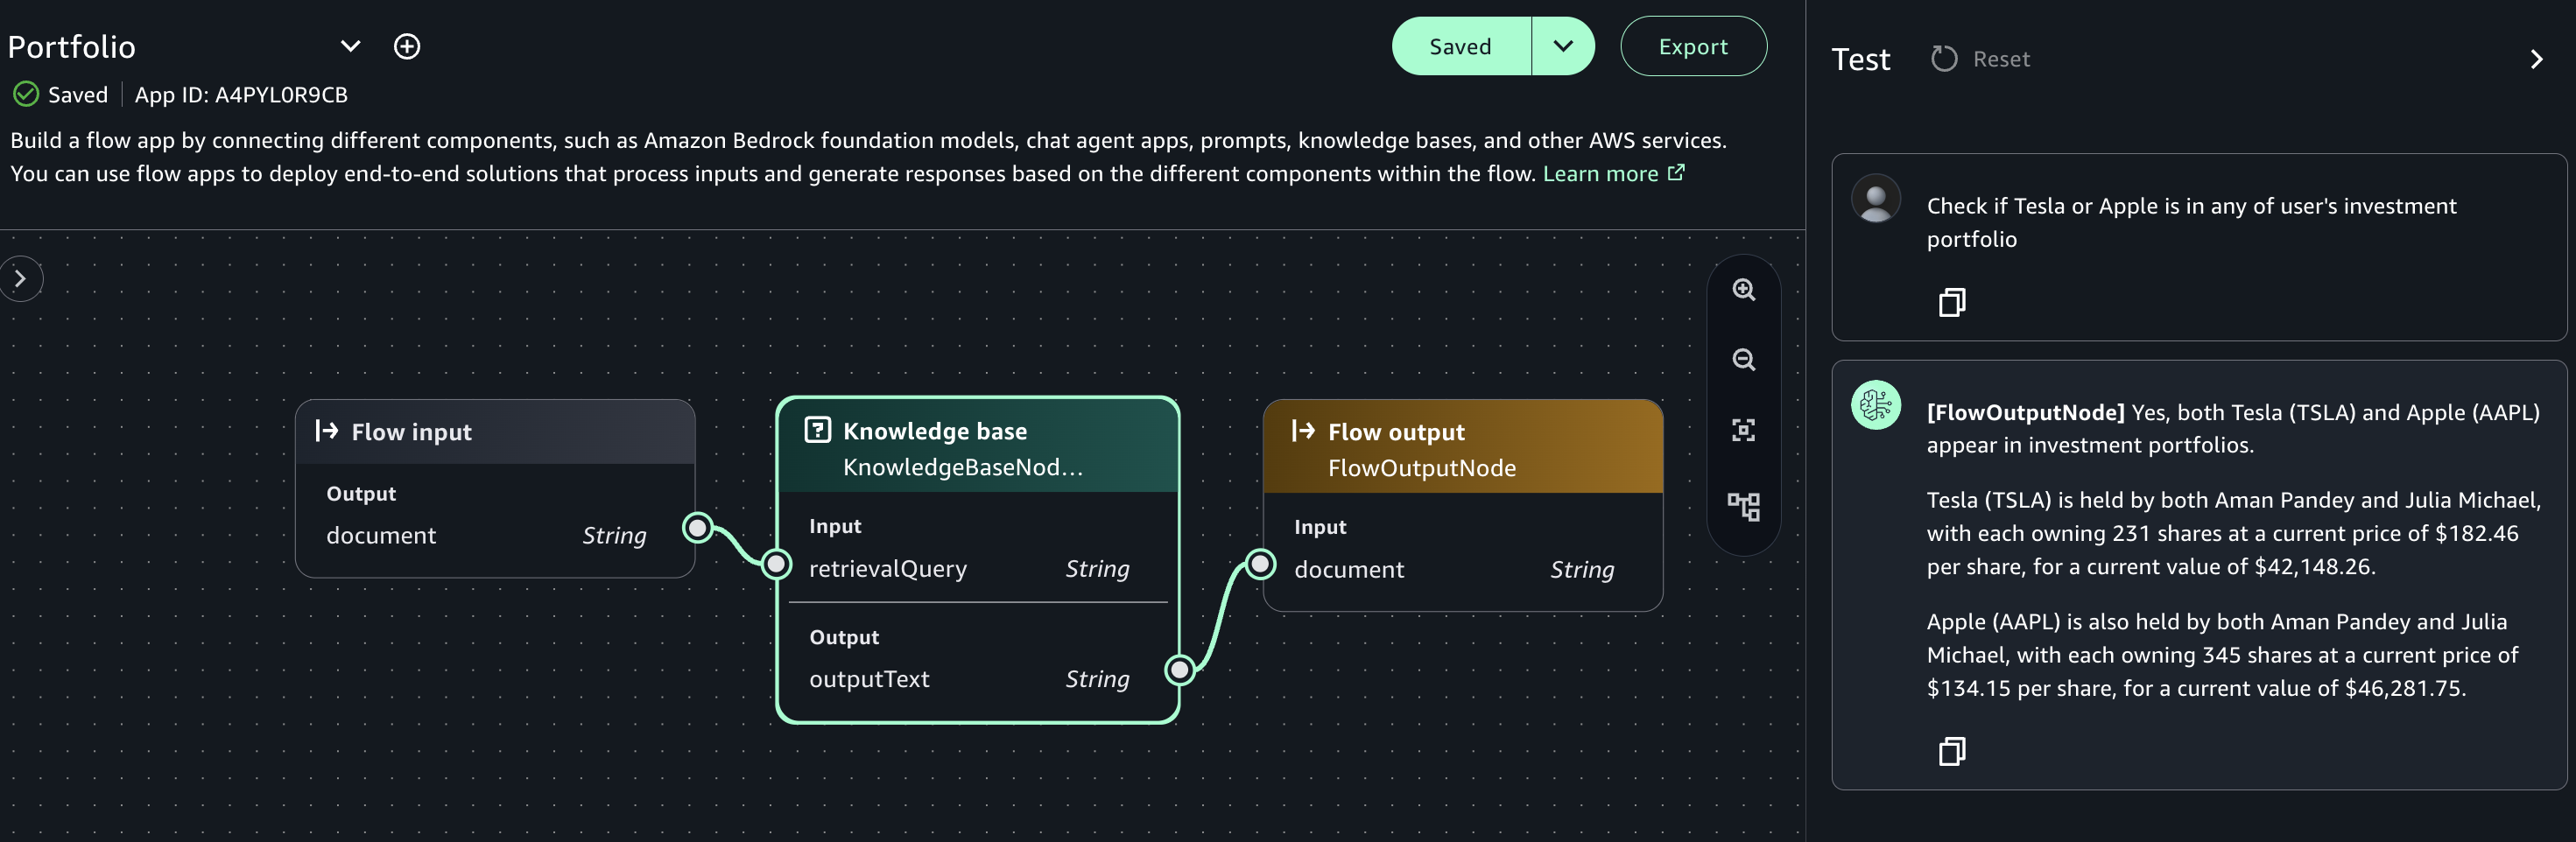
You can view the successfully created project.
Clean up
To clean up resources, complete the following steps:
- Delete the projects using the AWS CLI:
- Delete the account pools:
Conclusion
In this post, we discussed how account-agnostic project profiles can help organizations simplify and streamline the management of SageMaker project creation while maintaining enhanced security and governance features. To learn more about account-agnostic project profiles in SageMaker, refer to Account pools in Amazon SageMaker Unified Studio, and demo: account-agnostic project profile in Amazon SageMaker.
 Nikki Rouda works in product marketing at AWS. He has many years experience across a wide range of IT infrastructure, storage, networking, security, IoT, analytics, and modern applications.
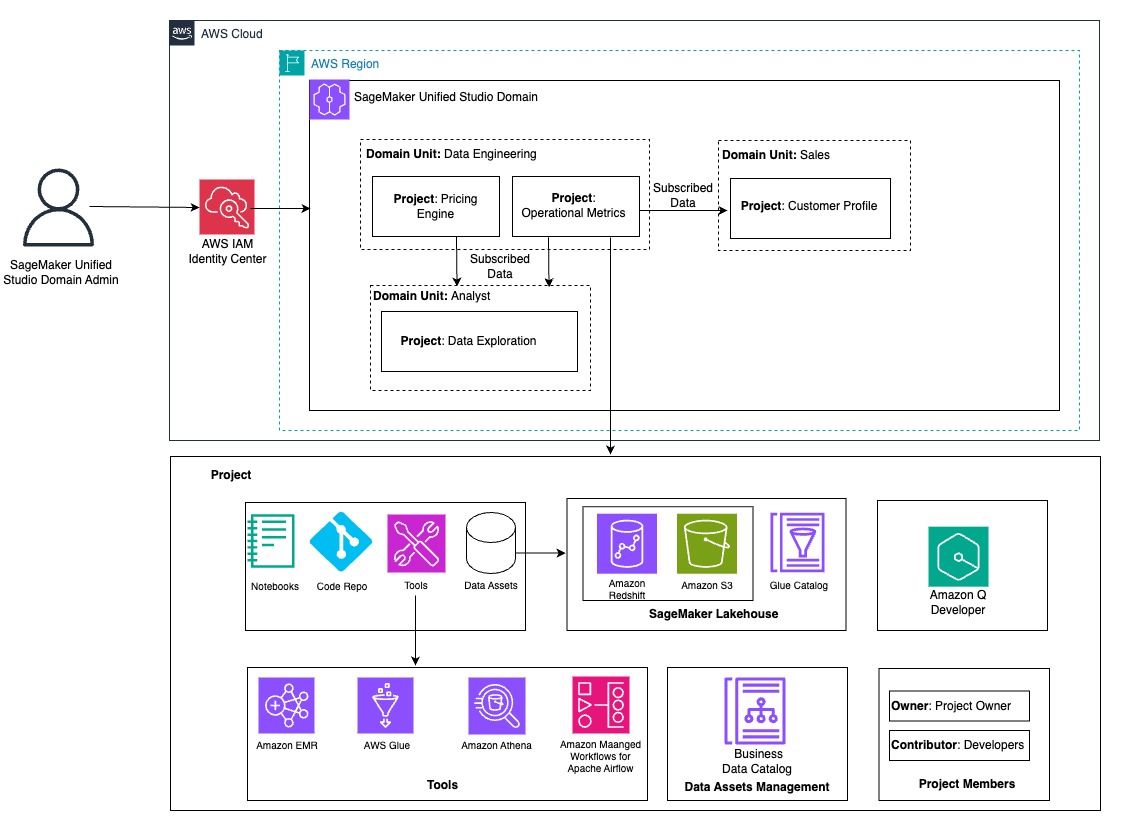
 Mitesh Patel is a Principal Solutions Architect at AWS. His passion is helping customers harness the power of Analytics, Machine Learning, AI & GenAI to drive business growth. He engages with customers to create innovative solutions on AWS.
 Raj Samineni is the Director of Data Engineering at ATPCO, leading the creation of advanced cloud-based data platforms. His work ensures robust, scalable solutions that support the airline industry’s strategic transformational objectives. By leveraging machine learning and AI, Raj drives innovation and data culture, positioning ATPCO at the forefront of technological advancement.
 Saurabh Rawat is a Solution Architect at AWS with 13 years of experience working with enterprise data systems. He has designed and delivered large-scale, cloud-native solutions for customers across industries, with a focus on data engineering, analytics, and well-architected architectures. Over his career, he has helped organizations modernize their data platforms, optimize for performance, and cost, and adopt best practices for scalability and security. Outside of work, he is a passionate musician and enjoys playing with his band.
 Nadeem Bulsara is a Principal Solutions Architect at AWS specializing in Genomics and Life Sciences. He brings his 13+ years of Bioinformatics, Software Engineering, and Cloud Development skills as well as experience in research and clinical genomics and multi-omics to help Healthcare and Life Sciences organizations globally. He is motivated by the industry’s mission to enable people to have a long and healthy life.
 Chaitanya Vejendla is a Senior Solutions Architect specialized in DataLake & Analytics primarily working for Healthcare and Life Sciences industry division at AWS. Chaitanya is responsible for helping life sciences organizations and healthcare companies in developing modern data strategies, deploy data governance and analytical applications, electronic medical records, devices, and AI/ML-based applications, while educating customers about how to build secure, scalable, and cost-effective AWS solutions. His expertise spans across data analytics, data governance, AI, ML, big data, and healthcare-related technologies.
 Dr. Mileidy Giraldo has over 20 years of experience bridging bioinformatics, research, and industry technology strategy. She specializes in making technology accessible for organizations in the life sciences sector. In her current role as WW Lead for Life Sciences Strategy and Lab of the Future at AWS, she helps biotechs, biopharma, and diagnostics organizations design Data & AI-driven initiatives that modernize labs and help scientists unlock the full value of their data.
 Chris Clark is a Senior Solutions Architect focused on helping Life Science customers leverage AWS technology to advance their operational capabilities. With 20+ years of hands-on experience in life sciences manufacturing and supply chain, he combines deep industry knowledge with his AWS expertise to guide his customers. When he’s not working to solve customer challenges, he enjoys cycling and building and repairing things in his workshop.
 Nick Furr is a Specialist Solutions Architect at AWS, supporting Data & Analytics for Healthcare and Life Sciences. He helps providers, payers, and life sciences organizations build secure, scalable data platforms to drive innovation and improve outcomes. His work focuses on modernizing data strategies through cloud analytics, governed data processing, and machine learning for use cases like clinical research and population health.
 Subrat Das is a Principal Solutions Architect for Global Healthcare and Life Sciences accounts at AWS. He is passionate about modernizing and architecting complex customers workloads. When he’s not working on technology solutions, he enjoys long hikes and traveling around the world.
 Amit Maindola is a Senior Data Architect focused on data engineering, analytics, and AI/ML at Amazon Web Services. He helps customers in their digital transformation journey and enables them to build highly scalable, robust, and secure cloud-based analytical solutions on AWS to gain timely insights and make critical business decisions.
 Arghya Banerjee is a Sr. Solutions Architect at AWS in the San Francisco Bay Area, focused on helping customers adopt and use the AWS Cloud. He is focused on big data, data lakes, streaming and batch analytics services, and generative AI technologies.
 Melody Yang is a Principal Analytics Architect for Amazon EMR at AWS. She is an experienced analytics leader working with AWS customers to provide best practice guidance and technical advice in order to assist their success in data transformation. Her areas of interests are open-source frameworks and automation, data engineering and DataOps.
 Gaurav Parekh is a Solutions Architect at AWS, specializing in generative AI and data analytics, with extensive experience building production AI systems on AWS.

 Mohit Dawar is a Senior Software Engineer at Amazon Web Services (AWS) working on Amazon DataZone. Over the past 3 years, he has led efforts around the core metadata catalog, generative AI–powered metadata curation, and lineage visualization. He enjoys working on large-scale distributed systems, experimenting with AI to improve user experience, and building tools that make data governance feel effortless. Connect with him on LinkedIn:
  Jose Romero is a Senior Solutions Architect for Startups at Amazon Web Services (AWS) based in Austin, TX, US. He is passionate about helping customers architect modern platforms at scale for data, AI, and ML. As a former senior architect in AWS Professional Services, he enjoys building and sharing solutions for common complex problems so that customers can accelerate their cloud journey and adopt best practices. Connect with him on LinkedIn:
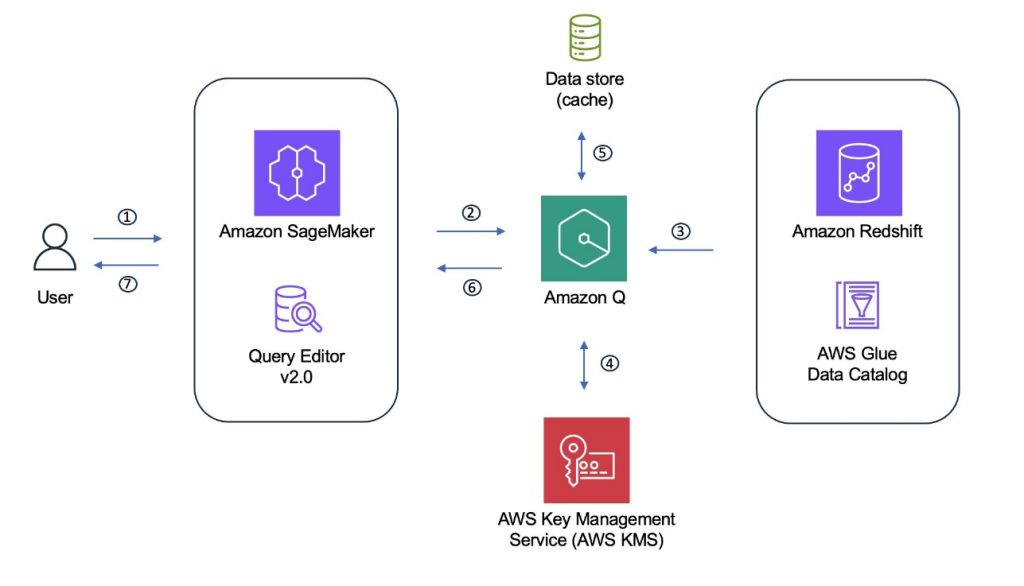
 Gregory Knowles is a data and AI specialist solution architect at AWS, focusing on the UK public sector. With extensive experience in cloud-based architectures, Greg guides public sector customers in implementing modern data solutions. His expertise spans governance, analytics, and AI/ML. Greg’s passion lies in accelerating transformation and innovation to improve productivity and outcomes. He has successfully led projects that moved data systems into the cloud, adopted new data architectures, and implemented AI at scale in production.
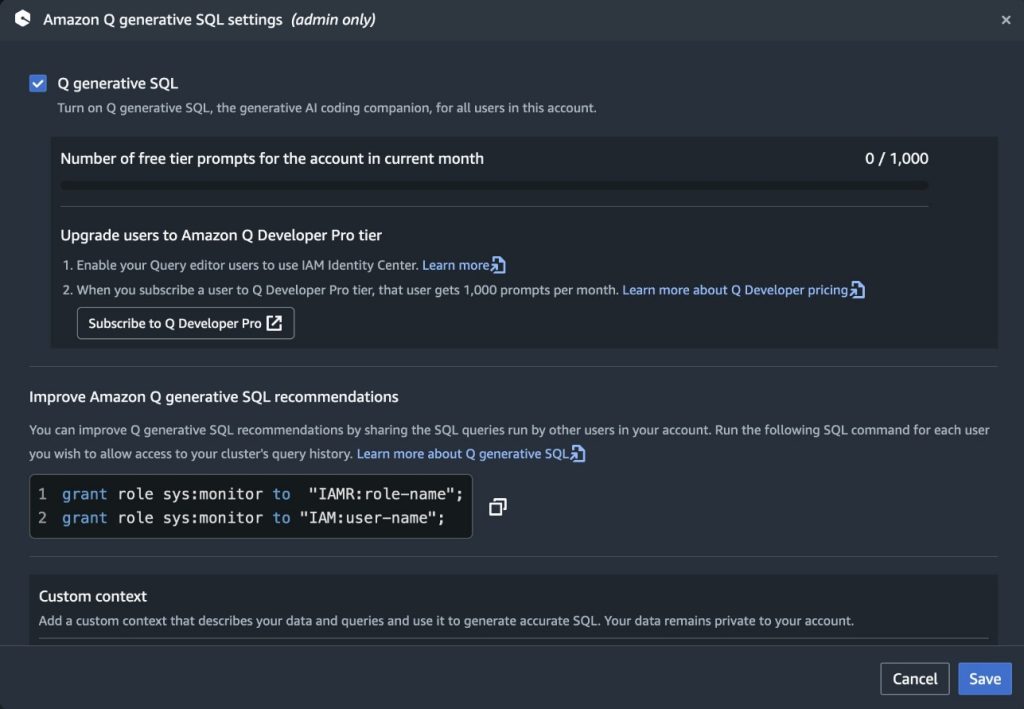
 Abhinav Tripathy is a Software Engineer and Security Guardian at AWS, where he develops Amazon Q generative SQL by combining machine learning, databases, and web systems. Abhinav is passionate about building scalable web systems from scratch that solve real customer challenges. Outside of work, he enjoys traveling, watching soccer, and playing badminton.
 Erol Murtezaoglu is a Technical Product Manager at AWS, is an inquisitive and enthusiastic thinker with a drive for self-improvement and learning. He has a strong and proven technical background in software development and architecture, balanced with a drive to deliver commercially successful products. Erol highly values the process of understanding customer needs and problems, in order to deliver solutions that exceed expectations.


 Chiho Sugimoto is a Cloud Support Engineer on the AWS Big Data Support team. She is passionate about helping customers build data lakes using ETL workloads. She loves planetary science and enjoys studying the asteroid Ryugu on weekends.
 Noritaka Sekiyama is a Principal Big Data Architect at the AWS Analytics product team. He’s responsible for designing new features in AWS products, building software artifacts, and providing architecture guidance to customers. In his spare time, he enjoys cycling on his road bike.
 Matt Su is a Senior Product Manager on the AWS Glue team. He enjoys helping customers uncover insights and make better decisions using their data with AWS Analytics services. In his spare time, he enjoys skiing and gardening.


 Naohisa Takahashi is a Senior Cloud Support Engineer on the AWS Support Engineering team. He supports customers resolve technical issues and launch systems. In his spare time, he plays board games with his friends.
 Noritaka Sekiyama is a Principal Big Data Architect with AWS Analytics services. He’s responsible for building software artifacts to help customers. In his spare time, he enjoys cycling on his road bike.
 Iris Tian is a UX designer on the Amazon SageMaker Unified Studio team. She designs intuitive, end-to-end experiences that simplify and streamline workflows across data processing and orchestration. In her spare time, she enjoys snowboarding and visiting museums.
 Regan Baum is a Senior Software Development Engineer on the Amazon SageMaker Unified Studio team. She designs, implements, and maintains features that enable customers to manage their workflows in SageMaker Unified Studio. Outside of work, she enjoys hiking and running.
 Yuhang Huang is a Software Development Manager on the Amazon SageMaker Unified Studio team. He leads the engineering team to design, build, and operate scheduling and orchestration capabilities in SageMaker Unified Studio. In his free time, he enjoys playing tennis.
 Gal Heyne is a Senior Technical Product Manager for AWS Analytics services with a strong focus on AI/ML and data engineering. She is passionate about developing a deep understanding of customers’ business needs and collaborating with engineers to design simple-to-use data products.


 The following screenshot shows an example of the Spark UI.
  The following screenshot shows an example of the driver logs.
  The following screenshot shows the Executors tab, which provides access to the driver and executor logs.


 In the following example, we run some TPC-DS SQL statements that are used for performance and benchmarks:


 Amit Maindola is a Senior Data Architect focused on data engineering, analytics, and AI/ML at Amazon Web Services. He helps customers in their digital transformation journey and enables them to build highly scalable, robust, and secure cloud-based analytical solutions on AWS to gain timely insights and make critical business decisions.
 Abhilash is a senior specialist solutions architect at Amazon Web Services (AWS), helping public sector customers on their cloud journey with a focus on AWS Data and AI services. Outside of work, Abhilash enjoys learning new technologies, watching movies, and visiting new places.


 Enrique Salgado Hernández is a Senior Specialist Solutions Architect at AWS with more than 10 years of experience working in the cloud. He specializes in designing and implementing large-scale analytics architectures across various industry sectors. He is passionate about working with customers to solve their problems by supporting them during their cloud journey.
 Angel Conde Manjon is a Senior EMEA Data & AI PSA, based in Madrid. He previously worked on research related to data analytics and AI in diverse European research projects. In his current role, Angel helps partners develop businesses centered on data and AI.


 Jose Romero is a Senior Solutions Architect for Startups at AWS, based in Austin, Texas. He is passionate about helping customers architect modern platforms at scale for data, AI, and ML. As a former senior architect in AWS Professional Services, he enjoys building and sharing solutions for common complex problems so that customers can accelerate their cloud journey and adopt best practices. Connect with him on
  Priya Tiruthani is a Senior Technical Product Manager with Amazon SageMaker Catalog (Amazon DataZone) at AWS. She focuses on building products and their capabilities in data analytics and governance. She is passionate about building innovative products to address and simplify customers’ challenges in their end-to-end data journey. Outside of work, she enjoys being outdoors to hike and capture nature’s beauty. Connect with her on


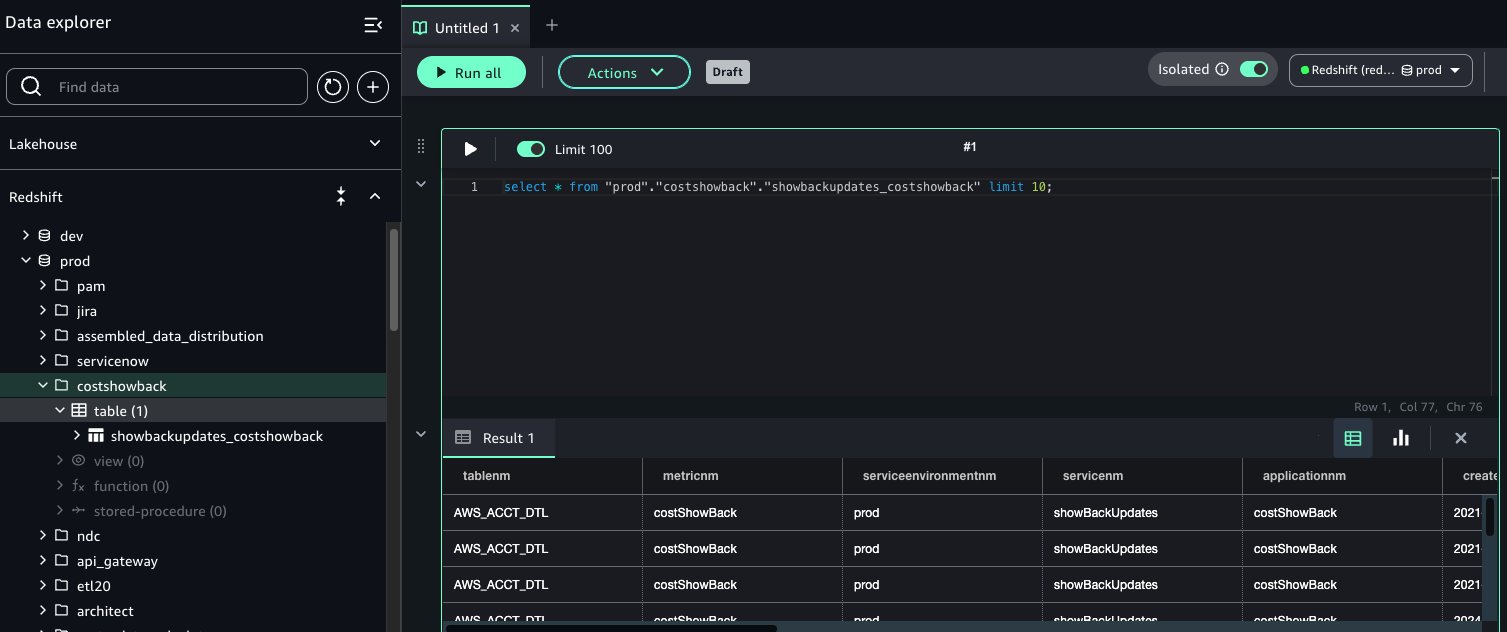
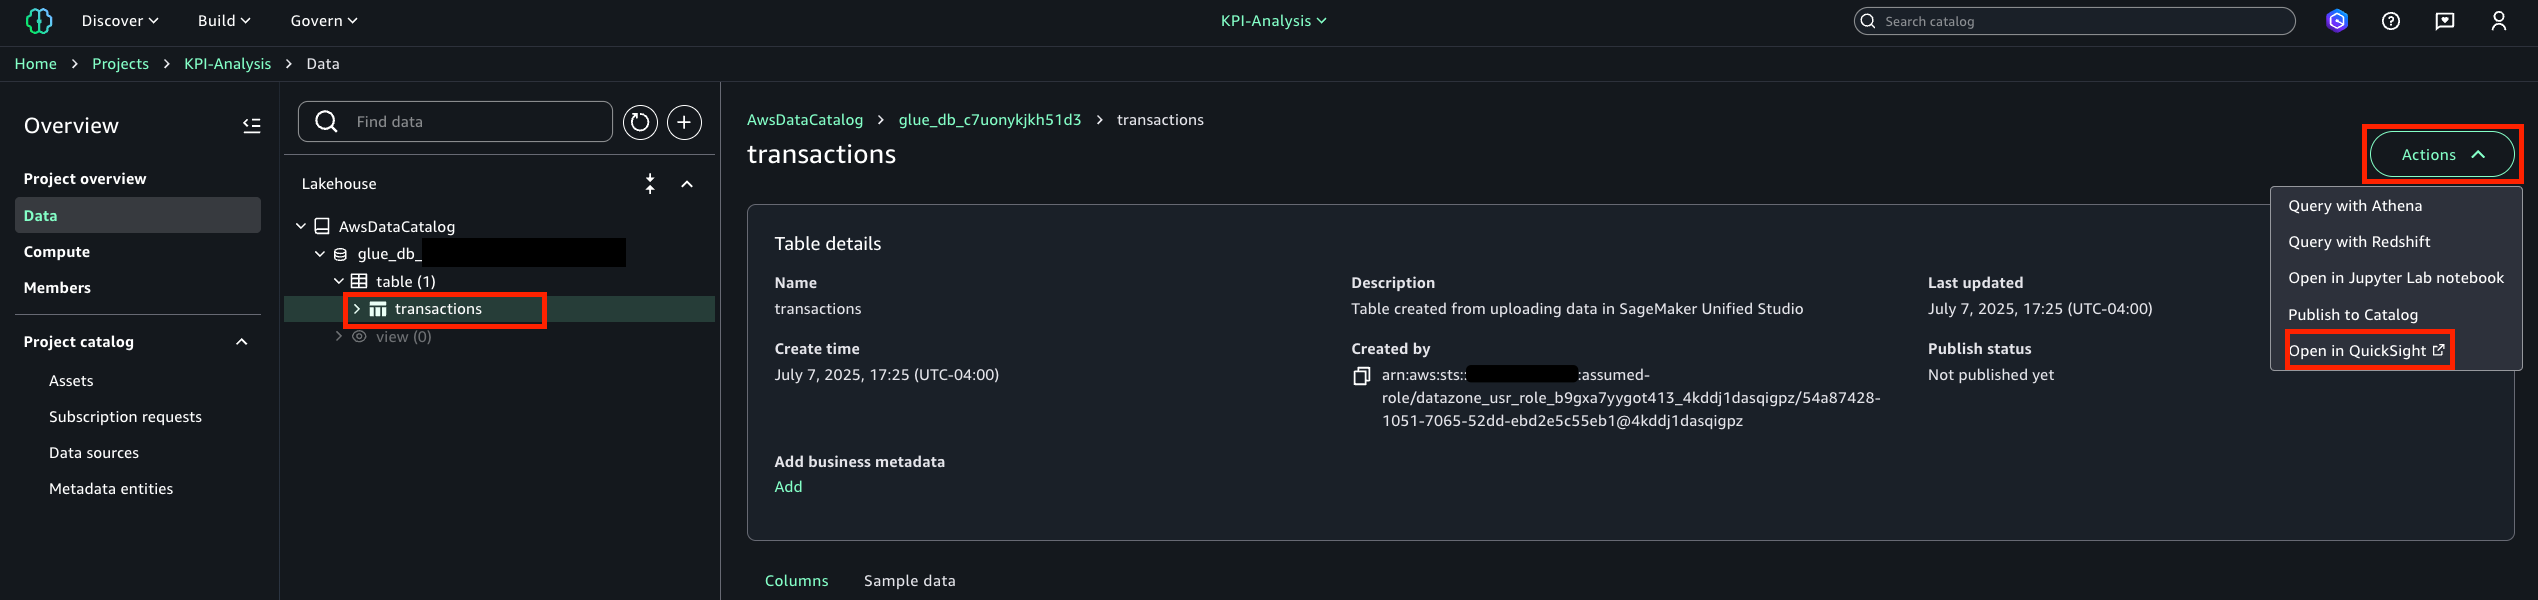
 If you select Redshift, you will be transferred to the Query editor where you can execute the SQL and see the results as shown in the following figure.
 Avijit Goswami is a Principal Data Solutions Architect at AWS specialized in data and analytics. He supports AWS strategic customers in building high-performing, secure, and scalable data lake solutions on AWS using AWS managed services and open-source solutions. Outside of his work, Avijit likes to travel, hike in the San Francisco Bay Area trails, watch sports, and listen to music.
 Saman Irfan is a Senior Specialist Solutions Architect focusing on Data Analytics at Amazon Web Services. She focuses on helping customers across various industries build scalable and high-performant analytics solutions. Outside of work, she enjoys spending time with her family, watching TV series, and learning new technologies.
 Sudarshan Narasimhan is a Principal Solutions Architect at AWS specialized in data, analytics and databases. With over 19 years of experience in Data roles, he is currently helping AWS Partners & customers build modern data architectures. As a specialist & trusted advisor he helps partners build & GTM with scalable, secure and high performing data solutions on AWS. In his spare time, he enjoys spending time with his family, travelling, avidly consuming podcasts and being heartbroken about Man United’s current state.


 This policy uses all the resources, which shouldn’t be used in production workload. To deploy this setup in production, restrict it to only specific zero-ETL integration resources by adding a

 The following code is an example of permissions for catalog settings:


 Narayani Ambashta is an Analytics Specialist Solutions Architect at AWS, focusing on the automotive and manufacturing sector, where she guides strategic customers in developing modern data and AI strategies. With over 15 years of cross-industry experience, she specializes in big data architecture, real-time analytics, and AI/ML technologies, helping organizations implement modern data architectures. Her expertise spans across lakehouse, generative AI, and IoT platforms, enabling customers to drive digital transformation initiatives. When not architecting modern solutions, she enjoys staying active through sports and yoga.
 Raj Ramasubbu is a Senior Analytics Specialist Solutions Architect focused on big data and analytics and AI/ML with AWS. He helps customers architect and build highly scalable, performant, and secure cloud-based solutions on AWS. Raj provided technical expertise and leadership in building data engineering, big data analytics, business intelligence, and data science solutions for over 18 years prior to joining AWS. He helped customers in various industry verticals like healthcare, medical devices, life sciences, retail, asset management, car insurance, residential REIT, agriculture, title insurance, supply chain, document management, and real estate.
 Yadgiri Pottabhathini is a Senior Analytics Specialist Solutions Architect in the media and entertainment sector. He specializes in assisting enterprise customers with their data and analytics cloud transformation initiatives, while providing guidance on accelerating their Generative AI adoption through the development of data foundations and modern data strategies that leverage open-source frameworks and technologies.
 Junpei Ozono is a Sr. Go-to-market (GTM) Data & AI solutions architect at AWS in Japan. He drives technical market creation for data and AI solutions while collaborating with global teams to develop scalable GTM motions. He guides organizations in designing and implementing innovative data-driven architectures powered by AWS services, helping customers accelerate their cloud transformation journey through modern data and AI solutions. His expertise spans across modern data architectures including Data Mesh, Data Lakehouse, and Generative AI, enabling customers to build scalable and innovative solutions on AWS.


 Dhrubajyoti Mukherjee is a Cloud Infrastructure Architect with a strong focus on data strategy, data governance, and artificial intelligence at Amazon Web Services (AWS). He uses his deep expertise to provide guidance to global enterprise customers across industries, helping them build scalable and secure cloud solutions that drive meaningful business outcomes. Dhrubajyoti is passionate about creating innovative, customer-centric solutions that enable digital transformation, business agility, and performance improvement. Outside of work, Dhrubajyoti enjoys spending quality time with his family and exploring nature through his love of hiking mountains.


 Kalyan Janaki is Senior Big Data & Analytics Specialist with Amazon Web Services. He helps customers architect and build highly scalable, performant, and secure cloud-based solutions on AWS.
 Phaneendra Vuliyaragoli is a Product Management Lead for Amazon Data Firehose at AWS. In this role, Phaneendra leads the product and go-to-market strategy for Amazon Data Firehose.
 Maria Ho is a Product Marketing Manager for Streaming and Messaging services at AWS. She works with services including Amazon Managed Streaming for Apache Kafka (Amazon MSK), Amazon Managed Service for Apache Flink, Amazon Data Firehose, Amazon Kinesis Data Streams, Amazon MQ, Amazon Simple Queue Service (Amazon SQS), and Amazon Simple Notification Services (Amazon SNS).


 Stefano Sandonà is a Senior Big Data Specialist Solution Architect at Amazon Web Services (AWS). Passionate about data, distributed systems, and security, he helps customers worldwide architect high-performance, efficient, and secure data solutions.
 Derek Liu is a Senior Solutions Architect based out of Vancouver, BC. He enjoys helping customers solve big data challenges through Amazon Web Services (AWS) analytic services.
 Raj Ramasubbu is a Senior Analytics Specialist Solutions Architect focused on big data and analytics and AI/ML with Amazon Web Services (AWS). He helps customers architect and build highly scalable, performant, and secure cloud-based solutions on AWS. Raj provided technical expertise and leadership in building data engineering, big data analytics, business intelligence, and data science solutions for over 18 years prior to joining AWS. He helped customers in various industry verticals like healthcare, medical devices, life science, retail, asset management, car insurance, residential REIT, agriculture, title insurance, supply chain, document management, and real estate.
 Angel Conde Manjon is a Sr. EMEA Data & AI PSA, based in Madrid. He has previously worked on research related to data analytics and AI in diverse European research projects. In his current role, Angel helps partners develop businesses centered on data and AI.