Tag Archives: announcements

New – Trusted Language Extensions for PostgreSQL on Amazon Aurora and Amazon RDS

Post Syndicated from Channy Yun original https://aws.amazon.com/blogs/aws/new-trusted-language-extensions-for-postgresql-on-amazon-aurora-and-amazon-rds/

PostgreSQL has become the preferred open-source relational database for many enterprises and start-ups with its extensible design for developers. One of the reasons developers use PostgreSQL is it allows them to add database functionality by building extensions with their preferred programming languages.

You can already install and use PostgreSQL extensions in Amazon Aurora PostgreSQL-Compatible Edition and Amazon Relational Database Service for PostgreSQL. We support more than 85 PostgreSQL extensions in Amazon Aurora and Amazon RDS, such as the pgAudit extension for logging your database activity. While many workloads use these extensions, we heard our customers asking for flexibility to build and run the extensions of their choosing for their PostgreSQL database instances.

Today, we are announcing the general availability of Trusted Language Extensions for PostgreSQL (pg_tle), a new open-source development kit for building PostgreSQL extensions. With Trusted Language Extensions for PostgreSQL, developers can build high-performance extensions that run safely on PostgreSQL.

Trusted Language Extensions for PostgreSQL provides database administrators control over who can install extensions and a permissions model for running them, letting application developers deliver new functionality as soon as they determine an extension meets their needs.

To start building with Trusted Language Extensions, you can use trusted languages such as JavaScript, Perl, and PL/pgSQL. These trusted languages have safety attributes, including restricting direct access to the file system and preventing unwanted privilege escalations. You can easily install extensions written in a trusted language on Amazon Aurora PostgreSQL-Compatible Edition 14.5 and Amazon RDS for PostgreSQL 14.5 or a newer version.

Trusted Language Extensions for PostgreSQL is an open-source project licensed under Apache License 2.0 on GitHub. You can comment or suggest items on the Trusted Language Extensions for PostgreSQL roadmap and help us support this project across multiple programming languages, and more. Doing this as a community will help us make it easier for developers to use the best parts of PostgreSQL to build extensions.

Let’s explore how we can use Trusted Language Extensions for PostgreSQL to build a new PostgreSQL extension for Amazon Aurora and Amazon RDS.

Setting up Trusted Language Extensions for PostgreSQL
To use pg_tle with Amazon Aurora or Amazon RDS for PostgreSQL, you need to set up a parameter group that loads pg_tle in the PostgreSQL shared_preload_libraries setting. Choose Parameter groups in the left navigation pane in the Amazon RDS console and Create parameter group to make a new parameter group.

Choose Create after you select postgres14 with Amazon RDS for PostgreSQL in the Parameter group family and pg_tle in the Group Name. You can select aurora-postgresql14 for an Amazon Aurora PostgreSQL-Compatible cluster.

Choose a created pgtle parameter group and Edit in the Parameter group actions dropbox menu. You can search shared_preload_library in the search box and choose Edit parameter. You can add your preferred values, including pg_tle, and choose Save changes.

You can also do the same job in the AWS Command Line Interface (AWS CLI).

$ aws rds create-db-parameter-group \
  --region us-east-1 \
  --db-parameter-group-name pgtle \
  --db-parameter-group-family aurora-postgresql14 \
  --description "pgtle group"

$ aws rds modify-db-parameter-group \
  --region us-east-1 \
  --db-parameter-group-name pgtle \
  --parameters "ParameterName=shared_preload_libraries,ParameterValue=pg_tle,ApplyMethod=pending-reboot"

Now, you can add the pgtle parameter group to your Amazon Aurora or Amazon RDS for PostgreSQL database. If you have a database instance called testing-pgtle, you can add the pgtle parameter group to the database instance using the command below. Please note that this will cause an active instance to reboot.

$ aws rds modify-db-instance \
  --region us-east-1 \
  --db-instance-identifier testing-pgtle \
  --db-parameter-group-name pgtle-pg \
  --apply-immediately

Verify that the pg_tle library is available on your Amazon Aurora or Amazon RDS for PostgreSQL instance. Run the following command on your PostgreSQL instance:

SHOW shared_preload_libraries;

pg_tle should appear in the output.

Now, we need to create the pg_tle extension in your current database to run the command:

 CREATE EXTENSION pg_tle;

You can now create and install Trusted Language Extensions for PostgreSQL in your current database. If you create a new extension, you should grant the pgtle_admin role to your primary user (e.g., postgres) with the following command:

GRANT pgtle_admin TO postgres;

Let’s now see how to create our first pg_tle extension!

Building a Trusted Language Extension for PostgreSQL
For this example, we are going to build a pg_tle extension to validate that a user is not setting a password that’s found in a common password dictionary. Many teams have rules around the complexity of passwords, particularly for database users. PostgreSQL allows developers to help enforce password complexity using the check_password_hook.

In this example, you will build a password check hook using PL/pgSQL. In the hook, you can check to see if the user-supplied password is in a dictionary of 10 of the most common password values:

SELECT pgtle.install_extension (
  'my_password_check_rules',
  '1.0',
  'Do not let users use the 10 most commonly used passwords',
$_pgtle_$
  CREATE SCHEMA password_check;
  REVOKE ALL ON SCHEMA password_check FROM PUBLIC;
  GRANT USAGE ON SCHEMA password_check TO PUBLIC;

  CREATE TABLE password_check.bad_passwords (plaintext) AS
  VALUES
    ('123456'),
    ('password'),
    ('12345678'),
    ('qwerty'),
    ('123456789'),
    ('12345'),
    ('1234'),
    ('111111'),
    ('1234567'),
    ('dragon');
  CREATE UNIQUE INDEX ON password_check.bad_passwords (plaintext);

  CREATE FUNCTION password_check.passcheck_hook(username text, password text, password_type pgtle.password_types, valid_until timestamptz, valid_null boolean)
  RETURNS void AS $$
    DECLARE
      invalid bool := false;
    BEGIN
      IF password_type = 'PASSWORD_TYPE_MD5' THEN
        SELECT EXISTS(
          SELECT 1
          FROM password_check.bad_passwords bp
          WHERE ('md5' || md5(bp.plaintext || username)) = password
        ) INTO invalid;
        IF invalid THEN
          RAISE EXCEPTION 'password must not be found on a common password dictionary';
        END IF;
      ELSIF password_type = 'PASSWORD_TYPE_PLAINTEXT' THEN
        SELECT EXISTS(
          SELECT 1
          FROM password_check.bad_passwords bp
          WHERE bp.plaintext = password
        ) INTO invalid;
        IF invalid THEN
          RAISE EXCEPTION 'password must not be found on a common password dictionary';
        END IF;
      END IF;
    END
  $$ LANGUAGE plpgsql SECURITY DEFINER;

  GRANT EXECUTE ON FUNCTION password_check.passcheck_hook TO PUBLIC;

  SELECT pgtle.register_feature('password_check.passcheck_hook', 'passcheck');
$_pgtle_$
);

You need to enable the hook through the pgtle.enable_password_check configuration parameter. On Amazon Aurora and Amazon RDS for PostgreSQL, you can do so with the following command:

$ aws rds modify-db-parameter-group \
    --region us-east-1 \
    --db-parameter-group-name pgtle \
    --parameters "ParameterName=pgtle.enable_password_check,ParameterValue=on,ApplyMethod=immediate"

It may take several minutes for these changes to propagate. You can check that the value is set using the SHOW command:

SHOW pgtle.enable_password_check;

If the value is on, you will see the following output:

 pgtle.enable_password_check
-----------------------------
 on

Now you can create this extension in your current database and try setting your password to one of the dictionary passwords and observe how the hook rejects it:

CREATE EXTENSION my_password_check_rules;

CREATE ROLE test_role PASSWORD '123456';
ERROR:  password must not be found on a common password dictionary

CREATE ROLE test_role;
SET SESSION AUTHORIZATION test_role;
SET password_encryption TO 'md5';
\password
-- set to "password"
ERROR:  password must not be found on a common password dictionary

To disable the hook, set the value of pgtle.enable_password_check to off:

$ aws rds modify-db-parameter-group \
    --region us-east-1 \
    --db-parameter-group-name pgtle \
    --parameters "ParameterName=pgtle.enable_password_check,ParameterValue=off,ApplyMethod=immediate"

You can uninstall this pg_tle extension from your database and prevent anyone else from running CREATE EXTENSION on my_password_check_rules with the following command:

DROP EXTENSION my_password_check_rules;
SELECT pgtle.uninstall_extension('my_password_check_rules');

You can find more sample extensions and give them a try. To build and test your Trusted Language Extensions in your local PostgreSQL database, you can build from our source code after cloning the repository.

Join Our Community!
The Trusted Language Extensions for PostgreSQL community is open to everyone. Give it a try, and give us feedback on what you would like to see in future releases. We welcome any contributions, such as new features, example extensions, additional documentation, or any bug reports in GitHub.

To learn more about using Trusted Language Extensions for PostgreSQL in the AWS Cloud, see the Amazon Aurora PostgreSQL-Compatible Edition and Amazon RDS for PostgreSQL documentation.

Give it a try, and please send feedback to AWS re:Post for PostgreSQL or through your usual AWS support contacts.

Channy

Preview: Use Amazon SageMaker to Build, Train, and Deploy ML Models Using Geospatial Data

Post Syndicated from Channy Yun original https://aws.amazon.com/blogs/aws/preview-use-amazon-sagemaker-to-build-train-and-deploy-ml-models-using-geospatial-data/

You use map apps every day to find your favorite restaurant or travel the fastest route using geospatial data. There are two types of geospatial data: vector data that uses two-dimensional geometries such as a building location (points), roads (lines), or land boundary (polygons), and raster data such as satellite and aerial images.

Last year, we introduced Amazon Location Service, which makes it easy for developers to add location functionality to their applications. With Amazon Location Service, you can visualize a map, search points of interest, optimize delivery routes, track assets, and use geofencing to detect entry and exit events in your defined geographical boundary.

However, if you want to make predictions from geospatial data using machine learning (ML), there are lots of challenges. When I studied geographic information systems (GIS) in graduate school, I was limited to a small data set that covered only a narrow area and had to contend with limited storage and only the computing power of my laptop at the time.

These challenges include 1) acquiring and accessing high-quality geospatial datasets is complex as it requires working with multiple data sources and vendors, 2) preparing massive geospatial data for training and inference can be time-consuming and expensive, and 3) specialized tools are needed to visualize geospatial data and integrate with ML operation infrastructure

Today I’m excited to announce the preview release of Amazon SageMaker‘s new geospatial capabilities that make it easy to build, train, and deploy ML models using geospatial data. This collection of features offers pre-trained deep neural network (DNN) models and geospatial operators that make it easy to access and prepare large geospatial datasets. All generated predictions can be visualized and explored on the map.

Also, you can use the new geospatial image to transform and visualize data inside geospatial notebooks using open-source libraries such as NumPy, GDAL, GeoPandas, and Rasterio, as well as SageMaker-specific libraries.

With a few clicks in the SageMaker Studio console, a fully integrated development environment (IDE) for ML, you can run an Earth Observation job, such as a land cover segmentation or launch notebooks. You can bring various geospatial data, for example, your own Planet Labs satellite data from Amazon S3, or US Geological Survey LANDSAT and Sentinel-2 images from Open Data on AWS, Amazon Location Service, or bring your own data, such as location data generated from GPS devices, connected vehicles or internet of things (IoT) sensors, retail store foot traffic, geo-marketing and census data.

The Amazon SageMaker geospatial capabilities support use cases across any industry. For example, insurance companies can use satellite images to analyze the damage impact from natural disasters on local economies, and agriculture companies can track the health of crops, predict harvest yield, and forecast regional demand for agricultural produce. Retailers can combine location and map data with competitive intelligence to optimize new store locations worldwide. These are just a few of the example use cases. You can turn your own ideas into reality!

Introducing Amazon SageMaker Geospatial Capabilities
In the preview, you can use SageMaker Studio initialized in the US West (Oregon) Region. Make sure to set the default Jupyter Lab 3 as the version when you create a new user in the Studio. To learn more about setting up SageMaker Studio, see Onboard to Amazon SageMaker Domain Using Quick setup in the AWS documentation.

Now you can find the Geospatial section by navigating to the homepage and scrolling down in SageMaker Studio’s new Launcher tab.

Here is an overview of three key Amazon SageMaker geospatial capabilities:

  • Earth Observation jobs – Acquire, transform, and visualize satellite imagery data to make predictions and get useful insights.
  • Vector Enrichment jobs – Enrich your data with operations, such as converting geographical coordinates to readable addresses from CSV files.
  • Map Visualization – Visualize satellite images or map data uploaded from a CSV, JSON, or GeoJSON file.

Let’s dive deep into each component!

Get Started with an Earth Observation Job
To get started with Earth Observation jobs, select Create Earth Observation job on the front page.

You can select one of the geospatial operations or ML models based on your use case.

  • Spectral Index – Obtain a combination of spectral bands that indicate the abundance of features of interest.
  • Cloud Masking – Identify cloud and cloud-free pixels to get clear and accurate satellite imagery.
  • Land Cover Segmentation – Identify land cover types such as vegetation and water in satellite imagery.

The SageMaker provides a combination of geospatial functionalities that include built-in operations for data transformations along with pretrained ML models. You can use these models to understand the impact of environmental changes and human activities over time, identify cloud and cloud-free pixels, and perform semantic segmentation.

Define a Job name, choose a model to be used, and click the bottom-right Next button to move to the second configuration step.

Next, you can define an area of interest (AOI), the satellite image data set you want to use, and filters for your job. The left screen shows the Area of Interest map to visualize for your Earth Observation Job selection, and the right screen contains satellite images and filter options for your AOI.

You can choose the satellite image collection, either USGS LANDSAT or Sentinel-2 images, the date span for your Earth Observation job, and filters on properties of your images in the filter section.

I uploaded GeoJSON format to define my AOI as the Mountain Halla area in Jeju island, South Korea. I select all job properties and options and choose Create.

Once the Earth Observation job is successfully created, a flashbar will appear where I can view my job details by pressing the View job details button.

Once the job is finished, I can Visualize job output.

This image is a job output on rendering process to detect land usage from input satellite images. You can see either input images, output images, or the AOI from data layers in the left pane.
It shows automatic mapping results of land cover for natural resource management. For example, the yellow area is the sea, green is cloud, dark orange is forest, and orange is land.

You can also execute the same job with SageMaker notebook using the geospatial image with geospatial SDKs.

From the File and New, choose Notebook and select the Image dropdown menu in the Setup notebook environment and choose Geospatial 1.0. Let the other settings be set to the default values.

Let’s look at Python sample code! First, set up SageMaker geospatial libraries.

import boto3
import botocore
import sagemaker
import sagemaker_geospatial_map

region = boto3.Session().region_name
session = botocore.session.get_session()
execution_role = sagemaker.get_execution_role()

sg_client= session.create_client(
    service_name='sagemaker-geospatial',
    region_name=region
)

Start an Earth Observation Job to identify the land cover types in the area of Jeju island.

# Perform land cover segmentation on images returned from the sentinel dataset.
eoj_input_config = {
    "RasterDataCollectionQuery": {
        "RasterDataCollectionArn": <ArnDataCollection,
        "AreaOfInterest": {
            "AreaOfInterestGeometry": {
                "PolygonGeometry": {
                    "Coordinates": [
                        [[126.647226, 33.47014], [126.406116, 33.47014], [126.406116, 33.307529], [126.647226, 33.307529], [126.647226, 33.47014]]
                    ]
                }
            }
        },
        "TimeRangeFilter": {
            "StartTime": "2022-11-01T00:00:00Z",
            "EndTime": "2022-11-22T23:59:59Z"
        },
        "PropertyFilters": {
            "Properties": [
                {
                    "Property": {
                        "EoCloudCover": {
                            "LowerBound": 0,
                            "UpperBound": 20
                        }
                    }
                }
            ],
            "LogicalOperator": "AND"
        }
    }
}
eoj_config = {"LandCoverSegmentationConfig": {}}

response = sg_client.start_earth_observation_job(
    Name =  "jeju-island-landcover", 
    InputConfig = eoj_input_config,
    JobConfig = eoj_config, 
    ExecutionRoleArn = execution_role
)
# Monitor the EOJ status
sg_client.get_earth_observation_job(Arn = response['Arn'])

After your EOJ is created, the Arn is returned to you. You use the Arn to identify a job and perform further operations. After finishing the job, visualize Earth Observation inputs and outputs in the visualization tool.

# Creates an instance of the map to add EOJ input/ouput layer
map = sagemaker_geospatial_map.create_map({
    'is_raster': True
})
map.set_sagemaker_geospatial_client(sg_client)
# render the map
map.render()

# Visualize input, you can see EOJ is not be completed.
time_range_filter={
    "start_date": "2022-11-01T00:00:00Z",
    "end_date": "2022-11-22T23:59:59Z"
}
arn_to_visualize = response['Arn']
config = {
    'label': 'Jeju island'
}
input_layer=map.visualize_eoj_input(Arn=arn_to_visualize, config=config , time_range_filter=time_range_filter)

# Visualize output, EOJ needs to be in completed status
time_range_filter={
    "start_date": "2022-11-01T00:00:00Z",
    "snd_date": "2022-11-22T23:59:59Z"
}

config = {
   'preset': 'singleBand',
   'band_name': 'mask'
}
output_layer = map.visualize_eoj_output(Arn=arn_to_visualize, config=config, time_range_filter=time_range_filter)

You can also execute the StartEarthObservationJob API using the AWS Command Line Interface (AWS CLI).

When you create an Earth Observation Job in notebooks, you can use additional geospatial functionalities. Here is a list of some of the other geospatial operations that are supported by Amazon SageMaker:

  • Band Stacking – Combine multiple spectral properties to create a single image.
  • Cloud Removal – Remove pixels containing parts of a cloud from satellite imagery.
  • Geomosaic – Combine multiple images for greater fidelity.
  • Resampling – Scale images to different resolutions.
  • Temporal Statistics – Calculate statistics through time for multiple GeoTIFFs in the same area.
  • Zonal Statistics – Calculate statistics on user-defined regions.

To learn more, see Amazon SageMaker geospatial notebook SDK and Amazon SageMaker geospatial capability Service APIs in the AWS documentation and geospatial sample codes in the GitHub repository.

Perform a Vector Enrichment Job and Map Visualization
A Vector Enrichment Job (VEJ) performs operations on your vector data, such as reverse geocoding or map matching.

  • Reverse Geocoding – Convert map coordinates to human-readable addresses powered by Amazon Location Service.
  • Map Matching – Match GPS coordinates to road segments.

While you need to use an Amazon SageMaker Studio notebook to execute a VEJ, you can view all the jobs you create.

With the StartVectorEnrichmentJob API, you can create a VEJ for the supplied two job types.

{
  "Name":"vej-reverse", 
  "InputConfig":{
       "DocumentType":"csv", //
       "DataSourceConfig":{
       "S3Data":{
            "S3Uri":"s3://channy-geospatial/sample/vej.csv",
        } 
   }
  }, 
  "JobConfig": {
      "MapMatchingConfig": { 
          "YAttributeName":"string", // Latitude 
          "XAttributeName":"string", // Longitude 
          "TimestampAttributeName":"string", 
          "IdAttributeName":"string"
       }
   },
   "ExecutionRoleArn":"string" 
}

You can visualize the output of VEJ in the notebook or use the Map Visualization feature after you export VEJ jobs output to your S3 bucket. With the map visualization feature, you can easily show your geospatial data on the map.

This sample visualization includes Seattle City Council districts and public-school locations in GeoJSON format. Select Add data to upload data files or select S3 bucket.

{
  "type": "FeatureCollection",
  "crs": { "type": "name", "properties": { 
            "name":   "urn:ogc:def:crs:OGC:1.3:CRS84" } },
                                                                                
  "features": [
            { "type": "Feature", "id": 1, "properties": { "PROPERTY_L": "Jane Addams", "Status": "MS" }, "geometry": { "type": "Point", "coordinates": [ -122.293009024934037, 47.709944862769468 ] } },
            { "type": "Feature", "id": 2, "properties": { "PROPERTY_L": "Rainier View", "Status": "ELEM" }, "geometry": { "type": "Point", "coordinates": [ -122.263172064204767, 47.498863322205558 ] } },
            { "type": "Feature", "id": 3, "properties": { "PROPERTY_L": "Emerson", "Status": "ELEM" }, "geometry": { "type": "Point", "coordinates": [ -122.258636146463658, 47.514820466363943 ] } }
            ]
}

That’s all! For more information about each component, see Amazon SageMaker geospatial Developer Guide.

Join the Preview
The preview release of Amazon SageMaker geospatial capability is now available in the US West (Oregon) Region.

We want to hear more feedback during the preview. Give it a try, and please send feedback to AWS re:Post for Amazon SageMaker or through your usual AWS support contacts.

Channy

New – Redesigned UI for Amazon SageMaker Studio

Post Syndicated from Antje Barth original https://aws.amazon.com/blogs/aws/new-redesigned-ui-for-amazon-sagemaker-studio/

Today, I’m excited to announce a new, redesigned user interface (UI) for Amazon SageMaker Studio.

SageMaker Studio provides a single, web-based visual interface where you can perform all machine learning (ML) development steps with a comprehensive set of ML tools. For example, you can prepare data using SageMaker Data Wrangler, build ML models with fully managed Jupyter notebooks, and deploy models using SageMaker’s multi-model endpoints.

Introducing the Redesigned UI for Amazon SageMaker Studio
The redesigned UI makes it easier for you to discover and get started with the ML tools in SageMaker Studio. One highlight of the new UI includes a redesigned navigation menu with links to SageMaker capabilities that follow the typical ML development workflow from preparing data to building, training, and deploying ML models.

We also added new dynamic landing pages for each of the navigation menu items. These landing pages will refresh automatically to show the ML resources relevant for the tool, such as clusters, feature groups, experiments, and model endpoints, as you create or update them. On each of these pages, you can also find links to videos, tutorials, blogs, or additional documentation, to help you get started with the corresponding ML tool in SageMaker Studio.

The new SageMaker Studio Home page gives you one-click access to common tasks and workflows. From here, you can also open the redesigned Launcher with quick links to some of the most frequent tasks, such as creating a new notebook, opening a code console, or opening an image terminal.

Let me give you a whirlwind tour of the redesigned UI.

New Navigation Menu
The new left navigation menu in SageMaker Studio now helps you discover and navigate to the right tools for each step in your ML development workflow. The menu offers clear entry points to key ML tasks, such as data preparation, experimentation, model building, and deployments. The menu also provides shortcuts to quick start solutions and helpful content to accelerate your work in SageMaker Studio.

Amazon SageMaker Studio - New Navigation Menu

New Landing Pages for SageMaker Features and Capabilities
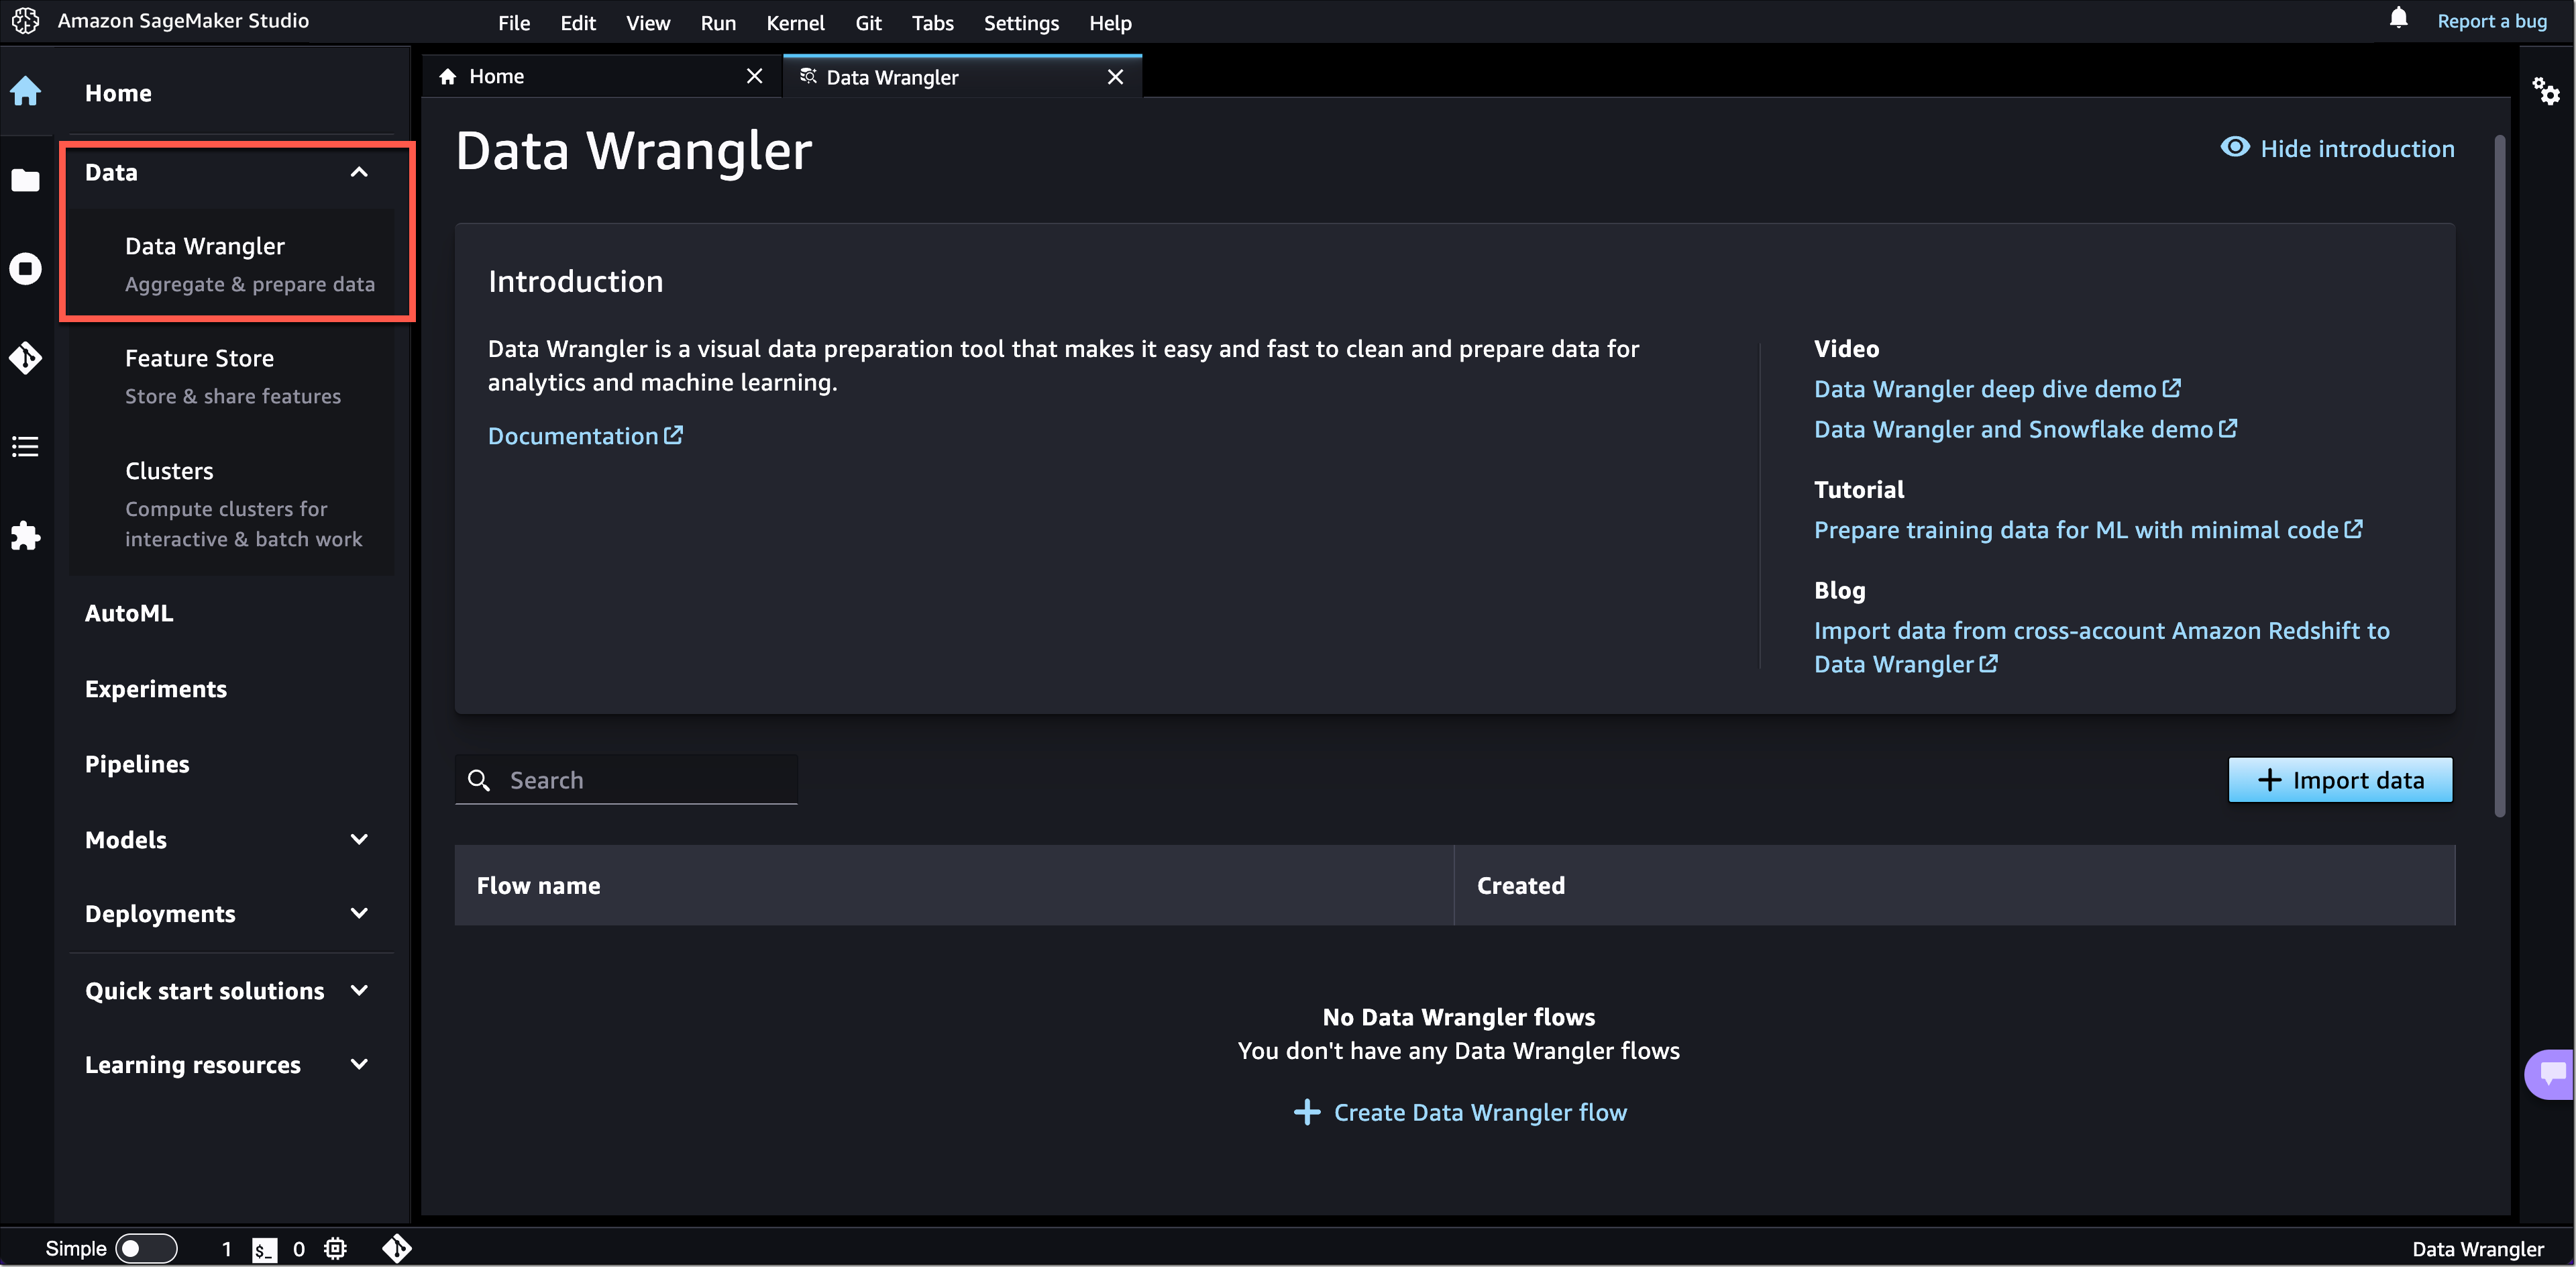
The new left navigation menu groups relevant tools together. For example, if you click on Data, you can now see the relevant SageMaker capabilities for your data preparation tasks. From here, you can prepare your data with SageMaker Data Wrangler, create and store ML features with SageMaker Feature Store, or manage Amazon EMR clusters for large-scale data processing.

If you click on Data Wrangler, the new landing page opens. These landing pages are designed to help you get started more easily. You can find a brief introduction to the tool and links to additional resources, such as videos, tutorials, or blogs.

Amazon SageMaker Studio - New Feature Landing Pages

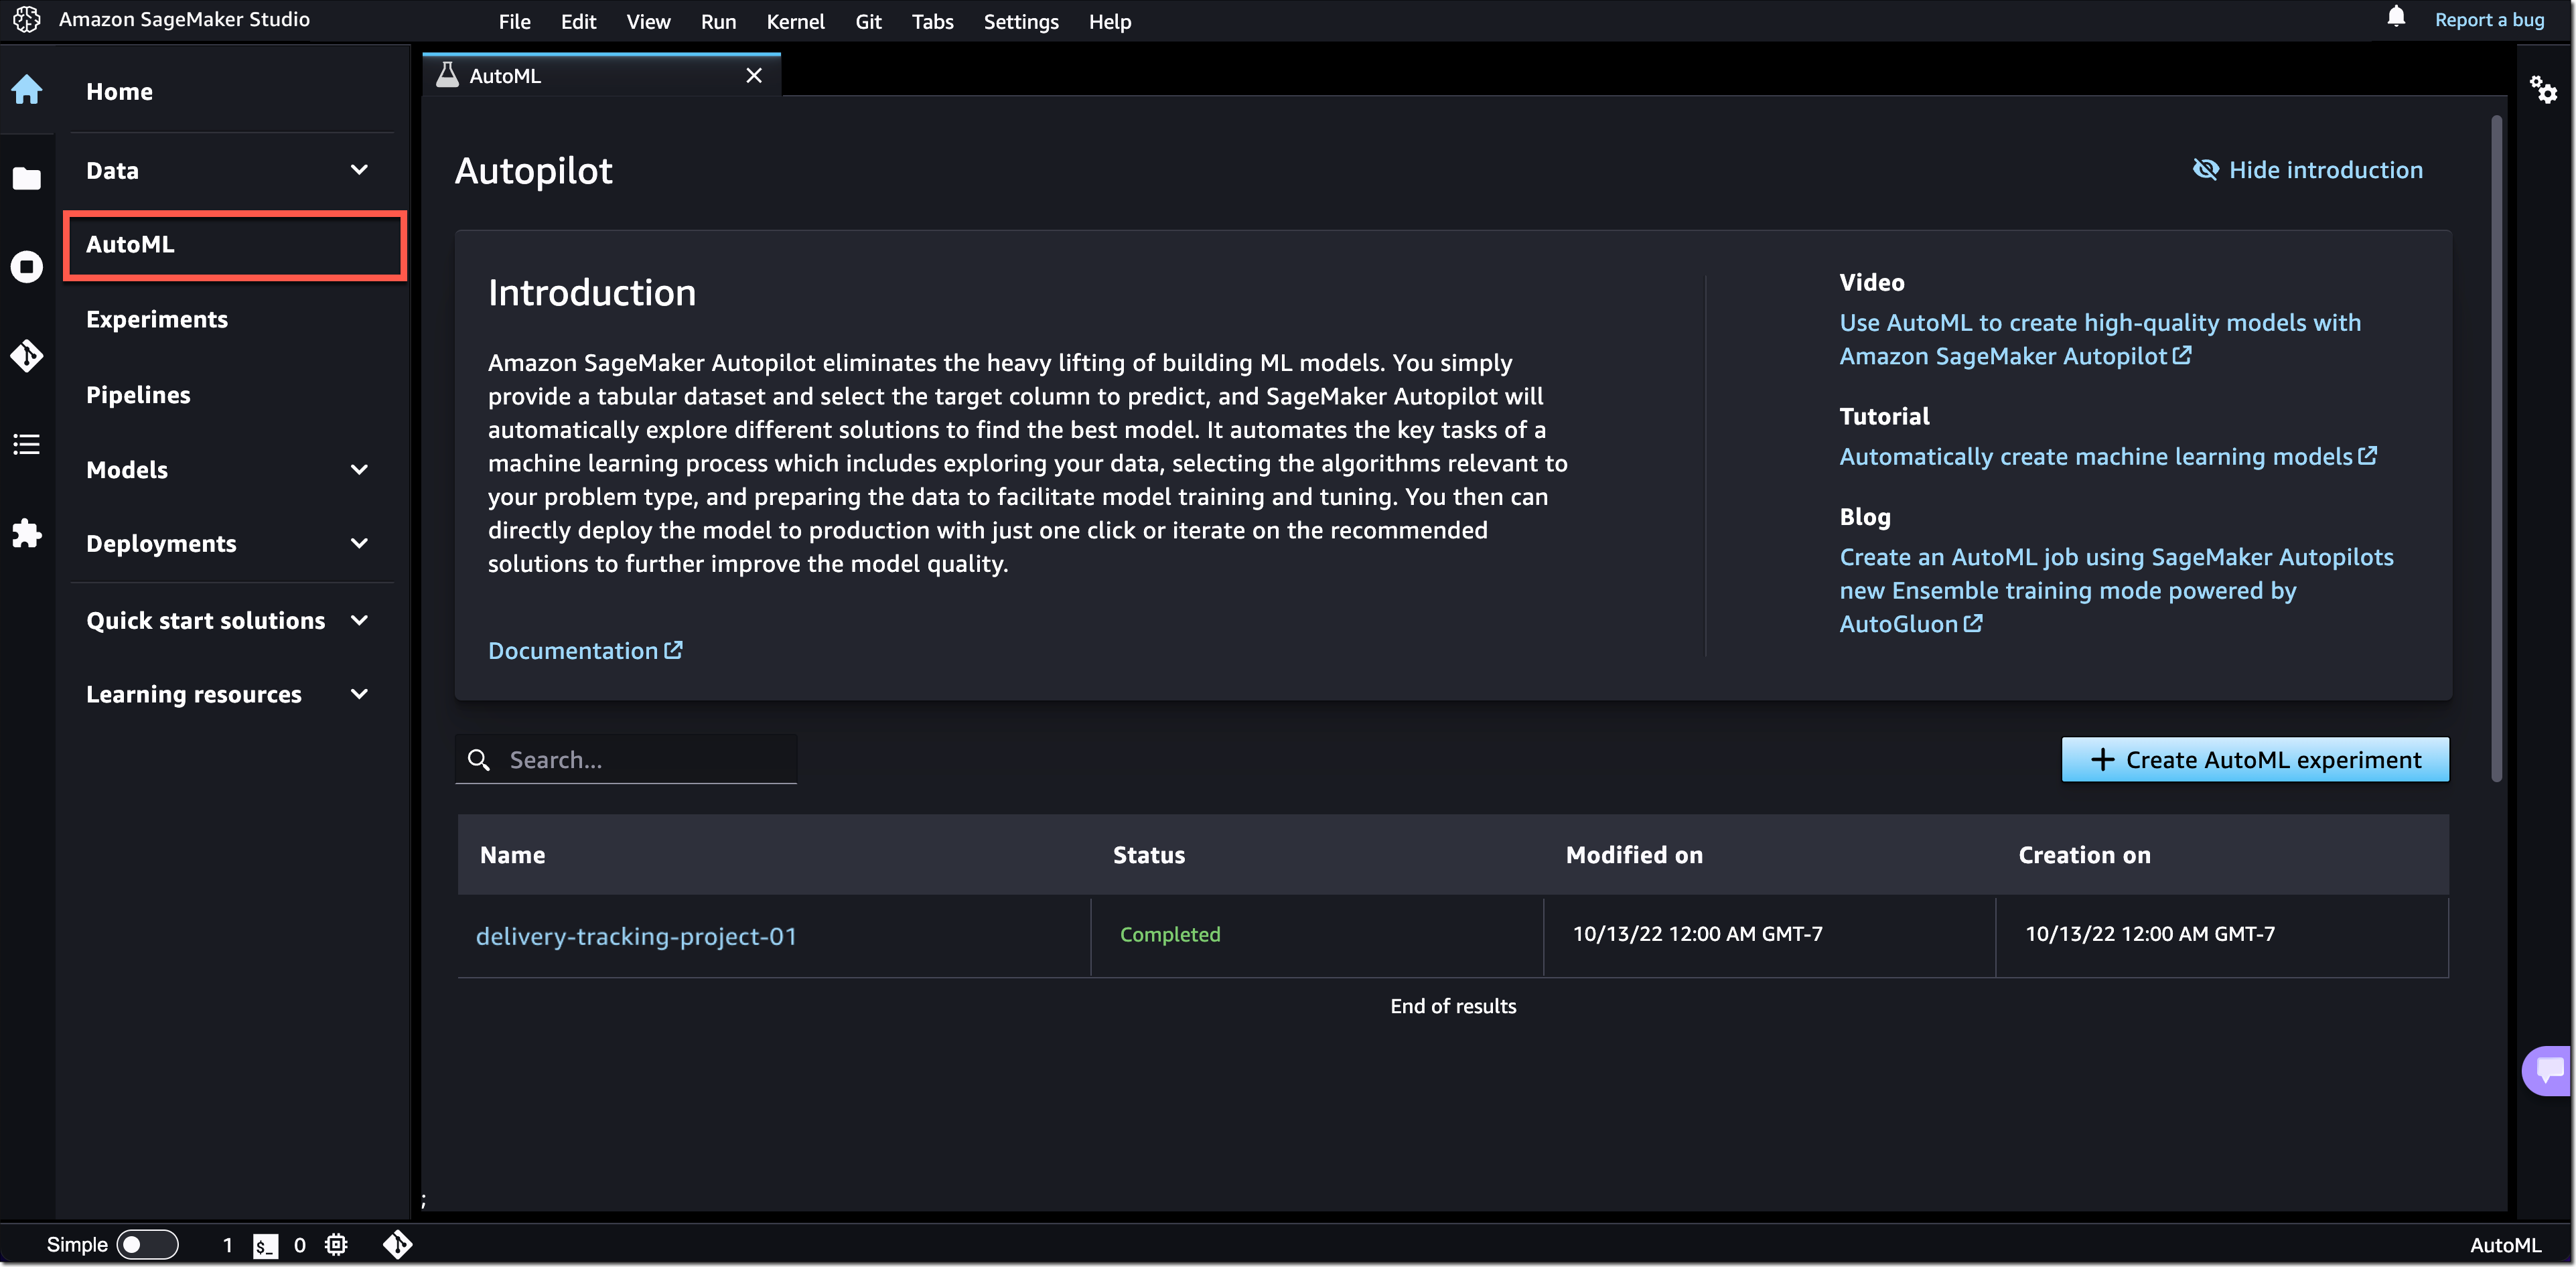
Similar landing pages exist for the other navigation menu items. For example, with one click on AutoML, you can now see your existing SageMaker Autopilot experiments or get started by creating a new one.

Amazon SageMaker Studio - New AutoML Landing Page

New SageMaker Studio Home Page
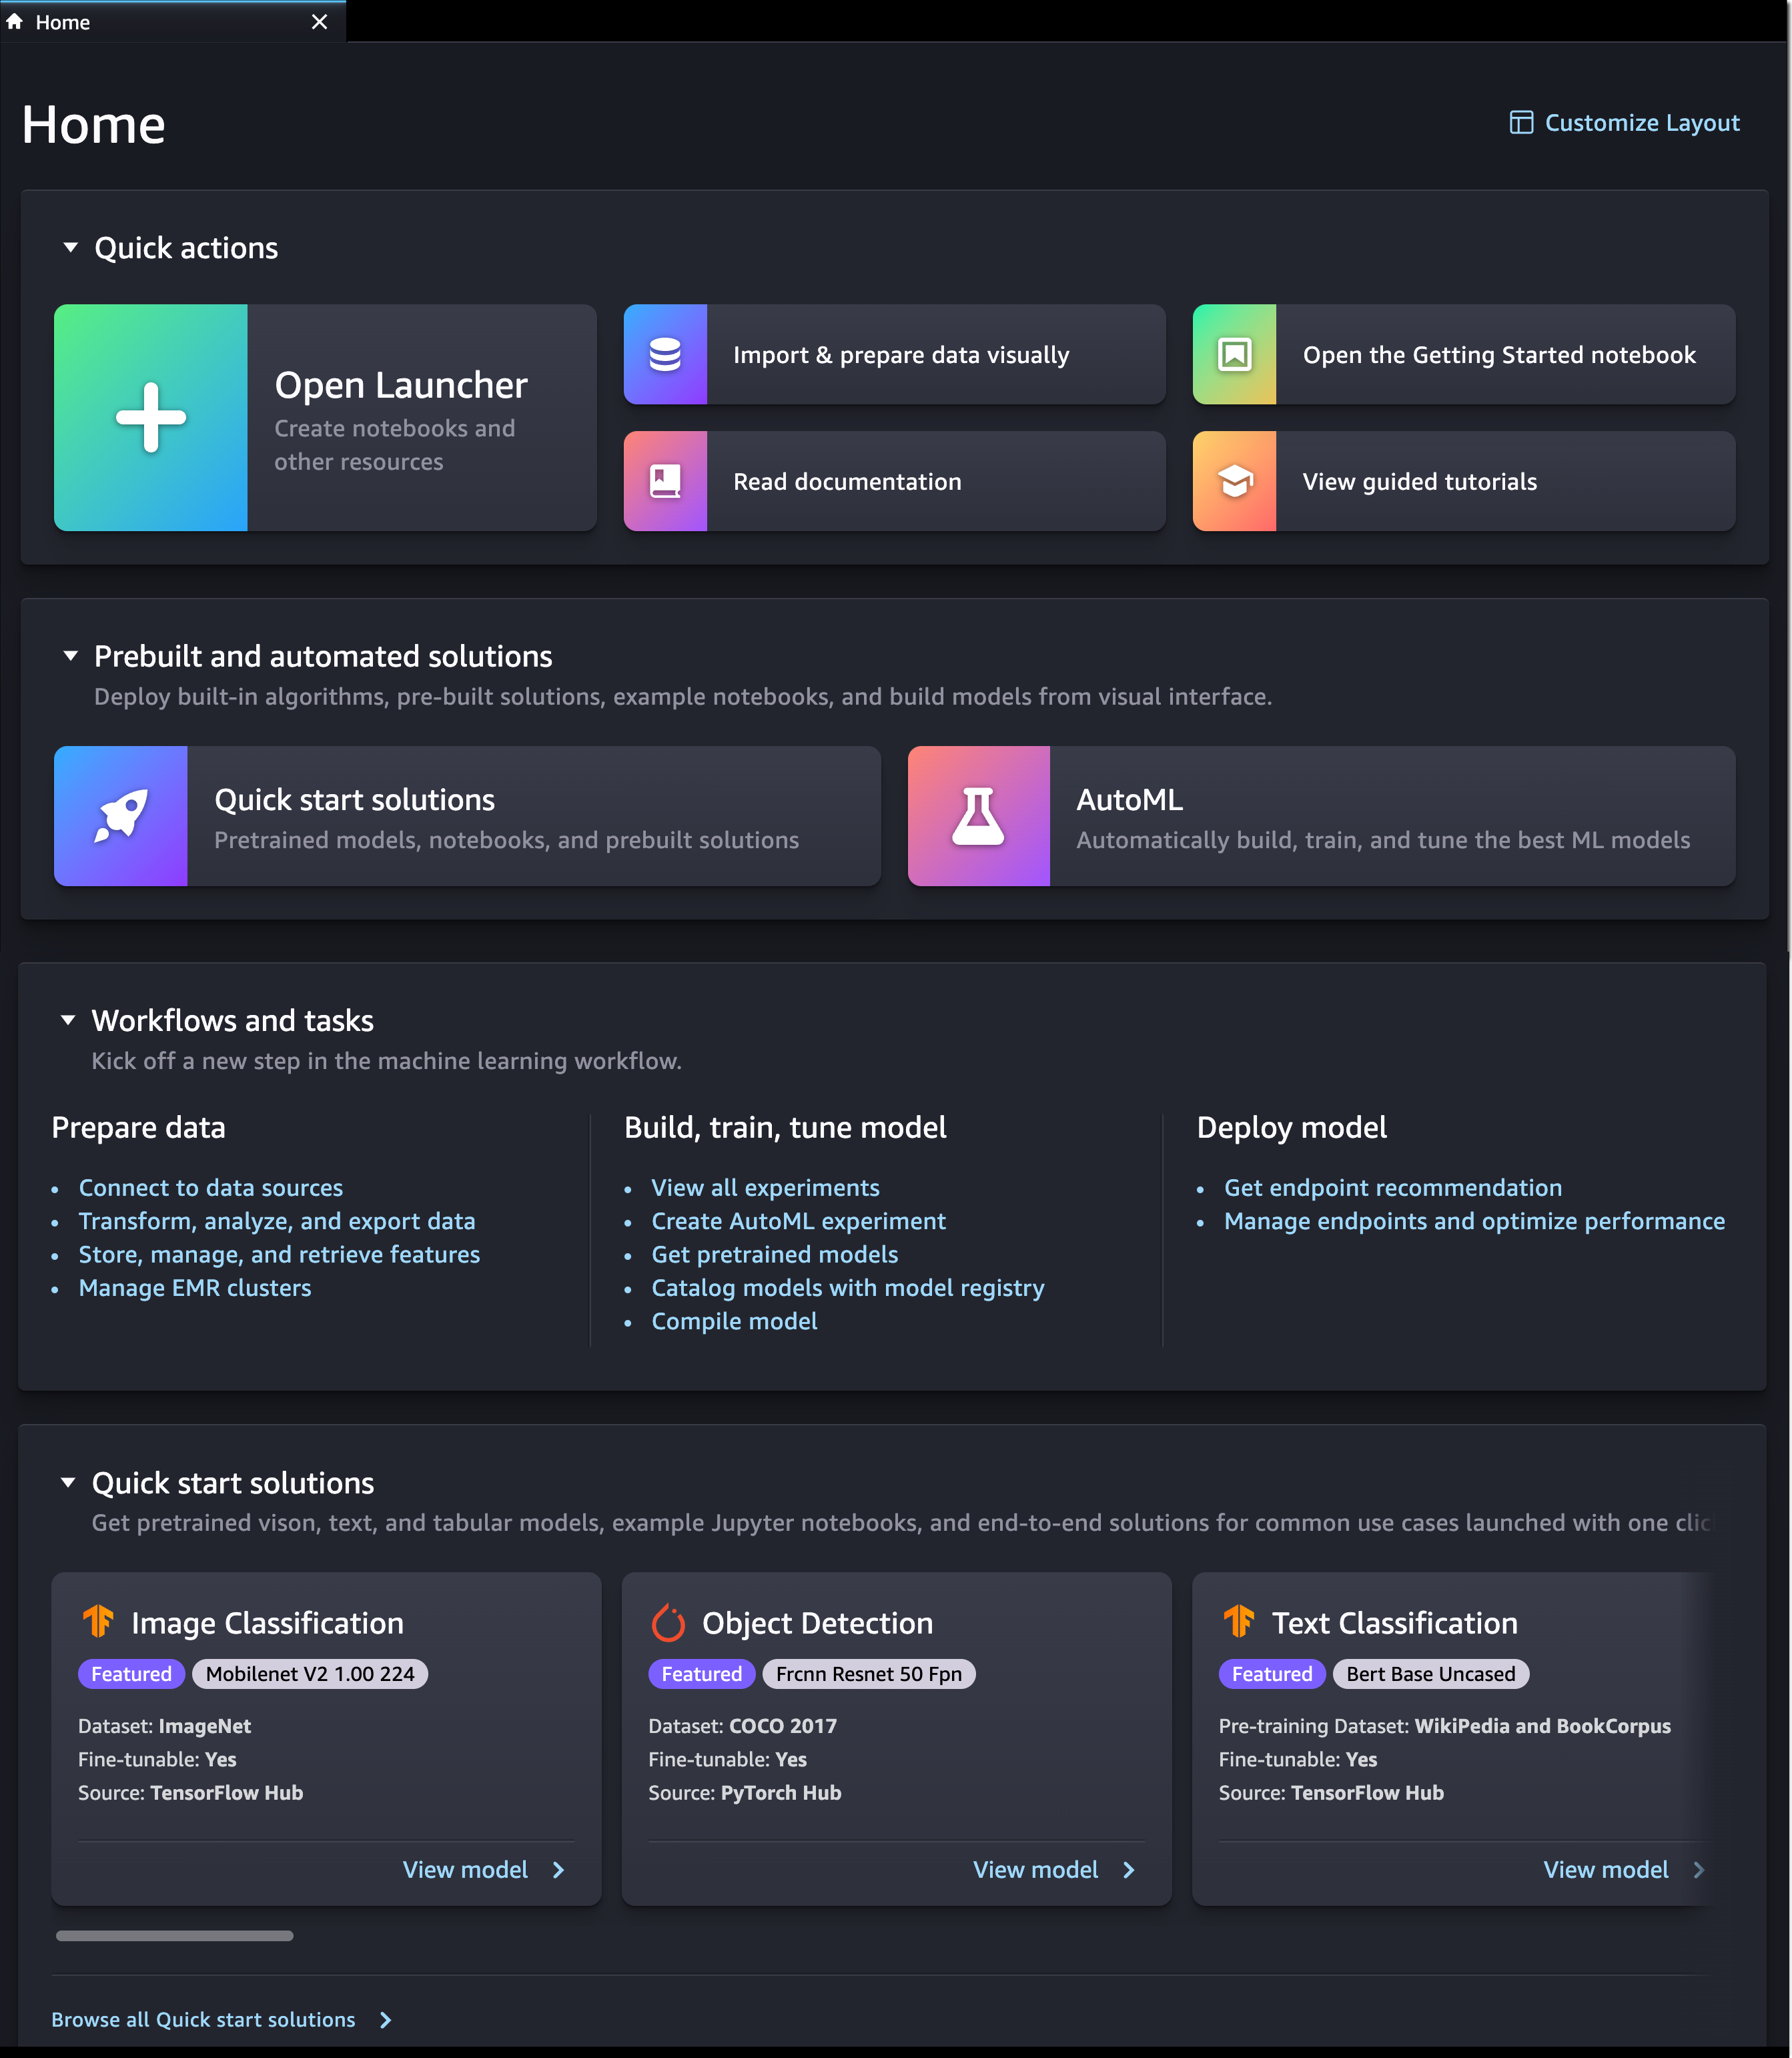
We also added a new SageMaker Studio Home page with tooltips on key controls in the UI.

The Home page includes a list of Quick actions for common tasks, such as Open Launcher to create notebooks and other resources. Import & prepare data visually takes you to SageMaker Data Wrangler and helps you get started with your data preparation tasks. You can open the new Getting Started notebook or find additional resources, such as documentation and tutorials.

The Prebuilt and automated solutions help you get started quickly with prebuilt solutions, pretrained open-source models, and AutoML.

In Workflows and tasks, you find a list of relevant tasks for each step in your ML development workflow that take you to the right tool for the job. For example, Store, manage, and retrieve features takes you to SageMaker Feature Store and opens the feature catalog. Similarly, View all experiments takes you to SageMaker Experiments and opens the experiments list view.

In Quick start solutions, you can find pretrained vision, text, and tabular models, notebooks, and end-to-end solutions for common use cases.

Amazon SageMaker Studio - New Home Page

New Getting Started Notebook
SageMaker Studio now includes a new Getting Started notebook that walks you through the basics of how to use SageMaker Studio. If you are a first-time user of SageMaker Studio, this is the perfect starting place. The notebook covers everything from the fundamentals of JupyterLab to a practical walkthrough of training an ML model. The notebook also provides detailed insight into SageMaker-specific functionality, resources, and tools.

New SageMaker Studio Launcher
The Launcher is designed to help you invoke JupyterLab actions and has been optimized to give you quick access to the most frequent tasks, such as creating a notebook, opening a code console, or opening an image terminal. In the same step, you can also choose the image, kernel, instance type, or startup script as needed. 

Amazon SageMaker Studio - New Launcher

Now Available
The redesigned Amazon SageMaker Studio UI is now available in all AWS Regions where SageMaker Studio is available. The redesigned UI is supported by SageMaker Studio domains running on JupyterLab 3. For instructions on how to update the JupyterLab version, see View and update the JupyterLab version of an app from the console.

Give the new user experience a try, and let us know what you think through the purple Feedback widget in SageMaker Studio, or through your usual AWS support contacts.

Start building your ML projects with Amazon SageMaker Studio today!

— Antje

Announcing Amazon DocumentDB Elastic Clusters

Post Syndicated from Veliswa Boya original https://aws.amazon.com/blogs/aws/announcing-amazon-documentdb-elastic-clusters/

Amazon DocumentDB (with MongoDB compatibility) is a scalable, highly durable, and fully managed database service for operating mission-critical JSON workloads. It is one of AWS fast-growing services with customers including BBC, Dow Jones, and Samsung relying on Amazon DocumentDB to run their JSON workloads at scale.

Today I am excited to announce the general availability of Amazon DocumentDB Elastic Clusters. Elastic Clusters enables you to elastically scale your document database to handle virtually any number of writes and reads, with petabytes of storage capacity. Elastic Clusters simplifies how customers interact with Amazon DocumentDB by automatically managing the underlying infrastructure and removing the need to create, remove, upgrade, or scale instances.

A Few Concepts about Elastic Clusters
Sharding – A popular database concept also known as partitioning, sharding splits large data sets into smaller data sets across multiple nodes enabling customers to scale out their database beyond vertical scaling limits. Elastic Clusters uses sharding to partition data across Amazon DocumentDB’s distributed storage system. 

Elastic Clusters – Elastic Clusters is Amazon DocumentDB clusters that allow you to scale your workload’s throughput to millions of writes/reads per second and storage to petabytes. Elastic Clusters comprises one or more shards each of which has its own compute and storage volume. It is highly available across three Availability Zones (AZs) by default, with six copies of your data replicated across these three AZs. You can create Elastic Clusters using the Amazon DocumentDB API, AWS SDK, AWS CLI, AWS CloudFormation, or the AWS console.

Scale Workloads with Little to No Impact – With Elastic Clusters, your database can scale to millions of operations with little to no downtime or performance impact.

Integration with Other AWS Services – Elastic Clusters integrates with other AWS services in the same way Amazon DocumentDB does today. First, you can monitor the health and performance of your Elastic Clusters using Amazon CloudWatch. Second, you can set up authentication and authorization for resources such as clusters through AWS Identity and Access Management (IAM) users and roles and use Amazon Virtual Private Cloud (Amazon VPC) for secure VPC-only connections. Last, you can use AWS Glue to import and export data from and to other AWS services such as Amazon Simple Storage Service (Amazon S3), Amazon Redshift, and Amazon OpenSearch Service.

Getting Started with Elastic Clusters
Previously, I mentioned that you can use either the AWS console, AWS CLI, or AWS SDK to create Elastic Clusters. In the examples below, we will look at how you can create a cluster, scale up or out, and scale in or down using the AWS CLI:

Create a Cluster
When creating a cluster, you will specify the vCPUs that you want for your Elastic Clusters at provisioning. With the size of vCPUs that you provision, you will also get a proportionate amount of memory, expressed in vCPUs. Elastic Clusters automatically provisions the necessary infrastructure (shards and instances) on your behalf.
aws docdb-elastic create-cluster
--cluster-name foo
--shard-capacity 2
--shard-count 4
--auth-type PLAIN_TEXT
--admin-user-name docdbelasticadmin
--admin-user-password password

Scale Up or Out
If you need more compute and storage to handle an increase in traffic, modify the shard-count parameter. Elastic Clusters scales the underlying infrastructure up or out to give you additional compute and storage capacity.
aws docdb-elastic update-cluster
--cluster-arn foo-arn
--shard-count 8

Scale In or Down
If you no longer need the compute and storage that you currently have provisioned, either due to a decline in database traffic or the fact that you originally over-provisioned, modify the shard-count parameter. Elastic Clusters scales the underlying infrastructure in or down.
aws docdb-elastic update-cluster
--cluster-arn foo-arn
--shard-count 4

General Availability of Elastic Clusters for Amazon DocumentDB
Amazon DocumentDB Elastic Clusters is now available in all AWS Regions where Amazon DocumentDB is available, except China and AWS GovCloud. To learn more, visit the Amazon DocumentDB page.

Veliswa x

New — Amazon Athena for Apache Spark

Post Syndicated from Donnie Prakoso original https://aws.amazon.com/blogs/aws/new-amazon-athena-for-apache-spark/

When Jeff Barr first announced Amazon Athena in 2016, it changed my perspective on interacting with data. With Amazon Athena, I can interact with my data in just a few steps—starting from creating a table in Athena, loading data using connectors, and querying using the ANSI SQL standard.

Over time, various industries, such as financial services, healthcare, and retail, have needed to run more complex analyses for a variety of formats and sizes of data. To facilitate complex data analysis, organizations adopted Apache Spark. Apache Spark is a popular, open-source, distributed processing system designed to run fast analytics workloads for data of any size.

However, building the infrastructure to run Apache Spark for interactive applications is not easy. Customers need to provision, configure, and maintain the infrastructure on top of the applications. Not to mention performing optimal tuning resources to avoid slow application starts and suffering from idle costs.

Introducing Amazon Athena for Apache Spark
Today, I’m pleased to announce Amazon Athena for Apache Spark. With this feature, we can run Apache Spark workloads, use Jupyter Notebook as the interface to perform data processing on Athena, and programmatically interact with Spark applications using Athena APIs. We can start Apache Spark in under a second without having to manually provision the infrastructure.

Here’s a quick preview:

Quick preview of Amazon Athena for Apache Spark

How It Works
Since Amazon Athena for Apache Spark runs serverless, this benefits customers in performing interactive data exploration to gain insights without the need to provision and maintain resources to run Apache Spark. With this feature, customers can now build Apache Spark applications using the notebook experience directly from the Athena console or programmatically using APIs.

The following figure explains how this feature works:

How Amazon Athena for Apache Spark works

On the Athena console, you can now run notebooks and run Spark applications with Python using Jupyter notebooks. In this Jupyter notebook, customers can query data from various sources and perform multiple calculations and data visualizations using Spark applications without context switching.

Amazon Athena integrates with AWS Glue Data Catalog, which helps customers to work with any data source in AWS Glue Data Catalog, including data in Amazon S3. This opens possibilities for customers in building applications to analyze and visualize data to explore data to prepare data sets for machine learning pipelines.

As I demonstrated in the demo preview section, the initialization for the workgroup running the Apache Spark engine takes under a second to run resources for interactive workloads. To make this possible, Amazon Athena for Apache Spark uses Firecracker, a lightweight micro-virtual machine, which allows for instant startup time and eliminates the need to maintain warm pools of resources. This benefits customers who want to perform interactive data exploration to get insights without having to prepare resources to run Apache Spark.

Get Started with Amazon Athena for Apache Spark
Let’s see how we can use Amazon Athena for Apache Spark. In this post, I will explain step-by-step how to get started with this feature.

The first step is to create a workgroup. In the context of Athena, a workgroup helps us to separate workloads between users and applications.

To create a workgroup, from the Athena dashboard, select Create Workgroup.

Select Create Workgroup

On the next page, I give the name and description for this workgroup.

Creating a workgroup

On the same page, I can choose Apache Spark as the engine for Athena. In addition, I also need to specify a service role with appropriate permissions to be used inside a Jupyter notebook. Then, I check Turn on example notebook, which makes it easy for me to get started with Apache Spark inside Athena. I also have the option to encrypt Jupyter notebooks managed by Athena or use the key I have configured in AWS Key Management Service (AWS KMS).

After that, I need to define an Amazon Simple Storage Service (Amazon S3) bucket to store calculation results from the Jupyter notebook. Once I’m sure of all the configurations for this workgroup, I just have to select Create workgroup.

Configure Calculation Results Settings

Now, I can see the workgroup already created in Athena.

Select newly created workgroup

To see the details of this workgroup, I can select the link from the workgroup. Since I also checked the Turn on example notebook when creating this workgroup, I have a Jupyter notebook to help me get started. Amazon Athena also provides flexibility for me to import existing notebooks that I can upload from my laptop with Import file or create new notebooks from scratch by selecting Create notebook.

Example notebook is available in the workgroup

When I select the Jupyter notebook example, I can start building my Apache Spark application.

When I run a Jupyter notebook, it automatically creates a session in the workgroup. Subsequently, each time I run a calculation inside the Jupyter notebook, all results will be recorded in the session. This way, Athena provides me with full information to review each calculation by selecting Calculation ID, which took me to the Calculation details page. Here, I can review the Code and also Results for the calculation.

Review code and results of a calculation

In the session, I can adjust the Coordinator size and Executor size, with 1 data processing unit (DPU) by default. A DPU consists of 4 vCPU and 16 GB of RAM. Changing to a larger DPU allows me to process tasks faster if I have complex calculations.

Configuring session parameters

Programmatic API Access
In addition to using the Athena console, I can also use programmatic access to interact with the Spark application inside Athena. For example, I can create a workgroup with the create-work-group command, start a notebook with create-notebook, and run a notebook session with start-session.

Using programmatic access is useful when I need to execute commands such as building reports or computing data without having to open the Jupyter notebook.

With my Jupyter notebook that I’ve created before, I can start a session by running the following command with the AWS CLI:

$> aws athena start-session \
    --work-group <WORKGROUP_NAME>\
    --engine-configuration '{"CoordinatorDpuSize": 1, "MaxConcurrentDpus":20, "DefaultExecutorDpuSize": 1, "AdditionalConfigs":{"NotebookId":"<NOTEBOOK_ID>"}}'
    --notebook-version "Jupyter 1"
    --description "Starting session from CLI"

{
    "SessionId":"<SESSION_ID>",
    "State":"CREATED"
}

Then, I can run a calculation using the start-calculation-execution API.

$ aws athena start-calculation-execution \
    --session-id "<SESSION_ID>"
    --description "Demo"
    --code-block "print(5+6)"

{
    "CalculationExecutionId":"<CALCULATION_EXECUTION_ID>",
    "State":"CREATING"
}

In addition to using code inline, with the --code-block flag, I can also pass input from a Python file using the following command:

$ aws athena start-calculation-execution \
    --session-id "<SESSION_ID>"
    --description "Demo"
    --code-block file://<PYTHON FILE>

{
    "CalculationExecutionId":"<CALCULATION_EXECUTION_ID>",
    "State":"CREATING"
}

Pricing and Availability
Amazon Athena for Apache Spark is available today in the following AWS Regions: US East (Ohio), US East (N. Virginia), US West (Oregon), Asia Pacific (Tokyo), and Europe (Ireland). To use this feature, you are charged based on the amount of compute usage defined by the data processing unit or DPU per hour. For more information see our pricing page here.

To get started with this feature, see Amazon Athena for Apache Spark to learn more from the documentation, understand the pricing, and follow the step-by-step walkthrough.

Happy building,

Donnie

AWS Verified Access Preview — VPN-less Secure Network Access to Corporate Applications

Post Syndicated from Sébastien Stormacq original https://aws.amazon.com/blogs/aws/aws-verified-access-preview-vpn-less-secure-network-access-to-corporate-applications/

Today, we announced the preview of AWS Verified Access, a new secure connectivity service that allows enterprises to enable local or remote secure access for their corporate applications without requiring a VPN.

Traditionally, remote access to applications when on the road or working from home is granted by a VPN. Once the remote workforce is authenticated on the VPN, they have access to a broad range of applications depending on multiple policies defined in siloed systems, such as the VPN gateway, the firewalls, the identity provider, the enterprise device management solution, etc. These policies are typically managed by different teams, potentially creating overlaps, making it difficult to diagnose application access issues. Internal applications often rely on older authentication protocols, like Kerberos, that were built with the LAN in mind, instead of modern protocols, like OIDC, that are better tuned to modern enterprise patterns. Customers told us that policy updates can take months to roll out.

Verified Access is built using the AWS Zero Trust security principles. Zero Trust is a conceptual model and an associated set of mechanisms that focus on providing security controls around digital assets that do not solely or fundamentally depend on traditional network controls or network perimeters.

Verified Access improves your organization’s security posture by leveraging multiple security inputs to grant access to applications. It grants access to applications only when users and their devices meet the specified security requirements. Examples of inputs are the user identity and role or the device security posture, among others. Verified Access validates each application request, regardless of user or network, before granting access. Having each application access request evaluated allows Verified Access to adapt the security posture based on changing conditions. For example, if the device security signals that your device posture is out of compliance, then Verified Access will not allow you to access the application anymore.

In my opinion, there are three main benefits when adopting Verified Access:

It is easy to use for IT administrators. As an IT Administrator, you can now easily set up applications for secure remote access. It provides a single configuration point to manage and enforce a multisystem security policy to allow or deny access to your corporate applications.

It provides an open ecosystem that allows you to retain your existing identity provider and device management system. I listed all our partners at the end of this post.

It is easy to use for end users. This is my preferred one. Your workforce is not required to use a VPN client anymore. A simple browser plugin is enough to securely grant access when the user and the device are identified and verified. As of today, we support Chrome and Firefox web browsers. This is something about which I can share my personal experience. Amazon adopted a VPN-less strategy a few years ago. It’s been a relief for my colleagues and me to be able to access most of our internal web applications without having to start a VPN client and keep it connected all day long.

Let’s See It in Action
I deployed a web server in a private VPC and exposed it to my end users through a private application load balancer (https://demo.seb.go-aws.com). I created a TLS certificate for the application external endpoint (secured.seb.go-aws.com). I also set up AWS Identity Center (successor of AWS SSO). In this demo, I will use it as a source for user identities. Now I am ready to expose this application to my remote workforce.

Verified Access - Demo application

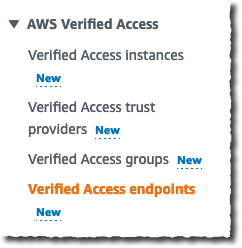
Creating a Verified Access endpoint is a four-step process. To get started, I navigate to the VPC page of the AWS Management Console. I first create the trust provider. A trust provider maintains and manages identity information for users and devices. When an application request is made, the identity information sent by the trust provider will be evaluated by Verified Access before allowing or denying the application request. I select Verified Access trust provider on the left-side navigation pane.

Verified Access navigation menu

On the Create Verified Access trust provider page, I enter a Name and an optional Description. I enter the Policy reference name, an identifier that will be used when working with policy rules. I select the source of trust: User trust provider. For this demo, I select IAM Identity Center as the source of trust for user identities. Verified Access also works with other OpenID Connect-compliant providers. Finally, I select Create Verified Access trust provider.

Verified Access - Create trust provider

I may repeat the operation when I have multiple trust providers. For example, I might have an identity-based trust provider to verify the identity of my end users and a device-based trust provider to verify the security posture of their devices.

I then create the Verified Identity instance. A Verified Access instance is a Regional AWS entity that evaluates application requests and grants access only when your security requirements are met.

On the Create Verified Access instance page, I enter a Name and an optional Description. I select the trust provider I just created. I can add additional trust provider types once the Verified Access instance is created.

Verified Access - Create instance

Third, I create a Verified Access group.

A Verified Access group is a collection of applications that have similar security requirements. Each application within a Verified Access group shares a group-level policy. For example, you can group together all applications for “finance” users and use one common policy. This simplifies your policy management. You can use a single policy for a group of applications with similar access needs.

On the Create Verified Access group page, I enter a Name only. I will enter a policy at a later stage.

Verified Access - Create access groupThe fourth and last step before testing my setup is to create the endpoint.

A Verified Access endpoint is a regional resource that specifies the application that Verified Access will be providing access to. This is where your end users connect to. Each endpoint has its own DNS name and TLS certificate. After having evaluated incoming requests, the endpoint forwards authorized requests to your internal application, either an internal load balancer or a network interface. Verified Access supports network-level and application-level load balancers.

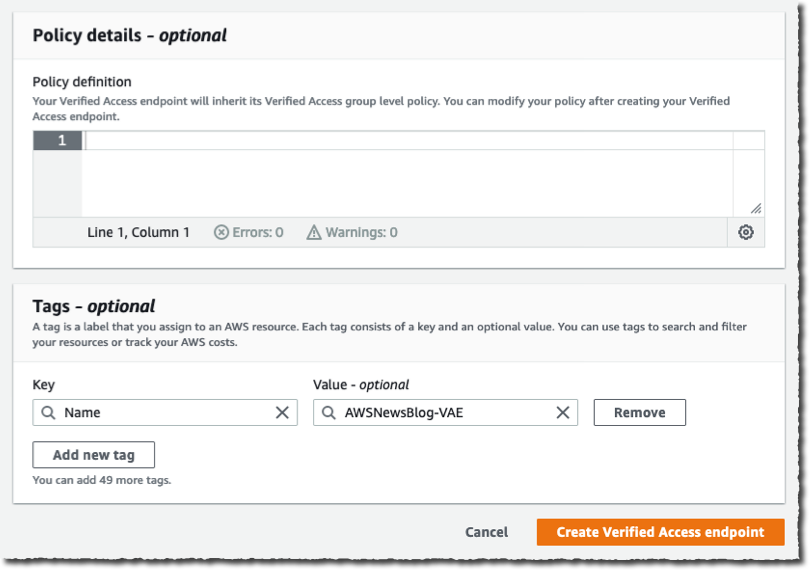
On the Create Verified Access endpoint page, I enter a Name and Description. I reference the Verified Access group that I just created.

In the Application details section, under Application domain, I enter the DNS name end users will use to access the application. For this demo, I use secured.seb.go-aws.com. Under Domain certificate ARN, I select a TLS certificate matching the DNS name. I created the certificate using AWS Certificate Manager.

Verified Access - Create endpoint - part 1

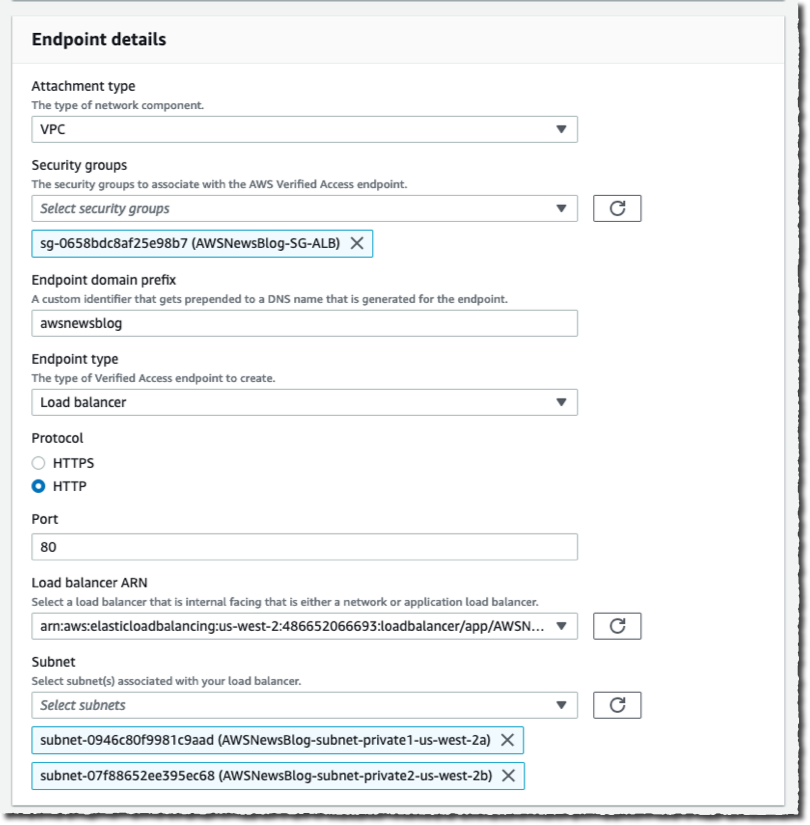
On the Endpoint details section, I select VPC as Attachment type. I select one or multiple Security groups to attach to this endpoint. I enter awsnewsblog as Endpoint domain prefix. I select load balancer as Endpoint type. I select the Protocol (HTTP), then I enter the Port (80). I select the Load balancer ARN and the private Subnets where my load balancer is deployed.

Verified Access - Create endpoint - part 2

Again, I leave the Policy details section empty. I will define a policy in the group instead. When I am done, I select Create Verified Access endpoint. It might take a few minutes to create.

Verified Access - Create endpoint - part 3

Now it is time to grab a coffee and stretch my legs. When I return, I see the Verified Access endpoint is ✅ Active. I copy the Endpoint domain and add it as a CNAME record to my application DNS name (secured.seb.go-aws.com). I use Amazon Route 53 for this, but you can use your existing DNS server as well.

Verified Access - endpoint detailsThen, I point my favorite browser to https://secured.seb.go-aws.com. The browser is redirected to IAM Identity Center (formerly AWS SSO). I enter the username and password of my test user. I am not adding a screenshot for this. After the redirection, I receive the error message : Unauthorized. This is expected because there is no policy defined on the Verified Access endpoint. It denies every request by default.

On the Verified Access groups page, I select the Policy tab. Then I select the Modify Verified Access endpoint policy button to create an access policy.

Verified Access - group policy tab

I enter a policy allowing anybody authenticated and having an email address ending with @amazon.com. This is the email address I used for the user defined in AWS Identity Center. Note that the name after context is the name I entered as Policy reference name when I created the Verified Access trust provider. The documentation page has the details of the policy syntax, the attributes, and the operators I can use.

permit(principal, action, resource)
when {
    context.awsnewsblog.user.email.address like "*@amazon.com"
};

Verified Access - group define policy

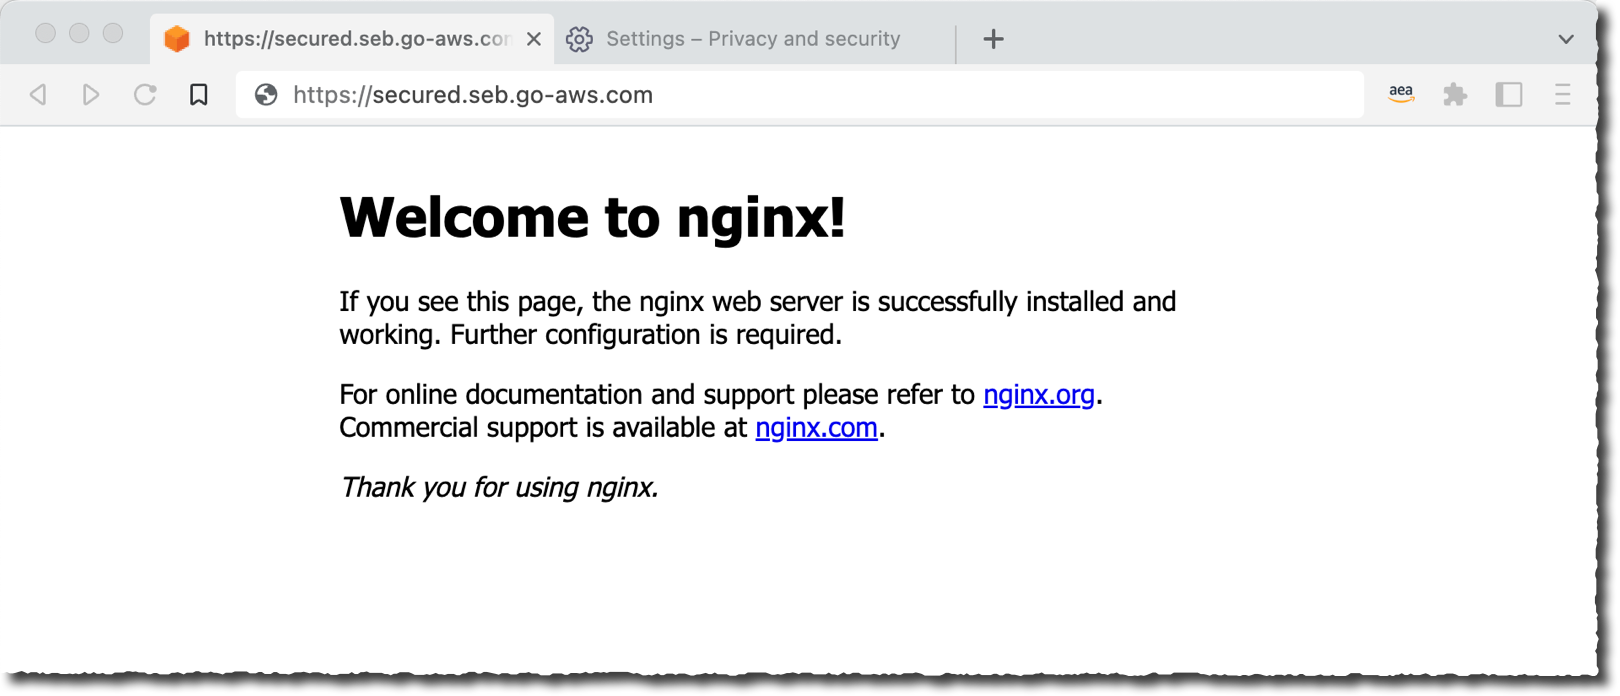
After a few minutes, Verified Access updates the policy and becomes Active again. I force my browser to refresh, and I see the internal application now available to my authenticated user.

Verified Access - access granted


Pricing and Availability

AWS Verified Access is now available in preview in 10 AWS Regions: US East (Ohio, N. Virginia), US West (N. California, Oregon), Asia Pacific (Sydney), Canada (Central), Europe (Ireland, London, Paris), and South America (São Paulo).

As usual, pricing is based on your usage. There is no upfront or fixed price. We charge per application (Verified Access endpoint) per hour, with tiers depending on the number of applications. Prices start in US East (N. Virginia) Region at $0.27 per verified Access endpoint and per hour. This price goes down to $0.20 per endpoint per hour when you have more than 200 applications.

On top of this, there is a charge of $0.02 per GB for data processed by Verified Access. You also incur standard AWS data transfer charges for all data transferred using Verified Access.

This billing model makes it easy to start small and then grow at your own pace.

Go and configure your first Verified Access access point today.

— seb

New – Announcing Automated Data Preparation for Amazon QuickSight Q

Post Syndicated from Veliswa Boya original https://aws.amazon.com/blogs/aws/new-announcing-automated-data-preparation-for-amazon-quicksight-q/

In this post that was published in September 2021, Jeff Barr announced general availability of Amazon QuickSight Q. To recap, Amazon QuickSight Q is a natural language query capability that lets business users ask simple questions of their data.

QuickSight Q is powered by machine learning (ML), providing self-service analytics by allowing you to query your data using plain language and therefore eliminating the need to fiddle with dashboards, controls, and calculations. With last year’s announcement of QuickSight Q, you can ask simple questions like “who had the highest sales in EMEA in 2021” and get your answers (with relevant visualizations like graphs, maps, or tables) in seconds.

Data used for analytics is often stored in a data warehouse like Amazon Redshift, and these unfortunately tend to be optimized for programmatic access via SQL rather than for natural language interaction. Furthermore, BI teams, understandably, tend to optimize data sources for consumption by dashboard authors, BI engineers, and other data teams, therefore using technical naming conventions that are optimized for dashboards (for example, “CUST_ID” instead of “Customer”) and SQL queries. These technical naming conventions are not intuitive to be used by business users.
To solve this, BI teams spend hours manually translating technical names into commonly used business language names to prepare the data for natural language questions.

Today, I’m excited to announce automated data preparation for Amazon QuickSight Q. Automated data preparation utilizes machine learning to infer semantic information about data and adds it to datasets as metadata about the columns (fields), making it faster for you to prepare data in order to support natural language questions.

A Quick Overview of Topics in QuickSight Q
Topics became available with the introduction of QuickSight Q. Topics are a collection of one or more datasets that represent a subject area that your business users can ask questions about. Looking at the example mentioned earlier (“who had the highest sales in EMEA in 2021”), one or more datasets (for example, a Sales/Regional Sales dataset) would be selected during the creation of this Topic.

As the author, once the Topic is created:

  • You would spend time selecting the most relevant columns from the dataset to add to the Topic (for example, excluding time_stamp, date_stamp columns, etc.). This can be challenging because without visibility to usage data of columns in dashboards and reports, you can find it hard to objectively decide which columns are most relevant to your business users to include in a Topic.
  • You would then spend hours reviewing the data and manually curating it to set configurations that are specific to natural language (for example, add “Area” as a synonym for the “Region” column).
  • Lastly, you would spend time formatting the data in order to ensure that it is more useful when presented.
  • QuickSight Q Topic

    QuickSight Q Topic

How Does Automated Data Preparation for Amazon QuickSight Q Work?
Creating from Analysis: The new automated data preparation for Amazon QuickSight Q saves time by enabling the capability to create a Topic from analysis and therefore saving you the hours that you would spend doing all the translation by automatically choosing user-friendly names and synonyms based on ML-trained models that seek to find synonyms and common terms for the data field in question. Moreover, instead of you selecting the most relevant columns, automated data preparation for Amazon QuickSight Q automatically selects high-value columns based on how they are used in the analysis. It then binds the Topic to this existing analysis’ dataset and prepares an index of unique string values within the data to enable natural language search.

Automated Field Selection and Classification: I mentioned earlier that automated data preparation for Amazon QuickSight Q selects high value columns, but how does it know which columns are high-value? Automated data preparation for Amazon QuickSight Q automates column selection based on signals from existing QuickSight assets, such as reports or dashboards, to help you create a Topic that is relevant to your business users. In addition to selecting high-value fields from a dataset, automated data preparation for Amazon QuickSight Q also imports new calculated fields that the author has created in the analysis, thereby not requiring them to recreate these in a Topic.

Automated Language Settings: At the beginning of this article, I talked about technical naming conventions that are not intuitive for business users. Now, instead of you spending time translating these technical names, column names are automatically updated with friendly names and synonyms using common terms. Looking at our Sales dataset example, CUST_ID has been assigned a friendly name, “Customer”, and a number of synonyms. Synonyms will now be added automatically to columns (with the option to customize further) to support a wide vocabulary that may be relevant to your business users.

Friendly names & Synonyms for columns

Friendly Names & Synonyms for Columns

Automated Metadata Settings: Automated data preparation for Amazon QuickSight Q detects Semantic Type of a column based on the column values and updates the corresponding configuration automatically. Formats for values will now be set to be used if a particular column is presented in the answer. These formats are derived from formats that you may have defined in an analysis.

Semantic Type Settings

Semantic Type Settings

Available Today
Automated Data Preparation for Amazon QuickSight Q is available today in all AWS Regions where QuickSight Q is available. To learn more, visit the Amazon QuickSight Q page. Join the QuickSight Community to ask, answer, and learn with others in the QuickSight Community.

Veliswa x

Introducing VPC Lattice – Simplify Networking for Service-to-Service Communication (Preview)

Post Syndicated from Danilo Poccia original https://aws.amazon.com/blogs/aws/introducing-vpc-lattice-simplify-networking-for-service-to-service-communication-preview/

Modern applications are built using modular and distributed components. Each component is a service that implements its own subset of functionalities. To make these services communicate with each other, you need a way to let them discover where they are, authorize access, and route traffic. When troubleshooting issues, you need to keep communication configurations under control so that you can quickly understand what is happening at the application, service, and network levels. This can take a lot of your time.

Today, we are making available in preview Amazon VPC Lattice, a new capability of Amazon Virtual Private Cloud (Amazon VPC) that gives you a consistent way to connect, secure, and monitor communication between your services. With VPC Lattice, you can define policies for traffic management, network access, and monitoring so you can connect applications in a simple and consistent way across AWS compute services (instances, containers, and serverless functions). VPC Lattice automatically handles network connectivity between VPCs and accounts and network address translation between IPv4, IPv6, and overlapping IP addresses. VPC Lattice integrates with AWS Identity and Access Management (IAM) to give you the same authentication and authorization capabilities you are familiar with when interacting with AWS services today, but for your own service-to-service communication. With VPC Lattice, you have common controls to route traffic based on request characteristics and weighted routing for blue/green and canary-style deployments. For example, VPC Lattice allows you to mix and match compute types for a given service, which helps you modernize a monolith application architecture to microservices.

VPC Lattice is designed to be noninvasive, allowing teams across your organization to incrementally opt in over time. In this way, you are able to deliver applications faster by focusing on your application logic, while VPC Lattice handles service-to-service networking, security, and monitoring requirements.

How Amazon VPC Lattice Works
With VPC Lattice, you create a logical application layer network, called a service network, that connects clients and services across different VPCs and accounts, abstracting network complexity. A service network is a logical boundary that is used to automatically implement service discovery and connectivity as well as apply access and observability policies to a collection of services. It offers inter-application connectivity over HTTP/HTTPS and gRPC protocols within a VPC.

Once a VPC has been enabled for a service network, clients in the VPC will automatically be able to discover the services in the service network through DNS and will direct all inter-application traffic through VPC Lattice. You can use AWS Resource Access Manager (RAM) to control which accounts, VPCs, and applications can establish communication via VPC Lattice.

A service is an independently deployable unit of software that delivers a specific task or function. In VPC Lattice, a service is a logical component that can live in any VPC or account and can run on a mixture of compute types (virtual machines, containers, and serverless functions). A service configuration consists of:

  • One or two listeners that define the port and protocol that the service is expecting traffic on. Supported protocols are HTTP/1.1, HTTP/2, and gRPC, including HTTPS for TLS-enabled services.
  • Listeners have rules that consist of a priority, which specifies the order in which rules should be processed, one or more conditions that define when to apply the rule, and actions that forward traffic to target groups. Each listener has a default rule that takes effect when no additional rules are configured, or no conditions are met.
  • A target group is a collection of targets, or compute resources, that are running a specific workload you are trying to route toward. Targets can be Amazon Elastic Compute Cloud (Amazon EC2) instances, IP addresses, and Lambda functions. For Kubernetes workloads, VPC Lattice can target services and pods via the AWS Gateway Controller for Kubernetes. To have access to the AWS Gateway Controller for Kubernetes, you can join the preview.

VPC Lattice logical architecture.

To configure service access controls, you can use access policies. An access policy is an IAM resource policy that can be associated with a service network and individual services. With access policies, you can use the “PARC” (principal, action, resource, and condition) model to enforce context-specific access controls for services. For example, you can use an access policy to define which services can access a service you own. If you use AWS Organizations, you can limit access to a service network to a specific organization.

VPC Lattice also provides a service directory, a centralized view of the services that you own or have been shared with you via AWS RAM.

Using Amazon VPC Lattice
We expect people with different roles can use VPC Lattice. For example:

  • The service network administrator can:
    • Create and manage a service network.
    • Define access and monitoring for the service network.
    • Associate client and services.
    • Share the service network with other AWS accounts.
  • The service owner can:
    • Create and manage a service, including access and monitoring.
    • Define routing, for example, configuring listeners and rules that point to the target groups where the service is running.
    • Associate a service to service networks.

Let’s see how this works in practice. In this quick walkthrough, I am covering both roles.

Creating Two Backend Services
There is nothing specific to VPC Lattice in this section. I am just creating a couple of services, one running on Amazon EC2 and one on AWS Lambda, that I’ll use later when I configure networking with VPC Lattice.

In an Amazon Linux EC2 instance, I create a web app that replies “Hello from the instance” to HTTP requests. To allow access to the instance from clients coming via VPC Lattice, I add an inbound rule to the security group to allow TCP traffic on port 8080 from the VPC Lattice AWS-managed prefix list.

Here’s the app.py file. I am using Python and Flask for this app, but you don’t need to know them to follow along with the post.

from flask import Flask

app = Flask(__name__)

@app.route('/')
def index():
  return 'Hello from the instance'

@app.route('/<path>')
def somePath(path):
  return 'Hello from the instance at path "{}"'.format(path)

app.run(host='0.0.0.0', port=8080)

Here’s the requirements.txt file with the Python dependencies. There’s only one line because the only module I need is flask:

flask

I install the dependencies:

pip3 install -r requirements.txt

Then, I start the web app using the nohup command to keep it running in case I log out of the instance:

nohup flask run --host=0.0.0.0 --port 8080 &

On the EC2 instance, the web service is now listening to HTTP traffic on port 8080.

In the Lambda console, I create a simple function using the Node.js 18.x runtime that replies “Hello from the function” to all invocations.

exports.handler = async (event) => {
    const response = {
        statusCode: 200,
        body: JSON.stringify('Hello from the function'),
    };
    return response;
};

The two services are now both ready. Let’s use VPC Lattice to configure networking.

Creating VPC Lattice Target Groups
I start by creating two target groups, one for the EC2 instance and one for the Lambda function. In the VPC console, there is a new VPC Lattice section in the navigation pane. There, I choose Target groups and then Create target group.

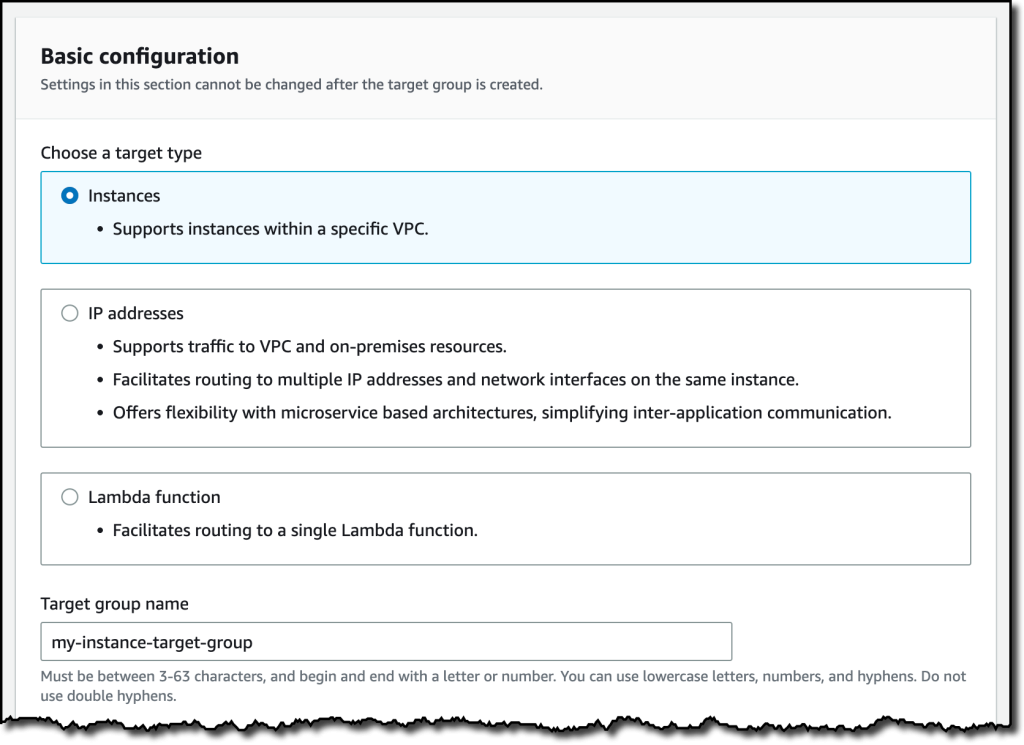
For the first target group, I choose the Instances target type and enter a name.

Console screenshot.

I choose the protocol (HTTP) and port (8080) used by the web app running on the instance. I select the VPC where the instance is running and the protocol version (HTTP1).

Console screenshot.

Now I can configure the health check that will be used to test the target status. In this case, I use the default values proposed by the console.

Console screenshot.

In the next step, I can register the targets. I select the instance on which the web app is running from the list and choose to include it.

Console screenshot.

I review the selected targets (one instance in this case) and choose Submit.

In a similar way, I create a target group for the Lambda function. This time, I select the function from the list. I can choose which function version or function alias to use. For simplicity, I use the $LATEST version.

Console screenshot.

Creating VPC Lattice Services
Now that the target groups are ready, I choose Services in the navigation pane and then Create service. I enter a name and a description.

Console screenshot.

Now, I can choose the authentication type. If I choose None, the service network does not authenticate or authorize client access, and the auth policy, if present, is not used. I select AWS IAM and then, from the Apply policy template dropdown, the template that allows both authenticated and unauthenticated access.

Console screenshot.

In the Monitoring section, I turn on Access logs. As the destination for the access logs, I use an Amazon CloudWatch Log group that I created before. I also have the option to use an Amazon Simple Storage Service (Amazon S3) bucket or a Amazon Kinesis Data Firehose delivery stream.

Console screenshot.

In the next step, I define routing for the service. I choose Add listener. For the protocol, I configure the service to listen using HTTPS. In the default action, I choose to send two-thirds (Weight 20) of the requests to the instance target group and one-third (Weight 10) to the function target group.

Console screenshot.

Then, I add two additional rules. The first rule (Priority 10) sends all requests where the path is /to-instance to the instance target group.

Console screenshot.

The second rule (Priority 20) sends all traffic where the path is /to-function to the function target group.

Console screenshot.

In the next step, I am asked to associate the service with one or more service networks. I didn’t create a service network yet, so I skip this step for now and choose Next. I review the configuration and create the service.

Creating VPC Lattice Service Networks
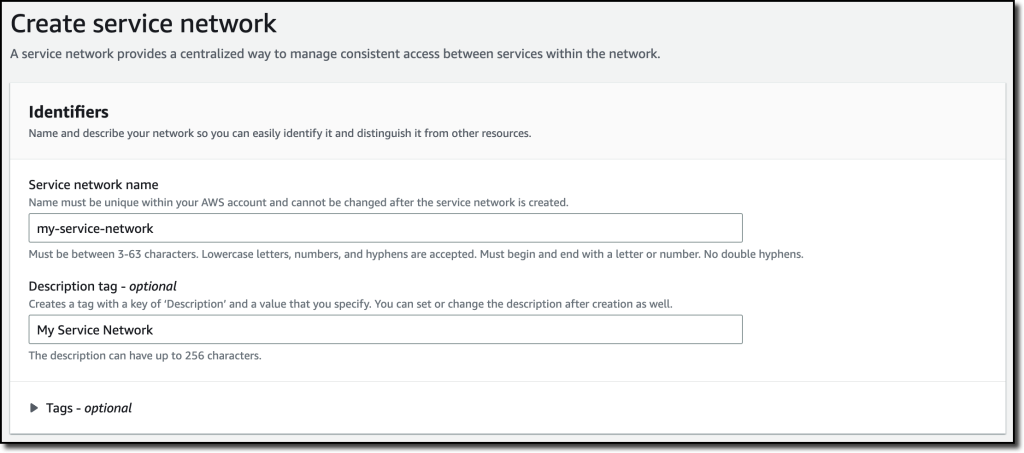
Now, I create the service network so that I can associate the service and the VPCs I want to use. I choose Service network from the navigation pane and then Create service network. I enter a name and a description for the service network.

Console screenshot.

In the Associate services, I select the service I just created.

Console screenshot.

In the VPC associations, I select the VPC used by the instance where the web app runs. This can help in the future because it allows the web app to call other services associated with the service network.

Console screenshot.

Then, I select a second VPC where I have another EC2 instance that I want to use to run some tests.

Console screenshot.

For simplicity, in the Access section, I select the None auth type.

Console screenshot.

In the Monitoring section, I choose to send the access logs for the whole service network to an S3 bucket.

Console screenshot.

I review the summary of the configuration and create the service network. After a few seconds all service and VPC associations are active, and I can start using the service.

I write down the domain name of the service from the list of service associations.

Console screenshot.

Testing Access to the Service Using VPC Lattice
I look at the Routing tab of the service to find a nice recap of how the listener is handling routing towards the different target groups.

Console screenshot.

Then, I log into the EC2 instance in my second VPC and use curl to call the service domain name. As expected, I get about two-thirds of the responses from the instance and one-third from the function.

curl https://my-service-03e92ee54968d87ca.7d67968.vpc-lattice-svcs.us-west-2.on.aws
Hello from the instance

curl https://my-service-03e92ee54968d87ca.7d67968.vpc-lattice-svcs.us-west-2.on.aws
Hello from the instance

curl https://my-service-03e92ee54968d87ca.7d67968.vpc-lattice-svcs.us-west-2.on.aws
"Hello from the function"

When I call the /to-instance and /to-function paths, the additional rules forward the requests to the instance and the function, respectively.

curl https://my-service-03e92ee54968d87ca.7d67968.vpc-lattice-svcs.us-west-2.on.aws/to-instance
Hello from the instance "to-instance" path

curl https://my-service-03e92ee54968d87ca.7d67968.vpc-lattice-svcs.us-west-2.on.aws/to-function
"Hello from the function"

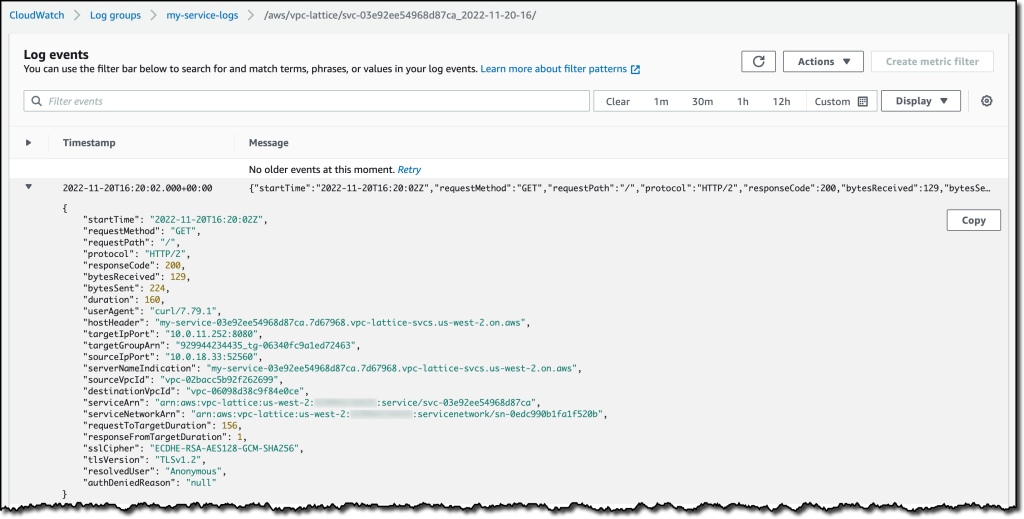
I can now review access to my service using the access log subscriptions I configured before.

For the service, I look in the CloudWatch Log group. There, I find a log stream containing detailed access information about the service.

Console screenshot.

The access log for all services associated with the service network is on the S3 bucket. I have only one service for now, but more are coming.

Console screenshot.

Available in Preview
Amazon VPC Lattice is available in preview in the US West (Oregon) Region.

VPC Lattice provides deployment consistency across AWS compute types so that you can connect your services across instances, containers, and serverless functions. You can use VPC Lattice to apply granular and rich traffic controls, such as policy-based routing and weighted targets to support blue/green and canary-style deployments.

VPC Lattice allows monitoring and troubleshooting service-to-service communication with detailed access logs and metrics that capture request type, volume of traffic, error rates, response time, and more. In this blog post, I only scratched the surface of what you can do with VPC Lattice.

Simplify the way you connect, secure, and monitor service-to-service communication with Amazon VPC Lattice.

Announcing AWS KMS External Key Store (XKS)

Post Syndicated from Sébastien Stormacq original https://aws.amazon.com/blogs/aws/announcing-aws-kms-external-key-store-xks/

I am excited to announce the availability of AWS Key Management Service (AWS KMS) External Key Store. Customers who have a regulatory need to store and use their encryption keys on premises or outside of the AWS Cloud can now do so. This new capability allows you to store AWS KMS customer managed keys on a hardware security module (HSM) that you operate on premises or at any location of your choice.

At a high level, AWS KMS forwards API calls to securely communicate with your HSM. Your key material never leaves your HSM. This solution allows you to encrypt data with external keys for the vast majority of AWS services that support AWS KMS customer managed keys, such as Amazon EBS, AWS Lambda, Amazon S3, Amazon DynamoDB, and over 100 more services. There is no change required to your existing AWS services’ configuration parameters or code.

This helps you unblock use cases for a small portion of regulated workloads where encryption keys should be stored and used outside of an AWS data center. But this is a major change in the way you operate cloud-based infrastructure and a significant shift in the shared responsibility model. We expect only a small percentage of our customers to enable this capability. The additional operational burden and greater risks to availability, performance, and low latency operations on protected data will exceed—for most cases—the perceived security benefits from AWS KMS External Key Store.

Let me dive into the details.

A Brief Recap on Key Management and Encryption
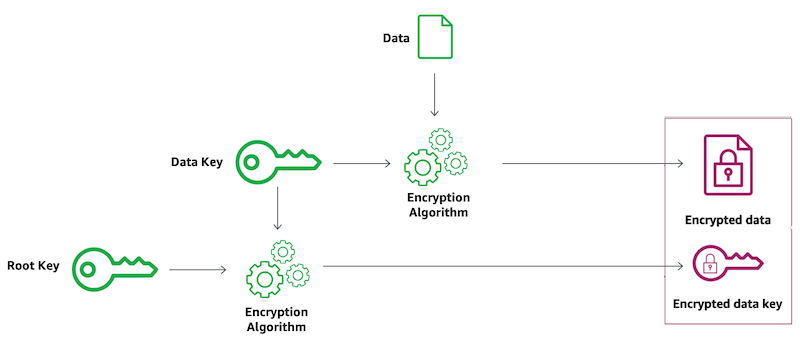
When an AWS service is configured to encrypt data at rest, the service requests a unique encryption key from AWS KMS. We call this the data encryption key. To protect data encryption keys, the service also requests that AWS KMS encrypts that key with a specific KMS customer managed key, also known as a root key. Once encrypted, data keys can be safely stored alongside the data they protect. This pattern is called envelope encryption. Imagine an envelope that contains both the encrypted data and the encrypted key that was used to encrypt these data.

But how do we protect the root key? Protecting the root key is essential as it allows the decryption of all data keys it encrypted.

The root key material is securely generated and stored in a hardware security module, a piece of hardware designed to store secrets. It is tamper-resistant and designed so that the key material never leaves the secured hardware in plain text. AWS KMS uses HSMs that are certified under the NIST 140-2 Cryptographic Module certification program.

You can choose to create root keys tied to data classification, or create unique root keys to protect different AWS services, or by project tag, or associated to each data owner, and each root key is unique to each AWS Region.

AWS KMS calls the root keys customer managed keys when you create and manage the keys yourself. They are called AWS managed keys when they are created on behalf of an AWS service that encrypts data, such as Amazon Elastic Block Store (Amazon EBS), Amazon Simple Storage Service (Amazon S3), Amazon Relational Database Service (RDS), or Amazon DynamoDB. For simplicity, let’s call them KMS keys. These are the root keys, the ones that never leave the secured HSM environment. All KMS encryption and decryption operations happen in the secured environment of the HSM.

The XKS Proxy Solution
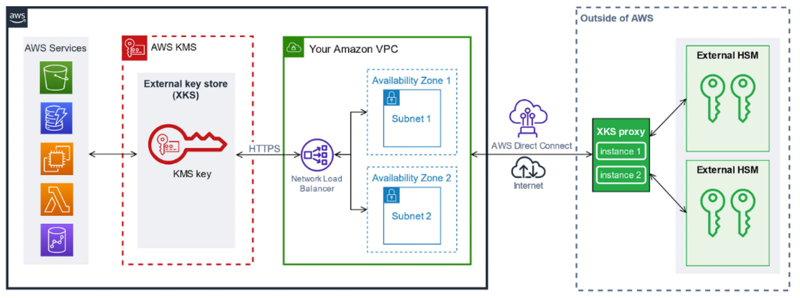
When configuring AWS KMS External Key Store (XKS), you are replacing the KMS key hierarchy with a new, external root of trust. The root keys are now all generated and stored inside an HSM you provide and operate. When AWS KMS needs to encrypt or decrypt a data key, it forwards the request to your vendor-specific HSM.

All AWS KMS interactions with the external HSM are mediated by an external key store proxy (XKS proxy), a proxy that you provide, and you manage. The proxy translates generic AWS KMS requests into a format that the vendor-specific HSMs can understand.

The HSMs that XKS communicates with are not located in AWS data centers.

XKS architecture

To provide customers with a broad range of external key manager options, AWS KMS developed the XKS specification with feedback from several HSM, key management, and integration service providers, including Atos, Entrust, Fortanix, HashiCorp, Salesforce, Thales, and T-Systems. For information about availability, pricing, and how to use XKS with solutions from these vendors, consult the vendor directly.

In addition, we will provide a reference implementation of an XKS proxy that can be used with SoftHSM or any HSM that supports a PKCS #11 interface. This reference implementation XKS proxy can be run as a container, is built in Rust, and will be available via GitHub in the coming weeks.

Once you have completed the setup of your XKS proxy and HSM, you can create a corresponding external key store resource in KMS. You create keys in your HSM and map these keys to the external key store resource in KMS. Then you can use these keys with AWS services that support customer keys or your own applications to encrypt your data.

Each request from AWS KMS to the XKS proxy includes meta-data such as the AWS principal that called the KMS API and the KMS key ARN. This allows you to create an additional layer of authorization controls at the XKS proxy level, beyond those already provided by IAM policies in your AWS accounts.

The XKS proxy is effectively a kill switch you control. When you turn off the XKS proxy, all new encrypt and decrypt operations using XKS keys will cease to function. AWS services that have already provisioned a data key into memory for one of your resources will continue to work until either you deactivate the resource or the service key cache expires. For example, Amazon S3 caches data keys for a few minutes when bucket keys are enabled.

The Shift in Shared Responsibility
Under standard cloud operating procedures, AWS is responsible for maintaining the cloud infrastructure in operational condition. This includes, but is not limited to, patching the systems, monitoring the network, designing systems for high availability, and more.

When you elect to use XKS, there is a fundamental shift in the shared responsibility model. Under this model, you are responsible for maintaining the XKS proxy and your HSM in operational condition. Not only do they have to be secured and highly available, but also sized to sustain the expected number of AWS KMS requests. This applies to all components involved: the physical facilities, the power supplies, the cooling system, the network, the server, the operating system, and more.

Depending on your workload, AWS KMS operations may be critical to operating services that require encryption for your data at rest in the cloud. Typical services relying on AWS KMS for normal operation include Amazon Elastic Block Store (Amazon EBS), Lambda, Amazon S3, Amazon RDS, DynamoDB, and more. In other words, it means that when the part of the infrastructure under your responsibility is not available or has high latencies (typically over 250 ms), AWS KMS will not be able to operate, cascading the failure to requests that you make to other AWS services. You will not be able to start an EC2 instance, invoke a Lambda function, store or retrieve objects from S3, connect to your RDS or DynamoDB databases, or any other service that relies on AWS KMS XKS keys stored in the infrastructure you manage.

As one of the product managers involved in XKS told me while preparing this blog post, “you are running your own tunnel to oxygen through a very fragile path.”

We recommend only using this capability if you have a regulatory or compliance need that requires you to maintain your encryption keys outside of an AWS data center. Only enable XKS for the root keys that support your most critical workloads. Not all your data classification categories will require external storage of root keys. Keep the data set protected by XKS to the minimum to meet your regulatory requirements, and continue to use AWS KMS customer managed keys—fully under your control—for the rest.

Some customers for which external key storage is not a compliance requirement have also asked for this feature in the past, but they all ended up accepting one of the existing AWS KMS options for cloud-based key storage and usage once they realized that the perceived security benefits of an XKS-like solution didn’t outweigh the operational cost.

What Changes and What Stays the Same?
I tried to summarize the changes for you.

What is identical
to standard AWS KMS keys
What is changing

The supported AWS KMS APIs and key identifiers (ARN) are identical. AWS services that support customer managed keys will work with XKS.

The way to protect access and monitor access from the AWS side is unchanged. XKS uses the same IAM policies and the same key policies. API calls are logged in AWS CloudTrail, and AWS CloudWatch has the usage metrics.

The pricing is the same as other AWS KMS keys and API operations.

XKS does not support asymmetric or HMAC keys managed in the HSM you provide.

You now own the concerns of availability, durability, performance, and latency boundaries of your encryption key operations.

You can implement another layer of authorization, auditing, and monitoring at XKS proxy level. XKS resides in your network.

While the KMS price stays the same, your expenses are likely to go up substantially to procure an HSM and maintain your side of the XKS-related infrastructure in operational condition.

An Open Specification
For those strictly regulated workloads, we are developing XKS as an open interoperability specification. Not only have we collaborated with the major vendors I mentioned already, but we also opened a GitHub repository with the following materials:

  • The XKS proxy API specification. This describes the format of the generic requests KMS sends to an XKS proxy and the responses it expects. Any HSM vendor can use the specification to create an XKS proxy for their HSM.
  • A reference implementation of an XKS proxy that implements the specification. This code can be adapted by HSM vendors to create a proxy for their HSM.
  • An XKS proxy test client that can be used to check if an XKS proxy complies with the requirements of the XKS proxy API specification.

Other vendors, such as SalesForce, announced their own XKS solution allowing their customers to choose their own key management solution and plug it into their solution of choice, including SalesForce.

Pricing and Availability
External Key Store is provided at no additional cost on top of AWS KMS. AWS KMS charges $1 per root key per month, no matter where the key material is stored, on KMS, on CloudHSM, or on your own on-premises HSM.

For a full list of Regions where AWS KMS XKS is currently available, visit our technical documentation.

If you think XKS will help you to meet your regulatory requirements, have a look at the technical documentation and the XKS FAQ.

— seb

New for Amazon Redshift – General Availability of Streaming Ingestion for Kinesis Data Streams and Managed Streaming for Apache Kafka

Post Syndicated from Danilo Poccia original https://aws.amazon.com/blogs/aws/new-for-amazon-redshift-general-availability-of-streaming-ingestion-for-kinesis-data-streams-and-managed-streaming-for-apache-kafka/

Ten years ago, just a few months after I joined AWS, Amazon Redshift was launched. Over the years, many features have been added to improve performance and make it easier to use. Amazon Redshift now allows you to analyze structured and semi-structured data across data warehouses, operational databases, and data lakes. More recently, Amazon Redshift Serverless became generally available to make it easier to run and scale analytics without having to manage your data warehouse infrastructure.

To process data as quickly as possible from real-time applications, customers are adopting streaming engines like Amazon Kinesis and Amazon Managed Streaming for Apache Kafka. Previously, to load streaming data into your Amazon Redshift database, you’d have to configure a process to stage data in Amazon Simple Storage Service (Amazon S3) before loading. Doing so would introduce a latency of one minute or more, depending on the volume of data.

Today, I am happy to share the general availability of Amazon Redshift Streaming Ingestion. With this new capability, Amazon Redshift can natively ingest hundreds of megabytes of data per second from Amazon Kinesis Data Streams and Amazon MSK into an Amazon Redshift materialized view and query it in seconds.

Architecture diagram.

Streaming ingestion benefits from the ability to optimize query performance with materialized views and allows the use of Amazon Redshift more efficiently for operational analytics and as the data source for real-time dashboards. Another interesting use case for streaming ingestion is analyzing real-time data from gamers to optimize their gaming experience. This new integration also makes it easier to implement analytics for IoT devices, clickstream analysis, application monitoring, fraud detection, and live leaderboards.

Let’s see how this works in practice.

Configuring Amazon Redshift Streaming Ingestion
Apart from managing permissions, Amazon Redshift streaming ingestion can be configured entirely with SQL within Amazon Redshift. This is especially useful for business users who lack access to the AWS Management Console or the expertise to configure integrations between AWS services.

You can set up streaming ingestion in three steps:

  1. Create or update an AWS Identity and Access Management (IAM) role to allow access to the streaming platform you use (Kinesis Data Streams or Amazon MSK). Note that the IAM role should have a trust policy that allows Amazon Redshift to assume the role.
  2. Create an external schema to connect to the streaming service.
  3. Create a materialized view that references the streaming object (Kinesis data stream or Kafka topic) in the external schemas.

After that, you can query the materialized view to use the data from the stream in your analytics workloads. Streaming ingestion works with Amazon Redshift provisioned clusters and with the new serverless option. To maximize simplicity, I am going to use Amazon Redshift Serverless in this walkthrough.

To prepare my environment, I need a Kinesis data stream. In the Kinesis console, I choose Data streams in the navigation pane and then Create data stream. For the Data stream name, I use my-input-stream and then leave all other options set to their default value. After a few seconds, the Kinesis data stream is ready. Note that by default I am using on-demand capacity mode. In a development or test environment, you can choose provisioned capacity mode with one shard to optimize costs.

Now, I create an IAM role to give Amazon Redshift access to the my-input-stream Kinesis data streams. In the IAM console, I create a role with this policy:

{
    "Version": "2012-10-17",
    "Statement": [
        {
            "Effect": "Allow",
            "Action": [
                "kinesis:DescribeStreamSummary",
                "kinesis:GetShardIterator",
                "kinesis:GetRecords",
                "kinesis:DescribeStream"
            ],
            "Resource": "arn:aws:kinesis:*:123412341234:stream/my-input-stream"
        },
        {
            "Effect": "Allow",
            "Action": [
                "kinesis:ListStreams",
                "kinesis:ListShards"
            ],
            "Resource": "*"
        }
    ]
}

To allow Amazon Redshift to assume the role, I use the following trust policy:

{
    "Version": "2012-10-17",
    "Statement": [
        {
            "Effect": "Allow",
            "Principal": {
                "Service": "redshift.amazonaws.com"
            },
            "Action": "sts:AssumeRole"
        }
    ]
}

In the Amazon Redshift console, I choose Redshift serverless from the navigation pane and create a new workgroup and namespace, similar to what I did in this blog post. When I create the namespace, in the Permissions section, I choose Associate IAM roles from the dropdown menu. Then, I select the role I just created. Note that the role is visible in this selection only if the trust policy allows Amazon Redshift to assume it. After that, I complete the creation of the namespace using the default options. After a few minutes, the serverless database is ready for use.

In the Amazon Redshift console, I choose Query editor v2 in the navigation pane. I connect to the new serverless database by choosing it from the list of resources. Now, I can use SQL to configure streaming ingestion. First, I create an external schema that maps to the streaming service. Because I am going to use simulated IoT data as an example, I call the external schema sensors.

CREATE EXTERNAL SCHEMA sensors
FROM KINESIS
IAM_ROLE 'arn:aws:iam::123412341234:role/redshift-streaming-ingestion';

To access the data in the stream, I create a materialized view that selects data from the stream. In general, materialized views contain a precomputed result set based on the result of a query. In this case, the query is reading from the stream, and Amazon Redshift is the consumer of the stream.

Because streaming data is going to be ingested as JSON data, I have two options:

  1. Leave all the JSON data in a single column and use Amazon Redshift capabilities to query semi-structured data.
  2. Extract JSON properties into their own separate columns.

Let’s see the pros and cons of both options.

The approximate_arrival_timestamp, partition_key, shard_id, and sequence_number columns in the SELECT statement are provided by Kinesis Data Streams. The record from the stream is in the kinesis_data column. The refresh_time column is provided by Amazon Redshift.

To leave the JSON data in a single column of the sensor_data materialized view, I use the JSON_PARSE function:

CREATE MATERIALIZED VIEW sensor_data AUTO REFRESH YES AS
    SELECT approximate_arrival_timestamp,
           partition_key,
           shard_id,
           sequence_number,
           refresh_time,
           JSON_PARSE(kinesis_data, 'utf-8') as payload    
      FROM sensors."my-input-stream";
CREATE MATERIALIZED VIEW sensor_data AUTO REFRESH YES AS
SELECT approximate_arrival_timestamp,
partition_key,
shard_id,
sequence_number,
refresh_time,
JSON_PARSE(kinesis_data) as payload 
FROM sensors."my-input-stream";

Because I used the AUTO REFRESH YES parameter, the content of the materialized view is automatically refreshed when there is new data in the stream.

To extract the JSON properties into separate columns of the sensor_data_extract materialized view, I use the JSON_EXTRACT_PATH_TEXT function:

CREATE MATERIALIZED VIEW sensor_data_extract AUTO REFRESH YES AS
    SELECT approximate_arrival_timestamp,
           partition_key,
           shard_id,
           sequence_number,
           refresh_time,
           JSON_EXTRACT_PATH_TEXT(FROM_VARBYTE(kinesis_data, 'utf-8'),'sensor_id')::VARCHAR(8) as sensor_id,
           JSON_EXTRACT_PATH_TEXT(FROM_VARBYTE(kinesis_data, 'utf-8'),'current_temperature')::DECIMAL(10,2) as current_temperature,
           JSON_EXTRACT_PATH_TEXT(FROM_VARBYTE(kinesis_data, 'utf-8'),'status')::VARCHAR(8) as status,
           JSON_EXTRACT_PATH_TEXT(FROM_VARBYTE(kinesis_data, 'utf-8'),'event_time')::CHARACTER(26) as event_time
      FROM sensors."my-input-stream";

Loading Data into the Kinesis Data Stream
To put data in the my-input-stream Kinesis Data Stream, I use the following random_data_generator.py Python script simulating data from IoT sensors:

import datetime
import json
import random
import boto3

STREAM_NAME = "my-input-stream"


def get_random_data():
    current_temperature = round(10 + random.random() * 170, 2)
    if current_temperature > 160:
        status = "ERROR"
    elif current_temperature > 140 or random.randrange(1, 100) > 80:
        status = random.choice(["WARNING","ERROR"])
    else:
        status = "OK"
    return {
        'sensor_id': random.randrange(1, 100),
        'current_temperature': current_temperature,
        'status': status,
        'event_time': datetime.datetime.now().isoformat()
    }


def send_data(stream_name, kinesis_client):
    while True:
        data = get_random_data()
        partition_key = str(data["sensor_id"])
        print(data)
        kinesis_client.put_record(
            StreamName=stream_name,
            Data=json.dumps(data),
            PartitionKey=partition_key)


if __name__ == '__main__':
    kinesis_client = boto3.client('kinesis')
    send_data(STREAM_NAME, kinesis_client)

I start the script and see the records that are being put in the stream. They use a JSON syntax and contain random data.

$ python3 random_data_generator.py
{'sensor_id': 66, 'current_temperature': 69.67, 'status': 'OK', 'event_time': '2022-11-20T18:31:30.693395'}
{'sensor_id': 45, 'current_temperature': 122.57, 'status': 'OK', 'event_time': '2022-11-20T18:31:31.486649'}
{'sensor_id': 15, 'current_temperature': 101.64, 'status': 'OK', 'event_time': '2022-11-20T18:31:31.671593'}
...

Querying Streaming Data from Amazon Redshift
To compare the two materialized views, I select the first ten rows from each of them:

  • In the sensor_data materialized view, the JSON data in the stream is in the payload column. I can use Amazon Redshift JSON functions to access data stored in JSON format.Console screenshot.
  • In the sensor_data_extract materialized view, the JSON data in the stream has been extracted into different columns: sensor_id, current_temperature, status, and event_time.Console screenshot.

Now I can use the data in these views in my analytics workloads together with the data in my data warehouse, my operational databases, and my data lake. I can use the data in these views together with Redshift ML to train a machine learning model or use predictive analytics. Because materialized views support incremental updates, the data in these views can be efficiently used as a data source for dashboards, for example, using Amazon Redshift as a data source for Amazon Managed Grafana.

Availability and Pricing
Amazon Redshift streaming ingestion for Kinesis Data Streams and Managed Streaming for Apache Kafka is generally available today in all commercial AWS Regions.

There are no additional costs for using Amazon Redshift streaming ingestion. For more information, see Amazon Redshift pricing.

It’s never been easier to use low-latency streaming data in your data warehouse and in your data lake. Let us know what you build with this new capability!

Danilo

Introducing Amazon Omics – A Purpose-Built Service to Store, Query, and Analyze Genomic and Biological Data at Scale

Post Syndicated from Channy Yun original https://aws.amazon.com/blogs/aws/introducing-amazon-omics-a-purpose-built-service-to-store-query-and-analyze-genomic-and-biological-data-at-scale/

You might learn in high school biology class that the human genome is composed of over three billion letters of code using adenine (A), guanine (G), cytosine (C), and thymine (T) paired in the deoxyribonucleic acid (DNA). The human genome acts as the biological blueprint of every human cell. And that’s only the foundation for what makes us human.

Healthcare and life sciences organizations collect myriad types of biological data to improve patient care and drive scientific research. These organizations map an individual’s genetic predisposition to disease, identify new drug targets based on protein structure and function, profile tumors based on what genes are expressed in a specific cell, or investigate how gut bacteria can influence human health. Collectively, these studies are often known as “omics”.

AWS has helped healthcare and life sciences organizations accelerate the translation of this data into actionable insights for over a decade. Industry leaders such as as Ancestry, AstraZeneca, Illumina, DNAnexus, Genomics England, and GRAIL leverage AWS to accelerate time to discovery while concurrently reducing costs and enhancing security.

The scale these customers, and others, operate at continues to increase rapidly. When omics data across thousand or hundreds of thousands (or more!) of individuals are compared and analyzed, new insights for predicting disease and the efficacy of different drug treatments are possible.

However, this scale, which can be many petabytes of data, can add complexity. When I studied medical informatics in my Ph.D course, I experienced this complexity in data access, processing, and tooling. You need a way to store omics data that is cost-efficient and easy to access. You need to scale compute across millions of biological samples while preserving accuracy and reliability. You also need specialized tools to analyze genetic patterns across populations and train machine learning (ML) models to predict diseases.

Today I’m excited to announce the general availability of Amazon Omics, a purpose-built service to help bioinformaticians, researchers, and scientists store, query, and analyze genomic, transcriptomic, and other omics data and then generate insights from that data to improve health and advance scientific discoveries.

With just a few clicks in the Omics console, you can import and normalize petabytes of data into formats optimized for analysis. Amazon Omics provides scalable workflows and integrated tools for preparing and analyzing omics data and automatically provisions and scales the underlying cloud infrastructure. So, you can focus on advancing science and translate discoveries into diagnostics and therapies.

Amazon Omics has three primary components:

  • Omics-optimized object storage that helps customers store and share their data efficiently and at low cost.
  • Managed compute for bioinformatics workflows that allows customers to run the exact analysis they specify, without worrying about provisioning underlying infrastructure.
  • Optimized data stores for population-scale variant analysis.

Now let’s learn more about each component of Amazon Omics. Generally, it follows the steps to create a data store and import data files, such as genome sequencing raw data, set up a basic bioinformatics workflow, and analyze results using existing AWS analytics and ML services.

The Getting Started page in the Omics console contains tutorial examples using Amazon SageMaker notebooks with the Python SDK. I will demonstrate Amazon Omics features through an example using a human genome reference.

Omics Data Storage
The Omics data storage helps you store and share petabytes of omics data efficiently. You can create data stores and import sample data in the Omics console and also do the same job in the AWS Command Line Interface (AWS CLI).

Let’s make a reference store and import a reference genome. This example uses Genome Reference Consortium Human Reference 38 (hg38), which is open access and available from the following Amazon S3 bucket: s3://broad-references/hg38/v0/Homo_sapiens_assembly38.fasta.

As prerequisites, you need to create Amazon S3 bucket in your preferred Region and the necessary IAM permissions to access S3 buckets. In the Omics console, you can easily create and select IAM role during the Omics storage setup.

Use the following AWS CLI command to create your reference store, copy the genome data to your S3 bucket, and import it data into your reference store.

// Create your reference store
$ aws omics create-reference-store --name "Reference Store"

// Import your reference data into your data store
$ aws s3 cp s3://broad-references/hg38/v0/Homo_sapiens_assembly38.fasta,name=hg38 s3://channy-omics
$ aws omics start-reference-import-job --sources sourceFile=s3://channy-omics/Homo_sapiens_assembly38.fasta,name=hg38 --reference-store-id 123456789 --role-arn arn:aws:iam::01234567890:role/OmicsImportRole

You can see the result in your console too.

Now you can create a sequence store. A sequence store is similar to an S3 bucket. Each object in a sequence store is known as a “read set”. A read set is an abstraction of a set of genomics file types:

  • FASTQ – A text-based file format that stores information about a base (sequence letter) from a sequencer and the corresponding quality information.
  • BAM – The compressed binary version of raw reads and their mapping to a reference genome.
  • CRAM – Similar to BAM, but uses the reference genome information to aid in compression.

Amazon Omics allows you to specify domain-specific metadata to your read sets you import. These are searchable and defined when you start a read set import job.

As an example, we will use the 1000 Genomes Project, a highly detailed catalogue of more than 80 million human genetic variants for more than 400 billions data points from over 2500 individuals. Let’s make a sequence store and then import genome sequence files into it.

// Create your sequence store 
$ aws omics create-sequence-store --name "MySequenceStore"

// Import your reference data into your data store
$ aws s3 cp s3://1000genomes/phase3/data/HG00146/sequence_read/SRR233106_1.filt.fastq.gz s3://channy-omics
$ aws s3 cp s3://1000genomes/phase3/data/HG00146/sequence_read/SRR233106_2.filt.fastq.gz s3://channy-omics

$ aws omics start-read-set-import-job --cli-input-json ‘
{
    "sourceFiles":
    {
        "source1": "s3://channy-omics/SRR233106_1.filt.fastq.gz",
        "source2": "s3://channy-omics/SRR233106_2.filt.fastq.gz"

    },
    "sourceFileType": "FASTQ",
    "subjectId": "mySubject2",
    "sampleId": "mySample2",
    "referenceArn": "arn:aws:omics:us-east-1:123456789012:referenceStore/123467890",
    "name": "HG00100"
}’

You can see the result in your console again.

Analytics Transformations
You can store variant data referring to a mutation, a difference between what the sequencer read at a position compared to the known reference and annotation data, known information about a location or variant in a genome, such as whether it may cause disease.

A variant store supports both variant call format files (VCF) where there is a called variant and gVCF inputs with records covering every position in a genome. An annotation store supports either a generic feature format (GFF3), tab-separated values (TSV), or VCF file. An annotation store can be mapped to the same coordinate system as variant stores during an import.

Once you’ve imported your data, you can now run queries like as followings which search for Single Nucleotide Variants (SNVs), the most common type of genetic variation among people, on human chromosome 1.

SELECT
    sampleid,
    contigname,
    start,
    referenceallele,
    alternatealleles
FROM "myvariantstore"."myvariantstore"
WHERE
    contigname = 'chr1'
    and cardinality(alternatealleles) = 1
    and length(alternatealleles[1]) = 1
    and length(referenceallele) = 1
LIMIT 10

You can see the output of this query:

#	sampleid	contigname	start	referenceallele	alternatealleles
1	NA20858	chr1	10096	T	[A]
2	NA19347	chr1	10096	T	[A]
3	NA19735	chr1	10096	T	[A]
4	NA20827	chr1	10102	T	[A]
5	HG04132	chr1	10102	T	[A]
6	HG01961	chr1	10102	T	[A]
7	HG02314	chr1	10102	T	[A]
8	HG02837	chr1	10102	T	[A]
9	HG01111	chr1	10102	T	[A]
10	NA19205	chr1	10108	A	[T] 

You can view, manage, and query those data by integrating with existing analytics engines such as Amazon Athena. These query results can be used to train ML models in Amazon SageMaker.

Bioinformatics Workflows
Amazon Omics allows you to perform bioinformatics workflow, such as variant calling or gene expression, analysis on AWS. These compute workloads are defined using workflow languages like  Workflow Description Language (WDL) and Nextflow, domain-specific languages that specify multiple compute tasks and their input and output dependencies.

You can define and execute a workflow using a few simple CLI commands. As an example, create a main.wdl file with the following WDL codes to create a simple WDL workflow with one task that creates a copy of a file.

version 1.0
workflow Test {
	input {
		File input_file
	}
	call FileCopy {
		input:
			input_file = input_file,
	}
	output {
		File output_file = FileCopy.output_file
	}
}
task FileCopy {
	input {
		File input_file
	}
	command {
		echo "copying ~{input_file}" >&2
		cat ~{input_file} > output
	}
	output {
		File output_file = "output"
	}
}

Then zip up your workflow and create your workflow with Amazon Omics using the AWS CLI:

$ zip my-wdl-workflow-zip main.wdl
$ aws omics create-workflow \
    --name MyWDLWorkflow \
    --description "My WDL Workflow" \
    --definition-zip file://my-wdl-workflow.zip \
    --parameter-template '{"input_file": "input test file to copy"}'

To run the workflow we just created, you can use the following command:

aws omics start-run \
  --workflow-id // id of the workflow we just created  \
  --role-arn // arn of the IAM role to run the workflow with  \
  --parameters '{"input_file": "s3://bucket/path/to/file"}' \
  --output-uri s3://bucket/path/to/results

Once the workflow completes, you could use these results in s3://bucket/path/to/results for downstream analyses in the Omics variant store.

You can execute a run, a single invocation of a workflow with a task and defined compute specifications. An individual run acts on your defined input data and produces an output. Runs also can have priorities associated with them, which allow specific runs to take execution precedence over other submitted and concurrent runs. For example, you can specify that a run that is high priority will be run before one that is lower priority.

You can optionally use a run group, a group of runs that you can set the max vCPU and max duration runs to help limit the compute resources used per run. This can help you partition users who may need access to different workflows to run on different data. It can also be used as a budget control/resource fairness mechanism by isolating users to specific run groups.

As you saw, Amazon Omics gives you a managed service with a couple of clicks and simple commands, and APIs in analyzing large-scale omic data, such as human genome samples so you can derive meaningful insights from this data, in hours rather than weeks. We also provide more tutorial SageMaker notebooks that you can use in Amazon SageMaker to help you get started.

In terms of data security, Amazon Omics helps ensure that your data remains secure and patient privacy is protected with customer-managed encryption keys, and HIPAA eligibility.

Customer and Partner Voices
Customers and partners in the healthcare and life science industry have shared how they are using Amazon Omics to accelerate scientific insights.

Children’s Hospital of Philadelphia (CHOP) is the oldest hospital in the United States dedicated exclusively to pediatrics and strives to advance healthcare for children with the integration of excellent patient care and innovative research. AWS has worked with the CHOP Research Institute for many years as they’ve led the way in utilizing data and technology to solve challenging problems in child health.

“At Children’s Hospital of Philadelphia, we know that getting a comprehensive view of our patients is crucial to delivering the best possible care, based on the most innovative research. Combining multiple clinical modalities is foundational to achieving this. With Amazon Omics, we can expand our understanding of our patients’ health, all the way down to their DNA.” – Jeff Pennington, Associate Vice President & Chief Research Informatics Officer, Children’s Hospital of Philadelphia

G42 Healthcare enables AI-powered healthcare that uses data and emerging technologies to personalize preventative care.

“Amazon Omics allows G42 to accelerate a competitive and deployable end-to-end service with globally leading data governance. We’re able to leverage the extensive omics data management and bioinformatics solutions hosted globally on AWS, at our customers’ fingertips. Our collaboration with AWS is much more than data – it’s about value.” – Ashish Koshi, CEO, G42 Healthcare

C2i Genomics brings together researchers, physicians and patients to utilize ultra-sensitive whole-genome cancer detection to personalize medicine, reduce cancer treatment costs, and accelerate drug development.

“In C2i Genomics, we empower our data scientists by providing them cloud-based computational solutions to run high-scale, customizable genomic pipelines, allowing them to focus on method development and clinical performance, while the company’s engineering teams are responsible for the operations, security and privacy aspects of the workloads. Amazon Omics allows researchers to use tools and languages from their own domain, and considerably reduces the engineering maintenance effort while taking care of cost and resource allocation considerations, which in turn reduce time-to-market and NRE costs of new features and algorithmic improvements.” – Ury Alon, VP Engineering, C2i Genomics

We are excited to work hand in hand with our AWS partners to build scalable, multi-modal solutions that enable the conversion of raw sequencing data into insights.

Lifebit builds enterprise data platforms for organizations with complex and sensitive biomedical datasets, empowering customers across the life sciences sector to transform how they use sensitive biomedical data.

“At Lifebit, we’re on a mission to connect the world’s biomedical data to obtain novel therapeutic insights. Our customers work with vast cohorts of linked genomic, multi-omics and clinical data – and these data volumes are expanding rapidly. With Amazon Omics they will have access to optimised analytics and storage for this large-scale data, allowing us to provide even more scalable bioinformatics solutions. Our customers will benefit from significantly lower cost per gigabase of data, essentially achieving hot storage performance at cold storage prices, removing cost as a barrier to generating insights from their population-scale biomedical data.” – Thorben Seeger, Chief Business Development Officer, Lifebit

To hear more customers and partner voices, see Amazon Omics Customers page.

Now Available
Amazon Omics is now available in the US East (N. Virginia), US West (Oregon), Europe (Ireland), Europe (London), Europe (Frankfurt), and Asia Pacific (Singapore) Regions.

To learn more, see the Amazon Omics page, Amazon Omics User Guide, Genomics on AWS, and Healthcare & Life Sciences on AWS. Give it a try, and please contact AWS genomics team and send feedback through your usual AWS support contacts.

Channy

Amazon Connect – New ML-Powered Capabilities for Forecasting, Capacity Planning, Scheduling, and Agent Empowerment

Post Syndicated from Antje Barth original https://aws.amazon.com/blogs/aws/amazon-connect-new-ml-powered-capabilities-for-forecasting-capacity-planning-scheduling-and-agent-empowerment/

Amazon Connect is an easy-to-use cloud contact center that helps companies of any size deliver superior customer service at a lower cost. If you are following our Amazon Connect announcements, you likely noticed that we keep adding more and more machine learning (ML) powered capabilities to Amazon Connect. ML makes Amazon Connect already smarter at analyzing conversations in real time, finding relevant information needed by contact center agents, and authenticating customers by the sound of their voice.

Today, I’m excited to announce the general availability of new ML-powered capabilities for Amazon Connect:

In addition, I’m happy to announce the preview of the following capabilities:

  • Contact Lens for Amazon Connect adds evaluation forms for agent performance, helping managers to create evaluation forms that can be automatically scored by Contact Lens’s ML-powered conversational analytics.
  • Amazon Connect agent workspace adds a new step-by-step experience that guides agents to resolve customer issues.

Let’s have a closer look at each of these new Amazon Connect capabilities.

Forecasting, Capacity Planning, and Scheduling
As a contact center manager, you can now predict contact demand with high accuracy, determine ideal staffing levels, and optimize agent schedules to ensure you have the right agent at the right time.

Many of our customers are already using Forecasting, Capacity Planning, and Scheduling. For example, Litigation Practice Group is a provider of legal support for debt relief, bankruptcy, or litigation. Alex Miles, Director of Business Intelligence at the Litigation Practice Group, said:

“One of our biggest challenges with our legacy contact center was forecasting customer demand based on historical data so we could predict surges. When searching for a new provider, Amazon Connect stood out to us because of how easy it is to harness data and leverage machine learning (ML) to deliver highly accurate (>95%) forecasts and optimized schedules. It is simple and flexible to set up and allows us to create agent schedules with high efficiency, even when our agents have many unique schedule requirements. It ensures the right agent is available at the right time to take an end customer’s call. The AWS team works with us closely to solve our business pain points and innovate quickly together. With Amazon Connect forecasting, capacity planning, and scheduling, we are finally confident we can reliably hit our service-level targets and gracefully navigate fluctuations in customer demand.”

To get started, enable Forecasting, Capacity Planning, and Scheduling for your contact center in the Amazon Connect console. Then, you can find the new capabilities in the Amazon Connect Analytics and optimization module.

Forecasting
Now, the first step is to create a forecast of contact demands. Amazon Connect uses an ML model tailored for contact center operations to analyze and predict future contact volume and average handle time based on historical data. The forecasts include inbound, transfer, and callback contacts in both voice and chat channels.

Amazon Connect - Forecast

Capacity Planning
Using the published long-term forecasts together with planning scenarios and metrics such as maximum occupancy, daily attrition, and full-time equivalent (FTE) hours per week as the input, you can then use the capacity planning feature to predict how many agents are required to meet your service level target for a certain period of time. It creates a long-term capacity plan that you can share with stakeholders.

Amazon Connect - Capacity Plan

Scheduling
Using the short-term published forecasts together with shift profiles, staffing groups, human resources, and business rules, the new scheduling feature creates efficient schedules that are optimized for a service level or an average speed of answer target. Schedulers can review and, if needed, edit the schedules. Once they publish the schedules, Amazon Connect notifies supervisors and agents in the relevant staffing groups that a new schedule is available.

Scheduling now supports intraday agent request management, offering agents overtime or voluntary time off. When things need to change, Amazon Connect makes real-time schedule adjustments with the help of ML, following business and labor rules.

Amazon Connect Scheduling - Overtime Requests

Contact Lens for Amazon Connect adds Conversational Analytics for Chat
Contact Lens conversational analytics capabilities analyze conversations in real time using natural language processing (NLP) and speech-to-text analytics. Today, Contact Lens adds conversational analytics capabilities for Amazon Connect Chat, extending the ML-powered analytics to better assess chat contacts with agents and the Amazon Lex bot. Contact Lens’s conversational analytics for chat helps you understand customer sentiment, redact sensitive customer information, and monitor agent compliance with company guidelines to improve agent performance and customer experience.

You can now use the contact search feature to quickly identify contacts where customers had issues based on specific keywords, customer sentiment score, contact categories, and other chat-specific analytics such as agent response time. Contact Lens now also offers chat summarization, a feature that uses ML to classify and highlight key parts of the customer’s conversation, such as issue, outcome, or action item. You can also use the new analytics capabilities to automatically detect and redact sensitive customer information, such as name, credit card details, and Social Security number, from chat transcripts.

Contact Lens for Amazon Connect - Conversational analytics for chat

Contact Lens for Amazon Connect adds Evaluation Forms for Agent Performance (Preview)
As a contact center manager, you can now create agent performance evaluation forms in Contact Lens. You can add relevant evaluation criteria, such as the agents’ adherence to required scripts or compliance with sensitive data collection practices. You can also enable scoring that uses the ML-powered Contact Lens for Amazon Connect conversational analytics capabilities.

Contact Lens for Amazon Connect adds evaluation forms for agent performance

Some of our customers have already looked into the agent performance evaluation forms in Contact Lens and provided us with feedback—one of them is Frontdoor. Frontdoor provides homeowners with a tech-enabled, people-driven platform for maintaining and repairing major home systems and appliances. Through a network of approximately 17,000 contractor firms, the company responds to more than 4 million service requests annually. Scott Brown, SVP of Customer Experience at Frontdoor, said:

“With millions of phone-based member interactions a year, our team needs a powerful and intuitive QA solution that will support our commitment to provide outstanding experiences at each touchpoint. We have been on Amazon Connect since early 2020 and recently launched Contact Lens. It’s a powerful combination that’s helping us simplify how we work, and its analytics are equipping us to make better-informed decisions and strengthen our agent coaching strategy. The UI is intuitive and easy to use, implementation and ramp-up time was minimal, and feedback from our managers has been very positive. For starters, we were able to reduce the number of evaluation forms needed by 200%, then completed the build-out of them in a third of the time that we anticipated. And, our managers appreciate how easy it is to access conversational insights; things like sentiment, categorization, recordings, hold time, and more are provided side-by-side in the same UI, where evaluation results are prepopulated.”

To join the preview, follow the instructions on Contact Lens for Amazon Connect.

Amazon Connect Agent Workspace adds step-by-step guides (Preview)
The Amazon Connect agent workspace is a single, unified application that provides your agents with the tools needed to resolve customer issues. When accepting calls, chats, or tasks, your agents can view updated customer information, search knowledge articles, and get real-time recommendations.

You can now also use Amazon Connect’s no-code, drag-and-drop interface to create custom workflows and step-by-step guides for your agents. You can specify in your contact flows under which condition a guide is shown to an agent. Once the agent selects the guide, the Amazon Connect agent workspace provides the information and one-click actions across both Amazon Connect and third-party applications that agents can use to resolve the customer issue.

Amazon Connect Agent Workspace

To join the preview, follow the instructions on Amazon Connect Agent Workspace.

Availability and Pricing
Regional availability slightly differs for each of these new Amazon Connect capabilities:

  • Forecasting, capacity planning, and scheduling: Available today in US East (N. Virginia), US West (Oregon), Asia Pacific (Sydney), and Europe (London) Regions.
  • Contact Lens’s conversational analytics for chat: Available for post-chat use cases today in all the AWS Regions where Contact Lens’s conversational analytics for speech is already available.
  • Preview—Contact Lens evaluation forms for agent performance: Available in preview in all the AWS Regions where Contact Lens is already available.
  • Preview—Amazon Connect’s step-by-step guides: Available in preview in US East (N. Virginia), US West (Oregon), Asia Pacific (Sydney), and Europe (London) Regions.

With Amazon Connect, you only pay for what you use. There are no required up-front payments, long-term commitments, or minimum monthly fees. The price metrics for these new capabilities are detailed on the Amazon Connect pricing page.

For more details, visit Amazon Connect forecasting, capacity planning, and scheduling, Contact Lens for Amazon Connect, and Amazon Connect Agent Workspace.

Let us know what you think about these new capabilities and how you use them.

And now, go build your contact centers.

— Antje

New AWS SimSpace Weaver–Run Large-Scale Spatial Simulations in the Cloud

Post Syndicated from Marcia Villalba original https://aws.amazon.com/blogs/aws/new-aws-simspace-weaver-build-large-scale-spatial-simulations-in-the-cloud/

Today, we’re announcing AWS SimSpace Weaver, a new compute service to run real-time spatial simulations in the cloud and at scale. With SimSpace Weaver, simulation developers are no longer limited by the compute and memory of their hardware.

Organizations run simulations on situations that are rare, dangerous, or very expensive to test in the real world. For example, city managers can’t wait for a natural disaster to hit a city to test the response systems. Event planners don’t want to wait until a large sporting event to start to understand the impact the games will have on traffic. Scenarios like these need to be simulated in a safe environment in which planners can test different situations and tune each system.

Until today, spatial simulations were generally confined to being run on a single piece of hardware. If developers wanted to simulate a bigger and more complex world with lots of independent and dynamic entities, they needed to provision a bigger computer. Simulation developers were forced to make trade-offs between scale and fidelity, in other words, deciding how big the world is and how many independent entities there are.

The world we live in is complex, and the scenarios that developers want to simulate are very complex as well—for example, how traffic will be affected by a large concert or sporting event. Simulating these events requires modeling hundreds of thousands of independent dynamic entities to represent the people and vehicles. Each entity has its own set of behaviors that need to be modeled as it moves throughout the world and interacts with other entities. Simulating this at a real-world scale requires CPU and memory beyond what you can have in one instance.

With SimSpace Weaver, you can run simulations at scale across multiple Amazon Elastic Compute Cloud (Amazon EC2) instances. It supports simulating upwards of a million independent and dynamic entities.

When to Use SimSpace Weaver
Use SimSpace Weaver when you need to increase the scale or complexity of your simulations. SimSpace Weaver is great at simulating crowds. This is very useful, for example, when you’re planning large events or planning to build infrastructure like a new stadium. It is also ideal for simulating smart cities, complete with vehicles, inhabitants, and other objects.

AWS SimSpace Weaver lets you connect external clients to your simulations so that you can interact and view the simulations with multiple users in real time.

How SimSpace Weaver Works
When using SimSpace Weaver, you can parallelize your spatial simulations workloads across multiple instances. Scale your simulations across up to 10 EC2 instances by specifying the compute capacity needed for the simulation and how it should be split into partitions. SimSpace Weaver handles the provisioning of the EC2 instances, launches the simulation applications, and cleans the environment after the simulation ends.

In the following image, you can see a representation of how a spatial area, in this case, a city, is spatially partitioned across different instances. Each row represents an instance. The example simulation in this image contains 10 instances, and each instance handles 16 partitions.

Map is partitioned into different instances

Map courtesy of Amazon Location Service

When working with multiple partitions, you don’t need to worry about the complexities of transferring entities between partitions. The SimSpace Weaver data replication system handles the networking and memory management for doing the transferring, regardless of whether the partitions are in the same EC2 instance or in a different one.

Another important feature that SimSpace Weaver provides is the scheduler. The SimSpace Weaver scheduler keeps all the distributed partitions synchronized at a set simulation tick rate (10, 15, or, 30 Hz), so the simulation behaves as if it was run on one machine.

SimSpace Weaver provides the infrastructure to weave together a simulation across multiple instances, but it is not a simulator. Build your simulations by integrating the AWS SimSpace Weaver C++ SDK with your code. Integrating with the SDK allows your applications to interface with the SimSpace Weaver software running in your instances. This allows SimSpace Weaver to track the global state of all your simulated entities and facilitates the transfer of entities between simulation applications. Developers building with Unreal Engine 5 or Unity can take advantage of the SimSpace Weaver out-of-the-box plugins to jump-start their projects.

Getting Started
You can get started with SimSpace Weaver from the AWS Management Console or the AWS Command-Line Interface (AWS CLI).

Getting started

From the console, use our one-click sample to quickly launch your first simulation. This is a simple example of a simulation divided into four different partitions. This simulation involves spherical entities that move freely throughout the world, avoiding each other and static objects.

One click simulation

The wizard guides you through the main steps for running a demo simulation:

  1. Download the client demo application. This is a prebuilt application that you use later to view the simulation running in the cloud. You can only run this demo application using a computer with Windows operating system.
  2. Start the simulation infrastructure in the cloud. SimSpace Weaver takes care of deploying all the infrastructure you need in order to run this simulation.
  3. View the simulation using the demo application you downloaded in the first step. The following image shows the result of running this simulation. Each color represents a different partition.

Simulation result

Available Now
Developers using SimSpace Weaver pay for the number of instances they use for the length of their simulation, with no up-front costs or licenses.

SimSpace Weaver is available in the US East (Ohio), US East (Northern Virginia), US West (Oregon), Asia-Pacific (Singapore), Asia-Pacific (Sydney), Europe (Ireland), Europe (Frankfurt), and Europe (Stockholm) AWS Regions.

You can get started with SimSpace Weaver today from the console and the AWS CLI. Learn more about SimSpace Weaver on the service page.

Marcia

New – Amazon EC2 Hpc6id Instances Optimized for High Performance Computing

Post Syndicated from Channy Yun original https://aws.amazon.com/blogs/aws/new-amazon-ec2-hpc6id-instances-optimized-for-high-performance-computing/

We have given you the flexibility and ability to run the largest and most complex high performance computing (HPC) workloads with Amazon Elastic Compute Cloud (Amazon EC2) instances that feature enhanced networking like C5n, C6gnR5n, M5n, and our recently launched HPC instances Hpc6a.

We heard feedback from customers asking us to deliver more options to support their most intensive workloads with higher per-vCPU compute performance as well as larger memory and local disk storage to reduce job completion time for data-intensive workloads like Finite Element Analysis (FEA) and seismic processing.

Announcing Amazon EC2 Hpc6id Instance for HPC Workloads
Today, we announce the general availability of Amazon EC2 Hpc6id instances, a new instance type that is purpose-built for tightly coupled HPC workloads. Amazon EC2 Hpc6id instances are powered by 3rd Gen Intel Xeon Scalable processors (Ice Lake) that run at frequencies up to 3.5 GHz, 1024 GiB memory, 15.2 TB local SSD disk, 200 Gbps Elastic Fabric Adapter (EFA) network bandwidth, which is 4x higher than R6i instances.

Amazon EC2 Hpc6id instances have the best per-vCPU HPC performance when compared to similar x86-based EC2 instances for data-intensive HPC workloads.

Here are the detailed specs:

Instance Name CPUs RAM EFA Network Bandwidth Attached Storage
hpc6id.32xlarge 64 1024 GiB Up to 200 Gbps 15.2 TB local SSD disk

Amazon EC2 Hpc6id Instances Use Cases
Customers running license-bound scenarios can lower infrastructure and HPC software licensing costs with Hpc6id. Other customers with HPC codes that are optimized for Intel-specific features, such as Math Kernel Library or AVX-512, can migrate their largest HPC workloads to Hpc6id and scale up their workloads on AWS by taking advantage of 200 Gbps EFA bandwidth.

Other customers using HPC software codes that are optimized for per-CPU performance are also able to consolidate their workloads on fewer nodes and complete jobs faster with Hpc6id. Faster job completion time helps customers to reduce both infrastructure and software licensing costs. Customers can use Hpc6id instances to quickly carry out complex calculations across a range of cluster sizes—up to tens of thousands of cores.

Customers also can use Hpc6id instances with AWS ParallelCluster to provision Hpc6id instances alongside other instance types, giving customers the flexibility to run different workload types within the same HPC cluster. Hpc6id instances benefit from the AWS Nitro System, a rich collection of building blocks that offloads many of the traditional virtualization functions to dedicated hardware and software to deliver high performance, high availability, and high security while also reducing virtualization overhead.

Now Available
Amazon EC2 Hpc6id instances are available for purchase as On-Demand or Reserved Instances or with Savings Plans. Hpc6id instances are available in the US East (Ohio) and AWS GovCloud (US-West) Regions. To optimize Amazon EC2 Hpc6id instances networking for tightly coupled workloads, use cluster placement groups within a single Availability Zone.

To learn more, visit our Hpc6 instance page and get in touch with our HPC teamAWS re:Post for EC2, or through your usual AWS Support contacts.

Channy

Preview: Amazon Security Lake – A Purpose-Built Customer-Owned Data Lake Service

Post Syndicated from Channy Yun original https://aws.amazon.com/blogs/aws/preview-amazon-security-lake-a-purpose-built-customer-owned-data-lake-service/

To identify potential security threats and vulnerabilities, customers should enable logging across their various resources and centralize these logs for easy access and use within analytics tools. Some of these data sources include logs from on-premises infrastructure, firewalls, and endpoint security solutions, and when utilizing the cloud, services such as Amazon Route 53, AWS CloudTrail, and Amazon Virtual Private Cloud (Amazon VPC).

The Amazon Simple Storage Service (Amazon S3) and AWS Lake Formation simplify the creation and management of a data lake on AWS. But, some customers’ security teams still struggle to define and implement security domain–specific aspects, such as data normalization, which requires them to analyze each log source’s structure and fields, define schemas and mappings, and pull in data enrichment such as threat intelligence.

Today we are announcing the preview release of Amazon Security Lake, a purpose-built service that automatically centralizes an organization’s security data from cloud and on-premises sources into a purpose-built data lake stored in your account. Amazon Security Lake automates the central management of security data, normalizing from integrated AWS services and third-party services and managing the lifecycle of data with customizable retention and also automates storage tiering.

Here are the key features of Amazon Security Lake:

  • Variety of supported log and event sources – During the preview, Amazon Security Lake automatically collects logs for AWS CloudTrail, Amazon VPC, Amazon Route 53, Amazon S3, and AWS Lambda, as well as security findings via AWS Security Hub for AWS Config, AWS Firewall Manager, Amazon GuardDuty, AWS Health Dashboard, AWS IAM Access Analyzer, Amazon Inspector, Amazon Macie, and AWS Systems Manager Patch Manager. Additionally, over 50 sources of third-party security findings can be sent to Amazon Security Lake. Security Partners are also directly sending data in a standard schema called the Open Cybersecurity Schema Framework (OCSF) format to Amazon Security Lake, such as Cisco Security, CrowdStrike, Palo Alto Networks, and more.
  • Data transformation and normalization – Security Lake automatically partitions and converts incoming log data to a storage and query-efficient Apache Parquet and OCSF format, making the data broadly and immediately usable for security analytics without the need for post-processing. Security Lake supports integrations with analytics partners such as IBM, Splunk, Sumo Logic, and more to address a variety of security use cases such as threat detection, investigation, and incident response.
  • Customizable data access levels – You can configure the level of subscribers consuming data stored in the Security Lake, such as specific data sources for data access to all new objects or directly querying data stored. You can also specify a rollup Region that the Security Lake is available in and multiple AWS accounts across your AWS Organizations. This can help you comply with data residency compliance requirements.

By reducing the operational overhead of security data management, you can make it easier to gather more security signals from across your organization and analyze that data to improve the protection of your data, applications, and workloads.

Configure Your Security Lake for Collection Data
To get started with Amazon Security Lake, choose Get started in the AWS console. You can enable log and event sources for all Regions and all accounts.

You can select log and event sources such as CloudTrail logs, VPC flow logs, and Route53 resolver logs into your data lake. Select Regions will contribute their data to your data lake with the Amazon S3-managed encryption that Amazon S3 will create and manage all encryption keys, as well as the specific AWS accounts in your organizations.

Next, you can select rollup and contributing Regions. All aggregated data from contributing Regions reside in the rollup Region. You can create multiple rollup Regions, which can help you comply with data residency compliance requirements. Optionally, you can define the Amazon S3 storage classes and the retention period you want the data to transition from the standard Amazon S3 storage classes used in Security Lake.

After initial configuration, choose Sources in the left pane of the console if you can add or remove log sources in your Regions or account.

You can also collect data from custom sources, such as Bind DNS logs, endpoint telemetry logs, on-premise Netflow logs, and so on. Before adding a custom source, you need to create AWS IAM role to grant permissions for AWS Glue.

To create a custom data source, choose Create custom source in the left menu of Custom sources.

It requires you to enter the IAM role Amazon Resource Names (ARNs) to write data to Security Lake and invoke AWS Glue on your behalf. Then, you can provide details about your custom source.

For efficient data processing and querying, objects from your custom sources should be partitioned by AWS Region, AWS account, year, month, day, and hour with a Parquet-formatted object.

Consume Your Data from Security Lake
Now you can create a subscriber, a service that consumes logs and events from Security Lake. To add or see your subscribers, choose Subscribers in the left pane of the console.

The Security Lake supports two types of subscriber data access methods:

  • Data access (Amazon S3) – Subscribers are notified of new objects for a source as the data is written to your Security Lake S3 bucket. You can choose to notify subscribers of new objects with an Amazon Simple Queue Service (Amazon SQS) queue or through messaging to an HTTPS endpoint provided by the subscriber. This type is useful to ingest selected data in your analytics application—good for use cases that require frequent access to data.
  • Query access (Lake Formation) – Subscribers can consume data by directly querying AWS Lake Formation tables in your S3 bucket through services like Amazon Athena. This type is useful to provide on-demand query access to data without the need to pre-ingest anything and for use cases that require infrequent access or on large volume sources too expensive to ingest upfront or retain in analytics tools.

When you add a subscriber, you can choose Amazon S3 to create data access for the subscriber. If you select the default method of notification, you can receive the following object notification message in either an HTTPS endpoint or Amazon SQS.

{
  "source": "aws.s3",
  "time": "2021-11-12T00:00:00Z",
  "region": "ca-central-1",
  "resources": [
    "arn:aws:s3:::example-bucket"
  ],
  "detail": {
    "bucket": {
      "name": "example-bucket"
    },
    "object": {
      "key": "example-key",
      "size": 5,
      "etag": "b57f9512698f4b09e608f4f2a65852e5"
    },
    "request-id": "N4N7GDK58NMKJ12R",
    "requester": "123456789012"
  }
}

Subscribers with query access can directly query data that is stored in Security Lake by using services like Amazon Athena and other services that can read from AWS Lake Formation. The following are sample queries of CloudTrail data.

SELECT 
      time, 
      api.service.name, 
      api.operation, 
      api.response.error, 
      api.response.message, 
      src_endpoint.ip 
    FROM ${athena_db}.${athena_table}
    WHERE eventHour BETWEEN '${query_start_time}' and '${query_end_time}' 
      AND api.response.error in (
        'Client.UnauthorizedOperation',
        'Client.InvalidPermission.NotFound',
        'Client.OperationNotPermitted',
        'AccessDenied')
    ORDER BY time desc
    LIMIT 25

Subscribers only have access to source data in the AWS Region that you’ve selected when you create the subscriber. To give a subscriber access to data from multiple Regions, you can set the Region where you create your subscriber as a rollup Region.

Third-Party Integrations
For supported third-party integrations, there are a number of sources as well as subscribing services integrated with Amazon Security Lake.

Amazon Security Lake supports third-party sources providing OCSF security data, including Barracuda Networks, Cisco, Cribl, CrowdStrike, CyberArk, Lacework, Laminar, Netscout, Netskope, Okta, Orca, Palo Alto Networks, Ping Identity, SecurityScorecard, Tanium, The Falco Project, Trend Micro, Vectra AI, VMware, Wiz, and Zscaler.

You can also use third-party security, automation, and analytics tools supporting Security Lake, including Datadog, IBM, Rapid7, Securonix, SentinelOne, Splunk, Sumo Logic, and Trellix. There are also service partners such as Accenture, Atos, Deloitte, DXC, Kyndryl, PWC, Rackspace, and Wipro that can work with you and Amazon Security Lake.

Join the Preview
The preview release of Amazon Security Lake is now available in the US East (Ohio), US East (N. Virginia), US West (Oregon), Asia Pacific (Sydney), Asia Pacific (Tokyo), Europe (Frankfurt), and Europe (Ireland) Regions.

To learn more, see the Amazon Security Lake page and Amazon Security Lake User Guide. We want to hear more feedback during the preview. Please send feedback in AWS re:Post and through your usual AWS support contacts.

Channy

New – Amazon Redshift Integration with Apache Spark

Post Syndicated from Channy Yun original https://aws.amazon.com/blogs/aws/new-amazon-redshift-integration-with-apache-spark/

Apache Spark is an open-source, distributed processing system commonly used for big data workloads. Spark application developers working in Amazon EMR, Amazon SageMaker, and AWS Glue often use third-party Apache Spark connectors that allow them to read and write the data with Amazon Redshift. These third-party connectors are not regularly maintained, supported, or tested with various versions of Spark for production.

Today we are announcing the general availability of Amazon Redshift integration for Apache Spark, which makes it easy to build and run Spark applications on Amazon Redshift and Redshift Serverless, enabling customers to open up the data warehouse for a broader set of AWS analytics and machine learning (ML) solutions.

With Amazon Redshift integration for Apache Spark, you can get started in seconds and effortlessly build Apache Spark applications in a variety of languages, such as Java, Scala, and Python.

Your applications can read from and write to your Amazon Redshift data warehouse without compromising on the performance of the applications or transactional consistency of the data, as well as performance improvements with pushdown optimizations.

Amazon Redshift integration for Apache Spark builds on an existing open source connector project and enhances it for performance and security, helping customers gain up to 10x faster application performance. We thank the original contributors on the project who collaborated with us to make this happen. As we make further enhancements we will continue to contribute back into the open source project.

Getting Started with Spark Connector for Amazon Redshift
To get started, you can go to AWS analytics and ML services, use data frame or Spark SQL code in a Spark job or Notebook to connect to the Amazon Redshift data warehouse, and start running queries in seconds.

In this launch, Amazon EMR 6.9, EMR Serverless, and AWS Glue 4.0 come with the pre-packaged connector and JDBC driver, and you can just start writing code. EMR 6.9 provides a sample notebook, and EMR Serverless provides a sample Spark Job too.

First, you should set AWS Identity and Access Management (AWS IAM) authentication between Redshift and Spark, between Amazon Simple Storage Service (Amazon S3) and Spark, and between Redshift and Amazon S3. The following diagram describes the authentication between Amazon S3, Redshift, the Spark driver, and Spark executors.

For more information, see Identity and access management in Amazon Redshift in the AWS documentation.

Amazon EMR
If you already have an Amazon Redshift data warehouse and the data available, you can create the database user and provide the right level of grants to the database user. To use this with Amazon EMR, you need to upgrade to the latest version of the Amazon EMR 6.9 that has the packaged spark-redshift connector. Select the emr-6.9.0 release when you create an EMR cluster on Amazon EC2.

You can use EMR Serverless to create your Spark application using the emr-6.9.0 release to run your workload.

EMR Studio also provides an example Jupyter Notebook configured to connect to an Amazon Redshift Serverless endpoint leveraging sample data that you can use to get started quickly.

Here is a Scalar example to build your applications both with Spark Dataframe and Spark SQL. Use IAM-based credentials for connecting to Redshift and use IAM role for unloading and loading data from S3.

// Create the JDBC connection URL and define the Redshift context
val jdbcURL = "jdbc:redshift:iam://<RedshiftEndpoint>:<Port>/<Database>?DbUser=<RsUser>"
val rsOptions = Map (
  "url" -> jdbcURL,
  "tempdir" -> tempS3Dir, 
  "aws_iam_role" -> roleARN,
  )
// Reference the sales table from Redshift 
val sales_df = spark
  .read 
  .format("io.github.spark_redshift_community.spark.redshift") 
  .options(rsOptions) 
  .option("dbtable", "sales") 
  .load() 
sales_df.createOrReplaceTempView("sales") 
// Reference the date table from Redshift using Data Frame 
sales_df.join(date_df, sales_df("dateid") === date_df("dateid"))
  .where(col("caldate") === "2008-01-05")
  .groupBy().sum("qtysold")
  .select(col("sum(qtysold)"))
  .show() 

If Amazon Redshift and Amazon EMR are in different VPCs, you have to configure VPC peering or enable cross-VPC access. Assuming both Amazon Redshift and Amazon EMR are in the same virtual private cloud (VPC), you can create a Spark job or Notebook and connect to the Amazon Redshift data warehouse and write Spark code to use the Amazon Redshift connector.

To learn more, see Use Spark on Amazon Redshift with a connector in the AWS documentation.

AWS Glue
When you use AWS Glue 4.0, the spark-redshift connector is available both as a source and target. In Glue Studio, you can use a visual ETL job to read or write to a Redshift data warehouse simply by selecting a Redshift connection to use within a built-in Redshift source or target node.

The Redshift connection contains Redshift connection details along with the credentials needed to access Redshift with the proper permissions.

To get started, choose Jobs in the left menu of the Glue Studio console. Using either of the Visual modes, you can easily add and edit a source or target node and define a range of transformations on the data without writing any code.

Choose Create and you can easily add and edit a source, target node, and the transform node in the job diagram. At this time, you will choose Amazon Redshift as Source and Target.

Once completed, the Glue job can be executed on Glue for the Apache Spark engine, which will automatically use the latest spark-redshift connector.

The following Python script shows an example job to read and write to Redshift with dynamicframe using the spark-redshift connector.

import sys
from awsglue.transforms import *
from awsglue.utils import getResolvedOptions
from pyspark.context import SparkContext
from awsglue.context import GlueContext
from awsglue.job import Job

## @params: [JOB_NAME]
args = getResolvedOptions(sys.argv, ['JOB_NAME'])
sc = SparkContext()
glueContext = GlueContext(sc)
spark = glueContext.spark_session
job = Job(glueContext)
job.init(args['JOB_NAME'], args)

print("================ DynamicFrame Read ===============")
url = "jdbc:redshift://<RedshiftEndpoint>:<Port>/dev"
read_options = {
    "url": url,
    "dbtable": dbtable,
    "redshiftTmpDir": redshiftTmpDir,
    "tempdir": redshiftTmpDir,
    "aws_iam_role": aws_iam_role,
    "autopushdown": "true",
    "include_column_list": "false"
}

redshift_read = glueContext.create_dynamic_frame.from_options(
    connection_type="redshift",
    connection_options=read_options
) 

print("================ DynamicFrame Write ===============")

write_options = {
    "url": url,
    "dbtable": dbtable,
    "user": "awsuser",
    "password": "Password1",
    "redshiftTmpDir": redshiftTmpDir,
    "tempdir": redshiftTmpDir,
    "aws_iam_role": aws_iam_role,
    "autopushdown": "true",
    "DbUser": "awsuser"
}

print("================ dyf write result: check redshift table ===============")
redshift_write = glueContext.write_dynamic_frame.from_options(
    frame=redshift_read,
    connection_type="redshift",
    connection_options=write_options
)

When you set up your job detail, you can only use the Glue 4.0 – Supports spark 3.3 Python 3 version for this integration.

To learn more, see Creating ETL jobs with AWS Glue Studio and Using connectors and connections with AWS Glue Studio in the AWS documentation.

Gaining the Best Performance
In the Amazon Redshift integration for Apache Spark, the Spark connector automatically applies predicate and query pushdown to optimize for performance. You can gain performance improvement by using the default Parquet format for the connector used for unloading with this integration.

As the following sample code shows, the Spark connector will turn the supported function into a SQL query and run the query in Amazon Redshift.

import sqlContext.implicits._val
sample= sqlContext.read
.format("io.github.spark_redshift_community.spark.redshift")
.option("url",jdbcURL )
.option("tempdir", tempS3Dir)
.option("unload_s3_format", "PARQUET")
.option("dbtable", "event")
.load()

// Create temporary views for data frames created earlier so they can be accessed via Spark SQL
sales_df.createOrReplaceTempView("sales")
date_df.createOrReplaceTempView("date")
// Show the total sales on a given date using Spark SQL API
spark.sql(
"""SELECT sum(qtysold)
| FROM sales, date
| WHERE sales.dateid = date.dateid
| AND caldate = '2008-01-05'""".stripMargin).show()

Amazon Redshift integration for Apache Spark adds pushdown capabilities for operations such as sort, aggregate, limit, join, and scalar functions so that only the relevant data is moved from the Redshift data warehouse to the consuming Spark application, thereby improving performance.

Available Now
The Amazon Redshift integration for Apache Spark is now available in all Regions that support Amazon EMR 6.9, AWS Glue 4.0, and Amazon Redshift. You can start using the feature directly from EMR 6.9 and Glue Studio 4.0 with the new Spark 3.3.0 version.

Give it a try, and please send us feedback either in the AWS re:Post for Amazon Redshift or through your usual AWS support contacts.

Channy

Preview: Amazon OpenSearch Serverless – Run Search and Analytics Workloads without Managing Clusters

Post Syndicated from Channy Yun original https://aws.amazon.com/blogs/aws/preview-amazon-opensearch-serverless-run-search-and-analytics-workloads-without-managing-clusters/

Most AWS analytics services have compelling serverless offerings that make it even easier for customers to analyze vast amounts of data without having to configure, scale, or manage the underlying infrastructure.

Along with other serverless analytics, such as Amazon QuickSight for business intelligence and AWS Glue for data integration, we have introduced Amazon EMR Serverless, Amazon MSK Serverless, and Amazon Redshift Serverless this year.

Today, we announce the preview release of a new serverless option for Amazon OpenSearch Service that makes it easy for customers to run large-scale search and analytics workloads without managing clusters. It automatically provisions and scales the underlying resources to deliver fast data ingestion and query responses for even the most demanding and unpredictable workloads, eliminating the need to configure and optimize clusters.

With Amazon OpenSearch Serverless, you do not need to account for factors that are hard to know in advance, such as the frequency and complexity of queries or the volume of data expected to be analyzed. Instead of managing infrastructure, you can focus on using OpenSearch for exploring and deriving insights from your data. You can also get started using familiar APIs to load and query data and use OpenSearch Dashboards for interactive data analysis and visualization.

Configure Your OpenSearch Serverless Collection
To get started with Amazon OpenSearch Serverless, you create a Collection via the AWS Management Console, AWS Command-Line Interface (AWS CLI), or AWS API.

Before the launch of OpenSearch Serverless, you created a managed cluster, specifying instance types, counts, and storage options, and then managed the lifecycle and shard strategy for indices within that cluster. With OpenSearch Serverless, you create a Collection, which manages a group of indices that work together to support a specific workload. You no longer need to specify the hardware or manage the indices directly.

To create an OpenSearch Serverless collection and secure data, set up Encryption policies to assign AWS KMS keys to one or more collections and attach Network policies to collections to control the access from specified VPCs and public IP addresses.

To create an encryption policy, choose Encryption policies in the left navigation pane and Create encryption policy. Encryption at rest secures the indices within your collection. For each collection, AWS KMS generates a unique, symmetric encryption key. Encryption policies are the optimal way to manage AWS KMS keys across multiple collections. You can define the target collection name or a prefix that automatically applies the encryption settings from this policy to the collection.

In order for users to access a collection, choose Network policies in the left navigation pane and Create network policy. Network policies determine whether your collection is accessible over the internet from public networks or whether it must be accessed through OpenSearch Serverless–managed VPC endpoints.

You can define multiple rules for each collection, either the Public or VPC, as a recommended option for the Access Type. If you select a public option, you can access the collection from OpenSearch Dashboards.

Also, you can configure access for OpenSearch Dashboards and the OpenSearch endpoint. For the Resource type, enable both Access to OpenSearch endpoints and Access to OpenSearch Dashboards. In both input boxes, select the Collection Name property and your collection name or prefix.

Finally, to create an OpenSearch Serverless collection, choose Create collection in the home page or choose Collections in the left navigation pane and choose Create collection.

Input your collection name, description, and collection type, either Time series or Search by your data type.

  • Time series – The log analytics segment that focuses on analyzing large volumes of semistructured, machine-generated data in real time for operational, security, user behavior, and business insights.
  • Search – Full-text search that powers applications in your internal networks (content management systems, legal documents) and internet-facing applications such as e-commerce website search and content search.

When you choose Create, a collection typically takes less than a minute to initialize.

Upload and Search Data in Your Collection
Before uploading and searching data in your collection, configure the IAM policy to access the actual data within a collection. Choose Data access policies in the left navigation pane and Create data access policy.

You can apply multiple policies simultaneously to the same resource. Each policy contains a set of rules. Each rule has a resource (collection or index), permissions for the resource, and a list of principals (IAM users, role ARNs, or SAML identities).

Here is a sample policy that provides a single user the minimum permissions required to create an index in your collection, index some data, and search for it. Replace the principal ARN with the ARN of the account that you’ll use to sign in to OpenSearch Dashboards.

[
  {
    "Rules": [
      {
        "ResourceType": "index",
        "Resource": [
          "index/books/*"
        ],
        "Permission": [
          "aoss:CreateIndex",
          "aoss:ReadDocument",
          "aoss:UpdateIndex",
          "aoss:DeleteIndex",
          "aoss:WriteDocument"
        ]
      }
    ],
    "Principal": [
      "arn:aws:iam::123456789012:user/admin"
    ]
  }
]

Now, you can upload data to an OpenSearch Serverless collection using Postman or curl. You can also use Dev Tools within the OpenSearch Dashboards console. Choose OpenSearch Dashboards on the detail page of your collection.

Sign in to OpenSearch Dashboards using the AWS access and secret keys for the principal that you specified in your data access policy. Within OpenSearch Dashboards, open the left navigation menu and choose Dev Tools.

To create a single index called books-index, run PUT books-index, and index your first single document into books-index.

You can also query search data in Dev Tools.

GET books_index/_search
{
    "query": {
    "simple_query_string": {
    "query": "Jeff",
    "fields": ["author"]
    } 
  }
}

In the case of time-series data, you can ingest data with all of the streaming ingestion options, such as native OpenSearch streaming APIs, Amazon Kinesis Data Firehose, AWS Glue, and a wide range of open-source streaming ingestion pipelines like Logstash, FluentBit, Fluentd, and Data Prepper.

In addition, you can snapshot your data from a managed cluster on OpenSearch Service and restore it to your collection, making it easy to migrate your workloads. Once your data is in your collection, you can then query it using your favorite OpenSearch client and interactively analyze and visualize your data using OpenSearch Dashboards.

Things to Know
Here are a couple of things to keep in mind about additional features and considerations when you choose Amazon OpenSearch Serverless:

  • SAML Authentications – You can use your existing identity provider to offer single sign-on (SSO) for the OpenSearch Dashboards endpoints of OpenSearch Serverless SAML authentication lets you use third-party identity providers to sign in to OpenSearch Dashboards to index and search data. OpenSearch Serverless supports providers that use the SAML 2.0 standard, such as Okta, Keycloak, Active Directory Federation Services, and Auth0.
  • Private VPC Endpoints – You can use AWS PrivateLink to create a private connection between your VPC and OpenSearch Serverless. You can access your collections as if they were in your VPC without the use of an internet gateway, NAT device, VPN connection, or AWS Direct Connect connection. To create an interface endpoint, choose VPC endpoints in the left navigation pane of OpenSearch Service.
  • Managed Clusters – You may prefer to use an option of Amazon OpenSearch Service’s managed clusters in scenarios where you need tight control over cluster configuration or specific customizations. For example, your workloads may need custom plugins that run best on accelerated computing instances and need more control on configuration such as data sharding strategy. You can choose either provisioned instances or serverless according to the requirements of your workload.

Join the Preview
The preview release of Amazon OpenSearch Serverless is now available in the US East (N. Virginia, Ohio), US West (Oregon), EU (Ireland), Asia Pacific (Tokyo). With OpenSearch Serverless, there are no upfront costs, and you pay only for the data that is ingest and the queries you run. For pricing details, see the OpenSearch Service pricing page. To learn more, visit the Amazon OpenSearch Service User Guide.

We want to hear more feedback during the preview. Please send feedback to AWS re:Post for Amazon OpenSearch Service or through your usual AWS support contacts.

Channy

New – Accelerate Your Lambda Functions with Lambda SnapStart

Post Syndicated from Jeff Barr original https://aws.amazon.com/blogs/aws/new-accelerate-your-lambda-functions-with-lambda-snapstart/

Our customers tell me that they love AWS Lambda for many reasons. On the development side they appreciate the simple programming model and ease with which their functions can make use of other AWS services. On the operations side they benefit from the ability to build powerful applications that can respond quickly to changing usage patterns.

As you might know if you are already using Lambda, your functions are run inside of a secure and isolated execution environment. The lifecycle of each environment consists of three main phases: Init, Invoke, and Shutdown. Among other things, the Init phase bootstraps the runtime for the function and runs the function’s static code. In many cases, these operations are completed within milliseconds and do not lengthen the phase in any appreciable way. In the remaining cases, they can take a considerable amount of time, for several reasons. First, initializing the runtime for some languages can be expensive. For example, the Init phase for a Lambda function that uses one of the Java runtimes in conjunction with a framework such as Spring Boot, Quarkus, or Micronaut can sometimes take as long as ten seconds (this includes dependency injection, compilation of the code for the function, and classpath component scanning). Second, the static code might download some machine learning models, pre-compute some reference data, or establish network connections to other AWS services.

Introducing Lambda SnapStart
In order to allow you to put Lambda to use in even more ways, we are introducing Lambda SnapStart today.

After you enable Lambda SnapStart for a particular Lambda function, publishing a new version of the function will trigger an optimization process. The process launches your function and runs it through the entire Init phase. Then it takes an immutable, encrypted snapshot of the memory and disk state, and caches it for reuse. When the function is subsequently invoked, the state is retrieved from the cache in chunks on an as-needed basis and used to populate the execution environment. This optimization makes invocation time faster and more predictable, since creating a fresh execution environment no longer requires a dedicated Init phase.

We are launching with support for Java functions that make use of the Corretto (java11) runtime, and expect to see Lambda SnapStart put to use right away for applications that make use of Spring Boot, Quarkus, Micronaut, and other Java frameworks. Enabling Lambda SnapStart for Java functions can make them start up to 10x faster, at no extra cost.

Using Lambda SnapStart
Because my last actual encounter with Java took place in the last century, I used the Serverless Spring Boot 2 example from the AWS Labs repo as a starting point. I installed the AWS SAM CLI and did a test build & deploy to establish a baseline. I invoked the function and saw that the Init duration was slightly more than 6 seconds:

Then I added two lines to template.yml to configure the SnapStart property:

I rebuilt and redeployed, published a fresh version of the function to set up SnapStart, and ran another test:

With SnapStart, the initialization phase (represented by the Init duration that I showed you earlier) happens when I publish a new version of the function. When I invoke a function that has SnapStart enabled, Lambda restores the snapshot (represented by the Restore duration) before invoking the function handler. As a result, the total cold invoke with SnapStart is now Restore duration + Duration. SnapStart has reduced the cold start duration from over 6 seconds to less than 200 ms.

Becoming Snap-Resilient
Lambda SnapStart speeds up applications by reusing a single initialized snapshot to resume multiple execution environments. This has a few interesting implications for your code:

Uniqueness – When using SnapStart, any unique content that used to be generated during the initialization must now be generated after initialization in order to maintain uniqueness. If you (or a library that you reference) uses a pseudo-random number generator, it should not be based on a seed that is obtained during the Init phase. We have updated OpenSSL’s RAND_Bytes to ensure randomness when used in conjunction with SnapStart, and we have verified that java.security.SecureRandom is already snap-resilient. Amazon Linux’s /dev/random and /dev/urandom are also snap-resilient.

Network Connections -If your code creates long-term connections to network services during the Init phase and uses them during the Invoke phase, make sure that it can re-establish the connection if necessary. The AWS SDKs have already been updated to do this.

Ephemeral Data – This is effectively a more general form of the above items. If your code downloads or computes reference information during the Init phase, consider doing a quick check to make sure that it has not gone stale during the caching period.

Lambda provides a pair of runtime hooks to help you to maintain uniqueness, as well as a scanning tool to help detect possible issues.

Things to Know
Here are a couple of other things to know about Lambda SnapStart:

Caching – Cached snapshots are removed after 14 days of inactivity. Lambda will automatically refresh the cache if a snapshot depends on a runtime that has been updated or patched.

Pricing – There is no extra charge for the use of Lambda SnapStart.

Feature Compatibility – You cannot use Lambda SnapStart with larger ephemeral storage, Elastic File Systems, Provisioned Concurrency, or Graviton2. In general, we recommend using SnapStart for your general-purpose Lambda functions and Provisioned Concurrency for the subset of those functions that are exceptionally sensitive to latency.

Firecracker – This feature makes use of Firecracker Snapshotting.

Regions – Lambda SnapStart is available in the US East (Ohio, N. Virginia), US West (Oregon), Asia Pacific (Singapore, Sydney, Tokyo), and Europe (Frankfurt, Ireland, Stockholm) Regions.

Jeff;

Amazon Inspector Now Scans AWS Lambda Functions for Vulnerabilities

Post Syndicated from Marcia Villalba original https://aws.amazon.com/blogs/aws/amazon-inspector-now-scans-aws-lambda-functions-for-vulnerabilities/

Amazon Inspector is a vulnerability management service that continually scans workloads across Amazon Elastic Compute Cloud (Amazon EC2) instances, container images living in Amazon Elastic Container Registry (Amazon ECR), and, starting today, AWS Lambda functions and Lambda layers.

Until today, customers that wanted to analyze their mixed workloads (including EC2 instances, container images, and Lambda functions) against common vulnerabilities needed to use AWS and third-party tools. This increased the complexity of keeping all their workloads secure.

In addition, the log4j vulnerability a few months ago was a great example that scanning your functions for vulnerabilities only before deployment is not enough. Because new vulnerabilities can appear at any time, it is very important for the security of your applications that the workloads are continuously monitored and rescanned in near real-time as new vulnerabilities are published.

Getting started
The first step to getting started with Amazon Inspector is to enable it for your account or your entire AWS Organizations. Once activated, Amazon Inspector automatically scans the functions in the selected accounts. Amazon Inspector is a native AWS service; this means that you don’t need to install a library or agent in your functions or layers for this to work.

Amazon Inspector is available starting today for functions and layers written in Java, NodeJS, and Python. By default, it continually scans all the functions inside your account, but if you want to exclude a particular Lambda function, you can attach the tag with the key InspectorExclusion and the value LambdaStandardScanning.

Amazon Inspector scans functions and layers initially upon deployment and automatically rescans them when there are changes in the workloads, for example, when a Lambda function is updated or when a new vulnerability (CVE) is published.

Summary for Amazon Inspector findings

In addition to functions, Amazon Inspector scans your Lambda layers; however, it only scans the specific layer version that is used in a function. If a layer or layer version is not used by any function, then it won’t get analyzed. If you are using third-party layers, Amazon Inspector also scans them for vulnerabilities.

You can see the findings for the different functions in the Amazon Inspector Findings console filtered By Lambda function. When Amazon Inspector finds something, all the findings are routed to AWS Security Hub and to Amazon EventBridge so you can build automation workflows, like sending notifications to the developers or system administrators.

Findings by function

Available Now
Amazon Inspector support for AWS Lambda functions and layers is generally available today in US East (Ohio), US East (N. Virginia), US West (N. California), US West (Oregon), Asia Pacific (Hong Kong), Asia Pacific (Mumbai), Asia Pacific (Seoul), Asia Pacific (Singapore), Asia Pacific (Sydney), Asia Pacific (Tokyo), Canada (Central), Europe (Frankfurt), Europe (Ireland), Europe (London), Europe (Milan), Europe (Paris), Europe (Stockholm), Middle East (Bahrain), and South America (Sao Paulo).

If you want to try this new feature, there is a 15-day free trial for you. Visit the service page to read more about the service and the free trial.

Marcia

New — Create and Share Operational Reports at Scale with Amazon QuickSight Paginated Reports

Post Syndicated from Donnie Prakoso original https://aws.amazon.com/blogs/aws/new-create-and-share-operational-reports-at-scale-with-amazon-quicksight-paginated-reports/

There are various ways to report on data insights, and paginated reports is one of them. Paginated reports are essential documents that contain critical business information for end-users. For decades, paginated reports have been the standard business reporting format. The following are examples of paginated reports. On the left shows the report for income statement and on the right is the yearly summary corporate statement:

Examples of paginated reports

As the example shows, paginated reports contain various highly formatted insights and are designed to be printable, in landscape or portrait orientation, so they can be consumed easily by readers. It’s called paginated because it often spans tens of hundreds of pages of data.

Although it may appear to be a simple task, generating paginated reports is heavily dependent on legacy data warehouses and legacy business intelligence tools, especially because modern business intelligence tools do not offer this capability. As a result, organizations typically have to maintain multiple business intelligence systems to have separate solutions for building critical operational reports and summarized dashboards. Each solution presents its set of challenges with data governance, security, and access management. This caused a disjointed experience both authors and end users. Legacy BI systems also run on-premises infrastructure, which is expensive to maintain and upgrade.

Introducing Amazon QuickSight Paginated Reports
Today, I’m pleased to announce Amazon QuickSight Paginated Reports. This feature allows customers to create and share highly formatted, personalized reports containing business-critical data to hundreds of thousands of end-users without any infrastructure setup or maintenance, up-front licensing, or long-term commitments.

Here’s a quick look on how Amazon QuickSight Paginated Reports works:

Quick look on Amazon QuickSight Paginated Reports

With Amazon QuickSight Paginated Reports, customers can now create and share paginated reports to their users from the same familiar QuickSight interface that they use to create and consume interactive dashboards. They can use one single BI service to create and deliver interactive analytics in dashboards, format reports with paginated reports, or embed analytics in apps while also allowing end users to ask questions of the underlying data using machine learning (ML) powered natural language query with QuickSight Q. From ML powered interactive dashboard to generating and distributing operational reports, these benefits impact different stakeholder groups in an organization

For Readers – Amazon QuickSight Paginated Reports makes it easy for readers to consume reports in a familiar and scheduled fashion, in highly formatted models in .pdf or .csv formats. Readers can access these reports via email, Amazon QuickSight web and mobile interfaces, mobile applications, or embedded portals.

For Authors – This feature gives report authors the flexibility to create highly formatted reports with images, texts, charts, tables, and exact page sizes. They can create reports from the same data models as dashboards, reusing data models built up, using access permissions (RLS/CLS) setup, and publishing in the same dashboards where their users look for data. These dashboards are also available via API, allowing migration between accounts or programmatic creation and migration of these assets as needed.

The Amazon QuickSight Paginated Reports makes it easy to build reports without the need for separate training or investment in a dedicated application. With an easy-to-use web-based authoring interface, this feature allows report authors to create complex data models in the form of operational reports for hundreds of thousands of report readers and enables data-driven decision-making.

For IT Leaders – This feature also provides IT leaders with benefits such as fully managed reporting capabilities consolidated within Amazon QuickSight. This reduces the time and resources required to set up and maintain reporting solutions, helping IT leaders to start looking at the cloud for their BI needs and transitioning legacy reporting to the cloud to save time and resources.

Amazon QuickSight Paginated Reports also leverages existing QuickSight capabilities, such as user management, data preparation, advanced scheduling and audit logging. By inheriting the capabilities from QuickSight, it removes the need to manage any infrastructure or provisioning setup to deliver reports to hundreds of thousands of users.

Get Started with Amazon QuickSight Paginated Reports
Let’s see how to get started with Amazon QuickSight Paginated Reports. I will focus more on how authors can create, publish and deliver reports to readers.

For Authors: Creating a Report
First, I open the QuickSight console. Then, in the navigation section, I select the dataset that I will use for reporting purposes. 

Selecting dataset

After I check and confirm the dataset, I select Use in Analysis.

Using dataset in analysis

On the next page, I have the option to select the sheet type, Interactive sheet, or Paginated report. I select Paginated report, and here I can configure the report for Paper size and either Portrait or Landscape orientation.

Select Paginated report

Now I’m starting my report creation. The sheet area I can use is adjusted to the paper size option I defined in the previous step. In this reporting sheet, QuickSight provides me with Header and Footer areas.

Header and footer area

First, I want to add the title of this report in the header section. I select the Header area, and in the menu section, I select Add text.

Adding text

Now, I can start entering the title of the report. I name this report “Attendance Statistics” and customize the header using the company logo. I can also use the text toolbar to format the text and add page numbers. For any changes I’ve made, I can also see the preview directly on this page.

Using text toolbar

I can also add other visuals in any section by selecting Add visual.

Adding visual

From here, I can start building reports with the available visuals, just like I normally do on the Amazon QuickSight dashboard. For example, if I need to add a summary to the pie chart, I can add another text box and drag and drop to set the layout and resize the visuals as needed.

Arranging layout

If I need to add another section, from the menu, I select Add section, and I can add other visuals or insights into this new section. As for visual tabular data, the visual will be generated across pages.

Table will automatically expand across pages

For Author: Publish and Schedule Report
Once the analysis is completed, I need to publish this analysis as a dashboard by selecting Share and then Publish dashboard. Then I can choose to create a new dashboard by selecting Publish new dashboard or Replace an existing dashboard. I can also select the sheet(s) I want to publish.

Publishing dashboard

At this stage, I’m ready to set a schedule to deliver my reports to readers. To do that, I need to open the dashboard and define a schedule by selecting Add schedule.

Select Add Schedule

In this menu, I can specify the schedule name and also the content format. In the Content section, I can choose either PDF or CSV format. For PDF format, I can select the sheet I want to use. For CSV format, I can select multiple visuals.

Schedule configuration

As for the delivery report schedule, I can define the schedule as Daily, Weekly, Monthly, or one-time delivery with Do not repeat. I can also specify the date and time of delivery, including the time zone.

Schedule timing configuration

Then, I specify the configuration of the email message. In the final section, I can also specify how readers access this report, by using Download link or File attachment. Once I’m done setting up the schedule, I can Save it or send this report according to the schedule by selecting Save and run now.


Save or save and run now

For Readers: Receiving and Accessing Reports
Here is an example email from the schedule that QuickSight has sent to me as a reader. I can download this report from the email attachment or from the dashboard. 

Example mail with paginated report

I can also use the provided link in the email to view recent snapshots. The Recent Snapshots feature allows me to review previously generated reports.Recent snapshots feature

Things to Know
Programmatic API Access – In addition to using the Amazon QuickSight console, customers can also use the AWS API and SDK to interact programmatically with Amazon QuickSight Paginated Reports.

AWS Partners – To make it easier for customers to migrate their legacy BI solutions to Amazon QuickSight, customers can work with AWS partners, Ironside Consulting and Data Terrain. Ironside and Data Terrain offerings are available in the AWS Marketplace, with more details at Amazon QuickSight Partners page.

Availability and Pricing – Amazon QuickSight Paginated Reports is available as an add-on to the existing Amazon QuickSight Enterprise or Enterprise enabled with Q in all supported AWS Regions.

Visit the Amazon QuickSight Paginated Reports page to learn more details on how to use this feature, learn how to get started, and understand the pricing.

Happy building!
Donnie