We really love builders at AWS. We’re constantly thinking of new ways to help technical communities thrive and create spaces like AWS Developer Center and community.aws where people can connect and share their knowledge and experiences.
Today, we’re announcing AWS Builder Center, a new home for builders to access all builder resources, engage with the AWS community, and provide feedback or product suggestions to AWS product teams. This new experience also integrates the previous AWS Developer Center and community.aws.
There are a variety of exciting features so let us discover some of them.
Your voice matters: Introducing Wishlist One of the most exciting new features, in my opinion, is Wishlist. You can now submit your wishes for new features or improvements you’d like to see in AWS services. Others can discover and vote on these wishes while also creating their own.
You can influence product roadmap collectively as a community and help us shape the future of AWS services. You can share ideas, suggestions, feature proposals, or challenges while operating AWS services, with the ability for the AWS community to upvote ideas and highlight the most sought-after improvements. Our internal teams will keep an eye on these and bring the most popular wishes to the attention of our service teams, making your voice an integral part of our product development process.
On top of that, you can bookmark this page as your centralized hub for finding upcoming community events, making it easy to find opportunities to learn and network in your local area and meet like-minded builders who share your interests.
Speaking of following people, AWS Builder Center makes it really straightforward to connect and engage with others, serving as the central hub for the AWS technical community. It brings together all the different ways that you can connect with fellow builders. For example, the Who to Follow section introduces you to AWS Heroes, Community Builders, and active community members who are sharing their knowledge and expertise in your areas of interest.
Explore our AWS hands-on resources On the Build page, you’ll discover ways to get familiar with AWS with hands-on experience such as interactive learning resources designed for every skill level such as AWS Tutorials and AWS Workshops. You can explore generative AI and agentic AI services playground and find the AWS Free Tier to try out AWS services free of charge up to specified limits for each service.
Choose the Toolbox page and discover the latest tools, programming language resources, and Open Source projects for AWS. The Toolbox has everything you need to get your project scaffolded and up and running.
To improve the build experience for builders, we plan to expand Builder Center’s built-in offerings such as creating dedicated groups and forums for collaborating on a particular topic, run workshops for hands-on labs, and various service playgrounds where builders can freely experiment with AWS services.
Supporting your builder journey The new Learn section serves as your gateway to skill development, bringing together everything you need to expand your AWS expertise. Here, you can explore learning and training resources, workshops, gamified experiences, and more to make your journey of building on AWS both educational and engaging.
Choose the Topics page, where you can explore and discover more content. You can explore content by topics and tags. There is a featured and trending topics section that helps you to stay connected with what’s capturing the community’s attention right now.
Built-in localization for your spoken language AWS Builder Center breaks down language barriers with comprehensive localization support. All content published in the Builder Center is automatically available in 16 languages, and user-generated content, such as posts, comments, or wishes, can be machine-translated on demand using Translate. So, you can collaborate with builders worldwide, sharing knowledge and experiences across language boundaries.
By default, all content will be displayed in based on the language that your browser is set to. But, you can override this by visiting the settings page and choosing the language that you want AWS Builder Center to use by default.
Sign up and build your profile now AWS Builder Center gives you a more personalized and comprehensive way to showcase your AWS journey. Your unique profile comes with a custom URL and shareable QR code, making it straightforward to connect with others and share your presence in the AWS community.
All your posts, wishes, and meaningful interactions are organized within a centralized view so you can easily check them. In the Manage profile page, you can customize your profile, add specific interests and areas of expertise, helping you connect with builders who share your passions. Profile management is seamless: it synchronizes across all AWS services using AWS Builder ID, ensuring your identity remains consistent wherever you engage with AWS offerings.
Visit builder.aws.com, sign up with AWS Builder ID, and claim your unique alias to access all features, including content creation, Wishlist, and community engagement tools.
AWS Builder Center was designed to help you connect, learn, and build with fellow AWS builders, so enjoy your journey together!
Amazon Web Services (AWS) is pleased to announce that three new AWS services have been added to the scope of our Payment Card Industry Data Security Standard (PCI DSS) certification:
This certification means that customers can use these services while maintaining PCI DSS compliance, enabling innovation without compromising security. The full list of services can be found on the AWS Services in Scope by Compliance Program page. The PCI DSS compliance package includes two key components:
Attestation of Compliance (AOC) – demonstrates that AWS was successfully validated against the PCI DSS standard.
AWS Responsibility Summary – provides guidance to help AWS customers understand their responsibility in developing and operating a highly secure environment on AWS for handling payment card data.
AWS was evaluated by Coalfire, a third-party Qualified Security Assessor (QSA).
This refreshed certification offers customers greater flexibility in deploying regulated workloads while reducing compliance overhead. Customers can access the PCI DSS reports through AWS Artifact. This self-service portal provides on-demand access to AWS compliance reports, streamlining audit processes.
To learn more about our PCI programs and other compliance and security programs, see the AWS Compliance Programs page. As always, we value your feedback and questions; reach out to the AWS Compliance team through the Compliance Support page.
If you have feedback about this post, submit comments in the Comments section below. If you have questions about this post, contact AWS Support.
Today, we’re announcing the general availability of Oracle Database@AWS, a new offering for Oracle Exadata workloads, including Oracle Real Application Clusters (RAC) within AWS.
In the past 14 years, customers had the choice of self-managing Oracle database workloads in the cloud using Amazon Elastic Compute Cloud (Amazon EC2) or using fully managed Amazon Relational Database Service (Amazon RDS) for Oracle. Now, you have an additional option for your workloads that require Oracle RAC or Oracle Exadata for quicker and simpler migrations to the cloud. You also get a single invoice through AWS Marketplace, which counts towards AWS commitments and Oracle license benefits, including Bring Your Own License (BYOL) and discount programs such as Oracle Support Rewards.
With Oracle Database@AWS, you can migrate your Oracle Exadata workloads to Oracle Exadata Database Service on Dedicated Infrastructure or Oracle Autonomous Database on Dedicated Exadata Infrastructure within AWS with minimal changes. You can purchase, provision, and manage your Oracle Database@AWS deployments through familiar AWS tools and interfaces such as AWS Management Console, AWS Command Line Interface (AWS CLI), or AWS APIs for applications running on AWS. The AWS APIs call the corresponding Oracle Cloud Infrastructure (OCI) APIs necessary to provision and manage the resources.
Since its preview last December, we’ve improved or added features to help run production workloads at general availability:
Regional expansion – You can now use Oracle Database@AWS in the U.S. East (N. Virginia) and U.S. West (Oregon) Regions today. We are also announcing plans to expand to 20 AWS Regions globally. This broader availability supports the diverse needs of our customers across various geographical areas so more enterprises can benefit from this option. You can choose from different Exadata system sizes to match your workload requirements in your AWS Region.
Zero-ETL and S3 backups – You can now benefit from zero-ETL integration with Amazon Redshift for analytics to remove the need to build and manage data pipelines for extract, transform, and load operations. With zero-ETL, you can unify your data on AWS without incurring cross network data transfer costs. We’re providing Amazon Simple Storage Service (Amazon S3) backups with up to eleven nines of data durability.
Autonomous VM cluster – You can now provision an Autonomous VM Cluster in addition to an Exadata VM cluster on the Exadata Dedicated Infrastructure. You can run Oracle Autonomous Database on Dedicated Exadata Infrastructure, a fully managed database environment using committed hardware and software resources.
Getting started with Oracle Database@AWS Oracle Database@AWS supports two key services: Oracle Exadata Database Service on Dedicated Infrastructure and Oracle Autonomous Database on Dedicated Exadata Infrastructure within AWS data centers.
These services physically reside within an Availability Zone in an AWS Region and logically reside in an OCI region, enabling seamless integration with AWS services through high-speed, low-latency connections.
You create an ODB network, a private, isolated network that hosts Oracle Exadata VM Clusters within an Availability Zone. Then, you use ODB peering accessible to EC2 application servers running in a VPC. To learn more, visit How Oracle Database@AWS works in the AWS documentation.
Request a private offer in AWS Marketplace
To begin your journey with Oracle Database@AWS, visit the AWS console or request the AWS Marketplace private offer. Your AWS and Oracle sales team will receive your request, then contact you to find the best option for your workloads, and activate your account.
When you activate and get access to Oracle Database@AWS, you can use the Dashboard to create an ODB network, Exadata infrastructure, and Exadata VM cluster or Autonomous VM cluster, and ODB peering connection.
An ODB network is a private isolated network that hosts OCI infrastructure on AWS. The ODB network maps directly to the network that exists within the OCI child site, thus serving as the means of communication between AWS and OCI.
In the Dashboard, choose Create ODB network, enter a network name, choose the Availability Zone, and specify a CIDR ranges for client connections established by applications and backup connections used for taking automated backups. You can also enter a name to use as a prefix to your domain fixed as oraclevcn.com. For example, if you enter myhost, the fully qualified domain name is myhost.oraclevcn.com.
Optionally, you can configure ODB network access to perform automated backups to Amazon S3 and zero-ETL for near real-time analytics and ML on your Oracle data using Amazon Redshift.
After you create your ODB network, update your VPC route tables of your EC2 application servers with the client connection CIDR in the ODB network. To learn more, visit ODB network, ODB peering, and Configuring VPC route tables for ODB peering in the AWS documentation.
Create Exadata infrastructure
The Oracle Exadata infrastructure is the underlying architecture of your database servers, storage servers, and networking that run your Oracle Exadata databases.
Choose Create Exadata infrastructure, enter a name, and use the default Availability Zone. In the next step, you can choose Exadata.X11M for the Exadata system model. You can also set a default of 2 or up to 32 database servers and 3 or up to 64 storage servers with 80 TB storage capacity per server.
Finally, you can configure system maintenance preferences, such as scheduling, patching mode, and OCI maintenance notification contacts. You can’t modify an infrastructure after you create it from the AWS console. But, you can navigate to the OCI console and modify it.
Create an Exadata VM cluster or Autonomous VM cluster
You can create VM clusters on Exadata infrastructure and deploy multiple VM clusters with different Oracle Exadata infrastructures in the same ODB network.
Here are two types of VM clusters:
An Exadata VM cluster is a set of virtual machines that has a complete Oracle database installation that includes all features of Oracle Enterprise Edition.
An Autonomous VM cluster is a set of fully managed databases that automate key management tasks using AI/ML with no human intervention required.
Choose Create Exadata VM cluster, enter a VM cluster name and a time zone, choose Bring Your Own License (BYOL) or license included for license options. In the next step, you can choose your Exadata infrastructure, grid infrastructure version, and Exadata image version. For database servers, you can choose the CPU core count, memory, and local storage for each VM or accept the defaults.
In the next step, you can configure the connectivity setting by choosing your ODB network and entering a prefix for the VM cluster. You can enter a port number for TCP access to the single client access name (SCAN) listener. The default port is 1521 or you can enter a custom SCAN port in the range 1024–8999. For SSH key pairs, enter the public key portion of one or more key pairs used for SSH access to the VM cluster.
Then, you can choose diagnostics and tags, review your settings, and create a VM cluster. The creation process can take up to 6 hours, depending on the size of the VM cluster.
Create and manage an Oracle database
When the VM cluster is ready, you can create and manage your Oracle Exadata databases in the OCI console. Choose Manage in OCI in the details page of the Exadata VM cluster. You will be redirected to the OCI console.
When you create an Oracle Database in the OCI console, you can select Oracle Database 19c or 23ai. When enabling automatic backups for your provisioned databases, you can use an S3 bucket or OCI Object Storage in the OCI region. To learn more, visit Provision Oracle Exadata Database Service in Oracle Database@AWS in the OCI documentation.
Things to know Here are a couple of things to know about Oracle Database@AWS:
Monitoring – You can monitor Oracle Database@AWS using Amazon CloudWatch metrics in the AWS/ODB namespaces for VM clusters, container databases, and pluggable databases. AWS CloudTrail captures all AWS API calls for Oracle Database@AWS as events. Using CloudTrail logs, you can determine the request that was made to Oracle Database@AWS, the IP address from which the request was made, when it was made, and additional details. To learn more, visit Monitoring Oracle Database@AWS.
Security – You can use IAM to assign permissions that determine who is allowed to manage Oracle Database@AWS resources and SSL/TLS encrypted connections to secure data. You can also use Amazon EventBridge for seamless event-driven database operations—all working together to maintain security standards while enabling efficient cloud operations. To learn more, visit Security in Oracle Database@AWS.
Compliance – Your compliance responsibility when using Oracle Database@AWS is determined by the sensitivity of your data, your company’s compliance objectives, and applicable laws and regulations. We provides the following compliances with Oracle Database@AWS: SOC 1, SOC 2, SOC 3, HIPAA, C5, CSA STAR Attest, CSA STAR Cert, HDS (France), ISO Series (ISO/IEC 9001, 20000-1, 27001, 27017, 27018, 27701, 22301), PCI DSS, and HITRUST. To learn more, visit Compliance validation for Oracle Database@AWS.
Support – Your AWS or Oracle sales account team can help you evaluate your current database infrastructure, determine how Oracle Database@AWS can best serve your organization’s requirements, and develop a tailored migration strategy and timeline. You can also get help from AWS Oracle Competency Partners specialized to architect, deploy, and manage Oracle-based workloads running in the AWS Cloud.
Now available and coming soon Oracle Database@AWS is now available in the U.S. East (N. Virginia) and U.S. West (Oregon) Regions through the AWS Marketplace. Oracle Database@AWS pricing and any AWS Marketplace private offers are set by Oracle. You can see specific details around pricing on Oracle’s pricing page for the offering.
Oracle Database@AWS will expand to 20 more AWS Regions across the Americas, Europe, and Asia-Pacific including: US East (Ohio), US West (N. California), Asia Pacific (Hyderabad), Asia Pacific (Melbourne), Asia Pacific (Mumbai), Asia Pacific (Osaka), Asia Pacific (Seoul), Asia Pacific (Singapore), Asia Pacific (Sydney), Asia Pacific (Tokyo), Canada (Central), Europe (Frankfurt), Europe (Ireland), Europe (London), Europe (Milan), Europe (Paris), Europe (Spain), Europe (Stockholm), Europe (Zurich), and South America (São Paulo).
Every Monday we tell you about the best releases and blogs that caught our attention last week.
Before continuing with this AWS Weekly Roundup, I’d like to share that last month I moved with my family to San Francisco, California, to start a new role as Developer Advocate/SDE, GenAI.
This excites me because I’ll have the opportunity to connect with new communities in the Bay Area while tackling exciting new challenges. If you’re part of a community focused on building generative AI and agentics applications, or know of one, I’d love to connect. Let’s connect!
Last week’s launches Here are the launches from last week:
New Amazon EC2 C8gn instances powered by AWS Graviton4 offering up to 600Gbps network bandwidth – Amazon Elastic Compute Cloud (Amazon EC2) C8gn instances are now generally available, powered by AWS Graviton4 processors and 6th generation AWS Nitro Cards. These network-optimized instances deliver up to 600 Gbps network bandwidth. This represents the highest bandwidth among EC2 network-optimized instances, with up to 192 vCPUs and 384 GiB memory. They provide 30% higher compute performance than C7gn instances and are ideal for network-intensive workloads like virtual appliances, data analytics, and cluster computing jobs.
Build the highest resilience apps with multi-Region strong consistency in Amazon DynamoDB global tables – Amazon DynamoDB global tables now supports multi-Region strong consistency (MRSC) for applications requiring zero Recovery Point Objective (RPO). This capability ensures applications can read the latest data from any Region during outages, addressing critical needs in payment processing and financial services. MRSC requires three AWS Regions configured as either three full replicas or two replicas plus a witness, providing the highest level of application resilience for mission-critical workloads.
Amazon Nova Canvas update: Virtual try-on and style options now available – Amazon Nova Canvas introduces virtual try-on capabilities that help you visualize how clothing looks on a person by combining two images, plus eight new pre-trained style options (3D animation, design sketch, vector illustration, graphic novel, etc.) for generating images with improved artistic consistency. Available in three AWS Regions, these features enhance AI-powered image generation capabilities for retailers and content creators seeking realistic product visualizations.
Amazon Q in Connect now supports 7 languages for proactive recommendations – Amazon Q in Connect, a generative AI-powered assistant for customer service, now provides proactive recommendations in seven languages: English, Spanish, French, Portuguese, Mandarin, Japanese, and Korean. The AI-powered customer service assistant detects customer intent during voice and chat interactions to help agents resolve issues quickly and accurately.
Amazon Aurora DSQL is now available in additional AWS Regions – Amazon Aurora DSQL expands to Asia Pacific (Seoul) and now supports multi-Region clusters across Asia Pacific and European regions. This serverless, distributed SQL database offers unlimited scalability, highest availability, and zero infrastructure management with AWS Free Tier access.
Other AWS blog posts
Optimize RAG in production environments using Amazon SageMaker JumpStart and Amazon OpenSearch Service – Learn how to optimize Retrieval Augmented Generation (RAG) in production environments using Amazon SageMaker JumpStart and Amazon OpenSearch Service. This comprehensive guide demonstrates implementing RAG workflows with LangChain, covers OpenSearch optimization strategies, provides setup instructions, and explains benefits of combining these AWS services for scalable, cost-effective generative AI applications.v
Agentic GenAI App Using Bedrock, MCP servers on EKS – This post shows how to build a scalable AI chat application using Amazon Bedrock, Strands Agent, and Model Context Protocol (MCP) servers deployed on Amazon Elastic Kubernetes Service (Amazon EKS). The architecture combines agentic workflows with containerized microservices for intelligent, auto-scaling conversations with multiple foundation models.
Enforce table level access control on data lake tables using AWS Glue 5.0 with AWS Lake Formation – AWS Glue 5.0 introduces Full-Table Access (FTA) control for Apache Spark with AWS Lake Formation, providing table-level security without fine-grained access overhead. This feature supports native Spark SQL/DataFrames for Lake Formation tables. It enables read/write operations on Iceberg and Hive tables with improved performance and lower costs.
Upcoming AWS events Check your calendars and sign up for these upcoming AWS events:
AWS re:Invent – Register now to get a head start on choosing your best learning path, booking travel and accommodations, and bringing your team to learn, connect, and have fun. Early-career professionals can apply for the All Builders Welcome Grant program, designed to remove financial barriers and create diverse pathways into cloud technology. Applications are now open and close on July 15, 2025.
AWS NY Summit – You can gain insights from Swami’s keynote featuring the latest cutting-edge AWS technologies in compute, storage, and generative AI. My News Blog team is also preparing some exciting news for you. If you’re unable to attend in person, you can still participate by registering for the global live stream. Also, save the date for these upcoming Summits in July and August near your city.
AWS Builders Online Series – If you’re based in one of the Asia Pacific time zones, join and learn fundamental AWS concepts, architectural best practices, and hands-on demonstrations to help you build, migrate, and deploy your workloads on AWS.
Join AWS Gen AI Lofts – Experience AWS Gen AI Lofts across San Francisco, Berlin, Dubai, Dublin, Bengaluru, Manchester, Paris, Tel Aviv, and additional locations – hands-on workshops, expert guidance, investor networking, and collaborative spaces designed to accelerate your generative AI startup journey.
We’re excited to announce that AWS has completed the CyberVadis assessment of its security posture with the highest score (Mature) in all assessed areas. This demonstrates our continued commitment to meet the heightened expectations for cloud service providers. Customers can now use the 2025 AWS CyberVadis report and scorecard to reduce their supplier due-diligence burden.
With the increasing adoption of cloud products and services across multiple sectors and industries, AWS is a critical component of customers’ third-party environments. Regulated customers, such as those in the financial services sector, are held to high standards by regulators and auditors when it comes to exercising effective due diligence on third parties.
Many customers use third-party risk management services such as CyberVadis to better manage risks from their evolving third-party environments and drive operational efficiencies. In support of these efforts, AWS has completed its annual CyberVadis security posture assessment, conducted by CyberVadis security analysts.
CyberVadis is a comprehensive third-party risk assessment process that combines the speed and scalability of automation with the certainty of analyst validation. CyberVadis assessments employ a dynamic and comprehensive approach to third-party risk assessment, replacing outdated static spreadsheets and the need for annual AWS assessment access requests. This cloud-based solution provides advanced capabilities by integrating AWS responses with analytics and sophisticated risk models to deliver an in-depth view of the security posture of AWS.
CyberVadis’s risk assessment methodology evaluates 20 topics covering the entire cybersecurity life cycle across four phases: Identify, Protect, Detect, and React. These topics include Data Privacy, Access Management, and Infrastructure Security. The assessment criteria are based on international information security standards, including ISO 2700x, NIST Cybersecurity Framework, Cybersecurity for ICS, PCI DSS, NIS2 and GDPR.
Customers can use CyberVadis results to map the assessment of AWS to commonly used industry frameworks and standards to instantly gain visibility into controls coverage.
AWS customers can download the complete 2025 AWS Assessment Report directly through CyberVadis’s portal using their own account, or through AWS Artifact.
We value your feedback and questions. Reach out to the AWS Compliance team through the Contact Us page. If you have feedback about this post, submit comments in the Comments section below. To learn more about our other compliance and security programs, see AWS Compliance Programs.
Have you ever wished you could quickly visualize how a new outfit might look on you before making a purchase? Or how a piece of furniture would look in your living room? Today, we’re excited to introduce a new virtual try-on capability in Amazon Nova Canvas that makes this possible. In addition, we are adding eight new style options for improved style consistency for text-to-image based style prompting. These features expand Nova Canvas AI-powered image generation capabilities making it easier than ever to create realistic product visualizations and stylized images that can enhance the experience of your customers.
Let’s take a quick look at how you can start using these today.
Getting started The first thing is to make sure that you have access to the Nova Canvas model through the usual means. Head to the Amazon Bedrock console, choose Model access and enable Amazon Nova Canvas for your account making sure that you select the appropriate regions for your workloads. If you already have access and have been using Nova Canvas, you can start using the new features immediately as they’re automatically available to you.
Virtual try-on The first exciting new feature is virtual try-on. With this, you can upload two pictures and ask Amazon Nova Canvas to put them together with realistic results. These could be pictures of apparel, accessories, home furnishings, and any other products including clothing. For example, you can provide the picture of a human as the source image and the picture of a garment as the reference image, and Amazon Nova Canvas will create a new image with that same person wearing the garment. Let’s try this out!
My starting point is to select two images. I picked one of myself in a pose that I think would work well for a clothes swap and a picture of an AWS-branded hoodie.
Note that Nova Canvas accepts images containing a maximum of 4.1M pixels – the equivalent of 2,048 x 2,048 – so be sure to scale your images to fit these constraints if necessary. Also, if you’d like to run the Python code featured in this article, ensure you have Python 3.9 or later installed as well as the Python packages boto3 and pillow.
To apply the hoodie to my photo, I use the Amazon Bedrock Runtime invoke API. You can find full details on the request and response structures for this API in the Amazon Nova User Guide. The code is straightforward, requiring only a few inference parameters. I use the new taskType of "VIRTUAL_TRY_ON". I then specify the desired settings, including both the source image and reference image, using the virtualTryOnParams object to set a few required parameters. Note that both images must be converted to Base64 strings.
import base64
def load_image_as_base64(image_path):
"""Helper function for preparing image data."""
with open(image_path, "rb") as image_file:
return base64.b64encode(image_file.read()).decode("utf-8")
inference_params = {
"taskType": "VIRTUAL_TRY_ON",
"virtualTryOnParams": {
"sourceImage": load_image_as_base64("person.png"),
"referenceImage": load_image_as_base64("aws-hoodie.jpg"),
"maskType": "GARMENT",
"garmentBasedMask": {"garmentClass": "UPPER_BODY"}
}
}
Nova Canvas uses masking to manipulate images. This is a technique that allows AI image generation to focus on specific areas or regions of an image while preserving others, similar to using painter’s tape to protect areas you don’t want to paint.
You can use three different masking modes, which you can choose by setting maskType to the correct value. In this case, I’m using "GARMENT", which requires me to specify which part of the body I want to be masked. I’m using "UPPER_BODY" , but you can use others such as "LOWER_BODY", "FULL_BODY", or "FOOTWEAR" if you want to specifically target the feet. Refer to the documentation for a full list of options.
I then call the invoke API, passing in these inference arguments and saving the generated image to disk.
# Note: The inference_params variable from above is referenced below.
import base64
import io
import json
import boto3
from PIL import Image
# Create the Bedrock Runtime client.
bedrock = boto3.client(service_name="bedrock-runtime", region_name="us-east-1")
# Prepare the invocation payload.
body_json = json.dumps(inference_params, indent=2)
# Invoke Nova Canvas.
response = bedrock.invoke_model(
body=body_json,
modelId="amazon.nova-canvas-v1:0",
accept="application/json",
contentType="application/json"
)
# Extract the images from the response.
response_body_json = json.loads(response.get("body").read())
images = response_body_json.get("images", [])
# Check for errors.
if response_body_json.get("error"):
print(response_body_json.get("error"))
# Decode each image from Base64 and save as a PNG file.
for index, image_base64 in enumerate(images):
image_bytes = base64.b64decode(image_base64)
image_buffer = io.BytesIO(image_bytes)
image = Image.open(image_buffer)
image.save(f"image_{index}.png")
I get a very exciting result!
And just like that, I’m the proud wearer of an AWS-branded hoodie!
In addition to the "GARMENT" mask type, you can also use the "PROMPT" or "IMAGE" masks. With "PROMPT", you also provide the source and reference images, however, you provide a natural language prompt to specify which part of the source image you’d like to be replaced. This is similar to how the "INPAINTING" and "OUTPAINTING" tasks work in Nova Canvas. If you want to use your own image mask, then you choose the "IMAGE" mask type and provide a black-and-white image to be used as mask, where black indicates the pixels that you want to be replaced on the source image, and white the ones you want to preserve.
This capability is specifically useful for retailers. They can use it to help their customers make better purchasing decisions by seeing how products look before buying.
Using style options I’ve always wondered what I would look like as an anime superhero. Previously, I could use Nova Canvas to manipulate an image of myself, but I would have to rely on my good prompt engineering skills to get it right. Now, Nova Canvas comes with pre-trained styles that you can apply to your images to get high-quality results that follow the artistic style of your choice. There are eight available styles including 3D animated family film, design sketch, flat vector illustration, graphic novel, maximalism, midcentury retro, photorealism, and soft digital painting.
Applying them is as straightforward as passing in an extra parameter to the Nova Canvas API. Let’s try an example.
I want to generate an image of an AWS superhero using the 3D animated family film style. To do this, I specify a taskType of "TEXT_IMAGE" and a textToImageParams object containing two parameters: text and style. The text parameter contains the prompt describing the image I want to create which in this case is “a superhero in a yellow outfit with a big AWS logo and a cape.” The style parameter specifies one of the predefined style values. I’m using "3D_ANIMATED_FAMILY_FILM" here, but you can find the full list in the Nova Canvas User Guide.
inference_params = {
"taskType": "TEXT_IMAGE",
"textToImageParams": {
"text": "a superhero in a yellow outfit with a big AWS logo and a cape.",
"style": "3D_ANIMATED_FAMILY_FILM",
},
"imageGenerationConfig": {
"width": 1280,
"height": 720,
"seed": 321
}
}
Then, I call the invoke API just as I did in the previous example. (The code has been omitted here for brevity.) And the result? Well, I’ll let you judge for yourself, but I have to say I’m quite pleased with the AWS superhero wearing my favorite color following the 3D animated family film style exactly as I envisioned.
What’s really cool is that I can keep my code and prompt exactly the same and only change the value of the style attribute to generate an image in a completely different style. Let’s try this out. I set style to PHOTOREALISM.
inference_params = {
"taskType": "TEXT_IMAGE",
"textToImageParams": {
"text": "a superhero in a yellow outfit with a big AWS logo and a cape.",
"style": "PHOTOREALISM",
},
"imageGenerationConfig": {
"width": 1280,
"height": 720,
"seed": 7
}
}
And the result is impressive! A photorealistic superhero exactly as I described, which is a far departure from the previous generated cartoon and all it took was changing one line of code.
Things to know Availability – Virtual try-on and style options are available in Amazon Nova Canvas in the US East (N. Virginia), Asia Pacific (Tokyo), and Europe (Ireland). Current users of Amazon Nova Canvas can immediately use these capabilities without migrating to a new model.
For a preview of virtual try-on of garments, you can visit nova.amazon.com where you can upload an image of a person and a garment to visualize different clothing combinations.
An organization’s data can come from various sources, including cloud-based pipelines, partner ecosystems, open table formats like Apache Iceberg, software as a service (SaaS) platforms, and internal applications. Although much of this data is business-critical, the ability to make it documented and discoverable at scale continues to challenge teams—especially when assets don’t originate from pre-integrated AWS based sources.
To help bridge this gap, Amazon SageMaker Catalog—part of the next generation of Amazon SageMaker—now supports generative AI-powered recommendations for business descriptions, including table summaries, use cases, and column-level descriptions for custom structured assets registered programmatically. This new capability, powered by large language models (LLMs) in Amazon Bedrock, extends automated metadata generation to the broader spectrum of enterprise data, including Iceberg tables in Amazon Simple Storage Service (Amazon S3) or datasets from third-party and internal applications.
With just a few clicks, you can create AI-generated suggestions, review and refine descriptions, and publish enriched asset metadata directly to the catalog. This helps reduce manual documentation effort, improves metadata consistency, and accelerates asset discoverability across organizations.
This launch is part of our broader investment in generative AI-powered cataloging and metadata intelligence across SageMaker Catalog. By combining machine learning (ML) with human oversight and governance controls, we’re making it straightforward for organizations to scale trusted, usable data across business units.
In this post, we demonstrate how to generate AI recommendations for business descriptions for custom structured assets in SageMaker Catalog.
Challenges when using incomplete metadata for custom and external data
SageMaker Catalog supports automated documentation for assets harvested from AWS-centered services like AWS Glue and Amazon Redshift. These built-in integrations automatically pull schema and generate contextual metadata, making it straightforward for data consumers to discover and understand what’s available.
However, many critical datasets originate outside of these services, such as:
Iceberg tables stored in Amazon S3
Structured datasets from third-party platforms like Snowflake or Databricks
Relational assets manually registered using APIs
As a result, customers had to manually enter business descriptions and column-level context—a process that delays publishing, introduces inconsistency, and undermines the discoverability of important assets.
With this launch, SageMaker Catalog adds support for generative AI-powered metadata generation for custom schema-based data assets registered programmatically through APIs. We use large language models (LLMs) in Amazon Bedrock to automatically generate key elements for custom structured assets. This includes providing a comprehensive table summary, detailed column-level descriptions, and suggesting potential analytical use cases. These automated capabilities help streamline the documentation process, ensuring consistency and efficiency across data assets.
Customer Spotlight
Across industries, customers are managing thousands of structured datasets that don’t originate from AWS-native pipelines. These datasets often lack documentation—not because they’re unimportant, but because documenting them is time-consuming, repetitive, and often deprioritized.
How Amazon’s Finance is revolutionizing data management with AI-powered metadata generation
As a large-scale organization with diverse data needs, Amazon’s Finance team manages thousands of data assets. Within the Finance organization, numerous datasets often lack proper documentation, creating bottlenecks that hinder critical financial analysis and decision-making.
Balaji Kumar Gopalakrishnan, Principal Engineer at Amazon Finance, shares how the AI-powered metadata generation capability is transforming their data management approach:
“As a finance organization, we manage numerous datasets that lack proper documentation, creating bottlenecks for critical financial analysis. The AI-powered auto-documentation capability would be transformative for our team—alleviating the manual documentation effort that delays asset discovery and usability. This would dramatically reduce our time-to-insight for reporting while enforcing consistent metadata standards across all our manually registered assets.”
This empowers teams like Amazon Finance to streamline metadata generation and documentation, making critical financial data easier to access and work with. By automating metadata creation, teams can focus on high-impact analysis, accelerating their decision-making process and improving the overall efficiency of the organization.
Key Benefits
This new feature directly addresses key challenges faced by cataloging teams by enabling them to:
Accelerate time to publish: Minimize the delay between data availability and catalog readiness.
Enhance discoverability: Enable quick and easy access to data through rich, searchable descriptions.
Build trust: Provide transparent, editable AI suggestions to ensure metadata aligns with organizational needs and domain accuracy.
For data producers, this capability eliminates the need for repetitive, manual documentation, saving valuable time. By automating metadata generation, it also standardizes how metadata is written and structured across assets, resulting in faster publishing and quicker data access for consumers.
On the consumer side, the enhanced metadata offers greater clarity, allowing users to understand the data and its usage at a glance. With complete and curated metadata, they can trust the source, while working more independently and reducing reliance on subject matter experts (SMEs) and data stewards for interpretation.
Solution overview
In this post, we demonstrate how to manually create a structured asset and use the new AI-powered capability to generate business metadata to improve asset usability. The asset we add is a product inventory table with the following columns:
To follow this post, you must have an Amazon SageMaker Unified Studio domain set up with a domain owner or domain unit owner privileges. You must have a project that we will use to publish assets. For instructions, refer to the SageMaker Unified Studio Getting started guide.
Create an asset
Complete the following steps to manually create the asset:
The manually registered asset types need to use the amazon.datazone.RelationalTableFormType form type. Get the latest revision in your domain. Run the following command, replacing the domain-identifier with your domain:
Create the asset for the table using the asset type and replacing the domain and project identifiers in your domain. For this example, we also enable businessNameGeneration:
When an asset is created with businessNameGeneration enabled, it generates the business name predictions asynchronously. After they are generated, they are returned as suggestions under the asset’s readOnlyForms.
Generate business metadata
Complete the following steps to generate metadata:
Log in to the SageMaker Unified Studio portal, open the project that you used, and choose Assets in the navigation pane.
The business name is already generated for the asset and columns.
To generate descriptions, choose Generate descriptions.
The following screenshot shows the generated names on the Schema tab.
If you approve of the generated names, choose Accept all.
Choose Accept all again to confirm.
Choose Generate descriptions to create suggested table and column descriptions.
Review the generated recommendations and choose Accept all if it looks accurate.
The following screenshot shows the generated descriptions.
Even when assets are registered as custom, you can use this feature to generate business context and seamlessly publish it to SageMaker catalog.
Conclusion
As enterprise data environments become increasingly distributed and sourced from diverse platforms, maintaining metadata quality at scale presents a challenge. This feature uses generative AI to automate the creation of business descriptions, including table summaries, use cases, and column-level metadata, reducing manual effort while preserving alignment with governance requirements.
The feature is available in the next generation of SageMaker through SageMaker Catalog for custom structured assets (with schema) registered programmatically using an API. For implementation details, refer to the product documentation.
About the authors
Ramesh H Singh is a Senior Product Manager Technical (External Services) at AWS in Seattle, Washington, currently with the Amazon SageMaker team. He is passionate about building high-performance ML/AI and analytics products that enable enterprise customers to achieve their critical goals using cutting-edge technology. Connect with him on LinkedIn.
Pradeep Misra is a Principal Analytics Solutions Architect at AWS. He works across Amazon to architect and design modern distributed analytics and AI/ML platform solutions. He is passionate about solving customer challenges using data, analytics, and AI/ML. Outside of work, Pradeep likes exploring new places, trying new cuisines, and playing board games with his family. He also likes doing science experiments, building LEGOs and watching anime with his daughters.
Balaji Kumar Gopalakrishnan is a Principal Engineer at Amazon Finance Technology. He has been with Amazon since 2013, solving real-world challenges through technology that directly impact the lives of Amazon customers. Outside of work, Balaji enjoys hiking, painting, and spending time with his family. He is also a movie buff!
Mohit Dawar is a Senior Software Engineer at AWS working on DataZone and SageMaker Unified Studio. Over the past three years, he has led efforts around the core metadata catalog, generative AI-powered metadata curation, and lineage visualization. He enjoys working on large-scale distributed systems, experimenting with AI to improve user experience, and building tools that make data governance feel effortless. Connect with him on LinkedIn.
Mark Horta is a Software Development Manager at AWS working on DataZone and SageMaker Unified Studio. He is responsible for leading the engineering efforts for SageMaker Catalog focusing on generative-AI metadata generation and curation and data lineage.
While tens of thousands of customers are successfully using Amazon DynamoDBglobal tables with eventual consistency, we’re seeing emerging needs for even stronger resilience. Many organizations find that the DynamoDB multi-Availability Zone architecture and eventually consistent global tables meet their requirements, but critical applications like payment processing systems and financial services demand more.
For these applications, customers require a zero Recovery Point Objective (RPO) during rare Region-wide events, meaning you can direct your app to read the latest data from any Region. Your multi-Region applications always need to access the same data regardless of location.
Starting today, you can use a new Amazon DynamoDB global tables capability that provides multi-Region strong consistency (MRSC), enabling zero RPO. This capability, first announced as a preview at AWS re:Invent 2024, simplifies building highly resilient global applications.
Here’s how you can enable MRSC starting with an existing empty DynamoDB table:
With MRSC, DynamoDB now offers you the highest level of resilience for your applications. If application processing is interrupted in a Region, you can redirect traffic to another Region containing a MRSC replica and know that you’ll be processing the latest data.
Getting started Let me walk you through how you can use this new capability.
To start using MRSC, I need to create a global table from an existing DynamoDB table that doesn’t contain any data. I navigate to my existing table, select the Global tables tab and select Create replica.
The MRSC availability architecture requires three AWS Regions. I can configure MRSC with either three full replicas or with two replicas and a witness. A witness contains only replicated change data to provide the required availability without maintaining a full copy of my table data.
The following screenshot shows how I configure MRSC with two replicas and a witness. To configure MRSC with three full replicas instead, I can clear Configure Region 2 as Witness.
If I need to update my existing table programmatically, I can use the Amazon Q CLI to generate the required command with the following prompt:
> Hey Q! Update my existing DynamoDB table called "demo-mrsc" in us-east-1 with multi-Region strong consistency across us-east-2 with witness in us-west-2 Regions
Shortly after, Q CLI will respond back with following command:
> To update your DynamoDB table with multi-Region strong consistency, you'll need to use the update-table command with the appropriate parameters. Here's how you would do it:
aws dynamodb update-table \
--table-name demo-mrsc \
--replica-updates '[{"Create": {"RegionName": "us-east-2"}}]' \
--global-table-witness-updates '[{"Create": {"RegionName": "us-west-2"}}]' \
--multi-region-consistency STRONG \
--region us-east-1
After it’s finished processing, I can check the status of my MRSC global table. I can see I have a witness configured for my DynamoDB global table. A witness reduces costs while still providing the resilience benefits of multi-Region strong consistency.
Then, in my application, I can use ConsistentRead to read data with strong consistency. Here’s a Python example:
import boto3
# Configure the DynamoDB client for your region
dynamodb = boto3.resource('dynamodb', region_name='us-east-2')
table = dynamodb.Table('demo-mrsc')
pk_id = "demo#test123"
# Read with strong consistency across regions
response = table.get_item(
Key={
'PK': pk_id
},
ConsistentRead=True
)
print(response)
For operations that require the strongest resilience, I can use ConsistentRead=True. For less critical operations where eventual consistency is acceptable, I can omit this parameter to improve performance and reduce costs.
Additional things to know Here are a couple of things to note:
Availability – The Amazon DynamoDB multi-Region strong consistency capability is available in following AWS Regions: US East (Ohio, N. Virginia), US West (Oregon), Asia Pacific (Osaka, Seoul, Tokyo), and Europe (Frankfurt, Ireland, London, Paris)
Pricing – Multi-Region strong consistency pricing follows the existing global tables pricing structure. DynamoDB recently reduced global tables pricing by up to 67 percent, making this highly resilient architecture more affordable than ever. Visit Amazon DynamoDB lowers pricing for on-demand throughput and global tables in the AWS Database Blog to learn more.
Learn more about how you can achieve the highest level of application resilience, enable your applications to be always available and always read the latest data regardless of the Region by visiting Amazon DynamoDB global tables.
The Amazon Redshift integration with AWS Lambda provides the capability to create Amazon Redshift Lambda user-defined functions (UDFs). This capability delivers flexibility, enhanced integrations, and security for functions defined in Lambda that can be run through SQL queries. Amazon Redshift Lambda UDFs offer many advantages:
Enhanced integration – You can connect to external services or APIs from within your UDF logic, enabling richer data enrichment and operational workflows.
Multiple Python runtimes – Lambda UDFs benefit from Lambda function support for multiple Python runtimes depending on specific use cases. In addition, the new versions and security patches are available within a month of their official release.
Independent scaling – Lambda UDFs use Lambda compute resources, so heavy compute or memory-intensive tasks don’t impact query performance or resource concurrency within Amazon Redshift.
Isolation and security – You can isolate custom code execution in a separate service boundary. This simplifies maintenance, monitoring, budgeting, and permission management.
Because Lambda UDFs provide these significant advantages in integration, flexibility, scalability, and security, we will be ending support for Python UDFs in Amazon Redshift. We recommend that you migrate your existing Python UDFs to Lambda UDFs by June 30, 2026.
October 30, 2025 – Creation of new Python UDFs will no longer be supported (existing functions can still be invoked)
June 30, 2026 – Execution of existing Python UDFs will be suspended
In this post, we walk you through how to migrate your existing Python UDFs to Lambda UDFs, set up monitoring and cost evaluations, and review key considerations for a smooth transition.
Solution overview
You can create UDFs for tasks such as tokenization, encryption and decryption, or data science functionality like the Levenshtein distance calculation. For this post, we provide examples for customers who have Python UDFs in place, demonstrating how to replace them with Lambda UDFs.
The Levenshtein function, also known as the Levenshtein distance or edit distance, is a string metric used to measure the difference between two sequences of characters. Although this functionality was previously implemented using Python UDFs using the Python library in Amazon Redshift, Lambda provides a more efficient and scalable solution. This post demonstrates how to migrate from Python UDFs to Lambda UDFs for calculating Levenshtein distances.
Run the following script to list existing Python UDFs:
SELECT
p.proname,
p.pronargs,
t.typname,
n.nspname,
l.lanname,
pg_get_functiondef(p.oid)
FROM
pg_proc p,
pg_language l,
pg_type t,
pg_namespace n
WHERE
p.prolang = l.oid
and p.prorettype = t.oid
and l.lanname = 'plpythonu'
and p.pronamespace = n.oid
and nspname not in ('pg_catalog', 'information_schema')
ORDER BY
proname;
The following is our existing Python UDF definition for Levenshtein distance:
create or replace function fn_levenshtein_distance(a varchar, b varchar) returns integer as
$$
def levenshtein_distance(a, len_a, b, len_b):
d = [[0] * (len_b + 1) for i in range(len_a + 1)]
for i in range(1, len_a + 1):
d[i][0] = i
for j in range(1, len_b + 1):
d[0][j] = j
for j in range(1, len_b + 1):
for i in range(1, len_a + 1):
if a[i - 1] == b[j - 1]:
cost = 0
else:
cost = 1
d[i][j] = min(d[i - 1][j] + 1, # deletion
d[i][j - 1] + 1, # insertion
d[i - 1][j - 1] + cost) # substitution
return d[len_a][len_b]
def distance(a, b):
len_a, len_b = len(a), len(b)
if len_a == len_b:
return 0
elif len_a == 0:
return len_b
elif len_b == 0:
return len_a
else:
return levenshtein_distance(a, len_a, b, len_b)
return distance(a, b)
$$ immutable;
Convert the Python UDF function to a Lambda UDF
You can simplify converting your Python UDF to a Lambda UDF using Amazon Q Developer, a generative AI-powered assistant. It handles code transformation, packaging, and integration logic, accelerating migration and improving scalability. Integrated with popular developer tools like VS Code, JetBrains, and others, Amazon Q streamlines workflows so teams can modernize analytics using serverless architectures with minimal effort.
Amazon Q Developer code suggestions are based on large language models (LLMs) trained on billions of lines of code, including open source and Amazon code. Always review a code suggestion before accepting it, and you might need to edit it to make sure that it does exactly what you intended.
Convert @python-udf.py Redshift Python UDF to Redshift Lambda UDF which batch processes data in the arguments array in a loop and returns json dump at the end. Refer to @lambda-context.py for reference and additional guidance on Lambda UDF.
Create a Lambda function
Complete the following steps to create a Lambda function:
On the Lambda console, choose Functions in the navigation pane.
Choose Create function.
Choose Author from scratch.
For Function name, enter a custom name (for example, levenshtein_distance_func).
For Runtime, choose your code environment. (The examples in this post are compatible with Python 3.12.)
For Architecture, select your system architecture. (The examples in this post are compatible with x86_64.)
For Execution role, select Create a new role with basic Lambda permissions.
Choose Create function.
Choose Code and add the following code:
import json
def lambda_handler(event, context):
t1 = event['arguments']
resp = [None]*len(t1)
for i, x in enumerate(t1):
if x[0] is not None and x[1] is not None:
resp[i] = distance(x[0], x[1])
ret = dict()
ret['results'] = resp
return json.dumps(ret)
def levenshtein_distance(a, len_a, b, len_b):
d = [[0] * (len_b + 1) for i in range(len_a + 1)]
for i in range(1, len_a + 1):
d[i][0] = i
for j in range(1, len_b + 1):
d[0][j] = j
for j in range(1, len_b + 1):
for i in range(1, len_a + 1):
if a[i - 1] == b[j - 1]:
cost = 0
else:
cost = 1
d[i][j] = min(d[i - 1][j] + 1, # deletion
d[i][j - 1] + 1, # insertion
d[i - 1][j - 1] + cost) # substitution
return d[len_a][len_b]
def distance(a, b):
len_a, len_b = len(a), len(b)
if len_a == len_b and a == b:
return 0
elif len_a == 0:
return len_b
elif len_b == 0:
return len_a
else:
return levenshtein_distance(a, len_a, b, len_b)
Choose configuration and update Timeout to 1 minute.
CREATE or REPLACE EXTERNAL FUNCTION
fn_lambda_levenshtein_distance(a varchar, b varchar) returns int
lambda 'levenshtein_distance_func' IAM_ROLE default
STABLE
;
Test the solution
To test the solution, run the following script using the Python UDF:
SELECT c_customer_sk, c_customer_id, fn_levenshtein_distance(c_first_name, c_last_name) as distance
FROM customer
WHERE c_customer_sk in (1,2,3,4,5,31);
The following table shows our output.
Run the same script using the Lambda UDF:
SELECT c_customer_sk, c_customer_id, fn_lambda_levenshtein_distance(c_first_name, c_last_name) as distance
FROM customer
WHERE c_customer_sk in (1,2,3,4,5,31);
The results of both UDFs match.
Replace the Python UDF with the Lambda UDF
You can use the following steps in preproduction for testing:
Revoke access for the Python UDF:
REVOKE execute on function fn_levenshtein_distance(varchar, varchar) from <group_name> or <role_name>
Grant access to the Lambda UDF:
grant execute on function fn_lambda_levenshtein_distance(varchar, varchar) to <group_name> or <role_name>
After full testing of the Lambda UDF has been performed, you can drop the Python UDF.
Rename the Lambda UDF fn_lambda_levenshtein_distance to fn_levenshtein_distance so the end-user and application code doesn’t need to change:
ALTER FUNCTION fn_lambda_levenshtein_distance(varchar, varchar)
RENAME TO fn_levenshtein_distance;
Validate with the following query:
SELECT c_customer_sk, c_customer_id, fn_levenshtein_distance(c_first_name, c_last_name) as distance
FROM customer
WHERE c_customer_sk in (1,2,3,4,5,31);
Cost evaluation
To evaluate the cost of the Lambda UDF, complete the following steps:
Run the following script to create a table using a SELECT query, which uses the Lambda UDF:
DROP TABLE IF EXISTS customer_lambda;
CREATE TABLE customer_lambda as
SELECT c_customer_sk, c_customer_id, fn_levenshtein_distance(c_first_name, c_last_name) as distance
FROM customer;
Use following query to find the cost of the Lambda UDF for the specific duration you selected:
parse @message /Duration:\s*(?<@duration_ms>\d+\.\d+)\s*ms\s*Billed\s*Duration:\s*(?<@billed_duration_ms>\d+)\s*ms\s*Memory\s*Size:\s*(?<@memory_size_mb>\d+)\s*MB/
| filter @message like /REPORT RequestId/
| stats sum(@billed_duration_ms * @memory_size_mb * 1.6279296875e-11 + 2.0e-7) as @cost_dollars_total
For this example, we used the us-east-1 Region using ARM-based instances. For more details on Lambda pricing by Region and the Free Tier limit, see AWS Lambda pricing.
Choose Summarize results.
The cost of this Lambda UDF invocation was $0.02329 for 30 million rows.
Monitor Lambda UDFs
Monitoring Lambda UDFs involves tracking both the Lambda function’s performance and the impact on the Redshift query execution. Because UDFs execute externally, a dual approach is necessary.
CloudWatch metrics and logs for Lambda functions
CloudWatch provides comprehensive monitoring for Lambda functions, such as the following key metrics:
Invocations – Tracks the number of times the Lambda function is called, indicating UDF usage frequency
Duration – Measures execution time, helping identify performance bottlenecks
Errors – Counts failed invocations, which is critical for detecting issues in UDF logic
Throttles – Indicates when Lambda limits invocations due to concurrency caps, which can delay query results
Logs – CloudWatch Logs capture detailed execution output, including errors and custom log messages, aiding in debugging
Alarms – Configures alarms for high error rates (for example, Errors > 0) or excessive duration (for example, Duration > 1 second) to receive proactive notifications
Redshift query performance
Within Amazon Redshift, system views provide comprehensive insights into Lambda UDF performance and errors:
SYS_QUERY_HISTORY – Identifies queries that have called your Lambda UDFs by filtering with the UDF name in the query_text column. This helps track usage patterns and execution frequency.
SYS_QUERY_DETAIL – Provides granular execution metrics for queries involving Lambda UDFs, helping identify performance bottlenecks at the step level.
Performance aggregation – Generates summary reports of Lambda UDF performance metrics, including execution count, average duration, and maximum duration to track performance trends over time.
The following table summarizes the monitoring tools available.
Monitoring Tool
Purpose
Key Metrics/Views
CloudWatch Metrics
Track Lambda function performance
Invocations, Duration, Errors, Throttles
CloudWatch Logs
Debug Lambda execution issues
Error messages, custom logs
SYS_QUERY_HISTORY
Track Lambda UDF usage patterns
Query execution times, status, user information, query text
SYS_QUERY_DETAIL
Analyze Lambda UDF performance
Step-level execution details, resource utilization, query plan information
Performance Summary Reports
Track UDF performance trends
Execution count, average/maximum duration, total elapsed time
Monitoring approach for Lambda UDFs in Amazon Redshift
For analyzing individual queries, you can use the following code to track how your Lambda UDFs are being used across your organization:
SELECT * FROM sys_query_history
WHERE query_text LIKE '%your_lambda_udf_name%'
ORDER BY start_time DESC
LIMIT 20;
This helps you do the following:
Identify frequent users
Monitor execution patterns
Track usage trends
Detect unauthorized access
You can also create comprehensive monitoring by using query history to monitor performance metrics at the user level:
SELECT
usename,
DATE_TRUNC('day', start_time) as day,
COUNT(*) as query_count,
AVG(DATEDIFF(microsecond, start_time, end_time))/1000000.0 as avg_duration_seconds,
MAX(DATEDIFF(microsecond, start_time, end_time))/1000000.0 as max_duration_seconds
FROM sys_query_history q
JOIN pg_user u ON q.user_id = u.usesysid
WHERE query_text LIKE '%your_lambda_udf_name%'
AND user_id > 1
GROUP BY usename, day
ORDER BY usename, query_count DESC;
Additionally, you can generate weekly performance reports using the following aggregation query:
SELECT
'your_lambda_udf_name' AS function_name,
COUNT(DISTINCT q.query_id) AS execution_count,
AVG(DATEDIFF(millisecond, q.start_time, q.end_time)) AS avg_duration_ms,
MAX(DATEDIFF(millisecond, q.start_time, q.end_time)) AS max_duration_ms,
SUM(q.elapsed_time) / 1000000 AS total_elapsed_time_sec
FROM
sys_query_history q
WHERE
q.query_text LIKE '%your_lambda_udf_name%'
GROUP BY
function_name
ORDER BY
execution_count DESC;
Considerations
To maximize the benefits of Lambda UDFs, consider the following aspects to optimize performance, provide reliability, secure data, and manage costs. If you have Python UDFs that don’t use Python libraries, consider whether they are candidates to convert to SQL UDFs.
The following are key performance considerations:
Batching – Amazon Redshift batches multiple rows into a single Lambda invocation to reduce call frequency, improving efficiency. Make sure the Lambda function handles batched inputs efficiently. For more details, see Accessing external components using Amazon Redshift Lambda UDFs.
Parallel invocations – Redshift cluster slices invoke Lambda functions in parallel, enhancing performance for large datasets. Design functions to support concurrent executions.
Cold starts – Lambda functions might experience cold start delays, particularly if infrequently used. Languages like Python or Node.js typically have faster startup times than Java, reducing latency.
Function optimization – Optimize Lambda code for quick execution, minimizing resource usage and latency. For example, avoid unnecessary computations or external API calls.
Consider the following error handling methods:
Robust lambda logic – Implement comprehensive error handling in the Lambda function to manage exceptions gracefully. Return clear error messages in the JSON response, as specified in the Amazon Redshift-Lambda interface. For more details, see Scalar Lambda UDFs.
Error propagation – Lambda errors can cause Redshift query failures. Monitor SYS_QUERY_HISTORY for query-level issues and CloudWatch Logs for detailed Lambda errors.
JSON interface – The Lambda function must return a JSON object with success, error_msg, num_records, and results fields. Use proper formatting to avoid query disruptions.
Clean up
Complete the following steps to clean up your resources:
Delete the Redshift provisioned or serverless endpoint.
Delete the Lambda function.
Delete the IAM roles you created.
Conclusion
Lambda UDFs unlock a new level of flexibility, performance, and maintainability for extending Amazon Redshift. By decoupling custom logic from the warehouse engine, teams can scale independently, adopt modern runtimes, and integrate external systems.
If you’re currently using Python UDFs in Amazon Redshift, it’s time to explore the benefits of migrating to Lambda UDFs. With the generative AI capabilities of Amazon Q Developer, you can automate much of this transformation and accelerate your modernization journey. To learn more, refer to the Lambda UDF examples GitHub repo and Data Tokenization with Amazon Redshift and Protegrity.
About the authors
Raks Khare is a Senior Analytics Specialist Solutions Architect at AWS based out of Pennsylvania. He helps customers across varying industries and regions architect data analytics solutions at scale on the AWS platform. Outside of work, he likes exploring new travel and food destinations and spending quality time with his family.
Ritesh Kumar Sinha is an Analytics Specialist Solutions Architect based out of San Francisco. He has helped customers build scalable data warehousing and big data solutions for over 16 years. He loves to design and build efficient end-to-end solutions on AWS. In his spare time, he loves reading, walking, and doing yoga.
Yanzhu Ji is a Product Manager in the Amazon Redshift team. She has experience in product vision and strategy in industry-leading data products and platforms. She has outstanding skill in building substantial software products using web development, system design, database, and distributed programming techniques. In her personal life, Yanzhu likes painting, photography, and playing tennis.
Harshida Patel is a Analytics Specialist Principal Solutions Architect, with AWS.
Today, we’re announcing the general availability of Amazon Elastic Compute Cloud (Amazon EC2) C8gn network optimized instances powered by AWS Graviton4 processors and the latest 6th generation AWS Nitro Card. EC2 C8gn instances deliver up to 600Gbps network bandwidth, the highest bandwidth among EC2 network optimized instances.
You can use C8gn instances to run the most demanding network intensive workloads, such as security and network virtual appliances (virtual firewalls, routers, load balancers, proxy servers, DDoS appliances), data analytics, and tightly-coupled cluster computing jobs.
EC2 C8gn instances specifications C8gn instances provide up to 192 vCPUs and 384 GiB memory, and offer up to 30 percent higher compute performance compared Graviton3-based EC2 C7gn instances.
If you’re using C7gn instances now, you will have straightforward experience migrating network intensive workloads to C8gn instances because the new instances offer similar vCPU and memory ratios. To learn more, check out the collection of Graviton resources to help you start migrating your applications to Graviton instance types.
Now available Amazon EC2 C8gn instances are available today in US East (N. Virginia) and US West (Oregon) Regions. Two metal instance sizes are only available in US East (N. Virginia) Region. These instances can be purchased as On-Demand, Savings Plan, Spot instances, or as Dedicated instances and Dedicated hosts.
Every time I visit Seattle, the first thing that greets me at the airport is Mount Rainier. Did you know that the most innovative project at Amazon Web Services (AWS) is named after this mountain?
Project Rainier is a new project to create what is expected to be the world’s most powerful computer for training AI models across multiple data centers in the United Stages. Anthropic will develop the advanced versions of its Claude models with five times more computing power than its current largest training cluster.
The key technology powering Project Rainier is AWS custom-designed Trainium2 chips, which are specialized for the immense data processing required to train complex AI models. Thousands of these Trainium2 chips will be connected in a new type of Amazon EC2 UltraServer and EC2 UltraCluster architecture that allows ultra-fast communication and data sharing across the massive system.
Learn about the AWS vertical integration of Project Rainer, where it designs every component of the technology stack from chips to software, allows it to optimize the entire system for maximum efficiency and reliability.
Last week’s launches Here are some launches that got my attention:
Amazon S3 access for Amazon FSx for OpenZFS – You can access and analyze your FSx for OpenZFS file data through Amazon S3 Access Points, enabling seamless integration with AWS AI/ML, and analytics services without moving your data out of the file system. You can treat your FSx for OpenZFS data as if it were stored in S3, making it accessible through the S3 API for various applications including Amazon Bedrock, Amazon SageMaker, AWS Glue, and other S3 based cloud-native applications.
Amazon S3 with sort and z-order compaction for Apache Iceberg tables – You can optimize query performance and reduce costs with new sort and z-order compaction. With S3 Tables, sort compaction automatically organizes data files based on defined column orders, while z-order compaction can be enabled through the maintenance API for efficient multicolumn queries.
Amazon CloudWatch investigations – You can accelerate your operational troubleshooting in AWS environments using the Amazon CloudWatch AI-powered investigation feature, which helps identify anomalies, surface related signals, and suggest remediation steps. This capability can be initiated through CloudWatch data widgets, multiple AWS consoles, CloudWatch alarm actions, or Amazon Q chat and enables team collaboration and integration with Slack and Microsoft Teams.
Amazon Bedrock Guardrails Standard tier – You can enhance your AI content safety measures using the new Standard tier. It offers improved content filtering and topic denial capabilities across up to 60 languages, better detection of variations including typos, and stronger protection against prompt attacks. This feature lets you configure safeguards to block harmful content, prevent model hallucinations, redact personally identifiable information (PII), and verify factual claims through automated reasoning checks.
Amazon Route 53 Resolver endpoints for private hosted zone – You can simplify DNS management across AWS and on-premises infrastructure using the new Route 53 DNS delegation feature for private hosted zone subdomains, which works with both inbound and outbound Resolver endpoints. You can delegate subdomain authority between your on-premises infrastructure and Route 53 Resolver cloud service using name server records, eliminating the need for complex conditional forwarding rules.
Amazon Q Developer CLI for Java transformation – You can automate and scale Java application upgrades using the new Amazon Q Developer Java transformation command line interface (CLI). This feature perform upgrades from Java versions 8, 11, 17, or 21 to versions 17 or 21 directly from the command line. This tool offers selective transformation options so you can choose specific steps from transformation plans and customize library upgrades.
New AWS IoT Device Management managed integrations – You can simplify Internet of Things (IoT) device management across multiple manufacturers and protocols using the new managed integrations feature, which provides a unified interface for controlling devices whether they connect directly, through hubs or third-party clouds. The feature includes pre-built cloud-to-cloud (C2C) connectors, device data model templates, and SDKs that support ZigBee, Z-Wave, and Wi-Fi protocols, while you can still create custom connectors and data models.
For a full list of AWS announcements, be sure to keep an eye on the What’s New with AWS? page.
Create your own MCP server with C# and .NET with Amazob Q CLI – You’ll use Amazon Q CLI as an MCP client to configure your local development environment for building and testing C# MCP servers, enhancing your ability to create, iterate, and refine AI-powered applications.
Upcoming AWS events Check your calendars and sign up for these upcoming AWS events:
AWS re:Invent – Register now to get a head start on choosing your best learning path, booking travel and accommodations, and bringing your team to learn, connect, and have fun. If you’re an early-career professional, you can apply to the All Builders Welcome Grant program, which is designed to remove financial barriers and create diverse pathways into cloud technology.
AWS NY Summits – You can gain insights from Swami’s keynote featuring the latest cutting-edge AWS technologies in compute, storage, and generative AI. My News Blog team is also preparing some exciting news for you. If you’re unable to attend in person, you can still participate by registering for the global live stream. Also, save the date for these upcoming Summits in July and August near your city.
AWS Builders Online Series – If you’re based in one of the Asia Pacific time zones, join and learn fundamental AWS concepts, architectural best practices, and hands-on demonstrations to help you build, migrate, and deploy your workloads on AWS.
We’re excited to announce AWS Glue Data Catalog usage metrics. The usage metrics is a new feature that provides native integration with Amazon CloudWatch. This feature provides you with immediate visibility into your AWS Glue Data Catalog API usage patterns and trends.
AWS Glue Data Catalog is a centralized repository that stores metadata about your organization’s datasets. With its unified interface that acts as an index, you can store and query information about your data sources, including their location, formats, schemas, and runtime metrics.
As you scale your lakehouse architecture on Amazon Web Services (AWS) and maintain reliable data operations, observability and monitoring becomes critical to understanding and optimizing Data Catalog API usages.
With Data Catalog usage metrics in CloudWatch, you can achieve the following:
Monitor API call patterns at 1-minute intervals
Proactively request service quota increase for API rate limits
Choose Usage > By AWS Resource, as shown in the following screenshot
The Metrics section opens and displays different catalog usage metrics that you can select from to create dashboards and alarms, as shown in the following screenshot
Monitor CallCount metrics
Each Amazon CloudWatch metric for Data Catalog is of a type API and set as CallCount. This means that for each API call on that specific resource (for example, GetConnection API) will be logged as one count. These metrics can seamlessly integrate into your existing CloudWatch dashboards, or you can use them to create new ones. For proactive monitoring, you can configure custom alarms that trigger automatically when this API usage exceeds your defined thresholds, helping you comply with service limits.
Under the Graphed metrics tab, you can provide additional customizations to match your monitoring needs. In the Details column, you can create alarms and enable anomaly detection to identify unusual patterns.
To help with effective API monitoring, CallCount metrics specifically focus on successful API calls. This way, you have more precise monitoring and can troubleshoot different types of API behaviors. The following screenshot shows the AWS Glue usage metrics view for GetTables API.
In the Statistics column, you can view your API usage beyond the default Sum, Min, and Max metrics. You can now select a wide variety of statistical methods to analyze your usage patterns, as shown in the following screenshot.
Metrics and dimensions for Data Catalog usage metrics
Data Catalog usage metrics use the AWS/Usage namespace and provide CallCount metrics. These metrics are published with the dimensions Service, Resource, Type and Class.
The CallCount metric doesn’t have a specified unit. The most useful statistic for the metric is SUM, which represents the total operation count for the 1-minute period. An important note is that the metric value is emitted at 1-minute intervals. Reducing the period further (for example, to 1 second) won’t change the emittance interval.
Metrics
Metric
Description
CallCount
The number of specified operations performed in your account.
Dimensions
Dimension key
Dimension value
Description
Service
AWS Glue
The name of the AWS service containing the resource. For Data Catalog usage metrics, the value for this dimension is AWS Glue.
Type
API
The type of resource being tracked. Currently, when the Service dimension is AWS Glue, the only valid value for Type is API.
Resource
<API name>
The name of the API operation. Valid values include the following:
The class of resource being tracked. Data Catalog usage metrics use this dimension with a value of None.
Set up CloudWatch alarms for Data Catalog usage metrics
Data Catalog has defined rules to manage atypical usage patterns that limit the customer call rate at the granularity of requests per second. You can generate CloudWatch alarms using the CallCount metric so that limit increases can be done proactively. To configure a CloudWatch alarm with this threshold, complete the following steps:
On the CloudWatch metrics console, select one of the available metrics, as shown in the following screenshot. In this example, we select the resource GetTables. You can select multiple metrics to fit your use case.
Choose Graphed metrics.
Choose Sum as the primary statistic.
Set period to 1 minute.
Choose Details and Create Alarm.
For Threshold type, choose Anomaly Detection. You can also select Static based on your requirements and after you’ve determined a specific threshold value.
Set the Anomaly detection threshold to 2 (default). The threshold value is used to determine the normal range of values for the metric. A higher value produces a thicker band of normal values. For more information on how CloudWatch anomaly detection works, refer to How CloudWatch anomaly detection works.
Choose Next.
For Send a notification to the following SNS topic, choose Create new topic.
For Email endpoints that will receive the notification, enter your email address. In this example, we’re going to create a new SNS topic. However, you can use your existing SNS topics or use other options such as AWS Lambda or auto scaling action.
Choose Create topic.
Scroll down and choose Next.
Enter an alarm name and a description and choose Next.
Review all the details you’ve entered and choose Create alarm, as shown in the following screenshot.
By following these steps, you’ve successfully configured a CloudWatch alarm using anomaly detection that monitors your Data Catalog usage with the threshold that you set. The alarm will trigger when the CallCount metric exceeds the calculated threshold, sending notifications to your specified SNS topic and email endpoints.
This proactive monitoring approach prevents API rate limit issues and provides a smooth operation of your Data Catalog usage. For more information on using CloudWatch alarms, refer to Using Amazon CloudWatch alarms.
Conclusion
AWS Glue Data Catalog usage metrics is an effective enhancement to your data infrastructure monitoring capabilities. It addresses the growing need for detailed observability through Amazon CloudWatch in modern data architectures built on top of Data Catalog. You now have access to more granular statistics, moving beyond simple maximum and average request metrics to comprehensive performance indicators including p99 percentiles. These metrics are emitted in 1-minute intervals, providing visibility into your data catalog operations. Organizations can now proactively identify bottlenecks before they affect operations and efficiently conduct capacity planning through detailed usage patterns.
From building monitoring dashboards to setting up alerts, the native support with CloudWatch anomaly detection and flexible alarm configurations makes it straightforward to proactively monitor your lakehouse deployment and prevent abnormalities in your lakehouse usage. For more information, refer to Monitoring Data Catalog usage metrics in Amazon CloudWatch in the AWS Glue documentation. We recommend testing and using these metrics as part of your modern monitoring and observability strategy. We encourage you to share your feedback with us.
About the authors
David Zhang is an Analytics Solutions Architect specializing in designing and implementing large-scale data infrastructure, ETL processes, and extensive data management systems. He helps customers modernize data platforms on Amazon Web Services (AWS). David is also an active speaker at AWS events and contributor to technical content and open source initiatives. He enjoys playing volleyball, tennis, and basketball during his free time.
Noritaka Sekiyama is a Principal Big Data Architect with Amazon Web Services (AWS) Analytics services. He’s responsible for building software artifacts to help customers. In his spare time, he enjoys cycling on his road bike.
Sandeep Adwankar is a Senior Product Manager at AWS. Based in the California Bay Area, he works with customers around the globe to translate business and technical requirements into products that enable customers to improve how they manage, secure, and access data.
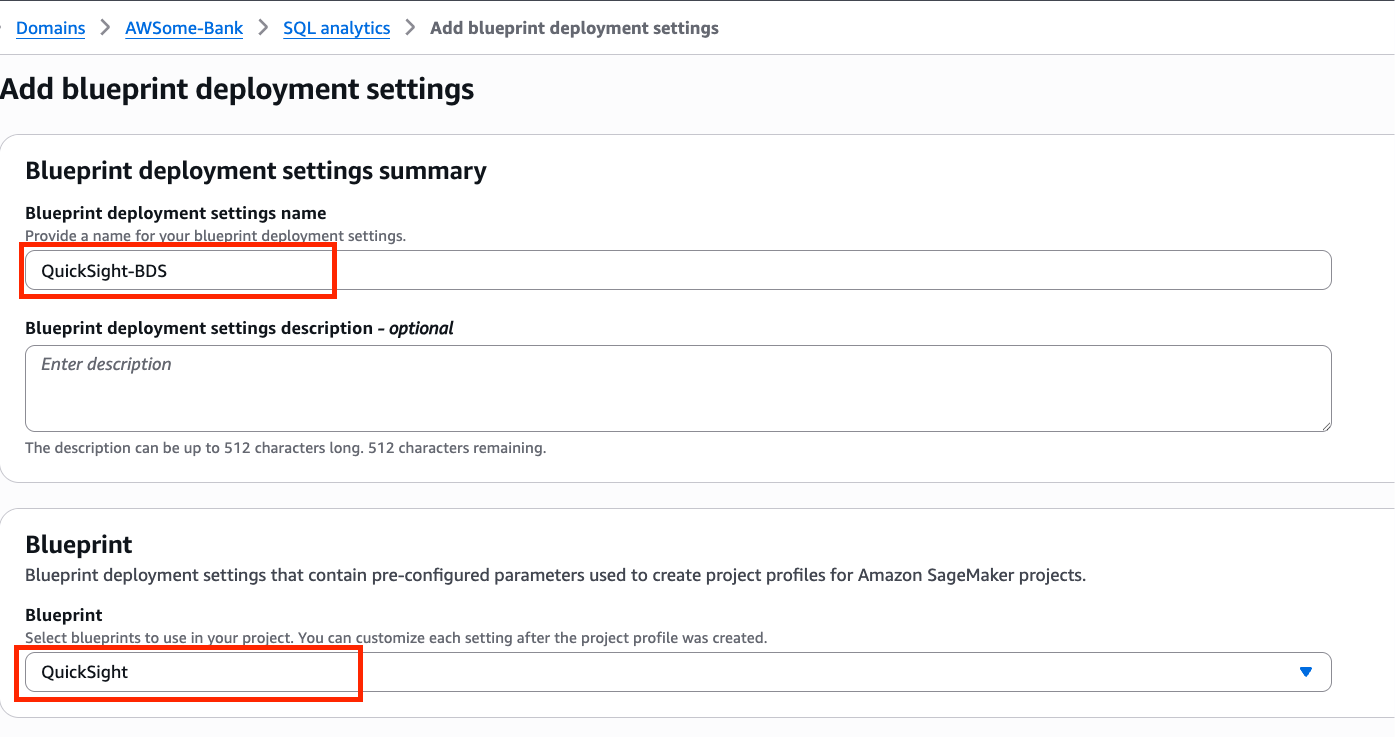
Abhay Joshi is a Software Development Engineer at AWS Glue and AWS Lake Formation. He is passionate about building fault tolerant and reliable distributed systems at scale.
Organizations store hundreds of exabytes of file data on premises and want to move this data to AWS for greater agility, reliability, security, scalability, and reduced costs. Once their file data is in AWS, organizations often want to do even more with it. For example, they want to use their enterprise data to augment generative AI applications and build and train machine learning models with the broad spectrum of AWS generative AI and machine learning services. They also want the flexibility to use their file data with new AWS applications. However, many AWS data analytics services and applications are built to work with data stored in Amazon S3 as data lakes. After migration, they can use tools that work with Amazon S3 as their data source. Previously, this required data pipelines to copy data between Amazon FSx for OpenZFS file systems and Amazon S3 buckets.
Amazon S3 Access Points attached to FSx for OpenZFS file systems remove data movement and copying requirements by maintaining unified access through both file protocols and Amazon S3 API operations. You can read and write file data using S3 object operations including GetObject, PutObject, and ListObjectsV2. You can attach hundreds of access points to a file system, with each S3 access point configured with application-specific permissions. These access points support the same granular permissions controls as S3 access points that attach to S3 buckets, including AWS Identity and Access Management (IAM)access point policies, Block Public Access, and network origin controls such as restricting access to your Virtual Private Cloud (VPC). Because your data continues to reside in your FSx for OpenZFS file system, you continue to access your data using Network File System (NFS) and benefit from existing data management capabilities.
To start, you can follow the steps in the Amazon FSx for OpenZFS file system documentation page to create the file system, then, using the Amazon FSx console, go to Actions and select Create S3 access point. Leave the standard configuration and then create.
To monitor the creation progress, you can go to the Amazon FSx console.
Once available, choose the name of the new S3 access point and review the access point summary. This summary includes an automatically generated alias that works anywhere you would normally use S3 bucket names.
Using the bucket-style alias, you can access the FSx data directly through S3 API operations.
To create the Amazon Bedrock Knowledge Base, I followed the connection steps in Connect to Amazon S3 for your knowledge base user guide. I chose Amazon S3 as the data source, entered my S3 access point alias as the S3 source, then configured and created the knowledge base.
Once the knowledge base is synchronized, I can see all documents and the Document source as S3.
Finally, I ran queries against the knowledge base and verified that it successfully used the file data from my Amazon FSx for OpenZFS file system to provide contextual answers, demonstrating seamless integration without data movement.
Things to know Integration and access control – Amazon S3 Access Points for Amazon FSx for OpenZFS file systems support standard S3 API operations (such as GetObject, ListObjectsV2, PutObject) through the S3 endpoint, with granular access controls through AWS Identity and Access Management (IAM) permissions and file system user authentication. Your S3 Access Point includes an automatically generated access point alias for data access using S3 bucket names, and public access is blocked by default for Amazon FSx resources.
Data management – Your data stays in your Amazon FSx for OpenZFS file system while becoming accessible as if it were in Amazon S3, eliminating the need for data movement or copies, with file data remaining accessible through NFS file protocols.
Performance – Amazon S3 Access Points for Amazon FSx for OpenZFS file systems deliver first-byte latency in the tens of milliseconds range, consistent with S3 bucket access. Performance scales with your Amazon FSx file system’s provisioned throughput, with maximum throughput determined by your underlying FSx file system configuration.
Pricing – You’re billed by Amazon S3 for the requests and data transfer costs through your S3 Access Point, in addition to your standard Amazon FSx charges. Learn more on the Amazon FSx for OpenZFS pricing page.
You can get started today using the Amazon FSx console, AWS CLI, or AWS SDK to attach Amazon S3 Access Points to your Amazon FSx for OpenZFS file systems. The feature is available in the following AWS Regions: US East (N. Virginia, Ohio), US West (Oregon), Europe (Frankfurt, Ireland, Stockholm), and Asia Pacific (Hong Kong, Singapore, Sydney, Tokyo).
You typically use Iceberg to manage large-scale analytical datasets in Amazon Simple Storage Service (Amazon S3) with AWS Glue Data Catalog or with S3 Tables. Iceberg tables support use cases such as concurrent streaming and batch ingestion, schema evolution, and time travel. When working with high-ingest or frequently updated datasets, data lakes can accumulate many small files that impact the cost and performance of your queries. You’ve shared that optimizing Iceberg data layout is operationally complex and often requires developing and maintaining custom pipelines. Although the default binpack strategy with managed compaction provides notable performance improvements, introducing sort and z-order compaction options for both S3 and S3 Tables delivers even greater gains for queries filtering across one or more dimensions.
Two new compaction strategies: Sort and z-order To help organize your data more efficiently, Amazon S3 now supports two new compaction strategies: sort and z-order, in addition to the default binpack compaction. These advanced strategies are available for both fully managed S3 Tables and Iceberg tables in general purpose S3 buckets through AWS Glue Data Catalog optimizations.
Sort compaction organizes files based on a user-defined column order. When your tables have a defined sort order, S3 Tables compaction will now use it to cluster similar values together during the compaction process. This improves the efficiency of query execution by reducing the number of files scanned. For example, if your table is organized by sort compaction along state and zip_code, queries that filter on those columns will scan fewer files, improving latency and reducing query engine cost.
Z-order compaction goes a step further by enabling efficient file pruning across multiple dimensions. It interleaves the binary representation of values from multiple columns into a single scalar that can be sorted, making this strategy particularly useful for spatial or multidimensional queries. For example, if your workloads include queries that simultaneously filter by pickup_location, dropoff_location, and fare_amount, z-order compaction can reduce the total number of files scanned compared to traditional sort-based layouts.
S3 Tables use your Iceberg table metadata to determine the current sort order. If a table has a defined sort order, no additional configuration is needed to activate sort compaction—it’s automatically applied during ongoing maintenance. To use z-order, you need to update the table maintenance configuration using the S3 Tables API and set the strategy to z-order. For Iceberg tables in general purpose S3 buckets, you can configure AWS Glue Data Catalog to use sort or z-order compaction during optimization by updating the compaction settings.
Only new data written after enabling sort or z-order will be affected. Existing compacted files will remain unchanged unless you explicitly rewrite them by increasing the target file size in table maintenance settings or rewriting data using standard Iceberg tools. This behavior is designed to give you control over when and how much data is reorganized, balancing cost and performance.
Let’s see it in action I’ll walk you through a simplified example using Apache Spark and the AWS Command Line Interface (AWS CLI). I have a Spark cluster installed and an S3 table bucket. I have a table named testtable in a testnamespace. I temporarily disabled compaction, the time for me to add data into the table.
After adding data, I check the file structure of the table.
spark.sql("""
SELECT
substring_index(file_path, '/', -1) as file_name,
record_count,
file_size_in_bytes,
CAST(UNHEX(hex(lower_bounds[2])) AS STRING) as lower_bound_name,
CAST(UNHEX(hex(upper_bounds[2])) AS STRING) as upper_bound_name
FROM ice_catalog.testnamespace.testtable.files
ORDER BY file_name
""").show(20, false)
Then, I wait for the next compaction job to trigger. These run throughout the day, when there are enough small files. I can check the compaction status with the following command.
When the compaction is done, I inspect the files that make up my table one more time. I see that the data was compacted to two files, and the upper and lower bounds show that the data was sorted across these two files.
spark.sql("""
SELECT
substring_index(file_path, '/', -1) as file_name,
record_count,
file_size_in_bytes,
CAST(UNHEX(hex(lower_bounds[2])) AS STRING) as lower_bound_name,
CAST(UNHEX(hex(upper_bounds[2])) AS STRING) as upper_bound_name
FROM ice_catalog.testnamespace.testtable.files
ORDER BY file_name
""").show(20, false)
There are fewer files, they have larger sizes, and there is a better clustering across the specified sort column.
To use z-order, I follow the same steps, but I set strategy=z-order in the maintenance configuration.
Regional availability Sort and z-order compaction are now available in all AWS Regions where Amazon S3 Tables are supported and for general purpose S3 buckets where optimization with AWS Glue Data Catalog is available. There is no additional charge for S3 Tables beyond existing usage and maintenance fees. For Data Catalog optimizations, compute charges apply during compaction.
With these changes, queries that filter on the sort or z-order columns benefit from faster scan times and reduced engine costs. In my experience, depending on my data layout and query patterns, I observed performance improvements of threefold or more when switching from binpack to sort or z-order. Tell us how much your gains are on your actual data.
We continue to expand the scope of our assurance programs at Amazon Web Services (AWS) and are pleased to announce that 122 services are now certified as adherent to the Cloud Infrastructure Services Providers in Europe (CISPE) Data Protection Code of Conduct. This alignment with the CISPE requirements demonstrates our ongoing commitment to adhere to the heightened expectations for data protection by cloud service providers. AWS customers who use AWS certified services can be confident that their data is processed in adherence with the European Union’s General Data Protection Regulation (GDPR).
The CISPE Code of Conduct is the first pan-European, sector-specific code for cloud infrastructure service providers and received a favorable opinion that it complies with the GDPR. It helps organizations across Europe accelerate the development of GDPR-aligned, cloud-based services for consumers, businesses, and institutions.
The accredited monitoring body EY CertifyPoint evaluated AWS as of May 19, 2025, and successfully audited 112 certified services. AWS added ten additional services to the current scope in May 2025. As of the date of this post, 122 services are in scope of this certification. The Certificate of Compliance that illustrates AWS compliance status is available on the CISPE Public Register. For up-to-date information, including when additional services are added, search the CISPE Public Register by entering AWS as the Seller of Record; or see the AWS CISPE Data Protection Code of Conduct page.
AWS strives to bring additional services into the scope of its compliance programs to help you meet your architectural and regulatory needs. If you have questions or feedback about AWS compliance with CISPE Code, reach out to your AWS account team.
AWS Lambda now provides native support for Apache Avro and Protocol Buffers (Protobuf) formatted events with Apache Kafka event source mapping (ESM) when using Provisioned Mode. The support allows you to validate your schema with popular schema registries. This allows you to use and filter the more efficient binary event formats and share data using schema in a centralized and consistent way. This blog post shows how you can use Lambda to process Avro and Protobuf formatted events from Kafka topics using schema registry integration.
This new capability works with both Amazon Managed Streaming for Apache Kafka (Amazon MSK), Confluent Cloud and self-managed Kafka clusters. To get started, update your existing Kafka ESM to Provisioned Mode and add schema registry configuration, or create a new ESM in Provisioned Mode with schema registry integration enabled.
Avro and Protobuf
Many organizations use Avro and Protobuf formats with Apache Kafka because these binary serialization formats offer advantages over JSON. They provide 50-80% smaller message sizes, faster serialization and deserialization performance, robust schema evolution capabilities, and strong typing across multiple programming languages.Working with these formats in Lambda functions previously necessitated custom code. Developers needed to implement schema registry clients, handle authentication and caching, write format-specific deserialization logic, and manage schema evolution scenarios.
What’s new
Lambda’s Kafka Event Source Mapping (ESM) now provides built-in integration with AWS Glue Schema Registry, Confluent Cloud Schema Registry, and self-managed Confluent Schema Registry. When you configure schema registry settings for your Kafka ESM, the service automatically validates incoming JSON Schema, Avro, and Protobuf records against their registered schema. This moves complex schema registry integration logic from your application layer to the managed Lambda service.
You can build your function with Kafka’s open-source ConsumerRecords interface using Powertools for AWS Lambda to get your Avro or Protobuf generated business objects directly. Optionally you can specify to get your records in the JSON format, where your function receives clean, validated JSON data regardless of the original serialization format, removing the need for custom deserialization code in your Lambda functions. This also allows you to create Kafka consumers across multiple programming languages.
Powertools for AWS Lambda is a developer toolkit that provides specific support for Java, .NET, Python, and TypeScript, maintaining consistency with existing Kafka development patterns. You can directly access business objects without custom deserialization code.
You can also setup filtering rules to discard irrelevant, JSON, Avro or Protobuf formatted events before function invocations, which can improve processing performance and reduce costs.
How schema validation works
When you configure schema registry integration for your Kafka ESM, you specify the registry endpoint, authentication details, and which event fields (key, value, or both) to validate. The ESM polls your Kafka topics for records as usual but now performs additional processing before invoking your Lambda function.For each incoming event, the ESM extracts the schema ID embedded in the serialized data. It fetches the corresponding schema from your configured registry. This process happens transparently, with schema definitions cached for up to 24 hours to optimize performance. The ESM identifies the format of your events using schema metadata and validates the event structure. It keeps either the original binary data or deserializes it to JSON format based on your customer configuration and sends it to your function for processing.
Figure 1: Kafka processing flow diagram.
The ESM handles schema evolution automatically. When producers begin using new schema versions, the service detects the updated schema IDs and fetches the latest definitions from your registry. This makes sure that your functions always receive properly deserialized data without requiring code changes.
Event record format
As a part of the ESM schema registry configuration, you need to specify Event Record Format, which Lambda uses to deliver validated records to your function. The schema registry configuration supports SOURCE and JSON.
SOURCE preserves the original binary format of the data as a base64-encoded string with producer-appended schema-id removed. This allows direct conversion to Avro or Protobuf objects so that you can use Kafka’s ConsumerRecords interface for a Kafka-like experience. Use this format when working with strongly typed languages or when you need to maintain the full capabilities of Avro or Protobuf schemas. Then, you can use any Avro or Protobuf deserializer to convert raw bytes to your business object. Powertools provides native support for this deserialization.
With JSON, the ESM deserializes the data ready for direct use in languages with native JSON support. Use this when you don’t need to preserve the original binary format or work with generated classes. You can also use Powertools to convert the base64 to your business object. See the documentation for payload formats and deserialization behavior.
If you configure filtering rules, then they operate on the JSON-formatted events after deserialization. This upstream filtering prevents unnecessary Lambda invocations for events that don’t match your processing criteria, directly reducing your compute costs.
Configuration and setup
To use this feature, you must enable Provisioned Mode for your Kafka ESM, which provides the dedicated compute resources needed for schema registry integration.
Your schema registry configuration includes the registry endpoint URL, authentication method (AWS Identity and Access Management (IAM) for AWS Glue Schema Registry, or Basic Auth, SASL/SCRAM, or mTLS for Confluent registries), and validation settings. You specify which event attributes to validate and optionally define filtering rules using standard Lambda event filtering syntax.
There are a number of Serverless Patterns that you can use to process Kafka streams using Lambda. This example uses the Java pattern.
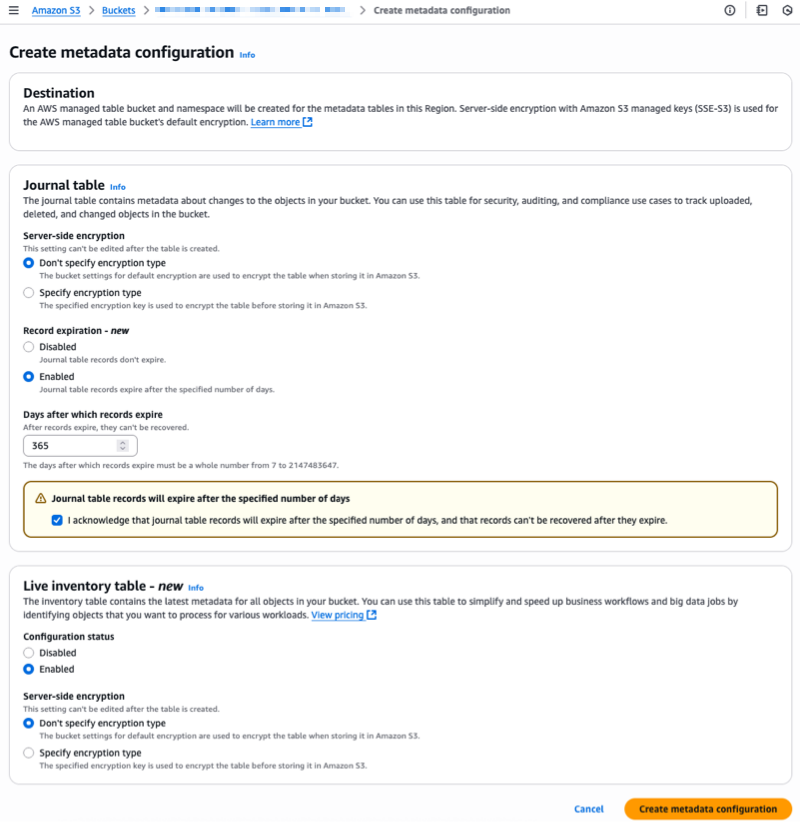
Deploy a sample Amazon MSK cluster
To set up an Amazon MSK cluster, follow the instructions in the GitHub repo and create a new AWS CloudFormation stack using the MSKAndKafkaClientEC2.yaml template file. The stack creates the Amazon MSK cluster, along with a client Amazon EC2 instance, to manage the Kafka cluster. There are costs involved when running this infrastructure.
Connect to the EC2 instance using EC2 Instance Connect.
Check that the Kafka topic is created by checking the contents of the kafka_topic_creator_output.txt file.
cat kafka_topic_creator_output.txt
The file should contain the text: “Created topic MskIamJavaLambdaTopic.”
Deploy the Glue schema registry and consumer Lambda function
The EC2 instance contains the software needed to deploy the schema registry and Lambda function.
Change directory to the pattern directory. cd serverless-patterns/msk-lambda-iam-java-sam
Build the application using AWS SAM. sam build
To deploy your application for the first time, run the following in the EC2 instance shell:
The consumer Lambda function ESM is configured for Provisioned Mode.
View the ESM configuration from the Lambda console for the Lambda function name prefixed with msk-lambda-schema-avro-ja-LambdaMSKConsumer.
Choose the MSK Lambda trigger which opens the Triggers pane under Configuration. Figure 2: View Lambda ESM schema configuration
The configuration specifies using the Event record formatSOURCE so your function can use Kafka’s native open-source ConsumerRecords interface. Powertools then deserializes the payload.
The schema validation attribute is VALUE.
The ESM filter configuration only processes the records that match zip codes of 2000.
In your function code, specify the open-source Kafka ConsumersRecords interface by including Powertools for Lambda as a dependency. ConsumerRecords provides metadata about Kafka records and allows you to get direct access to your Avro/Protobuf generated business objects without requiring any additional deserialization code.
To send messages to Kafka, there is a LambdaMSKProducerJava function.
Invoke the function from the Lambda console or CLI within the EC2 instance.
sam remote invoke LambdaMSKProducerJavaFunction --region $AWS_REGION \
--stack-name msk-lambda-schema-avro-java-sam
You can view the Producer logs to see the 10 records produced.The consumer Lambda function processes the records.
View the consumer Lambda function logs using the Amazon CloudWatch logs console or CLI within the EC2 instance.
sam logs --name LambdaMSKConsumerJavaFunction \
--stack-name msk-lambda-schema-avro-java-sam --region $AWS_REGION
The Lambda function processes and logs only the records that match the filter FILTER. The Avro binary data is deserialized using Powertools for AWS Lambda. You should see the function logs showing each record processed with the decoded keys and values.
You can clean up the example Lambda function by running the sam delete command.
sam delete
If you created the Amazon MSK cluster and EC2 client instance, then navigate to the CloudFormation console, choose the stack, and choose Delete.
Performance and cost considerations
Schema validation and deserialization can add processing time before your function invocation. However, this overhead is typically minimal when compared to the benefits. ESM caching minimizes schema registry API calls. Using filtering allows you to reduce costs, depending on how effectively your filtering rules eliminate irrelevant events. This feature simplifies the operational overhead of managing schema registry integration code so teams can focus on business logic rather than infrastructure concerns.
Error handling and monitoring
If schema registries become temporarily unavailable, then cached schemas allow event processing to continue until the registry is available again. Authentication failures generate error messages with automatic retry logic. Schema evolution happens seamlessly as Lambda automatically detects and fetches new versions.
If events fail validation or deserialization, they are routed to your configured failure destinations. For Amazon SQS and Amazon SNS destinations, the service sends metadata about the failure. For Amazon S3 destinations, both metadata and the original serialized payload are included for detailed analysis.
You can use standard Lambda monitoring, with more CloudWatch metrics providing visibility into schema validation success rates, registry API usage, and filtering effectiveness.
Conclusion
AWS Lambda now supports Avro and Protobuf formats for Kafka event processing in Provisioned Mode for Kafka ESM. This enables schema validation, event filtering, and integration with both Amazon MSK, Confluent, and self-managed Kafka clusters. Whether you’re building new Kafka applications or migrating existing consumers to Lambda, this native schema registry integration streamlines processing pipelines.
Let’s look at last week’s other new announcements.
Last week’s launches Apart from re:Inforce, here are the launches that got my attention.
AWS Lambda announces native support for Avro and Protobuf formatted Kafka events — AWS Lambda now provides native support for Avro and Protobuf formatted Kafka events with Apache Kafka’s event-source-mapping (ESM). This integration allows you to validate your schema, filter events, and process them using open source Kafka consumer interfaces. You can also use Powertools for AWS Lambda to process your Kafka events without writing custom deserialization code, making it easier to build your Kafka applications with AWS Lambda.
Kafka customers use Avro and Protobuf formats for efficient data storage, fast serialization and deserialization, schema evolution support, and interoperability between different programming languages. They utilize schema registries to manage, evolve, and validate schemas before data enters processing pipelines. Previously, you were required to write custom code within your Lambda function to validate, deserialize, and filter events when using these data formats. With this launch, Lambda natively supports Avro and Protobuf, as well as integration with GSR, CCSR, and SCSR. This enables you to process your Kafka events using these data formats without writing custom code. Additionally, you can optimize costs through event filtering to prevent unnecessary function invocations.
Amazon S3 Express One Zone now supports atomic renaming of objects with a single API call – The RenameObject API simplifies data management in S3 directory buckets by transforming a multi-step rename operation into a single API call. This means you can now rename objects in S3 Express One Zone by specifying an existing object’s name as the source and the new name as the destination within the same S3 directory bucket. With no data movement involved, this capability accelerates applications like log file management, media processing, and data analytics, while also lowering costs. For instance, renaming a 1-terabyte log file can now complete in milliseconds, instead of hours, significantly accelerating applications and reducing costs.
Valkey introduces GLIDE 2.0 with support for Go, OpenTelemetry, and pipeline batching – AWS, in partnership with Google and the Valkey community, announces the general availability of General Language Independent Driver for the Enterprise (GLIDE) 2.0. This is the latest release of one of AWS’s official open-source Valkey client libraries. Valkey, the most permissive open-source alternative to Redis, is stewarded by the Linux Foundation and will always remain open-source. Valkey GLIDE is a reliable, high-performance, multi-language client that supports all Valkey commands
GLIDE 2.0 introduces new capabilities that expand developer support, improve observability, and optimise performance for high-throughput workloads. Valkey GLIDE 2.0 extends its multi-language support to Go (contributed by Google), joining Java, Python, and Node.js to provide a consistent, fully compatible API experience across all four languages. More language support is on the way. With this release, Valkey GLIDE now supports OpenTelemetry, an open-source, vendor-neutral framework that enables developers to generate, collect, and export telemetry data and critical client-side performance insights. Additionally, GLIDE 2.0 introduces batching capabilities, reducing network overhead and latency for high-frequency use cases by allowing multiple commands to be grouped and executed as a single operation.
Other AWS events Check your calendar and sign up for upcoming AWS events.
AWS GenAI Lofts are collaborative spaces and immersive experiences that showcase AWS expertise in cloud computing and AI. They provide startups and developers with hands-on access to AI products and services, exclusive sessions with industry leaders, and valuable networking opportunities with investors and peers. Find a GenAI Loft location near you and don’t forget to register.
AWS Summits are free online and in-person events that bring the cloud computing community together to connect, collaborate, and learn about AWS. Register in your nearest city: Japan (this week June 25 – 26), Online in India (June 26), New-York City (July 16).
Save the date for these upcoming Summits in July and August: Taipei (July 29), Jakarta (August 7), Mexico (August 8), São Paulo (August 13), and Johannesburg (August 20) (and more to come in September and October).
AWS announced that Amazon Linux 2023 (AL2023) has achieved Federal Information Processing Standards (FIPS) 140-3 Level 1 validation of our cryptographic modules, marking a significant milestone in our commitment to providing secure, compliant operating system options for regulated workloads. FIPS certified modules are particularly important for US and Canadian government workloads, healthcare applications requiring HIPAA compliance, financial services, defense contractors, and other regulated industries. FIPS 140-3, which supersedes FIPS 140-2, represents the latest government security standard for cryptographic modules, jointly validated by the National Institute of Standards and Technology (NIST) and the Canadian Centre for Cyber Security (CCCS) through the Cryptographic Module Validation Program (CMVP). The validation follows the rigorous requirements outlined in the FIPS 140-3 standard and encompasses critical cryptographic modules including the OpenSSL, Linux Kernel Cryptographic API, NSS, GnuTLS, and Libgcrypt.
These modules have been extensively tested to have robust security capabilities such as approved cryptographic algorithms, secure key management, strong entropy generation, and protected memory boundaries. The validation process was conducted by a NIST-accredited lab, and further reviewed by the Cryptographic Module Validation Program (CMVP). Additionally, the certificate details can be verified on the CMVP Active Validation List.
At AWS re:Inforce 2025 (June 16-18, Philadelphia), AWS Vice President and Chief Information Security Officer Amy Herzog delivered the keynote address, announcing new security innovations. Throughout the event, AWS announced additional security capabilities focused on simplifying security at scale and enabling organizations to build more resilient applications in the cloud. Below is a comprehensive roundup of the major security launches and updates announced at this year’s conference.
Verify internal access to critical AWS resources with new IAM Access Analyzer capabilities A new capability in AWS Identity and Access Management Access Analyzer helps security teams verify which principals within their AWS organization have access to critical resources like S3 buckets, DynamoDB tables, and RDS snapshots by using automated reasoning to evaluate multiple policies and provide findings through a unified dashboard.
AWS IAM now enforces MFA for root users across all account types The new Multi-Factor Authentication enforcement prevents over 99% of password-related attacks. You can use a range of supported IAM MFA methods, including FIDO-certified security keys to harden access to your AWS accounts. AWS supports FIDO2 passkeys for a user-friendly MFA implementation and allows you to register up to 8 MFA devices per root and IAM user.
Improve your security posture using Amazon threat intelligence on AWS Network Firewall This new Network Firewall managed rule group offers protection against active threats relevant to workloads in AWS. The feature uses the Amazon threat intelligence system MadPot to continuously track attack infrastructure, including malware hosting URLs, botnet command and control servers, and crypto mining pools, identifying indicators of compromise (IOCs) for active threats.
AWS WAF simplified console experience The new AWS WAF console experience reduces security configuration steps by up to 80% through pre-configured protection packs. Security teams can quickly implement comprehensive protection for specific application types, with consolidated security metrics and customizable controls through an intuitive interface.
New AWS Shield feature discovers network security issues before they can be exploited (Preview) Shield network security posture management automatically discovers and analyzes network resources across AWS accounts, prioritizes security risks based on AWS best practices, and provides actionable remediation recommendations to protect applications against threats like SQL injections and DDoS attacks.
Unify your security with the new AWS Security Hub for risk prioritization and response at scale (Preview) AWS Security Hub has been enhanced to transform security signals into actionable insights, helping security teams prioritize and respond to critical issues at scale. This unified solution provides comprehensive visibility across your cloud environment while reducing the complexity of managing multiple security tools.
Amazon GuardDuty expands Extended Threat Detection coverage to Amazon EKS clusters Amazon GuardDuty Extended Threat Detection now supports Amazon EKS clusters, helping you detect sophisticated multistage attacks by correlating security signals across Kubernetes audit logs, runtime behaviors, and AWS API activities. This enhancement automatically identifies critical attack sequences that might otherwise go unnoticed, enabling faster response to threats.
New categories for the AWS MSSP Competency The AWS MSSP Competency (previously AWS Level 1 MSSP Competency) now includes new categories covering infrastructure security, workload security, application security, data protection, identity and access management, incident response, and cyber recovery. Partners provide 24/7 monitoring and incident response through dedicated Security Operations Centers.
Secure your Express application APIs in minutes with Amazon Verified Permissions Amazon Verified Permissions announced the release of the verified-permissions-express-toolkit, an open-source package that allows developers to implement authorization for Express web application APIs in minutes using Amazon Verified Permissions.
Beyond compute: Shifting vulnerability detection left with Amazon Inspector code security Amazon Inspector code security capabilities are now generally available, helping you secure applications before production by rapidly identifying and prioritizing security vulnerabilities and misconfigurations across application source code, dependencies, and infrastructure as code (IaC).
AWS Backup adds new Multi-party approval for logically air-gapped vaults Multi-party approval for AWS Backup logically air-gapped vaults enables you to recover your backup data even when your AWS account is compromised, by leveraging authorization from a designated approval team of trusted individuals who can enable vault sharing with a recovery account.
Security teams managing Kubernetes workloads often struggle to detect sophisticated multistage attacks that target containerized applications. These attacks can involve container exploitation, privilege escalation, and unauthorized movement within Amazon EKS clusters. Traditional monitoring approaches might detect individual suspicious events, but often miss the broader attack pattern that spans across these different data sources and time periods.
GuardDuty Extended Threat Detection introduces a new critical severity finding type, which automatically correlates security signals across Amazon EKS audit logs, runtime behaviors of processes associated with EKS clusters, malware execution in EKS clusters, and AWS API activity to identify sophisticated attack patterns that might otherwise go unnoticed. For example, GuardDuty can now detect attack sequences in which a threat actor exploits a container application, obtains privileged service account tokens, and then uses these elevated privileges to access sensitive Kubernetes secrets or AWS resources.
This new capability uses GuardDuty correlation algorithms to observe and identify sequences of actions that indicate potential compromise. It evaluates findings across protection plans and other signal sources to identify common and emerging attack patterns. For each attack sequence detected, GuardDuty provides comprehensive details, including potentially impacted resources, timeline of events, actors involved, and indicators used to detect the sequence. The findings also map observed activities to MITRE ATT&CK® tactics and techniques and remediation recommendations based on AWS best practices, helping security teams understand the nature of the threat.
To enable Extended Threat Detection for EKS, you need at least one of these features enabled: EKS Protection or Runtime Monitoring. For maximum detection coverage, we recommend enabling both to enhance detection capabilities. EKS Protection monitors control plane activities through audit logs, and Runtime Monitoring observes behaviors within containers. Together, they create a complete view of your EKS clusters, enabling GuardDuty to detect complex attack patterns.
How it works To use the new Amazon GuardDuty Extended Threat Detection for EKS clusters, go to the GuardDuty console to enable EKS Protection in your account. From the Region selector in the upper-right corner, select the Region where you want to enable EKS Protection. In the navigation pane, choose EKS Protection. On the EKS Protection page, review the current status and choose Enable. Select Confirm to save your selection.
After it’s enabled, GuardDuty immediately starts monitoring EKS audit logs from your EKS clusters without requiring any additional configuration. GuardDuty consumes these audit logs directly from the EKS control plane through an independent stream, which doesn’t affect any existing logging configurations. For multi-account environments, only the delegated GuardDuty administrator account can enable or disable EKS Protection for member accounts and configure auto-enable settings for new accounts joining the organization.
To enable Runtime Monitoring, choose Runtime Monitoring in the navigation pane. Under the Configuration tab, choose Enable to enable Runtime Monitoring for your account.
Now, you can view from the Summary dashboard the attack sequences and critical findings specifically related to Kubernetes cluster compromise. You can observe that GuardDuty identifies complex attack patterns in Kubernetes environments, such as credential compromise events and suspicious activities within EKS clusters. The visual representation of findings by severity, resource impact, and attack types gives you a holistic view of your Amazon EKS security posture. This means you can prioritize the most critical threats to your containerized workloads.
The Findingdetails page provides visibility into complex attack sequences targeting EKS clusters, helping you understand the full scope of potential compromises. GuardDuty correlates signals into a timeline, mapping observed behaviors to MITRE ATT&CK® tactics and techniques such as account manipulation, resource hijacking, and privilege escalation. This granular level of insight reveals exactly how attackers progress through your Amazon EKS environment. It identifies affected resources like EKS workloads and service accounts. The detailed breakdown of indicators, actors, and endpoints provides you with actionable context to understand attack patterns, determine impact, and prioritize remediation efforts. By consolidating these security insights into a cohesive view, you can quickly assess the severity of Amazon EKS security incidents, reduce investigation time, and implement targeted countermeasures to protect your containerized applications.
The Resources section of the Finding details page shows context about the specific assets affected during an attack sequence. This unified resource list provides you with visibility into the exact scope of the compromise—from the initial access to the targeted Kubernetes components. Because GuardDuty includes detailed attributes such as resource types, identifiers, creation dates, and namespace information, you can rapidly assess which components of your containerized infrastructure require immediate attention. This focused approach eliminates guesswork during incident response, so you can prioritize remediation efforts on the most critical affected resources and minimize the potential blast radius of Amazon EKS targeted attacks.
Now available Amazon GuardDuty Extended Threat Detection with expanded coverage for Amazon EKS clusters provides comprehensive security monitoring across your Kubernetes environment. You can use this capability to detect sophisticated multistage attacks by correlating events across different data sources, identifying attack sequences that traditional monitoring might miss.
To start using this expanded coverage, enable EKS Protection in your GuardDuty settings and consider adding Runtime Monitoring for enhanced detection capabilities.
For more information about this new capability, refer to the Amazon GuardDuty Documentation.
To provide the best experiences, we use technologies like cookies to store and/or access device information. Consenting to these technologies will allow us to process data such as browsing behavior or unique IDs on this site. Not consenting or withdrawing consent, may adversely affect certain features and functions.
Functional
Always active
The technical storage or access is strictly necessary for the legitimate purpose of enabling the use of a specific service explicitly requested by the subscriber or user, or for the sole purpose of carrying out the transmission of a communication over an electronic communications network.
Preferences
The technical storage or access is necessary for the legitimate purpose of storing preferences that are not requested by the subscriber or user.
Statistics
The technical storage or access that is used exclusively for statistical purposes.The technical storage or access that is used exclusively for anonymous statistical purposes. Without a subpoena, voluntary compliance on the part of your Internet Service Provider, or additional records from a third party, information stored or retrieved for this purpose alone cannot usually be used to identify you.
Marketing
The technical storage or access is required to create user profiles to send advertising, or to track the user on a website or across several websites for similar marketing purposes.