Tag Archives: announcements

Authentication and authorization options for Amazon MQ for RabbitMQ

Post Syndicated from Vinodh Kannan Sadayamuthu original https://aws.amazon.com/blogs/big-data/authentication-and-authorization-options-for-amazon-mq-for-rabbitmq/

Managing authentication for message brokers at scale is complex: credentials sprawl, audit requirements, and integration with existing identity providers create operational overhead. The default approach of creating RabbitMQ users with static usernames and passwords works for getting started, but it quickly becomes a liability at scale. Credentials must be distributed securely, rotated regularly, and revoked promptly when team members change roles or leave the organization. For regulated industries, auditors want to see that your messaging infrastructure enforces the same identity and access controls as the rest of your environment.

Different organizations have different identity infrastructures. Some manage users through Active Directory. Others have standardized on OAuth 2.0. Platform teams building on AWS want to use AWS Identity and Access Management (IAM) roles and policies they understand. Security-conscious environments might require certificate-based authentication where no passwords are transmitted over the network at all.

Amazon MQ for RabbitMQ supports multiple authentication and authorization methods, so you can connect your broker to the identity infrastructure you already use. This post introduces the available options and helps you choose the right one for your use case.

Authentication methods at a glance

Amazon MQ for RabbitMQ supports the following authentication and authorization methods:

Method Credential type User management Recommended for
Simple credentials Username / password Broker-local Getting started, development environments
OAuth 2.0 Bearer tokens from external identity provider External identity provider Workloads that need short-lived tokens from a third-party identity provider
IAM authentication Short-lived JSON Web Tokens (JWTs) from AWS Security Token Service (AWS STS) IAM AWS-native workloads, multi-tenant isolation, credential-free authentication
LDAP Directory credentials Active Directory or LDAP server Organizations with existing directory services
HTTP-based auth backend Username / password validated by external server External HTTP server Custom auth logic, centralized user management across brokers
SSL certificate authentication Certificate only (passwordless) Broker-local (username extracted from cert) Eliminating passwords entirely with certificate-only identity
Mutual TLS (mTLS) Certificate and username/password Broker-local Adding transport-layer certificate verification to existing credential-based auth

Choosing the right method

The right choice depends on your existing identity infrastructure, security requirements, and operational preferences.

Simple credentials

The default method. You create RabbitMQ users with usernames and passwords directly on the broker. This is a straightforward way to get started, but it requires you to manage credentials manually. Choose this for development, testing, or small-scale deployments where credential management overhead is acceptable.

OAuth 2.0

Clients obtain short-lived tokens from any OAuth 2.0-compatible identity provider and present them to the broker as bearer tokens. Choose this when you have an existing identity provider (other than IAM) that issues tokens for your applications, and you want automatic token expiration without managing broker-local credentials.

IAM authentication

IAM serves as an identity provider. Client applications use their IAM credentials to obtain a short-lived JWT from AWS Security Token Service (AWS STS) and present it as a bearer token. IAM policies control which roles can obtain tokens. RabbitMQ scope aliases on the broker map each role’s Amazon Resource Name (ARN) to specific resource permissions (read, write, configure, and administrator). AWS CloudTrail logs every token issuance for auditing. Choose this when your workloads run on AWS compute services with IAM roles, and you want credential-free, IAM-native authentication with broker-level authorization.

LDAP

Connect your broker to an existing directory service such as Active Directory. Users authenticate with their directory credentials, and RabbitMQ permissions map to LDAP group memberships. Choose this when your organization already manages users and groups through a directory service, and you want to apply existing password policies and group-based access control to broker access.

HTTP-based auth backend

Delegates authentication and authorization decisions to a custom HTTPS server. The broker sends HTTP requests to your server for user validation, virtual host access, resource permissions, and topic permissions. Choose this when you need custom authentication logic, want to centralize user management across multiple brokers, or need to integrate with an identity system that doesn’t support OAuth 2.0 or LDAP natively.

SSL certificate authentication

Removes passwords entirely. The broker uses the EXTERNAL Simple Authentication and Security Layer (SASL) mechanism to extract the client’s identity directly from the X.509 certificate (for example, from the Common Name field) and uses it as the RabbitMQ username. With this method, your application doesn’t transmit credentials over the network. Choose this when your security policy requires passwordless authentication, and you manage client identities through a public key infrastructure (PKI).

Mutual TLS (mTLS)

Adds certificate verification on top of existing username/password authentication. During the TLS handshake, the client validates the broker’s certificate and the broker validates the client’s certificate, then the client provides a username and password at the application layer. This gives you two-factor security: something you have (the certificate) plus something you know (the password). Choose this when compliance frameworks require mutual authentication, but you want to retain your existing username/password authentication flow.

Conclusion

Amazon MQ for RabbitMQ version 4 supports seven authentication and authorization methods. With these methods, you can align your message broker security with your existing identity infrastructure. Your organization might standardize on IAM, manage identities through Active Directory, federate access through a third-party identity providers like Okta or Microsoft Entra ID, or rely on PKI for certificate-based trust. In each case, you can eliminate the operational overhead of managing static credentials at scale.

Choose your implementation path:

For sample code and infrastructure templates, clone the
Amazon MQ samples repository and deploy the CDK stack for your chosen authentication method.

About the authors

Vinodh Kannan Sadayamuthu

Vinodh Kannan Sadayamuthu

Vinodh is a Senior Specialist Solutions Architect at Amazon Web Services (AWS). His expertise centers on AWS messaging and streaming services, where he provides architectural best practices consultation to AWS customers.

Vignesh Selvam

Vignesh Selvam

Vignesh is the Principal Product Manager for Amazon MQ at AWS. He works with customers to solve their messaging needs and with the open-source communities for innovating with message brokers. Prior to joining AWS, he built products for security and analytics.

Introducing public preview runtimes on AWS Lambda, starting with Node.js 26 and Python 3.15

Post Syndicated from Jonathan Tuliani original https://aws.amazon.com/blogs/compute/introducing-public-preview-runtimes-on-aws-lambda-starting-with-node-js-26-and-python-3-15/

Today, AWS Lambda introduces public preview runtimes, a new way to try upcoming language versions on Lambda before their general availability (GA) release. Starting today, you can create and update Lambda functions using Node.js 26 and Python 3.15, the first runtimes available as public previews.

Previously, Lambda has always launched new runtimes as Generally Available (GA), giving you a production-ready experience from day one. But this means you couldn’t run your functions on Lambda using a pre-release language version, and we couldn’t hear your feedback while breaking changes were still possible. Public preview runtimes change that. By putting pre-GA runtimes in your hands months earlier, we can listen to your feedback and address it before GA, while we still have the opportunity to make breaking changes to improve the runtime.

Preview runtimes are available in all AWS commercial Regions, AWS GovCloud (US) Regions, and China Regions. They use the same runtime identifier as the eventual GA runtime, so your functions graduate automatically when the runtime reaches GA, with no action required.

Why public preview runtimes

When Lambda launches a new runtime as GA, that means it is ready for use in production workloads from day one. Historically, the Lambda team has validated new runtimes through internal testing and pre-release benchmarking. However, without real customer workloads running on the runtime, some issues only surface after the GA launch. And once the runtime is GA, the scope to address those issues is much reduced since we cannot risk breaking existing production workloads.

Public preview runtimes address this by opening up a pre-GA feedback window. During this period, you can deploy functions using the upcoming runtime, and the Lambda team can act on what you find, including making potentially breaking changes if necessary. In addition, because the upstream language is still in its pre-release phase, there’s also the opportunity that issues discovered during preview can be fixed in the runtime itself, not just worked around.

This benefits everyone involved. You get a runtime that’s been tested against a broader range of real workloads before it reaches GA. Third-party partners, including observability providers, infrastructure-as-code tools, and deployment frameworks, get time to validate compatibility. And upstream language communities get a signal from a major cloud platform while they can still act on it.

This is the first time we’re launching runtimes as public previews. As such, it’s an experiment. We hope to make public previews the default for all future runtime launches, depending on the success of this experiment and the feedback we receive.

What’s included in the preview runtimes

The Node.js 26 and Python 3.15 preview runtimes are built on the latest upstream pre-release of each language version. At launch, they are a straightforward version bump. There are no additional Lambda-specific enhancements beyond what the new language version itself provides. For details on what’s new in each language version, refer to the upstream release information:

Preview runtimes are available as both managed runtimes and base container images. The base images are published to the Lambda base image ECR repository with image tags starting with 3.15-preview (for Python) and 26-preview (for Node.js).

During the preview period, we may introduce additional features or enhancements to these runtimes. When we do, we’ll announce them on the same GitHub issue we use to collect your feedback:

Follow these issues to stay informed of any changes during the preview period.

What to expect during preview

Preview runtimes follow the same patching cadence as GA runtimes. When an update is released upstream, Lambda applies it to the preview runtime on the same schedule as any other supported runtime. All Lambda features supported by the current GA runtimes are available on the preview runtimes, including Lambda Managed Instances and durable functions.

The key difference is that the underlying language version has not yet reached its stable release. In addition, the Lambda team is still working on the runtimes to add features and optimize performance. This means breaking changes may occur during the preview period. A function that works today may require a fix after Lambda rolls out the next runtime update. This is by design: the preview period exists so that these issues can be found and resolved before GA, not after.

Because of this potential for breaking changes, preview runtimes are not covered by the AWS Lambda SLA or AWS technical support plans. We strongly recommend against using them for production workloads. Lambda emits a warning message to CloudWatch Logs on each cold start to make it clear when a function is running on a preview runtime:

WARNING: This is a preview runtime version and should not be used for production workloads. For further information and to provide feedback, see https://docs.aws.amazon.com/lambda/latest/dg/lambda-runtimes.html.

You may notice that, at launch, preview runtimes have slower performance than GA runtimes, in particular for cold starts. This is because of a combination of lack of optimization and less caching in internal Lambda sub-systems. We will benchmark and optimize performance during the preview period, prior to GA.

Functions that use preview runtimes are billed at standard Lambda rates. There is no additional cost or separate pricing.

Share your feedback

We want to hear from you during the preview period. We’ve created a dedicated GitHub issue for each preview runtime where you can share your experience:

Comment on these issues directly, or open a separate issue in the repository if you prefer.

We’re interested in all feedback, not just bug reports. If you see an opportunity to take advantage of a new language feature in the runtime, or a way to improve the Lambda programming model for that language, we want to hear about it. The preview period is when we can still make meaningful changes, so this is the best time to share your ideas.

Note that feedback should be scoped to the runtime itself: the execution environment, language integration, and programming model. For broader Lambda feature requests, refer to the AWS Lambda public roadmap.

Transition to GA

Both Node.js 26 and Python 3.15 are expected to reach their stable upstream releases in October 2026. Lambda GA for each runtime is targeted within two months following those releases. For the latest estimated GA dates, see Lambda documentation.

For Node.js, the GA timeline is tied to the Node.js “Active LTS” release, which is scheduled for October 2026. Only at that point is the release considered suitable for production workloads by the Node.js project, and only then is it sufficiently stable for Lambda’s automatic runtime patching in which patches are applied to your functions without action on your part. Lambda will not GA the Node.js 26 runtime until it reaches Active LTS.

When a preview runtime reaches GA, your functions graduate automatically. The runtime identifier does not change: nodejs26.x in preview is the same nodejs26.x at GA. You do not need to update your function configuration, templates, or code. The preview label is removed from the console and documentation, the runtime becomes covered by the Lambda SLA and AWS Support, and the GA performance and quality bar applies from that point forward.

If you have pinned your function to a specific runtime version using Runtime Management Controls during the preview period, it remains pinned. You can unpin at any time to move to the GA runtime. Functions pinned to a pre-GA runtime version are not covered by the Lambda SLA and AWS Support.

Getting started

You can start using the Node.js 26 and Python 3.15 preview runtimes today using the Lambda console, AWS Command Line Interface (AWS CLI), AWS CloudFormation, AWS Serverless Application Model (AWS SAM), or AWS Cloud Development Kit (AWS CDK).

Console

In the Lambda console, choose “Node.js 26 (Preview)” or “Python 3.15 (Preview)” from the runtime list when creating or updating a function.

Screenshot of the Lambda console runtime list showing “Node.js 26 (Preview)” and “Python 3.15 (Preview)” options.

AWS CLI

Create a function using the preview runtime with the standard runtime identifier:

aws lambda create-function \
  --function-name my-function \
  --runtime nodejs26.x \
  --handler index.handler \
  --role arn:aws:iam::123456789012:role/my-role \
  --zip-file fileb://function.zip

For Python 3.15, use --runtime python3.15. These are the same identifiers the GA runtimes will use, there is no separate preview-specific value.

AWS CloudFormation

Specify the preview runtime in your CloudFormation template using the same runtime identifier:

Resources:
  MyFunction:
    Type: AWS::Lambda::Function
    Properties:
      FunctionName: my-function
      Runtime: nodejs26.x
      Handler: index.handler
      Role: arn:aws:iam::123456789012:role/my-role
      Code:
        S3Bucket: amzn-s3-demo-function-code
        S3Key: function.zip

AWS SAM

AWS SAM supports preview runtimes using the standard runtime identifier in your template:

Resources:
  MyFunction:
    Type: AWS::Serverless::Function
    Properties:
      Runtime: python3.15
      Handler: app.lambda_handler
      CodeUri: src/

When you run sam init, preview runtimes appear in the template list with a “(Preview)” label, so you can scaffold a new project directly.

AWS CDK

The AWS CDK does not yet include built-in enum members (such as Runtime.NODEJS_26_X). During the preview phase, you can use the public Runtime constructor to specify the runtime directly, for example:

import { Stack, StackProps } from "aws-cdk-lib";
import { Construct } from "constructs";
import { Function, Runtime, RuntimeFamily, Code } from "aws-cdk-lib/aws-lambda";

export class LambdaStack extends Stack {
  constructor(scope: Construct, id: string, props?: StackProps) {
    super(scope, id, props);

    new Function(this, "MyFunction", {
      runtime: new Runtime("nodejs26.x", RuntimeFamily.NODEJS),
      handler: "index.handler",
      code: Code.fromAsset("lambda"),
    });
  }
}

Or, for Python 3.15, replace new Runtime("nodejs26.x", RuntimeFamily.NODEJS) with new Runtime("python3.15", RuntimeFamily.PYTHON).

This synthesizes identical CloudFormation to what a built-in enum produces. When the runtime reaches GA, a corresponding enum member will be added. There is no functional difference in the meantime.

Conclusion

Public preview runtimes give you a seat at the table while Lambda’s next runtimes are still taking shape. Try using Node.js 26 or Python 3.15 today to deploy a function, run your test suite, and let us know what you find.

Share feedback and follow along:

These GitHub issues are where we’ll post any enhancements or breaking changes during the preview period, so they’re worth watching even if you don’t have immediate feedback. The preview runtimes are available today in all AWS Regions, including AWS GovCloud (US), and the AWS China Regions. To learn more, see the Lambda runtimes documentation.

AWS Certificate Manager will discontinue email validation to prove domain validation for certificates

Post Syndicated from Adam Aboudi original https://aws.amazon.com/blogs/security/aws-certificate-manager-will-discontinue-email-validation-to-prove-domain-validation-for-certificates/

Today, we’re announcing that AWS Certificate Manager (ACM) will discontinue support for email-validated public certificates by September 30, 2027. If you use email validation for your ACM public certificates, you need to migrate to DNS validation before that date. This change aligns with the Certification Authority/Browser (CA/B) Forum’s industry-wide deprecation of email-based domain validation and gives you a full year to migrate ahead of the Forum’s March 2028 deadline.

In this blog post, we share the rationale for this change, the timeline, and the steps you can take to migrate your certificates to DNS validation.

Background

The CA/B Forum sets the standards that browsers and certificate authorities must follow for publicly trusted certificates. In November 2025, they voted to end support for email-based domain validation effective March 15, 2028. After that date, certificates validated through email won’t be trusted by browsers, regardless of which certificate authority issued them.

ACM will be deprecating its email validation in-line with the CA/B Forum’s requirements, by September 30, 2027. The ACM timeline gives customers one year to migrate before the CA/B Forum’s hard deadline.

Timelines for these changes

If you currently use email validation for certificates requested from ACM, there are a few important dates that you should be aware of:

  • January 1, 2027: ACM will no longer offer email validation in new AWS Regions.
  • March 31, 2027: ACM will no longer offer email validation for new certificate requests in any Region.
  • September 30, 2027: ACM will no longer renew existing certificates that use email validation in any Region.
  • March 15, 2028: Per the CA/B Forum, public certificate authorities can no longer use email-based domain validation to issue or renew publicly trusted certificates. Certificates issued before this date remain valid until they expire.

Check for existing email validated certificates

If you have any ACM issued public certificates, you can check whether any of them are email validated by using the AWS Management Console for ACM or the AWS Command Line Interface (AWS CLI).

Identify email validated certificates using the ACM console

Use the following steps in the console to find email validated certificates.

  1. Open the ACM console.
  2. Select the filters Validation method = Email and Type = Amazon Issued for a list of email validated certificates.
  3. Any certificates listed are public email-validated certificates and should be migrated before September 30, 2027.
  4. Figure 1: List of all public email validated certificates

    Figure 1: List of all public email validated certificates

Identify email-validated certificates using the AWS CLI

Use the following commands to find email validated certificates.

# Discover email validated public certificates 
region="${1:-us-east-1}" 

aws acm list-certificates --region "$region" \ 
--query "CertificateSummaryList[?Type=='AMAZON_ISSUED'].CertificateArn" --output text | tr '\t' '\n' | while read -r arn; do aws acm describe-certificate --region "$region" --certificate-arn "$arn" \
--query 'Certificate.[DomainName,Type,DomainValidationOptions[0].ValidationMethod]' \ 
--output text done | awk -F'\t' '$3 == "EMAIL"' | column -t 

Usage: 
chmod +x list-email-validated-certs.sh 
./list-email-validated-certs.sh # default region, us-east-1 
./list-email-validated-certs.sh us-west-2 # another region

Migrate existing email validated certificates

To assist you in this migration, ACM is updating the UpdateCertificateOptions API so you can switch a certificate’s validation method from email to DNS in place. This means the certificate Amazon Resource Name(ARN) will remain the same and no changes will be needed to your AWS resources that reference the certificate.

When you update a certificate to DNS validation, ACM provides a CNAME record to add to your DNS configuration, and you have 72 hours to add that record. During this window, the certificate continues to function normally on email validation. If the 72 hours elapse without a DNS update, the certificate stays active on email validation and you can retry when ready. After DNS validation is complete, ACM is designed to automatically renew your certificate before it expires without further manual intervention required. We recommend completing migration before September 30, 2027, so that ACM can keep your certificates up to date without interruption.

To migrate using the console

  1. After you’ve identified a certificate that needs updating, open it and select Update validation method at the top of the page.
    Figure 2: DNS Validation prompt when viewing an email validated public certificate.

    Figure 2: DNS Validation prompt when viewing an email validated public certificate.

  2. After the update is triggered, you will see a View DNS records flashbar at the top of the certificate page.
    Figure 3: View DNS validation records after updating validation method.

    Figure 3: View DNS validation records after updating validation method.

  3. Select View DNS Records in the flashbar to open a dialog box from which you can download the CSV file for the CNAME records to export to other DNS providers.
    Figure 4: Get DNS validation information from the dialog box

    Figure 4: Get DNS validation information from the dialog box

  4. For Route 53 users, there is a Create records in Route 53 that makes the validation available as a one-click option.
    Figure 5: Create DNS validation records into Route 53

    Figure 5: Create DNS validation records into Route 53

To migrate using the AWS CLI:

For instructions on how to update certificates using the AWS CLI, see the email to DNS migration user guide.

Alternatives after email validation is no longer available

ACM supports two validation methods for new certificates going forward:

  • DNS validation – Add a CNAME record to your DNS configuration. ACM automatically renews DNS-validated certificates as long as the record remains in place. We recommend this method for most use cases.
  • HTTP validation for CloudFront – ACM provides a unique token that you host at a well-known URL path on your domain. This method is only available for certificates used with Amazon CloudFront.

Both methods remove the manual approval step required by email validation and let ACM renew your certificates automatically.

Conclusion

The deprecation of email validation and use of the new UpdateCertificateOptions API helps keep your certificates trusted and your applications running as industry standards evolve. The updated UpdateCertificateOptions API is designed to make this migration straightforward: switch your validation method in place, add the DNS record, and ACM is designed to handle renewals automatically from that point forward.

If you have questions or need assistance migrating, contact AWS Support or start a new thread on the AWS re:Post ACM Forum.

If you have feedback about this post, submit comments in the Comments section below.


Adam Aboudi

Adam Aboudi

Adam is a Senior Technical Product Manager on the AWS Certificate Manager team. He focuses on helping customers simplify certificate lifecycle management and maintain strong security posture across their AWS environments.

Poojil Tripathi

Poojil Tripathi

Poojil is a Solutions Architect at AWS based out of Austin, TX. They work with AWS customers to help them design secure architectures for all types of workloads. They would like to remind you to dance like no one is watching, but encrypt like everyone is.

Landing Zone Accelerator Independent Assessment Report for C5:2020 now available on AWS Artifact

Post Syndicated from Kevin Donohue original https://aws.amazon.com/blogs/security/landing-zone-accelerator-independent-assessment-report-for-c52020-now-available-on-aws-artifact/

Organizations operating in Germany and across Europe increasingly need to demonstrate cloud security compliance under the Cloud Computing Compliance Criteria Catalogue (C5:2020), published by Germany’s Federal Office for Information Security (BSI). Last year, we introduced Landing Zone Accelerator on AWS support for digital sovereignty and today we’re announcing the availability of a new independent assessment report available on AWS Artifact which evaluates how the Landing Zone Accelerator (LZA) on AWS solution provides enhanced coverage for C5:2020 requirements by implementing nearly 200 native security controls. LZA is available using a standard multi-account configuration or as a container-based deployment option in the AWS European Sovereign Cloud, enabling customers with data residency requirements to use the same security configuration baseline.

How this accelerates your compliance journey

Security and compliance are a shared responsibility. LZA takes on part of this responsibility by defining a security architecture baseline and automatically provisioning your AWS environment that scales as your organization grows. Where AWS already provides C5 Type 2 attestation reports for “security of the cloud”, the LZA assessment report offers an independent opinion of how the security baseline LZA provisions aligns with C5:2020 criteria for “security in the cloud”. Instead of starting from scratch, you can deploy with LZA, evaluate the scope of coverage from the report, and use the LZA Compliance Workbook to build on and customize for your organization’s unique use case. These resources can help you reduce time in architecture design, evidence collection, and preparation for C5:2020 assessments. The free LZA Compliance Workbook available on AWS Artifact and open source Universal Configuration GitHub repository are also excellent sources to add to a knowledge base, enabling you to create a security compliance chat agent with Bedrock to assist your governance or assurance teams.

What’s in the report

AWS Partner Schellman, an independent third-party assessor, evaluated the LZA Universal Configuration architecture and security control baseline, which maps to C5:2020 controls in the LZA Compliance Workbook, to determine how the LZA infrastructure aligns to C5:2020 technical requirements. The report concluded that LZA can help implement 325 security controls in aggregate, aligning to technical requirements from eight C5:2020 control areas. It also describes the LZA architecture design, security best practices, and scoping considerations for C5:2020 assessments. This is the first installation of the independent C5 report for LZA, which will be updated in 2027 to evaluate coverage for the pending C5:2026 revision.

In addition to the LZA C5:2020 report, you can also find the LZA Compliance Workbook available on AWS Artifact. It maps C5:2020 requirement identifiers to security implementation statements, giving you a starting point from which you can customize and enhance your compliance documentation for your unique workloads or operational practices after deploying LZA.

Getting started with LZA for C5

  1. Sign in to your AWS account first and then download the LZA C5:2020 Independent Assessment Report and LZA Compliance Workbook from AWS Artifact.
  2. Visit the LZA Universal Configuration GitHub repository to review and download the latest configuration baseline. Also, see guidance for European Sovereign Cloud LZA deployments.
  3. The LZA Implementation Guide walks you through deployment steps, use cases, and pre-deployment considerations.

To learn more, submit a question to a LZA team member or contact your AWS account representative.

If you have feedback about this post, submit comments in the Comments section below.


Kevin Donohue

Kevin Donohue

Kevin is a Senior Security Compliance Engineer at AWS, where he builds solutions and resources to help AWS customers achieve their security and compliance goals. Prior to joining the Landing Zone Accelerator team in AWS Professional Services in 2024, Kevin began his tenure with AWS Security in 2019 specializing in FedRAMP compliance and the shared responsibility model.

Michael Wahlers

Michael Wahlers

Michael is a Principal Solutions Architect and Public Sector Specialist working across Germany, Austria, and Switzerland. With passionate enthusiasm, he supports public institutions with innovative digital solutions. His expertise ensures seamless service delivery, making him a valuable asset in shaping the digital future of the public sector. He also enjoys exploring complex distributed systems and incorporating local contexts into his work.

Summer 2026 SOC 1 report is now available with 185 services in scope

Post Syndicated from Baj Bajwa original https://aws.amazon.com/blogs/security/summer-2026-soc-1-report-is-now-available-with-185-services-in-scope/

Amazon Web Services (AWS) is pleased to announce that the Summer 2026 System and Organization Controls (SOC) 1 report is now available. The reports cover 185 services over the 12-month period from July 1, 2025–June 30, 2026, giving customers a full year of assurance. These reports demonstrate our continuous commitment to adhering to the heightened expectations of cloud service providers.

Customers can download the Summer 2026 SOC 1 report through AWS Artifact, a self-service portal for on-demand access to AWS compliance reports. Sign in to AWS Artifact in the AWS Management Console, or learn more at Getting Started with AWS Artifact.

AWS strives to continuously bring services into the scope of its compliance programs to help customers meet their architectural and regulatory needs. You can view the current list of services in scope on our Services in Scope page. As an AWS customer, you can reach out to your AWS account team if you have any questions or feedback about SOC compliance.

To learn more about AWS compliance and security programs, see AWS Compliance Programs.


Baj Bajwa

Baj Bajwa

Baj is a Security Assurance Manager at AWS, where he leads the Global Third-Party Assurance product portfolio within the Compliance and Security Assurance (CSA) organization. He has over 15 years of experience in information security, compliance, and risk management, and holds a master’s degree in cybersecurity. Baj maintains CISSP, CISA, PMP, CCSK, GISF, and ICAgile certifications.

Tushar Jain

Tushar Jain
Tushar is a Compliance Program Manager at AWS where he leads multiple security and privacy initiatives Tushar holds a Master of Business Administration from Indian Institute of Management Shillong, India and a Bachelor of Technology in electronics and telecommunication engineering from Marathwada University, India. He has over 14 years of experience in information security and holds CISM, CCSK and CSXF certifications.

Michael Murphy

Michael Murphy
Michael is a Compliance Program Manager at AWS where he leads multiple security and privacy initiatives. Michael has over 14 years of experience in information security and holds a master’s degree and a bachelor’s degree in computer engineering from Stevens Institute of Technology. He also holds CISSP, CRISC, CISA, and CISM certifications.

Jeff Cheung

Jeff Cheung
Jeff is a Compliance Program Manager at AWS where he leads multiple security and privacy initiatives across business lines. Jeff has Bachelors degrees in Information Systems, and Economics from SUNY Stony Brook, and has over 20 years of experience in information security and assurance. Jeff has held professional certifications such as CISA, CISM, and PCI-QSA.

Logan Moore

Logan Moore
Logan is a Compliance Program Manager at AWS where he leads multiple security and compliance initiatives. Logan has over 10 years of experience in information security and holds a Bachelor’s Degree in Information Systems Management from Virginia Polytechnic Institute and State University.

Noah Miller

Noah Miller
Noah is a Compliance Program Manager at AWS and leads multiple security and privacy initiatives. Noah has 7 years of experience in information security. He has a master’s degree in Cybersecurity Risk Management and a bachelor’s degree in Informatics from Indiana University.

Will Black
Will Black

Will is a Compliance Program Manager at Amazon Web Services where he leads multiple security and compliance initiatives. Will has 10 years of experience in compliance and security assurance and holds a degree in Management Information Systems from Temple University. Additionally, he is a PCI Internal Security Assessor (ISA) for AWS and holds the CCSK and ISO 27001 Lead Implementer certifications.
Ziv Wand
Ziv Wand

Ziv is a Compliance Program Manager at AWS and leads multiple security and privacy initiatives. Ziv has over 6 years of experience in information security assurance, external IT security audits, security control design and implementation, and audit readiness. He holds a Bachelor of Science in Management Information Systems from Binghamton University.
Shalini Mishra
Shalini Mishra

Shalini is a Compliance Program Manager at AWS. She has over 5 years of experience leading end-to-end compliance programs across ISO, SOC, and cloud security frameworks, with deep expertise in third-party risk management and enterprise governance. Shalini holds a Master of Science degree in Information Systems and a CRISC certification.
Patrick Broussard

Patrick Broussard
Patrick is a Security Assurance Analyst at AWS, where he assists with multiple security and privacy initiatives, with expertise in physical security and infrastructure management. He has over 3 years of experience in information security assurance and infrastructure security control operation, and holds a Bachelors of Science from Virginia Polytechnic Institute and State University.

Jimmy Chang

Jimmy Chang
Jimmy is a Security Assurance Analyst at AWS, where he assists with multiple security and privacy initiatives, with expertise in application security and secure software development life cycle. He has over 4 years of experience in information security and holds CISSP and CCSK certifications, and holds a Master of Information Systems Management from Carnegie Mellon University.

Faraz Haq

Faraz Haq
Faraz is a Compliance Program Manager at AWS leading various compliance and security assurance initiatives. Faraz has over 10 years of experience in information security and compliance. He holds Bachelor of Science Degrees in Accounting and Finance from Oakland University.

AWS successfully completed its 2025-26 NHS DSPT assessment

Post Syndicated from Tariro Dongo original https://aws.amazon.com/blogs/security/aws-successfully-completed-its-2025-26-nhs-dspt-assessment/

Amazon Web Services (AWS) is pleased to announce its successful completion of the 2025-26 NHS Data Security and Protection Toolkit (NHS DSPT) assessment audit and achieving a status of Standards Exceeded.

The NHS DSPT is an assessment that allows organizations to measure their performance against the National Data Guardian’s 10 data security standards. All organizations that access NHS patient data and systems are expected to use the toolkit to demonstrate their compliance with safe data security standards. NHS DSPT covers standards regarding Personal Confidential Data, Continuity Planning, IT Protection, and more. AWS undergoes the assessment to provide customers with assurance that we are practicing good data security.

The AWS NHS DSPT assessment status is valid until June 30, 2027, and a certificate that confirms our compliance is available on the NHS England website and in AWS Artifact. AWS Artifact is a self-service portal for on-demand access to AWS compliance reports. Sign in to AWS Artifact in the AWS Management Console, or learn more at Getting Started with AWS Artifact.

Security and compliance is a shared responsibility between AWS and the customer. When customers move their computer systems and data to the cloud, security responsibilities are shared between the customer and the cloud service provider. For more information, see the AWS Shared Security Responsibility Model.

To learn more about our compliance and security programs, see AWS Compliance Programs.

As an AWS customer, you can reach out to your AWS account team if you have any questions or feedback.

If you have feedback about this post, submit comments in the Comments section below.


Tari Dongo

Tariro Dongo

Tari is a Security Assurance Program Manager at AWS, based in London. She is responsible for third-party and customer audits, attestations, certifications, and assessments across EMEA. Tari has worked in security assurance and technology risk in the big four and financial services industry for over 15 years.

AWS completes the 2026 Police-Assured Secure Facilities (PASF) audit in Europe (London)

Post Syndicated from Tariro Dongo original https://aws.amazon.com/blogs/security/aws-completes-the-2026-police-assured-secure-facilities-pasf-audit-in-europe-london/

We’re excited to announce that our Europe (London) AWS Region has renewed its accreditation for United Kingdom (UK) Police-Assured Secure Facilities (PASF) for Official-Sensitive data. Since 2017, the Amazon Web Services (AWS) Europe (London) Region has been accredited under the PASF program. This demonstrates our continuous commitment to adhere to the heightened expectations of customers with UK law enforcement workloads. Our UK law enforcement customers who require PASF can continue to run their applications in the PASF-accredited Europe (London) Region in confidence.

The PASF is a long-established assurance process, used by UK law enforcement, as a method for assuring the security of facilities such as data centers or other locations that house critical business applications that process or hold police data. PASF consists of a control set of security requirements, an on-site inspection, and an audit interview with representatives of the facility.

The Police Digital Service (PDS) confirmed the accreditation renewal for AWS on May 28, 2026. A confirmation letter can be found on AWS Artifact. The UK police force and law enforcement organizations can also obtain confirmation of the compliance status of AWS through the Police Digital Service.

To learn more about our compliance and security programs, see AWS Compliance Programs.

As an AWS customer, you can reach out to your AWS account team if you have any questions or feedback.

If you have feedback about this post, submit comments in the Comments section below.


Tari Dongo

Tariro Dongo

Tari is a Security Assurance Program Manager at AWS, based in London. She is responsible for third-party and customer audits, attestations, certifications, and assessments across EMEA. Tari has worked in security assurance and technology risk in the big four and financial services industry for over 15 years.

2026 AWS CyberVadis report now available for due diligence on third-party suppliers

Post Syndicated from Tariro Dongo original https://aws.amazon.com/blogs/security/2026-aws-cybervadis-report-now-available-for-due-diligence-on-third-party-suppliers/

We’re excited to announce that Amazon Web Services (AWS) has completed theCyberVadis assessment of its security posture with the highest score (Mature) in all assessed areas. This demonstrates our continued commitment to meet the heightened expectations for cloud service providers. Customers can now use the 2026 AWS CyberVadis report and scorecard to reduce their supplier due-diligence burden.

With the increasing adoption of cloud products and services across multiple sectors and industries, AWS is a critical component of customers’ third-party environments. Regulated customers, such as those in the financial services sector, are held to high standards by regulators and auditors when it comes to exercising effective due diligence on third parties.

Many customers use third-party risk management services such as CyberVadis to better manage risks from their evolving third-party environments and drive operational efficiencies. In support of these efforts, AWS has completed its annual CyberVadis security posture assessment, conducted by CyberVadis security analysts.

CyberVadis is a comprehensive third-party risk assessment process that combines the speed and scalability of automation with the certainty of analyst validation. CyberVadis assessments employ a dynamic and comprehensive approach to third-party risk assessment, replacing outdated static spreadsheets and the need for annual AWS assessment access requests. This cloud-based solution provides advanced capabilities by integrating AWS responses with analytics and sophisticated risk models to deliver an in-depth view of the security posture of AWS.

CyberVadis’s risk assessment methodology evaluates 20 topics covering the entire cybersecurity life cycle across four phases: Identify, Protect, Detect, and React. These topics include Data Privacy, Access Management, and Infrastructure Security. The assessment criteria are based on international information security standards, including ISO 2700x, NIST Cybersecurity Framework, Cybersecurity for ICS, PCI DSS, NIS2 and GDPR.

Customers can use CyberVadis results to map the assessment of AWS to commonly used industry frameworks and standards to instantly gain visibility into controls coverage.

AWS customers can download the complete 2026 AWS Assessment Report directly through CyberVadis’s portal using their own account, or through AWS Artifact.

To learn more about our other compliance and security programs, see AWS Compliance Programs.

As an AWS customer, you can reach out to your AWS account team if you have any questions or feedback.

If you have feedback about this post, submit comments in the Comments section below.


Tari Dongo

Tariro Dongo

Tari is a Security Assurance Program Manager at AWS, based in London. She is responsible for third-party and customer audits, attestations, certifications, and assessments across EMEA. Tari has worked in security assurance and technology risk in the big four and financial services industry for over 15 years.

Amazon OpenSearch Service extends version lifecycle support timelines

Post Syndicated from Kuldeep Yadav original https://aws.amazon.com/blogs/big-data/amazon-opensearch-service-extends-version-lifecycle-support-timelines/

In November 2024, we announced Standard and Extended Support dates for legacy Elasticsearch versions (1.5 through 7.8) and OpenSearch versions (1.0 through 1.2, and 2.3 through 2.9) running on Amazon OpenSearch Service. At that time, Extended Support for these versions was set to end on November 7, 2026 (except Elasticsearch 5.6, for which Extended Support ends on November 7, 2028), after which domains would no longer receive security fixes or operating system patches.

Since that announcement, many customers have upgraded to newer versions. However, some customers need more time to plan and complete their migrations. To provide this flexibility, we are continuing security and operating system patch coverage for these versions for an additional 12 months, through November 7, 2027, at an updated support rate.

Today, we’re announcing two updates: Extended Support extension for present versions and End of Standard Support and Extended Support for additional versions.

Extended Support extension for present versions

We are continuing security and operating system patch coverage for Elasticsearch versions 1.5 through 7.8, OpenSearch versions 1.0 through 1.2, and OpenSearch versions 2.3 through 2.9 for an additional 12 months. Coverage will now continue through November 7, 2027, giving customers additional time to plan and execute their migrations to the latest OpenSearch versions.

From November 7, 2026, the Extended Support surcharge for these versions will effectively double your instance pricing for the extension period. Storage costs are not affected. Elasticsearch 5.6, for which existing Extended Support rates end on November 7, 2028, will continue at the standard Extended Support cost of $0.0065 per Normalized Instance Hour (NIH). During this period, these versions will continue to receive critical security patches and operating system updates.

See the following table for the updated Extended Support end dates.

Software version End of Standard Support Original End of Extended Support date Updated End of Extended Support date
Elasticsearch versions 1.5 and 2.3 November 7, 2025 November 7, 2026 November 7, 2027
Elasticsearch versions 5.1 to 5.5 November 7, 2025 November 7, 2026 November 7, 2027
Elasticsearch version 5.6 November 7, 2025 November 7, 2028 No change
Elasticsearch versions 6.0 to 6.7 November 7, 2025 November 7, 2026 November 7, 2027
Elasticsearch versions 7.1 to 7.8 November 7, 2025 November 7, 2026 November 7, 2027
OpenSearch versions 1.0 to 1.2 November 7, 2025 November 7, 2026 November 7, 2027
OpenSearch versions 2.3 to 2.9 November 7, 2025 November 7, 2026 November 7, 2027

We recommend that you upgrade to the latest available OpenSearch version.

End of Standard Support and Extended Support for additional versions

Today we are announcing end of Standard and Extended Support dates for Elasticsearch versions 6.8, 7.9, and 7.10, OpenSearch version 1.3, and OpenSearch versions 2.11 to 2.19. For future updates on versions in Standard Support and Extended Support, follow supported versions.

For OpenSearch versions running on Amazon OpenSearch Service, we provide at least 12 months of Standard Support after the end-of-support date for the corresponding upstream open source OpenSearch version. Alternatively, we provide 12 months of Standard Support after the release of the next minor version on Amazon OpenSearch Service, whichever is longer. This aligns with the open source OpenSearch maintenance policy.

We categorize these versions into two groups:

  • The last versions of each major version family (ES 6.8, ES 7.10, OS 1.3, OS 2.19) will receive 3 years of Extended Support at the standard Extended Support charge of $0.0065 per NIH.
  • All other minor versions with clear upgrade paths within the same major family (ES 7.9, OS 2.11, OS 2.13, OS 2.15, OS 2.17) will receive 1 year of Extended Support at the same standard rate of $0.0065 per NIH.

After Extended Support ends for a version, domains running that version will not receive bug fixes or security updates. The following table shows the end of Standard Support and Extended Support dates for Elasticsearch and OpenSearch versions.

Elasticsearch versions

Software version End of Standard Support End of Extended Support
Elasticsearch version 6.8 November 7, 2027 November 7, 2030
Elasticsearch version 7.9 November 7, 2027 November 7, 2028
Elasticsearch version 7.10 November 7, 2027 November 7, 2030

OpenSearch versions

Software version End of Standard Support End of Extended Support
OpenSearch version 1.3 November 7, 2027 November 7, 2030
OpenSearch version 2.11 November 7, 2027 November 7, 2028
OpenSearch version 2.13 November 7, 2027 November 7, 2028
OpenSearch version 2.15 November 7, 2027 November 7, 2028
OpenSearch version 2.17 November 7, 2027 November 7, 2028
OpenSearch version 2.19 November 7, 2027 November 7, 2030
OpenSearch version 3.1 and above Not announced Not announced

Upgrading OpenSearch Service domains: We recommend that you upgrade your domains to the latest available OpenSearch version to derive maximum value out of Amazon OpenSearch Service. Minor version upgrades on OpenSearch don’t contain breaking changes. These version upgrades are typically non-disruptive. We recommend moving to the latest minor version. See Upgrading OpenSearch Service domains for detailed instructions. You can also use the Migration Assistant for Amazon OpenSearch Service for upgrading to newer versions.

New domain creation: New domain creation will be blocked after Extended Support ends for each version.

Calculating Extended Support charges

Amazon OpenSearch Service domains running versions under Extended Support will be charged a flat additional fee per NIH. NIH is computed as a factor of the instance size (for example, medium or large), and the number of instance hours.

Depending on which version you are on, the Extended Support charges are as follows:

  • Versions that have been on Extended Support (ES 1.5–7.8 (other than ES 5.6), OS 1.0–1.2, OS 2.3–2.9) from November 7, 2026: Extended Support cost will be equal to your instance price. This will be in addition to the standard instance pricing, effectively doubling the instance cost. Storage costs are not affected. Example (for versions that have been on Extended Support from November 7, 2026): If you are running an m7g.medium.search instance priced at $0.068/hr (on-demand) in US East (N. Virginia) for 24 hours, your standard instance cost is $1.632/day ($0.068×24). The Extended Support surcharge for the extension period will be equal to your instance cost ($1.632/day), doubling your instance pricing to ~$3.264/day. Storage costs remain unchanged.
  • New versions coming under Extended Support (ES 6.8, 7.9, 7.10, OS 1.3, OS 2.11–2.19): $0.0065 per NIH (standard Extended Support rate). See the pricing page for exact pricing by Region. Example (new versions — standard rate): If you are running an m7g.medium.search instance for 24 hours in the US East (N. Virginia) Region, priced at $0.068 per instance hour (on-demand), you will typically pay $1.632 ($0.068×24). If you are running a version that is in Extended Support, you will pay an additional $0.0065 per NIH. This is computed as $0.0065 × 24 (instance hours) × 2 (normalization factor for medium) = $0.312 for Extended Support for 24 hours. The total amount you will pay for 24 hours is $1.944 ($1.632 + $0.312, excluding storage cost).

The following table shows the normalization factor for various instance sizes in OpenSearch Service.

Instance size Normalization Factor
nano 0.25
micro 0.5
small 1
medium 2
large 4
xlarge 8
2xlarge 16
4xlarge 32
8xlarge 64
9xlarge 72
10xlarge 80
12xlarge 96
16xlarge 128
18xlarge 144
24xlarge 192
32xlarge 256

Summary

The latest OpenSearch versions include new features, performance and resiliency improvements, and security enhancements. With today’s announcement, we are:

  • Continuing security and operating system patch coverage for present versions through November 7, 2027, giving customers additional time to complete their upgrades at a new Extended Support rate.
  • Announcing Standard and Extended Support timelines for the next set of versions (ES 6.8, 7.9, 7.10, OS 1.3, 2.11–2.19) with predictable cost visibility.

We recommend that you upgrade to the latest OpenSearch versions to get the most benefit out of OpenSearch Service. For any questions on Standard and Extended Support options, see the FAQs. For further questions, contact AWS Support.


About the authors

Kuldeep Yadav

Kuldeep Yadav

Kuldeep is a Principal Technical Program Manager at AWS. He’s passionate about driving innovation and complex problem solving. He works closely with teams and customers to ensure operational excellence and achieve more with less.

Arvind Mahesh

Arvind Mahesh

Arvind is a Senior Manager-Product at AWS (Amazon OpenSearch Service). With close to two decades of technology experience, he brings deep expertise across Analytics, Search, Cloud, Network Security, and Telecom.

Jon Handler

Jon Handler

Jon is a Senior Principal Solutions Architect at AWS. He works closely with OpenSearch and Amazon OpenSearch Service, guiding a broad range of customers looking to move their search and log analytics workloads to the AWS Cloud.

AWS partners with Anthropic and OpenAI to bring AWS Continuum into developer workflows

Post Syndicated from Chet Kapoor original https://aws.amazon.com/blogs/security/aws-partners-with-anthropic-and-openai-to-bring-aws-continuum-into-developer-workflows/

Customers have access to models that are continuously getting better with each new generation bringing larger context windows, stronger reasoning, and lower token costs. Getting the strongest AI-powered security will come from tools that combine the most relevant models with deep knowledge of a customer’s specific environment.

AWS Continuum for code vulnerabilities (Preview) is built to be that tool to help secure your code at machine speed. Today, we’re announcing a partnership with Anthropic and OpenAI that extends AWS Continuum directly into the developer workflows where code is being written: Anthropic Claude Code, OpenAI Codex, and Kiro. Developers can use these integrations to discover vulnerabilities, contextually prioritize, validate, and remediate, within their existing workflows.

Models are getting smarter

AI models are advancing rapidly. Each generation brings new capabilities, and different models excel at different tasks. The latest frontier models can now identify vulnerabilities and reason through multi-step attack paths that would take a human security team weeks to trace manually.

This is a genuine breakthrough in detection, but it creates a new challenge for your security teams: more findings, more complexity, and the need to determine which ones matter most in your environment and how to address them. The next challenge customers face is building the correct harness and orchestration to turn these models into a single interface that goes from detection through remediation. This is what we set out to do when creating Continuum, which brings together many different models and uses the model that’s most effective for each part of the process.

We also partner with the Frontier Model Forum, an industry consortium developing shared safety standards, evaluation methods, and benchmarking to ensure we can evaluate these models effectively together. We’re also working with model providers on shared security performance benchmarking to make sure we’re using the best model for each task within Continuum and our other AWS security products.

The harness

An AI harness is the orchestration layer that wraps around a model to connect it to tools, guardrails, memory, and workflows, so it delivers outcomes. Think of the model as the engine and the harness as everything around it. You need both to have a high-performance car.

Harnesses are becoming increasingly complex. Teams are stitching together multiple models, agents that call agents, and dynamic workflows, and are dealing with constant change driven by innovations in models, agent frameworks, and tool integrations.

As a result of that complexity, customers are implementing shadow infrastructure to manage integration layers across models and tools. Every time the landscape shifts, security and governance controls potentially break, forcing teams to go back to revisit them and make updates.

These challenges extend beyond the model. They arise in the orchestration required to connect different models and developer environments with tools, context, controls, and workflows across a customer’s environment. At AWS, we see managing that complexity as heavy lifting that AWS should solve. We treat the harness as infrastructure and with the same rigor we apply to identity, discovery, policy enforcement, observability, and compliance of the core infrastructure at AWS.

Enter Continuum

AWS Continuum for code vulnerabilities discovers vulnerabilities, prioritizes them within the context of a customer’s business, validates them in a sandbox, and provides remediation at machine speed. Under the hood, Continuum is an agent-team loop architecture. A sophisticated harness that orchestrates all of it: selecting the right model, connecting to a customer environment, and delivering secure code that’s been validated in context. You never need to think about how the orchestration works, or what changed in the latest release.

Anthropic and OpenAI partnerships

Today we’re announcing partnerships with Anthropic and OpenAI to bring Continuum into the developer workflows where code is being written.

How it works:

Within Claude Code, Codex, and Kiro coding environments, on-demand vulnerability scans identify potential issues and send findings to Continuum. Continuum prioritizes them within the context of the customer’s AWS environment (configurations, AWS Identity and Access Management (IAM) policies, network topology, and exposure surfaces) and validates them in a sandbox. It then returns prioritized, contextual intelligence back to the coding assistant, which adjusts its recommendations accordingly.

This collapses what was traditionally a multi-step, multi-team process (write, scan, triage, prioritize, fix, rescan) into a single outcome: the code suggestion itself. Two modes, one outcome:

  • For existing code: Use Continuum for code vulnerabilities from AWS to discover, prioritize, validate, and remediate across your environment.
  • For greenfield code: Use the Continuum plugin within Codex, Claude Code, or Kiro to get security-validated suggestions in your development environment.

Early design partners are already seeing results.

“AWS Continuum connects source code with enterprise knowledge, allowing teams to accurately pinpoint security vulnerabilities and verify that flagged issues are truly meaningful. This shortens what really matters: timeline to fix serious vulnerabilities.” – Mike Johnson, CISO, Rivian

Next

  • AWS Continuum for code vulnerabilities is available in preview through AWS. Sign up to request access at AWS Continuum.
  • Continuum integrated into Claude Code, Codex, and Kiro workflows are coming soon.

If you have feedback about this post, submit comments in the Comments section below.


Chet Kapoor

Chet Kapoor

Chet is Vice President of Search, Security, and Observability at Amazon Web Services. With more than two decades in enterprise technology, he has led companies through some of the industry’s most consequential platform shifts — from APIs and open source to cloud and AI — building and scaling businesses through periods of rapid growth, transformation, acquisition, and IPO. He brings a builder’s mindset, deep operational experience, and a strong customer orientation to helping organizations adopt emerging technologies securely and at scale.

From 2 weeks to 2 minutes: Amazon Cognito launches Provisioned limits for self-service rate limit management

Post Syndicated from Kiran Dongara original https://aws.amazon.com/blogs/security/from-2-weeks-to-2-minutes-amazon-cognito-launches-provisioned-limits-for-self-service-rate-limit-management/

Imagine preparing for your biggest sales event of the year, and you want to ensure your customer identity management service can handle the elevated traffic for carrying out application activities. For security teams, business leaders, and technologists managing identity infrastructure at scale, this scenario has been all too familiar. Whether you’re a CISO evaluating security controls, a CFO managing cloud costs, traditional support ticket processes for adjusting Amazon Cognito rate limits meant waiting 10–14 days for capacity increases, requiring teams to plan weeks in advance or rush to escalate.

Today, we’re announcing provisioned limits for Amazon Cognito, a capability that transforms how you manage authentication rate limits. This introduces a feature in the AWS Management Console for Amazon Cognito for on-demand capacity adjustments, working alongside the existing account-level maximum limits in AWS Service Quotas. Together, they give you self-service control over your authentication infrastructure so you can scale up for Black Friday (or similar sales events), scale down after tax season, and optimize costs with unprecedented precision. What once took up to 2 weeks now happens in minutes.

In this post, you’ll learn how provisioned limits work, the relationship between account-level maximums and provisioned capacity, the cost implications and optimization strategies, and step-by-step implementation guidance. This capability fundamentally changes how you approach authentication capacity planning.

Manual processes that can’t keep pace

Identity management services open the front door to your application. When users can’t sign in, everything else stops. Amazon Cognito offers extremely flexible limit management: customers can request adjustments as granular as 1 request per second (RPS) for as short as 1 day. As customer demand for faster, self-service adjustments grew, we identified opportunities to address the following challenges:

  • Support tickets required for each rate limit change
  • 10–14 day approval timelines for standard review and processing
  • Advance planning needed weeks ahead of anticipated traffic spikes

For businesses with seasonal traffic, like tax preparation services that see 90% of annual authentication volume in March and April, or ecommerce platforms preparing for Black Friday, these factors meant teams had to plan capacity decisions well in advance with limited ability to adjust in the moment.

Provisioned limits and account-level max limits

Starting July 6, 2026, Amazon Cognito introduced provisioned limits in the Amazon Cognito console. At the account level (per AWS Region, per account), you’ll find a Provisioned limits tab next to the User Pools tab. This gives you direct control over your authentication rate limits through two complementary mechanisms:

  • Provisioned limits (Amazon Cognito console) – Adjust your provisioned capacity up or down on-demand. Changes take effect immediately. You’re billed for the capacity you provision above the default limit, regardless of how much you use.
  • Account-level max limit (Service Quotas console) – Set your account’s ceiling, the maximum RPS your account is allowed to provision. Raising this ceiling doesn’t incur additional charges. Approximately 90% of requests are automatically approved within minutes. For larger limit increases (depending on the API category and Region), manual approval through AWS Support might still be required.

The following experience shows the end-to-end workflow of adjusting your provisioned limits and requesting a higher account-level max.

Figure 1: Provisioned limit experience workflow

Figure 1: Provisioned limit experience workflow

How they work together

Let’s use the UserCreation API as an example. The default limit is 50 RPS, and initially the provisioned limit is also 50 RPS—meaning billed capacity is 0 (no additional charge). The applied account-level max limit is also 50 RPS. So you have three values: default (50), provisioned limit (50), and account-level max (50).

  1. Start by going to the Amazon Cognito console and choosing User pools from the navigation pane.

    Figure 2: UserCreation with default values

    Figure 2: UserCreation with default values

  2. Choose Edit provisioned limit, to go to the Edit provisioned limit page with an input field for New provisioned limit. However, because the account-level max limit is 50 RPS, you can’t set the provisioned limit above 50. For example, if you want to provision 55 RPS, the console won’t allow it because 55 exceeds the current account max of 50.

    Figure 3: Editing the provisioned limit constraint constraint to more than the account-level max

    Figure 3: Editing the provisioned limit constraint constraint to more than the account-level max

  3. To set a higher limit, choose Request an increase. This takes you to the Service Quotas console, where you can choose Request increase at account level to request a higher account-level max, for example, 55 RPS. Most requests are automatically approved within minutes. At any time, you can check the status of the request using the Request history tab.

    Figure 4: Service Quotas page where the account-level max increase is requested and auto-approved

    Figure 4: Service Quotas page where the account-level max increase is requested and auto-approved

  4. After receiving approval, return to the Amazon Cognito console to edit your provisioned limit up to 55 RPS. Your billed capacity becomes 5 RPS (55 minus the 50 default).

    Figure 5: Provisioned after increasing the provisioned limit to 55 RPS, with billed capacity of 5 RPS.

    Figure 5: Provisioned after increasing the provisioned limit to 55 RPS, with billed capacity of 5 RPS.

This two-part model gives you precise control over both cost and capacity. Raising the account-level max in Service Quotas doesn’t incur additional charges—it only sets your ceiling. You are billed for what you provision in the Amazon Cognito console above the default, so you benefit from right-sizing your provisioned capacity to match expected demand. Raise your account max ahead of time to prepare for future scaling needs without incurring any cost. When the time comes, increase your provisioned limit to what you need, and scale back down after the event. You stop being charged for the extra capacity as soon as you reduce the provisioned limit. This applies equally to seasonal spikes, planned load tests, or unexpected viral growth—all self-service, all within minutes.

How the provisioned limits experience works

The provisioned limits experience introduces three key concepts that work together:

  • Default limit – The baseline rate included at no additional cost (for example, 50 RPS for UserCreation).
  • Provisioned limit – The capacity you actively request and reserve in the Amazon Cognito console. Because this capacity is reserved specifically for your account, it’s the chargeable dimension. You’re billed for any provisioned capacity above the default, regardless of how much you consume. For example, if the default is 50 RPS and you provision 80 RPS, you’re billed for 30 RPS even if your actual usage is only 60 RPS. If your provisioned capacity is 50 RPS (the default), your billed capacity is 0.
  • Applied account-level max limit – The ceiling managed through Service Quotas. This determines how high you can set your provisioned limit. Raising this ceiling doesn’t incur charges, it only unlocks the ability to provision higher capacity. Importantly, the Provisioned limits page displays each API category with its adjustability status. For example, UserCreation is marked Adjustable (shown earlier in Figure 5) and can be modified. However, UserList is marked Not adjustable, meaning the account-level max limit can’t be adjusted for that category. You can still see its default and provisioned limit on the page, but you can’t modify them. For adjustable categories, you will see the default limit, current provisioned limit, and billed capacity at a glance.
Figure 6: Provisioned limits overview with non-adjustable API categories.

Figure 6: Provisioned limits overview with non-adjustable API categories.

Multi-tenant SaaS considerations

For software as a service (SaaS) providers managing multiple tenants with varying throughput requirements, the UpdateProvisionedLimit API enables programmatic management of provisioned capacity. Teams using dedicated user pools per tenant, for example, can integrate this into their infrastructure-as-code pipelines to adjust provisioned limits per tenant tier. With provisioned limits, SaaS vendors can tier their capacity management per tenant, for example, provisioning higher capacity for enterprise-tier tenants and lower capacity for free-tier tenants, and adjust each tenant’s provisioned capacity independently through the API based on their service tier and demand patterns.

Conclusion

With provisioned limits, whether you’re preparing for peak shopping season, tax filing deadlines, or any other scaling event, you can now adjust provisioned limits to respond to your organization’s needs on demand. The separation between the account-level max (in Service Quotas) and the provisioned limit (in the Amazon Cognito console) gives you full control to plan ahead, respond to demand changes in minutes, and optimize costs on your own terms.

Get started

The provisioned limits experience for Amazon Cognito user pools launched on July 6, 2026, and is available across all AWS Regions where Amazon Cognito is supported. To get started:

  1. Review your current authentication traffic patterns using Amazon CloudWatch metrics to understand your baseline
  2. Set up CloudWatch alarms at 70% and 85% of your current rate limits
  3. Ensure your team has appropriate AWS Identity and Access Management ( IAM) permissions for both Service Quotas and the Provisioned limits tab in the Amazon Cognito console
  4. Raise your account-level max in Service Quotas based on your demand expectations
  5. Use the Amazon Cognito console Provisioned limits tab to adjust capacity up or down as needed

Resources:

Need help? Contact your AWS account team or visit AWS Support for assistance with planning your rate limit strategy.

If you have feedback about this post, submit comments in the Comments section below.


Kiran Dongara

Kiran is an Enterprise Solutions Architect at AWS, primarily supporting Retail, Restaurant, and CPG customers. His primary focus is application identity within the IAM domain. His expertise includes deep technical understanding across technical and industry domains, which he integrates to design scalable and efficient architectures using best practices. When not working, Kiran prioritizes family time, nature walks, and cycling.

Howie Li

Howie Li

Howie Li is a Product Manager at Amazon Web Services, where he strives to make authentication straightforward by default. Outside of work, Howie enjoys exploring cultures and food through travels and making new ice cream flavors inspired by them.

Amazon DynamoDB now supports real-time vector search at any scale

Post Syndicated from Esra Kayabali original https://aws.amazon.com/blogs/aws/amazon-dynamodb-now-supports-real-time-vector-search-at-any-scale/

Today, we’re announcing the general availability of vector search in Amazon DynamoDB. You can now store vector embeddings alongside your operational data in DynamoDB and run similarity searches directly against that data, without replicating it to a separate vector store.

DynamoDB supports native vector search with single-digit millisecond latency at 99%+ recall, and is designed for any scale, even trillions of vectors. There are no servers to provision, patch, or manage, and no software to install, maintain, or operate. The service has no versions, no maintenance windows, and zero downtime maintenance.

Vector indexes have no storage limits and scale horizontally as your data grows. You can now build applications that require semantic retrieval on agentic memory, retrieval augmented generation, recommendation engines, personalized experiences, anomaly detection, and more using DynamoDB and its native vector search.

If your application already uses DynamoDB, adding vector search previously required copying data into a dedicated vector database while maintaining a synchronization pipeline between the two services. This added operational overhead, data movement costs, licensing costs, and the challenge of maintaining predictable low latency at scale. With vector search built into DynamoDB, your vectors and operational data share the same serverless infrastructure and the same pay-per-request pricing model.

Vector search in DynamoDB introduces a new index type that you create on an attribute storing vector embeddings. You generate embeddings using a model of your choice, such as Amazon Bedrock Titan Text Embeddings, Cohere Embed, or OpenAI text embedding models, and store them as a list of floats in your table using a standard PutItem call. You then create a vector index on that attribute and specify the number of dimensions, the distance function, and any non-vector attributes you want to use as filters to narrow search results at query time. The SearchVectors API accepts a query vector, the number of results to return (up to 100), and optional filter conditions. It returns results ranked by similarity.

Use vector search in DynamoDB when your operational data already lives in DynamoDB and you want to add similarity search without provisioning a separate database or managing a synchronization pipeline. DynamoDB is fully serverless, so vector search scales automatically with no infrastructure to manage. It supports up to 4096 dimensions, Euclidean, Cosine, and Dot product distance functions, and inline filtering.

Getting started with vector search in DynamoDB
This walkthrough shows how to add vector search to an existing DynamoDB table using the DynamoDB console. The scenario contains an online sporting goods store with a product catalog table. Each item has standard operational attributes such as productId, category, description, marketplace, name, and price. The goal is to add semantic search so shoppers can find products using natural language queries rather than exact keyword matches.

1. Prepare DynamoDB table
To enable semantic search, I first generate vector embeddings for the product descriptions already in my table. Embeddings are numerical representations of text generated by a machine learning model that capture the meaning of the content. Two items with similar descriptions will have embeddings that are close to each other in vector space, which is what makes similarity search possible.

I can generate embeddings using Amazon Bedrock Titan Text Embeddings or another embedding model, then add them to my table using the AWS Management Console, AWS Command Line Interface (AWS CLI), AWS SDKs, AWS CloudFormation, or other infrastructure-as-code (IaC) tools.

For an existing table like ProductCatalog, I add the embeddings to each item as a new attribute named descriptionEmbedding using an UpdateItem call. DynamoDB stores vector embeddings using its existing List data type. Each element in the list is a Number that represents a single float value of the embedding vector. This means I do not need a new data type or schema change to start storing vectors alongside my existing operational attributes.

2. Create vector index
In the DynamoDB console, open the ProductCatalog table and choose the Indexes tab. I choose Create vector index. On the Create vector index page, I fill in the index details as follows. I enter ProductDescriptionIndex as the Index name and descriptionEmbedding as the Vector attribute.

I enter the number of Dimensions that matches my embedding model’s output and select Cosine as the Distance function. Cosine measures the angle between vectors rather than their magnitude, which makes it effective for comparing semantic similarity of text embeddings. Vector search in DynamoDB also supports Euclidean and Dot product distance functions.

  • Euclidean: Use when the magnitude of the vectors is meaningful, such as clustering items by a numeric value like purchase count.
  • Dot product: Use when both direction and magnitude matter, such as in recommendation systems that weight interest alignment and frequency together. As a general rule, match the distance function to the one used to train your embedding model for the best accuracy.

I enter marketplace as the Partition key. The vector index partition key controls how DynamoDB distributes vectors across partitions, allowing the index to scale out while maintaining predictable latencies. Each search is scoped to a single partition key value, so a product catalog serving multiple marketplaces can search within one marketplace’s inventory without scanning the entire index. The partition key is optional, but recommended for large datasets with high query throughput.

I expand Inline filter attributes and add category as a filter attribute. This helps me narrow search results to a specific product category at query time. Filter conditions support exact-match values only; range conditions such as BETWEEN or BEGINS_WITH are not supported. I leave Attribute projections set to All so that all table attributes are returned with my search results. Choose Create vector index and wait for the index status to change to Active.

3. Run vector search
I generate a query vector from a natural language search term such as “lightweight running shoes for summer” using the same embedding model I used for the product descriptions. In the DynamoDB console, I choose Explore items in the left navigation pane and select the ProductCatalog table.

Choose Search to switch to vector search mode. I select ProductDescriptionIndex from the Select a vector index dropdown, paste the query vector into the Search vector field, and set Number of results (Top K) to 5. I enter US as the Partition key value to scope the search to the US marketplace. I expand Inline filter attributes and set category equal to footwear to narrow the search to footwear products only. Now, choose Run.

DynamoDB returns the five most semantically similar products in the footwear category, ranked by similarity score, alongside the standard operational attributes such as name and price in the same response. The similarity score’s meaning depends on the distance function selected for the index. For Cosine and Euclidean distance functions, lower similarity score values indicate higher similarity, with a score of 0 indicating identical vectors. For the dot product distance function, higher similarity score values indicate higher similarity.

To interact with vector search programmatically, including calling APIs and searching documentation, try the AWS MCP Server and plugins with your preferred AI coding tool. To learn more, visit the Amazon DynamoDB Developer Guide.

Get started today
Vector search in Amazon DynamoDB is generally available in all commercial AWS Regions, including the AWS GovCloud (US) Regions. For Regional availability and a future roadmap, visit the AWS Capabilities by Region. For pricing details, visit the Amazon DynamoDB pricing page.

Start exploring vector search in DynamoDB today and send feedback to AWS re:Post for Amazon DynamoDB or through your usual AWS Support contacts.

— Esra

Spring 2026 PCI DSS and PCI 3DS compliance packages for AWS now available

Post Syndicated from Will Black original https://aws.amazon.com/blogs/security/spring-2026-pci-dss-and-pci-3ds-compliance-packages-for-aws-now-available/

Amazon Web Services (AWS) is pleased to announce the successful completion of our Payment Card Industry (PCI) Data Security Standard (DSS) and Three Domain Secure (3DS) certifications. As part of this renewal, we have expanded the scope to include three additional AWS services and one additional AWS Region:

Newly added AWS services:

Newly added AWS Region:

  • Asia Pacific – New Zealand

This certification means that customers can use these services while maintaining PCI DSS and PCI 3DS compliance, enabling innovation without compromising security. The full list of services can be found on the AWS Services in Scope by Compliance Program page.

The PCI DSS and PCI 3DS compliance packages include two key components for each certification:

  • Attestation of Compliance (AOC) – demonstrates that AWS was successfully validated against the PCI DSS and PCI 3DS standards.
  • AWS Responsibility Summary – provides guidance to help AWS customers understand their responsibility in developing and operating a highly secure environment on AWS for handling payment card data.

AWS was evaluated by Coalfire, a third-party Qualified Security Assessor (QSA).

This refreshed certification offers customers greater flexibility in deploying regulated workloads while reducing compliance overhead. Customers can access the PCI DSS and PCI 3DS report packages through AWS Artifact. This self-service portal provides on-demand access to AWS compliance reports, streamlining audit processes.

To learn more about our PCI programs and other compliance and security programs, see the AWS Compliance Programs page.

As always, we value your feedback and questions; reach out to the AWS Compliance team through the Compliance Support page.

If you have feedback about this post, submit comments in the Comments section below. If you have questions about this post, contact AWS Support.


Will Black

Will Black

Will is a Compliance Program Manager at AWS where he leads multiple security and compliance initiatives. Will has 10 years of experience in compliance and security assurance and holds a degree in Management Information Systems from Temple University. Additionally, he is a PCI Internal Security Assessor (ISA) for AWS and holds the CCSK and ISO 27001 Lead Implementer certifications.

Introducing Apache Spark troubleshooting agent for Amazon EMR on EKS

Post Syndicated from Vara Bonthu original https://aws.amazon.com/blogs/big-data/introducing-apache-spark-troubleshooting-agent-for-amazon-emr-on-eks/

Debugging a failed Apache Spark application on Amazon EMR on EKS often means correlating signals from several places at once. These signals include Spark driver and executor pod logs, Spark event logs, and container termination signals that surface as pod exit codes rather than clear Spark errors. For example, a single out-of-memory failure can appear as a Kubernetes exit code 137 with no obvious link back to the line of code or configuration that caused it. This cross-system investigation can extend a single incident’s mean-time-to-resolution (MTTR) to days and requires deep Spark and Kubernetes expertise.

We recently announced Amazon EMR on EKS now supports Apache Spark troubleshooting agent extending the Apache Spark troubleshooting agent to support Amazon EMR on EKS. The agent already helps data engineers diagnose Spark failures on Amazon EMR on EC2, Amazon EMR Serverless, and AWS Glue using natural language prompts. With this launch, you can now point the same workflow at a failed Amazon EMR on EKS job run. From a single natural language prompt, the agent automatically retrieves your Spark logs from Amazon Simple Storage Service (Amazon S3) or Amazon CloudWatch (depending on your job’s logging configuration) along with Spark History Server Event log data, identifies the root cause, and recommends a fix when the failure is code-related. This can help reduce incident MTTR from days to minutes. Amazon EMR on EKS customers can use the agent at no additional cost. You only pay for your existing Amazon EMR on EKS resources.

In this post, we show you how to set up the agent for Amazon EMR on EKS and walk through troubleshooting a failed job run. We demonstrate the workflow from both the Amazon EMR console and an AI assistant that supports the Model Context Protocol (MCP), an open standard for connecting AI assistants to external tools and data.

How the troubleshooting agent works on Amazon EMR on EKS

The troubleshooting agent exposes a single interface to diagnose failed Spark applications across Amazon EMR on EKS, Amazon EMR on EC2, Amazon EMR Serverless, AWS Glue, and Amazon SageMaker notebooks. Instead of navigating different consoles, APIs, and log locations for each service, you describe your failed job in natural language, and the agent handles the rest. You can reach the agent from the Amazon EMR console or from MCP-compatible AI assistants, such as Kiro CLI, Kiro IDE, or Claude Code. We walk through both later in this post.

The troubleshooting agent runs as a fully managed MCP server, so you do not need to deploy or maintain a local MCP server. It uses a single-tenant design to keep your application data and code isolated. Operations are read-only and governed by AWS Identity and Access Management (IAM) permissions. The agent can only access the resources and actions your IAM role grants. Tool calls are automatically logged to AWS CloudTrail for complete auditability.

Architecture of the Spark troubleshooting agent running as a managed MCP server with read-only IAM access and CloudTrail logging

What’s specific to Amazon EMR on EKS is how the agent gathers its inputs. On Amazon EMR on EKS, your Spark driver and executor logs can be delivered to Amazon S3, Amazon CloudWatch Logs, or both, depending on your job’s monitoring configuration. The agent handles both sources automatically:

  • Driver and executor pod logs in Amazon S3 – When your job is configured with S3 monitoring, the agent reads the Spark event logs and the per-container stderr/stdout logs from your S3 log location, including discovering executor pod logs.
  • Driver and executor container logs in Amazon CloudWatch – When your job is configured with CloudWatch monitoring, the agent reads the driver and executor container log streams directly from your CloudWatch log group.
  • Spark History Server (SHS) data through the Amazon EMR Persistent UI – For the richer SHS signals (query plans, executor timelines, stage metrics, and configurations), the agent connects to the Amazon EMR Persistent UI for your job run, the same mechanism used for Amazon EMR on EC2.

Drawing on years of AWS experience running millions of Spark applications at scale, the agent extracts the relevant features and signals from these sources, work that would otherwise require manual correlation across Amazon S3, Amazon CloudWatch, and the Spark UI. It then uses a large language model on Amazon Bedrock, grounded in a managed knowledge base of Spark and AWS troubleshooting expertise through Retrieval Augmented Generation (RAG), to produce a root cause analysis and, when the failure is code-related, a code recommendation.

The large language model (LLM), the knowledge base, and the retrieval that connects them are fully managed as part of the agent. There’s nothing for you to provision, host, or tune. This managed inference is provided at no additional cost for Amazon EMR on EKS. You pay only for the AWS resources you already use to run your Spark applications and to validate recommended changes.

The agent extracting signals from Amazon S3 and Amazon CloudWatch and using an Amazon Bedrock model with a knowledge base to produce a root cause analysis

Getting started

You can use the agent from either the Amazon EMR console or an MCP client. Both rely on setting up a single IAM role. The following sections walk through creating that role and then troubleshooting a failed job run with each method.

Set up IAM permissions

The IAM role grants the agent read access to the diagnostic sources it analyzes, such as your Amazon EMR on EKS job runs, the Amazon EMR Persistent UI, and your Spark logs in Amazon S3 and Amazon CloudWatch. Creating this role is the only setup required for the console experience. The MCP client path has a few additional prerequisites, covered later in the section on troubleshooting from an MCP client.

To run the commands in this section, you need the AWS Command Line Interface (AWS CLI) (version 2.30.0 or later) installed and configured with your AWS credentials. For instructions, see Setting up the AWS CLI.

Step 1: Create the IAM role

The agent uses your IAM role to authorize operations at the AWS service level. It can only access what your role allows. Create a role your account can assume, then attach a policy granting the permissions the agent needs for Amazon EMR on EKS.

First, set some variables for the commands that follow. ACCOUNT_ID is derived from your configured credentials. Set REGION to the AWS Region where you run your Amazon EMR on EKS workloads:

ACCOUNT_ID=$(aws sts get-caller-identity --query Account --output text)
REGION=us-east-2   # replace with your Region

Create a trust policy that allows your account to assume the role, and create the role:

cat > mcp-trust-policy.json << EOF
{
  "Version": "2012-10-17",
  "Statement": [
    {
      "Sid": "AllowAccountToAssumeRole",
      "Effect": "Allow",
      "Principal": { "AWS": "arn:aws:iam::${ACCOUNT_ID}:root" },
      "Action": "sts:AssumeRole"
    }
  ]
}
EOF

aws iam create-role \
  --role-name SparkTroubleshootingMCPRole \
  --assume-role-policy-document file://mcp-trust-policy.json

Step 2: Attach Amazon EMR on EKS permissions

Create and attach a policy granting the agent read access to your Amazon EMR on EKS job runs, the Amazon EMR Persistent UI, and your S3 and CloudWatch logs. Replace amzn-s3-demo-logging-bucket with the name of your logging bucket and replace my_log_group_name and my_log_stream_prefix with your CloudWatch log group name and log stream prefix, respectively.

cat > emr-eks-policy.json << EOF
{
  "Version": "2012-10-17",
  "Statement": [
    {
      "Sid": "EMREKSReadAccess",
      "Effect": "Allow",
      "Action": [
        "emr-containers:DescribeJobRun",
        "emr-containers:DescribeVirtualCluster",
        "emr-containers:ListJobRuns",
        "emr-containers:ListVirtualClusters"
      ],
      "Resource": ["*"]
    },
    {
      "Sid": "EMREKSPersistentApp",
      "Effect": "Allow",
      "Action": [
        "elasticmapreduce:CreatePersistentAppUI",
        "elasticmapreduce:DescribePersistentAppUI",
        "elasticmapreduce:GetPersistentAppUIPresignedURL"
      ],
      "Resource": ["*"]
    },
    {
      "Sid": "EMREKSS3LogAccess",
      "Effect": "Allow",
      "Action": ["s3:GetObject", "s3:ListBucket"],
      "Resource":[
        "arn:aws:s3:::amzn-s3-demo-logging-bucket",
        "arn:aws:s3:::amzn-s3-demo-logging-bucket/*"
      ]
    },
    {
      "Sid": "EMREKSCloudWatchLogAccess",
      "Effect": "Allow",
      "Action": [
        "logs:GetLogEvents",
        "logs:DescribeLogGroups",
        "logs:DescribeLogStreams"
      ],
      "Resource": [
        "arn:aws:logs:*:*:log-group:my_log_group_name:log-stream:my_log_stream_prefix/*"
      ]
    }
  ]
}
EOF

aws iam put-role-policy \
  --role-name SparkTroubleshootingMCPRole \
  --policy-name EMREKSTroubleshootingAccess \
  --policy-document file://emr-eks-policy.json

Note: If you prefer an automated setup, an AWS CloudFormation template that creates this role with the required permissions is available in the setup documentation. The previous CLI steps give you the same result with finer control over each permission.

Troubleshooting a failed Amazon EMR on EKS job run

You can reach the troubleshooting agent two ways: directly from the Amazon EMR console, or from an MCP-compatible AI assistant such as Claude Code. We walk through both, using two different failures to show the range of what the agent diagnoses.

Option 1: Troubleshoot from the Amazon EMR console

The console offers the fastest path. Once you’ve created the IAM role in the Set up IAM permissions section, no additional setup is required. Here we troubleshoot a job that failed with a driver out-of-memory error. The application generates a large dataset and calls collect() to pull it back to the driver, exceeding the configured spark.driver.maxResultSize of 512 MiB.

  1. Open the Amazon EMR console, choose Virtual clusters (under Amazon EMR on EKS), and select the virtual cluster that ran your job.
  2. In the Jobs list, find your failed job run and choose its Failed status. This opens a popover with a Troubleshoot with AI button.

The failed job run popover in the Amazon EMR console with the Troubleshoot with AI button

  1. Choose Troubleshoot with AI. The agent analyzes the job and returns its findings directly on the console, namely the analysis insights, a root cause, and a recommendation. For this job, it identifies that the collect() operation on line 24 attempts to materialize the full result set on the driver, exceeding the spark.driver.maxResultSize safety limit. This fails the job before an actual driver out-of-memory crash. Because the failure stems from the application code, the agent also returns a code recommendation: a before-and-after diff that replaces the collect() call with a distributed write to the destination path. Executors then persist their partitions in parallel instead of funneling the data through the driver.

Agent results in the console showing the root cause and a before-and-after code recommendation for the collect() failure

Option 2: Troubleshoot from an MCP client (Claude Code)

You can also use the agent from MCP-compatible AI assistants. This option requires a one-time setup to connect the assistant to the agent’s MCP servers, and it unlocks a conversational workflow where the agent chains from analysis into a concrete code fix. In this walkthrough, we use Claude Code.

Prerequisites

In addition to the IAM role from the Set up IAM permissions section, the MCP client path requires:

  • Python 3.10 or higher.
  • The uv package manager. For instructions, see Installing uv.
  • Claude Code installed. For instructions, see Install Claude Code. You can also use another MCP-compatible AI assistant such as Kiro CLI or Kiro IDE.

Configure an AWS CLI profile

Configure a profile that assumes the IAM role you created, so the MCP servers call AWS with the agent’s permissions:

export IAM_ROLE=arn:aws:iam::${ACCOUNT_ID}:role/SparkTroubleshootingMCPRole
export SMUS_MCP_REGION=${REGION}

aws configure set profile.smus-mcp-profile.role_arn ${IAM_ROLE}
aws configure set profile.smus-mcp-profile.source_profile default
aws configure set profile.smus-mcp-profile.region ${SMUS_MCP_REGION}

Add the MCP servers

The troubleshooting agent provides two tools through two MCP servers: analyze_spark_workload (workload analysis and root cause) and spark_code_recommendation (code fixes). Add both to your assistant.

For Claude Code:

claude mcp add sagemaker-unified-studio-mcp-troubleshooting \
    -- uvx mcp-proxy-for-aws@latest \
    https://sagemaker-unified-studio-mcp.${SMUS_MCP_REGION}.api.aws/spark-troubleshooting/mcp \
    --service sagemaker-unified-studio-mcp --profile smus-mcp-profile \
    --region ${SMUS_MCP_REGION} --read-timeout 180

claude mcp add sagemaker-unified-studio-mcp-code-rec \
    -- uvx mcp-proxy-for-aws@latest \
    https://sagemaker-unified-studio-mcp.${SMUS_MCP_REGION}.api.aws/spark-code-recommendation/mcp \
    --service sagemaker-unified-studio-mcp --profile smus-mcp-profile \
    --region ${SMUS_MCP_REGION} --read-timeout 180

Verify your setup by running the /mcp command in Claude Code to confirm the sagemaker-unified-studio-mcp-troubleshooting and sagemaker-unified-studio-mcp-code-rec servers are connected and their tools are available.

For Kiro CLI:

# Add the Spark Troubleshooting MCP server
kiro-cli-chat mcp add \
    --name "sagemaker-unified-studio-mcp-troubleshooting" \
    --command "uvx" \
    --args "[\"mcp-proxy-for-aws@latest\",\"https://sagemaker-unified-studio-mcp.${SMUS_MCP_REGION}.api.aws/spark-troubleshooting/mcp\", \"--service\", \"sagemaker-unified-studio-mcp\", \"--profile\", \"smus-mcp-profile\", \"--region\", \"${SMUS_MCP_REGION}\", \"--read-timeout\", \"180\"]" \
    --timeout 180000 \
    --scope global

# Add the Spark Code Recommendation MCP server
kiro-cli-chat mcp add \
    --name "sagemaker-unified-studio-mcp-code-rec" \
    --command "uvx" \
    --args "[\"mcp-proxy-for-aws@latest\",\"https://sagemaker-unified-studio-mcp.${SMUS_MCP_REGION}.api.aws/spark-code-recommendation/mcp\", \"--service\", \"sagemaker-unified-studio-mcp\", \"--profile\", \"smus-mcp-profile\", \"--region\", \"${SMUS_MCP_REGION}\", \"--read-timeout\", \"180\"]" \
    --timeout 180000 \
    --scope global

Verify with the /tools command in Kiro CLI to confirm the analyze_spark_workload and spark_code_recommendation tools are available.

Run the agent

For this walkthrough, we troubleshoot a different failure to show how the agent chains from analysis into a concrete code fix. The job is a small PySpark application that reads a CSV file into a DataFrame and registers it as a temporary view named people. It runs a Spark SQL query to uppercase the Name column before displaying the results. The job run failed because the query calls UPPERX, a function that doesn’t exist in Spark SQL (it’s a typo for the built-in UPPER).

From the Claude Code terminal (or MCP-compatible assistants), describe your failed job run in natural language, providing the virtual cluster ID and job run ID:

Debug my EMR on EKS job with job run id <jr-id> and virtual cluster id <vc-id> in <region>

The agent invokes the analyze_spark_workload tool, which automatically:

  1. Calls the Amazon EMR on EKS API to retrieve your job run’s configuration and determine where its logs are stored.
  2. Retrieves your Spark logs from Amazon S3 or Amazon CloudWatch, depending on your job’s logging configuration.
  3. Connects to the Amazon EMR Persistent UI to extract Spark UI features such as the execution plan, stage metrics, and executor timelines.
  4. Analyzes the correlated signals and returns a root cause explanation.

For this job, the agent returns:

Root cause: SQL function error. Your Spark SQL query references a function UPPERX that doesn’t exist in an available function catalog (system.builtin, system.session, or spark_catalog.default). Category: SQL_ERROR. The job failed because the function name can’t be resolved. UPPERX is almost certainly a typo for the built-in UPPER function.

Because the failure is code-related, the agent then chains into the spark_code_recommendation tool, which produces a concrete before-and-after fix:

  df.createOrReplaceTempView("people")

- result = spark.sql("SELECT UPPERX(Name) FROM people")
+ result = spark.sql("SELECT UPPER(Name) FROM people")
  result.show()

  spark.stop()

The two tools work together. analyze_spark_workload identifies the root cause, and when the failure stems from the application code, spark_code_recommendation returns the exact edit to make. You review the recommendation and apply it with full control over the change. The agent only provides the analysis and recommendations.

Supported failure categories

The troubleshooting agent diagnoses a wide range of Apache Spark failures on Amazon EMR on EKS, including:

  • Out-of-memory and resource exhaustion – Driver and executor out-of-memory errors, including driver-side failures from operations like collect() and executor terminations that surface as Kubernetes pod exit codes (such as exit code 137).
  • Data skew and shuffle issues – Uneven partitioning and shuffle failures that concentrate work on a few executors.
  • Configuration errors – Misconfigured Spark settings that lead to failures or inefficiency.
  • Code-level issues – Problems such as incorrect API usage, unbounded collect() calls, and user-defined function (UDF) errors, for which the agent can recommend code fixes.

Code recommendations are supported for PySpark workloads on Amazon EMR on EKS, Amazon EMR on EC2, Amazon EMR Serverless, and AWS Glue.

Conclusion

With support for Amazon EMR on EKS, the Apache Spark troubleshooting agent gives platform and data engineering teams a shared workflow for investigating failed Spark applications. By bringing together Spark and Kubernetes diagnostic signals, the agent can reduce manual investigation and repeated handoffs between teams, helping engineers identify likely causes and corrective actions faster.

There’s no additional charge for using the troubleshooting agent, including the large language model used through Amazon Bedrock. You pay only for the AWS resources used to run your Spark applications and validate recommended changes.

To get started:


About the authors

Vara Bonthu

Vara Bonthu

Vara is a Principal Open Source Specialist SA leading Data on EKS at AWS, driving open source initiatives and helping AWS customers to diverse organizations. He specializes in open source technologies, data analytics, AI/ML, and Kubernetes, with extensive experience in development, DevOps, and architecture.

Maheedhar Reddy Chappidi

Maheedhar Reddy Chappidi

Maheedhar is a Senior Software Development Engineer at AWS Analytics. He is passionate about building fault-tolerant, reliable distributed systems at scale and generative AI applications for data integration. Outside of work, Maheedhar enjoys listening to podcasts and playing with his two-year-old child.

Layth Yassin

Layth Yassin

Layth is a Software Development Engineer at AWS Analytics. He’s passionate about building distributed systems and generative AI solutions for data integration problems. Outside of work, he enjoys playing/watching basketball, and spending time with friends and family.

Andrew Kim

Andrew Kim

Andrew is a Software Development Engineer at AWS Analytics, with a deep passion for distributed systems architecture and AI-driven solutions, specializing in intelligent data integration workflows and cutting-edge feature development on Apache Spark. Andrew focuses on re-inventing and simplifying solutions to complex technical problems, and he enjoys creating side projects and producing music in his free time.

Kartik Panjabi

Kartik Panjabi

Kartik is a Software Development Manager at AWS Analytics. His team builds generative AI features for the Data Integration and distributed system for data integration.

Weijing Cai

Weijing Cai

Weijing is a Software Development Engineer at AWS Analytics. She is passionate about distributed systems and generative AI, and their intersection in building intelligent, scalable solutions for data integration.

Jeremy Samuel

Jeremy Samuel

Jeremy is a Software Development Engineer at AWS Analytics. He has a strong interest in creating distributed systems and generative AI. In his spare time, he enjoys playing video games and listening to music.

Shawn Huang

Shawn Huang

Shawn is a Software Engineer working on the Amazon EMR on EKS service, where he develops scalable and reliable solutions for running big data workloads on Kubernetes.

Siddharth Kumar

Siddharth Kumar

Siddharth is a Software Development Engineer for Amazon EMR at Amazon Web Services, where he works across the Amazon EMR on EKS service. He helps build and operate the systems that let customers run Spark workloads on Amazon Elastic Kubernetes Service (Amazon EKS) at scale, with a focus on making them easier to run, monitor, and scale. Outside of work, Siddharth enjoys watching anime, swimming, and hiking.

HIPAA Security Rule on AWS – Technical Safeguards Implementation and Readiness Guidance

Post Syndicated from Abdul Javid original https://aws.amazon.com/blogs/security/hipaa-security-rule-on-aws-technical-safeguards-implementation-and-readiness-guidance/

Today, we’re releasing the HIPAA Security Rule on AWS: Technical Safeguards Implementation and Readiness Guidance. This helps covered entities and business associates configure, implement, and evidence compliance with the HIPAA Security Rule Technical Safeguard requirements (45 CFR §164.312) when building healthcare workloads on AWS.

The HIPAA Security Rule’s Technical Safeguards (§164.312) define five standards and nine implementation specifications covering access control, audit controls, integrity, authentication, and transmission security.

The guidance also covers the 2025 NPRM proposed changes, including encryption at rest and in transit becoming required, multi-factor authentication (MFA) becoming mandatory for all electronic Personal Health Information (ePHI) access, and new specifications for network segmentation, configuration management, anti-malware protection, patch management, software removal, incident response and breach notification.

Key topics included

  • Shared responsibility for HIPAA on AWS – A responsibility matrix mapping each §164.312 specification to what AWS manages nd what the customer must configure and operate.
  • ePHI boundary architecture – Guidance on establishing a defined ePHI boundary
  • ePHI data flow and encryption – A reference architecture tracing ePHI with the applicable §164.312 specification
  • Foundation checklist – Prerequisite recommendation before configuring individual Technical Safeguard controls.

This guidance is written for cloud architects, security engineers, CISOs, and compliance teams at covered entities and business associates building or operating AWS healthcare workloads. It assumes familiarity with AWS services and is intended as a practical implementation reference, not a legal or regulatory interpretation. This guidance focuses exclusively on Technical Safeguards.

HHS published a Notice of Proposed Rulemaking in January 2025, proposing significant updates to the HIPAA Security Rule—including eliminating the Addressable designation, making encryption, MFA, and asset inventory mandatory, and introducing new technical requirements not present in the current rule. As of June 2026, the final rule has not been published. This guidance covers both the current rule and the proposed changes and recommends treating all specifications as Required for new workloads.

Download HIPAA Security Rule on AWS: Technical Safeguards Implementation and Readiness Guidance.

For questions about HIPAA readiness on AWS, including Administrative Safeguards, Physical Safeguards, risk analysis, and assessment preparation, contact the AWS Security Assurance Services team or your AWS account representative.

This guidance is provided by AWS Security Assurance Services, LLC, a HITRUST External Assessor Firm and PCI-QSAC along with contribution from AWS HCLS, AWS Compliance teams. It is for informational and guidance purposes only and does not constitute legal, regulatory, or compliance advice. Recipients are solely responsible for determining applicability to their specific environments and legal obligations.

If you have feedback about this post, submit comments in the Comments section below.


Abdul Javid

Abdul Javid

Abdul is a Senior Security Assurance Consultant at AWS Security Assurance Services. He holds HITRUST certifications and has led HITRUST r2 and i1 engagements across multiple healthcare technology companies. Abdul holds multiple security and auditing certifications and supports customers building responsible AI governance programs on AWS. He has over 25 years of experience and holds certifications across AWS, CMMC, PCI DSS, PMI, ISC2, and ISACA.

Shreya Singh

Shreya Singh

Shreya is a Security Assurance Consultant at AWS with more than eight years of experience in governance, risk, compliance, and cloud security. She holds the CISA and HITRUST Certified CSF Practitioner (CCSFP) certifications and supports healthcare and technology organizations with HITRUST, HIPAA, SOC 2, risk management, and audit readiness initiatives.She holds a Master of Engineering in Cybersecurity from the University of Maryland, College Park.

Kapil Temghare

Kapil Temghare

Kapil is a Security Industry Specialist at AWS with over 10 years of experience spanning compliance, cloud security, and regulatory operations. He manages HIPAA compliance within the Regulatory Operations Center (ROC), including service eligibility assessments, controls validation, and compliance sign-off. Beyond healthcare, Kapil supports various regulatory programs such as FedRAMP and the EU Data Act and holds CISSP certification.

Hector Rodriguez

Hector Rodriguez

Hector is a Principal Industry Specialist and Executive Security Advisor, AWS Health & Life Sciences. He has over 25 years of experience enabling Health & Life Sciences business and clinical transformation and innovation and with multiple industry and academic groups. He is a board advisor for healthcare startups, a founding member of the HITRUST Business Associate Council and a health industry and cybersecurity curriculum advisor and lecturer.

Deliver Apache Kafka data to streaming tables for Apache Iceberg with Amazon MSK Express brokers

Post Syndicated from Shakhi Hali original https://aws.amazon.com/blogs/big-data/deliver-apache-kafka-data-to-streaming-tables-for-apache-iceberg-with-amazon-msk-express-brokers/

Today, we are announcing delivery to streaming tables on Apache Iceberg for Amazon Managed Streaming for Apache Kafka (Amazon MSK) Express brokers, a fully managed capability that continuously materializes your streaming data as queryable Apache Iceberg tables on Amazon S3 Tables, a capability of Amazon Simple Storage Service (Amazon S3). With delivery to streaming tables, you no longer need to deploy, scale, or maintain Kafka connectors, Flink jobs, or custom consumers to make your streaming data available for analytics. You select a Kafka topic, choose S3 Tables as your destination, and your data becomes a read-only Iceberg table queryable from Amazon Athena, Amazon Redshift, and Apache Spark within minutes. Delivery to streaming tables provides up to 60% cost savings compared to self-managed alternatives. It also reduces downstream query costs by up to 30% through optimized file sizing, without writing a single line of code or managing any infrastructure. Because this capability delivers to S3 Tables registered in AWS Glue Data Catalog, your tables are automatically discoverable through Glue Data Catalog Business Context and Semantic Search (preview). Data stewards can enrich streaming tables with business descriptions, glossary terms, and skill assets. AI agents can then discover and reason in real time using semantic search grounded in trusted business definitions rather than raw schema inference.

In addition to S3 Tables, you can deliver Amazon MSK streaming data to general purpose Amazon S3 buckets in source data format. Data delivery to general purpose Amazon S3 buckets enables workloads like archival, backup, or ML training data delivery. This provides a price-performant, serverless, and scalable way to deliver streaming data as-is to your general purpose Amazon S3 buckets.

Challenges with delivering streaming data to Apache Iceberg

Customers today face three critical challenges when integrating streaming data with Apache Iceberg. First, ease of use: customers must manage complex Kafka Connect deployments, handle frequent pipeline failures, maintain custom configurations, handle data format conversions, and manage pipeline infrastructure for data delivery. These operational tasks consume significant engineering time and introduce ongoing risk of downtime. Second, resiliency: without proper coordination, simultaneous writes from multiple high-throughput Kafka partitions can conflict with each other, leading to failed commits, data freshness delays, and performance issues. Streaming ingestion of high-volume data creates large numbers of small Parquet files in Iceberg tables, significantly degrading query performance and forcing a difficult trade-off between data freshness and query efficiency. Third, price performance can become a bottleneck to enriching your data lake with streaming data into. With delivery to streaming tables, pricing is predictable, and up to 60% lower than self managed Kafka deployments, lowering the barrier to getting real-time context to your data agents.

How delivery to streaming tables solves these challenges

Delivery to streaming tables is a native capability built directly into Amazon MSK Express brokers. It addresses each challenge directly: it eliminates operational complexity by removing the need to deploy, configure, or maintain pipeline infrastructure, you enable it with a few clicks. It provides built-in write coordination and exactly-once delivery semantics, resolving concurrent writer conflicts and supporting data integrity without manual intervention. And it performs intelligent inline compaction during ingestion, producing query-optimized Parquet files that eliminate the small-file problem while maintaining minute-level data freshness. The capability automatically scales to process gigabytes per second of throughput.

End-to-end managed streaming analytics architecture

With delivery to streaming tables, you now have a fully managed end-to-end real-time data architecture from data ingestion through storage to analytics. Your producers publish events to Amazon MSK Express brokers, which continuously deliver data as optimized Iceberg read-only tables in S3 Tables, registered automatically on AWS Glue Data Catalog. From there, you can query your streaming data using analytics engines like Amazon Athena, Amazon Redshift, Amazon EMR (Apache Spark), or Apache Flink . You can also let AI agents discover and reason over your data through Glue Data Catalog semantic search. This managed experience eliminates the intermediate infrastructure that customers previously assembled, no separate connector clusters, no compaction jobs, no custom consumers, replacing it with a single, serverless pipeline from stream to insight.

The following diagram illustrates this end-to-end architecture.

End-to-end streaming architecture from Amazon MSK Express brokers to Iceberg tables in Amazon S3 Tables, queried by Athena, Redshift, EMR, and Flink

Getting started

To get started, log into the Amazon MSK console, navigate to your Amazon MSK Express cluster, and enable delivery to streaming tables with a few clicks. Specify the Kafka topic you want to deliver, configure your schema settings using AWS Glue Schema Registry, and choose your destination. Destinations can be either fully managed Iceberg tables in S3 Tables or self-managed Iceberg tables in general purpose S3 buckets. Once enabled, delivery to streaming tables immediately begins materializing your Kafka data as queryable Iceberg tables in S3 with no further intervention required.

Additionally, you can use Amazon MSK APIs to programmatically set up, update, or delete delivery to streaming tables configurations for your Kafka topics. This allows teams to build agentic workflows and infrastructure-as-code patterns for teams managing configurations across multiple clusters and topics at scale.

Getting started with the streaming tables Agent Skill

The streaming tables Agent Skill provides AI-assisted guidance for setting up streaming tables integrations for your existing or new topics in Amazon MSK Express cluster. The skill helps you configure delivery to S3 Tables (Iceberg) or S3, including schema registry setup, IAM role configuration, and validation.

Installing as an Agent Skill

Agent Skills are discovered automatically by compatible tools through the SKILL.md file. Refer to the Agent Toolit for AWS Skill Installation Guide to install the managing-amazon-msk Agent Skill. We also recommend you install the AWS MCP Server in your developer tool of choice, which exposes tools for searching AWS documentation, blogs, and Skills dynamically at runtime. These capabilities make agents more accurate and powerful for AWS related development and operational tasks, and make skill discovery and installation more flexible. Refer to Setting up the AWS MCP Server for guidance on installing the AWS MCP Server in your environment.

For example:

aws configure agent-toolkit
aws agent-toolkit add-skill --skill-name managing-amazon-msk

To verify the installation, interact with the skill in your preferred tool.

To start delivering data from your Kafka topics to Apache Iceberg tables in real time, for example, prompt “Create me a streaming table on my MSK cluster for my events topic” to your agent of choice:

Agent chat showing the prompt to create a streaming table on an MSK cluster for the events topic

The agent will dynamically load the managing-amazon-msk skill, and start by gathering the available resources in your AWS account to use for the streaming tables integration. Once it gathers that data, it will confirm the resources to use or create, and create the integration:

Agent confirming the AWS resources to use and creating the streaming tables integration

After creating the integration, the agent will summarize the status and can then help with any other operational tasks with your data. For example, the agent can help you set up AWS Lake Formation permissions for you to query the data in S3 Tables with Athena, or configure your table maintenance behavior in S3 Tables:

Agent summarizing integration status and offering to set up Lake Formation permissions or configure S3 Tables maintenance

Conclusion

Delivery to streaming tables and general purpose S3 buckets is available in all AWS Regions where Amazon MSK Express brokers are available. To learn more about delivery to streaming tables, visit the documentation and pricing pages.


About the authors

Shakhi Hali

Shakhi Hali

Shakhi is a Product Manager for Amazon Managed Streaming for Apache Kafka. She works closely with AWS customers to understand their needs for real-time analytics and high throughput, low latency streaming workloads. Working backwards from their needs, she helps drive the Amazon MSK roadmap and deliver new innovations that help AWS customers focus on building novel streaming applications.

Mazrim Mehrtens

Mazrim Mehrtens

Mazrim is a Sr. Specialist Solutions Architect for messaging and streaming workloads. Mazrim works with customers to build and support systems that process and analyze terabytes of streaming data in real time, run enterprise Machine Learning pipelines, and create systems to share data across teams seamlessly with varying data toolsets and software stacks.

Huyam Hasan

Huyam Hasan

Huyam is a Solutions Architect II at AWS, based in Austin, TX, with a passion for data and analytics solutions and customer success. She works with enterprise customers across travel, gaming, and hospitality to design and build modern, secure, and scalable data and streaming architectures, with a focus on real-time analytics that help them achieve their business outcomes.

Extend Amazon Inspector SBOM Generator with Plugins

Post Syndicated from Michael Long original https://aws.amazon.com/blogs/security/extend-amazon-inspector-sbom-generator-with-plugins/

Amazon Inspector is an automated vulnerability management service that continually scans Amazon Web Services (AWS) workloads for software vulnerabilities. The vulnerability management capabilities of Amazon Inspector are powered by an asset inventory engine known as the Amazon Inspector SBOM Generator (inspector-sbomgen), a standalone command-line tool that produces a software bill of materials (SBOM) from container images, directories, archives, local systems, compiled binaries, and more. Over the past two years, we’ve expanded inspector-sbomgen’s coverage across dozens of programming language ecosystems, operating systems, and widely deployed applications.

We’re pleased to announce a new capability for builders using inspector-sbomgen: a plugin system for writing your own custom package collectors that you can use right away, without requiring source code compilation nor waiting for an official release.

You can download the latest version of inspector-sbomgen from the Amazon Inspector User Guide.

In this post, we walk you through what the inspector-sbomgen plugin system does, why we built it, and how you can write your first plugin in a few minutes. Along the way, we also cover how plugin-generated package components integrate with Amazon Inspector for vulnerability scanning, and we explore the plugin safety model, which helps ensure security-hardened and predictable plugin behavior.

Why we built a plugin system

Software ecosystems are dynamic. New language package managers, lockfile formats, and end user applications ship constantly, and many are adopted quickly, in some cases with little security scrutiny. That leaves security teams with a visibility gap: production workloads running software that their SBOM tooling doesn’t yet recognize. Customers have asked us to inventory many of these ecosystems directly, and until recently, the only path to support was to open a feature request and wait for the inspector-sbomgen team to onboard the ecosystem and deploy a new release.

The inspector-sbomgen plugin system changes that. With plugins, you can:

  • Onboard ecosystems that inspector-sbomgen doesn’t support out of the box. New open source ecosystems, niche or fast-moving package formats, and internal or proprietary tooling can all be inventoried without modifying inspector-sbomgen.
  • Prototype detection for an ecosystem quickly. We designed a plugin system that is friendly to developers and AI coding assistants alike. Plugins are written in Lua, loaded at runtime, and require no Go toolchain nor compilation. You can use the built in test harness to iterate on a plugin and see results immediately.
  • Build on a stable foundation. The plugin API abstracts away artifact-type differences, so you write your detection logic once and it works seamlessly across container images, archives, local systems, and more. And because plugins stay decoupled from the internals of sbomgen, the core tool’s regression surface stays small.

Internally, we’ve used the plugin system to ship new ecosystem coverage faster than before. In our 1.13 release, more than 20 ecosystems that were previously implemented in Go, including Apache Tomcat, NGINX, MySQL, Redis, WordPress, and the OpenSSH toolchain, are now embedded as plugins inside the sbomgen binary. The same release also added more than ten brand-new ecosystems as plugins, including Apache Cassandra, Apache Struts, Conda, Swift packages, and AI-agent collectors (Amazon Q Developer, Kiro CLI, Claude Code, GitHub Copilot, and Ollama).

How inspector-sbomgen plugins work

Sbomgen plugins follow a two-step pipeline:

  1. Discovery – Scan the artifact’s file system to identify files that contain installed package metadata.
  2. Collection – Open each discovered file, parse file contents, and publish findings into the SBOM.

Under the hood, an event bus connects discovery and collection plugins. Discovery plugins publish events listing discovered files, and one or more collection plugins subscribe to these events, triggering package collection. Developers might recognize this behavior as the observer pattern.

This decoupling lets a single discovery plugin feed multiple collectors, for example, one extracting package metadata, another scanning for secrets, and another checking policy. Each collection plugin works from the same file list without re-walking the artifact filesystem, a computationally expensive operation.

Write your first plugin in 5 minutes

Inspector-sbomgen makes it straightforward to bootstrap a plugin environment. The plugin new command tells sbomgen to create a new plugin workspace, and the —-with-example flag populates the workspace with a discovery-collection plugin pair, that you can run immediately.

inspector-sbomgen plugin new --with-example 

After invoking the preceding command, you will be prompted to provide a plugin name and a directory that will contain your plugin workspace. You can provide custom values or use the default values:

Plugin name (identifies the software ecosystem your plugin will inventory, e.g. debian-dpkg, rhel-rpm, python-pip, cmake) [my-custom-ecosystem]: <enter>
Project directory [my-sbomgen-plugins]: <enter>

Created plugin "my-custom-ecosystem" in my-sbomgen-plugins/

Note that you can skip interactive prompts by specifying the plugin name and directory using the corresponding command line interface (CLI) arguments:

inspector-sbomgen plugin new \
    --with-example \
    --name my-custom-ecosystem \
    --path my-sbomgen-plugins

After creating your plugin workspace, inspector-sbomgen will display a next steps screen, which guides developers and AI code assistants to the source files they need to change and to supporting documentation:

Next steps:

  Get started:
    1. Open plugin folder in a code editor (VS Code recommended)
    2. Add test files that your plugin will discover and parse
       (e.g., config files, lockfiles, binaries, etc.):
       my-sbomgen-plugins/discovery/cross-platform/extra-ecosystems/my-custom-ecosystem/_testdata/

  Develop:
    3. Edit discovery:    my-sbomgen-plugins/discovery/cross-platform/extra-ecosystems/my-custom-ecosystem/init.lua
    4. Edit collection:   my-sbomgen-plugins/collection/cross-platform/extra-ecosystems/my-custom-ecosystem/init.lua

  Test:
    5. Write unit tests:  my-sbomgen-plugins/discovery/cross-platform/extra-ecosystems/my-custom-ecosystem/init_test.lua
    6. Run unit tests:    inspector-sbomgen plugin test --path my-sbomgen-plugins

  Deploy:
    7. Distribute your plugin directory wherever you run inspector-sbomgen:
       inspector-sbomgen <arguments> --plugin-dir /path/to/my-sbomgen-plugins

       Example:
       inspector-sbomgen container --image alpine:latest -o /tmp/sbom.json --plugin-dir /path/to/my-sbomgen-plugins

For code completion, install the VS Code Lua language server extension:
  https://luals.github.io/#vscode-install

For more information:
  - Plugin guide:    my-sbomgen-plugins/docs/sbomgen-plugin-developer-guide.md
  - Testing guide:   my-sbomgen-plugins/docs/sbomgen-plugin-testing-guide.md
  - API reference:   my-sbomgen-plugins/docs/sbomgen-plugin-api-reference.md
  - Documentation:   https://docs.aws.amazon.com/inspector/latest/user/sbom-generator.html

Now that you have a plugin workspace, let’s explore its contents in greater detail:

tree my-sbomgen-plugins

├── AGENTS.md
├── collection
│   └── cross-platform
│       └── extra-ecosystems
│           └── my-custom-ecosystem
│               └── init.lua
├── discovery
│   └── cross-platform
│       └── extra-ecosystems
│           └── my-custom-ecosystem
│               ├── _testdata
│               │   ├── empty
│               │   └── example.lock
│               ├── init_test.lua
│               └── init.lua
├── docs
│   ├── sbomgen-plugin-api-reference.md
│   ├── sbomgen-plugin-developer-guide.md
│   └── sbomgen-plugin-testing-guide.md
├── library
│   └── sbomgen.lua
└── README.md

The scaffolded project includes a working discovery and collection plugin pair, passing unit tests with test fixtures under _testdata/, a .vscode/settings.json for integrated development environment (IDE) integration, and a local copy of the developer documentation.

The scaffolding is deliberately succinct and complete, so it reads well for both humans and AI coding assistants. Every file has clear comments that explain what each function does and what the plugin author needs to fill in.
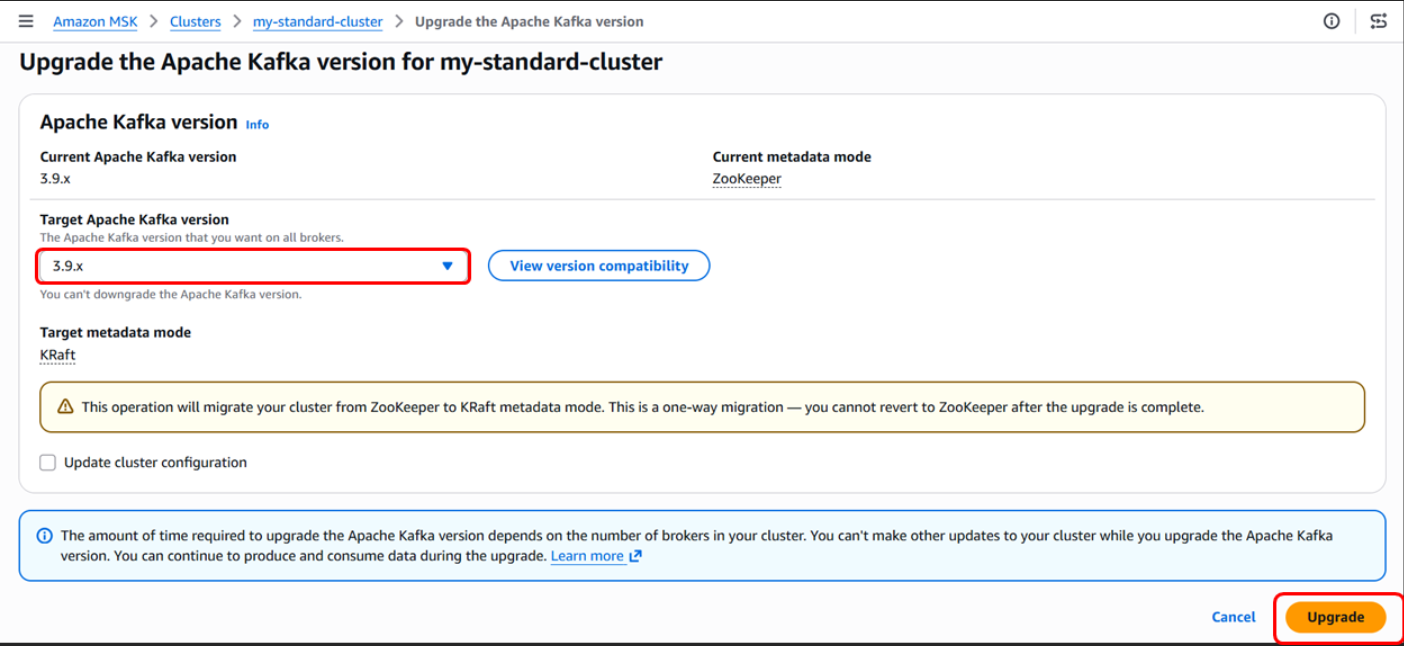
To test a plugin, you first need something to scan, such as a package lock file or a compiled binary. The example plugin inventories a fictional example.lock with the following contents:
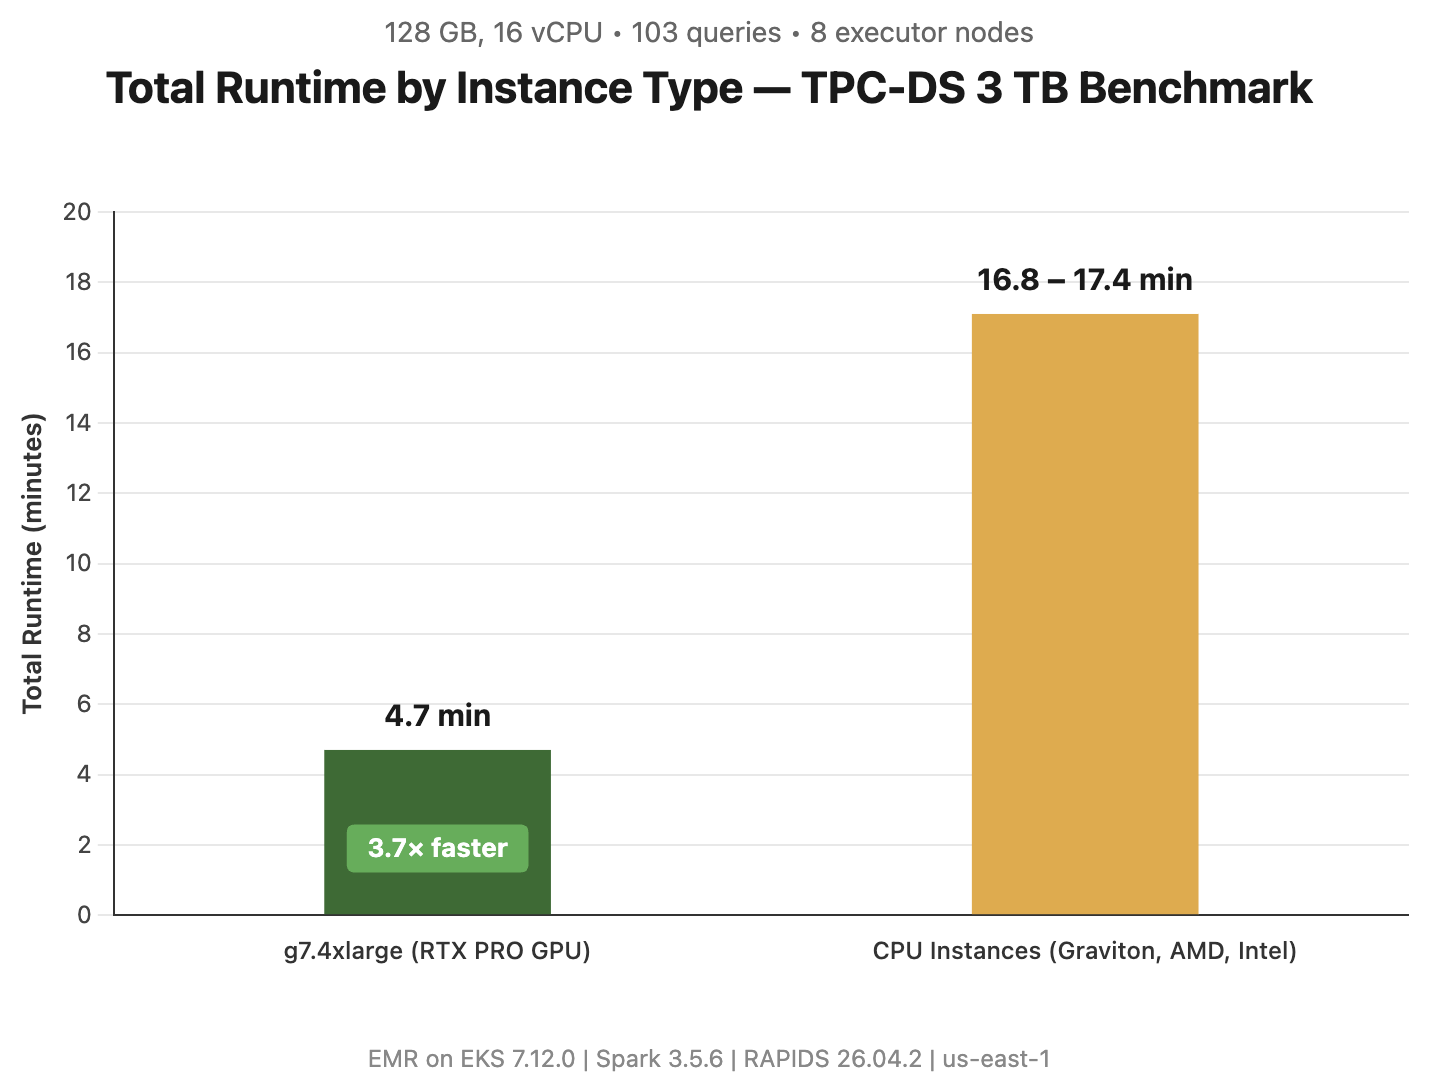
my-package-alpha==1.0.0 
my-package-beta==2.3.1 
my-package-gamma==0.9.5 

The provided discovery plugin knows how to look for instances of example.lock within the artifact file system:
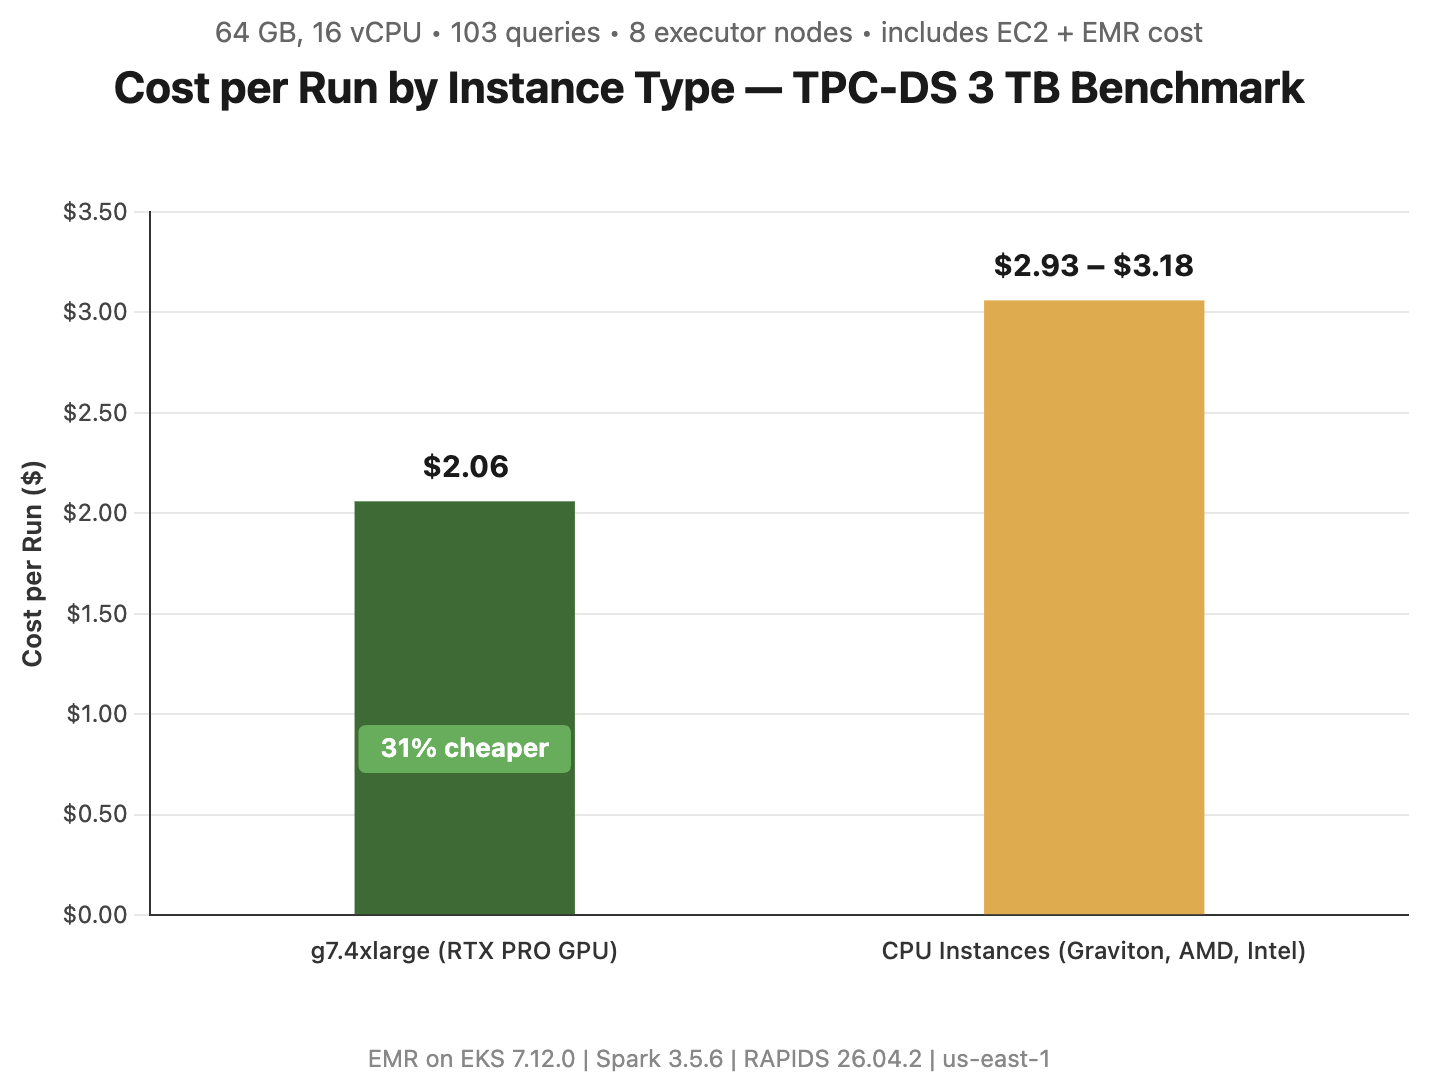
-- my-custom-ecosystem discovery plugin
-- Discovers example.lock files in the artifact file list.

function discover()
    return sbomgen.find_files_by_name({"example.lock"})
end

And the provided collection plugin knows how to parse the contents of example.lock and publish package findings to the output SBOM.

-- my-custom-ecosystem collection plugin
-- Parses example.lock files and extracts package name and version.

function collect(file_path)
    local content = sbomgen.read_file(file_path)
    if content == nil then
        return
    end

    for line in content:gmatch("[^\n]+") do
        local name, ver = line:match("^(.+)==(.+)$")
        if name and ver then
            sbomgen.push_package({
                name = name,
                version = ver,
                purl_type = "generic",
                namespace = "my-custom-ecosystem",
                component_type = sbomgen.component_types.APPLICATION,
            })
        end
    end
end

Run the tests

Plugins ship with a built-in test framework so you can validate your logic before scanning a real artifact. Tests are written in Lua, live next to the plugin in init_test.lua, and reference fixture data in _testdata/:

function test_discovers_packages() 
    local result = testing.scan_directory("_testdata") 
    testing.assert_equals(3, #result.findings) 
    testing.assert_equals("my-package-alpha", result.findings[1].name) 
    testing.assert_equals("1.0.0", result.findings[1].version) 
end 
 
function test_no_findings_for_empty_directory() 
    local result = testing.scan_directory("_testdata/empty") 
    testing.assert_equals(0, #result.findings) 
end

Run the tests with the following command:

inspector-sbomgen plugin test --path my-sbomgen-plugins -v

=== RUN   my-custom-ecosystem/discovery/init_test/test_discovers_packages 
--- PASS: my-custom-ecosystem/discovery/init_test/test_discovers_packages (0.04s) 
=== RUN   my-custom-ecosystem/discovery/init_test/test_no_findings_for_empty_directory 
--- PASS: my-custom-ecosystem/discovery/init_test/test_no_findings_for_empty_directory (0.04s) 
ok    2 tests passed 

This is the tightest development loop we could design: no Go toolchain, no rebuild, no container spin-up. Write a test, run it, iterate.

Scan a real artifact

For plugins to produce findings, inspector-sbomgen needs an artifact that contains the files your plugin looks for. For the example plugin, any directory with an example.lock file works. The fixture we generated earlier is a good stand-in:

inspector-sbomgen directory \ 
    --plugin-dir ./my-sbomgen-plugins \ 
    --path ./my-sbomgen-plugins/discovery/cross-platform/extra-ecosystems/my-custom-ecosystem/_testdata \ 
    -o sbom.json 

The --plugin-dir flag tells inspector-sbomgen where to load your Lua plugins from. The resulting SBOM contains a CycloneDX component for each of the three packages in example.lock, for example:

{
  "bom-ref": "comp-2",
  "type": "application",
  "name": "my-package-alpha",
  "version": "1.0.0",
  "scope": "optional",
  "purl": "pkg:generic/my-sbomgen-plugin/[email protected]",
  "properties": [
    {
      "name": "amazon:inspector:sbom_generator:source_path",
      "value": "./my-sbomgen-plugins/example.lock"
    }
  ]
}

Every plugin-generated component carries an amazon:inspector:sbom_generator:source_path property that records the file the component was collected from, so you can always trace a component back to the artifact that produced it.

Vulnerability scanning with Amazon Inspector

Plugin-generated findings are first-class SBOM components. They work with every downstream consumer that reads CycloneDX SBOMs, including Amazon Inspector. To send an SBOM to Amazon Inspector for vulnerability analysis, add the --scan-sbom flag (this requires an active AWS account):

inspector-sbomgen directory \ 
    --path ./my-sbomgen-plugins/discovery/cross-platform/extra-ecosystems/my-custom-ecosystem/_testdata \ 
    --plugin-dir ./my-sbomgen-plugins \ 
    --scan-sbom \ 
    --aws-profile your_profile \ 
    --aws-region your_region \ 
    -o /tmp/sbom.json 

An important caveat when you onboard a brand-new ecosystem: Plugin authors can inventory arbitrary ecosystems, but Amazon Inspector can only report vulnerabilities for components it has advisories for. When you point Amazon Inspector at a component whose ecosystem isn’t in its advisory feeds yet, Inspector will return the component with a property, Component skipped: no supported rules found. For example:

{ 
  "bom-ref": "comp-1", 
  "name": "my-package-alpha", 
  "properties": [ 
    { 
      "name": "amazon:inspector:sbom_scanner:path", 
      "value": "my-sbomgen-plugins/discovery/cross-platform/extra-ecosystems/my-custom-ecosystem/_testdata/example.lock" 
    }, 
    { 
      "name": "amazon:inspector:sbom_scanner:info", 
      "value": "Component skipped: no supported rules found." 
    } 
  ], 
  "purl": "pkg:generic/my-custom-ecosystem/[email protected]", 
  "type": "application", 
  "version": "1.0.0" 
} 

This is expected behavior, not an error. The SBOM is still generated correctly, the component is still tracked, and the source_path tells you exactly which file produced it. If and when Amazon Inspector adds advisory coverage for the ecosystem, the same SBOM will start producing vulnerability findings without any change to your plugin. For ecosystems Inspector already supports, plugin-generated components are indistinguishable from components produced by built-in scanners.

First class IDE support

We care about productivity and efficiency when writing plugins. Writing Lua without modern conveniences such as autocomplete isn’t fun, so every plugin project scaffolded with the plugin new command ships with a library/sbomgen.lua definition file and a .vscode/settings.json that automatically wires it up to the Lua Language Server extension for VS Code.

For code completion and IDE support, first install the sumneko.lua extension, open your plugin project in VS Code, and every sbomgen.* function will get:

  • Parameter hints with types.
  • Hover documentation.
  • Autocomplete for constants (sbomgen.component_types.*, sbomgen.groups.*, sbomgen.platform.*).
  • Type checking on function calls.
  • Inline warnings when required fields are missing from push_package().

The same definition file makes plugin development work well with AI coding assistants. The types and documentation are embedded in a form that tools can read, so assistants can generate correct plugin code with far less monitoring than writing against a raw language would require.

A safe foundation

Plugins run real code inside the same process as inspector-sbomgen, so we designed the execution environment to keep that code stable and security-hardened. Every Lua plugin runs in an isolated sandbox. Every Lua virtual machine (VM) has access to a restricted subset of the Lua standard library to ensure only safe operations are permitted:

  • No direct filesystem access. The Lua io library isn’t loaded. All file operations go through sbomgen.* functions, which route through sbomgen’s internals so your plugin behaves identically whether it’s scanning a directory on disk, a container image, a compressed archive, or a mounted volume.
  • No subprocess execution or environment mutation. The Lua os library is blocked, so plugins can’t spawn processes, modify environment variables, or touch files outside the artifact.
  • No VM introspection. The Lua debug library is blocked.
  • No unbounded code loading. dofile, loadfile, and loadstring are removed. require() is available but restricted to the plugin’s own directory tree, so plugins can share helper modules with themselves but cannot load code from other plugins or system paths.

If a plugin raises an unhandled Lua error, inspector-sbomgen logs a warning and continues with the next file or plugin; one faulty plugin does not prevent other plugins from running. Plugins never override inspector-sbomgen’s built-in package collectors. Every plugin must declare a unique name. If a custom plugin uses a name that’s already claimed by an official built-in plugin, the custom plugin is skipped with a warning. Built-in plugins always take precedence, so a custom plugin can never silently replace or shadow the tool’s own detection behavior.

Next steps

To start building your own plugins today:

  1. Install the latest inspector-sbomgen from the Amazon Inspector user guide.
  2. Run inspector-sbomgen plugin new --with-example and follow the prompts.
  3. Run inspector-sbomgen plugin test --path ./my-sbomgen-plugins -v to see the example tests pass.
  4. Replace the example logic with detection for your own ecosystem.

The full reference documentation covers every function, constant, and command in depth:

Conclusion

Whether you’re adding support for an internal lockfile format, prototyping detection for a new open source ecosystem, or replacing a home-grown scanner with something your whole organization can run at scale, the plugin system is designed to make the path from idea to working SBOM as short as possible. We can’t wait to see what you build with it.
If you have feedback about this post, submit comments in the Comments section below. If you have questions about this post, contact AWS Support.


Michael Long

Michael Long

Michael is a Senior Security Researcher for Amazon Inspector at AWS. He leads research and development of the Amazon Inspector SBOM Generator and Amazon Inspector for GitHub Actions. Before joining AWS, he was a principal adversary emulation engineer on the MITRE ATT&CK team. He also served honorably for nearly 10 years in the U.S. Army spanning military intelligence and cyber operations.

Charlie Bacon

Charlie Bacon

Charlie is Head of Security Engineering and Research for Amazon Inspector at AWS. He leads the teams behind the vulnerability scanning and inventory collection services that power Amazon Inspector and other Amazon Security vulnerability management tools. Before joining AWS, he spent two decades in the financial and security industries where he held senior roles in both research and product development.

Anthony Verleysen

Anthony Verleysen

Anthony is a Senior Technical Product Management for Amazon Inspector. Before Amazon Inspector, Anthony worked as a Product Manager in AWS Systems Manager owning Node Management capabilities. Outside of work, Anthony is an avid tennis and soccer player.

Accelerate Spark on EMR Serverless with larger workers and shuffle-optimized disks

Post Syndicated from Karthik Prabhakar original https://aws.amazon.com/blogs/big-data/accelerate-spark-on-emr-serverless-with-larger-workers-and-shuffle-optimized-disks/

With Amazon EMR Serverless, you can run open source big data frameworks such as Apache Spark and Apache Hive without managing clusters or infrastructure. Customers are increasingly choosing EMR Serverless for their analytics workloads because of the simplicity of a fully managed, serverless experience. As adoption grows, teams want to bring their most demanding jobs to Serverless too. These jobs include large-scale joins, shuffle-heavy ETL, and memory-intensive analytics that previously required carefully sized clusters. Customers migrating these heavyweight workloads from their Spark clusters often need the same compute shapes on EMR Serverless to achieve the same price-performance and make migration easier.

Today, we’re excited to announce a new 32 vCPU / 244 GB worker configuration on Amazon EMR Serverless, giving you the headroom to run your most intensive workloads without leaving the serverless experience.

Overview of larger workers

An EMR Serverless application uses workers to run your Spark tasks, and you can choose a worker size that matches your workload. The new 32 vCPU worker offers a large compute and memory footprint (32 vCPUs and 244 GB of memory) that supports attaching up to 2,000 GB of shuffle-optimized disk. This combination benefits three common workload patterns:

  • Shuffle-intensive workloads – Wide transformations such as join, groupBy, sortBy, and repartition redistribute large amounts of data across the cluster. Larger workers keep more shuffle data local to each executor and read and write shuffle blocks on higher-throughput disk, reducing remote fetches and shuffle wait time.
  • I/O-heavy workloads – Queries that scan large datasets or spill intermediate data to disk are limited by disk throughput and IOPS. The shuffle-optimized disk raises the ceiling on both sides. Large workers also improve network bandwidth.
  • Memory-intensive workloads – Higher per-executor memory (244 GB versus 30 GB) lets more data be cached and processed in memory without spilling, which helps with data skew and caching.

Benchmark setup

We compared the recommended large-worker configuration against common small-worker defaults at identical total compute (192 vCPUs).

  • Large workers – 6 executors × (32 vCPU / 244 GB / 2,000 GB shuffle-optimized disk).
  • Small workers – 48 executors × (4 vCPU / 30 GB / 200 GB standard disk).

The two configurations differ in both worker shape and disk class. We compare them as paired configurations, since shuffle-optimized disk is the intended disk type for the 32 vCPU worker. The reported gains reflect this combined effect.

Both configurations set spark.dynamicAllocation.enabled=false and spark.scheduler.minRegisteredResourcesRatio=1 to reduce variance from worker launch times. Requiring full registration ensures each query starts only after the cluster is ready. We ran every query with 3 iterations and reported the median. Both benchmarks ran on EMR release emr-7.13.0 in a virtual private cloud (VPC) with an Amazon Simple Storage Service (Amazon S3) gateway endpoint attached to the private subnets.

Benchmark results

This post presents benchmark results comparing the new 32 vCPU workers against the existing 4 vCPU standard workers using the industry-standard TPC-DS and TPC-H benchmarks. Across 126 queries (104 TPC-DS and 22 TPC-H), large workers delivered an average of 29% faster query execution and 29% lower query-attributed cost, with zero regressions and improvements peaking at 45–55% on shuffle-heavy, multi-table join queries. Both the larger executor shape and the shuffle-optimized disk contribute to these gains. The disk advantage is most pronounced on the shuffle and I/O-heavy queries where the largest improvements appear.

The following table summarizes the results across both benchmarks. Large workers won every query on both performance and cost.

Note: The benchmark results in this post are derived from the TPC-DS and TPC-H benchmark specifications. TPC-DS and TPC-H are trademarks of the Transaction Processing Performance Council.

Benchmark Queries tested Avg performance improvement Avg cost improvement
TPC-DS (3 TB) 104 26.7% 27.4%
TPC-H (1 TB) 22 38.5% 37.2%
Combined 126 28.8% 29.1%

TPC-DS 3 TB benchmark

TPC-DS is an industry-standard decision support benchmark that models complex analytical workloads with multi-table joins, subqueries, and aggregations. We ran 104 queries from the TPC-DS v2.4 suite against a 3 TB partitioned Parquet dataset, with 3 iterations per query for statistical confidence.

The test environment was as follows:

  • Dataset: 3 TB partitioned Parquet (24 TPC-DS tables).
  • Queries: 104 (full suite minus 4 incompatible with the dataset schema).
  • Iterations: 3 per query (one query per start-job-run, a fresh Spark application each time).
  • Networking: VPC with an Amazon S3 gateway endpoint.
  • EMR release: emr-7.13.0.

The following chart shows the top 10 and bottom 5 queries by performance improvement. All 104 queries show a positive improvement, with the largest gains on shuffle-heavy queries such as q58 (45%), q21 (43%), and q12 (42%).

Bar chart of per-query performance improvement for the top 10 and bottom 5 TPC-DS queries

Performance improvement for the top 10 and bottom 5 TPC-DS queries, 32 vCPU compared to 4 vCPU standard workers

Why large workers are faster for TPC-DS

TPC-DS queries are characterized by complex multi-table joins that generate large shuffle operations. With 6 large executors instead of 48 small ones, the shuffle-optimized disk provides significantly higher random I/O throughput for reading and writing shuffle blocks. In addition, fewer executors mean less network coordination during shuffle. Each executor fetches shuffle data from only 5 remote sources instead of 47. This increases the share of shuffle data read locally, which improves performance.

TPC-H 1 TB benchmark

TPC-H is a decision support benchmark that focuses on ad hoc analytical queries. We ran all 22 TPC-H queries against a 1 TB dataset, with 3 iterations per query. Each query was submitted as a separate start-job-run (a fresh Spark application) to simulate the realistic pattern of independent ad hoc queries arriving without session warmup.

The test environment was as follows:

  • Dataset: 1 TB partitioned Parquet.
  • Queries: 22.
  • Iterations: 3 per query (one query per start-job-run, a fresh Spark application each time).
  • Networking: VPC with an Amazon S3 gateway endpoint.
  • EMR release: emr-7.13.0.
Bar chart of per-query performance improvement across the 22 TPC-H queries

Performance improvement for TPC-H queries, 32 vCPU compared to 4 vCPU standard workers

Why large workers are faster for TPC-H

The shuffle-optimized disk accelerates this initial table-scan phase. The subsequent query execution benefits from higher per-executor memory (244 GB versus 30 GB), which lets more data be processed in memory without spilling to disk.

Cost calculation and improvement results

The following table compares the cost of running TPC-DS and TPC-H benchmarks on larger workers (32 vCPU / 244 GB / 2,000 GB shuffle-optimized disk) versus smaller workers (4 vCPU / 30 GB / 200 GB standard disk) on EMR Serverless. Both configurations use identical total compute (192 vCPUs).

TPC-DS 3 TB

Metric Larger Workers (6 × 32 vCPU) Smaller Workers (48 × 4 vCPU)
Runtime 2,780.8s 3,670.2s
Resource Billed

vCPU = 148.31 | Memory = 1,130.87 |

Disk = 9,269.47

vCPU = 195.74| Memory = 1,468.07 |

Disk = 9787.15

Cost $15.37 $19.87
Total vCPU 192 192
Total Disk 12 TB (shuffle-optimized) 9.6 TB (standard)
Improvement 27.4% lower cost Baseline

TPC-H 1 TB

Metric Larger Workers (6 × 32 vCPU) Smaller Workers (48 × 4 vCPU)
Runtime 940.7s 1,529.5s
Resource Billed

vCPU = 50.17 | Memory = 382.54 |

Disk = 3,135.60

vCPU = 81.57 | Memory = 611.81 |

Disk = 4,078.72

Cost $5.20 $8.28
Total vCPU 192 192
Total Disk 12 TB (shuffle-optimized) 9.6 TB (standard)
Improvement 37.2% lower cost Baseline

Notes:

  • Runtime represents the sum of median query execution times across all queries in the benchmark (3 iterations per query, median reported).
  • Calculated cost is computed using EMR Serverless on-demand pricing: vCPU-hr ($0.052624), Memory GB-hr ($0.0057785), Storage GB-hr ($0.000111).
  • Illustrative TPC-DS run cost calculation:
    • Large worker: (148.31 * $0.052624) + (1,130.87 * $0.0057785) + (9,269.47 * $0.000111) = $15.37.
    • Smaller worker: (195.74 * $0.052624) + (1,468.07 * $0.0057785) + (9787.15 * $0.000111) = $19.87.
  • Cost is proportionally attributed to query execution time, excluding Spark initialization and shutdown overhead.
  • Both configurations use identical total vCPU (192) with Dynamic Resource Allocation disabled.
  • The improvement percentage represents the cost reduction achieved by larger workers relative to smaller workers.
  • Disk Sizing: The larger workers provisioned 25% more disk (12 TB versus 9.6 TB), yet the total cost came out 22.6–37.2% lower. Disk is by far the lowest-priced billing dimension on EMR Serverless ($0.000111 per GB-hour, versus 52x that for memory and 474x for vCPU) and made up only $1.03 of the $15.37 TPC-DS total. Many customers under-provision disk to trim this smallest line item, and it backfires. Shuffles slow down, jobs run longer, and every extra second is billed on the costlier vCPU and memory dimensions. On large workers (8+ vCPUs), shuffle-optimized disks scale IOPS and throughput with capacity, which helps move shuffle data faster. Size disk as a performance lever, not a cost lever.

When to use large workers

To determine whether the 32 vCPU worker with shuffle-optimized disk will benefit your Spark applications, consider the following:

  • Check the Stages tab of the Spark History Server for your EMR Serverless application and review the Shuffle Read and Shuffle Write columns. The larger the shuffle volume relative to the number of executors, the more a job benefits from keeping shuffle data local on high-throughput disk. Jobs that shuffle tens of gigabytes or more per executor are strong candidates.
  • Check the Stages tab for the Spill (memory) and Spill (disk) columns and the Executors tab for peak JVM memory. If data is spilling to disk or peak memory is close to the configured executor memory, the higher memory of the large worker can remove the spill and improve performance.

When not to use large workers

Large workers are not the best fit for every workload:

  • I/O-bound jobs – For workloads whose runtime is dominated by reading and writing data (rather than shuffle or memory pressure), a larger number of smaller workers (for example, 8 or 16 vCPU) with the same disk sizes can deliver better aggregate throughput. Spreading the work across more executors increases read/write parallelism, although a few large workers can leave disk and network bandwidth underused.

Conclusion

In this post, we demonstrated that EMR Serverless 32 vCPU workers deliver performance and cost benefits for shuffle-intensive Spark workloads. Across 126 TPC-DS and TPC-H queries, larger workers achieved an average 29% faster execution and 29% lower cost.

We recommend evaluating the 32 vCPU worker with shuffle-optimized disk for your shuffle-intensive and I/O-heavy EMR Serverless Spark workloads. To get started, use the following configuration:

--conf spark.executor.cores=32
--conf spark.executor.instances=6
--conf spark.executor.memory=220g
--conf spark.emr-serverless.executor.disk=2000G
--conf spark.emr-serverless.executor.disk.type=SHUFFLE_OPTIMIZED

For more information about worker configurations, refer to Worker configurations in the Amazon EMR Serverless User Guide. We also recommend staying up to date with the latest EMR releases to take advantage of ongoing performance improvements.


About the authors

Karthik Prabhakar

Karthik Prabhakar

Karthik is a Data Processing Engines Architect for Amazon EMR at AWS. He specializes in distributed systems architecture and query optimization, working with customers to solve complex performance challenges in large-scale data processing workloads. His focus spans engine internals, cost optimization strategies, and architectural patterns that enable customers to run petabyte-scale analytics efficiently.

Arun Maniyan

Arun Maniyan

Arun is a Sr. Specialist Solutions Architect at AWS. He specializes in designing highly performant, scalable lakehouse and data lake architectures for large enterprises. Outside of work, he enjoys playing musical instruments, biking, and spending time with his family.

Neil Mukerje

Neil Mukerje

Neil is a Principal Product Manager with the Amazon EMR Team. He is driven to build experiences that let customers achieve their goals efficiently. In his spare time, he enjoys reading, hiking, and tinkering with technology.

2026 Phase 1a IRAP report is now available on AWS Artifact for Australian customers

Post Syndicated from Patrick Chang original https://aws.amazon.com/blogs/security/2026-phase-1a-irap-report-is-now-available-on-aws-artifact-for-australian-customers/

Amazon Web Services (AWS) is excited to announce that the latest version of Information Security Registered Assessors Program (IRAP) report (Phase 1a – full assessment) is now available through AWS Artifact. An independent Australian Signals Directorate (ASD) certified IRAP assessor completed the IRAP assessment of AWS in June 2026.

The new IRAP report includes four additional AWS services that are now assessed at the PROTECTED level under IRAP. This brings the total number of services assessed at the PROTECTED level to 167.

The four newly assessed services are:

For the full list of services, see the IRAP tab on the AWS Services in Scope by Compliance Program page.

We have developed an IRAP documentation pack to help our Australian customers and their partners plan, architect, and assess risk for their workloads when they use AWS cloud services.

We developed this pack in accordance with the Australian Cyber Security Centre (ACSC) Cloud Security Guidance and Cloud Assessment and Authorisation framework, which addresses guidance within the Australian Government’s Information Security Manual (ISM, September 2025 version), the Department of Home Affairs’ Protective Security Policy Framework (PSPF), and the Digital Transformation Agency’s Secure Cloud Strategy.

The IRAP pack on AWS Artifact also includes newly updated versions of the AWS Consumer Guide and the whitepaper Reference Architectures for ISM PROTECTED Workloads in the AWS Cloud.

Reach out to your AWS representatives to let us know which additional services you want to see in scope for upcoming IRAP assessments. We strive to bring more services into scope at the PROTECTED level under IRAP to support your requirements.


Patrick Chang

Patrick Chang

Patrick is the APJ Audit Specialist based in Sydney. He leads security audits, certifications, and compliance programs across the APJ region. Patrick is a technology risk and audit professional with around two decades of experience and is passionate about delivering assurance programs that build trust with customers and provide them assurance on cloud security.

AWS Shield Advanced is embracing the AWS WAF Anti-DDoS managed rule group: What changes and how to prepare

Post Syndicated from Eitav Arditti original https://aws.amazon.com/blogs/security/aws-shield-advanced-is-embracing-the-aws-waf-anti-ddos-managed-rule-group-what-changes-and-how-to-prepare/

Application-layer distributed denial of service (DDoS) attacks are difficult to detect because they closely resemble legitimate traffic. HTTP request floods are now among the most common vectors targeting web applications, using valid-looking requests that blend in with normal user activity.

In June 2025, AWS launched the AWS WAF Anti-DDoS managed rule group, built specifically for application-layer (L7) DDoS protection. AWS Shield Advanced is adopting it as the default application-layer protection, and in time as the only one. On July 27, AWS Shield Advanced begins adding the Anti-DDoS managed rule group to eligible web access control lists (ACLs) in Count mode. It will not cause any interruption to your traffic alongside your existing L7 automatic mitigation and WAF rules. In this blog post, we provide details regarding the Anti-DDoS managed rule group and when the change is expected to reach your web ACLs. You will understand the phases and steps that you need to take before the finish date, including how the monitoring and metrics will change.

Anti-DDoS managed rule group features

The Anti-DDoS managed rule group builds on what Shield Advanced automatic mitigation already provides. It profiles your traffic, learns what normal traffic looks like for your application, and establishes a baseline in minutes rather than hours. When an attack starts, it reacts within seconds and there are no health checks to configure. The rule group adds a Challenge action to the Block and Count actions you already use. Challenge decisions are driven by the AMR labels that mark the suspicion level of each inspected request. One option is a silent browser challenge, which has a background verification that runs in the visitor’s browser with no interstitial page, so legitimate users are never interrupted while automated traffic is filtered out. You can also exclude workload paths that don’t support Challenge, which fall back to Block mitigations instead. Sensitivity is configurable to Low, Medium, or High, and you set it separately for Block and Challenge. Block and Challenge are tuned independently; meaning you can run Challenge at high sensitivity to catch more suspicious traffic while keeping Block low to avoid dropping legitimate requests or reverse it for a stricter posture.

The rest is about cost and visibility:

  • It uses less capacity than before. The rule group needs 50 web ACL capacity units (WCUs), down from the 150 the previous protection required, providing you with capacity for the rest of your rules.
  • The dashboard ships in the AWS Management Console for AWS WAF. It’s there now, showing live DDoS events, match metrics, and the top URIs, geographies, and IP addresses driving traffic.
  • It labels everything it inspects. Requests get labels for event-detected, graduated suspicion levels, and specific rules. Match on those labels in your own AWS WAF rules when you need logic the rule group doesn’t cover.
  • You don’t pay for the attack traffic. During active mitigation, blocked DDoS requests drop out of your monthly count. That exclusion covers AWS WAF request fees, Anti-DDoS managed rule group request fees, and Shield Advanced request charges.

AWS Shield Advanced isn’t required to use any of these features. Shield Advanced subscribers get the rule group included with AWS WAF and any customer can turn it on independently. See AWS WAF pricing for more information on costs.

Implementation details

Shield Advanced upgrades application-layer DDoS protection in five phases. The following dates are when AWS will act automatically, not the earliest date when you can act. After the rule group is deployed in Count mode on July 27, 2026, you can begin migrating right away rather than waiting for the October auto-upgrade. There’s no window where protection lapses. Your current automatic mitigation stays active through every phase until the Anti-DDoS managed rule group takes over. That handoff happens in a single operation, with no cutover window and no gap for your traffic flows.

Phase 1: Anti-DDoS managed rule group deployed in Count mode (rolling out July 27–August 7, 2026)

AWS adds the Anti-DDoS managed rule group in Count mode to every web ACL eligible for this rollout. Eligible means any Shield Advanced web ACL with at least one resource using application-layer automatic mitigation that isn’t already running the Anti-DDoS rule group. This is a broader set than the web ACLs eligible for the October auto-upgrade (Phase 3), which applies a stricter test. The deployment rolls out gradually, starting July 27 and expected to finish by August 7, 2026, so different web ACLs might be updated on different days. There’s no impact to your traffic because the rule group watches and labels requests without acting on them while your existing automatic mitigation keeps running. Throughout the evaluation period, you receive DDoS events, metrics, and AWS WAF labels at no additional charge.

Phase 2: Free evaluation period (July 27–September 30, 2026)

The existing automatic mitigation and the Anti-DDoS managed rule group run side by side each detecting independently. Automatic mitigation continues to protect your resources while the rule group operates in Count mode. To compare their detection results, use the DDoSAttackRequests metric, AWS WAF labels, and the Anti-DDoS dashboard. All Anti-DDoS managed rule group charges are waived during this period, including the subscription fee, per-request fees, and WCU consumption costs for the eligible web ACLs from phase 1.

Phase 3: Auto-upgrade begins (October 1, 2026)

For eligible web ACLs, the auto-upgrade mirrors your existing automatic mitigation configuration. The rule group inherits your current setting, so a Block configuration comes up in Block mode and a Count configuration comes up in Count mode in a single, atomic operation. The rule group takes over in the same step that disables automatic mitigation, so protection never drops for an instant. This is a handoff rather than a cutover with no window where your resources are unprotected. If you’d rather not upgrade you can opt out by contacting AWS Support before the auto-upgrade date.

Phase 4: Guided migration (available July 27–December 31, 2026)

You don’t have to wait for the October auto-upgrade to migrate. As soon as the rule group is deployed in Count mode between July 27 and August 7, 2026, you can move to it on your own schedule. This is the path to use for web ACLs that aren’t eligible for the Phase 3 auto-upgrade, meaning mixed-mode web ACLs or ones with resources that don’t have automatic mitigation enabled. Work with your AWS account team and AWS Support at any point in this window to plan and complete the migration. Eligible web ACLs are also upgraded automatically starting October 1 (Phase 3), so guided migration is mainly for the web ACLs the auto-upgrade can’t cover.

Phase 5: Shield Advanced application-layer automatic mitigation sunset (January 1, 2027)

As of January 1, 2027, the Shield Advanced application-layer automatic mitigation feature will no longer be available. Resources that haven’t migrated to the Anti-DDoS managed rule group will lose automatic application-layer DDoS mitigation.

Capability

Shield Advanced application layer automatic mitigation

Anti-DDoS managed rule group (AWSManagedRulesAntiDDoSRuleSet)

Feature type

Shield Advanced automatic mitigation

AWS WAF managed rule group

Detection and mitigation speed

Requires a baseline period; mitigation varies per event

Enhanced detection and faster mitigation

Configuration scope

Per resource (Shield API)

Per web ACL (AWS WAF API)

Mitigation actions

Count, Block

Count, Block, and Challenge

Sensitivity controls

None

Low, Medium, and High for both Block and Challenge

Non-HTML path handling

N/A

URI regex exemptions for Challenge

WCU consumption

150 WCUs

50 WCUs

Health checks

Required (Amazon Route 53 health-based detection)

Not required, provides automatic traffic profiling

Availability

Shield Advanced only

AWS WAF and Shield Advanced (see pricing)

Observability

The existing automatic mitigation and the Anti-DDoS managed rule group use separate Amazon CloudWatch namespaces and metric structures. The rule group gives you three tiers of observability: tier 1 tells you an attack is happening, tier 2 shows which requests it flagged and why, and tier 3 shows what it did about them. You don’t need all three on day 1 because most customer teams start at tier 1 to confirm detection is working, then add the others as they tune.

Tier 1: Event detection alarms

You can detect DDoS events using two CloudWatch metrics, each with its own namespace.

DDoSDetected (Shield)

DDoSAttackRequests (Anti-DDoS managed rule group)

Namespace

AWS/DDoSProtection

AWS/WAFV2

Requires Shield Advanced

Yes

No

Scope

L3, L4, and L7 events

L7 events only

Value during event

Binary (0 or 1)

Count of requests observed

Value outside event

Reported once daily (keeps metric alive)

Absent (no data points)

Dimensions

ResourceArn

Resource, ResourceType

What this means for your existing alarms:

  • After the application-layer automatic mitigation feature is sunset, DDoSDetected still fires for infrastructure layer 3 and layer 4 events, so your existing network layer and transport layer alarms remain valid. For the full list, see AWS Shield Advanced metrics.
  • DDoSAttackRequests is the Anti-DDoS managed rule group equivalent for application-layer event detection. Alarm on Sum >= 1 to detect any event, or set a volume threshold (for example, more than 10,000 requests per minute) for severity-based alerting.
  • During the evaluation period, both metrics fire independently and you can validate detection parity before migrating your application-layer alarms.
  • Because DDoSAttackRequests is absent when there are no active DDoS events, set treat-missing-data to missing or notBreaching for alarms on this metric.

Tier 2: Detection labels for custom monitoring

Every request the Anti-DDoS managed rule group evaluates gets a label. Where tier 1 tells you an attack started, tier 2 shows which requests looked suspicious and how confident the rule group was. The labels surface as AWS WAF metrics in the AWS/WAFV2 namespace: AllowedRequests, BlockedRequests, and CountRuleMatch. Each carries the LabelName and LabelNamespace dimensions under the awswaf:managed:aws:anti-ddos: namespace.

  • event-detected – Requests observed during a detected DDoS event
  • ddos-request – Requests identified as part of the attack
  • low-suspicion-ddos-request, medium-suspicion-ddos-request, high-suspicion-ddos-request – Graduated suspicion levels
  • challengeable-request – Requests eligible for browser challenge

Chart suspicion-level trends on a CloudWatch dashboard to see how an attack builds. Match on the labels in your own AWS WAF rules or dig into them in your AWS WAF logs with CloudWatch Logs Insights or Amazon Athena when you need to understand a specific event after the fact.

Tier 3: Mitigation action metrics

Where tier 2 shows what the rule group flagged, tier 3 shows what it did about those requests during an event. You’ll find these metrics as ChallengeRequests, BlockedRequests, and CountRuleMatch, each scoped by the rule label that produced it.

  • ChallengeAllDuringEvent – Requests challenged during an active event
  • ChallengeDDoSRequests – Suspected DDoS requests challenged based on suspicion level
  • DDoSRequests – Requests blocked (or counted in Count mode)

Watch these during a live event to see whether mitigation is keeping up. If you’re challenging far more requests than you’re blocking, your configuration might be too cautious, and you can raise the sensitivity level after you trust the numbers.

Observability summary

Tier

Automatic mitigation

Anti-DDoS managed rule group

Event alarm

DDoSDetected in AWS/DDoSProtection (binary, L3/L4/L7)

DDoSAttackRequests in AWS/WAFV2 (request count, L7)

Detection labels

None

event-detected, ddos-request, suspicion levels, challengeable-request

Mitigation actions

Not visible (Shield-managed rule group metrics not exposed)

ChallengeAllDuringEvent, ChallengeDDoSRequests, DDoSRequests

Dashboard

Shield console event history

Shield console and Anti-DDoS dashboard in the AWS WAF console

Historical analysis

Shield event history only

AWS WAF logs (CloudWatch Logs, Amazon Simple Storage Service (Amazon S3), Amazon Data Firehose)

Billing

Your Shield Advanced subscription includes the Anti-DDoS managed rule group for up to 50 billion requests per month, counted across your whole organization at the payer account level. For most customers that ceiling is well above normal traffic, so you won’t see a line item here unless you’re operating at very high volume. For the exact rates, see AWS WAF pricing and Shield Advanced pricing.

You aren’t charged for DDoS traffic while the Anti-DDoS managed rule group is actively mitigating, which means Block or Challenge mode rather than Count. This applies to AWS WAF request fees, Anti-DDoS managed rule group request fees, and Shield Advanced request charges. Leaving the rule group in Count mode past the evaluation period costs you the protection without the billing relief, so avoid staying in Count mode longer than you need to validate.

During the evaluation period (July 27 to September 30, 2026), the eligible web ACLs AWS auto-enrolled don’t incur per-request fees or WCU consumption, even when configured in Count mode.

The Anti-DDoS managed rule group works at the web ACL level, so every resource you associate with a web ACL shares that coverage. Before assuming a single resource accounts for the whole cost, look at how many resources sit behind each web ACL. A web ACL fronting 20 resources bills differently from one fronting 2, so check that count first and familiarize yourself with the workload protected by each web ACL.

Adding the Anti-DDoS managed rule group to a web ACL yourself isn’t part of the upgrade path, so standard pricing applies from the moment you enable it. The same is true for any resource that was already running the rule group before the rollout. To get the free evaluation, let the automatic rollout reach your web ACLs rather than adding the rule group ahead of it. There’s no penalty for adding it yourself; you just don’t receive the waiver on that web ACL.

Update your infrastructure as code

If you manage web ACLs with AWS CloudFormation, AWS Cloud Development Kit (AWS CDK), Terraform, or other infrastructure as code (IaC), the auto-upgrade changes your infrastructure configuration outside your templates. Your code is still the source of truth, so you need to do two things. First, change where the protection is declared. Today you enable application-layer automatic mitigation through the Shield API (EnableApplicationLayerAutomaticResponse), configured per protected resource. The Anti-DDoS managed rule group is configured through the AWS WAF API instead (CreateWebACL and UpdateWebACL), as a managed rule group statement inside the web ACL, scoped per web ACL rather than per resource. In IaC terms, you remove the Shield automatic-response block (for example, Terraform’s aws_shield_application_layer_automatic_response) and add the WAF managed rule group statement shown in the following section. Second, pull the upgraded web ACL back into your tooling before your next deploy, or your pipeline will try to revert the change.

For the full statement in Terraform, CloudFormation, and the AWS CDK, plus how to sync state after the auto-upgrade (terraform plan, CloudFormation drift detection, cdk diff), see the iac-webacl-examples helper.

Update your AWS Firewall Manager policy

If you run a Shield Advanced policy in AWS Firewall Manager today, that policy is what enabled application-layer automatic mitigation across your accounts. To keep that protection, add the Anti-DDoS managed rule group to an AWS WAF Firewall Manager policy. Your Shield Advanced policy still handles L3 and L4, while the application-layer piece moves to the AWS WAF policy. The migration is straightforward: add or reuse an AWS WAF Firewall Manager policy, put the Anti-DDoS managed rule group in it, and scope it to the same accounts and resources your Shield Advanced policy covers.

You can’t add the rule group from the Shield console or by editing an account-level web ACL directly, because Firewall Manager owns the web ACLs it creates and overwrites local edits. Instead, add the rule group to the AWS WAF policy and Firewall Manager pushes it to every in-scope account.

You can make this change in the console or as code. If you manage your Firewall Manager policies as code, don’t edit them in the console: add a new AWS WAF policy or update an existing one in your templates with the Anti-DDoS managed rule group included, and deploy it using the following Firewall Manager policies using IaC steps. Otherwise, use the console.

In the console, follow Creating an AWS Firewall Manager policy for AWS WAF to create the policy and reach the Edit policy rules page. Add the Anti-DDoS rule group, listed there as AWS AntiDDoS Protection for Layer 7 attacks (AWSManagedRulesAntiDDoSRuleSet), as a new rule group under First rule groups so it evaluates before your other managed groups, but below any Allow custom rules you use to fast-path known-good traffic.

If you protect CloudFront distributions, make this change in your Global policy, and repeat it in each AWS Regional policy for regional resources. Save the policy, and Firewall Manager rolls the change out to in-scope accounts, which can take a few minutes.

After being added, the rule group appears as the first rule group in the policy, as shown in the following screenshot:

Figure 1: AntiDDoS enabled

Figure 1: AntiDDoS enabled

Firewall Manager policies using IaC

If you manage Firewall Manager policies as code, make the change in your template instead of the console. The Anti-DDoS managed rule group goes into the AWS WAF policy’s ManagedServiceData, a WAFV2 policy definition carried as a JSON string, added to the first rule groups so it evaluates early. For the ManagedServiceData JSON with CloudFormation, Terraform, and AWS CDK examples, see the firewall-manager-examples helper.

Whichever path you take, scope the policy to the same accounts and resources your Shield Advanced policy already covers, so no resource loses application-layer protection during the move.

Getting started

Between July 27 and August 7, 2026, AWS will add the Anti-DDoS managed rule group in Count mode to Shield Advanced web ACLs that have resources using application layer automatic mitigation but not yet the Anti-DDoS rule group. After it reaches your web ACL, you can evaluate it, and migrate whenever you’re ready, without waiting for the October auto-upgrade.

  • Review the Anti-DDoS dashboard in the AWS WAF console. The dashboard shows real-time DDoS events, match metrics, and top traffic sources.
  • Compare event detection side by side. During Count mode, both systems detect independently. Check the DDoSDetected metric in AWS/DDoSProtection alongside DDoSAttackRequests in AWS/WAFV2 to validate detection parity for your resources. You can deploy the CloudWatch comparison dashboard from the AWS Samples repository to view both systems on a single dashboard.
  • Explore AWS WAF labels. Enable AWS WAF logging and query for labels in the awswaf:managed:aws:anti-ddos: namespace. Look at suspicion levels (low-suspicion-ddos-request, medium-suspicion-ddos-request, high-suspicion-ddos-request), event-detected, and challengeable-request to see per-request visibility into detected events.
  • Start with Low sensitivity for Block actions during evaluation to minimize false positive risk. Tune up as you gain confidence from the Anti-DDoS dashboard and AWS WAF label data.
  • Plan your configuration. Review sensitivity levels, URI exemptions for non-HTML paths, and web ACL priority placement. The Anti-DDoS managed rule group should run at the highest priority in your web ACL, or right below any custom rules with the Allow action.
  • Sync your IaC templates. After the auto-upgrade adds the Anti-DDoS managed rule group to your web ACL, fetch the current state into your IaC tooling (Terraform refresh, CloudFormation drift detection, AWS CDK import) before your next deployment.

Conclusion

The Anti-DDoS managed rule group profiles your traffic within minutes and mitigates within seconds, where the automatic mitigation it builds on established its baseline over hours, and it gives you granular visibility into what it’s doing. The evaluation period exists so you can watch both systems run on your own traffic before anything changes. Spend the first few weeks in Count mode confirming the new detection matches what you see today, then move your alarms over and pick a sensitivity level you’re comfortable with. If you run a web ACL across several resources, or you manage rules through AWS Firewall Manager, contact AWS Support before you start so you don’t have to unwind anything later. The Shield Advanced application-layer automatic mitigation feature retires on January 1, 2027, and anything still relying on it needs to be migrated by then.

Resources

    If you have feedback about this post, submit comments in the
    Comments section below.


    Eitav Arditti

    Eitav is a Senior Solutions Architect at AWS and a technology leader with over 15 years of experience in the tech industry. He specializes in edge computing, serverless, and platform engineering, and works with engineering teams to design secure, globally scalable architectures on CloudFront and AWS WAF. His current focus is on internet-scale systems—from global content delivery to edge security.

    Andrew Chen

    Andrew is a Senior Product Manager focused on DDoS protection at AWS. He leads the AWS Shield product line, helping safeguard both AWS infrastructure and customers from volumetric and network-layer threats. Andrew works closely with security and networking teams to strengthen internet safety.

    Justin Kurpius

    Justin is a Security Go-to-Market Specialist at AWS, based in Chicago, IL. He focuses on AWS edge and security services, including Amazon CloudFront, AWS WAF, AWS Shield, and AWS Firewall Manager, helping customers architect scalable, resilient web application defenses. Justin works across monetization strategy, ISV partnerships, and field enablement to accelerate adoption of the AWS edge security portfolio.