How to Migrate Your SMS Program to Amazon Pinpoint
In the fast-paced realm of communication, where every second counts and attention spans are shorter than ever, the choice of channels that you use to deliver your message to your recipients is critical. While we often find ourselves swept away by the allure of flashy social media platforms and sleek email interfaces, it’s the unassuming text message, or SMS, that continually proves to be one of the most effective options. According to Statista, there over 5 billion mobile internet users globally, amounting to over 60% of the earth’s population of ~8 billion. SMS obviously provides an expansive reach that can help businesses connect with a diverse audience but in order to do that at scale, you need to use a service like Amazon Pinpoint that facilitates the ability to send SMS to over 240 countries and/or regions around the world. If you have a current SMS provider and are considering Pinpoint SMS for its global reach, scalability, cost effective pricing, and demonstrably high deliverability, this guide will walk you through how to migrate from your current provider.
There are several common reasons our customers give us when considering a migration. Don’t worry if your situation doesn’t fit into a neat box, we help customers navigate the dynamic landscape of SMS that is constantly evolving. Let’s dive deep into each of the below to highlight some common things we hear from our customers.
My current provider doesn’t deliver to countries I want to send to
My current provider is more expensive than Pinpoint pricing
Our pricing is available on the public pricing page here. Each country has it’s own cost associated with it so enter in the countries you would like to see pricing for. These prices are per message sent so if you are planning on sending to multiple countries factor in the types of messages that you will want to send as well as the countries. If your use case includes 2 way communication make sure to factor the number of inbound messages you expect into your calculations.
NOTE: Depending on the language the available characters per message varies, which can affect your calculations on cost. See here for an explanation
My current provider doesn’t have features that Pinpoint has
Among many other features Pinpoint has the ability to send over multiple channels, including: SMS, Email, Push/In-App, Voice, Over the Top (OTT) services such as WhatsApp, as well as interact with third-party APIs giving you the flexibility to send to many other channels.
My current provider is not native to AWS
Pinpoint, being native to the AWS Cloud, boasts the capability to seamlessly integrate with a wide array of services, including AI/ML offerings such as Amazon Personalize, Amazon Bedrock, and Amazon SageMaker, among others. This means you can leverage various AWS services to create innovative solutions that enhance and optimize the communications sent through Pinpoint.
My current provider does not have good deliverability
Price is not the only factor to consider when looking at SMS providers. If you find another provider with lower pricing make sure to ask about their deliverability to the countries you are wanting to send to. There is a big difference between sending an SMS at a low price, and actually delivering that SMS. We are happy to discuss deliverability with you, just reach out to your Account Manager if you have one or contact us to start a conversation about your migration.
I’m not happy with the customer support of my current provider
The SMS landscape is constantly changing and our SMS experts are here to help guide you through the process. Whether it’s regulatory changes, pricing changes, or creating complex architectures to support your needs. Reach out to your Account Manager if you have one or contact us to start a conversation about your migration and get your questions answered.
Regardless of your reason for considering migrating there are four scenarios that most of our customers find themselves in when beginning to plan for an SMS migration.
I have not sent SMS before but I would like to start sending through Pinpoint Skip ahead to the section on “Checklist for Planning an SMS Migration” to start planning for sending SMS
I have number(s) (Also known as Originators, Origination Identities (OIDs), Toll-Free, 10DLC, Long Code, Short Code, and/or SenderID) with a different provider and I would like to move those to Pinpoint The ability to “port” numbers from other providers is dependent on the type of originator, the vendor you procured them from, and the country that they support. You may need to get new originators so factor that into your timeline and reach out to your Account Manager to determine whether your originators are able to be ported over. Once you have done that, pull the reports for how much volume you are sending to each country with your current provider and then skip ahead to the section on “Checklist for Planning an SMS Migration” to start planning for sending SMS
I have a current provider but I would like to procure new numbers from Pinpoint Pull the reports for how much volume you are sending to each country with your current provider and then skip ahead to the section on “Checklist for Planning an SMS Migration” to start planning for sending SMS
I have a current provider but would like to split traffic between them and Pinpoint Pull the reports for how much volume you are sending to the countries you plan on migrating to AWS and then skip ahead to the section on “Checklist for Planning an SMS Migration” to start planning for sending SMS. Make sure that you consider how you will be managing opt-outs across two providers. Pinpoint offers centrally managed opt-outs but self-management is also an option. All Delivery Receipts/Reporting (DLRs) and inbound/outbound events can be streamed through Amazon Kinesis, Amazon CloudWatch, and/or Amazon Simple Notification Service (SNS) if you need to send those events to another location inside or outside of the AWS Cloud.
NOTE: Not all countries support 2-way communications, which is the ability to have the recipient send a message back to the OID.
NOTE: Sender ID also does not support 2-way communication so if you are planning on using Sender ID you will need to account for how to opt recipients out of future communications.
Identify your countries
Take note of which countries require registration as this will affect your timeline
If you are already sending SMS with another provider pull a report over a representative time period.
Identify your throughput needs (Also referred to as Messages per Second, MPS, Transactions per Second, or TPS) for each country
Most origination identities are chosen for their ability to support a certain level of MPS, not volume, so if you have seasonality make sure to account for burst rates. There are quotas for the APIs that govern sending as well as quotas for the different types of originators.
If you have OIDs you would like to migrate make sure you determine whether that is possible ASAP since your timelines could be affected by the outcome.
Make sure you give ample time for your migration. There are many entities involved in delivering SMS, from governments, to mobile carriers, to third-party registrars, and more, which means that timelines are not always within your control. Ask questions, take advantage of the expert resources we have at AWS, and the content we have produced around these topics.
In the preceding entries of this series, we examined the transformative impact of Generative AI on marketing strategies in “Building Generative AI into Marketing Strategies: A Primer” and delved into the intricacies of Prompt Engineering to enhance the creation of marketing content with services such as Amazon Bedrock in “From Prompt Engineering to Auto Prompt Optimisation”. We also explored the potential of Large Language Models (LLMs) to refine prompts for more effective customer engagement.
Continuing this exploration, we will articulate how Amazon Bedrock, Amazon Personalize, and Amazon Pinpoint can be leveraged to construct a marketer portal that not only facilitates AI-driven content generation but also personalizes and distributes this content effectively. The aim is to provide a clear blueprint for deploying a system that crafts, personalizes, and distributes marketing content efficiently. This blog will guide you through the deployment process, underlining the real-world utility of these services in optimizing marketing workflows. Through use cases and a code demonstration, we’ll see these technologies in action, offering a hands-on perspective on enhancing your marketing pipeline with AI-driven solutions.
The Challenge with Content Generation in Marketing
Many companies struggle to streamline their marketing operations effectively, facing hurdles at various stages of the marketing operations pipeline. Below, we list the challenges at three main stages of the pipeline: content generation, content personalization, and content distribution.
Content Generation
Creating high-quality, engaging content is often easier said than done. Companies need to invest in skilled copywriters or content creators who understand not just the product but also the target audience. Even with the right talent, the process can be time-consuming and costly. Moreover, generating content at scale while maintaining quality and compliance to industry regulations is the key blocker for many companies considering adopting generative AI technologies in production environments.
Content Personalization
Once the content is created, the next hurdle is personalization. In today’s digital age, generic content rarely captures attention. Customers expect content tailored to their needs, preferences, and behaviors. However, personalizing content is not straightforward. It requires a deep understanding of customer data, which often resides in siloed databases, making it difficult to create a 360-degree view of the customer.
Content Distribution
Finally, even the most captivating, personalized content is ineffective if it doesn’t reach the right audience at the right time. Companies often grapple with choosing the appropriate channels for content distribution, be it email, social media, or mobile notifications. Additionally, ensuring that the content complies with various regulations and doesn’t end up in spam folders adds another layer of complexity to the distribution phase. Sending at scale requires paying attention to deliverability, security and reliability which often poses significant challenges to marketers.
By addressing these challenges, companies can significantly improve their marketing operations and empower their marketers to be more effective. But how can this be achieved efficiently and at scale? The answer lies in leveraging the power of Amazon Bedrock, Amazon Personalize, and Amazon Pinpoint, as we will explore in the following solution.
The Solution In Action
Before we dive into the details of the implementation, let’s take a look at the end result through the linked demo video.
Use Case 1: Banking/Financial Services Industry
You are a relationship manager working in the Consumer Banking department of a fictitious company called AnyCompany Bank. You are assigned a group of customers and would like to send out personalized and targeted communications to the channel of choice to every members of this group of customer.
Behind the scene, the marketer is utilizing Amazon Pinpoint to create the segment of customers they would like to target. The customers’ information and the marketer’s prompt are then fed into Amazon Bedrock to generate the marketing content, which is then sent to the customer via SMS and email using Amazon Pinpoint.
In the Prompt Iterator page, you can employ a process called “prompt engineering” to further optimize your prompt to maximize the effectiveness of your marketing campaigns. Please refer to this blog on the process behind engineering the prompt as well as how to apply an additional LLM model for auto-prompting. To get started, simply copy the sample banking prompt which has gone through the prompt engineering process in this page.
Next, you can either upload your customer group by uploading a .csv file (through “Importing a Segment”) or specify a customer group using pre-defined filter criteria based on your current customer database using Amazon Pinpoint.
E.g.: The screenshot shows a sample filtered segment named ManagementOrRetired that only filters to customers who are management or retirees.
Once done, you can log into the marketer portal and choose the relevant segment that you’ve just created within the Amazon Pinpoint console.
You can then preview the customers and their information stored in your Amazon Pinpoint’s customer database. Once satisfied, we’re ready to start generating content for those customers!
Click on 1:1 Content Generator tab, your content is automatically generated for your first customer. Here, you can cycle through your customers one by one, and depending on the customer’s preferred language and channel, an email or SMS in the preferred language is automatically generated for them.
Generated SMS in English
A negative example showing proper prompt-engineering at work to moderate content. This happens if we try to insert data that does not make sense for the marketing content generator to output. In this case, the marketing generator refuses to output (justifiably) an advertisement for a 6-year-old on a secured instalment loan.
Finally, we choose to send the generated content via Amazon Pinpoint by clicking on “Send with Amazon Pinpoint”. In the back end, Amazon Pinpoint will orchestrate the sending of the email/SMS through the appropriate channels.
Alternatively, if the auto-generated content still did not meet your needs and you want to generate another draft, you can Disagree and try again.
Use Case 2: Travel & Hospitality
You are a marketing executive that’s working for an online air ticketing agency. You’ve been tasked to promote a specific flight from Singapore to Hong Kong for AnyCompany airline. You’d first like to identify which customers would be prime candidates to promote this flight leg to and then send out hyper-personalized message to them.
Behind the scene, instead of using Amazon Pinpoint to manually define the segment, the marketer in this case is leveraging AIML capabilities of Amazon Personalize to define the best group of customers to recommend the specific flight leg to them. Similar to the above use case, the customers’ information and LLM prompt are fed into the AmazonBedrock, which generates the marketing content that is eventually sent out via Amazon Pinpoint.
Similar to the above use case, you’d need to go through a prompt engineering process to ensure that the content the LLM model is generating will be relevant and safe for use. To get started quickly, go to the Prompt Iterator page, you can use the sample airlines prompt and iterate from there.
Your company offers many different flight legs, aggregated from many different carriers. You first filter down to the flight leg that you want to promote using the Filters on the left. In this case, we are filtering for flights originating from Singapore (SRCCity) and going to Hong Kong (DSTCity), operated by AnyCompany Airlines.
Now, let’s choose the number of customers that you’d like to generate. Once satisfied, you choose to start the batch segmentation job.
In the background, Amazon Personalize generates a group of customers that are most likely to be interested in this flight leg based on past interactions with similar flight itineraries.
Once the segmentation job is finished as shown, you can fetch the recommended group of customers and start generating content for them immediately, similar to the first use case.
Setup instructions
The setup instructions and deployment details can be found in the GitHub link.
Conclusion
In this blog, we’ve explored the transformative potential of integrating Amazon Bedrock, Amazon Personalize, and Amazon Pinpoint to address the common challenges in marketing operations. By automating the content generation with Amazon Bedrock, personalizing at scale with Amazon Personalize, and ensuring precise content distribution with Amazon Pinpoint, companies can not only streamline their marketing processes but also elevate the customer experience.
The benefits are clear: time-saving through automation, increased operational efficiency, and enhanced customer satisfaction through personalized engagement. This integrated solution empowers marketers to focus on strategy and creativity, leaving the heavy lifting to AWS’s robust AI and ML services.
For those ready to take the next step, we’ve provided a comprehensive guide and resources to implement this solution. By following the setup instructions and leveraging the provided prompts as a starting point, you can deploy this solution and begin customizing the marketer portal to your business’ needs.
Call to Action
Don’t let the challenges of content generation, personalization, and distribution hold back your marketing potential. Deploy the Generative AI Marketer Portal today, adapt it to your specific needs, and watch as your marketing operations transform. For a hands-on start and to see this solution in action, visit the GitHub repository for detailed setup instructions.
Have a question? Share your experiences or leave your questions in the comment section.
About the Authors
Tristan (Tri) Nguyen
Tristan (Tri) Nguyen is an Amazon Pinpoint and Amazon Simple Email Service Specialist Solutions Architect at AWS. At work, he specializes in technical implementation of communications services in enterprise systems and architecture/solutions design. In his spare time, he enjoys chess, rock climbing, hiking and triathlon.
Philipp Kaindl
Philipp Kaindl is a Senior Artificial Intelligence and Machine Learning Solutions Architect at AWS. With a background in data science and mechanical engineering his focus is on empowering customers to create lasting business impact with the help of AI. Outside of work, Philipp enjoys tinkering with 3D printers, sailing and hiking.
Bruno Giorgini
Bruno Giorgini is a Senior Solutions Architect specializing in Pinpoint and SES. With over two decades of experience in the IT industry, Bruno has been dedicated to assisting customers of all sizes in achieving their objectives. When he is not crafting innovative solutions for clients, Bruno enjoys spending quality time with his wife and son, exploring the scenic hiking trails around the SF Bay Area.
Coban – Grab’s real-time data streaming platform – has been operating Kafka on Kubernetes with Strimzi in
production for about two years. In a previous article (Zero trust with Kafka), we explained how we leveraged Strimzi to enhance the security of our data streaming offering.
In this article, we are going to describe how we improved the fault tolerance of our initial design, to the point where we no longer need to intervene if a Kafka broker is unexpectedly terminated.
To make our operations easier and limit the blast radius of any incidents, we deploy exactly one Kafka cluster for each EKS cluster. We also give a full worker node to each Kafka broker. In terms of storage, we initially relied on EC2 instances with non-volatile memory express (NVMe) instance store volumes for
maximal I/O performance. Also, each Kafka cluster is accessible beyond its own Virtual Private Cloud (VPC) via a VPC Endpoint Service.
Fig. 1 Initial design of a 3-node Kafka cluster running on Kubernetes.
Fig. 1 shows a logical view of our initial design of a 3-node Kafka on Kubernetes cluster, as typically run by Coban. The Zookeeper and Cruise-Control components are not shown for clarity.
There are four Kubernetes services (1): one for the initial connection – referred to as “bootstrap” – that redirects incoming traffic to any Kafka pods, plus one for each Kafka pod, for the clients to target each Kafka broker individually (a requirement to produce or consume from/to a partition that resides on any particular Kafka broker). Four different listeners on the Network Load Balancer (NLB) listening on four different TCP ports, enable the Kafka clients to target either the bootstrap
service or any particular Kafka broker they need to reach. This is very similar to what we previously described in Exposing a Kafka Cluster via a VPC Endpoint Service.
Each worker node hosts a single Kafka pod (2). The NVMe instance store volume is used to create a Kubernetes Persistent Volume (PV), attached to a pod via a Kubernetes Persistent Volume Claim (PVC).
Lastly, the worker nodes belong to Auto-Scaling Groups (ASG) (3), one by Availability Zone (AZ). Strimzi adds in node affinity to make sure that the brokers are evenly distributed across AZs. In this initial design, ASGs are not for auto-scaling though, because we want to keep the size of the cluster under control. We only use ASGs – with a fixed size – to facilitate manual scaling operation and to automatically replace the terminated worker nodes.
With this initial design, let us see what happens in case of such a worker node termination.
Fig. 2 Representation of a worker node termination. Node C is terminated and replaced by node D. However the Kafka broker 3 pod is unable to restart on node D.
Fig. 2 shows the worker node C being terminated along with its NVMe instance store volume C, and replaced (by the ASG) by a new worker node D and its new, empty NVMe instance store volume D. On start-up, the worker node D automatically joins the Kubernetes cluster. The Kafka broker 3 pod that was running on the faulty worker node C is scheduled to restart on the new worker node D.
Although the NVMe instance store volume C is terminated along with the worker node C, there is no data loss because all of our Kafka topics are configured with a minimum of three replicas. The data is poised to be copied over from the surviving Kafka brokers 1 and 2 back to Kafka broker 3, as soon as Kafka broker 3 is effectively restarted on the worker node D.
However, there are three fundamental issues with this initial design:
The Kafka clients that were in the middle of producing or consuming to/from the partition leaders of Kafka broker 3 are suddenly facing connection errors, because the broker was not gracefully demoted beforehand.
The target groups of the NLB for both the bootstrap connection and Kafka broker 3 still point to the worker node C. Therefore, the network communication from the NLB to Kafka broker 3 is broken. A manual reconfiguration of the target groups is required.
The PVC associating the Kafka broker 3 pod with its instance store PV is unable to automatically switch to the new NVMe instance store volume of the worker node D. Indeed, static provisioning is an intrinsic characteristic of Kubernetes local volumes. The PVC is still in Bound state, so Kubernetes does not take any action. However, the actual storage beneath the PV does not exist anymore. Without any storage, the Kafka broker 3 pod is unable to start.
At this stage, the Kafka cluster is running in a degraded state with only two out of three brokers, until a Coban engineer intervenes to reconfigure the target groups of the NLB and delete the zombie PVC (this, in turn, triggers its re-creation by Strimzi, this time using the new instance store PV).
In the next section, we will see how we have managed to address the three issues mentioned above to make this design fault-tolerant.
Solution
Graceful Kafka shutdown
To minimise the disruption for the Kafka clients, we leveraged the AWS Node Termination Handler (NTH). This component provided by AWS for Kubernetes environments is able to cordon and drain a worker node that is going to be terminated. This draining, in turn, triggers a graceful shutdown of the Kafka
process by sending a polite SIGTERM signal to all pods running on the worker node that is being drained (instead of the brutal SIGKILL of a normal termination).
The termination events of interest that are captured by the NTH are:
Scale-in operations by an ASG.
Manual termination of an instance.
AWS maintenance events, typically EC2 instances scheduled for upcoming retirement.
This suffices for most of the disruptions our clusters can face in normal times and our common maintenance operations, such as terminating a worker node to refresh it. Only sudden hardware failures (AWS issue events) would fall through the cracks and still trigger errors on the Kafka client side.
Fig. 3 Architecture of the NTH with the Queue Processor.
Fig. 3 shows the NTH with the Queue Processor in action, and how it reacts to a scale-in operation (typically triggered manually, during a maintenance operation):
As soon as the scale-in operation is triggered, an Auto Scaling lifecycle hook is invoked to pause the termination of the instance.
Simultaneously, an Auto Scaling lifecycle hook event is issued to an Amazon Simple Queue Service (SQS) queue. In Fig. 3, we have also materialised EC2 events (e.g. manual termination of an instance, AWS maintenance events, etc.) that transit via Amazon EventBridge to eventually end up in the same SQS queue. We will discuss EC2 events in the next two sections.
The NTH, a pod running in the Kubernetes cluster itself, constantly polls that SQS queue.
When a scale-in event pertaining to a worker node of the Kubernetes cluster is read from the SQS queue, the NTH sends to the Kubernetes API the instruction to cordon and drain the impacted worker node.
On draining, Kubernetes sends a SIGTERM signal to the Kafka pod residing on the worker node.
Upon receiving the SIGTERM signal, the Kafka pod gracefully migrates the leadership of its leader partitions to other brokers of the cluster before shutting down, in a transparent manner for the clients. This behaviour is ensured by the controlled.shutdown.enable parameter of Kafka, which is enabled by default.
Once the impacted worker node has been drained, the NTH eventually resumes the termination of the instance.
Strimzi also comes with a terminationGracePeriodSeconds parameter, which we have set to 180 seconds to give the Kafka pods enough time to migrate all of their partition leaders gracefully on termination. We have verified that this is enough to migrate all partition leaders on our Kafka clusters (about 60 seconds for 600 partition leaders).
Manual termination of an instance
The Auto Scaling lifecycle hook that pauses the termination of an instance (Fig. 3, step 1) as well as the corresponding resuming by the NTH (Fig. 3, step 7) are invoked only for ASG scaling events.
In case of a manual termination of an EC2 instance, the termination is captured as an EC2 event that also reaches the NTH. Upon receiving that event, the NTH cordons and drains the impacted worker node. However, the instance is immediately terminated, most likely before the leadership of all of its Kafka partition leaders has had the time to get migrated to other brokers.
To work around this and let a manual termination of an EC2 instance also benefit from the ASG lifecycle hook, the instance must be terminated using the terminate-instance-in-auto-scaling-group AWS CLI command.
AWS maintenance events
For AWS maintenance events such as instances scheduled for upcoming retirement, the NTH acts immediately when the event is first received (typically adequately in advance). It cordons and drains the soon-to-be-retired worker node, which in turn triggers the SIGTERM signal and the graceful termination of Kafka as described above. At this stage, the impacted instance is not terminated, so the Kafka partition leaders have plenty of time to complete their migration to other brokers.
However, the evicted Kafka pod has nowhere to go. There is a need for spinning up a new worker node for it to be able to eventually restart somewhere.
To make this happen seamlessly, we doubled the maximum size of each of our ASGs and installed the Kubernetes Cluster Autoscaler. With that, when such a maintenance event is received:
The worker node scheduled for retirement is cordoned and drained by the NTH. The state of the impacted Kafka pod becomes Pending.
The Kubernetes Cluster Autoscaler comes into play and triggers the corresponding ASG to spin up a new EC2 instance that joins the Kubernetes cluster as a new worker node.
The impacted Kafka pod restarts on the new worker node.
The Kubernetes Cluster Autoscaler detects that the previous worker node is now under-utilised and terminates it.
In this scenario, the impacted Kafka pod only remains in Pending state for about four minutes in total.
In case of multiple simultaneous AWS maintenance events, the Kubernetes scheduler would honour our PodDisruptionBudget and not evict more than one Kafka pod at a time.
Dynamic NLB configuration
To automatically map the NLB’s target groups with a newly spun up EC2 instance, we leveraged the AWS Load Balancer Controller (LBC).
Let us see how it works.
Fig. 4 Architecture of the LBC managing the NLB’s target groups via TargetGroupBinding custom resources.
Fig. 4 shows how the LBC automates the reconfiguration of the NLB’s target groups:
It first retrieves the desired state described in Kubernetes custom resources (CR) of type TargetGroupBinding. There is one such resource per target group to maintain. Each TargetGroupBinding CR associates its respective target group with a Kubernetes service.
The LBC then watches over the changes of the Kubernetes services that are referenced in the TargetGroupBinding CRs’ definition, specifically the private IP addresses exposed by their respective Endpoints resources.
When a change is detected, it dynamically updates the corresponding NLB’s target groups with those IP addresses as well as the TCP port of the target containers (containerPort).
This automated design sets up the NLB’s target groups with IP addresses (targetType: ip) instead of EC2 instance IDs (targetType: instance). Although the LBC can handle both target types, the IP address approach is actually more straightforward in our case, since each pod has a routable private IP address in the AWS subnet, thanks to the AWS Container Networking Interface (CNI) plug-in.
This dynamic NLB configuration design comes with a challenge. Whenever we need to update the Strimzi CR, the rollout of the change to each Kafka pod in a rolling update fashion is happening too fast for the NLB. This is because the NLB inherently takes some time to mark each target as healthy before enabling it. The Kafka brokers that have just been rolled out start advertising their broker-specific endpoints to the Kafka clients via the bootstrap service, but those
endpoints are actually not immediately available because the NLB is still checking their health. To mitigate this, we have reduced the HealthCheckIntervalSeconds and HealthyThresholdCount parameters of each target group to their minimum values of 5 and 2 respectively. This reduces the maximum delay for the NLB to detect that a target has become healthy to 10 seconds. In addition, we have configured the LBC with a Pod Readiness Gate. This feature makes the Strimzi rolling deployment wait for the health check of the NLB to pass, before marking the current pod as Ready and proceeding with the next pod.
Fig. 5 Steps for a Strimzi rolling deployment with a Pod Readiness Gate. Only one Kafka broker and one NLB listener and target group are shown for simplicity.
Fig. 5 shows how the Pod Readiness Gate works during a Strimzi rolling deployment:
The old Kafka pod is terminated.
The new Kafka pod starts up and joins the Kafka cluster. Its individual endpoint for direct access via the NLB is immediately advertised by the Kafka cluster. However, at this stage, it is not reachable, as the target group of the NLB still points to the IP address of the old Kafka pod.
The LBC updates the target group of the NLB with the IP address of the new Kafka pod, but the NLB health check has not yet passed, so the traffic is not forwarded to the new Kafka pod just yet.
The LBC then waits for the NLB health check to pass, which takes 10 seconds. Once the NLB health check has passed, the NLB resumes forwarding the traffic to the Kafka pod.
Finally, the LBC updates the pod readiness gate of the new Kafka pod. This informs Strimzi that it can proceed with the next pod of the rolling deployment.
Data persistence with EBS
To address the challenge of the residual PV and PVC of the old worker node preventing Kubernetes from mounting the local storage of the new worker node after a node rotation, we adopted Elastic Block Store (EBS) volumes instead of NVMe instance store volumes. Contrary to the latter, EBS volumes can conveniently be attached and detached. The trade-off is that their performance is significantly lower.
However, relying on EBS comes with additional benefits:
The cost per GB is lower, compared to NVMe instance store volumes.
Using EBS decouples the size of an instance in terms of CPU and memory from its storage capacity, leading to further cost savings by independently right-sizing the instance type and its storage. Such a separation of concerns also opens the door to new use cases requiring disproportionate amounts of storage.
After a worker node rotation, the time needed for the new node to get back in sync is faster, as it only needs to catch up the data that was produced during the downtime. This leads to shorter maintenance operations and higher iteration speed. Incidentally, the associated inter-AZ traffic cost is also lower, since there is less data to transfer among brokers during this time.
Increasing the storage capacity is an online operation.
Data backup is supported by taking snapshots of EBS volumes.
We have verified with our historical monitoring data that the performance of EBS General Purpose 3 (gp3) volumes is significantly above our maximum historical values for both throughput and I/O per second (IOPS), and we have successfully benchmarked a test EBS-based Kafka cluster. We have also set up new monitors to be alerted in case we need to
provision either additional throughput or IOPS, beyond the baseline of EBS gp3 volumes.
With that, we updated our instance types from storage optimised instances to either general purpose or memory optimised instances. We added the Amazon EBS Container Storage Interface (CSI) driver to the Kubernetes cluster and created a new Kubernetes storage class to let the cluster dynamically provision EBS gp3 volumes.
We configured Strimzi to use that storage class to create any new PVCs. This makes Strimzi able to automatically create the EBS volumes it needs, typically when the cluster is first set up, but also to attach/detach the volumes to/from the EC2 instances whenever a Kafka pod is relocated to a different worker node.
Note that the EBS volumes are not part of any ASG Launch Template, nor do they scale automatically with the ASGs.
Fig. 6 Steps for the Strimzi Operator to create an EBS volume and attach it to a new Kafka pod.
Fig. 6 illustrates how this works when Strimzi sets up a new Kafka broker, for example the first broker of the cluster in the initial setup:
The Strimzi Cluster Operator first creates a new PVC, specifying a volume size and EBS gp3 as its storage class. The storage class is configured with the EBS CSI Driver as the volume provisioner, so that volumes are dynamically provisioned [1]. However, because it is also set up with volumeBindingMode: WaitForFirstConsumer, the volume is not yet provisioned until a pod actually claims the PVC.
The Strimzi Cluster Operator then creates the Kafka pod, with a reference to the newly created PVC. The pod is scheduled to start, which in turn claims the PVC.
This triggers the EBS CSI Controller. As the volume provisioner, it dynamically creates a new EBS volume in the AWS VPC, in the AZ of the worker node where the pod has been scheduled to start.
It then attaches the newly created EBS volume to the corresponding EC2 instance.
After that, it creates a Kubernetes PV with nodeAffinity and claimRef specifications, making sure that the PV is reserved for the Kafka broker 1 pod.
Lastly, it updates the PVC with the reference of the newly created PV. The PVC is now in Bound state and the Kafka pod can start.
One important point to take note of is that EBS volumes can only be attached to EC2 instances residing in their own AZ. Therefore, when rotating a worker node, the EBS volume can only be re-attached to the new instance if both old and new instances reside in the same AZ. A simple way to guarantee this is to set up one ASG per AZ, instead of a single ASG spanning across 3 AZs.
Also, when such a rotation occurs, the new broker only needs to synchronise the recent data produced during the brief downtime, which is typically an order of magnitude faster than replicating the entire volume (depending on the overall retention period of the hosted Kafka topics).
Table 1 Comparison of the resynchronization of the Kafka data after a broker rotation between the initial design and the new design with EBS volumes.
Initial design (NVMe instance store volumes)
New design (EBS volumes)
Data to synchronise
All of the data
Recent data produced during the brief downtime
Function of (primarily)
Retention period
Downtime
Typical duration
Hours
Minutes
Outcome
With all that, let us revisit the initial scenario, where a malfunctioning worker node is being replaced by a fresh new node.
Fig. 7 Representation of a worker node termination after implementing the solution. Node C is terminated and replaced by node D. This time, the Kafka broker 3 pod is able to start and serve traffic.
Fig. 7 shows the worker node C being terminated and replaced (by the ASG) by a new worker node D, similar to what we have described in the initial problem statement. The worker node D automatically joins the Kubernetes cluster on start-up.
However, this time, a seamless failover takes place:
The Kafka clients that were in the middle of producing or consuming to/from the partition leaders of Kafka broker 3 are gracefully redirected to Kafka brokers 1 and 2, where Kafka has migrated the leadership of its leader partitions.
The target groups of the NLB for both the bootstrap connection and Kafka broker 3 are automatically updated by the LBC. The connectivity between the NLB and Kafka broker 3 is immediately restored.
Triggered by the creation of the Kafka broker 3 pod, the Amazon EBS CSI driver running on the worker node D re-attaches the EBS volume 3 that was previously attached to the worker node C, to the worker node D instead. This enables Kubernetes to automatically re-bind the corresponding PV and PVC to Kafka broker 3 pod. With its storage dependency resolved, Kafka broker 3 is able to start successfully and re-join the Kafka cluster. From there, it only needs to catch up with the new data that was produced
during its short downtime, by replicating it from Kafka brokers 1 and 2.
With this fault-tolerant design, when an EC2 instance is being retired by AWS, no particular action is required from our end.
Similarly, our EKS version upgrades, as well as any operations that require rotating all worker nodes of the cluster in general, are:
Simpler and less error-prone: We only need to rotate each instance in sequence, with no need for manually reconfiguring the target groups of the NLB and deleting the zombie PVCs anymore.
Faster: The time between each instance rotation is limited to the short amount of time it takes for the restarted Kafka broker to catch up with the new data.
More cost-efficient: There is less data to transfer across AZs (which is charged by AWS).
It is worth noting that we have chosen to omit Zookeeper and Cruise Control in this article, for the sake of clarity and simplicity. In reality, all pods in the Kubernetes cluster – including Zookeeper and Cruise Control – now benefit from the same graceful stop, triggered by the AWS termination events and the NTH. Similarly, the EBS CSI driver improves the fault tolerance of any pods that use EBS volumes for persistent storage, which includes the Zookeeper pods.
Challenges faced
One challenge that we are facing with this design lies in the EBS volumes’ management.
On the one hand, the size of EBS volumes cannot be increased consecutively before the end of a cooldown period (minimum of 6 hours and can exceed 24 hours in some cases [2]). Therefore, when we need to urgently extend some EBS volumes because the size of a Kafka topic is suddenly growing, we need to be relatively generous when sizing the new required capacity and add a comfortable security margin, to make sure that we are not running out of storage in the short run.
On the other hand, shrinking a Kubernetes PV is not a supported operation. This can affect the cost efficiency of our design if we overprovision the storage capacity by too much, or in case the workload of a particular cluster organically diminishes.
One way to mitigate this challenge is to tactically scale the cluster horizontally (ie. adding new brokers) when there is a need for more storage and the existing EBS volumes are stuck in a cooldown period, or when the new storage need is only temporary.
What’s next?
In the future, we can improve the NTH’s capability by utilising webhooks. Upon receiving events from SQS, the NTH can also forward the events to the specified webhook URLs.
This can potentially benefit us in a few ways, e.g.:
Proactively spinning up a new instance without waiting for the old one to be terminated, whenever a termination event is received. This would shorten the rotation time even further.
Sending Slack notifications to Coban engineers to keep them informed of any actions taken by the NTH.
We would need to develop and maintain an application that receives webhook events from the NTH and performs the necessary actions.
In addition, we are also rolling out Karpenter to replace the Kubernetes Cluster Autoscaler, as it is able to spin up new instances slightly faster, helping reduce the four minutes delay a Kafka pod remains in Pending state during a node rotation. Incidentally, Karpenter also removes the need for setting up one ASG by AZ, as it is able to deterministically provision instances in a specific AZ, for example where a particular EBS volume resides.
Lastly, to ensure that the performance of our EBS gp3 volumes is both sufficient and cost-efficient, we want to explore autoscaling their throughput and IOPS beyond the baseline, based on the usage metrics collected by our monitoring stack.
We would like to thank our team members and Grab Kubernetes gurus that helped review and improve this blog before publication: Will Ho, Gable Heng, Dewin Goh, Vinnson Lee, Siddharth Pandey, Shi Kai Ng, Quang Minh Tran, Yong Liang Oh, Leon Tay, Tuan Anh Vu.
Join us
Grab is the leading superapp platform in Southeast Asia, providing everyday services that matter to consumers. More than just a ride-hailing and food delivery app, Grab offers a wide range of on-demand services in the region, including mobility, food, package and grocery delivery services, mobile payments, and financial services across 428 cities in eight countries.
Powered by technology and driven by heart, our mission is to drive Southeast Asia forward by creating economic empowerment for everyone. If this mission speaks to you, join our team today!
It seems like it was just yesterday that we were in Las Vegas for AWS Re:Invent, but it’s already been almost two weeks since the conference wrapped up. As is always the case, AWS unveiled a host of new services throughout the week, including advancements around serverless, artificial intelligence (AI) and Machine Learning (ML), security and more.
There were a ton of really exciting announcements, but a few stood out to me. Before we dive into the new and updated services we now support in InsightCloudSec, let’s take a second to highlight a few of them and why they’re of note.
Highlights from AWS’ New Service Announcements during Re:Invent
Amazon Bedrockgeneral availability was announced back in October, re:Invent brought with it announcements of new capabilities including customized models, GenAI applications to execute multi-step tasks, and Guardrails announced in preview. New Security Hub functionalities were introduced, including centralized governance, custom controls and a refresh of the dashboard.
Serverless innovationsinclude updates to Amazon Aurora Limitless Database, Amazon ElasticCache Serverless, and AI-driven Amazon Redshift Serverless adding greater scaling and efficiency to their database and analytics offerings. Serverless architectures bring scalability and flexibility, however security and risk considerations shift away from traditional network traffic inspection and access control lists, towards IAM hygiene, system identity behavioral analysis along with code integrity and validation.
Amazon Datazone general availability, like Bedrock, was originally announced in October and got some new innovations showcased during Re:Invent including business driven domains and data catalog, projects and environments, and the ability for data workers to publish and data consumers to subscribe to workflows. Available in open preview for Datazone are automated, AI-driven recommendations for metadata-driven business descriptions and specific columns and analytical applications based on business units.
One of the most exciting announcements from Re:Invent this year was Amazon Q, Amazon’s new GenAI-powered Virtual Assistant. Q was also integrated into Amazon’s Business Intelligence (BI) service, QuickSight, which has been supported in InsightCloudSec for some time now.
Having released our support forAmazon OpenSearch last year, this year’s re:Invent brought some exciting updates that are worth mentioning here. Now generally available is Vector Engine for OpenSearch Serverless, which enables users to store and quickly search vector embeddings for GenAI applications. AWS also announced the OR1 Instance family, which is compute optimized specifically for OpenSearch and also a new zero-ETL integration withS3.
Expanded Resource Coverage in InsightCloudSec
It’s very important to us here at Rapid7 that we provide our customers with the peace of mind to know when their teams leave these events and begin implementing new innovations from AWS that they’re doing so securely. To that end, the days and weeks following Re:Invent is always a bit of a sprint, and this year was no exception.
The Coverage and Analysis team loves a challenge though, and in my totally unbiased opinion — we’ve delivered something special. Our latest release featured new support for a variety of the new services announced during Re:Invent, as well as, a number of existing services we’ve expanded support for in relation to updates announced by AWS. We’ve added support for 6 new services that were either announced or updated during the show. We’ve also added 25 new Insights, all of which have been applied to our existing AWS Foundational Security Best Practices pack, AWS Center for Internet Security (CIS) 2.0 compliance pack, as well as new AWS relevant updates to NIST SP800-53 (Rev 5).
The newly supported services are:
Bedrock, a fully managed service that allows users to build generative AI applications in the cloud by providing a set of foundational models both from AWS and 3rd party vendors.
Clean Rooms, which enables customers to collaborate and analyze data securely in ‘clean rooms’ in minutes with any other company on joint initiatives without sharing real raw data.
AWS Control Tower (January 2024 Release), a management service that can be used to create and orchestrate a multi-account AWS environment in accordance with AWS best practices including the Well-Architected Framework.
Along with support for newly-added services, we’ve also expanded our coverage around the host of existing services as well. We’ve added or expanded support for the following security and serverless solutions:
Network Firewall, which provides fine-grained control over network traffic.
Security Hub, anAWS’ native service that provides CSPM functionality, aggregating security and compliance checks.
Glue, a serverless data integration service that makes it easy for analytics users to discover, prepare, move, and integrate data from multiple sources, empowering your analytics and ML projects.
Helping Teams Securely Build AI/ML Applications in the Cloud
One of the most exciting elements to come out of the past few weeks with the addition of AWS Bedrock, is our extended coverage for AI and ML solutions that we are now able to provide across cloud providers for our customers. Supporting AWS Bedrock, along with GCP Vertex and Azure OpenAI Service has enabled us to build a very exciting new feature as part of our Compliance Packs.
Machine learning, artificial intelligence, and analytics were driving themes of this year’s conference, so it makes me very happy to announce that we now offer a dedicated Rapid7 AI/ML Security Best Practices compliance pack. If interested, I highly recommend you keep an eye out in the coming days for my colleague Kathryn Lynas-Blunt’s blog discussing how Rapid7 enables teams to securely build AI applications in the cloud.
As a cloud enthusiast, AWS re:Invent never fails to deliver on innovation, excitement and shared learning experiences. As we continue our partnership with AWS, I’m very excited for all that 2024 holds in store. Until next year!
Cloud environments differ in a number of ways from more traditional on-prem environments. From the immense scale and compounding complexity to the rate of change, the cloud creates a host of challenges for security teams to navigate and grapple with. By definition, anything running in the cloud has the potential to be made publicly available, either directly or indirectly. The interconnected nature of these environments is such that when one account, resource, or service is compromised, it can be fairly easy for a bad actor to move laterally across your environment and/or grant themselves the permissions to wreak havoc. These avenues for lateral movement or privilege escalation are often referred to as attack paths.
Having a solution in place that can clearly and dynamically detect and depict these attack paths is critical to helping teams not only understand where risks exist across their environment but arguably more importantly how they are most likely to be exploited and what that means for an organization – particularly with respect to protecting high-value assets.
Detect and Remediate Attack Paths With InsightCloudSec
Attack Path Analysis in InsightCloudSec enables Rapid7 customers to see their cloud environments from the perspective of an attacker. It visualizes the various ways an attacker could gain access, move between resources, and compromise the cloud environment. Attack Paths are high fidelity signals in our risk prioritization model that focuses on identifying toxic combinations that lead to real business impact.
Since Rapid7 initially launched Attack Path Analysis, we’ve continued to roll out incremental updates to the feature, primarily in the form of expanded attack path coverage across each of the major cloud service providers (CSPs). In our most recent InsightCloudSec release (12.12.2023), we’ve continued this momentum, announcing additional attack paths as well as some exciting updates around how we visualize risk across paths and the potential blast radius should a compromised resource within an existing attack path be exploited. In this post, we’ll dive into an example of one of our recently added attack paths for Microsoft Azure along with a bit more detail about the new risk visualizations. So with that, let’s jump right in.
Expanding Coverage With New Attack Paths
First, on the coverage side of things we’ve added seven new paths in recent releases across AWS and Azure. Our AWS coverage was extended to support ECS across all of our AWS Attack Paths, and we also introduced 3 new Azure Attack paths. In the interest of brevity, we won’t cover each of them, but we do have an ever-developing list of supported attack paths you can access here on the docs page. As an example, however, let’s dive into one of the new paths we released for Azure, which identifies the presence of attack paths targeting publicly exposed instances that also have attached privileged roles.
This type of attack path is concerning for a couple of reasons: First and foremost, an attacker could use the publicly exposed instance as an inroad to your cloud environment due to the fact that it’s publicly accessible, gaining access to sensitive data on the resource itself or accessing data the resource in question has indirect access to. Secondly, since the attached role is capable of escalating privileges, an attacker could then leverage the resource to assign themselves admin permissions which could in turn be used to open up new attack vectors.
Because this could have wide-reaching ramifications should it be exploited, we’ve assigned this a critical severity. That means we’ll want to work to resolve this as fast as possible any time this path shows up across our cloud environments, maybe even automating the process of closing down public access or adjusting the resource permissions to limit the potential for lateral movement or privilege escalation. Speaking of paths with widespread impact should they be exploited, that brings me to some other exciting updates we’ve rolled out to Attack Path Analysis.
Clearly Visualizing Risk Severity and Potential Blast Radius
As I mentioned earlier, along with expanded coverage, we’ve also updated Attack Path Analysis to make it clearer for users where your riskiest assets lie across a given attack path and to clearly show the potential blast radius of an exploitation.
To make it easier to understand the overall riskiness of an attack path and where its choke points are, we’ve added a new security view that visualizes the risk of each resource along a given path. This new view makes it very easy for security teams to immediately understand which specific resources present the highest risk and where they should be focusing their remediation efforts to block potential attackers in their tracks.
In addition to this new security-focused view, we’ve also extended Attack Path Analysis to show a potential blast radius by displaying a graph-based topology map that helps clearly outline the various ways resources across your environment – and specifically within an attack path – interconnect with one another.
This topology map not only makes it easier for security teams to quickly hone in on what needs their attention first during an investigation, but also where a bad actor could move next. Additionally, this view helps security teams and leaders in communicating risk across the organization, particularly when engaging with non-technical stakeholders that find it difficult to understand why exactly a compromised resource presents a potentially larger risk to the business.
We will continue to expand on our existing Attack Path Analysis capabilities in the future, so be sure to keep an eye out for additional paths being added in the coming months as well as a continued effort to enable security teams to more quickly analyze cloud risk with the context needed to effectively detect, communicate, prioritize, and respond.
Cloud-based service platforms are becoming increasingly popular, and one of the most widely adopted is Amazon Web Services (AWS). Like many cloud services, AWS charges a user fee, which has led many users to look for a breakdown of which specific services they are being charged for. Fortunately, Zabbix has an AWS Cost Explorer over HTTP template that’s ready to run right out of the box and provides a list of daily and monthly maintenance costs.
Why monitor AWS costs?
While AWS cost data is stored for 12 months, Zabbix allows data to be stored for up to 25 years (see Keep lost resources period). The Keep lost resources period is a vital parameter for storing data longer than 12 months since the cost data removed from AWS will result in the discovered items becoming lost. Therefore, if we want to keep our cost data for a period longer than 12 months, Keep lost resources period parameter needs to be adjusted accordingly.
In addition, Zabbix can show fees charged for unavailable services, such as test deployments for a cluster in the us-east-1 region.
Preparing to monitor in a few easy steps
I recommend visiting zabbix.com/integrations/aws for any sources referred to in this tutorial. You can also find a link to all Zabbix templates there. For the most part, we will follow the steps outlined in the readme.
The AWS Cost Explorer by HTTP template can use key-based and role-based authorization. Set the following macros {$AWS.AUTH_TYPE}, possible values: role_base, access_key (using by default).
If you are using access key-based authorization, be sure set the following macros {$AWS.ACCESS.KEY.ID}, {$AWS.SECRET.ACCESS.KEY}.
Create or use an existing access key, which you can get from Identity and Access Management (IAM).
Accessing the IAM Console:
Log in to your AWS Management Console.Navigate to the IAM service.
Next, go to the Users tab and select the required user.
Creating a access key for monitoring:
After that, go to the Security credentials tab.
Select Create access key.
Add the following required permissions to your Zabbix IAM policy in order to collect metrics.
Defining Permissions through IAM Policies:
Access the “Policies” section within IAM.
Click on “Create Policy”.
Select the JSON tab to define policy permissions.
Provide a meaningful name and description for the policy.
Structure the policy document based on the permissions needed for the AWS Cost Explorer by HTTP template.
– Search for and select the policy created in the previous step.
– Review the attached policies to ensure they align with the intended permissions for the user.
Creating a host in Zabbix
Now, let’s create a host that will represent the metrics available via the Cost Explorer API:
Create a Host Group in which to put hosts related to AWS. For this example, let’s create one that we’ll call AWS Cloud.
Head to the host page under Configuration and click Create host. Give this host the name AWS Cost. We’ll also assign this host to the AWS Cloud group we created and attach the AWS Cost Explorer template by HTTP.
Click the Macros tab and select Inherited and host macros. In this case, we need to change the first two macros. The first, {$AWS.ACCESS.KEY.ID}, should be set to the received access key ID. For the second, {$AWS.SECRET.ACCESS.KEY}, the secret access key should be set to the previously retrieved value from the Security credentials tab.
Click Add. The AWS Cost Explorer template has three low-level discovery rules that use master items. The low-level discovery rules will start discovering resources only after the master item has collected the required data.
The best practice is to always test such items for data. Don’t forget to fill in the required macros!
In AWS daily costs by services and AWS monthly costs by services discovery you can filter by service, which can be specified in macros.
Let’s execute the master items to collect the required data on-demand. Choose both items to get data and click Execute now.
In a few minutes, you should receive cost metrics by services for 12 months plus the current month, as well as by day. If you want the information to be stored longer, remember to change the Keep lost resources period in the LLD rule, as it’s set to 30 days by default.
Businesses are constantly looking for better ways to engage with customer communities, but it’s hard to do when profile data is limited to user-completed form input or messaging campaign interaction metrics. Neither of these data sources tell a business much about their customer’s interests or preferences when they’re engaging with that community.
To bridge this gap for their community of customers, AWS Game Tech created the Cohort Modeler: a deployable solution for developers to map out and classify player relationships and identify like behavior within a player base. Additionally, the Cohort Modeler allows customers to aggregate and categorize player metrics by leveraging behavioral science and customer data. In our first blog post, we talked about how to extend Cohort Modeler’s functionality.
In this post, you’ll learn how to:
Use the extension we built to create the first part of the Community Engagement Flywheel.
Process the user extract from the Cohort Modeler and import the data into Amazon Pinpoint as a messaging-ready Segment.
Send email to the users in the Cohort via Pinpoint’s powerful and flexible Campaign functionality.
Use Case Examples for The Cohort Modeler
For this example, we’re going to retrieve a cohort of individuals from our Cohort Modeler who we’ve identified as at risk:
Maybe they’ve triggered internal alarms where they’ve shared potential PII with others over cleartext.
Maybe they’ve joined chat channels known to be frequented by some of the game’s less upstanding citizens.
Either way, we want to make sure they understand the risks of what they’re doing and who they’re dealing with.
Pinpoint provides various robust methods to import user contact and personalization data in specific formats, and once Pinpoint has ingested that data, you can use Campaigns or Journeys to send customized and personalized messaging to your cohort members – either via automation, or manually via the Pinpoint Console.
Architecture overview
In this architecture, you’ll create a simple Amazon DynamoDB table that mimics a game studio’s database of record for its customers. You’ll then create a Trigger for Amazon Simple Storage Service (Amazon S3) bucket that will ingest the Cohort Modeler extract (created in the prior blog post) and convert it into a CSV file that Pinpoint can ingest. Lastly, once generated, the AWS Lambda function will prompt Pinpoint to automatically ingest the CSV as a static segment.
Once the automation is complete, you’ll use Pinpoint’s console to quickly and easily create a Campaign, including an HTML mail template, to the imported segment of players you identified as at risk via the Cohort Modeler.
Prerequisites
At this point, you should have completed the steps in the prior blog post, Extending the Cohort Modeler. This is all you’ll need to proceed.
Walkthrough
Messaging your Cohort
Now that we’ve extended the Cohort Modeler and built a way to extract cohort data into an S3 bucket, we’ll transform that data into a Segment in Pinpoint, and use the Pinpoint Console to send a message to the members of the Cohort via a Pinpoint Campaign. In this walkthrough, you’ll:
Create a Pinpoint Project to import your Cohort Segments.
Create a Dynamo table to emulate your database of record for your players.
Create an S3 bucket to hold the cohort contact data CSV file.
Create a Lambda trigger to respond to Cohort Modeler export events and kick off Pinpoint import jobs.
Create and send a Pinpoint Campaign using the imported Segment.
Create the Pinpoint Project
You’ll need a Pinpoint Project (sometimes referred to as an “App”) to send messaging to your cohort members, so navigate to the Pinpoint console and click Create a Project.
Sign in to the AWS Management Console and open the Pinpoint Console.
If this is your first time using Amazon Pinpoint, you will see a page that introduces you to the features of the service. In the Get started section, you’ll need to enter the name you want to call your project. We used ‘CohortModelerPinpoint‘ but you can use whatever you’d like.
On the following screen, the Configure features page, you’ll want to choose Configure in the Email section.
Pinpoint will ask you for an email address you want to validate, so that when email goes out, it will use your email address as the FROM header in your email. Enter the email address you want to use as your sending address, and Choose Verify email address.
Check the inbox of the address that you entered and look for an email from [email protected]. Open the email and click the link in the email to complete the verification process for the email address.
Note: Once you have verified your email identity, you may receive an alert prompting you to update your email address’ policy. If so, highlight your email under All identities, and choose Update policy. To complete this update, Enter confirm where requested, and choose Update.
Later on, when you’re asked for your Pinpoint Project ID, this can accessed by choosing All projects from the Pinpoint navigation pane. From there, next to your project name, you will see the associated Project ID.
Create the Dynamo Table
For this step, you’re emulating a game studio’s database of record for its players, and therefore the Lambda function that you’re creating, (to merge Cohort Modeler data with the database of record) is also an emulation.
In a real-world situation, you would use the same ingestion method as the S3TriggerCohortIngest.py example that will be created further below. However, instead of using placeholder data, you would use the ‘playerId’ information extracted from the Cohort Modeler. This would allow you to formulate a specific query against your main database, whether it requires an SQL statement, or some other type of database query.
Creating the Table
Navigate to the DynamoDB Console. You’re going to create a table with ‘playerId’ as the Primary key, and four additional attributes: email, favorite role, first name, and last name.
In the navigation pane, choose Tables. On the next page, in the Tables section, choose Create table.
In the Table details section, we entered userdata for our Table name. (In order to maintain simple compatibility with the scripts that follow, it is recommended that you do the same.)
For Partition key, enter playerId and leave the data type as String.
Intentionally leave the Sort key blank and the data type as String.
Below, in the Table settings section, leave everything at their Default settings value.
Scroll to the end of the page and choose Create table.
Adding Synthetic Data
You’ll need some synthetic data in the database, so that your Cohort Modeler-Pinpoint integration can query the database, retrieve contact information, and then import that contact information into Pinpoint as a Segment.
From the DynamoDB Tables section, choose your newly created Table by selecting its name. (The name preferably being userdata).
In the DynamoDB navigation pane, choose Explore items.
From the Items returned section, choose Create item.
Once on the Create item page, ensure that the Formview is highlighted and not the JSON view. You’re going to create a new entry in the table. Cohort Modeler creates the same synthetic information each time it’s built, so all you need to do is to create three entries.
For the first entry, enter wayne96 as the Value for playerID.
Select the Add new attribute dropdown, and choose String.
Enter email as the Attribute name, and the Value should be your own email address since you’ll be receiving this email. This should be the same email used to configure your Pinpoint project from earlier.
Again, select the Add new attribute dropdown, and choose String.
Enter favoriteRole as the Attribute name, and enter Tank as the attribute’s Value.
Again, select the Add new attribute dropdown, and choose String.
Enter firstName as the Attribute name, and enter Wayne as the attribute’s Value.
Finally, select the Add new attribute dropdown, and choose String.
And enter the lastName as the Attribute name, and enter Johnson as the attribute’s value.
Repeat the process for the following two users. You’ll be using the SES Mailbox Simulator on these player IDs – one will simulate a successful delivery (but no opens or clicks), and the other will simulate a bounce notification, which represents an unknown user response code.
Now that the table’s populated, you can build the integration between Cohort Modeler and your new “database of record,” allowing you to use the cohort data to send messages to your players.
Create the Pinpoint Import S3 Bucket
Pinpoint requires a CSV or JSON file stored on S3 to run an Import Segment job, so we’ll need a bucket (separate from our Cohort Modeler Export bucket) to facilitate this.
Navigate to the S3 Console, and inside the Buckets section, choose Create Bucket.
In the General configuration section, enter a bucket a name, remembering that its name must be unique across all of AWS.
You can leave all other settings at their default values, so scroll down to the bottom of the page and choose Create Bucket. Remember the name – We’ll be referring to it as your “Pinpoint import bucket” from here on out.
Create a Pinpoint Role for the S3 Bucket
Before creating the Lambda function, we need to create a role that allows the Cohort Modeler data to be imported into Amazon Pinpoint in the form of a segment.
For more details on how to create an IAM role to allow Amazon Pinpoint to import endpoints from the S3 Bucket, refer to this documentation. Otherwise, you can follow the instructions below:
Navigate to the IAM Dashboard. In the navigation pane, under Access management, choose Roles, followed by Create role.
Once on the Select trusted entity page, highlight and select AWS service, under the Trusted entity type section.
In the Use case section dropdown, type or select S3. Once selected, ensure that S3 is highlighted, and not S3 Batch Operations. Choose, Next.
From the Add permissions page, enter AmazonS3ReadOnlyAccess within Search area. Select the associated checkbox and choose Next.
Once on the Name, review, and create page, For Role name, enter PinpointSegmentImport.
Scroll down and choose Create role.
From the navigation pane, and once again under Access management, choose Roles. Select the name of the role just created.
In the Trust relationships tab, choose Edit trust policy.
Paste the following JSON trust policy. Remember to replace accountId, region and application-id with your AWS account ID, the region you’re running Amazon Pinpoint from, and the Amazon Pinpoint project ID respectively.
You’ll need to create a Lambda function for S3 to trigger when Cohort Modeler drops its export files into the export bucket, as well as the connection to the Cohort Modeler export bucket to set up the trigger. The steps below will take you through the process.
Create the Lambda
Head to the Lambda service menu, and from Functions page, choose Create function. From there:
On the Create function page, select Author from scratch.
For Function Name, enter S3TriggerCohortIngest for consistency.
For Runtime choose Python 3.8
No other complex configuration options are needed, so leave the remaining options as default and click Create function.
In the Code tab, replace the sample code with the code below.
import json
import os
import uuid
import urllib

import boto3
from botocore.exceptions import ClientError

### S3TriggerCohortIngest

# We get activated once we're triggered by an S3 file getting Put.
# We then:
# - grab the file from S3 and ingest it.
# - negotiate with a DB of record (Dynamo in our test case) to pull the corresponding player data.
# - transform that record data into a format Pinpoint will interpret.
# - Save that CSV into a different S3 bucket, and
# - Instruct Pinpoint to ingest it as a Segment.


# save the CSV file to a random unique filename in S3
def save_s3_file(content):

    # generate a random uuid csv filename.
    fname = str(uuid.uuid4()) + ".csv"

    print("Saving data to file: " + fname)

    try:
        # grab the S3 bucket name
        s3_bucket_name = os.environ['S3BucketName']

        # Set up the S3 boto client
        s3 = boto3.resource('s3')

        # Lob the body into the object.
        object = s3.Object(s3_bucket_name, fname)
        object.put(Body=content)

        return fname

    # If we fail, say why and exit.
    except ClientError as error:
        print("Couldn't store file in S3: %s", json.dumps(error.response))
        return {
            'statuscode': 500,
            'body': json.dumps('Failed access to storage.')
        }

# Given a list of users, query the user dynamo db for their account info.
def query_dynamo(userlist):

    # set up the dynamo client.
    ddb_client = boto3.resource('dynamodb')

    # Set up the RequestIems object for our query.
    batch_keys = {
        'userdata': {
            'Keys': [{'playerId': user} for user in userlist]
        }
    }

    # query for the keys. note: currently no explicit error-checking for <= 100 items.
    try:

        db_response = ddb_client.batch_get_item(RequestItems=batch_keys)


        return db_response

    # If we fail, say why and exit.
    except ClientError as error:
        print("Couldn't access data in DynamoDB: %s", json.dumps(error.response))
        return {
            'statuscode': 500,
            'body': json.dumps('Failed access to db.')
        }

def ingest_pinpoint(filename):

    s3url = "s3://" + os.environ.get('S3BucketName') + "/" + filename


    try:
        pinClient = boto3.client('pinpoint')

        response = pinClient.create_import_job(
            ApplicationId=os.environ.get('PinpointApplicationID'),
            ImportJobRequest={
                'DefineSegment': True,
                'Format': 'CSV',
                'RegisterEndpoints': True,
                'RoleArn': 'arn:aws:iam::744969268958:role/PinpointSegmentImport',
                'S3Url': s3url,
                'SegmentName': filename
            }
        )

        return {
            'ImportId': response['ImportJobResponse']['Id'],
            'SegmentId': response['ImportJobResponse']['Definition']['SegmentId'],
            'ExternalId': response['ImportJobResponse']['Definition']['ExternalId'],
        }

    # If we fail, say why and exit.
    except ClientError as error:
        print("Couldn't create Import job for Pinpoint: %s", json.dumps(error.response))
        return {
            'statuscode': 500,
            'body': json.dumps('Failed segment import to Pinpoint.')
        }

# Lambda entry point GO
def lambda_handler(event, context):

    # Get the bucket + obj name from the incoming event
    incoming_bucket = event['Records'][0]['s3']['bucket']['name']
    filename = urllib.parse.unquote_plus(event['Records'][0]['s3']['object']['key'], encoding='utf-8')

    # light up the S3 client
    s3 = boto3.resource('s3')

    # grab the file that triggered us
    try:
        content_object = s3.Object(incoming_bucket, filename)
        file_content = content_object.get()['Body'].read().decode('utf-8')

        # and turn it into JSON.
        json_content = json.loads(file_content)

    except Exception as e:
        print(e)
        print('Error getting object {} from bucket {}. Make sure they exist and your bucket is in the same region as this function.'.format(filename, incoming_bucket))
        raise e

    # Munge the file we got into something we can actually use
    record_content = json.dumps(json_content)

    # load it into json
    record_json = json.loads(record_content)

    # Initialize an empty list for names
    namelist = []

    # Iterate through the records in the list
    for record in record_json:
        # Check if "playerId" key exists in the record
        if "playerId" in record:
            # Append the first element of "playerId" list to namelist
            namelist.append(record["playerId"][0])

    # use the name list and grab the corresponding users from the dynamo table
    userdatalist = query_dynamo(namelist)

    # grab just what we need to create our import file
    userdata_responses = userdatalist["Responses"]["userdata"]

    csvlist = "ChannelType,Address,User.UserId,User.UserAttributes.FirstName,User.UserAttributes.LastName\n"

    for user in userdata_responses:
        newString = "EMAIL," + user["email"] + "," + user["playerId"] + "," + user["firstName"] + "," + user["lastName"] + "\n"
        csvlist += newString

    # Dump it to S3 with a unique filename.
    csvFile = save_s3_file(csvlist)

    # and tell Pinpoint to import it as a Segment.
    pinResponse = ingest_pinpoint(csvFile)

    return {
        'statusCode': 200,
        'body': json.dumps(pinResponse)
    }
Configure the Lambda
Firstly, you’ll need to raise the function timeout, because sometimes it will take time to import large Pinpoint segments. To do so, navigate to the Configuration tab, then General configuration and change the Timeout value to the maximum of 15 minutes.
Next, select Environment variables beneath General configuration in the navigation pane. Choose Edit, followed by Add environment variable, for each Key and Value below.
Create a key – DynamoUserTableName – and give it the name of the DynamoDB table you built in the previous step. (If following our recommendations, it would be userdata. )
Create a key – PinpointApplicationID – and give it the Project ID (not the name), of the Pinpoint Project you created in the first step.
Create a key – S3BucketName – and give it the name of the Pinpoint Import S3 Bucket.
Finally, create a key – PinpointS3RoleARN – and paste the ARN of the Pinpoint S3role you created during the Import Bucket creation step.
Once all Environment Variables are entered, choose Save.
In a production build, you could have this information stored in System Manager Parameter Store, in order to ensure portability and resilience.
While still in the Configuration tab, from the navigation pane, choose the Permissions menu option.
Note that just beneath Execution role, AWS has created an IAM Role for the Lambda. Select the role’s name to view it in the IAM console.
On the Role’s page, in the Permissions tab and within the Permissions policies section, you should see one policy attached to the role: AWSLambdaBasicExecutionRole
You will need to give the Lambda access to your Pinpoint import bucket, so highlight the Policy name and select the Add permissions dropdown and choose Create inline policy – we won’t be needing this role anywhere else.
Replace the placeholder YOUR-CM-BUCKET-NAME-HERE with the name of the S3 Bucket you created in the previous blog post to store, and the YOUR-PINPOINT-BUCKET-NAME-HERE with the bucket to store Amazon Pinpoint segment endpoint you created earlier in the blog.
Remember to replace accountId, region and application-id with your AWS account ID, the region you’re running Amazon Pinpoint from, and the Amazon Pinpoint project ID respectively.
Choose Review Policy.
Give the policy a name – we used S3TriggerCohortIngestPolicy.
Finally, choose Create Policy.
Trigger the Lambda via S3
The goal is for the Lambda to be triggered when Cohort Modeler drops the extract file into its designated S3 delivery bucket. Fortunately, setting this up is a simple process:
Navigate back to the Lambda Functions page. For this particular Lambda script S3TriggerCohortIngest, choose the + Add trigger from the Function overview section.
From the Trigger configuration dropdown, select S3 as the source.
Under Bucket, enter or select the bucket you’ve chosen for Cohort Modeler extract delivery. (Created in the previous blog.)
Leave Event type as “All object create events“
Leave both Prefix and Suffix blank.
Check the box that acknowledges that using the same bucket for input and output is not recommended, as it can increase Lambda usage and thereby costs.
Finally, choose Add.
Lambda will add the appropriate permissions to invoke the trigger when an object is created in the S3 bucket.
Test the Lambda
The best way to test the end to end process is to simply connect to the endpoint you created in the first step of the process and send it a valid query. I personally use Postman, but you can use curl or any other HTTP tool to send the request.
Again, refer back to your prior work to determine the HTTP API endpoint for your Cohort Modeler’s cohort extract endpoint, and then send it the following query:
The Status code confirms that the request was successful, and the body provides the name of the export file which was created.
From the AWS console, navigate to the S3 Dashboard, and select the S3 Bucket you assigned to Cohort Modeler exports. You should see a JSON file corresponding to the response from your API call in that bucket.
Still in S3, navigate back and select the S3 bucket you assigned as your Pinpoint Import bucket. You should find a CSV file with the same file prefix in that bucket.
Finally, navigate to the Pinpoint dashboard and choose your Project.
From the navigation pane, select Segments. You should see a segment name which directly corresponds to the CSV file which you located in the Pinpoint Import bucket.
If these three steps are complete, then the outbound arm of the Community Engagement Flywheel is functional. All that’s left now is to test the Segment by using it in a Campaign.
Create an email template
In order to send your message recipients a message, you’ll need a message template. In this section, we’ll walk you through this process. The Pinpoint Template Editor is a simple HTML editor, but other third-party services like visual designers, can integrate directly with Pinpoint to provide a seamless integration between the design tool and Pinpoint.
From the navigation pane of the Pinpoint console, choose Message templates, and then select Create template.
Leave the Channel set to Email, and under Template name, enter a unique and memorable name.
Under Subject – We entered and used ‘Happy Video Game Day!’, but enter and use whatever you would like.
Locate and copy the contents of EmailTemplate.html, and paste the contents into the Message section of the form.
Finally, choose Create, and your Template will now be available for use.
Create & Send the Pinpoint Campaign
For the final step, you will create and send a campaign to the endpoints included in the Segment that the Community Engagement Flywheel created. Earlier, you mapped three email addresses to the identities that Cohort Modeler generated for your query: your email, and two test emails from the SES Email Simulator. As a result, you should receive one email to the email address you selected when you’ve completed this process, as well as events which indicate the status of all campaign activities.
In the navigation bar of the Pinpoint console, choose All projects, and select the project you’ve created for this exercise.
From the navigation pane, choose Campaigns, and then Create a campaign at the top of the page.
On the Create a campaign page, give your campaign a name, highlight Standard campaign, and choose Email for the Channel. To proceed, choose Next.
On the Choose a segment page, highlight Use an existing segment, and from the Segment dropdown, select the segment .csv that was created earlier. Once selected, choose Next.
On the Create your message page, you have two tasks:
You’re going to use the email template you created in the prior step, so in the Email template section, under Template name, select Choose a template, followed by the template you created, and finally Choose template.
In the Email settings section, ensure you’ve selected the sender email address you verified previously when you initially created the Pinpoint project.
Choose Next.
On the Choose when to send the campaign page, ensure Immediately is highlighted for when you want the campaign to be sent. Scroll down and choose Next.
Finally, on the Review and launch page, verify your selections as you scroll down the page, and finally Launch campaign.
Check your inbox! You will shortly receive the email, and this confirms the Campaign has been successfully sent.
Conclusion
So far you’ve extended the Cohort Modeler to report on the cohorts it’s built for you, you’ve operated on that extract and built an ETL machine to turn that cohort into relevant contact and personalization data, you’ve imported the contact data into Pinpoint as a static Segment, and you’ve created a Pinpoint Campaign witih that Segment to send messaging to that Cohort.
In the next and final blog post, we’ll show how to respond to events that result from your cohort members interacting with the messaging they’ve been sent, and how to enrich the cohort data with those events so you can understand in deeper detail how your messaging works – or doesn’t work – with your cohort members.
Tristan (Tri) Nguyen is an Amazon Pinpoint and Amazon Simple Email Service Specialist Solutions Architect at AWS. At work, he specializes in technical implementation of communications services in enterprise systems and architecture/solutions design. In his spare time, he enjoys chess, rock climbing, hiking and triathlon.
Brett Ezell
Brett Ezell is an Amazon Pinpoint and Amazon Simple Email Service Specialist Solutions Architect at AWS. As a Navy veteran, he joined AWS in 2020 through an AWS technical military apprenticeship program. When he isn’t deep diving into solutions for customer challenges, Brett spends his time collecting vinyl, attending live music, and training at the gym. An admitted comic book nerd, he feeds his addiction every Wednesday by combing through his local shop for new books.
Businesses are constantly looking for better ways to engage with customer communities, but it’s hard to do when profile data is limited to user-completed form input or messaging campaign interaction metrics. Neither of these data sources tell a business much about their customer’s interests or preferences when they’re engaging with that community.
To bridge this gap for their community of customers, AWS Game Tech created the Cohort Modeler: a deployable solution for developers to map out and classify player relationships and identify like behavior within a player base. Additionally, the Cohort Modeler allows customers to aggregate and categorize player metrics by leveraging behavioral science and customer data.
In this series of three blog posts, you’ll learn how to:
Extend the Cohort Modeler’s functionality to provide reporting functionality.
Interact with them through automation to send meaningful messaging to them.
Enrich their behavioral profiles via their interaction with your messaging.
In this blog post, we’ll show how to extend Cohort Modeler’s functionality to include and provide cohort reporting and extraction.
Use Case Examples for The Cohort Modeler
For this example, we’re going to retrieve a cohort of individuals from our Cohort Modeler who we’ve identified as at risk:
Maybe they’ve triggered internal alarms where they’ve shared potential PII with others over cleartext
Maybe they’ve joined chat channels known to be frequented by some of the game’s less upstanding citizens.
Either way, we want to make sure they understand the risks of what they’re doing and who they’re dealing with.
Because the Cohort Modeler’s API automatically translates the data it’s provided into the graph data format, the request we’re making is an easy one: we’re simply asking CM to retrieve all of the player IDs where the player’s ea_atrisk attribute value is greater than 2.
In our case, that either means
They’ve shared PII at least twice, or shared PII at least once.
Joined the #give-me-your-credit-card chat channel, which is frequented by real-life scammers.
These are currently the only two activities which generate at-risk data in our example model.
Architecture overview
In this example, you’ll extend Cohort Modeler’s functionality by creating a new API resource and method, and test that functional extension to verify it’s working. This supports our use case by providing a studio with a mechanism to identify the cohort of users who have engaged in activities that may put them at risk for fraud or malicious targeting.
Prerequisites
This blog post series integrates two tech stacks: the Cohort Modeler and the Digital User Engagement Events Database, both of which you’ll need to install. In addition to setting up your environment, you’ll need to clone the Community Engagement Flywheel repository, which contains the scripts you’ll need to use to integrate Cohort Modeler and Pinpoint.
In order to meet our functional requirements, we’ll need to extend the Cohort Modeler API. This first part will walk you through the mechanisms to do so. In this walkthrough, you’ll:
Normally it’d be enough to just create the S3 Bucket, but because our Cohort Modeler operates inside an Amazon Virtual Private Cloud (VPC), we need to both create the bucket and create an interface endpoint.
Create the Bucket
The size of a Cohort Modeler extract could be considerable depending on the size of a cohort, so it’s a best practice to deliver the extract to an S3 bucket. All you need to do in this step is create a new S3 bucket for Cohort Modeler exports.
Navigate to the S3 Console page, and inside the main pane, choose Create Bucket.
In the General configuration section, enter a bucket a name, remembering that its name must be unique across all of AWS.
You can leave all other settings at their default values, so scroll down to the bottom of the page and choose Create Bucket. Remember the name – I’ll be referring to it as your “CM export bucket” from here on out.
Create S3 Gateway endpoint
When accessing “global” services, like S3 (as opposed to VPC services, like EC2) from inside a private VPC, you need to create an Endpoint for that service inside the VPC. For more information on how Gateway Endpoints for Amazon S3 work, refer to this documentation.
In the navigation pane, under Virtual private cloud, choose Endpoints.
In the Endpoints pane, choose Create endpoint.
In the Endpoint settings section, under Service category, select AWS services.
In the Services section, under find resources by attribute, choose Type, and select the filter Type: Gateway and select com.amazonaws.region.s3.
For VPC section, select the VPC in which to create the endpoint.
For Route tables, section, select the route tables to be used by the endpoint. We automatically add a route that points traffic destined for the service to the endpoint network interface.
In the Policy section, select Full access to allow all operations by all principals on all resources over the VPC endpoint. Otherwise, select Custom to attach a VPC endpoint policy that controls the permissions that principals have to perform actions on resources over the VPC endpoint.
(Optional) To add a tag, choose Add new tag in the Tags section and enter the tag key and the tag value.
Choose Create endpoint.
Create the VPC Endpoint Security Group
When accessing “global” services, like S3 (as opposed to VPC services, like EC2) from inside a private VPC, you need to create an Endpoint for that service inside the VPC. One of the things the Endpoint needs to know is what network interfaces to accept connections from – so we’ll need to create a Security Group to establish that trust.
Navigate to the Amazon VPC console and In the navigation pane, under Security, choose Security groups.
In the Security Groups pane choose Create security group.
Under the Basic details section, name your security group S3 Endpoint SG.
Under the Outbound Rules section, choose Add Rule.
Under Type, select All traffic.
Under Source, leave Custom selected.
For the Custom Source, open the dropdown and choose the S3 gateway endpoint (this should be named pl-63a5400a)
Repeat the process for Outbound rules.
When finished, choose Create security group
Creating a Lambda Layer
You can use the code as provided in a Lambda, but the gremlin libraries required for it to run are another story: gremlin_python doesn’t come as part of the default Lambda libraries. There are two ways to address this:
You can upload the libraries with the code in a .zip file; this will work, but it will mean the Lambda isn’t editable via the built-in editor, which isn’t a scalable technique (and makes debugging quick changes a real chore).
You can create a Lambda Layer, upload those libraries separately, and then associate them with the Lambda you’re creating.
The Layer is a best practice, so that’s what we’re going to do here.
Creating the zip file
In Python, you’ll need to upload a .zip file to the Layer, and all of your libraries need to be included in paths within the /python directory (inside the zip file) to be accessible. Use pip to install the libraries you need into a blank directory so you can zip up only what you need, and no more.
Create a new subdirectory in your user directory,
Create a /python subdirectory,
Invoke pip3 with the —target option:
pip install --target=./python gremlinpython
Ensure that you’re zipping the python folder, the resultant file should be named python.zip and extracts to a python folder.
Creating the Layer
Head to the Lambda console, and select the Layers menu option from the AWS Lambda navigation pane. From there:
Choose Create layer in the Layer’s section
Give it a relevant name – like gremlinpython .
Select Upload a .zip file and upload the zip file you just created
For Compatible architectures, select x86_64.
Select the Python 3.8 as your runtime,
Choose Create.
Assuming all steps have been followed, you’ll receive a message that the layer has been successfully created.
Building the Lambda
You’ll be extending the Cohort Modeler with new functionality, and the way CM manages its functionality is via microservice-based Lambdas. You’ll be building a new API: to query the CM and extract Cohort information to S3.
Create the Lambda
Head back to the Lambda service menu, in the Resources for (your region) section, choose Create Function. From there:
On the Create function page select Author from scratch.
For Function Name enter ApiCohortGet for consistency.
For Runtime choose Python 3.8.
For Architectures, select x86_64.
Under the Advanced Settings pane select Enable VPC – you’re going to need this Lambda to query Cohort Modeler’s Neptune database, which has VPC endpoints.
Under VPC select the VPC created by the Cohort Modeler installation process.
Select all subnets in the VPC.
Select the security group labeled as the Security Group for API Lambda functions (also installed by CM)
Furthermore, select the security group S3 Endpoint SG we created, this allows the Lambda function hosted inside the VPC to access the S3 bucket.
Choose Create Function.
In the Code tab, and within the Code source window, delete all of the sample code and replace it with the code below. This python script will allow you to query Cohort Modeler for cohort extracts.
import os
import json
import boto3
from datetime import datetime
from gremlin_python import statics
from gremlin_python.driver.driver_remote_connection import DriverRemoteConnection
from gremlin_python.driver.protocol import GremlinServerError
from gremlin_python.driver import serializer
from gremlin_python.process.anonymous_traversal import traversal
from gremlin_python.process.graph_traversal import __
from gremlin_python.process.strategies import *
from gremlin_python.process.traversal import T, P
from aiohttp.client_exceptions import ClientConnectorError
import logging

logger = logging.getLogger()
logger.setLevel(logging.INFO)

s3 = boto3.client('s3')

def query(g, cohort, thresh):
    return (g.V().hasLabel('player')
            .has(cohort, P.gt(thresh))
            .valueMap("playerId", cohort)
            .toList())

def doQuery(g, cohort, thresh):
    return query(g, cohort, thresh)

# Lambda handler
def lambda_handler(event, context):

    # Connection instantiation
    conn = create_remote_connection()
    g = create_graph_traversal_source(conn)
    try:
        # Validate the cohort info here if needed.

        # Grab the event resource, method, and parameters.
        resource = event["resource"]
        method = event["httpMethod"]
        pathParameters = event["pathParameters"]

        # Grab query parameters. We should have two: cohort and threshold
        queryParameters = event.get("queryStringParameters", {})

        cohort_val = pathParameters.get("cohort")
        thresh_val = int(queryParameters.get("threshold", 0))

        result = doQuery(g, cohort_val, thresh_val)


        # Convert result to JSON
        result_json = json.dumps(result)

        # Generate the current timestamp in the format YYYY-MM-DD_HH-MM-SS
        current_timestamp = datetime.now().strftime('%Y-%m-%d_%H-%M-%S')

        # Create the S3 key with the timestamp
        s3_key = f"export/{cohort_val}_{thresh_val}_{current_timestamp}.json"

        # Upload to S3
        s3_result = s3.put_object(
            Bucket=os.environ['S3ExportBucket'],
            Key=s3_key,
            Body=result_json,
            ContentType="application/json"
        )
        response = {
            'statusCode': 200,
            'body': s3_key
        }
        return response

    except Exception as e:
        logger.error(f"Error occurred: {e}")
        return {
            'statusCode': 500,
            'body': str(e)
        }

    finally:
        conn.close()

# Connection management
def create_graph_traversal_source(conn):
    return traversal().withRemote(conn)

def create_remote_connection():
    database_url = 'wss://{}:{}/gremlin'.format(os.environ['NeptuneEndpoint'], 8182)
    return DriverRemoteConnection(
        database_url,
        'g',
        pool_size=1,
        message_serializer=serializer.GraphSONSerializersV2d0()
    )
Configure the Lambda
Head back to the Lambda service page, and fom the navigation pane, select Functions. In the Functions section select ApiCohortGet from the list.
In the Function overview section, select the Layers icon beneath your Lambda name.
In the Layers section, choose Add a layer.
From the Choose a layer section, select Layer Source to Custom layers.
From the dropdown menu below, select your recently custom layer, gremlinpython.
For Version, select the appropriate (probably the highest, or most recent) version.
Once finished, choose Add.
Now, underneath the Function overview, navigate to the Configuration tab and choose Environment variables from the navigation pane.
Now choose edit to create a new variable. For the key, enter NeptuneEndpoint , and give it the value of the Cohort Modeler’s Neptune Database endpoint. This value is available from the Neptune control panel under Databases. This should not be the read-only cluster endpoint, so select the ‘writer’ type. Once selected, the Endpoint URL will be listed beneath the Connectivity & security tab
Create an additional new key titled, S3ExportBucket and for the value use the unique name of the S3 bucket you created earlier to receive extracts from Cohort Modeler. Once complete, choose save
In a production build, you can have this information stored in System Manager Parameter Store in order to ensure portability and resilience.
While still in the Configuration tab, under the navigation pane choose Permissions.
Note that AWS has created an IAM Role for the Lambda. select the role name to view it in the IAM console.
Under the Permissions tab, in the Permisions policies section, there should be two policies attached to the role: AWSLambdaBasicExecutionRole and AWSLambdaVPCAccessExecutionRole.
You’ll need to give the Lambda access to your CM export bucket
Also in the Permissions policies section, choose the Add permissions dropdown and select Create Inline policy – we won’t be needing this role anywhere else.
On the new page, choose the JSON tab.
Delete all of the sample code within the Policy editor, and paste the inline policy below into the text area.
Replace the placeholder YOUR-S3-BUCKET-NAME-HERE with the name of your CM export bucket.
Click Review Policy.
Give the policy a name – I used ApiCohortGetS3Policy.
Click Create Policy.
Integrating with API Gateway
Now you’ll need to establish the API Gateway that the Cohort Modeler created with the new Lambda functions that you just created. If you’re on the old console User Interface, we strongly recommend switching over to the new console UI. This is due to the previous UI being deprecated by the 30th of October 2023. Consequently, the following instructions will apply to the new console UI.
Navigate to the main service page for API Gateway.
From the navigation pane, choose Use the new console.
Create the Resource
From the new console UI, select the name of the API Gateway from the APIs Section that corresponds to the name given when you launched the SAM template.
On the Resources navigation pane, choose /data, followed by selecting Create resource.
Under Resource name, enter cohort, followed by Create resource.
We’re not quite finished. We want to be able to ask the Cohort Modeler to give us a cohort based on a path parameter – so that way when we go to /data/cohort/COHORT-NAME/ we receive back information about the cohort name that we provided. Therefore…
Create the Method
Now we’ll create the GET Method we’ll use to request cohort data from Cohort Modeler.
From the same menu, choose the /data/cohort/{cohort} Resource, followed by selecting Get from the Methods dropdown section, and finally choosing Create Method.
From the Create method page, select GET under Method type, and select Lambda function under the Integration type.
For the Lambda proxy integration, turn the toggle switch on.
Under Lamba function, choose the function ApiCohortGet, created previously.
Finally, choose Create method.
API Gateway will prompt and ask for permissions to access the Lambda – this is fine, choose OK.
Create the API Key
You’ll want to access your API securely, so at a minimum you should create an API Key and require it as part of your access model.
Under the API Gateway navigation pane, choose APIs. From there, select API Keys, also under the navigation pane.
In the API keys section, choose Create API key.
On the Create API key page, enter your API Key name, while leaving the remaining fields at their default values. Choose Save to complete.
Returning to the API keys section, select and copy the link for the API key which was generated.
Once again, select APIs from the navigation menu, and continue again by selecting the link to your CM API from the list.
From the navigation pane, choose API settings, folded under your API name, and notthe Settings option at the bottom of the tab.
In the API details section, choose Edit under API details. Once on the Edit API settings page, ensure the Header option is selected under API key source.
Deploy the API
Now that you’ve made your changes, you’ll want to deploy the API with the new endpoint enabled.
Back in the navigation pane, under your CM API’s dropdown menu, choose Resources.
On the Resources page for your CM API, choose Deploy API.
Select the Prod stage (or create a new stage name for testing) and click Deploy.
Test the API
When the API has deployed, the system will display your API’s URL. You should now be able to test your new Cohort Modeler API:
Using your favorite tool (curl, Postman, etc.) create a new request to your API’s URL.
The URL should look like https://randchars.execute-api.us-east-1.amazonaws.com/Stagename. You can retrieve your APIGateway endpoint URL by selecting API Settings, in the navigation pane of your CM API’s dropdown menu.
From the API settings page, under Default endpoint, will see your Active APIGateway endpoint URL. Remember to add the Stagename (for example, “Prod) at the end of the URL.
Be sure you’re adding a header named X-API-Key to the request, and give it the value of the API key you created earlier.
Add the /data/cohort resource to the end of the URL to access the new endpoint.
Add /ea_atrisk after /data/cohort – you’re querying for the cohort of players who belong to the at-risk cohort.
Finally, add ?threshold=2 so that we’re only looking at players whose cohort value (in this case, the number of times they’ve shared personally identifiable information) is greater than 2. The final URL should look something like: https://randchars.execute-api.us-east-1.amazonaws.com/Stagename/data/cohort/ea_atrisk?threshold=2
Once you’ve submitted the query, your response should look like this:
The status code indicates a successful query, and the body indicates the name of the json file in your extract S3 bucket which contains the cohort information. The name comprises of the attribute, the threshold level and the time the export was made. Go ahead and navigate to the S3 bucket, find the file, and download it to see what Cohort Modeler has found for you.
Troubleshooting
Installing the Game Tech Cohort Modeler
Error: Could not find public.ecr.aws/sam/build-python3.8:latest-x86_64 image locally and failed to pull it from docker
Try: docker logout public.ecr.aws.
Attempt to pull the docker image locally first: docker pull public.ecr.aws/sam/build-python3.8:latest-x86_64
Error: RDS does not support creating a DB instance with the following combination:DBInstanceClass=db.r4.large, Engine=neptune, EngineVersion=1.2.0.2, LicenseModel=amazon-license.
The default option r4 family was offered when Neptune was launched in 2018, but now newer instance types offer much better price/performance. As of engine version 1.1.0.0, Neptune no longer supports r4 instance types.
Therefore, we recommend choosing another Neptune instance based on your needs, as detailed on this page.
For testing and development, you can consider the t3.medium and t4g.medium instances, which are eligible for Neptune free-tier offer.
Remember to add the instance type that you want to use in the AllowedValues attributes of the DBInstanceClass and rebuilt using sam build –use-container
Using the data gen script (for automated data generation)
The cohort modeler deployment does not deploy the CohortModelerGraphGenerator.ipynb which is required for dummy data generation as a default.
You will need to login to your Sagemaker instance and upload the CohortModelerGraphGenerator.ipynb file and run through the cells to generate the dummy data into your S3 bucket.
Finally, you’ll need to follow the instructions in this page to load the dummy data from Amazon S3 into your Neptune instance.
For the IAM role for Amazon Neptune to load data from Amazon S3, the stack should have created a role with the name Cohort-neptune-iam-role-gametech-modeler.
You can run the requests script from your jupyter notebook instance, since it already has access to the Amazon Neptune endpoint. The python script should look like below:
Remember to replace the NeptuneEndpointURL, S3FileURI, and NeptuneIAMRoleARN.
Remember to load user_vertices.csv, campaign_vertices.csv, action_vertices.csv, interaction_edges.csv, engagement_edges.csv, campaign_edges.csv, and campaign_bidirectional_edges.csv in that order.
Conclusion
In this post, you’ve extended the Cohort Modeler to respond to requests for cohort data, by both querying the cohort database and providing an extract in an S3 bucket for future use. In the next post, we’ll demonstrate how creating this file triggers an automated process. This process will identify the players from the cohort in the studio’s database, extract their contact and other personalization data, compiling the data into a CSV file from that request, and import that file into Pinpoint for targeted messaging.
Tristan (Tri) Nguyen is an Amazon Pinpoint and Amazon Simple Email Service Specialist Solutions Architect at AWS. At work, he specializes in technical implementation of communications services in enterprise systems and architecture/solutions design. In his spare time, he enjoys chess, rock climbing, hiking and triathlon.
Brett Ezell
Brett Ezell is an Amazon Pinpoint and Amazon Simple Email Service Specialist Solutions Architect at AWS. As a Navy veteran, he joined AWS in 2020 through an AWS technical military apprenticeship program. When he isn’t deep diving into solutions for customer challenges, Brett spends his time collecting vinyl, attending live music, and training at the gym. An admitted comic book nerd, he feeds his addiction every Wednesday by combing through his local shop for new books.
Today AWS made the much-anticipated announcement of Graviton4 which should be available in 2024. This is AWS’s latest Graviton processor and the fourth generation launched in the last five years. The company also announced its second-generation Tranium2 processor for AI workloads. AWS Graviton4 is an Even Bigger Arm Server Processor AWS is continuing on its […]
Layered Context introduced a consolidated view of all security risks insightCloudSec collects from the various layers of a cloud environment. This enabled our customers to go from visibility into individual security risks on a resource, to understanding all of the risks that impacted that resource and the overall risk of that resource.
For example: let’s take a cloud resource that has a port left open to the public.
With this level of detail it is pretty challenging to identify the risk level, because we don’t know enough about the resource in question, or even if it was supposed to be opened to the public or not. It’s not that this isn’t risky, we just need to know more to evaluate just how risky it is. As we add more context, we start to get a clearer picture: the environment the resource is running in, if it is connected to a business critical application, does it have any known vulnerabilities, are there identities with elevated permissions associated with the resource, etc.
By layering together all of this context, customers are able to effectively understand the actual risk associated with each and every one of their resources – in real-time. This is of course helpful information to have in one consolidated view, but even still it can be difficult to sift through potentially thousands of resources and prioritize the work that needs to be done to secure each one. To that end, we are excited to introduce a new risk score in Layered Context, which analyzes all the signals and context we know about a given cloud resource and automatically assigns a score and a severity, making it easy for our customers to understand the riskiest resources they should focus on.
Prioritizing Risk By Focusing on Toxic Combinations
Much like Layered Context itself, the new risk score combines a variety of risk signals, assigning a higher risk score to resources that suffer from toxic combinations, or multiple risk vectors that compound to present an increased likelihood or impact of compromise.
The risk score takes into account:
Business Criticality, with an understanding of what applications the resource is associated with such as a crown-jewel or revenue generating app
Public Accessibility, both from a network perspective as well as via user permissions (more on that in a second)
Potential Attack Paths, to understand how a bad actor could move laterally across your inter-connected environment
Identity-related risk, including excessive and/or unused permissions and privileges
Misconfigurations, including whether or not the resource is in compliance with organizational standards
Threats to factor in any malicious behavior that has been detected
And of course, Vulnerabilities, using Rapid7’s Active Risk model which consumes data on exploitability and active exploitation in the wild
By identifying these toxic combinations, we can ensure the riskiest resources are given the highest priority. Each resource is assigned a score and a severity, making it easy for our customers to see where the riskiest resources exist in their environment and where to focus.
A Clear Understanding of How We Calculate Risk
Alongside our risk score, we are introducing a new view to breakdown all of the reasons why a resource has been scored accordingly. This will give an overview of the most important information our customers need to know that clearly summarizes the factors that influenced the risk scoring. Reducing the time required to understand why a resource is risky, meaning security teams can focus on remediating the risks.
A Bit More on How we Determine Public Accessibility
As mentioned previously, the basis of much of our risk calculation in cloud resources stems from a simple question: “is this resource publicly accessible?” This is a critical detail in determining relative risk, but can be very difficult to ascertain given the complex and ephemeral nature of cloud environments. To address this, we’ve invested significant time and effort to ensure we’re assessing public accessibility as accurately as possible but also explaining why we’ve determined it that way, so it’s much easier to take remediation action. This determination can easily be viewed on a per resource basis from the Layered Context page.
We have lots of exciting releases coming up in the next few months, alongside Risk scoring we are also extending our Attack Path Analysis feature to show the Blast Radius of an Attack with improved topology visualizations. This will give our customers not only the visibility into how an attacker could exploit a given resource but also the potential for lateral movement between interconnected resources. Additionally, we’ll be updating the way we validate and show proof of public accessibility. Should a resource be publicly accessible, you will be able to easily view the proof details which will show exactly which combination of configurations is resulting in the resource being publicly accessible.
The new risk scoring capabilities in Layered Context will be on display at AWS Re:Invent next week. Be sure to stop by booth #1270 to see it in action!
Amazon Pinpoint is a multichannel communication service that helps application developers engage their customers through communication channels such as SMS or text messaging, email, mobile push, voice, and in-app messaging.
Amazon Pinpoint SMS provides the global scale, resiliency, and flexibility required to deliver SMS and voice messaging in web, mobile, or business applications. SMS messaging is used for use cases like one-time passcode validation, time sensitive alerts, and two-way chat due to its global reach and ubiquity. Today Amazon Pinpoint SMS sends messages to over 240 countries and regions. In this post, we will review how to use the new Pinpoint SMS management console to get your SMS resources setup correctly the first time.
This blog walks through the setup and configuration steps for Pinpoint SMS using the management console. Additionally, all setup and configurations can also be completed using Pinpoint SMS APIs. For more information visit the Pinpoint SMS documentation, or complete the Amazon Pinpoint SMS workshop.
The Pinpoint SMS management console provides control for the existing functionality of the Pinpoint SMS APIs to create, and manage your SMS and voice resources. In addition, the Pinpoint SMS console has a Quick start – SMS setup guide or Request originator flow to guide you through the setup process and for requesting and managing your SMS resources.
Phone pool: The phone pool resource is a collection of phone numbers and sender IDs that all share the same settings and provide failover if a number becomes unavailable.
Originator: An originator refers to either a phone number or sender ID.
Phone number: Also called originator number, a phone number is a numeric string of numbers that identifies the sender. This can be a long code, short code, toll-free number (TFN), or 10-digit long code (10DLC). For more information see choosing a phone number or sender ID.
Verified destination phone number: When your account is in Sandbox you can only send SMS messages to phone numbers that have gone through the verification process. The phone number receives an SMS message with a verification code. The received code must be entered into the console to complete the process.
Simulator phone number: A simulator phone number behaves as any other origination and destination phone number without sending the SMS message to mobile carriers. Simulator phone numbers do not require registration and are used for testing scenarios.
Sender ID: Also called originator ID, a sender ID is an alphanumeric string that identifies the sender. For more information see choosing a phone number or sender ID.
Registered phone number: Some countries require you to register your company’s identity before you can purchase phone numbers or sender IDs. They also require a review of the messages that you send to recipients in their country. Registrations are processed by external third parties, so the amount of time to process a registration varies by phone number type and country. After all required registrations are complete, the status of your phone numbers changes to Active and is available for use. For more information about which countries require registration see, supported countries and regions (SMS channel).
Getting started
Sign-in to the AWS management console and search for Amazon Pinpoint. If you don’t have an existing AWS account, complete the following steps to create one.
In the Amazon Pinpoint console, you can choose between managing Pinpoint SMS and Pinpoint campaign orchestration. Pinpoint SMS is the place where applications developers go to setup and configure their associated resources for SMS sending through any AWS service. Pinpoint campaign orchestration is for builders who want to manage their customer segments and send messages using campaigns, or multi-step journeys. Campaign orchestration utilizes communication channels like Pinpoint SMS or Amazon SES (simple email service) to deliver its messages. In this blog, we will discuss how to configure Pinpoint SMS using its management console.
Quick start – SMS setup guide
Once you’ve selected the Amazon Pinpoint SMS console, you will land on the Overview page. On this page, you get a summary of your SMS resources and the Quick start – SMS setup guide. This guide will walk you through creating the appropriate SMS resources to start sending SMS messages. The steps outlined in the Quick start guide are recommended but not required.
Step 1: Create a phone pool
A phone pool is a collection of phone numbers and sender IDs that all share the same settings and provide failover if a number becomes unavailable. Phone pools provide the benefit of managing for number resiliency, removes the complexity from sending applications, and provides a logical grouping to manage phone numbers and sender IDs. For example, phone pools can be grouped by use-case such as having a phone pool for OTP (one-time password) messages.
In the navigation pane, under Overview, in the Quick start section, choose Create pool. Under the pool setup section, enter a name for your pool in Pool name. To create a pool, you will need to select an origination identity, either a phone number or sender ID to associate with the pool. Additional origination identities can be added once the pool is created on the Phone pools page. If you don’t have an active phone number or sender ID in your account, we recommend selecting a simulator number, which can be used for testing and does not require any registration. Once you’ve selected an origination identity, you can choose Create phone pool to complete step 1.
Step 2: Create a configuration set
A configuration set is a set of rules that are applied when you send a message. For example, a configuration set can specify a destination for events related to a message. When SMS events occur (such as delivery or failure events), they are routed to the destination associated with the configuration set that you specified when you sent the message. You’re not required to use configuration sets when you send messages, but we recommend that you do. We support sending SMS and voice events to Amazon CloudWatch, Amazon Kinesis DataFirehose, and Amazon SNS.
In the navigation pane, under Overview, in the Quick start section, choose Create set. Under the Configuration set details section, enter a name in Configuration set name. For Event Destination setup, choose either the quick start option to create a Cloud formation stack to automatically create and configure CloudWatch, Kinesis DataFirehose, and SNS to log all events or the advanced option to manually select which event destinations you would like to setup. Once you’ve made the selection, choose Create Configuration set to complete step 2.
Step 3: Test SMS sending
Send a test message using the SMS simulator. Select an originator to send from, and a destination number to send to. To track the status of your message, add a configuration set to publish SMS events.
In the navigation pane, under Overview, in the Quick start section, choose Test SMS sending. Under the Originator section, select either a phone pool, phone number, or sender ID in your account to send test messages from. Next, under the Destination phone number section, select either a simulator number or active destination number to send test messages to. If your account is in Sandbox, you can only send messages to simulator numbers or verified destination numbers. Once your account is in Production you can send messages to simulator numbers or any active destination number. You can (optionally) select a configuration set to track your SMS events. Next, under the Message body section, enter a sample message and send the test message.
Note – If you are sending from a US simulator number (or using a phone pool that only contains a US simulator number) you can only send messages to US simulator destination numbers. A simulator phone number behaves like any other phone number without sending the SMS message to mobile carriers.
Step 4: Request production Access
Finally, if your account is in Sandbox there are limits to the amount you can spend and can only send to verified destination phone numbers. Request moving your account from Sandbox to Production to remove these limits. To move to Production, open a case with AWS Support Center.
Conclusion
After following the request for Production access, you’ve completed the recommended steps to get your account configuration setup. You have now tested and configured the following resources in your account:
Phone pool: A phone pool is a collection of phone numbers and sender IDs that all share the same settings and provide failover if a number becomes unavailable. Phone pools provide the benefit of managing for number resiliency, removes the complexity from sending applications, and provides a logical grouping to manage phone numbers and sender IDs.
Originator: As part of the pool setup, you are required to associate at least one originator to the phone pool. An originator refers to either a phone number or sender ID. If you’ve selected a simulator number and would like to now request a new phone number or sender ID, you can do so following Request originator flow.
Configuration set: A configuration set allows you to organize, track, and configure logging of your SMS events, specifying where to publish them by adding event destinations.
Next steps
To request additional originators such as phone numbers or sender IDs, you can follow the Request Originator flow in the management console. If your originator requires registrations and is supported, you can self-service the phone number or sender ID registration in the management console.
In a move to safeguard user inboxes, Gmail and Yahoo Mail announced a new set of requirements for senders effective from February 2024. Let’s delve into the specifics and what Amazon Simple Email Service (Amazon SES) customers need to do to comply with these requirements.
What are the new email sender requirements?
The new requirements include long-standing best practices that all email senders should adhere to in order to achieve good deliverability with mailbox providers. What’s new is that Gmail, Yahoo Mail, and other mailbox providers will require alignment with these best practices for those who send bulk messages over 5000 per day or if a significant number of recipients indicate the mail as spam.
The requirements can be distilled into 3 categories: 1) stricter adherence to domain authentication, 2) give recipients an easy way to unsubscribe from bulk mail, and 3) monitoring spam complaint rates and keeping them under a 0.3% threshold.
* This blog was originally published in November 2023, and updated on January 12, 2024 to clarify timelines, and to provide links to additional resources.
1. Domain authentication
Mailbox providers will require domain-aligned authentication with DKIM and SPF, and they will be enforcing DMARC policies for the domain used in the From header of messages. For example, gmail.com will be publishing a quarantine DMARC policy, which means that unauthorized messages claiming to be from Gmail will be sent to Junk folders.
The following steps outline how Amazon SES customers can adhere to the domain authentication requirements:
Adopt domain identities: Amazon SES customers who currently rely primarily on email address identities will need to adopt verified domain identities to achieve better deliverability with mailbox providers. By using a verified domain identity with SES, your messages will have a domain-aligned DKIM signature.
Configure a Custom MAIL FROM domain: To further align with best practices, SES customers should also configure a custom MAIL FROM domain so that SPF is domain-aligned.
The table below illustrates the three scenarios based on the type of identity you use with Amazon SES
Fail – DMARC analysis fails as the sending domain does not have a DKIM signature or SPF record that matches.
example.com as a verified domain identity
example.com
email.amazonses.com
Success – DKIM signature aligns with sending domain which will cause DMARC checks to pass.
example.com as a verified domain identity, and bounce.example.com as a custom MAIL FROM domain
example.com
bounce.example.com
Success – DKIM and SPF are aligned with sending domain.
Figure 1: Three scenarios based on the type of identity used with Amazon SES. Using a verified domain identity and configuring a custom MAIL FROM domain will result in both DKIM and SPF being aligned to the From header domain’s DMARC policy.
Be strategic with subdomains: Amazon SES customers should consider a strategic approach to the domains and subdomains used in the From header for different email sending use cases. For example, use the marketing.example.com verified domain identity for sending marketing mail, and use the receipts.example.com verified domain identity to send transactional mail.
Why? Marketing messages may have higher spam complaint rates and would need to adhere to the bulk sender requirements, but transactional mail, such as purchase receipts, would not necessarily have spam complaints high enough to be classified as bulk mail.
Publish DMARC policies: Publish a DMARC policy for your domain(s). The domain you use in the From header of messages needs to have a policy by setting the p= tag in the domain’s DMARC policy in DNS. The policy can be set to “p=none” to adhere to the bulk sending requirements and can later be changed to quarantine or reject when you have ensured all email using the domain is authenticated with DKIM or SPF domain-aligned authenticated identifiers.
2. Set up an easy unsubscribe for email recipients
Bulk senders are expected to include a mechanism to unsubscribe by adding an easy to find link within the message. The February 2024 mailbox provider rules will require senders to additionally add one-click unsubscribe headers as defined by RFC 2369 and RFC 8058. These headers make it easier for recipients to unsubscribe, which reduces the rate at which recipients will complain by marking messages as spam.
There are many factors that could result in your messages being classified as bulk by any mailbox provider. Volume over 5000 per day is one factor, but the primary factor that mailbox providers use is in whether the recipient actually wants to receive the mail.
If you aren’t sure if your mail is considered bulk, monitor your spam complaint rates. If the complaint rates are high or growing, it is a sign that you should offer an easy way for recipients to unsubscribe.
How to adhere to the easy unsubscribe requirement
The following steps outline how Amazon SES customers can adhere to the easy unsubscribe requirement:
Add one-click unsubscribe headers to the messages you send: Amazon SES customers sending bulk or potentially unwanted messages will need to implement an easy way for recipients to unsubscribe, which they can do using the SES subscription management feature.
Mailbox providers are requiring that large senders give recipients the ability to unsubscribe from bulk email in one click using the one-click unsubscribe header, however it is acceptable for the unsubscribe link in the message to direct the recipient to a landing page for the recipient to confirm their opt-out preferences.
To set up one-click unsubscribe without using the SES subscription management feature, include both of these headers in outgoing messages:
When a recipient unsubscribes using one-click, you receive this POST request:
POST /unsubscribe/example HTTP/1.1
 Host: example.com
 Content-Type: application/x-www-form-urlencoded
 Content-Length: 26
 List-Unsubscribe=One-Click
Gmail’s FAQ and Yahoo’s FAQ both clarify that the one-click unsubscribe requirement will not be enforced until June 2024 as long as the bulk sender has a functional unsubscribe link clearly visible in the footer of each message.
Honor unsubscribe requests within 2 days: Verify that your unsubscribe process immediately removes the recipient from receiving similar future messages. Mailbox providers are requiring that bulk senders give recipients the ability to unsubscribe from email in one click, and that the senders process unsubscribe requests within two days.
If you adopt the SES subscription management feature, make sure you integrate the recipient opt-out preferences with the source of your email sending lists. If you implement your own one-click unsubscribe (for example, using Amazon API Gateway and an AWS Lambda function), make sure it designed to suppress sending to email addresses in your source email lists.
Review your email list building practices: Ensure responsible email practices by refraining from purchasing email lists, safeguarding opt-in forms from bot abuse, verifying recipients’ preferences through confirmation messages, and abstaining from automatically enrolling recipients in categories that were not requested.
Having good list opt-in hygiene is the best way to ensure that you don’t have high spam complaint rates before you adhere to the new required best practices. To learn more, read What is a Spam Trap, and Why You Should Care.
3. Monitor spam rates
Mailbox providers will require that all senders keep spam complaint rates below 0.3% to avoid having their email treated as spam by the mailbox provider. The following steps outline how Amazon SES customers can meet the spam complaint rate requirement:
Enroll with Google Postmaster Tools: Amazon SES customers should enroll with Google Postmaster Tools to monitor their spam complaint rates for Gmail recipients.
Gmail recommends spam complaint rates stay below 0.1%. If you send to a mix of Gmail recipients and recipients on other mailbox providers, the spam complaint rates reported by Gmail’s Postmaster Tools are a good indicator of your spam complaint rates at mailbox providers who don’t let you view metrics.
Segregate and secure your sending using configuration sets: In addition to segregating sending use cases by domain, Amazon SES customers should use configuration sets for each sending use case.
These changes are planned for February 2024, but be aware that the exact timing and methods used by each mailbox provider may vary. If you experience any deliverability issues with any mailbox provider prior to February, it is in your best interest to adhere to these required best practices as a first step.
We hope that this blog clarifies any areas of confusion on this change and provides you with the information you need to be prepared for February 2024. Happy sending!
Compliance with the Payment Card Industry Data Security Standard (PCI DSS) is critical for organizations that handle cardholder data. Achieving and maintaining PCI DSS compliance can be a complex and challenging endeavor. Serverless technology has transformed application development, offering agility, performance, cost, and security.
In this blog post, we examine the benefits of using AWS serverless services and highlight how you can use them to help align with your PCI DSS compliance responsibilities. You can remove additional undifferentiated compliance heavy lifting by building modern applications with abstracted AWS services. We review an example payment application and workflow that uses AWS serverless services and showcases the potential reduction in effort and responsibility that a serverless architecture could provide to help align with your compliance requirements. We present the review through the lens of a merchant that has an ecommerce website and include key topics such as access control, data encryption, monitoring, and auditing—all within the context of the example payment application. We don’t discuss additional service provider requirements from the PCI DSS in this post.
This example will help you navigate the intricate landscape of PCI DSS compliance. This can help you focus on building robust and secure payment solutions without getting lost in the complexities of compliance. This can also help reduce your compliance burden and empower you to develop your own secure, scalable applications. Join us in this journey as we explore how AWS serverless services can help you meet your PCI DSS compliance objectives.
Disclaimer
This document is provided for the purposes of information only; it is not legal advice, and should not be relied on as legal advice. Customers are responsible for making their own independent assessment of the information in this document. This document: (a) is for informational purposes only, (b) represents current AWS product offerings and practices, which are subject to change without notice, and (c) does not create any commitments or assurances from AWS and its affiliates, suppliers or licensors. AWS products or services are provided “as is” without warranties, representations, or conditions of any kind, whether express or implied. The responsibilities and liabilities of AWS to its customers are controlled by AWS agreements, and this document is not part of, nor does it modify, any agreement between AWS and its customers.
AWS encourages its customers to obtain appropriate advice on their implementation of privacy and data protection environments, and more generally, applicable laws and other obligations relevant to their business.
PCI DSS v4.0 and serverless
In April 2022, the Payment Card Industry Security Standards Council (PCI SSC) updated the security payment standard to “address emerging threats and technologies and enable innovative methods to combat new threats.” Two of the high-level goals of these updates are enhancing validation methods and procedures and promoting security as a continuous process. Adopting serverless architectures can help meet some of the new and updated requirements in version 4.0, such as enhanced software and encryption inventories. If a customer has access to change a configuration, it’s the customer’s responsibility to verify that the configuration meets PCI DSS requirements. There are more than 20 PCI DSS requirements applicable to Amazon Elastic Compute Cloud (Amazon EC2). To fulfill these requirements, customer organizations must implement controls such as file integrity monitoring, operating system level access management, system logging, and asset inventories. Using AWS abstracted services in this scenario can remove undifferentiated heavy lifting from your environment. With abstracted AWS services, because there is no operating system to manage, AWS becomes responsible for maintaining consistent time settings for an abstracted service to meet Requirement 10.6. This will also shift your compliance focus more towards your application code and data.
This makes more of your PCI DSS responsibility addressable through the AWS PCI DSS Attestation of Compliance (AOC) and Responsibility Summary. This attestation package is available to AWS customers through AWS Artifact.
Reduction in compliance burden
You can use three common architectural patterns within AWS to design payment applications and meet PCI DSS requirements: infrastructure, containerized, and abstracted. We look into EC2 instance-based architecture (infrastructure or containerized patterns) and modernized architectures using serverless services (abstracted patterns). While both approaches can help align with PCI DSS requirements, there are notable differences in how they handle certain elements. EC2 instances provide more control and flexibility over the underlying infrastructure and operating system, assisting you in customizing security measures based on your organization’s operational and security requirements. However, this also means that you bear more responsibility for configuring and maintaining security controls applicable to the operating systems, such as network security controls, patching, file integrity monitoring, and vulnerability scanning.
On the other hand, serverless architectures similar to the preceding example can reduce much of the infrastructure management requirements. This can relieve you, the application owner or cloud service consumer, of the burden of configuring and securing those underlying virtual servers. This can streamline meeting certain PCI requirements, such as file integrity monitoring, patch management, and vulnerability management, because AWS handles these responsibilities.
Using serverless architecture on AWS can significantly reduce the PCI compliance burden. Approximately 43 percent of the overall PCI compliance requirements, encompassing both technical and non-technical tests, are addressed by the AWS PCI DSS Attestation of Compliance.
Customer responsible 52%
AWS responsible 43%
N/A 5%
The following table provides an analysis of each PCI DSS requirement against the serverless architecture in Figure 1, which shows a sample payment application workflow. You must evaluate your own use and secure configuration of AWS workload and architectures for a successful audit.
PCI DSS 4.0 requirements
Test cases
Customer responsible
AWS responsible
N/A
Requirement 1: Install and maintain network security controls
35
13
22
0
Requirement 2: Apply secure configurations to all system components
27
16
11
0
Requirement 3: Protect stored account data
55
24
29
2
Requirement 4: Protect cardholder data with strong cryptography during transmission over open, public networks
12
7
5
0
Requirement 5: Protect all systems and networks from malicious software
25
4
21
0
Requirement 6: Develop and maintain secure systems and software
35
31
4
0
Requirement 7: Restrict access to system components and cardholder data by business need-to-know
22
19
3
0
Requirement 8: Identify users and authenticate access to system components
52
43
6
3
Requirement 9: Restrict physical access to cardholder data
56
3
53
0
Requirement 10: Log and monitor all access to system components and cardholder data
38
17
19
2
Requirement 11: Test security of systems and networks regularly
51
22
23
6
Requirement 12: Support information security with organizational policies
56
44
2
10
Total
464
243
198
23
Percentage
52%
43%
5%
Note: The preceding table is based on the example reference architecture that follows. The actual extent of PCI DSS requirements reduction can vary significantly depending on your cardholder data environment (CDE) scope, implementation, and configurations.
Sample payment application and workflow
This example serverless payment application and workflow in Figure 1 consists of several interconnected steps, each using different AWS services. The steps are listed in the following text and include brief descriptions. They cover two use cases within this example application — consumers making a payment and a business analyst generating a report.
The example outlines a basic serverless payment application workflow using AWS serverless services. However, it’s important to note that the actual implementation and behavior of the workflow may vary based on specific configurations, dependencies, and external factors. The example serves as a general guide and may require adjustments to suit the unique requirements of your application or infrastructure.
Several factors, including but not limited to, AWS service configurations, network settings, security policies, and third-party integrations, can influence the behavior of the system. Before deploying a similar solution in a production environment, we recommend thoroughly reviewing and adapting the example to align with your specific use case and requirements.
Keep in mind that AWS services and features may evolve over time, and new updates or changes may impact the behavior of the components described in this example. Regularly consult the AWS documentation and ensure that your configurations adhere to best practices and compliance standards.
This example is intended to provide a starting point and should be considered as a reference rather than an exhaustive solution. Always conduct thorough testing and validation in your specific environment to ensure the desired functionality and security.
Figure 1: Serverless payment architecture and workflow
Use case 1: Consumers make a payment
Consumers visit the e-commerce payment page to make a payment.
The request is routed to the payment application’s domain using Amazon Route 53, which acts as a DNS service.
The payment page is protected by AWS WAF to inspect the initial incoming request for any malicious patterns, web-based attacks (such as cross-site scripting (XSS) attacks), and unwanted bots.
An HTTPS GET request (over TLS) is sent to the public target IP. Amazon CloudFront, a content delivery network (CDN), acts as a front-end proxy and caches and fetches static content from an Amazon Simple Storage Service (Amazon S3) bucket.
AWS WAF inspects the incoming request for any malicious patterns, if the request is blocked, the request doesn’t return static content from the S3 bucket.
User authentication and authorization are handled by Amazon Cognito, providing a secure login and scalable customer identity and access management system (CIAM)
AWS WAF processes the request to protect against web exploits, then Amazon API Gateway forwards it to the payment application API endpoint.
API Gateway launches AWS Lambda functions to handle payment requests. AWS Step Functions state machine oversees the entire process, directing the running of multiple Lambda functions to communicate with the payment processor, initiate the payment transaction, and process the response.
The cardholder data (CHD) is temporarily cached in Amazon DynamoDB for troubleshooting and retry attempts in the event of transaction failures.
A Lambda function validates the transaction details and performs necessary checks against the data stored in DynamoDB. A web notification is sent to the consumer for any invalid data.
A Lambda function calculates the transaction fees.
A Lambda function authenticates the transaction and initiates the payment transaction with the third-party payment provider.
A Lambda function is initiated when a payment transaction with the third-party payment provider is completed. It receives the transaction status from the provider and performs multiple actions.
Use case 2: An admin or analyst generates the report for non-PCI data
An admin accesses the web-based reporting dashboard using their browser to generate a report.
The request is routed to AWS WAF to verify the source that initiated the request.
An HTTPS GET request (over TLS) is sent to the public target IP. CloudFront fetches static content from an S3 bucket.
AWS WAF inspects incoming requests for any malicious patterns, if the request is blocked, the request doesn’t return static content from the S3 bucket. The validated traffic is sent to Amazon S3 to retrieve the reporting page.
The backend requests of the reporting page pass through AWS WAF again to provide protection against common web exploits before being forwarded to the reporting API endpoint through API Gateway.
API Gateway launches a Lambda function for report generation. The Lambda function retrieves data from DynamoDB storage for the reporting mechanism.
The AWS Security Token Service (AWS STS) issues temporary credentials to the Lambda service in the non-PCI serverless account, allowing it to launch the Lambda function in the PCI serverless account. The Lambda function retrieves non-PCI data and writes it into DynamoDB.
The Lambda function fetches the non-PCI data based on the report criteria from the DynamoDB table from the same account.
Additional AWS security and governance services that would be implemented throughout the architecture are shown in Figure 1, Label-25. For example, Amazon CloudWatch monitors and alerts on all the Lambda functions within the environment.
Label-26 demonstrates frameworks that can be used to build the serverless applications.
Scoping and requirements
Now that we’ve established the reference architecture and workflow, lets delve into how it aligns with PCI DSS scope and requirements.
PCI scoping
Serverless services are inherently segmented by AWS, but they can be used within the context of an AWS account hierarchy to provide various levels of isolation as described in the reference architecture example.
Segregating PCI data and non-PCI data into separate AWS accounts can help in de-scoping non-PCI environments and reducing the complexity and audit requirements for components that don’t handle cardholder data.
PCI serverless production account
This AWS account is dedicated to handling PCI data and applications that directly process, transmit, or store cardholder data.
Services such as Amazon Cognito, DynamoDB, API Gateway, CloudFront, Amazon SNS, Amazon SES, Amazon SQS, and Step Functions are provisioned in this account to support the PCI data workflow.
Security controls, logging, monitoring, and access controls in this account are specifically designed to meet PCI DSS requirements.
Non-PCI serverless production account
This separate AWS account is used to host applications that don’t handle PCI data.
Since this account doesn’t handle cardholder data, the scope of PCI DSS compliance is reduced, simplifying the compliance process.
Note: You can use AWS Organizations to centrally manage multiple AWS accounts.
Now, let’s look at the PCI DSS requirements that this architectural pattern can help address.
Requirement 1: Install and maintain network security controls
Network security controls are limited to AWS Identity and Access Management (IAM) and application permissions because there is no customer controlled or defined network. VPC-centric requirements aren’t applicable because there is no VPC. The configuration settings for serverless services can be covered under Requirement 6 to for secure configuration standards. This supports compliance with Requirements 1.2 and 1.3.
Requirement 2: Apply secure configurations to all system components
AWS services are single function by default and exist with only the necessary functionality enabled for the functioning of that service. This supports compliance with much of Requirement 2.2.
Access to AWS services is considered non-console and only accessible through HTTPS through the service API. This supports compliance with Requirement 2.2.7.
The wireless requirements under Requirement 2.3 are not applicable, because wireless environments don’t exist in AWS environments.
Requirement 3: Protect stored account data
AWS is responsible for destruction of account data configured for deletion based on DynamoDB Time to Live (TTL) values. This supports compliance with Requirement 3.2.
DynamoDB and Amazon S3 offer secure storage of account data, encryption by default in transit and at rest, and integration with AWS Key Management Service (AWS KMS). This supports compliance with Requirements 3.5 and 4.2.
AWS is responsible for the generation, distribution, storage, rotation, destruction, and overall protection of encryption keys within AWS KMS. This supports compliance with Requirements 3.6 and 3.7.
Manual cleartext cryptographic keys aren’t available in this solution, Requirement 3.7.6 is not applicable.
Requirement 4: Protect cardholder data with strong cryptography during transmission over open, public networks
AWS Certificate Manager (ACM) integrates with API Gateway and enables the use of trusted certificates and HTTPS (TLS) for secure communication between clients and the API. This supports compliance with Requirement 4.2.
Requirement 4.2.1.2 is not applicable because there are no wireless technologies in use in this solution. Customers are responsible for ensuring strong cryptography exists for authentication and transmission over other wireless networks they manage outside of AWS.
Requirement 4.2.2 is not applicable because no end-user technologies exist in this solution. Customers are responsible for ensuring the use of strong cryptography if primary account numbers (PAN) are sent through end-user messaging technologies in other environments.
Requirement 5: Protect a ll systems and networks from malicious software
There are no customer-managed compute resources in this example payment environment, Requirements 5.2 and 5.3 are the responsibility of AWS.
Requirement 6: Develop and maintain secure systems and software
Amazon Inspector helps identify vulnerabilities and security weaknesses in the payment application’s code, dependencies, and configuration. This supports compliance with Requirement 6.3.
AWS WAF is designed to protect applications from common attacks, such as SQL injections, cross-site scripting, and other web exploits. AWS WAF can filter and block malicious traffic before it reaches the application. This supports compliance with Requirement 6.4.2.
Requirement 7: Restrict access to system components and cardholder data by business need to know
IAM and Amazon Cognito allow for fine-grained role- and job-based permissions and access control. Customers can use these capabilities to configure access following the principles of least privilege and need-to-know. IAM and Cognito support the use of strong identification, authentication, authorization, and multi-factor authentication (MFA). This supports compliance with much of Requirement 7.
Requirement 8: Identify users and authenticate access to system components
IAM and Amazon Cognito also support compliance with much of Requirement 8.
Some of the controls in this requirement are usually met by the identity provider for internal access to the cardholder data environment (CDE).
Requirement 9: Restrict physical access to cardholder data
AWS is responsible for the destruction of data in DynamoDB based on the customer configuration of content TTL values for Requirement 9.4.7. Customers are responsible for ensuring their database instance is configured for appropriate removal of data by enabling TTL on DDB attributes.
Requirement 9 is otherwise not applicable for this serverless example environment because there are no physical media, electronic media not already addressed under Requirement 3.2, or hard-copy materials with cardholder data. AWS is responsible for the physical infrastructure under the Shared Responsibility Model.
Requirement 10: Log and monitor all access to system components and cardholder data
AWS CloudTrail provides detailed logs of API activity for auditing and monitoring purposes. This supports compliance with Requirement 10.2 and contains all of the events and data elements listed.
CloudWatch can be used for monitoring and alerting on system events and performance metrics. This supports compliance with Requirement 10.4.
AWS Security Hub provides a comprehensive view of security alerts and compliance status, consolidating findings from various security services, which helps in ongoing security monitoring and testing. Customers must enable PCI DSS security standard, which supports compliance with Requirement 10.4.2.
AWS is responsible for maintaining accurate system time for AWS services. In this example, there are no compute resources for which customers can configure time. Requirement 10.6 is addressable through the AWS Attestation of Compliance and Responsibility Summary available in AWS Artifact.
Requirement 11: Regularly test security systems and processes
Testing for rogue wireless activity within the AWS-based CDE is the responsibility of AWS. AWS is responsible for the management of the physical infrastructure under Requirement 11.2. Customers are still responsible for wireless testing for their environments outside of AWS, such as where administrative workstations exist.
AWS is responsible for internal vulnerability testing of AWS services, and supports compliance with Requirement 11.3.1.
Amazon GuardDuty, a threat detection service that continuously monitors for malicious activity and unauthorized access, providing continuous security monitoring. This supports the IDS requirements under Requirement 11.5.1, and covers the entire AWS-based CDE.
AWS Config allows customers to catalog, monitor and manage configuration changes for their AWS resources. This supports compliance with Requirement 11.5.2.
Customers can use AWS Config to monitor the configuration of the S3 bucket hosting the static website. This supports compliance with Requirement 11.6.1.
Requirement 12: Support information security with organizational policies and programs
Customers can download the AWS AOC and Responsibility Summary package from Artifact to support Requirement 12.8.5 and the identification of which PCI DSS requirements are managed by the third-party service provider (TSPS) and which by the customer.
Conclusion
Using AWS serverless services when developing your payment application can significantly help reduce the number of PCI DSS requirements you need to meet by yourself. By offloading infrastructure management to AWS and using serverless services such as Lambda, API Gateway, DynamoDB, Amazon S3, and others, you can benefit from built-in security features and help align with your PCI DSS compliance requirements.
Contact us to help design an architecture that works for your organization. AWS Security Assurance Services is a Payment Card Industry-Qualified Security Assessor company (PCI-QSAC) and HITRUST External Assessor firm. We are a team of industry-certified assessors who help you to achieve, maintain, and automate compliance in the cloud by tying together applicable audit standards to AWS service-specific features and functionality. We help you build on frameworks such as PCI DSS, HITRUST CSF, NIST, SOC 2, HIPAA, ISO 27001, GDPR, and CCPA.
More information on how to build applications using AWS serverless technologies can be found at Serverless on AWS.
Want more AWS Security news? Follow us on Twitter.
SMS fraud is, unfortunately, a common issue that all senders of SMS encounter as they adopt SMS as a communication channel. This post defines the most common types of fraud and provides concrete guidance on how to mitigate or eliminate each of them.
Introduction to SMS Pumping:
SMS Pumping, also known as an SMS Flood attack, or Artificially Inflated Traffic (AIT), occurs when fraudsters exploit a phone number input field to acquire a one-time passcode (OTP), an app download link, or any other content via SMS. In cases where these input forms lack sufficient security measures, attackers can artificially increase the volume of SMS traffic, thereby exploiting vulnerabilities in your application. The perpetrators dispatch SMS messages to a selection of numbers under the jurisdiction of a particular mobile network operator (MNO), ultimately receiving a portion of the resulting revenue. It is essential to understand how to detect these attacks and prevent them.
Common Evidence of SMS Pumping:
Dramatic Decrease in Conversion Rates: A common SMS use case is for identity verification through the use of One Time Passwords (OTP) but this could also be seen in other types of use cases where a clear and consistent conversion rate is seen. A drop in a normally stable conversion rate may be caused by an increase in volume that will never convert and can indicate an issue that requires investigation. Setting up an alert for anomalies in conversion rates is always a good practice.
SMS Requests or Deliveries from Unknown Countries: If your application normally sends SMS to a defined set of countries and you begin to receive requests for a different country, then then this should be investigated.
Spike in Outgoing Messages: A significant and sudden increase in outgoing messages could indicate an issue that requires investigation.
Spike in Messages Sent to a Block of AdjacentNumbers: Fraudsters often deploy bots and programmatically loop through numbers in a sequence. You will probably notice an increase in messages to a group of nearby numbers frequently for example, +11111111110, +11111111111
How to Identify and Prevent SMS Pumping Attacks:
Now that we understand the common signs of SMS pumping, lets discuss how to use AWS Services to identify, confirm the fraud and how to place measures in place to prevent it in the first place.
The below query will print all the logs that have the destination number like +11111111111 fields @timestamp, @message, @logStream, @log | filter delivery.destination like '+11111111111' | limit 20
If you are using Amazon Pinpoint, you can enable event stream to analyse destination numbers.
Example: If you expect only users from India to sign up in your application, you can include rules such as “\+91[0-9]{10}”, which allows only Indian numbers as input.
Note: SNS and Pinpoint APIs are not natively integrated with WAF. However, you can connect your application to an Amazon API Gateway with which you can integrate with WAF.
How to Create a Regex Pattern Set with WAF – The below Regex Pattern set will allow sending messages to Australia (+61) and India (+91) destination phone numbers
Sign in to the AWS Management Console and navigate to AWS WAF console
In the navigation pane, choose Regex pattern sets and then Create regex pattern set.
Enter a name and description for the regex pattern set. You’ll use these to identify it when you want to use the set. For example, Allowed_SMS_Countries
Select the Region where you want to store the regex pattern set
In the Regular expressions text box, enter one regex pattern per line
Review the settings for the regex pattern set, and choose Create regex pattern set
Regex pattern set details
Create a Web ACL with above Regex Pattern Set
Sign in to the AWS Management Console and navigate to AWS WAF console
In the navigation pane, choose Web ACLs and then Create web ACL
Enter a Name, Description and CloudWatch metric name for Web ACL details
Select Resource type as Regional resources
Click Next
Web ACL details
Click on Add Rules > Add my own rules and rule groups
Enter Rule name and select Regular rule
Web ACL Rule Builder
Select Inspect > Body, Content type as JSON, JSON match scope as Values, Content to inspect as Full JSON content
Select Match type as Matches pattern from regex pattern set and select the Regex pattern set as “Allowed_SMS_Countries” created above
Select Action as Allow
Click Add Rule
Web ACL Rule builder statement
Select Block for Default web ACL action for requests that don’t match any rules
AWS WAF provides an option to rate limit per originating IP. You can define the maximum number of requests allowed in a five-minute period that satisfy the criteria you provide, before limiting the requests using the rule action setting
CAPTCHA
Implement CAPTCHA in your application request process to protect your application against common bot traffic
Validate Phone Numbers – You can use the Pinpoint Phone number validate API to check the values for CountryCodeIso2, CountryCodeNumeric, and PhoneType prior to sending SMS and then only send SMS to countries that match your criteria Sample API Response:
This post covers the basics of SMS pumping attacks, the different mechanisms that can be used to detect them, and some potential ways to solve for or mitigate them using services and features like Pinpoint Validate API and WAF.
Further Reading:
Review the documentation of WAF with API gateway here
Review the documentation of Phone number validate here
Amazon Pinpoint offers marketers and developers one customizable tool to deliver customer communications across channels, segments, and campaigns at scale. Amazon Pinpoint makes it easy to run targeted campaigns and drive customer communications across different channels: email, SMS, push notifications, in-app messaging, or custom channels. Amazon Pinpoint campaigns enables you define which users to target, determine which messages to send, schedule the best time to deliver the messages, and then track the results of your campaign.
In many cases, the customer data resides in a third-party system such as a CRM, Customer Data Platform, Point of Sales, database and data warehouse. This customer data represents a valuable asset for your organization. Your marketing team needs to leverage each piece of this data to elevate the customer experience.
In this blog post we will demonstrate how you can leverage users’ clickstream data stored in database to build user segments and launch campaigns using Amazon Pinpoint. Also, we will showcase the full architecture of the data pipeline including other AWS services such as Amazon RDS, AWS Data Migration Service, Amazon Kinesis and AWS Lambda.
Let us understand our case study with an example: a customer currently has digital touch points such as a Website and a Mobile App to collect the users’ clickstreams and behavioral data where they are storing them in a MySQL database. Marketing teams want to leverage the collected data to deliver a personalized experience by leveraging Amazon Pinpoint capabilities.
You can find below the detail of a specific use case covered by the proposed solution:
All the clickstream and customer data are stored in MySQL DB
Your marketing team wants to create a personalized Amazon Pinpoint campaigns based on the user status and experience. Ex:
Customers who interested in specific offering to activate for them campaign based on their interest
Communicate with the preferred language of the user
Please note that this use case is used to showcase the proposed solution capabilities. However, it is not limited to this specific use case since you can leverage any customer collected dimension/attribute to create specific campaign to achieve a specific marketing use case.
In this post, we provide a guided journey on how marketers can collect, segment, and activate audience segments in real-time to increase their agility in managing campaigns.
Overview of solution
The use case covered in this post, focuses on demonstrating the flexibility offered by Amazon Pinpoint in both inbound (Ingestion) and outbound (Activation) stream of customer data. For the inbound stream, Amazon Pinpoint gives you a variety of ways to import your customer data, including:
CSV/JSON import from the AWS console
API operation to create a single or multiple endpoints
Programmatically create and execute import jobs
We will focus on building a real-time inbound stream of customer data available within an Amazon RDS MySQL database specifically. It is important to mention that similar approach can be implemented to ingest data from third-party systems if any.
For the outbound stream, activating customer data using Amazon Pinpoint can be achieved using the following two methods:
Campaign: a campaign is a messaging initiative that engages a specific audience segment.
Journey: a journey is a customized, multi-step engagement experience.
The result of customer data activation cannot be completed without specifying the targeted channel. A channel represents the platform through which you engage your audience segment with messages. For example, Amazon Pinpoint customers can optimize how they target notifications to prospective customers through LINE message and email. They can deliver notifications with more information on prospected customer’s product information such as sales, new products etc. to the appropriate audience.
Amazon Pinpoint supports the following channels:
Push notifications
Email
SMS
Voice
In-app messages
In addition to these channels, you can also extend the capabilities to meet your specific use case by creating custom channels. You can use custom channels to send messages to your customers through any service that has an API including third-party services. For example, you can use custom channels to send messages through third-party services such as WhatsApp or Facebook Messenger. We will focus on developing an Amazon Pinpoint connector using custom channel to target your customers on third-party services through API.
The below diagram illustrates the proposed architecture to address the use case. Moving from left to right:
Fig 1: Architecture Diagram for the Solution
Amazon RDS: This hosts customer database where you can have one or many tables contains customer data.
AWS Data Migration Service (DMS): This acts as the glue between Amazon RDS MySQL and the downstream services by replicating any transformation that happens at the record level in the configured customer tables.
Amazon Kinesis Data Streams: This is the destination endpoint for AWS DMS. It will carry all the transformed records for the next stage of the pipeline.
AWS Lambda (inbound): The inbound AWS Lambda triggers the Kinesis Data Streams, process the mutated records, and ingest them in Amazon Pinpoint.
Amazon Pinpoint: This act as the centralized place to define customer segments and launch campaigns.
AWS Lambda (outbound): This act as the custom channel destination for the campaigns activated from Amazon Pinpoint.
To illustrate how to set up this architecture, we’ll walk you through the following steps:
Deploying an AWS CDK stack to provision the following AWS Resources
Run a Sample Workflow – This workflow will run an AWS Glue PySpark job that uses a custom Python library, and an upgraded version of boto3.
Cleaning up your resources.
Prerequisites
Make sure that you complete the following steps as prerequisites:
Have an AWS account. For this post, you configure the required AWS resources using AWS CloudFormation. If you haven’t signed up, complete the following tasks:
Some of the AWS Services or service features are not available in all regions. Therefore, we suggest to deploy the solution architecture in one of the regions below:
Step 2: Change directories to the new directory code location:
cd amazon-pinpoint-realtime-campaign-optimization-example
Step 3: Update your AWS account number and region:
Edit config.py with your choice to tool or command line
look for section “Account Setup” and update your account number and region
Fig 2: Configuring config.py for account-id and region
look for section “VPC Parameters” and update your VPC and subnet info
Fig 3: Configuring config.py for VPC and subnet information
Step 4: Verify if you are in the directory where app.py file is located:
ls -ltr app.py
Step 5: Create a virtual environment:
macOS/Linux:
python3 -m venv .env
Windows:
python -m venv .env
Step 6: Activate the virtual environment after the init process completes and the virtual environment is created:
macOS/Linux:
source .env/bin/activate
Windows:
.env\Scripts\activate.bat
Step 7: Install the required dependencies:
pip3 install -r requirements.txt
Step 8: Bootstrap the cdk app using the following command:
cdk bootstrap aws://<AWS_ACCOUNTID>/<AWS_REGION>
Replace the place holder AWS_ACCOUNTID and AWS_REGION with your AWS account ID and the region to be deployed. This step provisions the initial resources, including an Amazon S3 bucket for storing files and IAM roles that grant permissions needed to perform deployments.
Fig 4: Bootstrapping CDK environment
Please note, if you have already bootstrapped the same account previously, you cannot bootstrap account, in such case skip this step or use a new AWS account.
Step 9: Make sure that your AWS profile is setup along with the region that you want to deploy as mentioned in the prerequisite. Synthesize the templates. AWS CDK apps use code to define the infrastructure, and when run they produce or “synthesize” a CloudFormation template for each stack defined in the application:
cdk synthesize
Step 10: Deploy the solution. By default, some actions that could potentially make security changes require approval. In this deployment, you’re creating an IAM role. The following command overrides the approval prompts, but if you would like to manually accept the prompts, then omit the –require-approval never flag:
cdk deploy "*" --require-approval never
While the AWS CDK deploys the CloudFormation stacks, you can follow the deployment progress in your terminal.
Fig 5: AWS CDK Deployment progress in terminal
Once the deployment is successful, you’ll see the successful status as follows:
Fig 6: AWS CDK Deployment completion success
Step 11: Log in to the AWS Console, go to CloudFormation, and see the output of the ApplicationStack:
Fig 7: AWS CloudFormation stack output
Note the values of PinpointProjectId, PinpointProjectName, and RDSSecretName variables. We’ll use them in the next step to upload our artifacts
Testing The Solution
In this section we will create a full data flow using the below steps:
Ingest data in the customer_tb table within the Amazon RDS MySQL DB instance
Validate that AWS Data Migration Service created task is replicating the changes to the Amazon Kinesis Data Streams
Validate that endpoints are created within Amazon Pinpoint
Create Amazon Pinpoint Segment and Campaign and activate data to Webhook.site endpoint URL
Step 1: Connect to MySQL DB instance and create customer database
Environment type: Create a new EC2 instance for environment (direct access)
Instance type: t2.micro
Timeout: 30 minutes
Platform: Amazon Linux 2
Network settings under VPC settings select the same VPC where the MySQL DB instance was created. (this is the same VPC and Subnet from step 3.3)
Click Next
Review and click Create environment
Select the created AWS Cloud9 from the AWS Cloud9 console at https://console.aws.amazon.com/cloud9 and click Open in Cloud9. You will have access to AWS Cloud9 Linux shell.
From Linux shell, update the operating system and :
sudo yum update -y
From Linux shell, update the operating system and :
sudo yum install -y mysql
To connect to the created MySQL RDS DB instance, use the below command in the AWS Cloud9 Linux shell:
mysql -h <<host>> -P 3308 --user=<<username>> --password=<<password>>
To get values for dbInstanceIdentifier, username, and password
Open the secret with the name created by the CDK application
Select ‘Reveal secret value’ and copy the respective values and replace in your command
After you enter the password for the user, you should see output similar to the following.
Welcome to the MariaDB monitor.  Commands end with ; or \g.
Your MySQL connection id is 27
Server version: 8.0.32 Source distribution
Copyright (c) 2000, 2018, Oracle, MariaDB Corporation Ab and others.
Type 'help;' or '\h' for help. Type '\c' to clear the current input statement.
MySQL [(none)]>
Step 2: Ingest data in the customer_tb table within the Amazon RDS MySQL DB instance Once the connection to the MySQL DB instance established, using the same AWS Cloud9 Linux shell connected to the MySQL RDS DB execute following commands.
Create database pinpoint-test-db:
CREATE DATABASE `pinpoint-test-db`;
Create table customer-tb:
Use `pinpoint-test-db`;
CREATE TABLE `customer_tb` (`userid` int NOT NULL,
                            `email` varchar(150) DEFAULT NULL,
                            `language` varchar(45) DEFAULT NULL,
                            `favourites` varchar(250) DEFAULT NULL,
                            PRIMARY KEY (`userid`);
You can verify the schema using the below SQL command:
DESCRIBE `pinpoint-test-db`.customer_tb;
Fig 8: Verify schema for customer_db table
Insert records in customer_tb table:
Use `pinpoint-test-db`;
insert into customer_tb values (1,'[email protected]','english','football');
insert into customer_tb values (2,'[email protected]','english','basketball');
insert into customer_tb values (3,'[email protected]','french','football');
insert into customer_tb values (4,'[email protected]','french','football');
insert into customer_tb values (5,'[email protected]','french','basketball');
insert into customer_tb values (6,'[email protected]','french','football');
insert into customer_tb values (7,'[email protected]','french',null);
insert into customer_tb values (8,'[email protected]','english','football');
insert into customer_tb values (9,'[email protected]','english','football');
insert into customer_tb values (10,'[email protected]','english',null);
Verify records in customer_tb table:
select * from `pinpoint-test-db`.`customer_tb`;
Fig 9: Verify data for customer_db table
Step 3: Validate that AWS Data Migration Service created task is replicating the changes to the Amazon Kinesis Data Streams
Click on Amazon Pinpoint Project Demo created by CDK stack “dev-pinpoint-project”
from the left menu, click on Segments and click Create a segment
create Segment using the below configurations:
Name: English Speakers
Under criteria:
Attribute: Language
Operator: Conatins
Value: english
Fig 14: Amazon Pinpoint segment summary
Click create segment
Step 5.2: Create Amazon Pinpoint Campaign
from the left menu, click on Campaigns and click Create a campaign
set the Campaign name to test campaign and select Custom option for Channel as shown below:
Fig 15: Amazon Pinpoint create campaign
Click Next
Select English Speakers from Segment as shown below and click Next:
Fig 16: Amazon Pinpoint segment
Choose Lambda function channel type and select outbound lambda function with name pattern as ApplicationStack-lambdaoutboundfunction* from the dropdown as shown below:
Fig 17: Amazon Pinpoint message creation
Click Next
Choose At a specific time option and immediately to send the campaign as show below:
Fig 18: Amazon Pinpoint campaign scheduling
If you push more messages or records into Amazon RDS (from step 2.4), you will need to create a new campaign (from step 4.2) to process the new messages.
Click Next, review the configuration and click Launch campaign.
Navigate to dev-pinpoint-project and select the campaign created in previous step. You should see status as ‘Complete’
Fig 19: Amazon Pinpoint campaign processing status
Navigate to dev-pinpoint-project dashboard and select your campaign in ‘Campaign metrics’ dashboard, you will see the statistics for the processing.
Fig 20: Amazon Pinpoint campaign metrics
Accomplishments
This is a quick summary of what we accomplished:
Created an Amazon RDS MySQL DB instance and define customer_tb table schema
Created an Amazon Kinesis Data Stream
Replicated database changes from the Amazon RDS MySQL DB to Amazon Kinesis Data Stream
Created an AWS Lambda function triggered by Amazon Kinesis Data Stream to ingest database records in Amazon Pinpoints as User endpoints using AWS SDK
Created an Amazon Pinpoint Project, segment and campaign
Created an AWS Lambda function as custom channel for Amazon Pinpoint campaign
Tested end-to-end data flow from Amazon RDS MySQL DB instance to third party endpoint
Next Steps
You have now gained a good understanding of Amazon Pinpoint agnostic data flow but there are still many areas left for exploration. What this workshop hasn’t covered is the operation of other communication channels such as Email, SMS, Push notification and Voice outbound. You can enable the channels that are pertinent to your use case and send messages using campaigns or journeys.
Clean Up
Make sure that you clean up all of the other AWS resources that you created in the AWS CDK Stack deployment. You can delete these resources via the AWS CDK Destroy command as follows or the CloudFormation console.
To destroy the resources using AWS CDK, follow these steps:
Follow Steps 1-5 from the ‘Launching your CDK Stack’ section.
Destroy the app by executing the following command:
cdk destroy
Summary
In this post, you have now gained a good understanding of Amazon Pinpoint flexible real-time data flow. By implementing the steps detailed in this blog post, you can achieve a seamless integration of your customer data from Amazon RDS MySQL database to Amazon Pinpoint where you can leverage segments and campaigns to activate data using custom channels to third-party services via API. The demonstrated use case focuses on Amazon RDS MySQL database as a data source. However, there are still many areas left for exploration. What this post hasn’t covered is the operation of integrating customer data from other type of data sources such as MongoDB, Microsoft SQL Server, Google Cloud, etc. Also, other communication channels such as Email, SMS, Push notification and Voice outbound can be used in the activation layer. You can enable the channels that are pertinent to your use case and send messages using campaigns or journeys, and get a complete view of their customers across all touchpoints and can lead to less relevant marketing campaigns.
About the Authors
Bret Pontillo is a Senior Data Architect with AWS Professional Services Analytics Practice. He helps customers implement big data and analytics solutions. Outside of work, he enjoys spending time with family, traveling, and trying new food.
Rushabh Lokhande is a Data & ML Engineer with AWS Professional Services Analytics Practice. He helps customers implement big data, machine learning, and analytics solutions. Outside of work, he enjoys spending time with family, reading, running, and golf.
Ghandi Nader is a Senior Partner Solution Architect focusing on the Adtech and Martech industry. He helps customers and partners innovate and align with the market trends related to the industry. Outside of work, he enjoys spending time cycling and watching formula one.
Businesses are constantly evolving, often managing multiple product lines, customer segments, or even geographical locations. Furthermore, many business-to-business (B2B) companies that are Independent Software Vendors (ISVs) will often need to manage their customer’s marketing automation environment. This complexity necessitates a robust customer engagement strategy that can adapt and scale efficiently. However, managing disparate systems for each tenant is not only cumbersome but also resource-intensive, leading to increased operational costs and potential data silos. A multi-tenancy setup in Amazon Pinpoint addresses these challenges head-on, allowing businesses to streamline their customer engagement efforts under a unified architecture.
The question is not just whether to adopt multi-tenancy, but how to implement it in a way that aligns with your unique business requirements. Amazon Pinpoint offers multiple approaches to achieve this. This blog explores three:
Single Pinpoint Project: Simple but demands careful permissions management.
Multiple Pinpoint Projects: Granular control but limited by soft project quotas.
Multiple Account & Multi Pinpoint Projects: Highly scalable but needs comprehensive monitoring.
We’ll delve into the pros, cons, and best use-cases for each as well as how to choose the different multi-tenancy configuration depending on your communications channels needs, guiding you to make an informed architectural decision.
In this blog, we’ll cut through the complexity, helping you align your Amazon Pinpoint architecture with your business goals. Let’s get started.
Single Account / Single Project (SA/SP)
Overview
In a Single Pinpoint Project setup, all customer engagement activities reside within one project and multi-tenancy within this context will leverage customer endpoint attributes. This streamlined approach allows for easy management, especially for those new to Amazon Pinpoint. A configuration example for this case is shown below:
When preparing one Pinpoint Project and managing information for multiple tenants, tenant information can be managed by using custom user attributes of endpoints. Also, campaign information can be managed for each tenant by using the tag function for campaign information. The elements required to take this configuration are shown below.
S3 buckets that hold customer data:
Prepare an S3 bucket to store customer information lists to be imported into Pinpoint. Amazon Pinpoint allows you to import CSV files in S3 as segments. In order to make settings for each tenant in Amazon Pinpoint, we will include tenant information as custom user attributes in the CSV file.
Settings for each channel to be distributed are also required.
Campaign information can be assigned to tenant information by using the tag function.
Amazon Kinesis:
By using Amazon Pinpoint’s event stream settings, it can be saved to S3 via Kinesis.
Athena and S3 buckets to analyze event data:
Store Amazon Pinpoint event data in S3 and analyze it via Athena. Take advantage of this solution.
One thing to keep in mind when adopting this configuration is that customer endpoint information exists in the same Pinpoint Project. It is possible to specify values that can be used to identify each tenant, such as custom attributes, and solve the problem with AWS Identity and Access Management (IAM) policies, but it is necessary to manage access rights and attributes on your own.
Also, to add an endpoint, you’ll need to specify its Channel and Address. Take note that one project cannot have the same channel and address for different endpoints. From the above, if the channel and address of the endpoint do not overlap between tenants, it is possible to construct your own access permission control, then this pattern can be examined.
Since fewer components are required compared to other patterns, the configuration is easier to start with. Some customers that want to build on top of Pinpoint API and want to simplify configuration on the Pinpoint side as much as possible can also choose this option. However, this approach can get complex to manage later on as you onboard more tenants. The issue presents itself when you want to create detailed reporting for your tenant in this configuration. You’ll have to have dedicated tags on each campaigns, journeys to operationalize granular reporting for your Amazon Pinpoint project.
Lastly, take note of service limits per Amazon Pinpoint project/AWS account to ensure your use case will be scalable should the need arise.
Single Account / Multiple Projects (SA/MP)
Overview
For this architecture, you are still using a single AWS account to host your Amazon Pinpoint environment, however, you will be creating multiple projects for each customer or tenant. A configuration example for this case is shown diagram.
In this example, we will create multiple Amazon Pinpoint Projects. One major difference from the case of the Single Pinpoint Project is that it is possible to completely separate customer endpoint information. When importing customer data segments, it is possible to manage each tenant in a separate state simply by importing them from S3 into the target Pinpoint Project. This makes it easy to control permissions via IAM policies.
Also, with Amazon Pinpoint, you can use email addresses, SMS numbers, message templates, etc. for transmission obtained with the relevant account in common to all projects, and event data for each project can be aggregated via Amazon Kinesis. By adopting such a configuration, you gain the benefits of separating endpoint information per project while still retaining basic setting information management and operator operations.
An example starter solution architecture to set up this configuration are shown below.
S3 buckets that hold customer data:
Similar to SA/SP, prepare an S3 bucket to store a list of customer information to be imported into Pinpoint. CSV to be imported must be prepared for each project.
Amazon DynamoDB Table:
Prepare a DynamoDB (or other key-value database) table to manage Pinpoint project information. Tenant information can also be stored as metadata in the DynamoDB table.
AWS Lambda:
Create a Pinpoint Project using Lambda. Amazon Pinpoint allows you to create and configure projects using the Amazon Pinpoint API, the AWS SDK, or the AWS Command Line Interface (AWS CLI). Thus, it is possible to automate the creation of the Pinpoint project and associated campaigns/journeys. Tenant information is also registered in DynamoDB at the time of creation.
Multiple Amazon Pinpoint Projects:
This is a Project created by Lambda above. There will now be a Pinpoint Project for each tenant, and endpoint information will be completely separated. It is also easy to control access rights for each project by using the IAM function.
Message templates: templates can be created and shared across projects.
By using Amazon Pinpoint’s event stream settings, campaign/journeys/app/channels events can be streamed to Amazon Kinesis. Multiple Amazon Pinpoint projects can all stream to one Amazon Kinesis stream. When setup correctly, event data will be tagged with the relevant tenant information so that an analytics solution can decompose the stream later on.
Athena and S3 buckets to analyze event data:
Amazon Pinpoint event data is stored in Amazon S3 and analyzed via Amazon Athena. The analytics solution, Amazon Athena in this case will be responsible for filtering event data and according to the tenant. Refer to this solution for more details.
Note that Pinpoint projects have a soft limit of 100 projects per AWS account, which can be increased via raising a Support Ticket, other quotas also apply at the project and the account level which should be taken into account.
From the above, it is necessary to note that there are restrictions on quotas per account when using the SA/MP and more initial configurations would be required to automate the process of project creation for individual tenants. However, when compared to SA/SP architecture,
Multiple Accounts & Multi Pinpoint Projects (MA/MP)
Overview
Before diving into the MA/MP approach, it’s crucial to understand the role of AWS Organizations in this configuration. AWS Organizations allows you to consolidate multiple AWS accounts into an organization to achieve centralized governance and billing. This feature is particularly useful in a MA/MP setup, as it enables streamlined management of multiple AWS accounts and Amazon Pinpoint projects from a single central management AWS account. For more information on AWS Organizations, you can visit the official AWS Organizations documentation.
In an MA/MP setup, we utilize separate AWS Accounts for each customer or tenant. A configuration example for this case is shown below.
In this example, we have created a Management account and prepared multiple AWS accounts under it. The management account manages the AWS account ID and the Pinpoint project ID, and has a configuration created with Lambda. Customer data and Event Stream Data are managed through a Management account, and information on each project is aggregated. A major benefit of this configuration is the ability to segregate actions of individual tenants, preventing the such as noisy neighbours antipattern. It also enables AWS accounts from being freed from quota restrictions that cannot be handled by a single AWS account. Additionally, Amazon Pinpoint has excellent CloudFormation coverage, and it is also possible to deploy highly reproducible architectures automatically.
The elements required to set up this configuration are shown below.
Set up Organizations to manage multiple accounts. See Best Practices for setting up multiple accounts.
Management account:
Create an account to manage multiple account information. Here we will set the following elements. Use IAM roles and Service control policies (SCPs) when manipulating resources across accounts. This allows cross-account access. The required elements are the same as the SA/MP described above.
S3 buckets that hold customer data: With AWS, you can utilize S3 data across accounts. Set up cross-account settings and securely link customer data to each account.
Dynamo DB Table: Holds your AWS account ID, Pinpoint Project ID, and management information associated with it.
AWS Lambda: Create a Pinpoint project using Lambda.
Athena and S3 buckets to analyze event data: Event information from multiple accounts and Pinpoint projects is aggregated and analyzed.
AWS accounts and Pinpoint projects per tenant:
Depending on how tenants are separated, prepare an AWS account and Pinpoint Project. You can also consider automating account creation by using AWS CloudFormation.
There are cases where it is necessary to set the distribution channel email address, SMS number, etc. for each account. See the next section for details.
Amazon Kinesis is prepared for each account, but everything is stored in the same S3 in the Management account for easier bird-eye’s view reporting.
One thing to keep in mind is that since accounts are separated, it becomes necessary to manage each one separately. For example, newly created account will be placed in the sandbox state, and an application for actual use via support tickets is required for each account. Also, since all reputation is done on a single account, it is also necessary to monitor reputation for each account.
Navigating Channels in Amazon Pinpoint: Aligning Service Delivery with Architecture
Beyond choosing a Pinpoint architecture for multi-tenancy, it’s pivotal to decide which channels best deliver your services and how that decision is affected by your choice of multi-tenancy architecture. Below is a non-exhaustive lists of capabilities in Amazon Pinpoint that will help with your multi-channel, multi-tenancy configurations as well as potential blockers that you’d need to be aware of for each channels.
Email
Email is one of the most versatile channels, with integration with Amazon SES’s configuration sets and email suppression list capability, easily fitting into any of the three multi-tenancy models.
Configurations Sets: Using configuration sets, you’d be able to segregate your email sending activities using different IP Pools, as well as different event destinations.
You can use configuration sets in both Amazon Pinpoint and Amazon SES. Configuration sets rules that you configure in Amazon SES are also applied to email messages that you send using Amazon Pinpoint.
SA/SP and SA/MP: Email templates and sending IP addresses needs to be tagged using configuration sets for each tenant in the Pinpoint project.
MA/MP: Email templates and sending IP address can be sent using the account default, or follow granular tagging using configuration sets.
Email Suppression List: Suppression list is managed automatically at the account level. Alternatively, you can specify whether a specific configuration can override the account-level suppression list.
If any tenant sends to an email address that hard-bounced or complaint, all other tenants will also be unable to send emails to the same address.
You will have to manually override the account-level suppression list for each email addresses.
MA/MP:
If one of your tenant sends an email to a hard-bounced or complaint address, only the AWS account that the tenant belongs to will respect the suppression list i.e. other tenants in other AWS account can still send email to that email address.
Noisy Neighbour Threat: Broadly, this occurs when one tenant’s performance is degraded because of the activities of another tenant. Applied to email, the anti-pattern needs to be addressed because you don’t want one bad actor tenant to affect the entire environment’s email sending activity.
SA/SP and SA/MP:
Because email bounce and complaint rates are tracked at the account level, it is possible your entire account email sending domain to be blocked due to high bounce/complaint incidences from one bad tenant.
To mitigate this, it’s best practice to set up dedicated configuration sets and alarms to alert when any individual tenant is exhibiting high bounce/complaint rate.
MA/MP:
Offers the most segregation and ensure email identities/domains are only usable by one tenant/account.
You would need to anticipate the total daily sending quota and sending rate for all tenants in your AWS account and raise the service limits accordingly. Therefore, more planning will be involved to estimate the correct service limit threshold.
MA/MP:
You can raise service limits per individual tenant’s needs since each tenant will be on a separate AWS account.
It is best practice to have business process in place for individual tenant to notify of their email sending quota request in advance so that it can be raised accordingly for their AWS account.
Origination Identity procurement: When opting for MA/MP setup, remember that OIDs (phone numbers) are bound to AWS accounts.
Since OIDs do not carry across account, you will need to repeat the procurement process for every new AWS account.Number Pooling: This feature groups phone numbers or sender IDs. It’s particularly useful in a Single Project model to segment communications per tenant.
Configuration Sets: With the release of the V2 SMS and Voice API, you can now use configuration sets to manage your SMS opt-out lists, OIDs and event streaming destinations for a multi-tenant environment.
Take note that if you do not specify an OID in your API call, Amazon Pinpoint will attempt to use the most suitable (in terms of throughput and deliverability) OID to send your SMS. This
Similar to email, you can leverage number pooling and configuration sets to segregate SMS sending activity within a single account. This helps protect’s your SMS OID reputation because it can be costly and time-consuming to request new OIDs.
MA/MP:
Offers the most segregation and ensure numbers are only usable by one tenant/account.
SMS Opt Outs: Similar to the email channel’s suppression list, opt-outs are managed per account and configuration sets. Therefore, in a MA/MP setup, a customer that has opted out from communication in one account can still receive communications from other accounts.
Push Notifications
Amazon Pinpoint integrates with various push services like FCM, APNS, Baidu Cloud Push, and ADM.
Project-level Authentication: Authentication information is set at the Pinpoint Project level, requiring separate management.
Therefore, you will not be able to use the SA/SP architecture for multiple tenants using different applications.
Custom channels in Amazon Pinpoint allow you to send messages through any service that has an API, including third-party services. You can interact with APIs by using a webhook, or by calling an AWS Lambda function.If you are using custom channels extensively from Amazon Pinpoint, you’ll need to be aware of service limits in AWS Lambda, , especially if you’re considering SA/SP or SA/MP architectures.
Conclusion
In this blog, we’ve untangled the intricacies of implementing multi-tenancy in Amazon Pinpoint. Our deep dive covered three architectural patterns:
Single Account/Single Project (SA/SP): A beginner-friendly approach offering simple management but requiring meticulous permissions handling to segregate sending activity between different tenants.
Single Account/Multiple Projects (SA/MP): Offers granular control over customer data with slight increased in management complexity. However, this approach faces soft quotas and potential ‘Noisy Neighbor’ issues.
Multiple Accounts/Multiple Projects (MA/MP): Provides the most flexibility and isolation, albeit with increased management complexity.
Each approach comes with its own set of trade-offs related to ease of management/reporting, scalability, and control over customer data. Our discussion didn’t stop at architecture; we also examined how your multi-tenancy decisions will affect your channel configurations in Amazon Pinpoint. From email and SMS to push notifications, the architectural choices you make will have a direct impact on how efficiently you can manage these distribution channels. Armed with this information, you’re now better equipped to make informed decisions that align with your business objectives.
Call to Action
Your next step? Implement and architect your Amazon Pinpoint environment. Use the best practices and architectural guidelines outlined in this blog post as your north star. Going forward, the architectural blueprint you choose should be tailored to your specific needs—be it user count, company size, or distribution channels. Take into account not just the initial setup but also the long-term management aspects, including the respective service limits and quotas.
Tristan (Tri) Nguyen is an Amazon Pinpoint and Amazon Simple Email Service Specialist Solutions Architect at AWS. At work, he specializes in technical implementation of communications services in enterprise systems and architecture/solutions design. In his spare time, he enjoys chess, rock climbing, hiking and triathlon.
Tatsuya Nakamura
Nakamura Tatsuya is a Solutions Architect in charge of enterprise companies at AWS. He is mainly in charge of the trading company industry and the distribution/retail industry, also supporting the implementation of Amazon Pinpoint for Japanese customers. His career so far includes ERP implementation support and multiple new web service launches.
Amazon SES: Email Authentication and Getting Value out of Your DMARC Policy
Introduction
For enterprises of all sizes, email is a critical piece of infrastructure that supports large volumes of communication. To enhance the security and trustworthiness of email communication, many organizations turn to email sending providers (ESPs) like Amazon Simple Email Service (Amazon SES). These ESPs allow users to send authenticated emails from their domains, employing industry-standard protocols such as the Sender Policy Framework (SPF) and DomainKeys Identified Mail (DKIM). Messages authenticated with SPF or DKIM will successfully pass your domain’s Domain-based Message Authentication, Reporting, and Conformance (DMARC) policy. This blog post will focus on the DMARC policy enforcement mechanism. The blog will explore some of the reasons why email may fail DMARC policy evaluation and propose solutions to fix any failures that you identify. For an introduction to DMARC and how to carefully choose your email sending domain identity, you can refer to Choosing the Right Domain for Optimal Deliverability with Amazon SES The relationship between DMARC compliance and email deliverability rates is crucial for organizations aiming to maintain a positive sender reputation and ensure successful email delivery. There are many advantages when organizations have this correctly setup, these include:
Improved Email Deliverability
Reduction in Email Spoofing and Phishing
Positive Sender Reputation
Reduced Risk of Email Marked as Spam
Better Email Engagement Metrics
Enhanced Brand Reputation
With this foundation, let’s explore the intricacies of DMARC and how it can benefit your organization’s email communication.
What is DMARC?
DMARC is a mechanism for domain owners to advertise SPF and DKIM protection and to tell receivers how to act if those authentication methods fail. The domain’s DMARC policy protects your domain from third parties attempting to spoof the domain in the “From” header of emails. Malicious email messages that aim to send phishing attempts using your domain will be subject to DMARC policy evaluation, which may result in their quarantine or rejection by the email receiving organization. This stringent policy ensures that emails received by email recipients are genuinely from the claimed sending domain, thereby minimizing the risk of people falling victim to email-based scams. Domain owners publish DMARC policies as a TXT record in the domain’s _dmarc.<domain> DNS record. For example, if the domain used in the “From” header is example.com, then the domain’s DMARC policy would be located in a DNS TXT record named _dmarc.example.com. The DMARC policy can have one of three policy modes:
A typical DMARC deployment of an existing domain will start with publishing "p=none". A none policy means that the domain owner is in a monitoring phase; the domain owner is monitoring for messages that aren’t authenticated with SPF and DKIM and seeks to ensure all email is properly authenticated
When the domain owner is comfortable that all legitimate use cases are properly authenticated with SPF and/or DKIM, they may change the DMARC policy to "p=quarantine". A quarantine policy means that messages which fail to produce a domain-aligned authenticated identifier via SPF or DKIM will be quarantined by the mail receiving organization. The mail receiving organization may filter these messages into Junk folders, or take another action that they feel best protects their recipients.
Finally, domain owners who are confident that all of the legitimate messages using their domain are authenticated with SPF or DKIM, may change the DMARC policy to "p=reject". A reject policy means that messages which fail to produce a domain-aligned authenticated identifier via SPF or DKIM will be rejected by the mail receiving organization.
The following are examples of a TXT record that contains a DMARC policy, depending on the desired policy (the ‘p’ tag):
This policy tells email providers to apply the DMARC policy to messages that fail to produce a DKIM or SPF authenticated identifier that is aligned to the domain in the “From” header. Alignment means that one or both of the following occurs:
The messages pass the SPF policy for the MAIL FROM domain and the MAIL FROM domain is the same as the domain in the “From” header, or a subdomain. Reference Using a custom MAIL FROM domain to learn more about how to send SPF aligned messages with SES.
The messages have a DKIM signature signed by a public key in DNS at a location within the domain of the “From” header. Reference Authenticating Email with DKIM in Amazon SES to learn more about how to send DKIM aligned messages with SES.
DMARC reporting
The rua tag in the domain’s DMARC policy indicates the location to which mail receiving organizations should send aggregate reports about messages that pass or fail SPF and DKIM alignment. Domain owners analyze these reports to discover messages which are using the domain in the “From” header but are not properly authenticated with SPF or DKIM. The domain owner will attempt to ensure that all legitimate messages are authenticated through analysis of the DMARC aggregate reports over time. Mail receiving organizations which support sending DMARC reports typically send these aggregated reports once per day, although these practices differ from provider to provider.
What does a typical DMARC deployment look like?
A DMARC deployment is the process of:
Ensuring that all emails using the domain in the “From” header are authenticated with DKIM and SPF domain-aligned identifiers. Focus on DKIM as the primary means of authentication.
Publishing a DMARC policy (none, quarantine, or reject) for the domain that reflects how the domain owner would like mail receiving organizations to handle unauthenticated email claiming to be from their domain.
New domains and subdomains
Deploying a DMARC policy is easy for organizations that have created a new domain or subdomain for the purpose of a new email sending use case on SES; for example email marketing, transaction emails, or one-time pass codes (OTP). These domains can start with the "p=reject" DMARC enforcement policy because the policy will not affect existing email sending programs. This strict enforcement is to ensure that there is no unauthenticated use of the domain and its subdomains.
Existing domains
For existing domains, a DMARC deployment is an iterative process because the domain may have a history of email sending by one or multiple email sending programs. It is important to gain a complete understanding of how the domain and its subdomains are being used for email sending before publishing a restrictive DMARC policy (p=quarantine or p=reject) because doing so would affect any unauthenticated email sending programs using the domain in the “From” header of messages. To get started with the DMARC implementation, these are a few actions to take:
Publish a p=none DMARC policy (sometimes referred to as monitoring mode), and set the rua tag to the location in which you would like to receive aggregate reports.
Analyze the aggregate reports. Mail receiving organizations will send reports which contain information to determine if the domain, and its subdomains, are being used for sending email, and how the messages are (or are not) being authenticated with a DKIM or SPF domain-aligned identifier. An easy to use analysis tool is the Dmarcian XML to Human Converter.
Avoid prematurely publishing a “p=quarantine” or “p=reject” policy. Doing so may result in blocked or reduced delivery of legitimate messages of existing email sending programs.
The image below illustrates how DMARC will be applied to an email received by the email receiving server and actions taken based on the enforcement policy:
Figure 1 – DMARC Flow
How do SPF and DKIM cause DMARC policies to pass
When you start sending emails using Amazon SES, messages that you send through Amazon SES automatically use a subdomain of amazonses.com as the default MAIL FROM domain. SPF evaluators will see that these messages pass the SPF policy evaluation because the default MAIL FROM domain has a SPF policy which includes the IP addresses of the SES infrastructure that sent the message. SPF authentication will result in an “SPF=PASS” and the authenticated identifier is the domain of the MAIL FROM address. The published SPF record applies to every message that is sent using SES regardless of whether you are using a shared or dedicated IP address. The amazonses.com SPF record lists all shared and dedicated IP addresses, so it is inclusive of all potential IP addresses that may be involved with sending email as the MAIL FROM domain. You can use ‘dig’ to look up the IP addresses that SES will use to send email:
It is best practice for customers to configure a custom MAIL FROM domain, and not use the default amazonses.com MAIL FROM domain. The custom MAIL FROM domain will always be a subdomain of the customer’s verified domain identity. Once you configure the MAIL FROM domain, messages sent using SES will continue to result in an “SPF=PASS” as it does with the default MAIL FROM domain. Additionally, DMARC authentication will result in “DMARC=PASS” because the MAIL FROM domain and the domain in the “From” header are in alignment. It’s important to understand that customers must use a custom MAIL FROM domain if they want “SPF=PASS” to result in a “DMARC=PASS”.
For example, an Amazon SES-verified example.com domain will have the custom MAIL FROM domain “bounce.example.com”. The configured SPF record will be:
Note: The chosen MAIL FROM domain could be any sub-domain of your choice. If you have the same domain identity configured in multiple regions, then you should create region-specific custom MAIL FROM domains for each region. e.g. bounce-us-east-1.example.com and bounce-eu-west-2.example.com so that asynchronously bounced messages are delivered directly to the region from which the messages were sent.
DKIM results in DMARC pass
For customers that establish Amazon SES Domain verification using DKIM signatures, DKIM authentication will result in a DKIM=PASS, and DMARC authentication will result in “DMARC=PASS” because the domain that publishes the DKIM signature is aligned to the domain in the “From” header (the SES domain identity).
DKIM and SPF together
Email messages are fully authenticated when the messages pass both DKIM and SPF, and both DKIM and SPF authenticated identifiers are domain-aligned. If only DKIM is domain-aligned, then the messages will still pass the DMARC policy, even if the SPF “pass” is unaligned. Mail receivers will consider the full context of SPF and DKIM when determining how they will handle the disposition of the messages you send, so it is best to fully authenticate your messages whenever possible. Amazon SES has taken care of the heavy lifting of the email authentication process away from our customers, and so, establishing SPF, DKIM and DMARC authentication has been reduced to a few clicks which allows SES customers to get started easily and scale fast.
Why is DMARC failing?
There are scenarios when you may notice that messages fail DMARC, whether your messages are fully authenticated, or partially authenticated. The following are things that you should look out for:
Email Content Modification
Sometimes email content is modified during the delivery to the recipients’ mail servers. This modification could be as a result of a security device or anti-spam agent along the delivery path (for example: the message Subject may be modified with an “[EXTERNAL]” warning to recipients). The modified message invalidates the DKIM signature which causes a DKIM failure. Remember, the purpose of DKIM is to ensure that the content of an email has not been tampered with during the delivery process. If this happens, the DKIM authentication will fail with an authentication error similar to “DKIM-signature body hash not verified“.
Solutions:
If you control the full path that the email message will traverse from sender to recipient, ensure that no intermediary mail servers modify the email content in transit.
Ensure that you configure a custom MAIL FROM domain so that the messages have a domain-aligned SPF identifier.
Keep the DMARC policy in monitoring mode (p=none) until these issues are identified/solved.
Email Forwarding
Email Forwarding There are multiple scenarios in which a message may be forwarded, and they may result in both/either SPF and DKIM failing to produce a domain-aligned authenticated identifier. For SPF, it means that the forwarding mail server is not listed in the MAIL FROM domain’s SPF policy. It is best practice for a forwarding mail server to avoid SPF failures and assume responsibility of mail handling for the messages it forwards by rewriting the MAIL FROM address to be in the domain controlled by the forwarding server. Forwarding servers that do not rewrite the MAIL FROM address pose a risk of impersonation attacks and phishing. Do not add the IP addresses of forwarding servers to your MAIL FROM domain’s SPF policy unless you are in complete control of all sources of mail being forwarded through this infrastructure. For DKIM, it means that the messages are being modified in some way that causes DKIM signature validation failure (see Email Content Modification section above). A responsible forwarding server will rewrite the MAIL FROM domain so that the messages pass SPF with a non-aligned authenticated identifier. These servers will attempt to forward the message without alteration in order to preserve DKIM signatures, but that is sometimes challenging to do in practice. In this scenario, since the messages carry no domain-aligned authenticated identifier, the messages will fail the DMARC policy.
Solution:
Email forwarding is an expected type of failure of which you will see in the DMARC aggregate reports. The domain owner must weigh the risk of causing forwarded messages to be rejected against the risk of not publishing a reject DMARC policy. Reference 8.6. Interoperability Considerations. Forwarding servers that wish to forward messages that they know will result in a DMARC failure will commonly rewrite the “From” header address of messages it forwards so that the messages pass a DMARC policy for a domain that the forwarding server is responsible for. The way to identify forwarding servers that rewrite the “From” header in this situation is to publish “p=quarantine pct=0 t=y” in your domain’s DMARC policy before publishing “p=reject”.
Multiple email sending providers are sending using the same domain
Multiple email sending providers: There are situations where an organization will have multiple business units sending email using the same domain, and these business units may be using an email sending provider other than SES. If neither SPF nor DKIM is configured with domain-alignment for these email sending providers, you will see DMARC failures in the DMARC aggregate report.
Solution:
Analyze the DMARC aggregate reports to identify other email sending providers, track down the business units responsible for each email sending program, and follow the instructions offered by the email sending provider about how to configure SPF and DKIM to produce a domain-aligned authenticated identifier.
What does a DMARC aggregate report look like?
The following XML example shows the general format of a DMARC aggregate report that you will receive from participating email service providers.
How to address DMARC deployment for domains confirmed to be unused for email (dangling or otherwise)
Deploying DMARC for unused or dangling domains is a proactive step to prevent abuse or unauthorized use of your domain. Once you have confirmed that all subdomains being used for sending email have the desired DMARC policies, you can publish a ‘p=reject’ tag on the organizational domain, which will prevent unauthorized usage of unused subdomains without the need to publish DMARC policies for every conceivable subdomain. For more advanced subdomain policy scenarios, read the “tree walk” definitions in https://datatracker.ietf.org/doc/draft-ietf-dmarc-dmarcbis/
Conclusion:
In conclusion, DMARC is not only a technology but also a commitment to email security, integrity, and trust. By embracing DMARC best practices, organizations can protect their users, maintain a positive brand reputation, and ensure seamless email deliverability. Every message from SES passes SPF and DKIM for “amazonses.com”, but the authenticated identifiers are not always in alignment with the domain in the “From” header which carries the DMARC policy. If email authentication is not fully configured, your messages are susceptible to delivery issues like spam filtering, or being rejected or blocked by the recipient ESP. As a best practice, you can configure both DKIM and SPF to attain optimum deliverability while sending email with SES.
About the Authors
Bruno Giorgini is a Senior Solutions Architect specializing in Pinpoint and SES. With over two decades of experience in the IT industry, Bruno has been dedicated to assisting customers of all sizes in achieving their objectives. When he is not crafting innovative solutions for clients, Bruno enjoys spending quality time with his wife and son, exploring the scenic hiking trails around the SF Bay Area.
Jesse Thompson is an Email Deliverability Manager with the Amazon Simple Email Service team. His background is in enterprise IT development and operations, with a focus on email abuse mitigation and encouragement of authenticity practices with open standard protocols. Jesse’s favorite activity outside of technology is recreational curling.
Sesan Komaiya is a Solutions Architect at Amazon Web Services. He works with a variety of customers, helping them with cloud adoption, cost optimization and emerging technologies. Sesan has over 15 year’s experience in Enterprise IT and has been at AWS for 5 years. In his free time, Sesan enjoys watching various sporting activities like Soccer, Tennis and Moto sport. He has 2 kids that also keeps him busy at home.
Mudassar Bashir is a Solutions Architect at Amazon Web Services. He has over ten years of experience in enterprise software engineering. His interests include web applications, containerization, and serverless technologies. He works with different customers, helping them with cloud adoption strategies.
Priya Singh is a Cloud Support Engineer at AWS and subject matter expert in Amazon Simple Email Service. She has a 6 years of diverse experience in supporting enterprise customers across different industries. Along with Amazon SES, she is a Cloudfront enthusiast. She loves helping customers in solving issues related to Cloudfront and SES in their environment.
As you may have seen in Jeff Barr’s blog post or in an announcement, Amazon Simple Email Service (Amazon SES) now provides bounce and complaint notifications via Amazon Simple Notification Service (Amazon SNS). You can refer to the Amazon SES Developer Guide or Jeff’s post to learn how to set up this feature. In this post, we will show you how you might manage your email list using the information you get in the Amazon SNS notifications.
Background
Amazon SES assigns a unique message ID to each email that you successfully submit to send. When Amazon SES receives a bounce or complaint message from an ISP, we forward the feedback message to you. The format of bounce and complaint messages varies between ISPs, but Amazon SES interprets these messages and, if you choose to set up Amazon SNS topics for them, categorizes them into JSON objects.
Scenario
Let’s assume you use Amazon SES to send monthly product announcements to a list of email addresses. You store the list in a database and send one email per recipient through Amazon SES. You review bounces and complaints once each day, manually interpret the bounce messages in the incoming email, and update the list. You would like to automate this process using Amazon SNS notifications with a scheduled task.
Solution
To implement this solution, we will use separate Amazon SNS topics for bounces and complaints to isolate the notification channels from each other and manage them separately. Also, since the bounce and complaint handler will not run 24/7, we need these notifications to persist until the application processes them. Amazon SNS integrates with Amazon Simple Queue Service (Amazon SQS), which is a durable messaging technology that allows us to persist these notifications. We will configure each Amazon SNS topic to publish to separate SQS queues. When our application runs, it will process queued notifications and update the email list. We have provided sample C# code below.
Configuration
Set up the following AWS components to handle bounce notifications:
Create an Amazon SQS queue named ses-bounces-queue.
Create an Amazon SNS topic named ses-bounces-topic.
Configure the Amazon SNS topic to publish to the SQS queue.
Configure Amazon SES to publish bounce notifications using ses-bounces-topic to ses-bounces-queue.
Set up the following AWS components to handle complaint notifications:
Create an Amazon SQS queue named ses-complaints-queue.
Create an Amazon SNS topic named ses-complaints-topic.
Configure the Amazon SNS topic to publish to the SQS queue.
Configure Amazon SES to publish complaint notifications using ses-complaints-topic to ses-complaints-queue.
Ensure that IAM policies are in place so that Amazon SNS has access to publish to the appropriate SQS queues.
Bounce Processing
Amazon SES will categorize your hard bounces into two types: permanent and transient. A permanent bounce indicates that you should never send to that recipient again. A transient bounce indicates that the recipient’s ISP is not accepting messages for that particular recipient at that time and you can retry delivery in the future. The amount of time you should wait before resending to the address that generated the transient bounce depends on the transient bounce type. Certain transient bounces require manual intervention before the message can be delivered (e.g., message too large or content error). If the bounce type is undetermined, you should manually review the bounce and act accordingly.
You will need to define some classes to simplify bounce notification parsing from JSON into .NET objects. We will use the open-source JSON.NET library.
/// <summary>Represents the bounce or complaint notification stored in Amazon SQS.</summary>classAmazonSqsNotification
{
publicstring Type { get;set; }
publicstring Message { get;set; }
}
/// <summary>Represents an Amazon SES bounce notification.</summary>classAmazonSesBounceNotification
{
publicstring NotificationType { get;set; }
publicAmazonSesBounce Bounce { get;set; }
}
/// <summary>Represents meta data for the bounce notification from Amazon SES.</summary>classAmazonSesBounce
{
publicstring BounceType { get;set; }
publicstring BounceSubType { get;set; }
publicDateTime Timestamp { get;set; }
publicList<AmazonSesBouncedRecipient> BouncedRecipients { get;set; }
}
/// <summary>Represents the email address of recipients that bounced
/// when sending from Amazon SES.</summary>classAmazonSesBouncedRecipient
{
publicstring EmailAddress { get;set; }
}
Sample code to handle bounces:
/// <summary>Process bounces received from Amazon SES via Amazon SQS.</summary>/// <param name="response">The response from the Amazon SQS bounces queue /// to a ReceiveMessage request. This object contains the Amazon SES /// bounce notification.</param> private static void ProcessQueuedBounce(ReceiveMessageResponse response)
{
int messages = response.ReceiveMessageResult.Message.Count;
if (messages > 0)
{
foreach (var m in response.ReceiveMessageResult.Message)
{
// First, convert the Amazon SNS message into a JSON object.var notification = Newtonsoft.Json.JsonConvert.DeserializeObject<AmazonSqsNotification>(m.Body);
// Now access the Amazon SES bounce notification.var bounce = Newtonsoft.Json.JsonConvert.DeserializeObject<AmazonSesBounceNotification>(notification.Message);
switch (bounce.Bounce.BounceType)
{
case"Transient":
// Per our sample organizational policy, we will remove all recipients
// that generate an AttachmentRejected bounce from our mailing list.
// Other bounces will be reviewed manually.switch (bounce.Bounce.BounceSubType)
{
case"AttachmentRejected":
foreach (var recipient in bounce.Bounce.BouncedRecipients)
{
RemoveFromMailingList(recipient.EmailAddress);
}
break;
default:
ManuallyReviewBounce(bounce);
break;
}
break;
default:
// Remove all recipients that generated a permanent bounce
// or an unknown bounce.foreach (var recipient in bounce.Bounce.BouncedRecipients)
{
RemoveFromMailingList(recipient.EmailAddress);
}
break;
}
}
}
}
Complaint Processing
A complaint indicates the recipient does not want the email that you sent them. When we receive a complaint, we want to remove the recipient addresses from our list. Again, define some objects to simplify parsing complaint notifications from JSON to .NET objects.
/// <summary>Represents an Amazon SES complaint notification.</summary>classAmazonSesComplaintNotification
{
publicstring NotificationType { get;set; }
publicAmazonSesComplaint Complaint { get;set; }
}
/// <summary>Represents the email address of individual recipients that complained
/// to Amazon SES.</summary>classAmazonSesComplainedRecipient
{
publicstring EmailAddress { get;set; }
}
/// <summary>Represents meta data for the complaint notification from Amazon SES.</summary>classAmazonSesComplaint
{
publicList<AmazonSesComplainedRecipient> ComplainedRecipients { get;set; }
publicDateTime Timestamp { get;set; }
publicstring MessageId { get;set; }
}
Sample code to handle complaints is:
/// <summary>Process complaints received from Amazon SES via Amazon SQS.</summary>/// <param name="response">The response from the Amazon SQS complaint queue /// to a ReceiveMessage request. This object contains the Amazon SES /// complaint notification.</param>private static void ProcessQueuedComplaint(ReceiveMessageResponse response)
{
int messages = response.ReceiveMessageResult.Message.Count;
if (messages > 0)
{
foreach (var
message in response.ReceiveMessageResult.Message)
{
// First, convert the Amazon SNS message into a JSON object.var notification = Newtonsoft.Json.JsonConvert.DeserializeObject<AmazonSqsNotification>(message.Body);
// Now access the Amazon SES complaint notification.var complaint = Newtonsoft.Json.JsonConvert.DeserializeObject<AmazonSesComplaintNotification>(notification.Message);
foreach (var recipient in complaint.Complaint.ComplainedRecipients)
{
// Remove the email address that complained from our mailing list.
RemoveFromMailingList(recipient.EmailAddress);
}
}
}
}
Final Thoughts
We hope that you now have the basic information on how to use bounce and complaint notifications. For more information, please review our API reference and Developer Guide; it describes all actions, error codes and restrictions that apply to Amazon SES.
If you have comments or feedback about this feature, please post them on the Amazon SES forums. We actively monitor the forum and frequently engage with customers. Happy sending with Amazon SES!
How to secure your email account and improve email sender reputation
Introduction
Amazon Simple Email Service (Amazon SES) is a cost-effective, flexible, and scalable email service that enables customers to send email from within any application. You can send email using the SES SMTP interface or via HTTP requests to the SES API. All requests to send email must be authenticated using either SMTP or IAM credentials and it is when these credentials end up in the hands of a malicious actor, that customers need to act fast to secure their SES account.
Compromised credentials with permission to send email via SES allows the malicious actor to use SES to send spam and or phishing emails, which can lead to high bounce and or complaint rates for the SES account. A consequence of high bounce and or complaint rates can result in sending for the SES account being paused.
How to identify if your SES email sending account is compromised
Start by checking the reputation metrics for the SES account from the Reputation metrics menu in the SES Console. A sudden increase or spike in the bounce or complaint metrics should be further investigated. You can start by checking the Feedback forwarding destination, where SES will send bounce and or complaints to. Feedback on bounces and complaints will contain the From, To email addresses as well as the subject. Use these attributes to determine if unintended emails are being sent, for example if the bounce and / or complaint recipients are not known to you that is an indication of compromise. To find out what your feedback forwarding destination is, please see Feedback forwarding mechanism
If SNS notifications are already enabled, check the subscribed endpoint for the bounce and / or complaint notifications to review the notifications for unintended email sending. SNS notifications would provide additional information, such as IAM identity being used to send the emails as well as the source IP address the emails are being sent from.
If the review of the bounces or complaints leads to the conclusion that the email sending is unintended, immediately follow the steps below to secure your account.
Steps to secure your account:
You can follow the below steps in order to secure your SES account:
It is recommended that to avoid any more unintended emails from being sent, to immediately pause the SES account until the root cause has been identified and steps taken to secure the SES account. You can use the below command to pause the email sending for your account:
aws ses update-account-sending-enabled --no-enabled --region sending_region
Note: Change the sending_region with the region you are using to send email.
Rotate the credentials for the IAM identity being used to send the unintended emails. If the IAM identity was originally created from the SES Console as SMTP credentials, it is recommended to delete the IAM identity and create new SMTP credentials from the SES Console.
Limit the scope of SMTP/IAM identity to send email only from the specific IP address your email sending originates from.
When you send an email from IP address apart from the IP mentioned in the policy, then the following error will be observed and the email sending request will fail:
———-
554 Access denied: User arn:aws:iam::123456789012:user/iam-user-name’ is not authorized to perform ses:SendRawEmail’ on resource `arn:aws:ses:eu-west-1:123456789012:identity/example.com’
———-
4. Once these steps have been taken, the sending for the account can be enabled again, using the command below:
aws ses update-account-sending-enabled --enabled --region sending_region
Conclusion
You can secure your SES email sending account by taking the necessary steps mentioned and also prevent this from happening in the future.
Business intelligence (BI) dashboards provide a graphical representation of metrics and key performance indicators (KPIs) to monitor the health of your business. By leveraging BI dashboards to analyze the performance of your customer communications, you gain valuable insights into how they are engaging with your messages and can make data-driven decisions to improve your marketing and communication strategies.
In this blog post we introduce a solution that automates the deployment of an Amazon QuickSight dashboard that enables marketers to analyze their long-term Amazon Pinpoint customer engagement data. These dashboards can be customized further depending the use case. This solution alleviates the need to create data pipelines for storage and analysis of Amazon Pinpoint’s engagement data, while offering a greater variety of widgets and views across email, SMS, campaigns, journeys and transactional messages when comparing to Amazon Pinpoint’s native dashboards.
Amazon Pinpoint is a flexible, scalable marketing communications service that connects you with customers over email, SMS, push notifications, or voice. The service offers ready to use dashboards to view key performance indicators (KPIs) for the various messaging channels, It provides 90 days of events for analysis. However, the raw events used to populate Amazon Pinpoint’s dashboards, can be streamed using Amazon Kinesis Data Firehose to a destination of your choice. This blog will walk you through leveraging this feature to create a data lake to store and analyze data beyond the initial 90 days.
Amazon QuickSight is a cloud-scale business intelligence (BI) service that you can use to deliver easy-to-understand insights in an interactive visual environment.
The Amazon QuickSight dashboards deployed through this solution are designed to serve several use cases. Here are just a few examples:
View email and SMS costs per Campaign and Journey.
Deep dive into engagement insights and performance. (eg: SMS events, Email events, Campaign events, Journey events).
Schedule reports to various business stakeholders.
Track individual email & SMS statuses to specific endpoints.
Analyze open and click rates based on the message send time.
These are some of the use cases you can use these dashboards for and with all the data points being available in Amazon QuickSight, you can create your own views and widgets based on your specific requirements.
Solution Overview
This solution builds upon the Digital User Engagement (DUE) Event Database AWS Solution. It creates a long-term Amazon Pinpoint event data lake. This solution also builds a QuickSight dashboard to visualize and analyze this data. It leverages several other AWS services to tie i all together. It uses AWS Lambda for processing AWS CloudTrail data, Amazon Athena to build views using SQL for Amazon QuickSight, AWS CloudTrail to record any new campaign, journey and segment updates and Amazon DynamoDB to store the campaign, journey and segment metadata. This solution can be segmented into three logical portions: 1) Pinpoint campaign/journey/segment lookup tables. 2) Amazon Athena Views. 3) Amazon QuickSight resources.
The AWS Cloud Development Kit (CDK) is used to deploy this solution to your account. AWS CDK is an open-source software development framework for defining cloud infrastructure as code with modern programming languages and deploying it through AWS CloudFormation.
Pinpoint campaign/journey/segment lookup tables
A CloudFormation AWS Lambda-backed custom resource function adds current Pinpoint campaign, journey and segment meta data to Amazon DynamoDB lookup tables. An AWS CloudFormation custom resource is managed by a Lambda function that runs only upon the deployment, update and deletion of the AWS CloudFormation stack.
AWS CloudTrail logs record API actions to an S3 bucket every 5 minutes.
When an AWS CloudTrail log is written to the S3 bucket an AWS Lambda function is invoked and checks for Amazon Pinpoint campaigns/journeys/segments management events such as create, update and delete.
For every Amazon Pinpoint action the AWS Lambda function finds, it queries Amazon Pinpoint to get the respective resource details.
The AWS Lambda function will create or update records in the Amazon DynamoDB table to reflect the changes.
This solution also deploys an Amazon Athena DynamoDB connector. Amazon Athena uses this to query the Amazon DynamoDB lookup tables to enrich the data in the Amazon Pinpoint event data lake.
The Amazon Athena to Amazon DynamoDB connector requires an Amazon S3 spill bucket for any data that exceeds the AWS Lambda function limits
Amazon Athena views
Amazon Athena views are crucial for querying and organizing the data. These views allow QuickSight to interact with the Pinpoint event data lake through standard SQL queries and views. Here’s how they’re set up:
The application creates several named queries (called saved queries in the Amazon Athena console). Each named query uses a SQL statement to create a database view containing a subset of the data from the Pinpoint event data lake (or joins data from a previous view with the Amazon DynamoDB tables created above. The views are also created using an AWS Lambda-backed custom resource.
Amazon QuickSight resources
This solution creates several Amazon QuickSight resources to support the deployed dashboard. These include data sources, datasets, refresh schedules, and an analysis. The refresh schedule determines the frequency that Amazon QuickSight queries the Amazon Athena views to update the datasets.
Amazon Athena retrieves live data from the DUE event database data lake and the Athena DynamoDB Connector whenever the Amazon QuickSight refresh schedule runs.
After you have deployed this solution, gather the following data from the stack’s Resources section.
DUES3DataLake: You will need the bucket name
PinpointProject: You will need the project Id
PinpointEventDatabase: This is the name of the Glue Database. You will only need this if you used something other than the default of due_eventdb
Note: If you are installing the DUE event database for the first time as part of these instructions, your dashboard will not have any data to show until new events start to come in from your Amazon Pinpoint project.
Once you have the DUE event database installed, you are ready to begin your deployment.
Implementation steps
Step 1 – Ensure that Amazon Athena is setup to store query results
Amazon Athena uses workgroups to separate users, teams, applications, or workloads, to set limits on amount of data each query or the entire workgroup can process, and to track costs. There is a default workgroup called “primary” However, before you can use this workgroup, it needs to be configured with an Amazon S3 bucket for storing the query results.
If you do not have an existing S3 bucket you can use for the output, create a new Amazon S3 bucket.
Navigate to the Amazon Athena console and from the menu select workgroups > primary > Edit > Query result configuration
Select the Amazon S3 bucket and any specific directory for the Athena query result location
Note: If you choose to use a workgroup other that the default “primary” workgroup. Please take note of the workgroup name to be used later.
Step 2 – Enable Amazon QuickSight
Amazon QuickSight offers two types of data sets: Direct Query data sets, which provides real-time access to data sources, and SPICE (Super-fast, Parallel, In-memory Calculation Engine) data sets, which are pre-aggregated and cached for faster performance and scalability that can be refreshed on a schedule.
This solution uses SPICE datasets set to incrementally refresh on a cycle of your choice (Daily or Hourly). If you have already setup Amazon QuickSight, please navigate to Amazon QuickSight in the AWS Console and skip to step 3.
Navigate to Amazon QuickSight on the AWS console
Setup Amazon QuickSight account by clicking the “Sign up for QuickSight” button.
You will need to setup an Enterprise account for this solution.
To complete the process for the Amazon QuickSight account setup follow the instructions at this link
Ensure you have the Admin Role
Choose the profile icon in the top right corner, select Manage QuickSight and click on Manage Users
Subscription details should display on the screen.
Ensure you have enough SPICE capacity for the datasets
Choose the profile icon, and then select Manage QuickSight
Click on SPICE Capacity
Make sure you enough SPICE for all three datasets
if you are still in the free tier, you should have enough for initial testing.
You will need about 2GB of capacity for every 1,000,000 Pinpoint events that will be ingested in to SPICE
Note: If you do not have enough SPICE capacity, deployment will fail
Please note the Amazon QuickSight username. You can find this by clicking profile icon. Example username: Admin/user-name
Step 3 – Collect the Amazon QuickSight Service Role name in IAM
For Amazon Athena, Amazon S3, and Athena Query Federation connections, Amazon QuickSight uses the following IAM “consumer” role by default: aws-quicksight-s3-consumers-role-v0
If the “consumer” role is not present, then QuickSight uses the following “service” role instead : aws-quicksight-service-role-v0.
The version number at the end of the role could be different in your account. Please validate your role name with the following steps.
Navigate to the Identity and Access Management (IAM) console
Go to Roles and search QuickSight
If the consumer role exists, please note its full name
If you only find the service role, please note its full name
Deploying this solution requires no previous experience with the AWS CDK toolkit. If you would like to familiarize yourself with CDK, the AWS CDK Workshop is a great place to start.
Setup your integrated development environment (IDE)
Option 1 (recommended for first time CDK users): Use AWS Cloud9 – a cloud-based IDE that lets you write, run, and debug your code with just a browser
Navigate to Cloud9 in the AWS console and click the Create Environment button
Provide a descriptive name to your environment (e.g. PinpointAnalysis)
Leave the rest of the values as their default values and click Create
Open the Cloud9 IDE
Node, TypeScript, and CDK should be come pre-installed. Test this by running the following commands in your terminal.
node --version
tsc --version
cdk --version
If dependencies are not installed, follow the Step 1 instructions from this article
Using AWS Cloud 9 will incur a nominal charge if you are no longer Free Tier eligible. However, using AWS Cloud9 will simply setup if you do not already have a local environment with AWS CDK and the AWS CLI installed
Install the required npm packages from package.json by running the commands below:
cd digital-user-engagement-events-dashboards
npm install
Open the file at digital-user-engagement-events-dashboards/bin/pinpoint-bi-analysis.ts for editing in your IDE.
Edit the following code block your your solution with the information you have gathered in the previous steps. Please reference Table 1 for a description of each editable field.
The prefix for all created Athena and QuickSight resources
pinpoint_analytics_
region
Where new resources will be deployed. This must be the same region that the DUE event database solution was deployed
us-east-1
dueDbBucketName
The name of the DUE event database S3 Bucket
due-database-xxxxxxxxxxus-east-1
qsUserName
The name of your QuickSight User
Admin/my-user
athenaWorkGroupName
The Athena workgroup that was previously configured
primary
dataLakeDbName
The Glue database created during the DUE event database solution. By default the database name is “due_eventdb”
due_eventdb
dateRangeNumberOfMonths
The number of months of data the Athena views will contain. QuickSight SPICE datasets will contain this many months of data initially and on full refresh. The QuickSight dataset will add new data incrementally without deleting historical data.
6
qsUserRegion
The region where your quicksight user exists. By default, new users will be created in us-east-1. You can check your user location with the AWS CLI: aws quicksight list-users --aws-account-id {accout-id} --namespace default and look for the region in the arn
us-east-1
qsDefaultServiceRole
The service role collected during Step 3.
aws-quicksight-service-role-v0
spiceRefreshInterval
Options Include HOURLY, DAILY – This is how often the SPICE 7-day incremental window will be refreshed
DAILY
Step 5 – Deploy
CDK requires you to bootstrap in each region of an account. This creates a S3 bucket for deployment. You only need to bootstrap once per account/region
cdk bootstrap
Deploy the application
cdk deploy
Step 6 – Explore
Once your solution deploys, look for the Outputs provided by the CDK CLI. You will find a link to your new Amazon Quicksight Analysis, or Dashboard, as well as a few other key resources. Also, explore the resources sections of the deployed stacks in AWS CloudFormation for a complete list of deployed resources. In the AWS CloudFormation, you should have two stacks. The main stack will be called PinpointAnalytics and a nested stack.
Pricing
The total cost to run this solution will depend on several factors. To help explore what the costs might look like for you, please look at the following examples.
All costs outlined below will assume the following:
1 Amazon QuickSight author
100 Amazon QuickSight analysis reader sessions
100k write API actions for all services in AWS account
A total of 1k Amazon Pinpoint campaigns, journeys, and segments resulting in 1k Amazon DynamoDB records
5 million monthly Amazon Pinpoint events – email send, email delivered, etc.
Base Costs:
1 Amazon QuickSight author – can edit all Amazon QuickSight resources
$24 – There is a a 30 day trial for 4 authors in the free tier
100 Amazon QuickSight analysis reader sessions OR 6 readers with unlimited access – max $5 per month per reader
$30
Total Monthly Costs: $54 / month
Variable Costs:
Even with the assumptions listed above, the costs will vary depending on the chosen data retention window as well as the the refresh schedule.
SPICE data storage costs.
Total size of storage will depend on how many months you choose to display in the dashboard
For the above assumptions, the SPICE datasets will cost roughly $3.25 for each month stored in the datasets.
Amazon Athena data volume costs
With Athena you are charged for the total number of bytes scanned in a query. The solution implements incremental data resfreshes in SPICE. Amazon QuickSight will only query and updates the most recent 7 days of data during each refresh cycle. This can be adjusted as needed.
Scenario 1 – 6-month data analysis with daily refresh:
Fixed costs: $57
SPICE datasets: $19.50
Athena Scans: $1.25
Total Costs: $77.75 / Month
Scenario 2 – 12-month data analysis with daily refresh:
Fixed costs: $57
SPICE datasets: $39
Athena Scans: $1.25
Total Costs: $97.25 / Month
Scenario 3 – 12-month data analysis with hourly refresh:
Fixed costs: $57
SPICE datasets: $39
Athena Scans: $27.50
Total Costs: $123.5 / Month
Note: Several services were not mentioned in the above scenarios (e.g., DynamoDB, Cloudtrail, Lambda, etc). The limited usage of these services resulted in a combined cost of less than a few US dollars per month. Even at a greater scale, the costs from these services will not increase in any significant way.
Clean up
Delete the CDK stack running the following from your command line
Go to Glue > Data Catalog > Databases > Your Database Name
This should delete all Athena views no longer needed. Views created will start with the resourcePrefix specified in the bin/athena-quicksight-cdk.ts file
Delete S3 buckets
DynamoDB cloud watch log bucket
Dynamo Athena Connector Spill bucket
Athena workgroup output bucket
Delete DynamoDB tables
This solution creates two DynamoDB lookup tables prefixed with the Stack name
Conclusion
In this blog, you have deployed a solution that visualizes Amazon Pinpoint’s email and SMS engagement data using Amazon QuickSight. This solution provides you with an Amazon QuickSight functional dashboard as well as a foundation to design and build new Amazon QuickSight dashboards that meet your bespoke requirements. Parts of the solution, such as the Amazon Athena views, can be ingested with other business intelligence tools that your business might already be using.
Next steps
This solution can be expanded to include Amazon Pinpoint engagement events from other channels such as push notifications, Amazon Connect outbound calls, in-app and custom events. This will require certain updates on the Amazon Athena views and consequently on the Amazon QuickSight dashboards. Furthermore, the Amazon DynamoDB tables store only campaign, journey and segment meta-data. You can extend this part of the solution to include message template meta-data, which will help to analyze performance per message template.
Considerations / Troubleshooting
Pinpoint Standard account can be upgraded to an Enterprise account. Enterprise accounts cannot be downgraded to a Standard account.
SPICE capacity is allocated separately for each AWS Region. Default SPICE capacity is automatically allocated to your home AWS Region. For each AWS account, SPICE capacity is shared by all the people using QuickSight in a single AWS Region. The other AWS Regions have no SPICE capacity unless you choose to purchase some.
The QuickSight Analysis Event rates are calculated on Pinpoint message_id and endpoint_id grain – click rate will be the same if a user clicks an email link one or more than one times
All timestamps are in UTC. To display data in another timezone edit event_timestamp_timezone calculated field in every dataset
Data inside Amazon QuickSight will refresh depending on the schedule set during deployment. Current options include hourly and daily refreshes.
AWS CloudTrail has 5 cloudtrail trails per AWS account.
About the Authors
Spencer Harrison
Spencer was a 2023 WWPS Solution Architect intern at Amazon Web Services. He will graduate with his Masters of Information Systems Management from Brigham Young University in the spring of 2024. After graduation he is aspiring to find opportunities as a solution architect, cloud engineer, or DevOps engineer. Outside of work, Spencer loves going outdoors to wake surf, downhill ski, and play pickle ball.
Daniel Wells
With over 20 years of IT experience, Daniel has held many architecture and director positions supporting a wide variety of technologies. He currently works as an AWS Solutions Architect supporting Education Technology companies striving to make a difference for learners and educators worldwide. Daniel’s interests outside of work include music, family, health, education and anything that allows him to express himself creatively.
Pavlos Ioannou Katidis
Pavlos Ioannou Katidis is an Amazon Pinpoint and Amazon Simple Email Service Senior Specialist Solutions Architect at AWS. He enjoys diving deep into customers’ technical issues and help in designing communication solutions. In his spare time, he enjoys playing tennis, watching crime TV series, playing FPS PC games, and coding personal projects.
The collective thoughts of the interwebz
Manage Consent
To provide the best experiences, we use technologies like cookies to store and/or access device information. Consenting to these technologies will allow us to process data such as browsing behavior or unique IDs on this site. Not consenting or withdrawing consent, may adversely affect certain features and functions.
Functional
Always active
The technical storage or access is strictly necessary for the legitimate purpose of enabling the use of a specific service explicitly requested by the subscriber or user, or for the sole purpose of carrying out the transmission of a communication over an electronic communications network.
Preferences
The technical storage or access is necessary for the legitimate purpose of storing preferences that are not requested by the subscriber or user.
Statistics
The technical storage or access that is used exclusively for statistical purposes.The technical storage or access that is used exclusively for anonymous statistical purposes. Without a subpoena, voluntary compliance on the part of your Internet Service Provider, or additional records from a third party, information stored or retrieved for this purpose alone cannot usually be used to identify you.
Marketing
The technical storage or access is required to create user profiles to send advertising, or to track the user on a website or across several websites for similar marketing purposes.


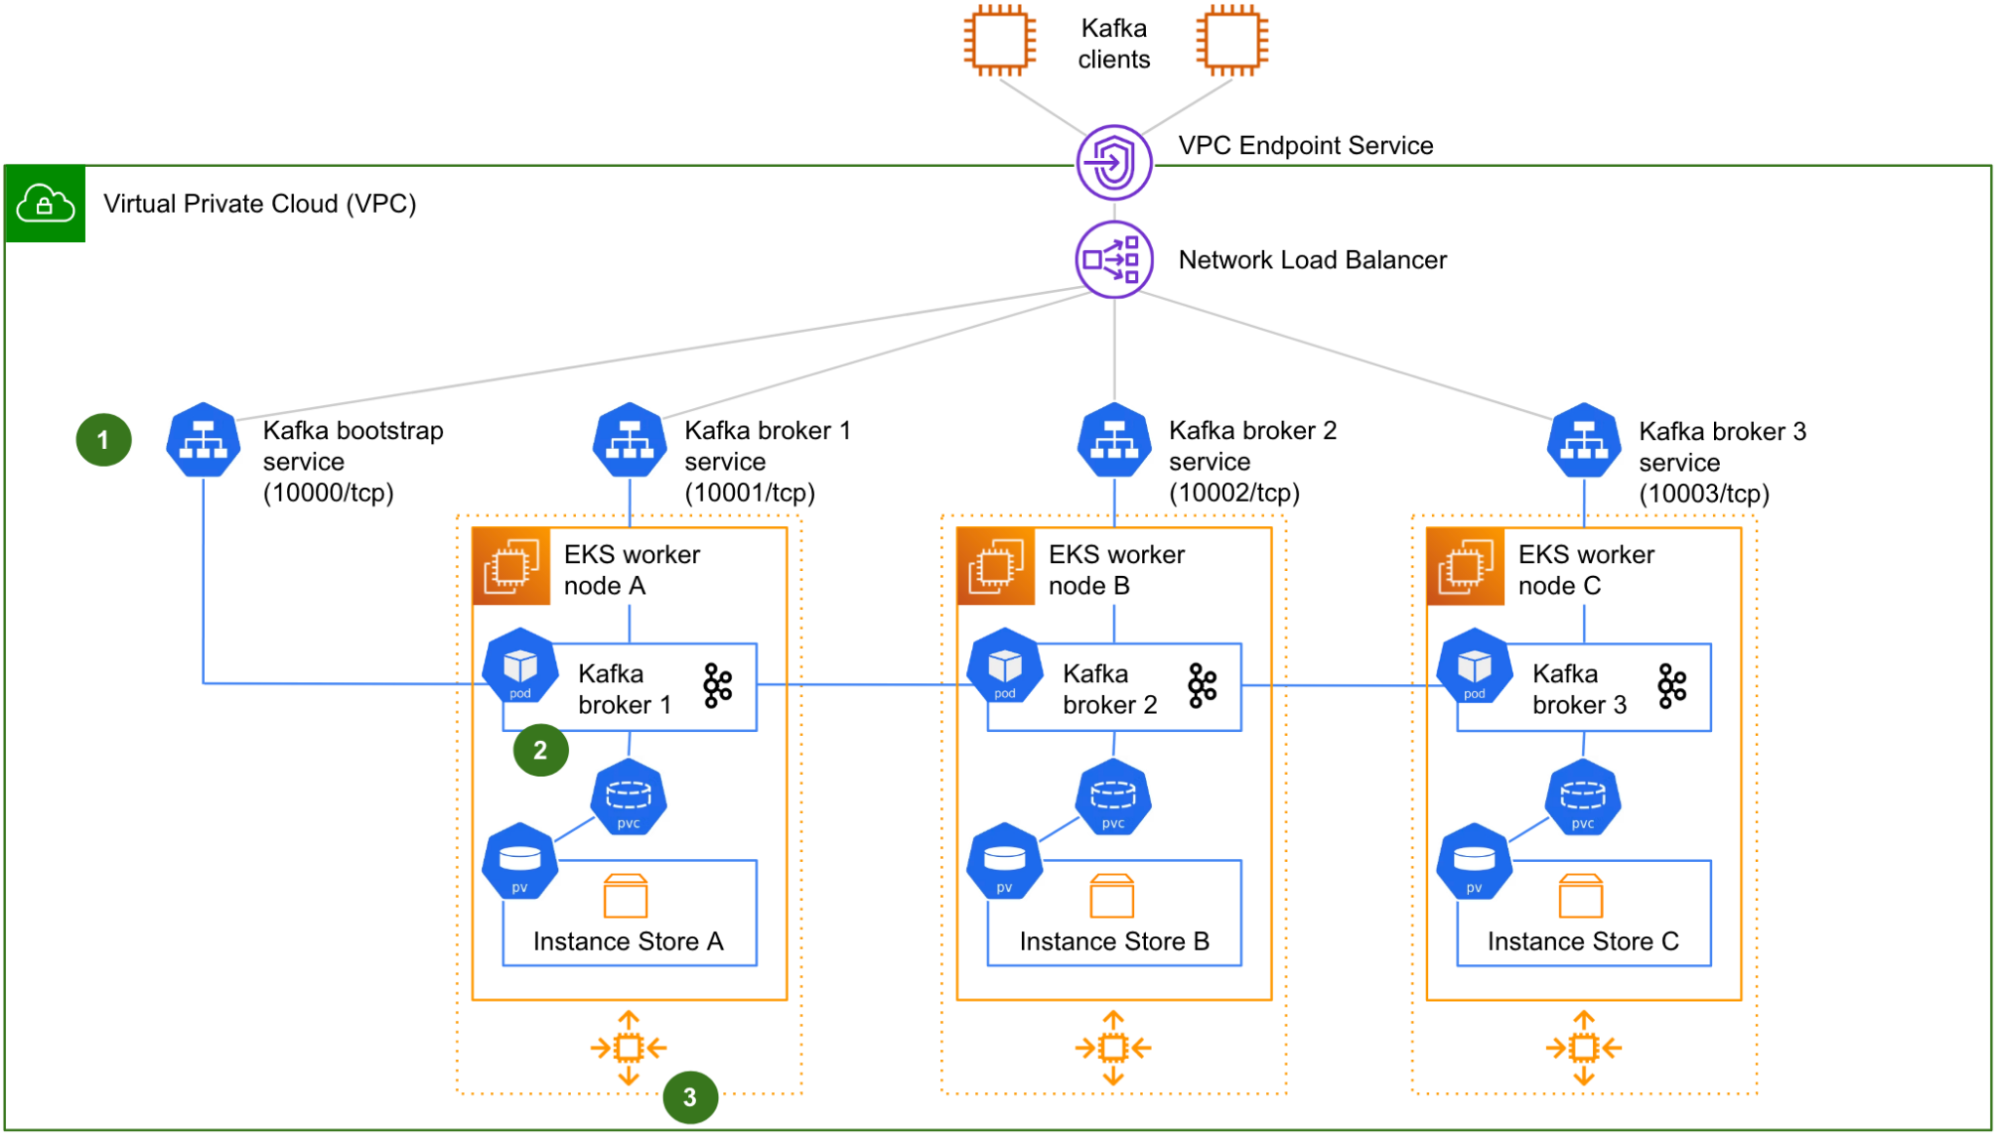
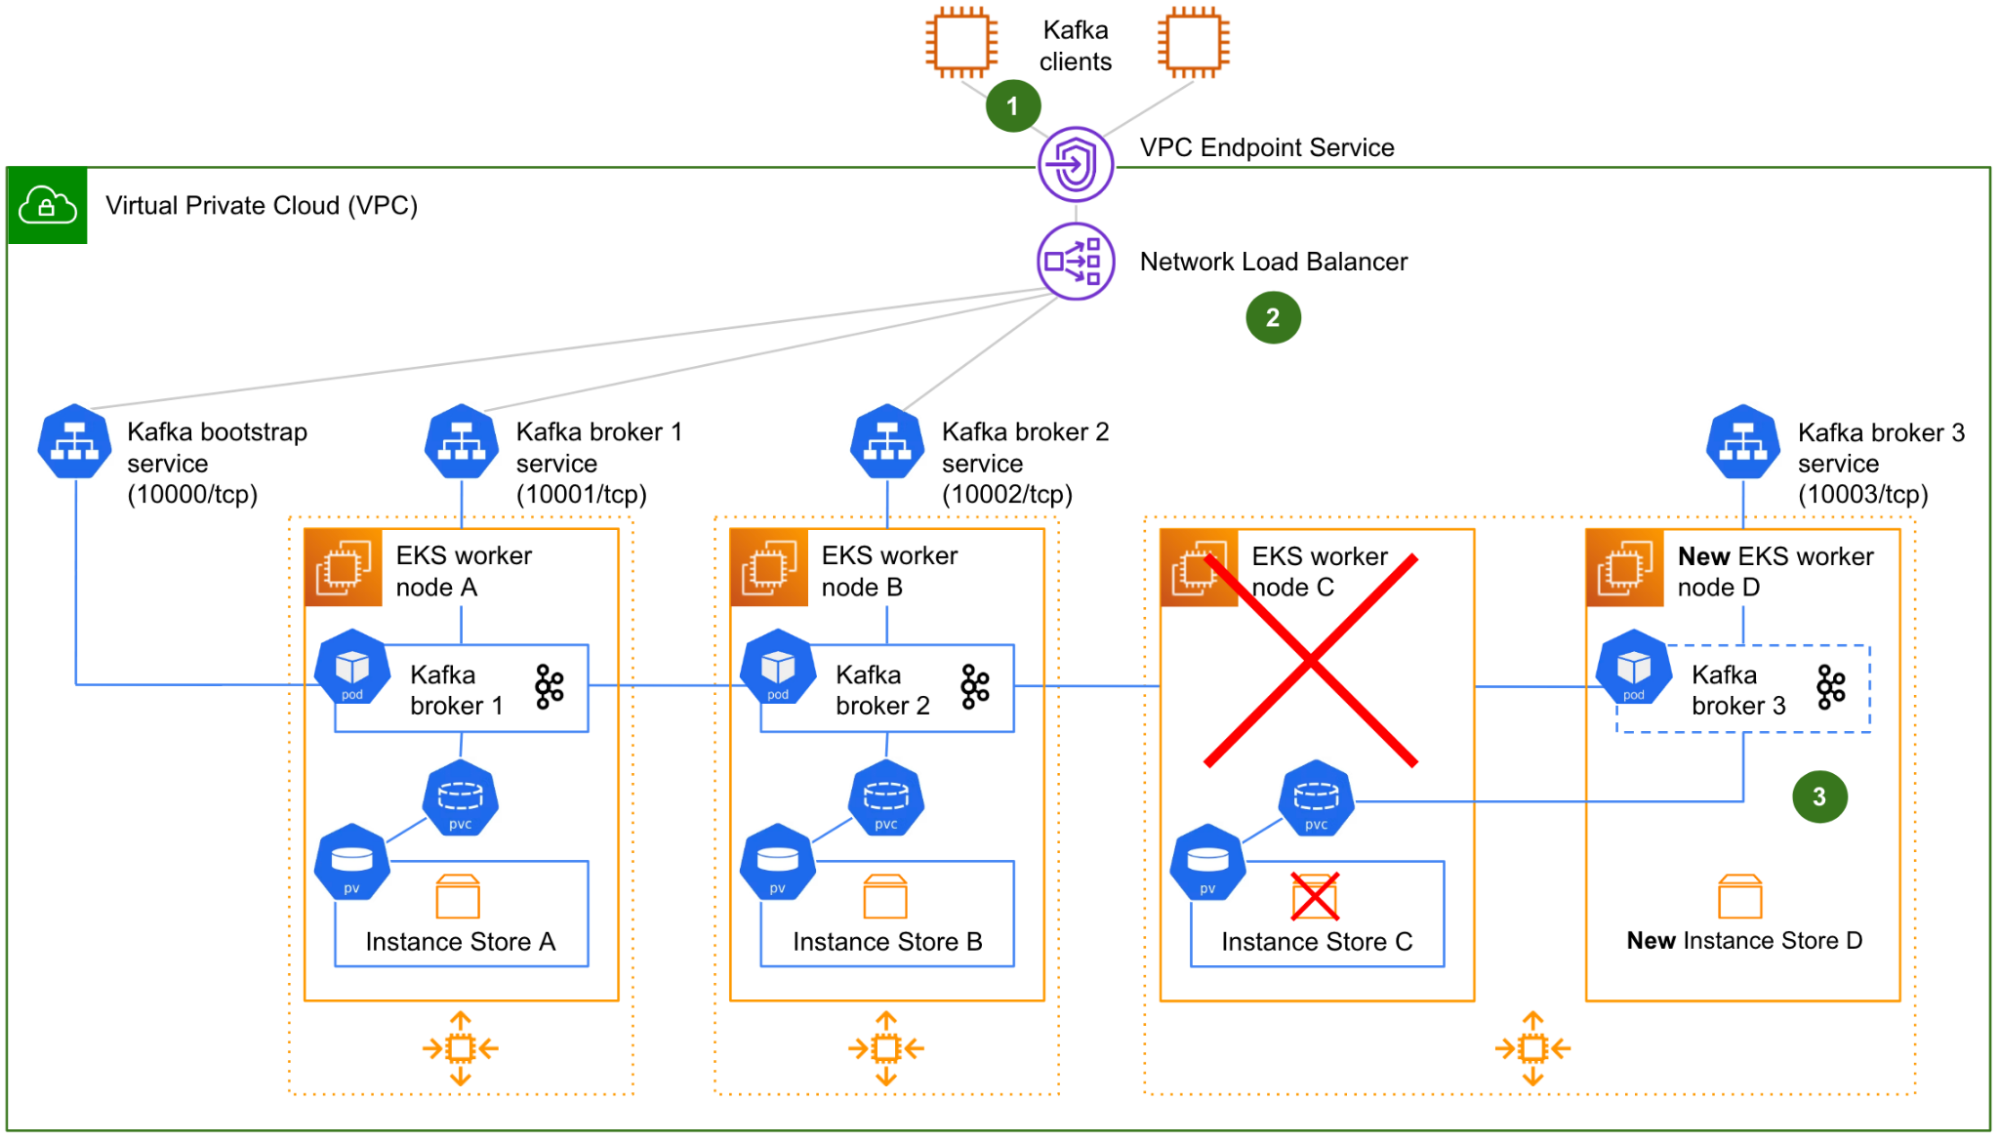
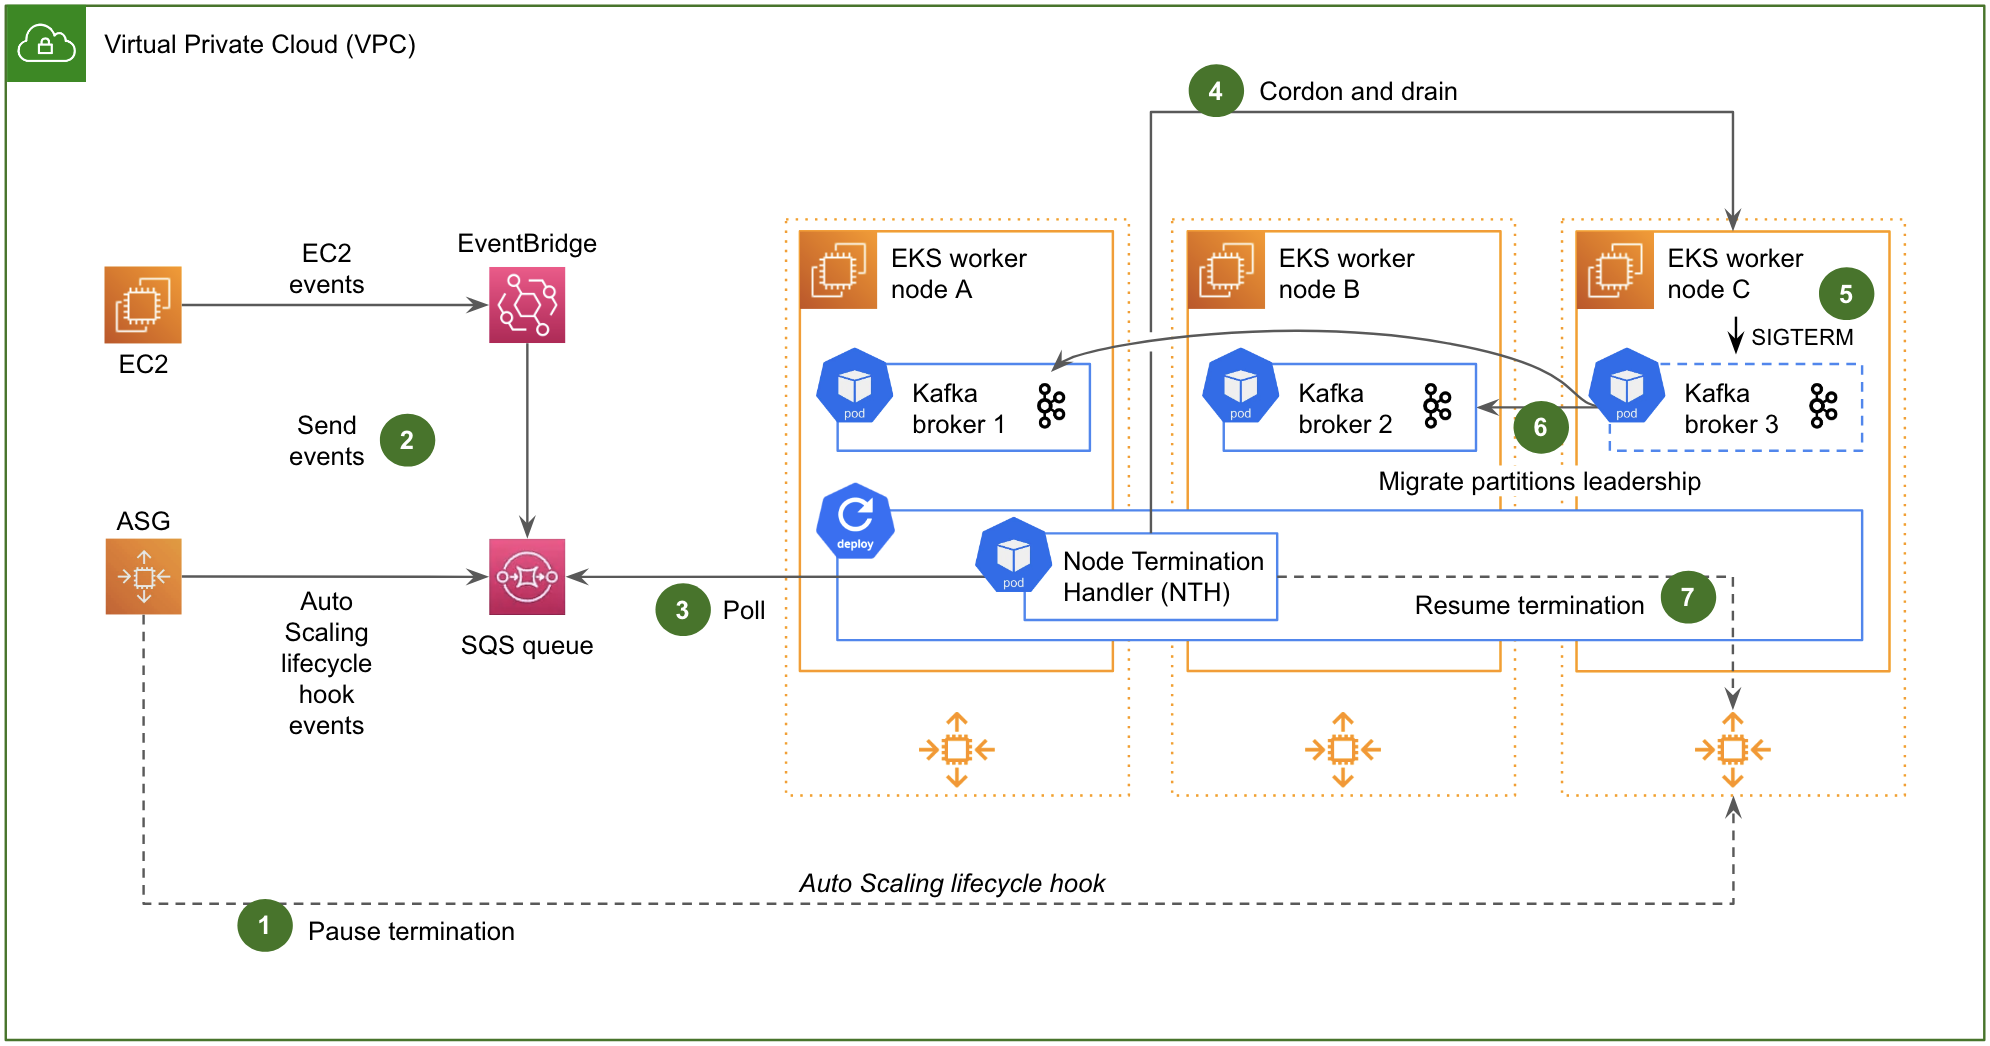
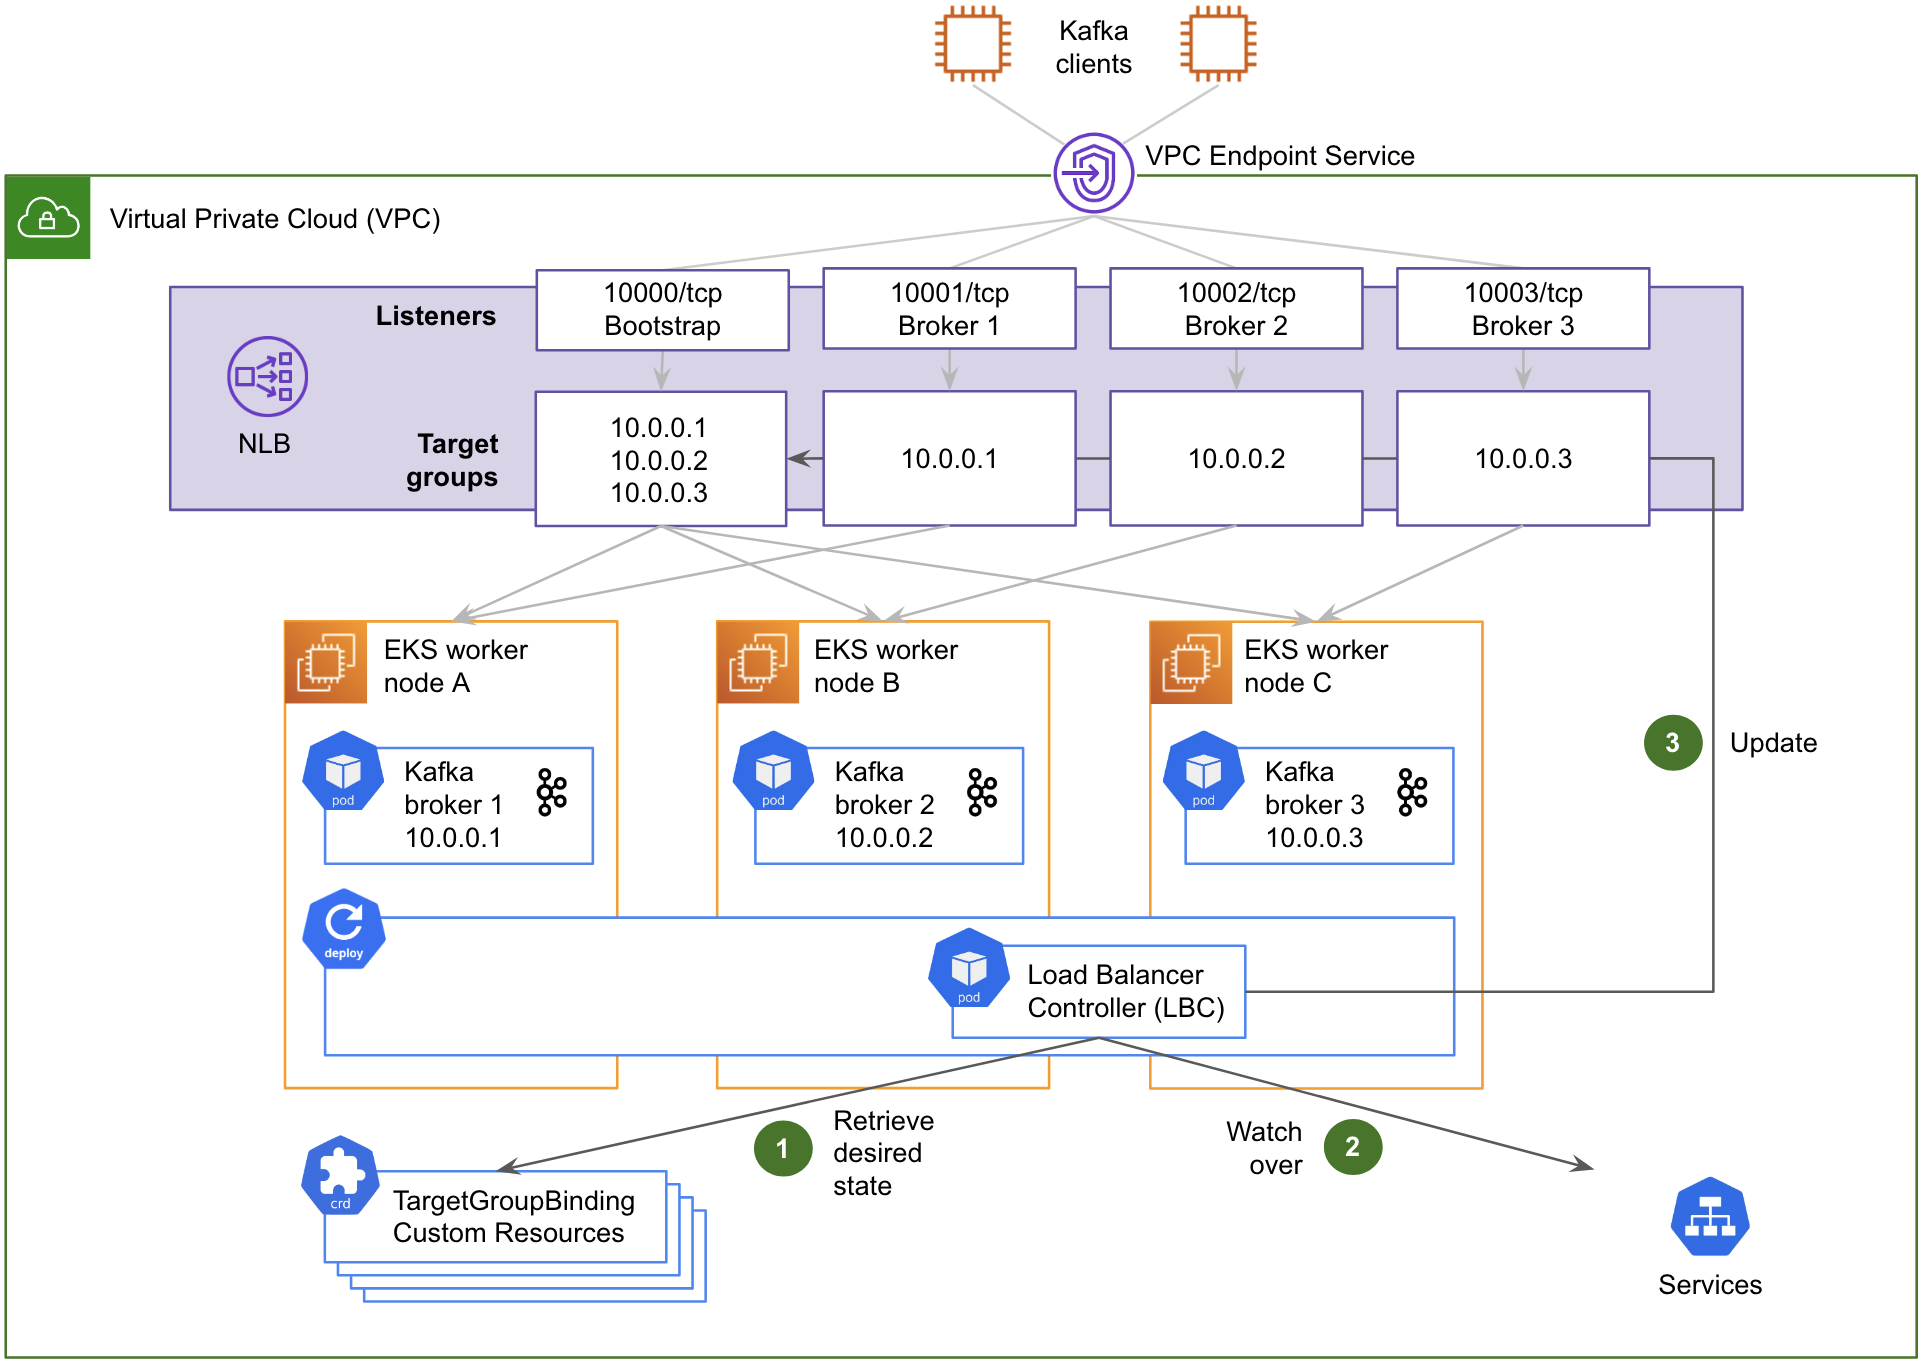
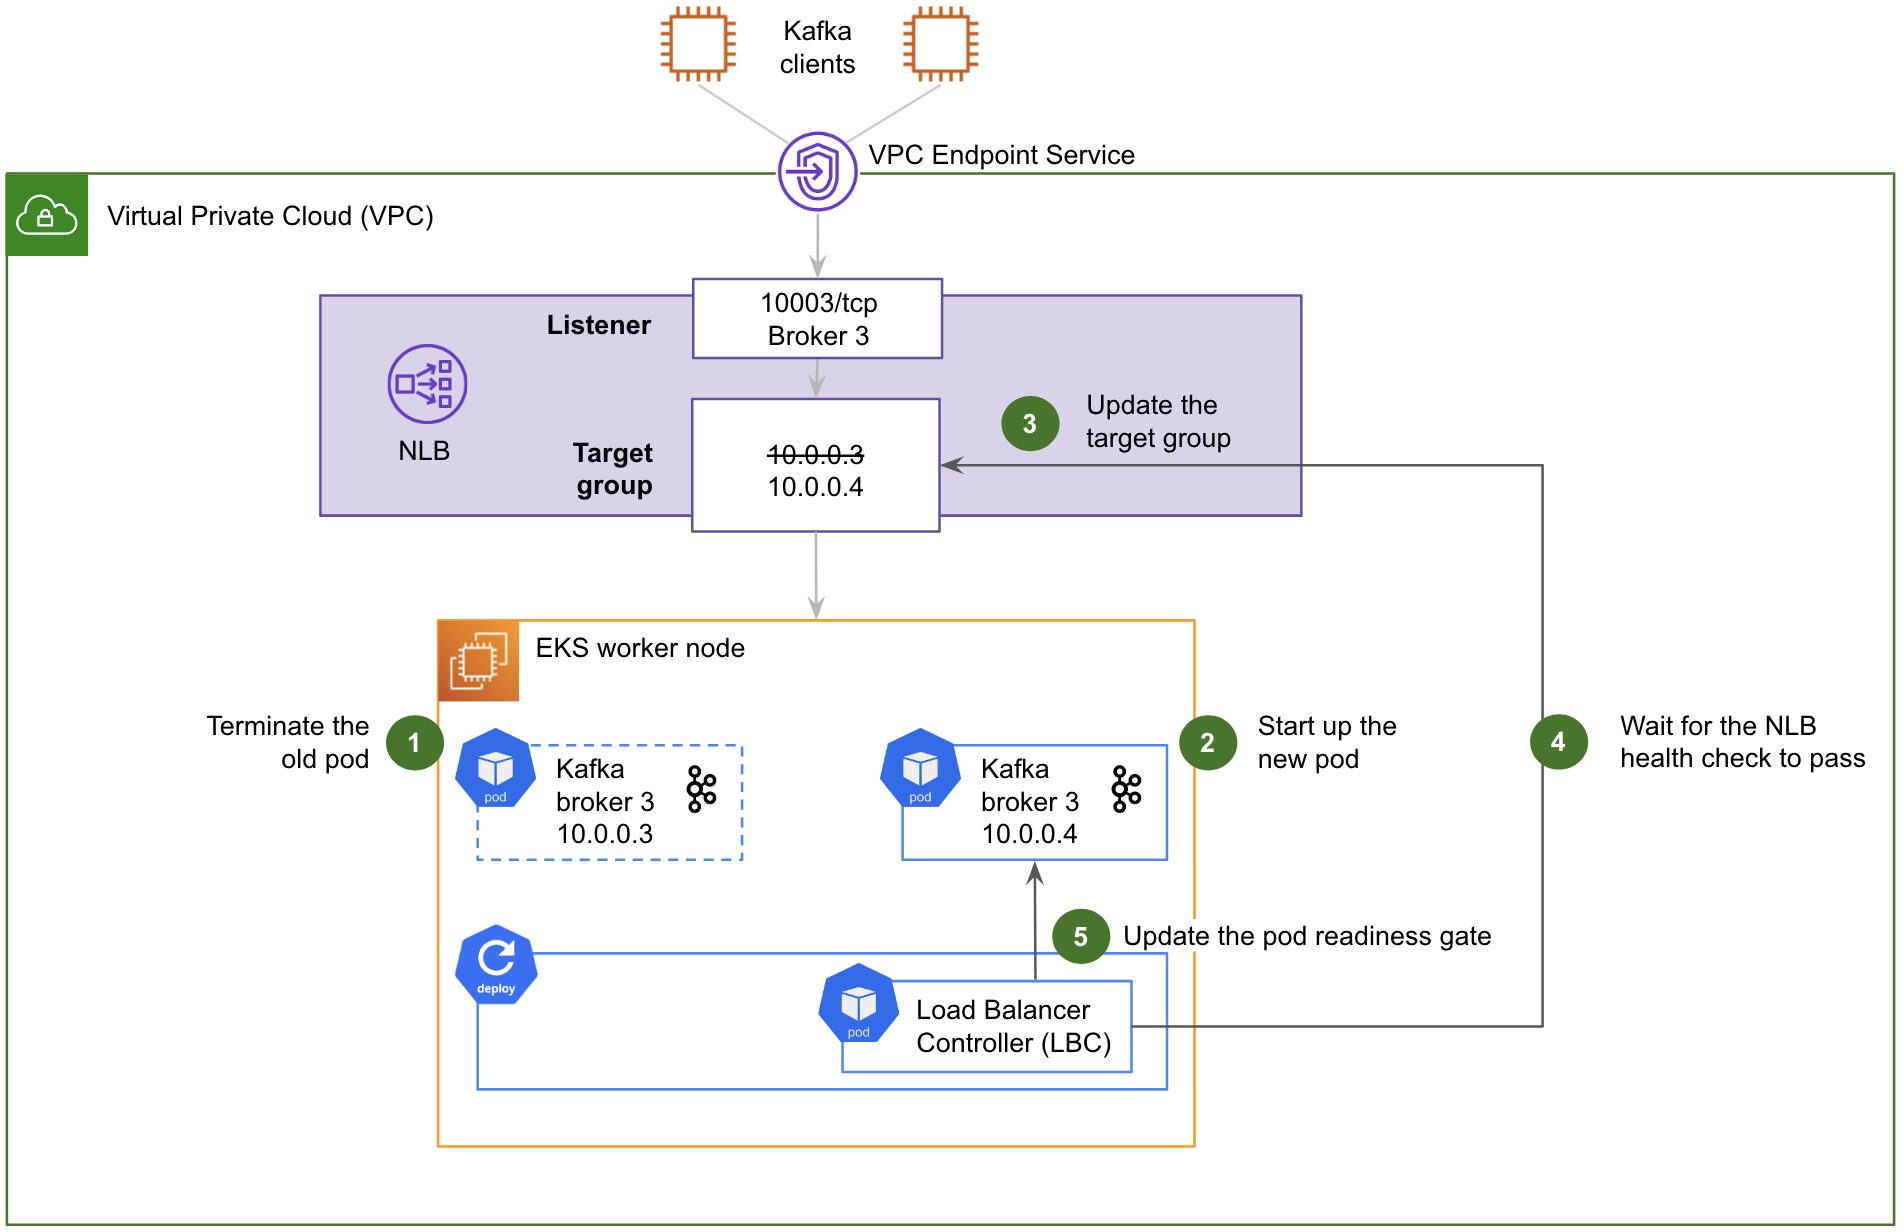
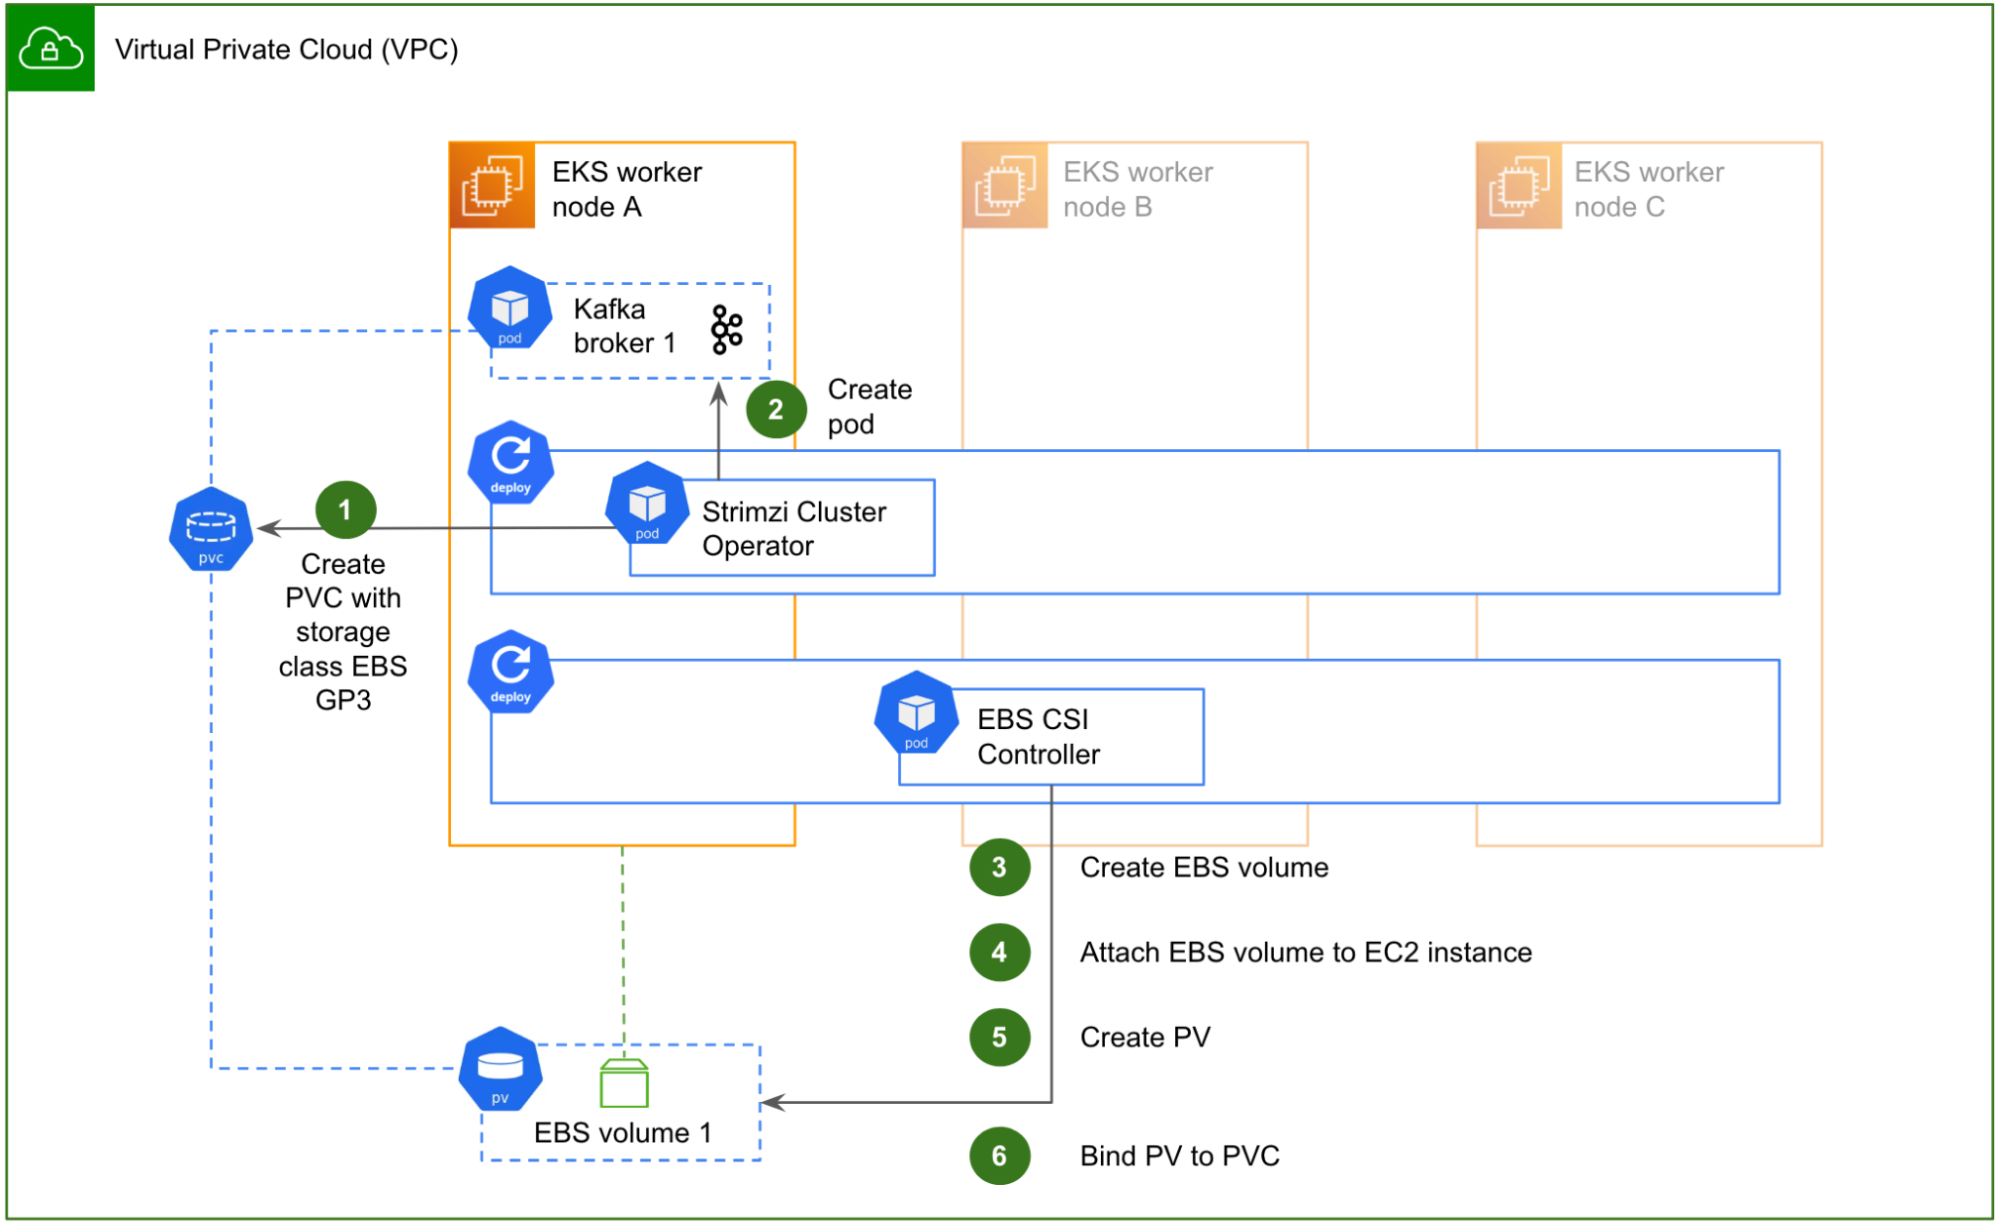
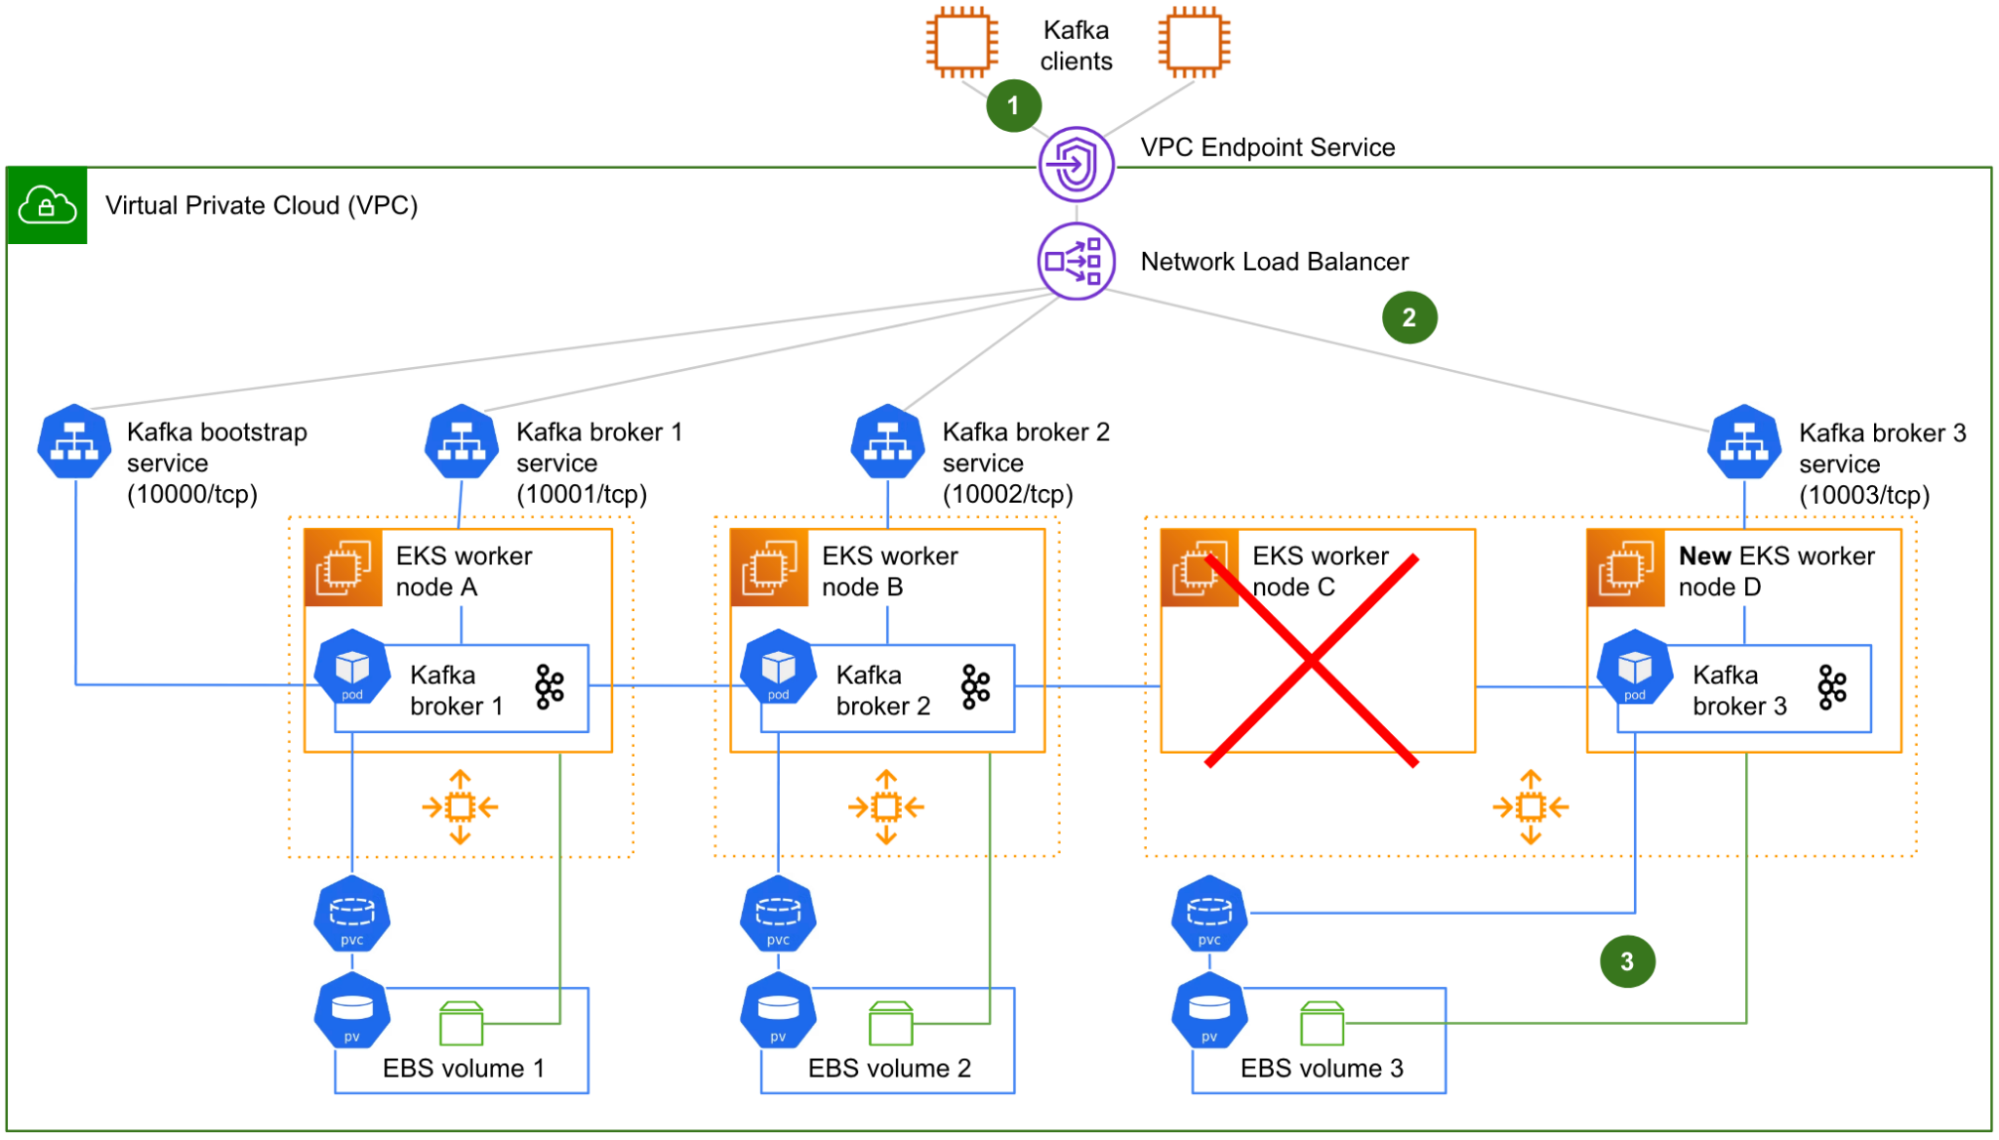


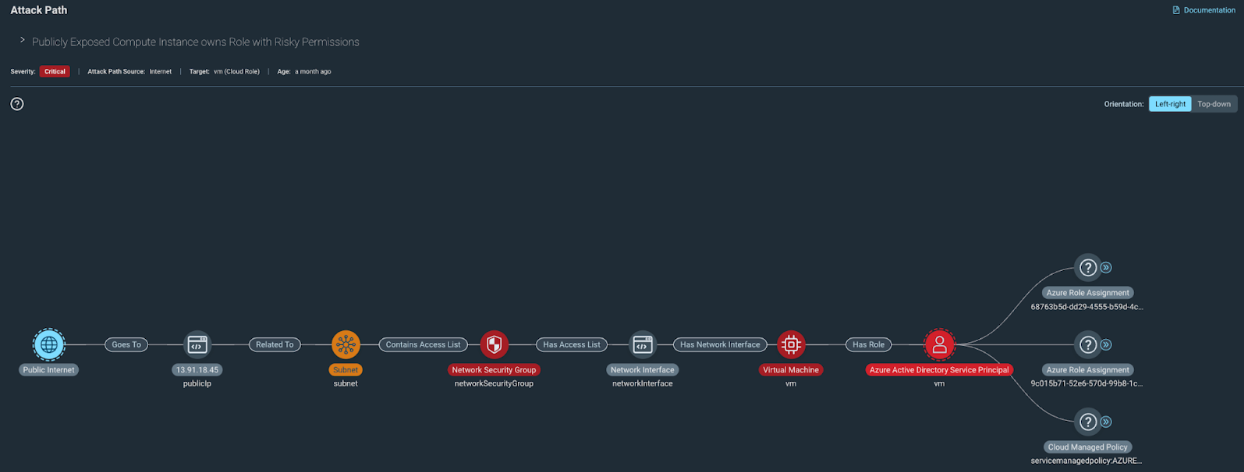
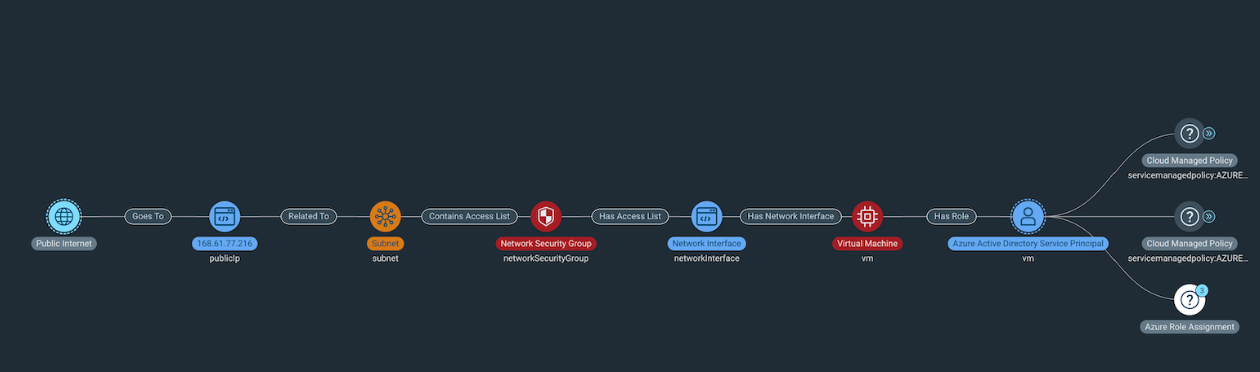
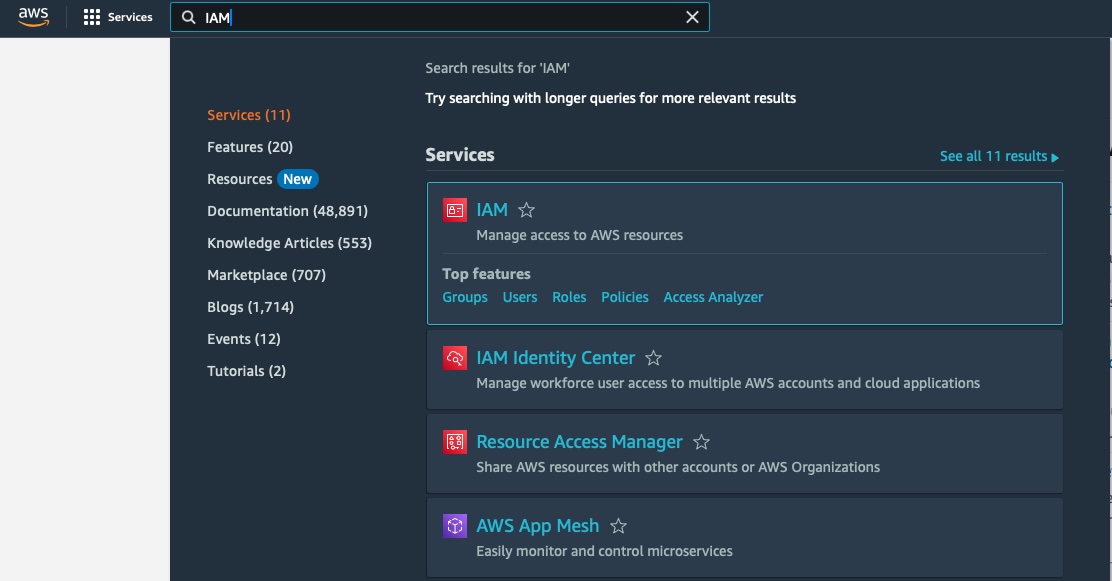
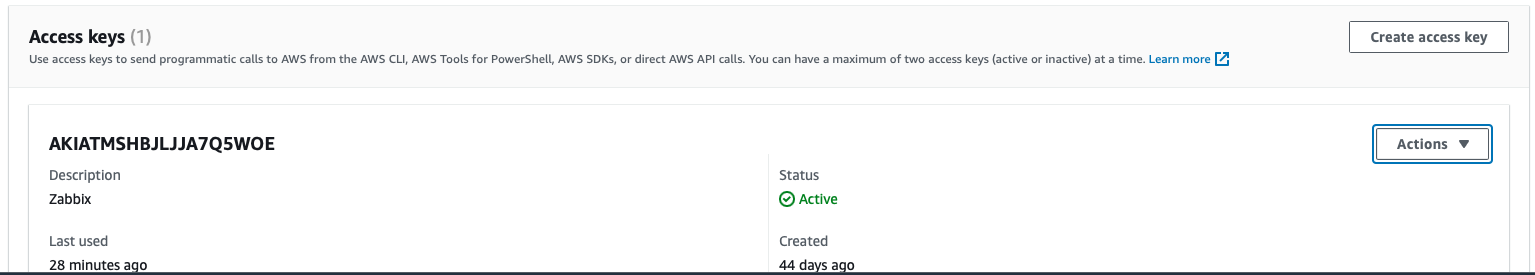

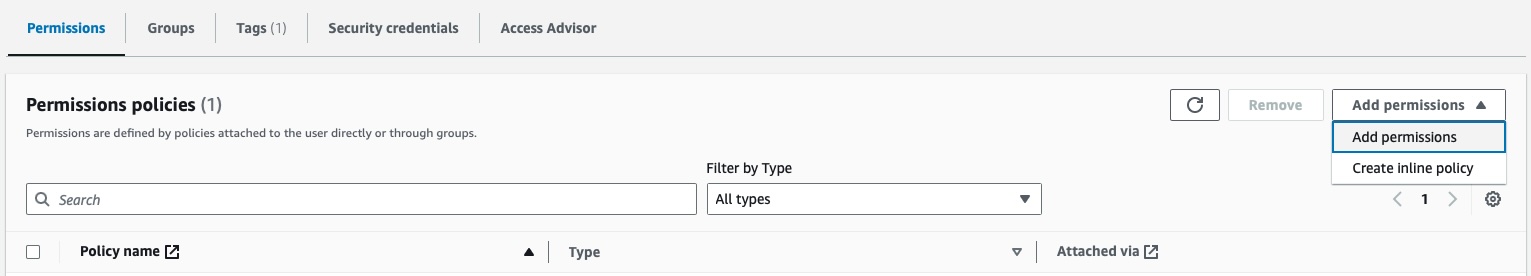

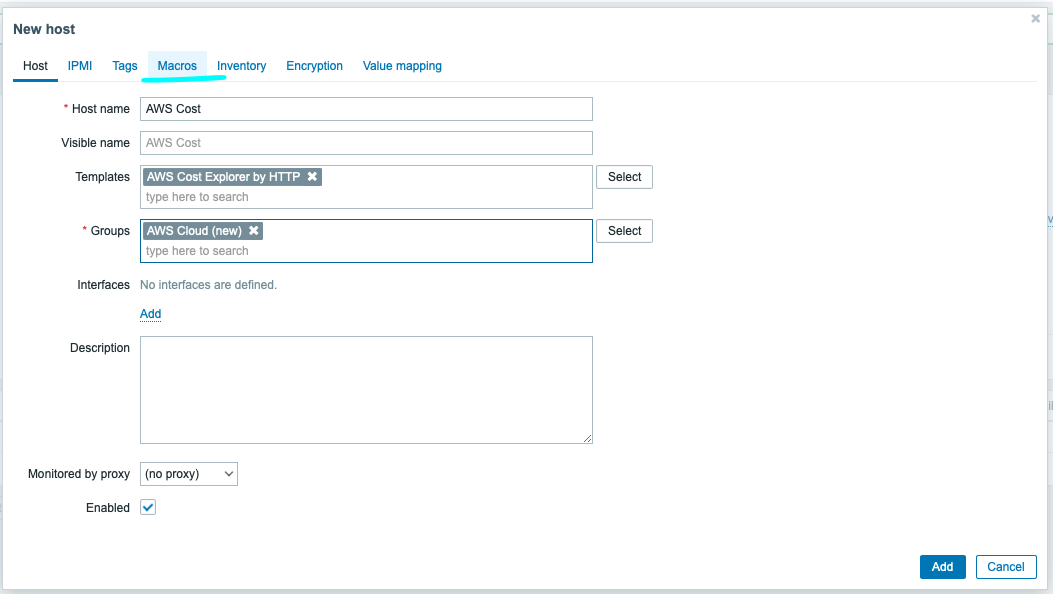
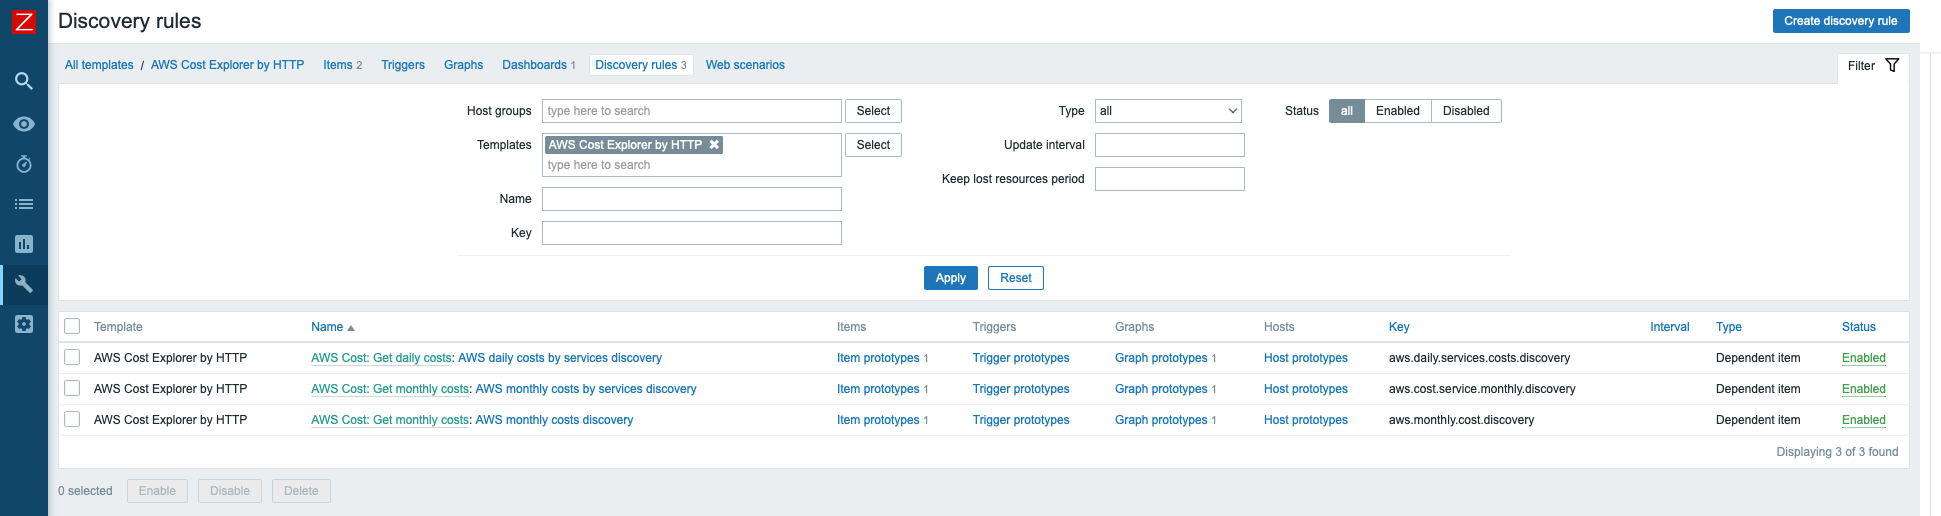
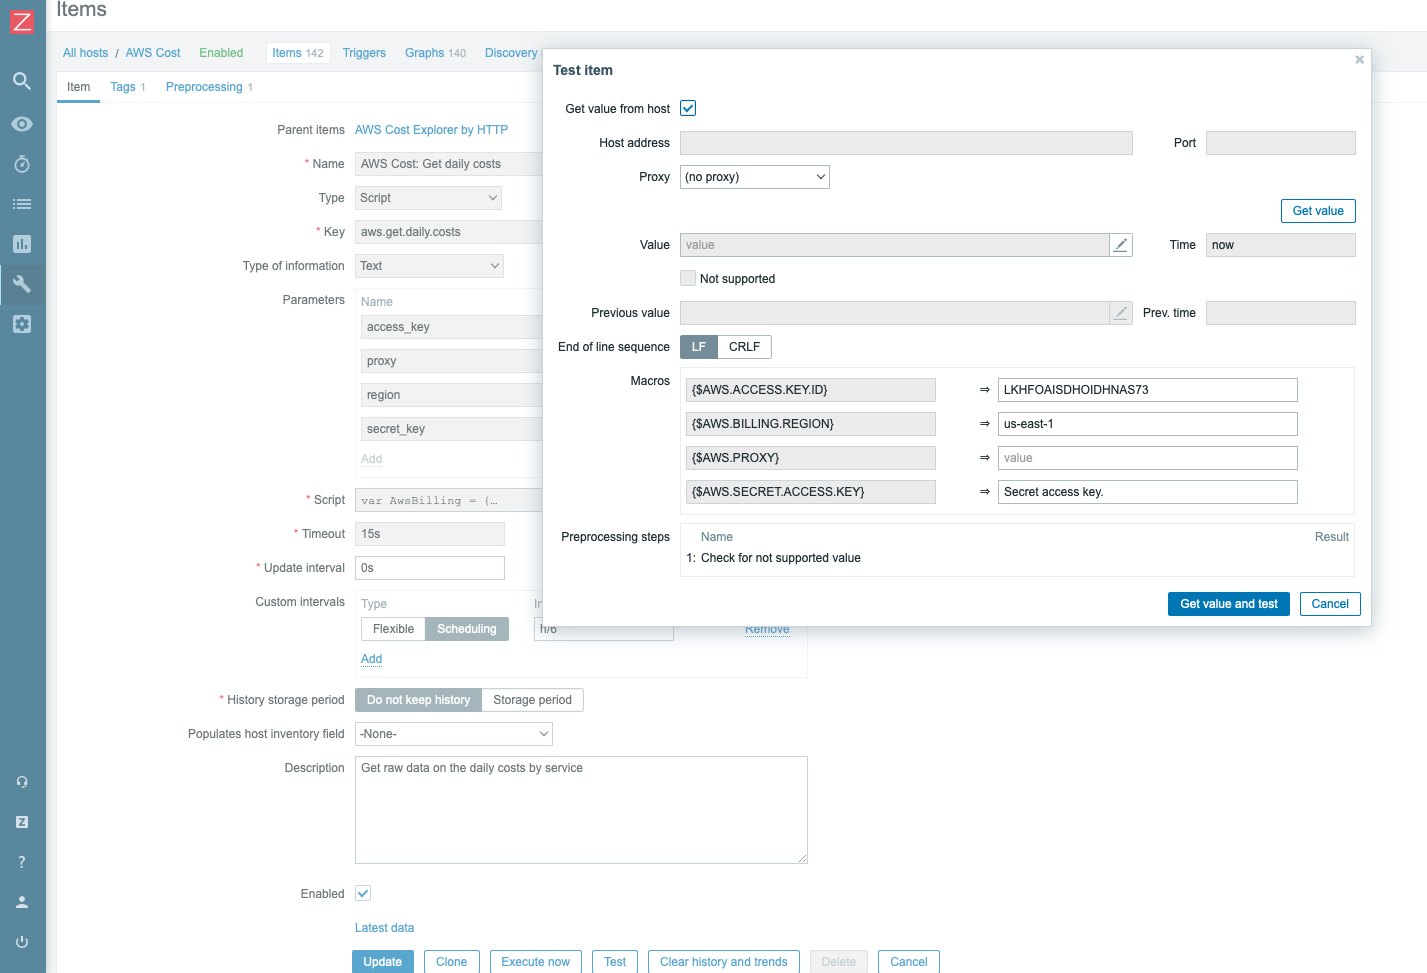
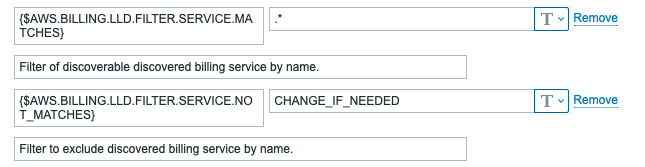

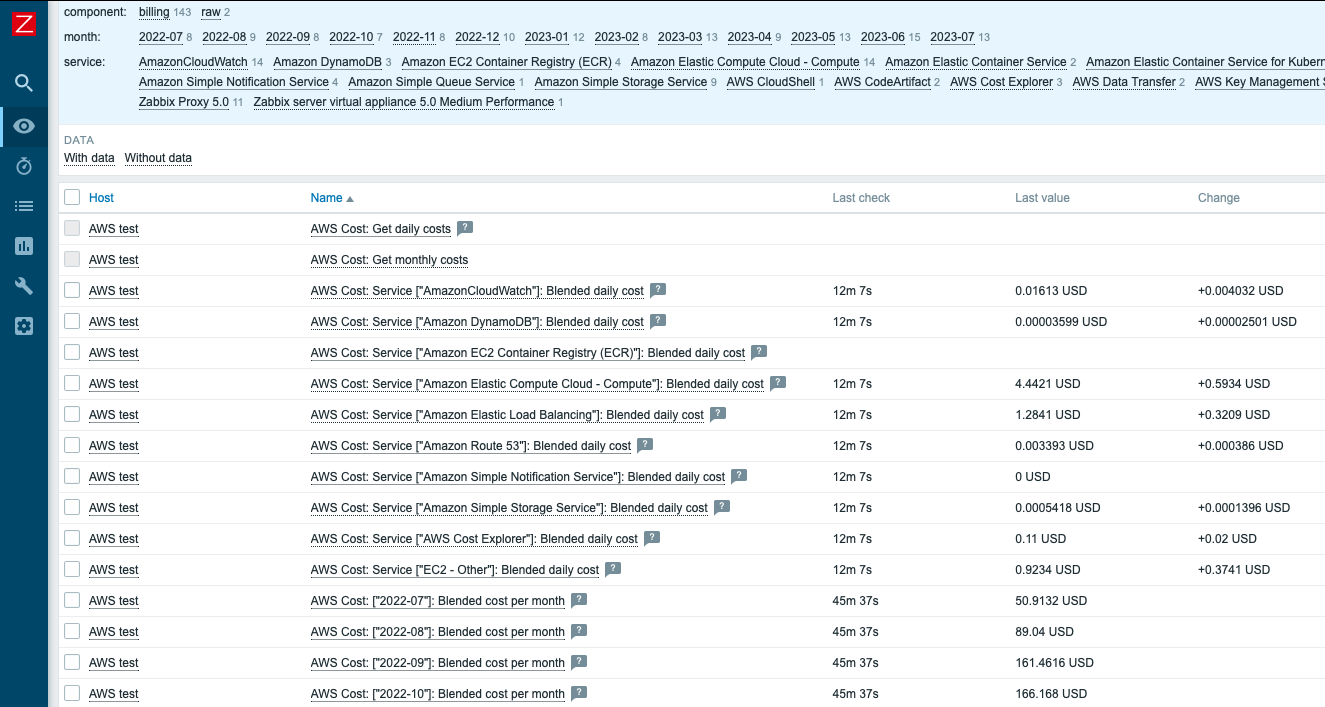


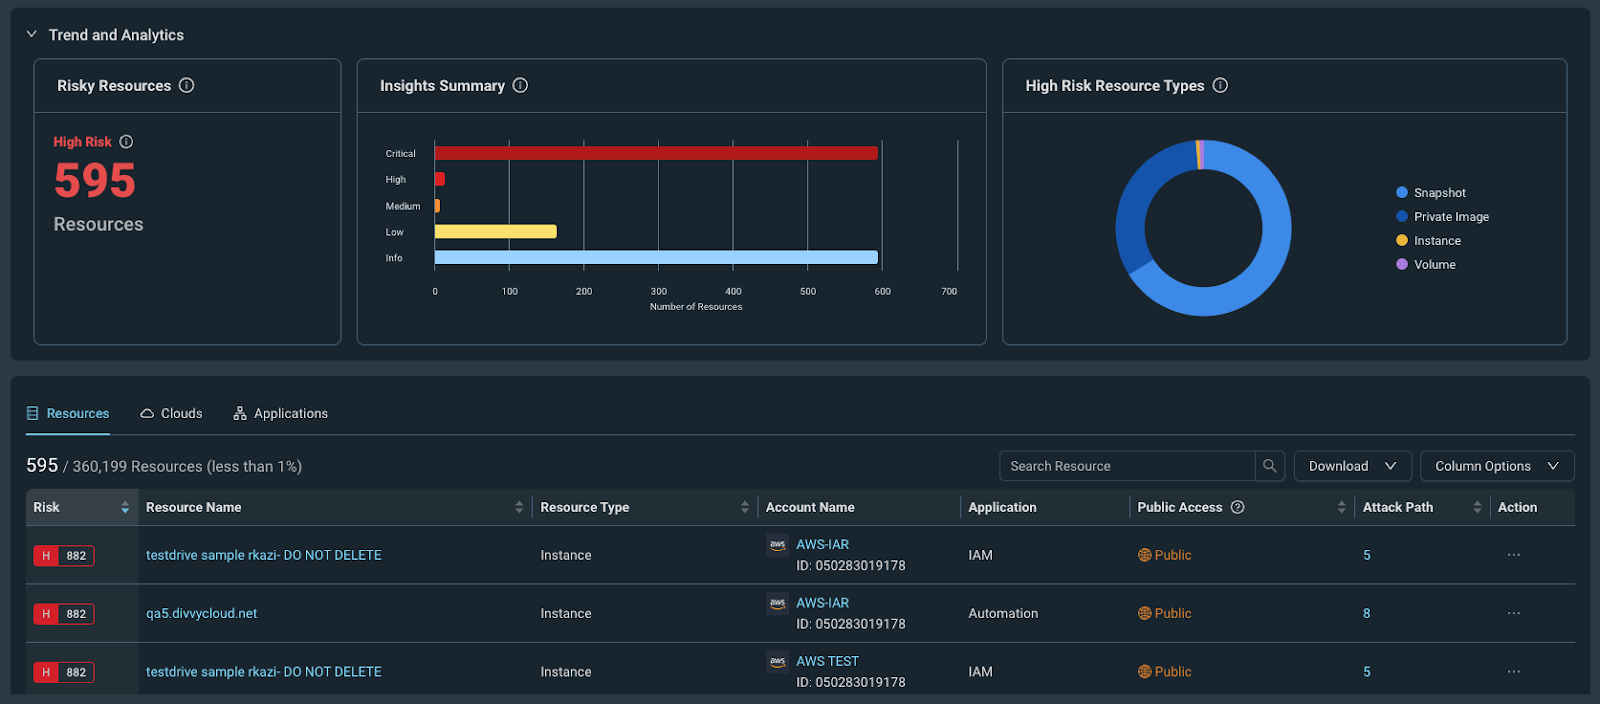
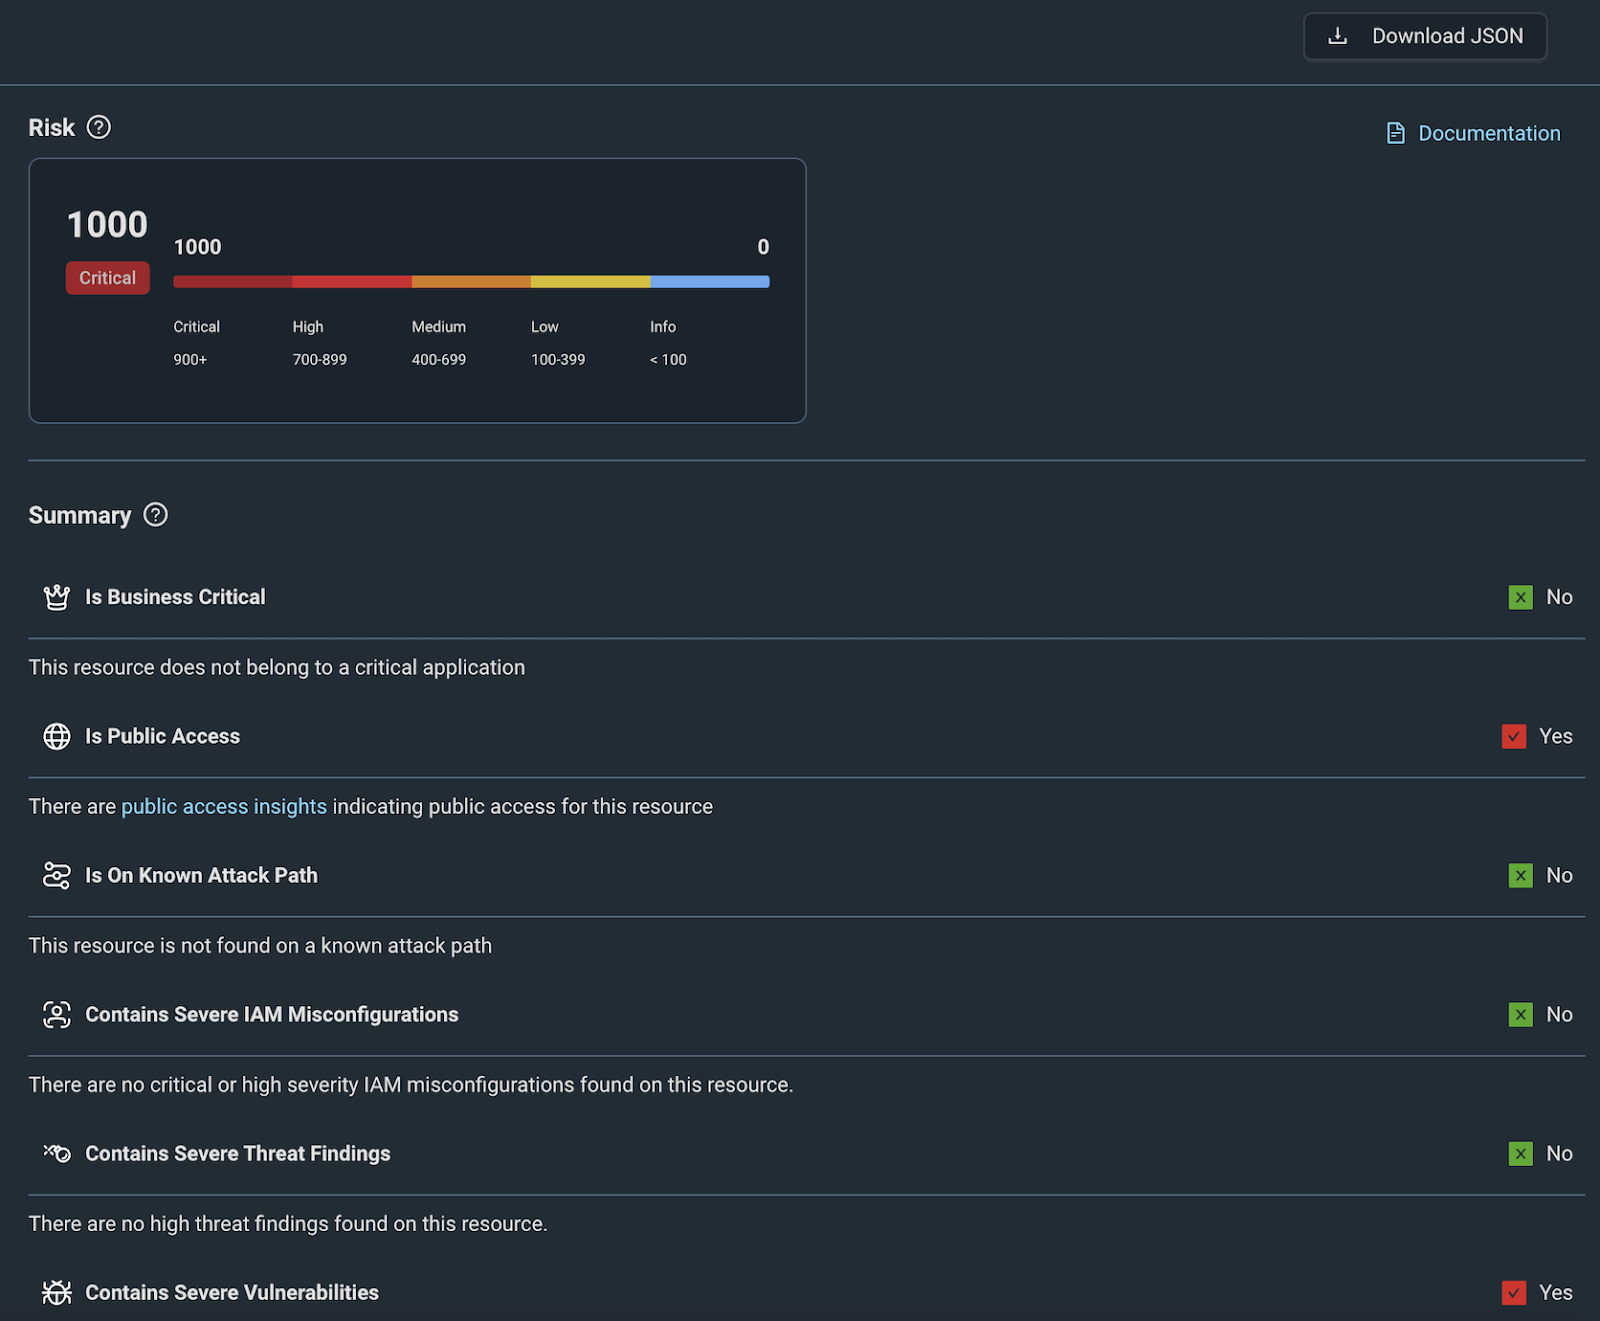


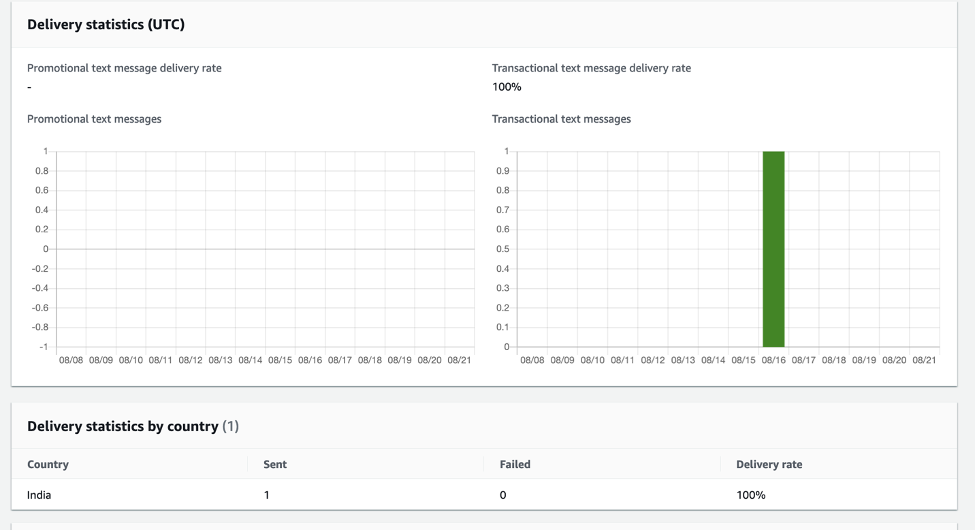
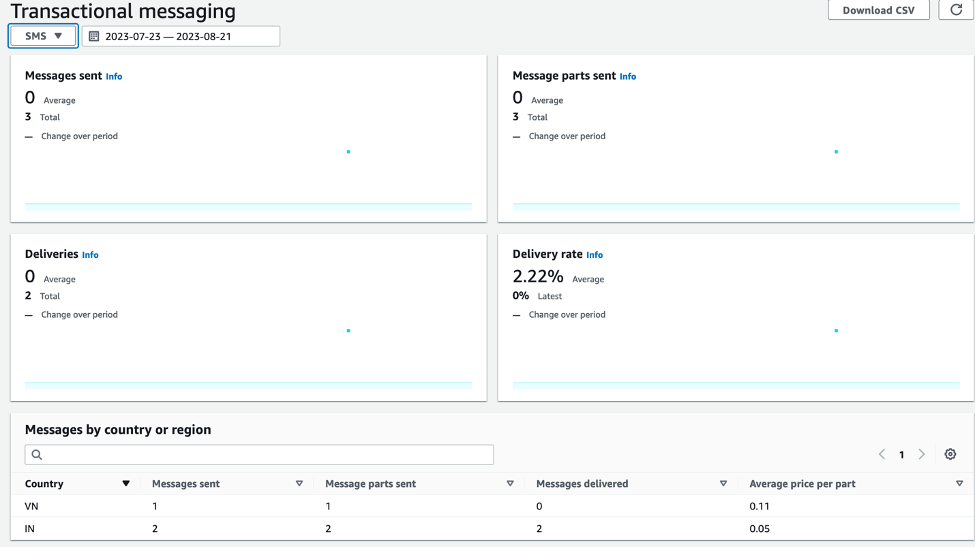
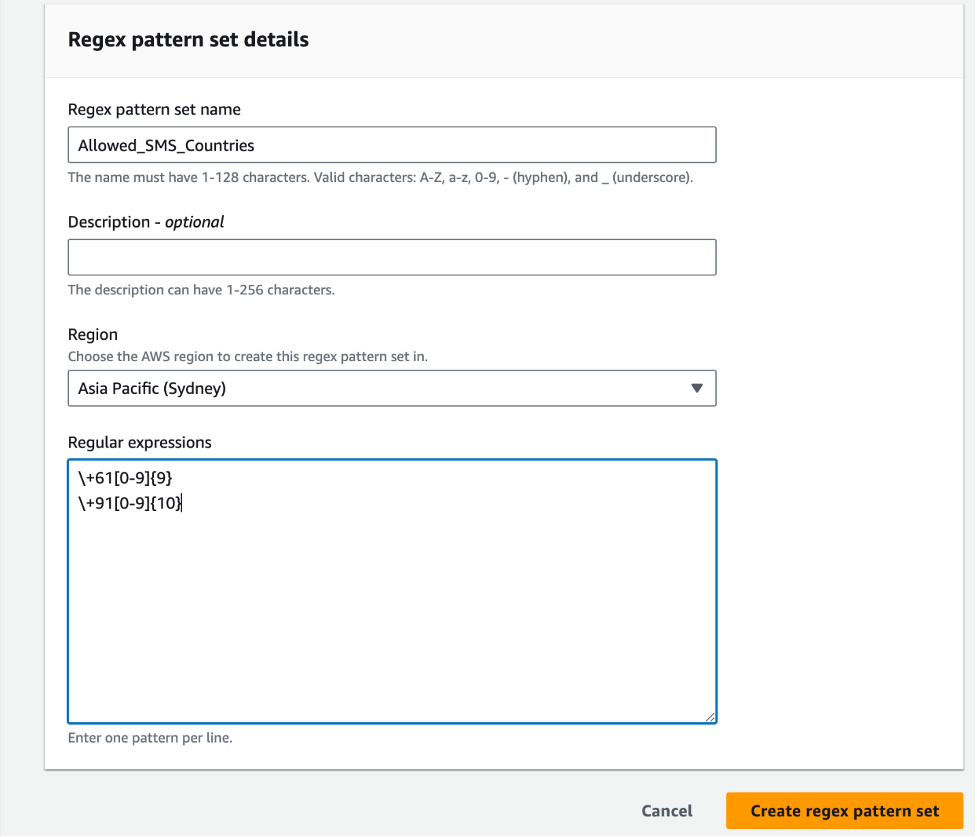
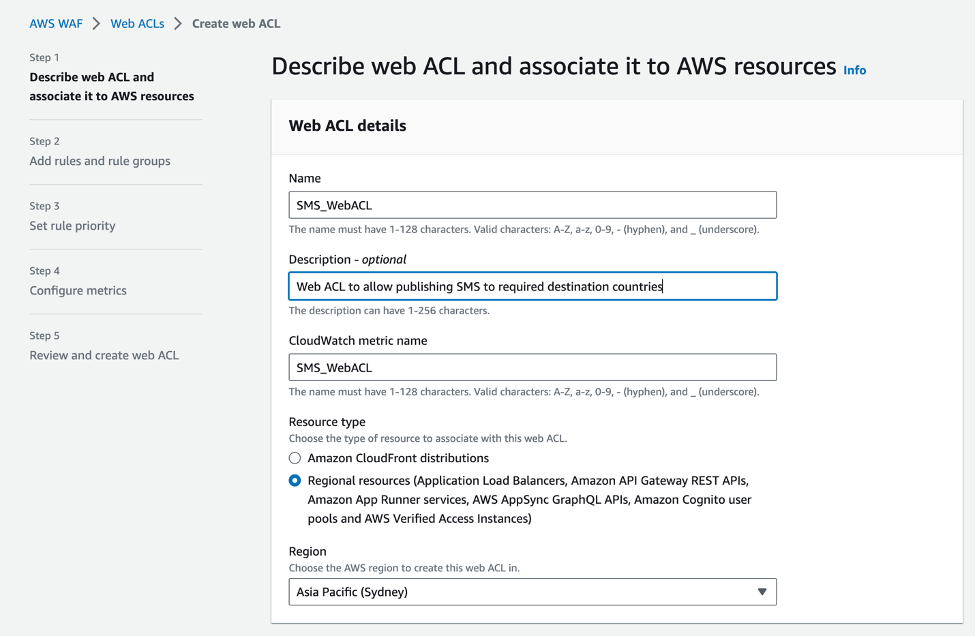
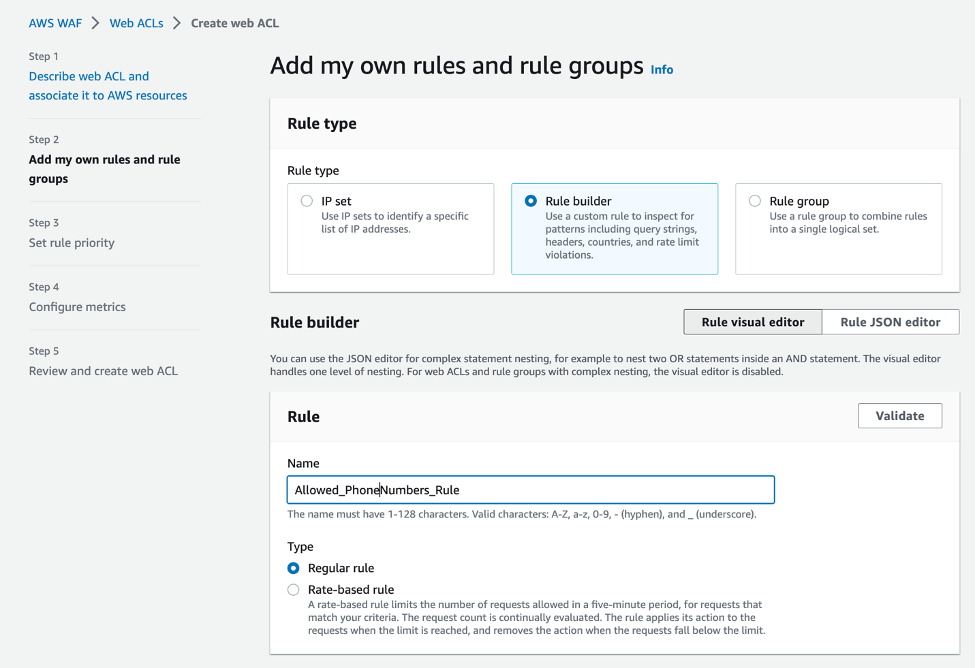
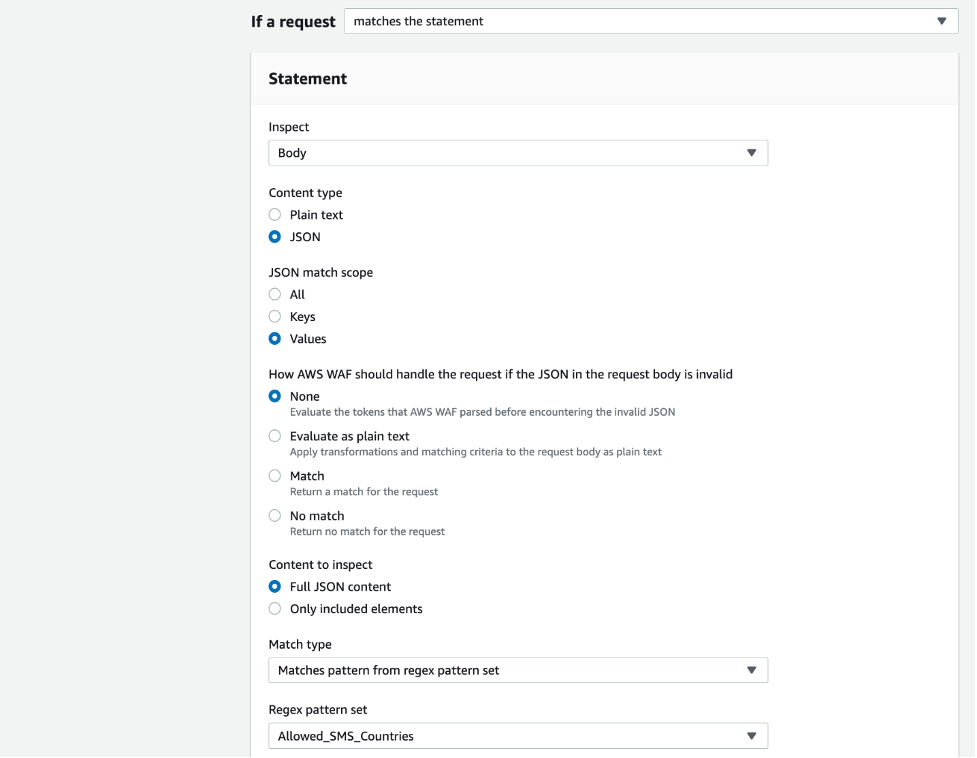
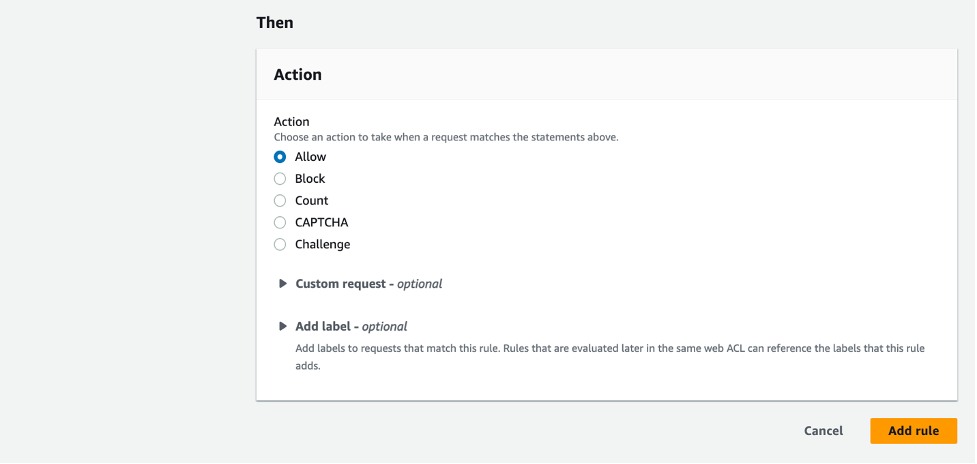
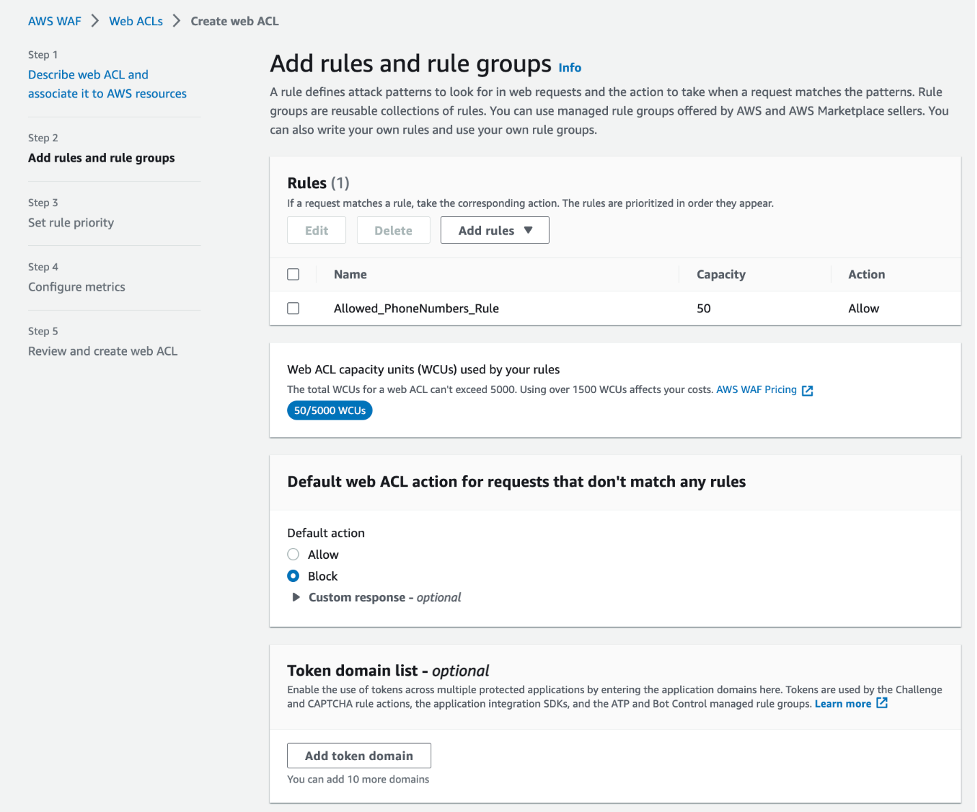
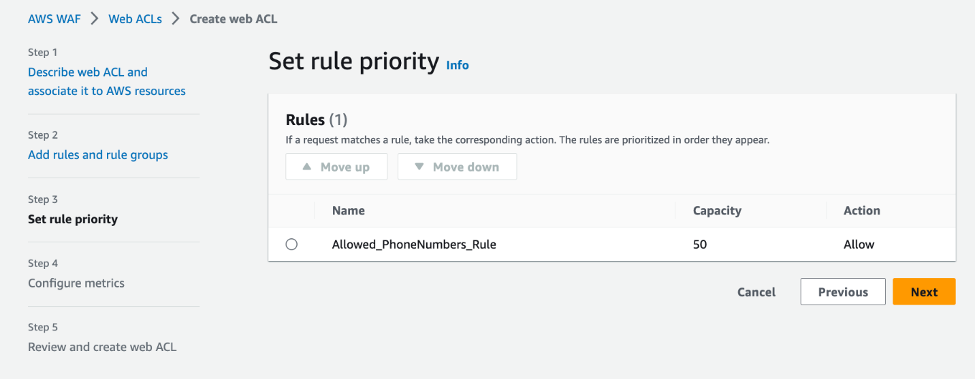
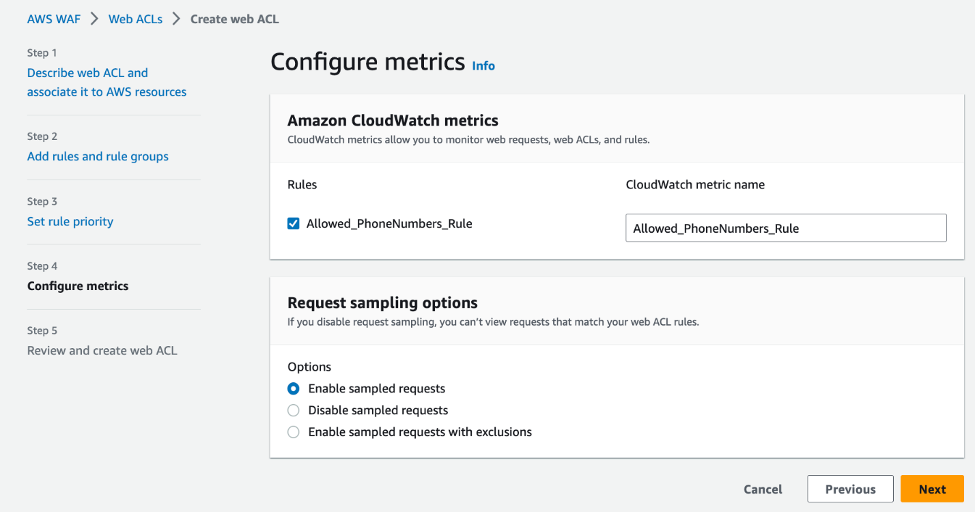
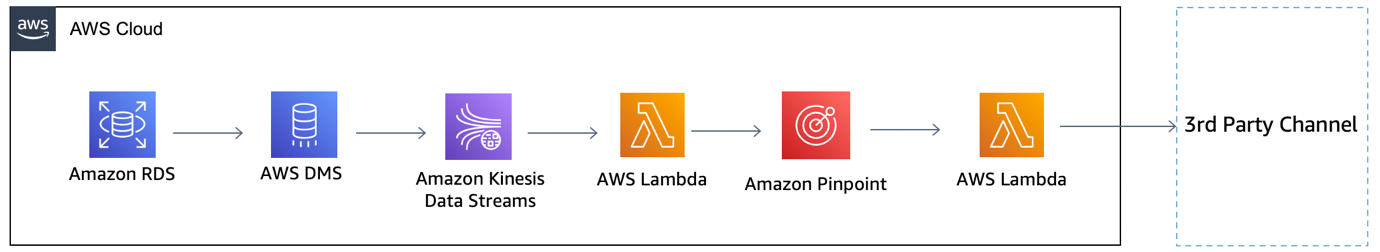


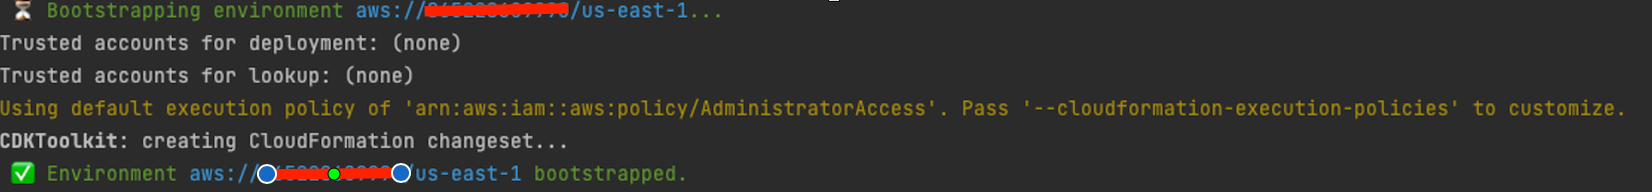
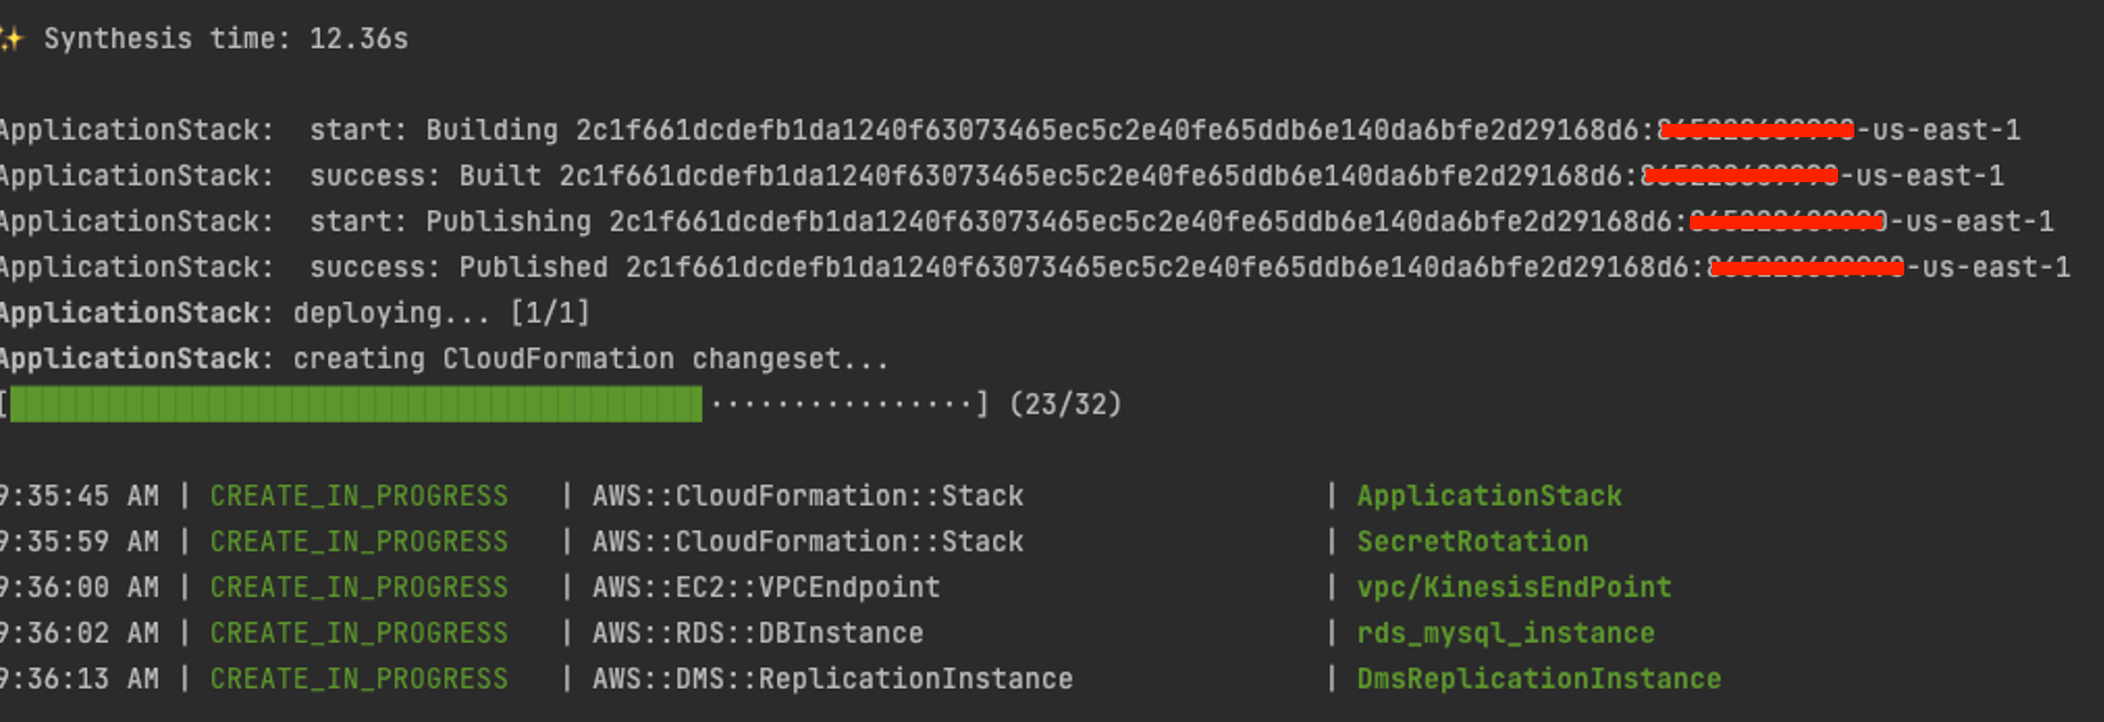
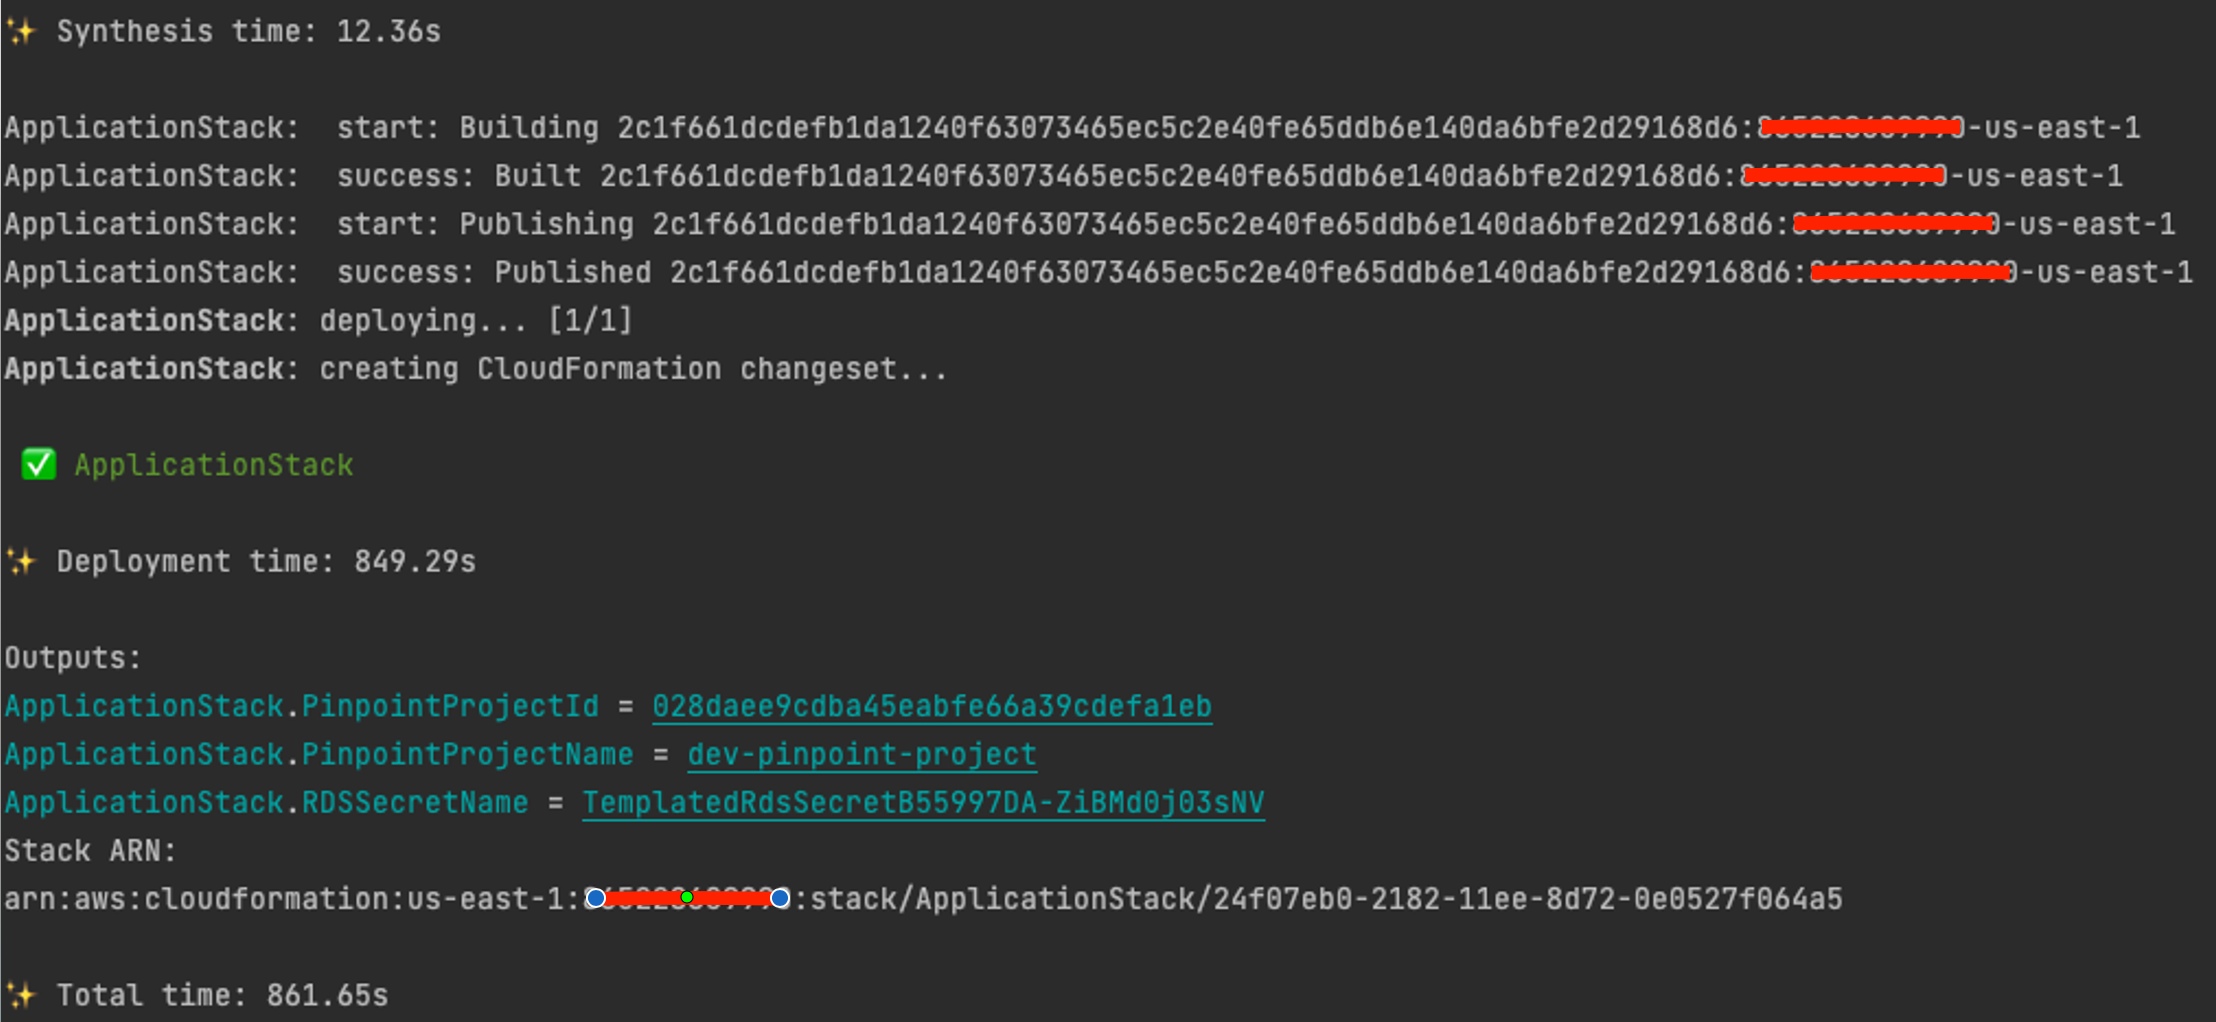
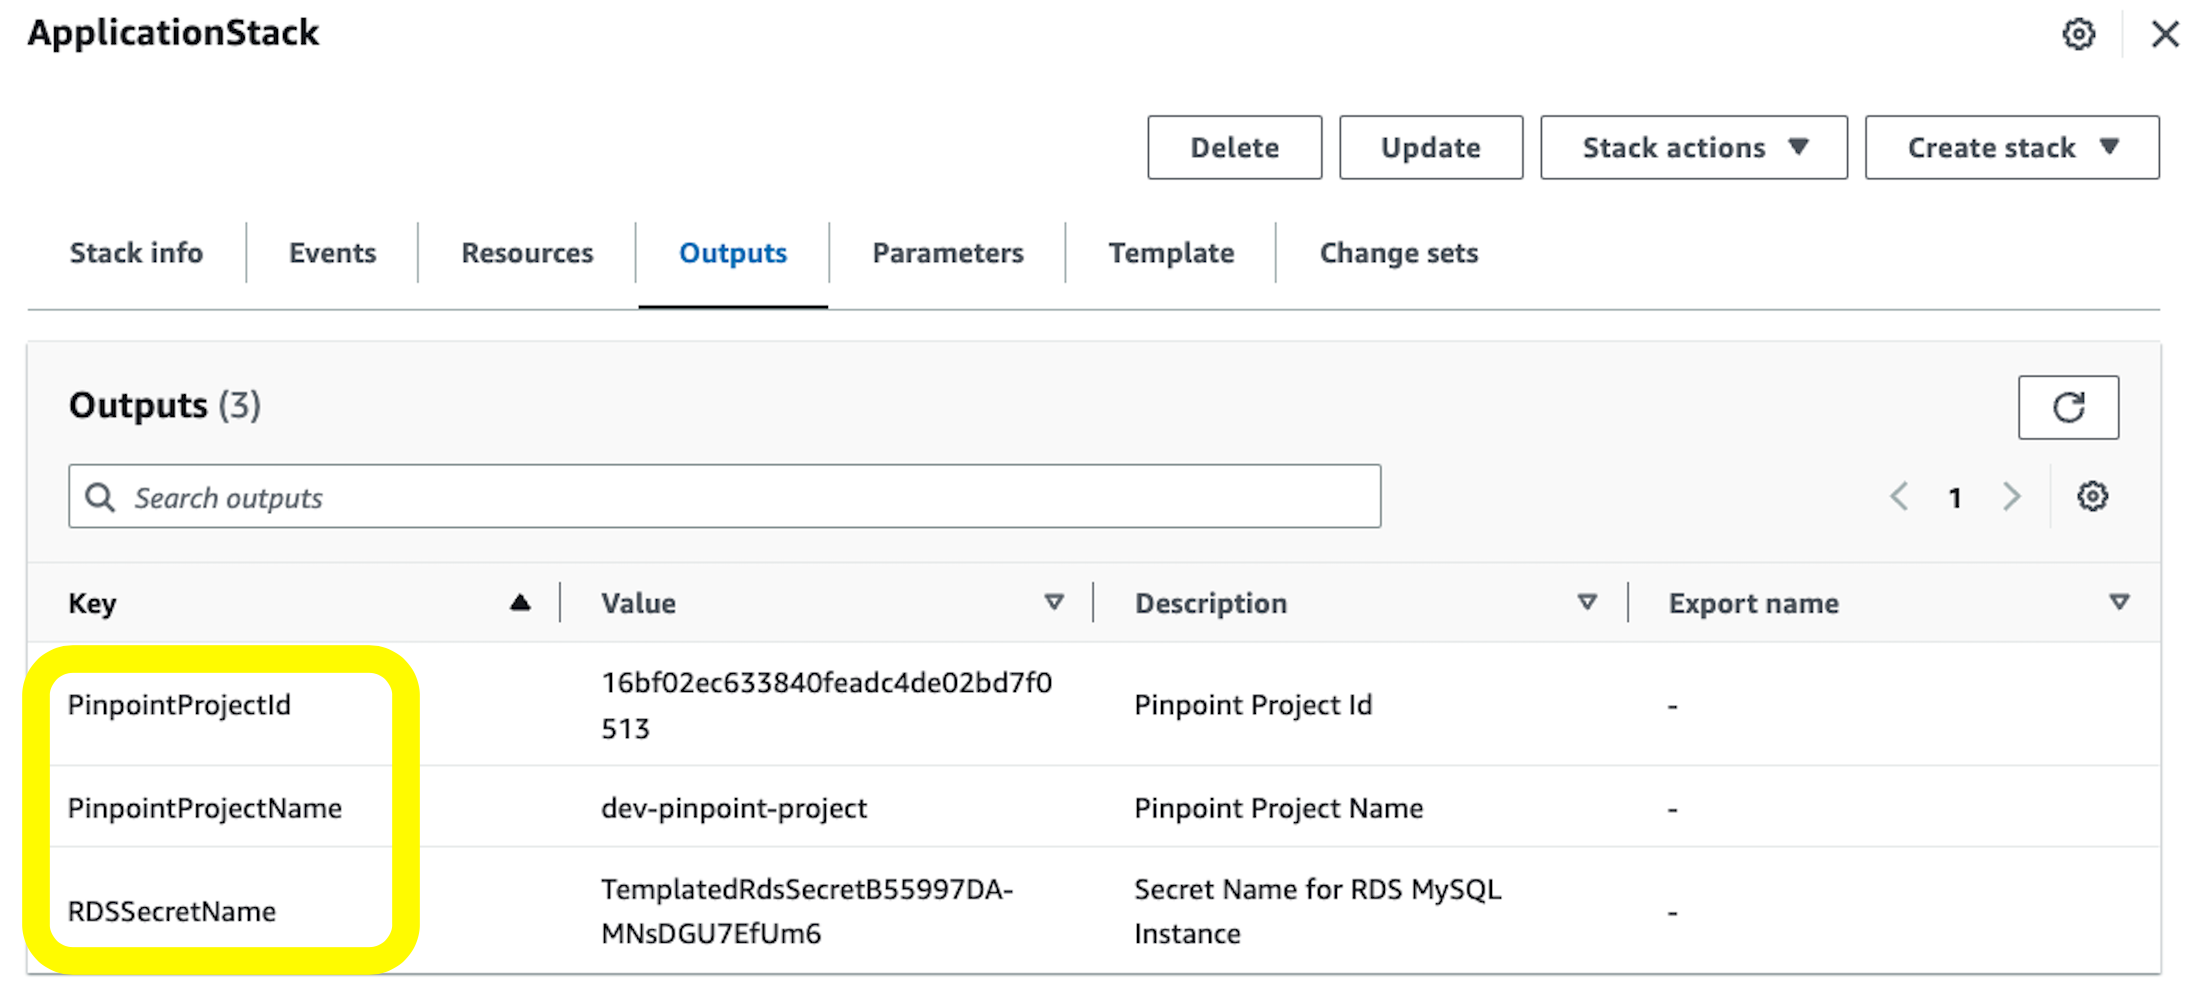


 Figure 1 – DMARC Flow


