Post Syndicated from Sheila Busser original https://aws.amazon.com/blogs/compute/evaluating-predictive-scaling-for-amazon-ec2-capacity-optimization/
This post is written by Ankur Sethi, Sr. Product Manager, EC2, and Kinnar Sen, Sr. Specialist Solution Architect, AWS Compute.
Amazon EC2 Auto Scaling helps customers optimize their Amazon EC2 capacity by dynamically responding to varying demand. Based on customer feedback, we enhanced the scaling experience with the launch of predictive scaling policies. Predictive scaling proactively adds EC2 instances to your Auto Scaling group in anticipation of demand spikes. This results in better availability and performance for your applications that have predictable demand patterns and long initialization times. We recently launched a couple of features designed to help you assess the value of predictive scaling – prescriptive recommendations on whether to use predictive scaling based on its potential availability and cost impact, and integration with Amazon CloudWatch to continuously monitor the accuracy of predictions. In this post, we discuss the features in detail and the steps that you can easily adopt to enjoy the benefits of predictive scaling.
Recap: Predictive Scaling
EC2 Auto Scaling helps customers maintain application availability by managing the capacity and health of the underlying cluster. Prior to predictive scaling, EC2 Auto Scaling offered dynamic scaling policies such as target tracking and step scaling. These dynamic scaling policies are configured with an Amazon CloudWatch metric that represents an application’s load. EC2 Auto Scaling constantly monitors this metric and responds according to your policies, thereby triggering the launch or termination of instances. Although it’s extremely effective and widely used, this model is reactive in nature, and for larger spikes, may lead to unfulfilled capacity momentarily as the cluster is scaling out. Customers mitigate this by adopting aggressive scale out and conservative scale in to manage the additional buffer of instances. However, sometimes applications take a long time to initialize or have a recurring pattern with a sudden spike of high demand. These can have an impact on the initial response of the system when it is scaling out. Customers asked for a proactive scaling mechanism that can scale capacity ahead of predictable spikes, and so we delivered predictive scaling.
Predictive scaling was launched to make the scaling action proactive as it anticipates the changes required in the compute demand and scales accordingly. The scaling action is determined by ensemble machine learning (ML) built with data from your Auto Scaling group’s scaling patterns, as well as billions of data points from our observations. Predictive scaling should be used for applications where demand changes rapidly but with a recurring pattern, instances require a long time to initialize, or where you’re manually invoking scheduled scaling for routine demand patterns. Predictive scaling not only forecasts capacity requirements based on historical usage, but also learns continuously, thereby making forecasts more accurate with time. Furthermore, predictive scaling policy is designed to only scale out and not scale in your Auto Scaling groups, eliminating the risk of ending with lesser capacity because of inexact predictions. You must use dynamic scaling policy, scheduled scaling, or your own custom mechanism for scale-ins. In case of exceptional demand spikes, this addition of dynamic scaling policy can also improve your application performance by bridging the gap between demand and predicted capacity.
What’s new with predictive scaling
Predictive scaling policies can be configured in a non-mutative ‘Forecast Only’ mode to evaluate the accuracy of forecasts. When you’re ready to start scaling, you can switch to the ‘Forecast and Scale’ mode. Now we prescriptively recommend whether your policy should be switched to ‘Forecast and Scale’ mode if it can potentially lead to better availability and lower costs, saving you the time and effort of doing such an evaluation manually. You can test different configurations by creating multiple predictive scaling policies in ‘Forecast Only’ mode, and choose the one that performs best in terms of availability and cost improvements.
Monitoring and observability are key elements of AWS Well Architected Framework. Now we also offer CloudWatch metrics for your predictive scaling policies so that that you can programmatically monitor your predictive scaling policy for demand pattern changes or prolonged periods of inaccurate predictions. This will enable you to monitor the key performance metrics and make it easier to adopt AWS Well-Architected best practices.
In the following sections, we deep dive into the details of these two features.
Recommendations for predictive scaling
Once you set up an Auto Scaling group with predictive scaling policy in Forecast Only mode as explained in this introduction to predictive scaling blog post , you can review the results of the forecast visually and adjust any parameters to more accurately reflect the behavior that you desire. Evaluating simply on the basis of visualization may not be very intuitive if the scaling patterns are erratic. Moreover, if you keep higher minimum capacities, then the graph may show a flat line for the actual capacity as your Auto Scaling group capacity is an outcome of existing scaling policy configurations and the minimum capacity that you configured. This makes it difficult to contemplate whether the lower capacity predicted by predictive scaling wouldn’t leave your Auto Scaling group under-scaled.
This new feature provides a prescriptive guidance to switch on predictive scaling in Forecast and Scale mode based on the factors of availability and cost savings. To determine the availability and cost savings, we compare the predictions against the actual capacity and the optimal, required capacity. This required capacity is inferred based on whether your instances were running at a higher or lower value than the target value for scaling metric that you defined as part of the predictive scaling policy configuration. For example, if an Auto Scaling group is running 10 instances at 20% CPU Utilization while the target defined in predictive scaling policy is 40%, then the instances are running under-utilized by 50% and the required capacity is assumed to be 5 instances (half of your current capacity). For an Auto Scaling group, based on the time range in which you’re interested (two weeks as default), we aggregate the cost saving and availability impact of predictive scaling. The availability impact measures for the amount of time that the actual metric value was higher than the target value that you defined to be optimal for each policy. Similarly, cost savings measures the aggregated savings based on the capacity utilization of the underlying Auto Scaling group for each defined policy. The final cost and availability will lead us to a recommendation based on:
- If availability increases (or remains same) and cost reduces (or remains same), then switch on Forecast and Scale
- If availability reduces, then disable predictive scaling
- If availability increase comes at an increased cost, then the customer should take the call based on their cost-availability tradeoff threshold
 Figure 1: Predictive Scaling Recommendations on EC2 Auto Scaling console
The preceding figure shows how the console reflects the recommendation for a predictive scaling policy. You get information on whether the policy can lead to higher availability and lower cost, which leads to a recommendation to switch to Forecast and Scale. To achieve this cost saving, you might have to lower your minimum capacity and aim for higher utilization in dynamic scaling policies.
To get the most value from this feature, we recommend that you create multiple predictive scaling policies in Forecast Only mode with different configurations, choosing different metrics and/or different target values. Target value is an important lever that changes how aggressive the capacity forecasts must be. A lower target value increases your capacity forecast resulting in better availability for your application. However, this also means more dollars to be spent on the Amazon EC2 cost. Similarly, a higher target value can leave you under-scaled while reactive scaling bridges the gap in just a few minutes. Separate estimates of cost and availability impact are provided for each of the predictive scaling policies. We recommend using a policy if either availability or cost are improved and the other variable improves or stays the same. As long as there is a predictable pattern, Auto Scaling enhanced with predictive scaling maintains high availability for your applications.
Continuous Monitoring of predictive scaling
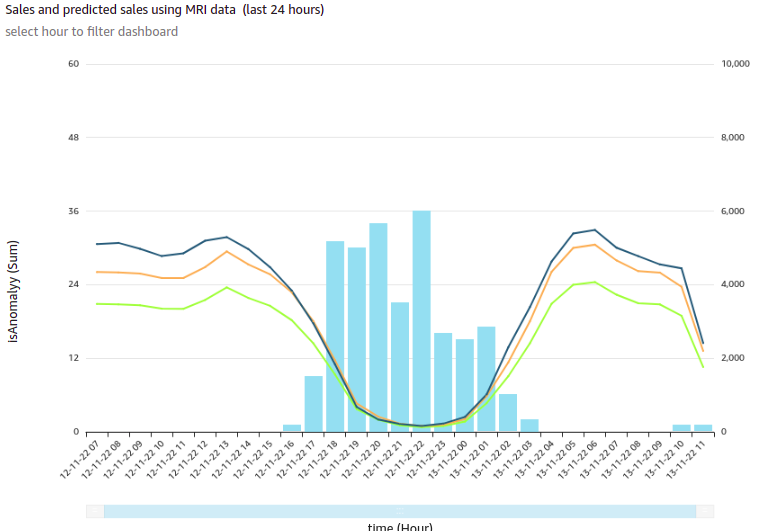
Once you’re using a predictive scaling policy in Forecast and Scale mode based on the recommendation, you must monitor the predictive scaling policy for demand pattern changes or inaccurate predictions. We introduced two new CloudWatch Metrics for predictive scaling called ‘PredictiveScalingLoadForecast’ and ‘PredictiveScalingCapacityForecast’. Using CloudWatch mertic math feature, you can create a customized metric that measures the accuracy of predictions. For example, to monitor whether your policy is over or under-forecasting, you can publish separate metrics to measure the respective errors. In the following graphic, we show how the metric math expressions can be used to create a Mean Absolute Error for over-forecasting on the load forecasts. Because predictive scaling can only increase capacity, it is useful to alert when the policy is excessively over-forecasting to prevent unnecessary cost. Figure 2: Graphing an accuracy metric using metric math on CloudWatch
In the previous graph, the total CPU Utilization of the Auto Scaling group is represented by m1 metric in orange color while the predicted load by the policy is represented by m2 metric in green color. We used the following expression to get the ratio of over-forecasting error with respect to the actual value.
IF((m2-m1)>0, (m2-m1),0))/m1
Next, we will setup an alarm to automatically send notifications using Amazon Simple Notification Service (Amazon SNS). You can create similar accuracy monitoring for capacity forecasts, but remember that once the policy is in Forecast and Scale mode, it already starts influencing the actual capacity. Hence, putting alarms on load forecast accuracy might be more intuitive as load is generally independent of the capacity of an Auto Scaling group.
 Figure 3: Creating a CloudWatch Alarm on the accuracy metric
In the above screenshot, we have set an alarm that triggers when our custom accuracy metric goes above 0.02 (20%) for 10 out of last 12 data points which translates to 10 hours of the last 12 hours. We prefer to alarm on a greater number of data points so that we get notified only when predictive scaling is consistently giving inaccurate results.
Conclusion
With these new features, you can make a more informed decision about whether predictive scaling is right for you and which configuration makes the most sense. We recommend that you start off with Forecast Only mode and switch over to Forecast and Scale based on the recommendations. Once in Forecast and Scale mode, predictive scaling starts taking proactive scaling actions so that your instances are launched and ready to contribute to the workload in advance of the predicted demand. Then continuously monitor the forecast to maintain high availability and cost optimization of your applications. You can also use the new predictive scaling metrics and CloudWatch features, such as metric math, alarms, and notifications, to monitor and take actions when predictions are off by a set threshold for prolonged periods.


 Synthesis time: 3.05s
 DevUsersStack
 Deployment failed: Error: Stack Deployments Failed: Error: The stack
named DevUsersStack failed creation, it may need to be manually deleted
from the AWS console:
ROLLBACK_COMPLETE:
User: arn:aws:sts::123456789012:assumed-role/cdk-hnb659fds-cfn-exec-role-123456789012-ap-southeast-2/AWSCloudFormation
is not authorized to perform: config:PutConfigRule on resource: access-keys-policy with an explicit deny in a
permissions boundary
 Deployment failed: Error: Stack Deployments Failed: Error: The stack
named DevUsersStack failed creation, it may need to be manually deleted
from the AWS console:
  ROLLBACK_COMPLETE:
    User: arn:aws:sts::123456789012:assumed-role/cdk-hnb659fds-cfn-exec-role-123456789012-ap-southeast-2/AWSCloudFormation
    is not authorized to perform: config:PutConfigRule on resource: access-keys-policy with an explicit deny in a
    permissions boundary


 Jeremy “Jez” Bristow is Head of Product at Green Flag. He has been working at Green Flag, part of Direct Line Group, for over 4 years and has been co-responsible for delivering the digital transformation programme within Green Flag. They have built a cloud-based ecosystem of micro-services supported by a data platform within AWS to enable the delivery of better customer outcomes to grow their business.


 Dorothy Li is Convoy’s CTO, overseeing Convoy’s Product and Engineering group and technology strategy, shaping and scaling the company’s innovation and industry-defining technology platforms. Prior to Convoy, Dorothy held leadership roles at Amazon, most recently as Vice President of BI and Analytics at AWS. During her more than 20 years at Amazon, Dorothy helped build out Amazon’s ecommerce platform and also led and collaborated on products that had visibly impacted customers around the world – from the initial launch of Amazon Prime, to Kindle, and at AWS where she focused on data analytics and BI. Dorothy received her Bachelor of Science at Brigham Young University and studies at Shanghai International Studies University.