Post Syndicated from Grab Tech original https://engineering.grab.com/transforming-the-analytics-landscape-with-RAG-powered-LM
Introduction
Retrieval-Augmented Generation (RAG) is a powerful process that is designed to integrate direct function calling to answer queries more efficiently by retrieving relevant information from a broad database. In the rapidly evolving business landscape, Data Analysts (DAs) are struggling with the growing number of data queries from stakeholders. The conventional method of manually writing and running similar queries repeatedly is time-consuming and inefficient. This is where RAG-powered Large Language Models (LLMs) step in, offering a transformative solution to streamline the analytics process and empower DAs to focus on higher value tasks.
In this article, we will share how the Integrity Analytics team has built out a data solution using LLMs to help automate tedious analytical tasks like generating regular metric reports and performing fraud investigations.
While LLMs are known for their proficiency in data interpretation and insight generation, they represent just a fragment of the entire solution. For a comprehensive solution, LLMs must be integrated with other essential tools. The following is required in assembling a solution:
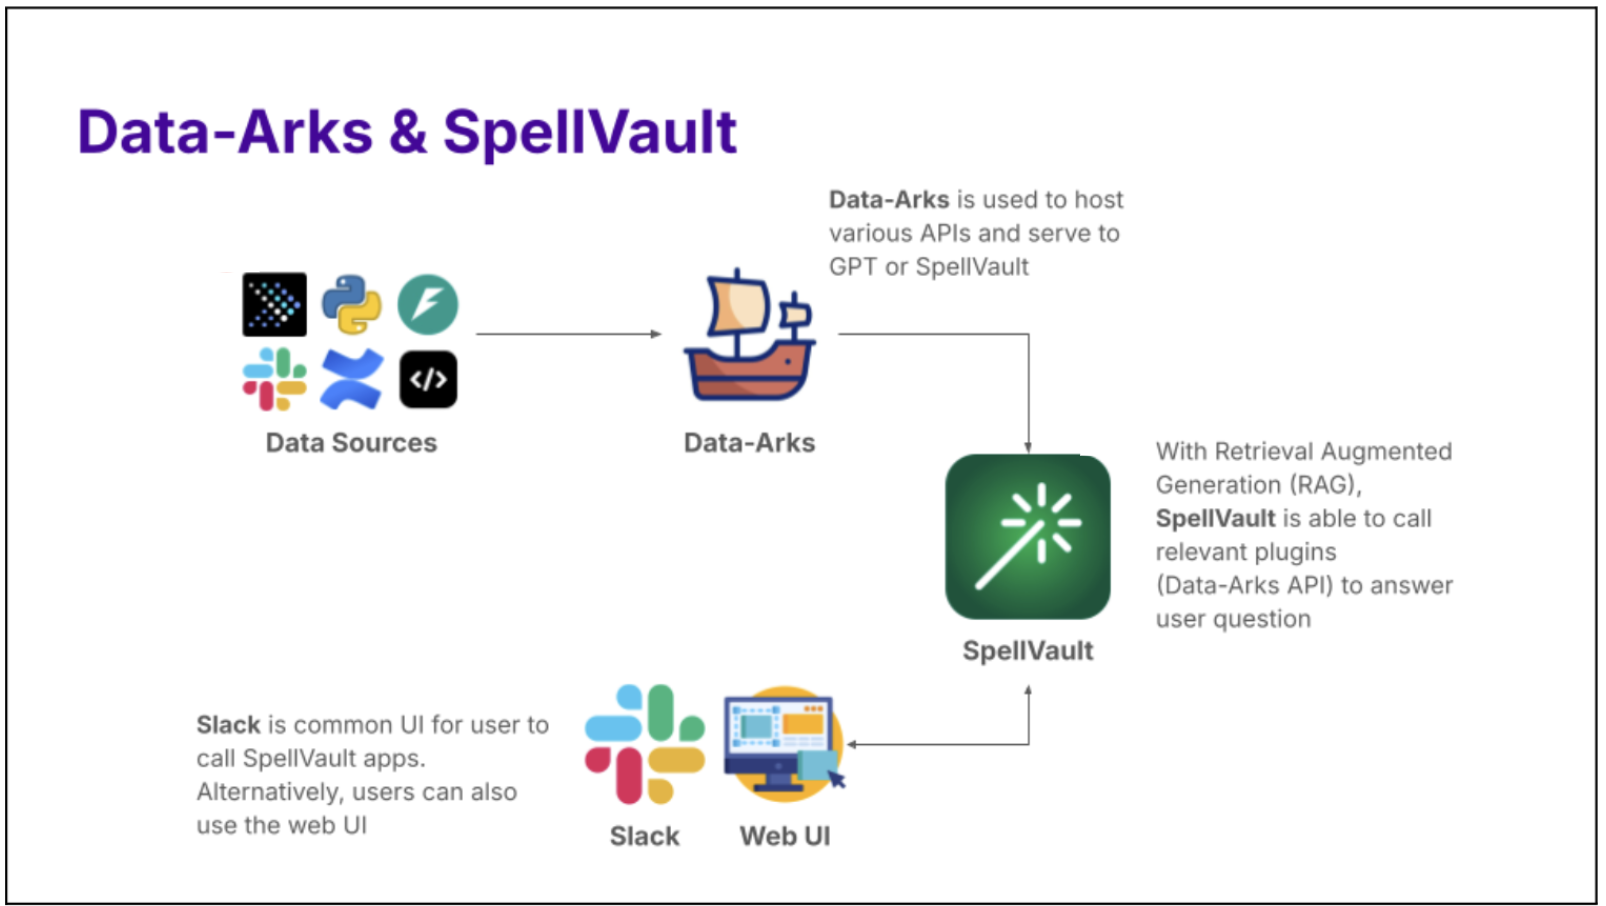
- Internally facing LLM tool – Spellvault is a platform within Grab that stores, shares, and refines LLM prompts. It features low/no-code RAG capabilities that lower the barrier of entry for people to create LLM applications.
- Data – with real time or close to real-time latency to ensure accuracy. It has to be in a standardised format to ensure that all LLM data inputs are accurate.
- Scheduler – runs LLM applications at regular intervals. Useful for automating routine tasks.
- Messaging Tool – a user interface where users can interact with LLM by entering a command to receive reports and insights.
Introducing Data-Arks, the data middleware serving up relevant data to the LLM agents
For most data use cases, DAs are usually running the same set of SQL queries with minor changes to parameters like dates, age or other filter conditions. In most instances, we already have a clear understanding of the required data and format to accomplish a task. Therefore, we need a tool that can execute the exact SQL query and channel the data output to the LLM.
What is Data-Arks?
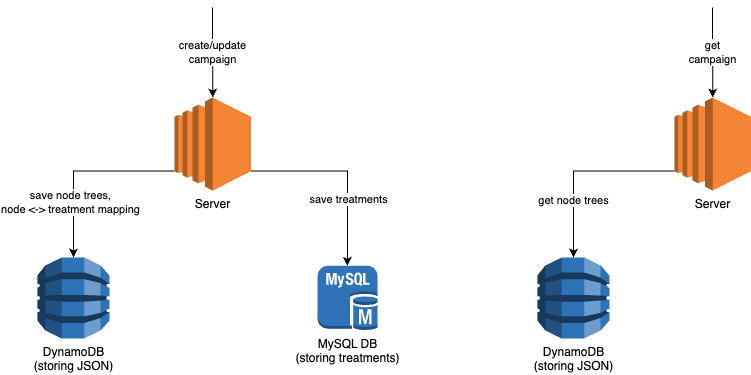
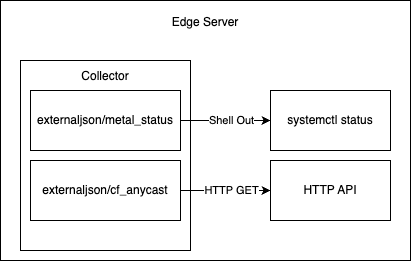
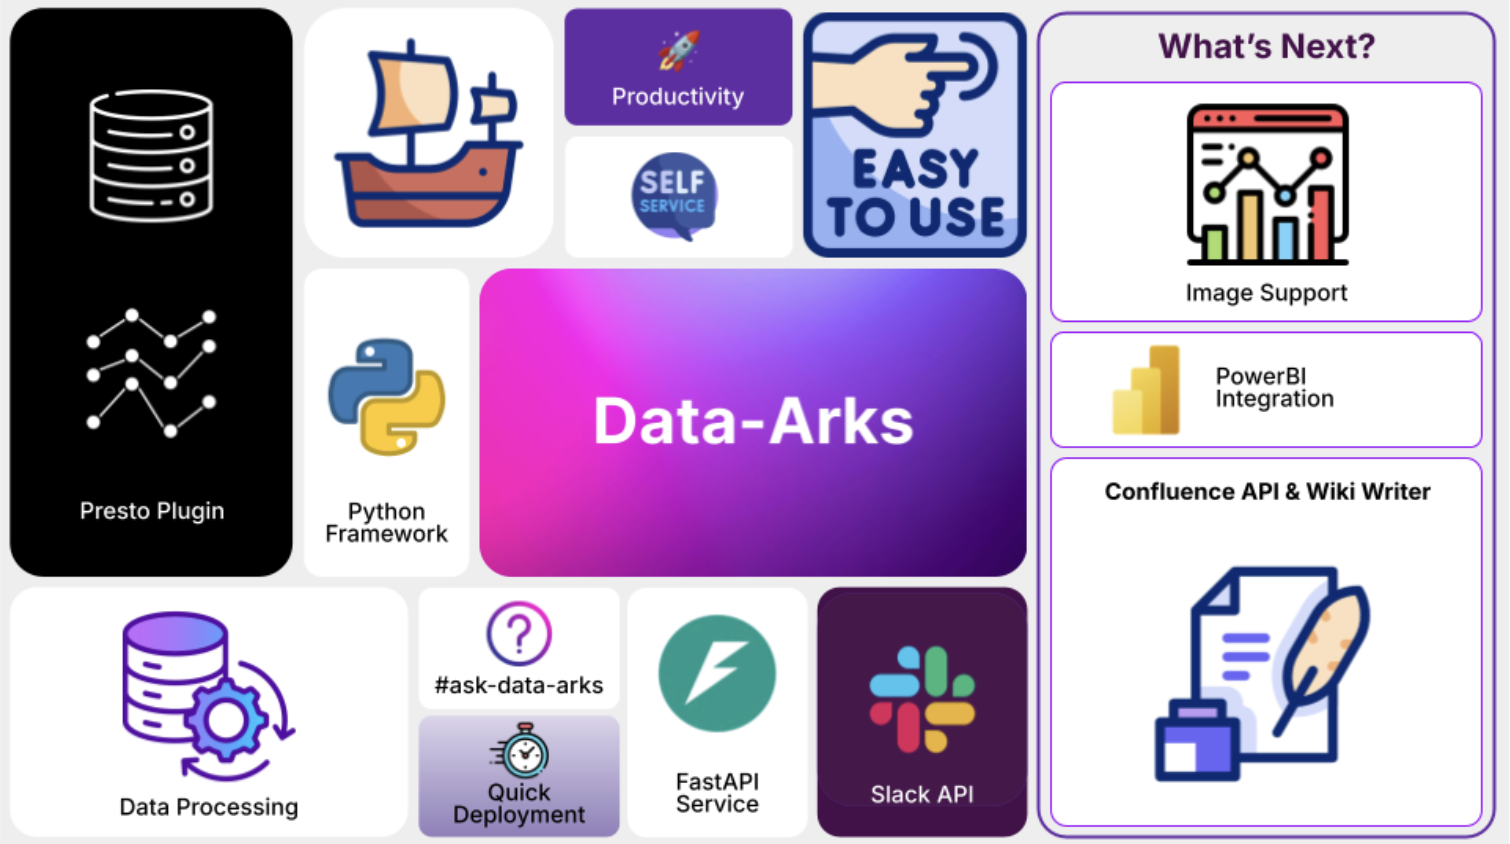
Data-Arks is an in-house Python-based API platform housing several frequently used SQL queries and python functions packaged into individual APIs. Data-Arks is also integrated with Slack, Wiki, and JIRA APIs, allowing users to parse and fetch information and data from these tools as well. The benefits of Data-Arks are summarised as follows:
-
Integration: Data-Arks service allows users to upload any SQL query or Python script on the platform. These queries are then surfaced as APIs, which can be called to serve data to the LLM agent.
-
Versatility: Data-Arks can be extended to everyone. Employees from various teams and functions at Grab can self-serve to upload any SQL query that they want onto the platform, allowing this tool to be used for different teams’ use cases.
Automating regular report generation and summarisation using Data-Arks and Spellvault
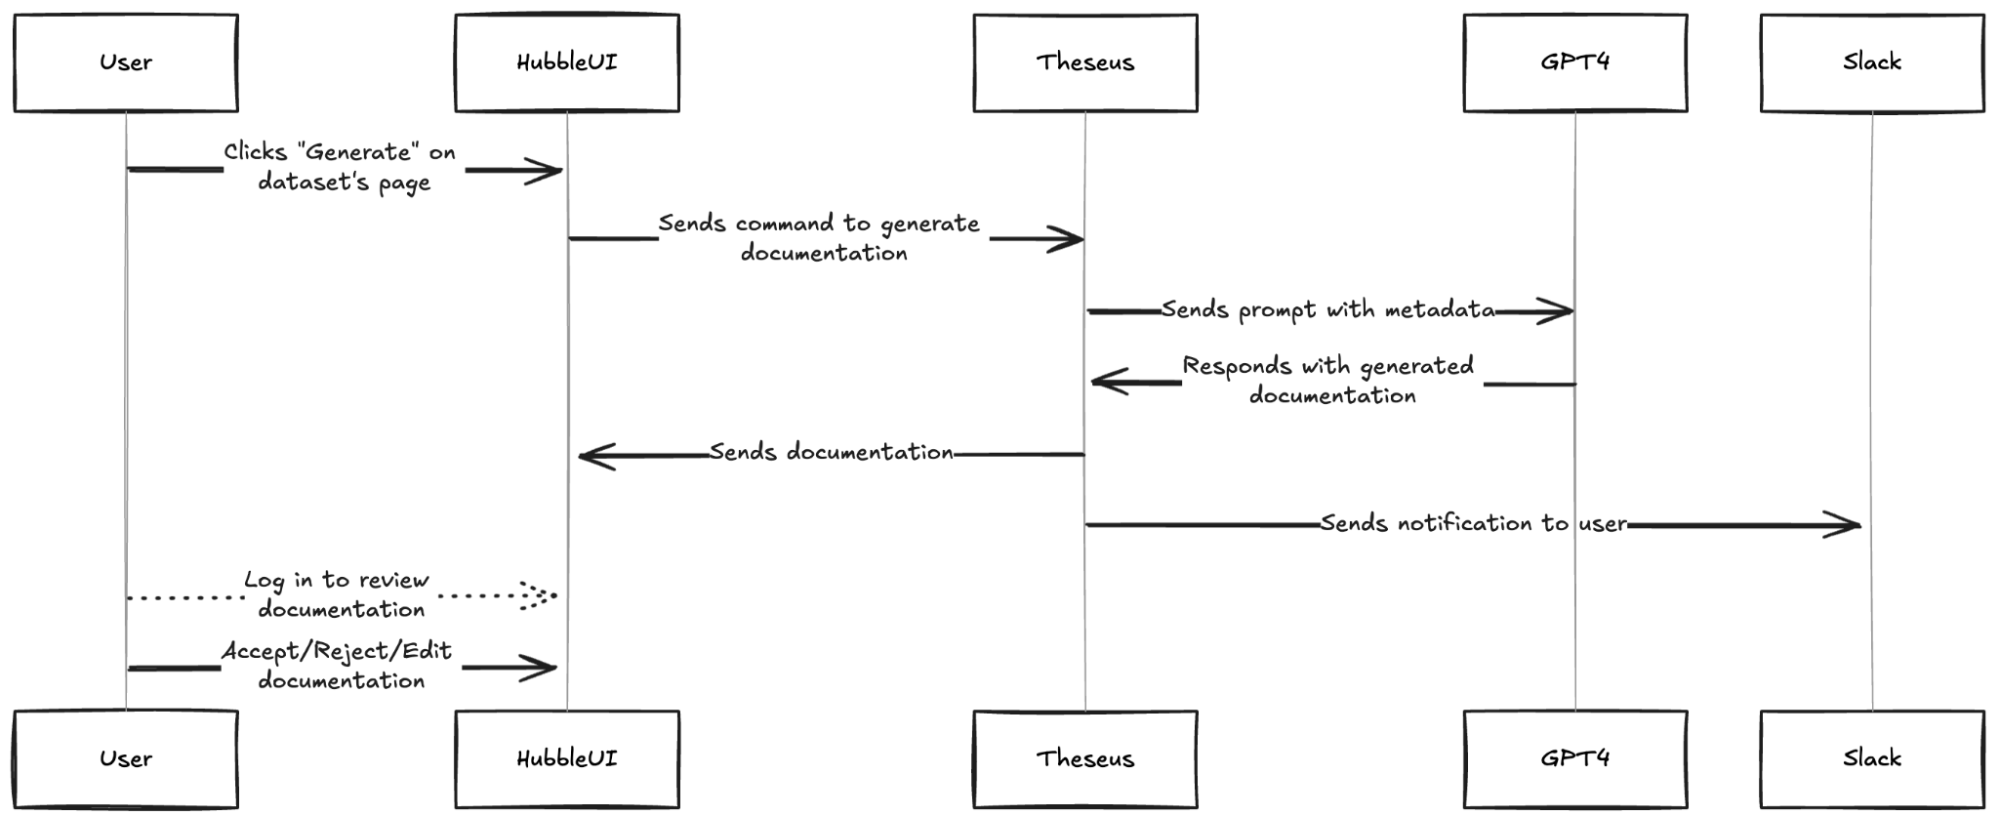
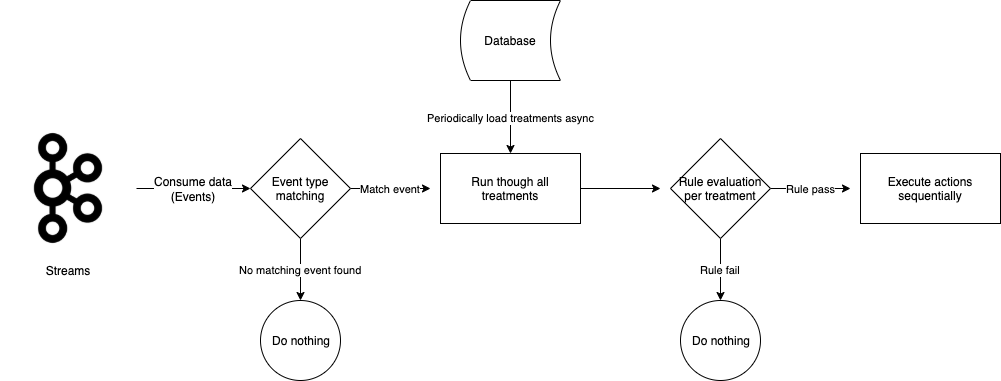
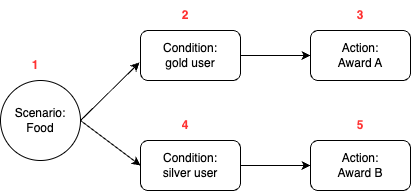
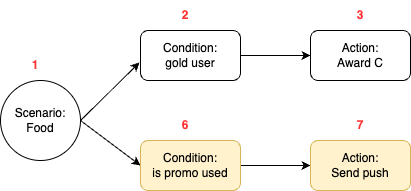
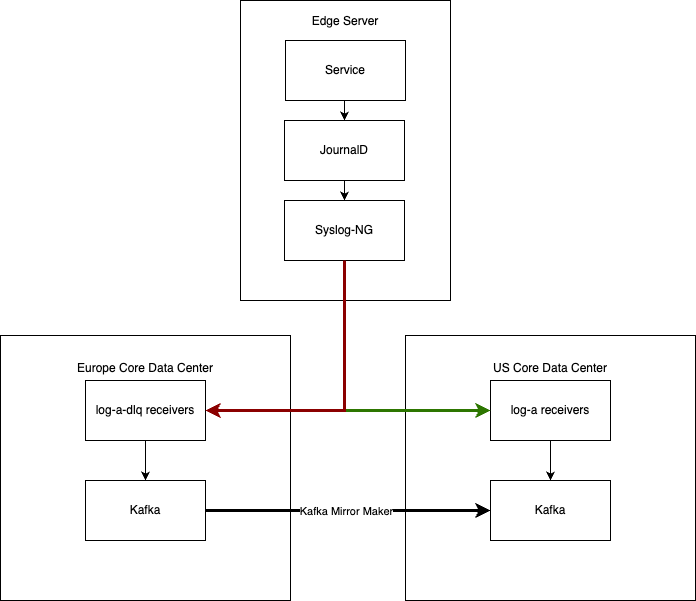
LLMs are just one piece of the puzzle, to build a comprehensive solution, they must be integrated with other tools. Figure 2 shows how different tools are used in executing report summaries in Slack.
Figure 2 shows how different tools are used in executing report summaries in Slack.
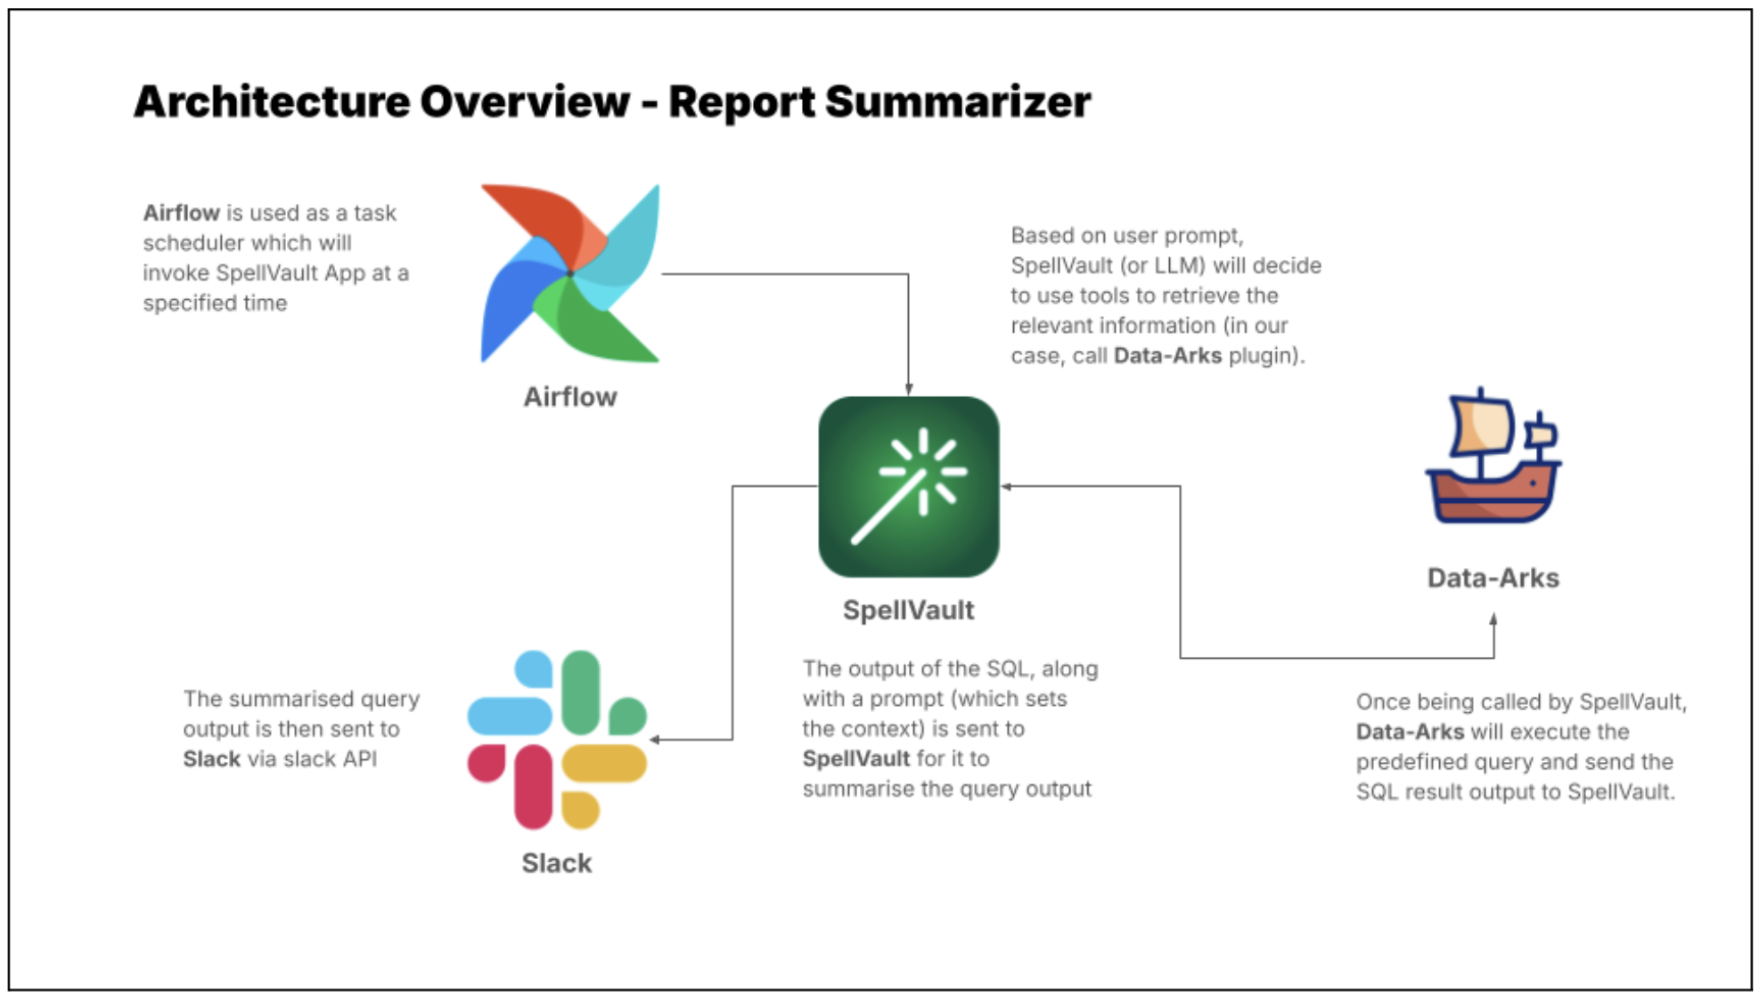
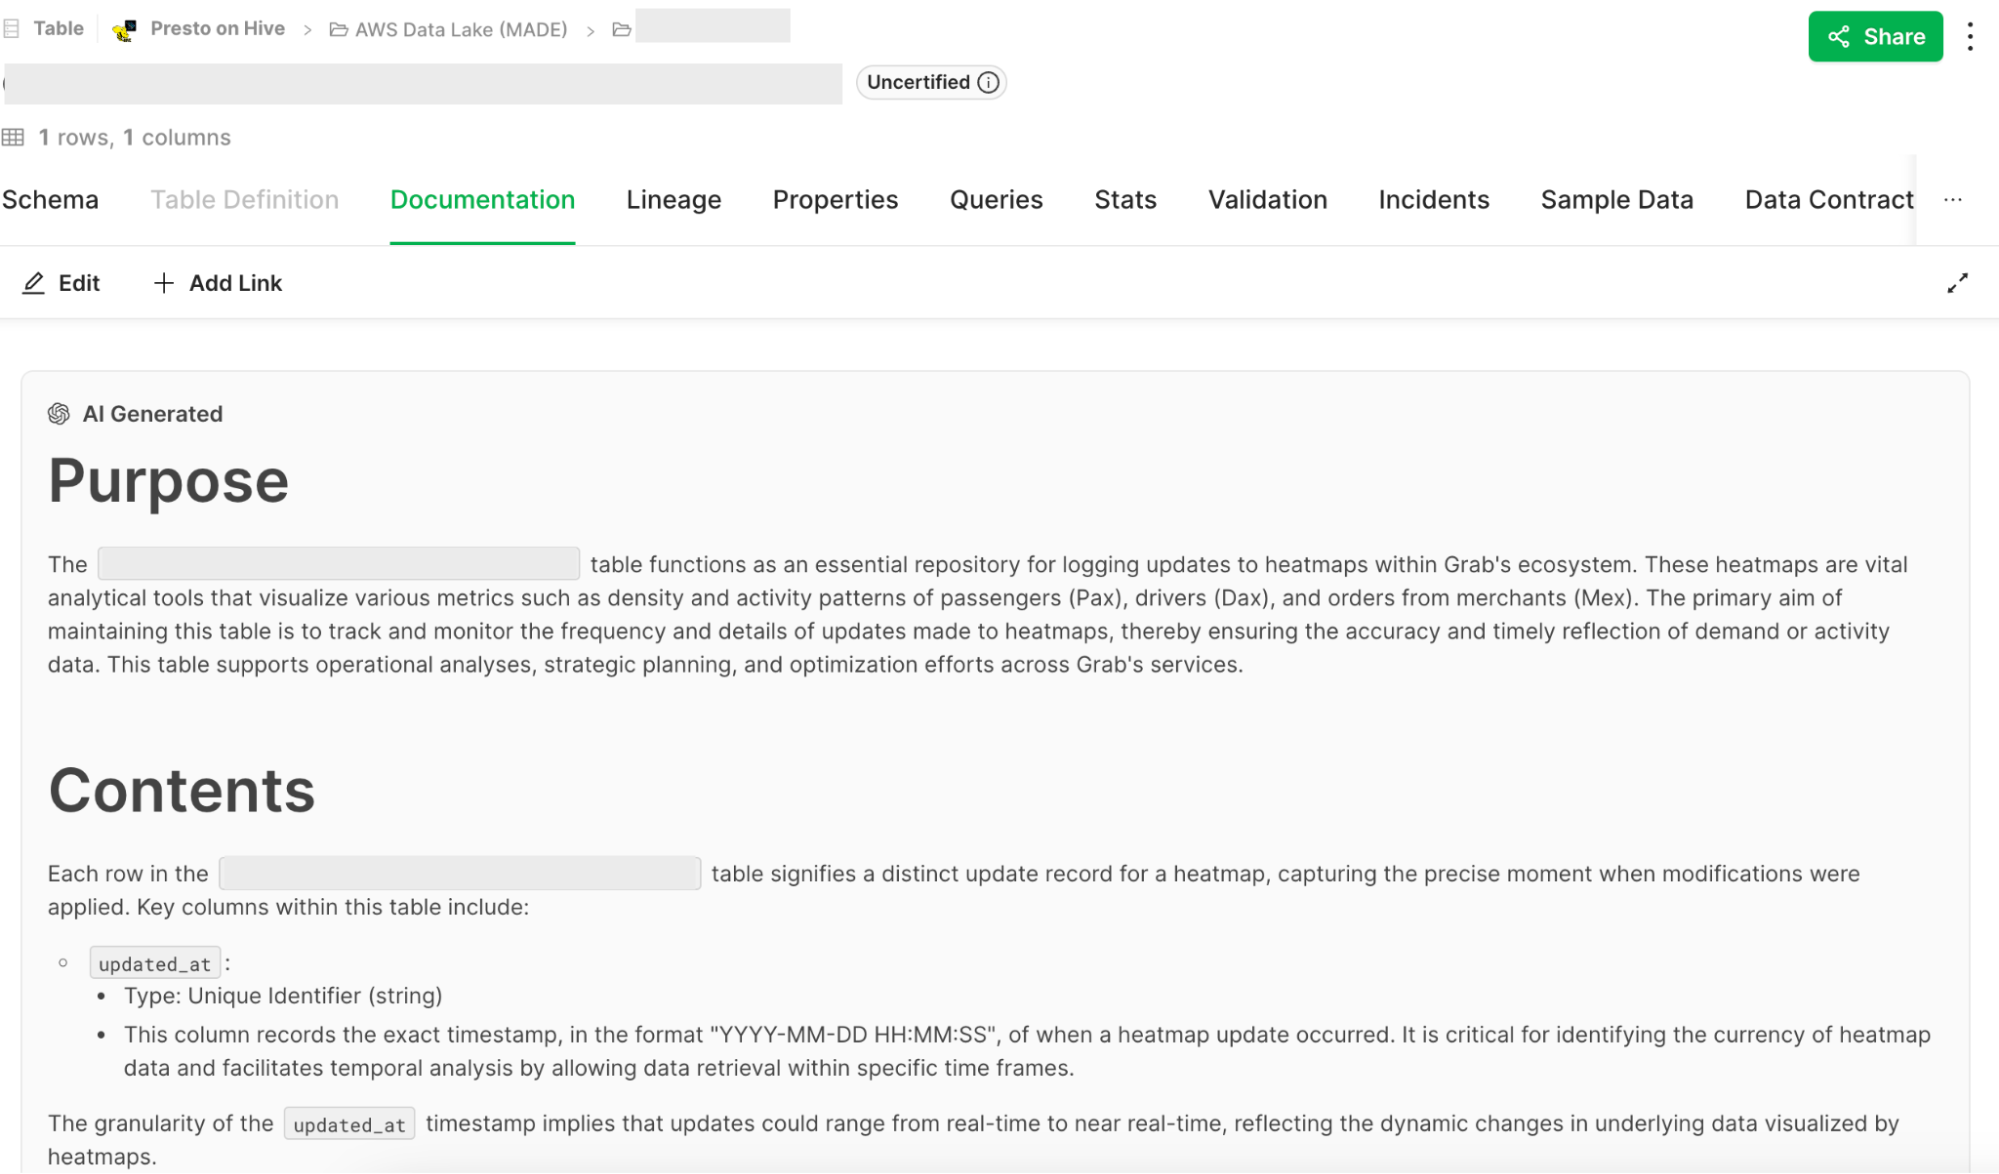
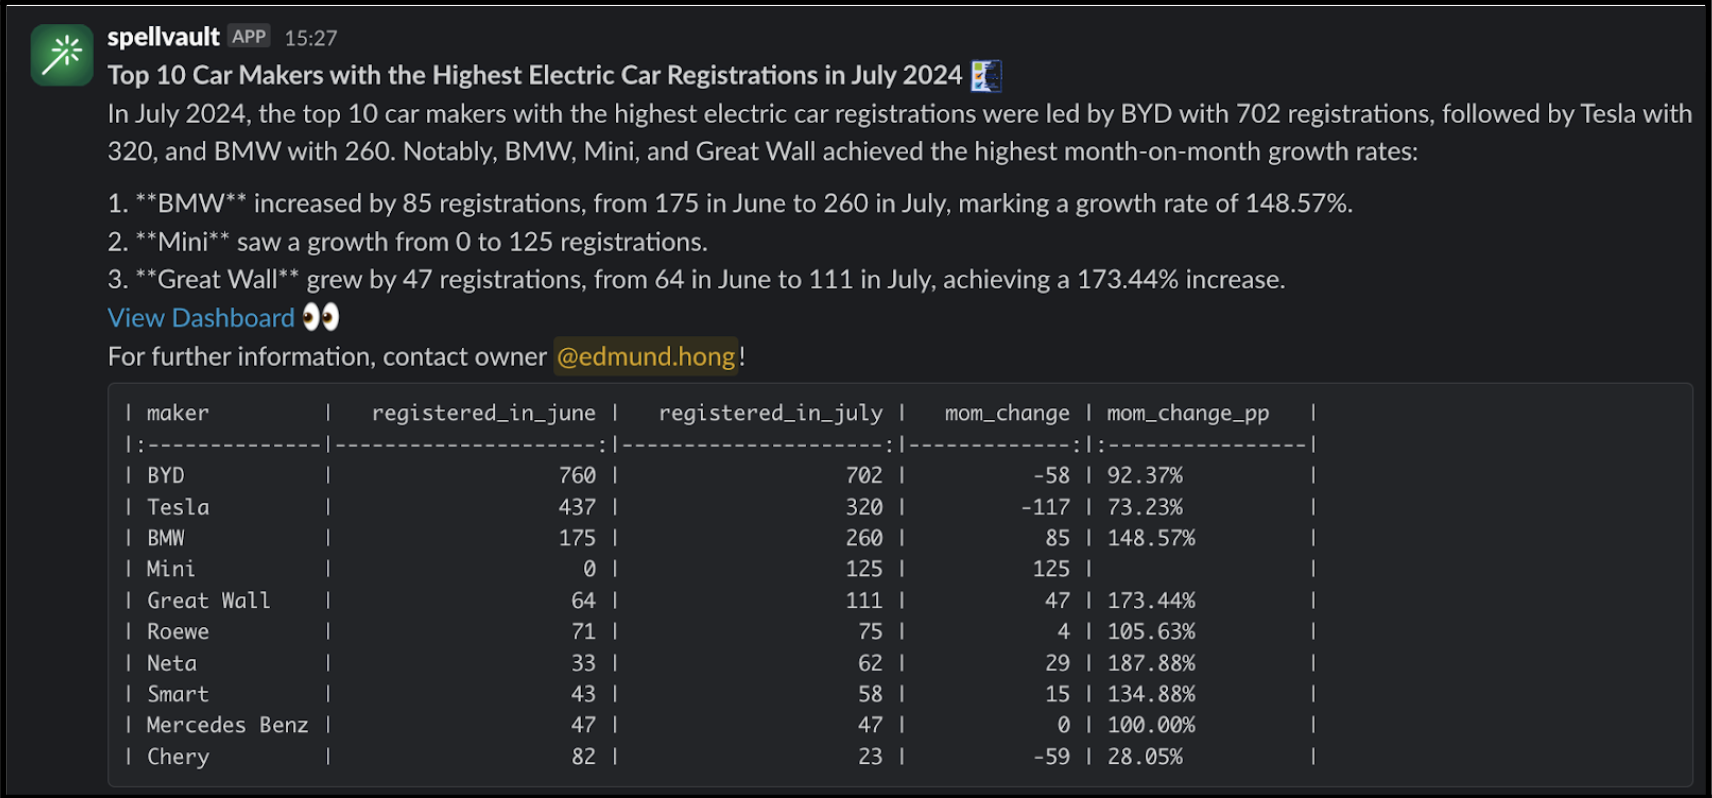
Figure 3 is an example of a summarised report generated by the Report Summarizer using dummy data. Report Summarizer calls a Data-Arks API to generate the data in a tabular format and LLM helps summarise and generate a short paragraph of key insights. This automated report generation has helped save an estimated 3-4 hours per report.
LLM bots for fraud investigations
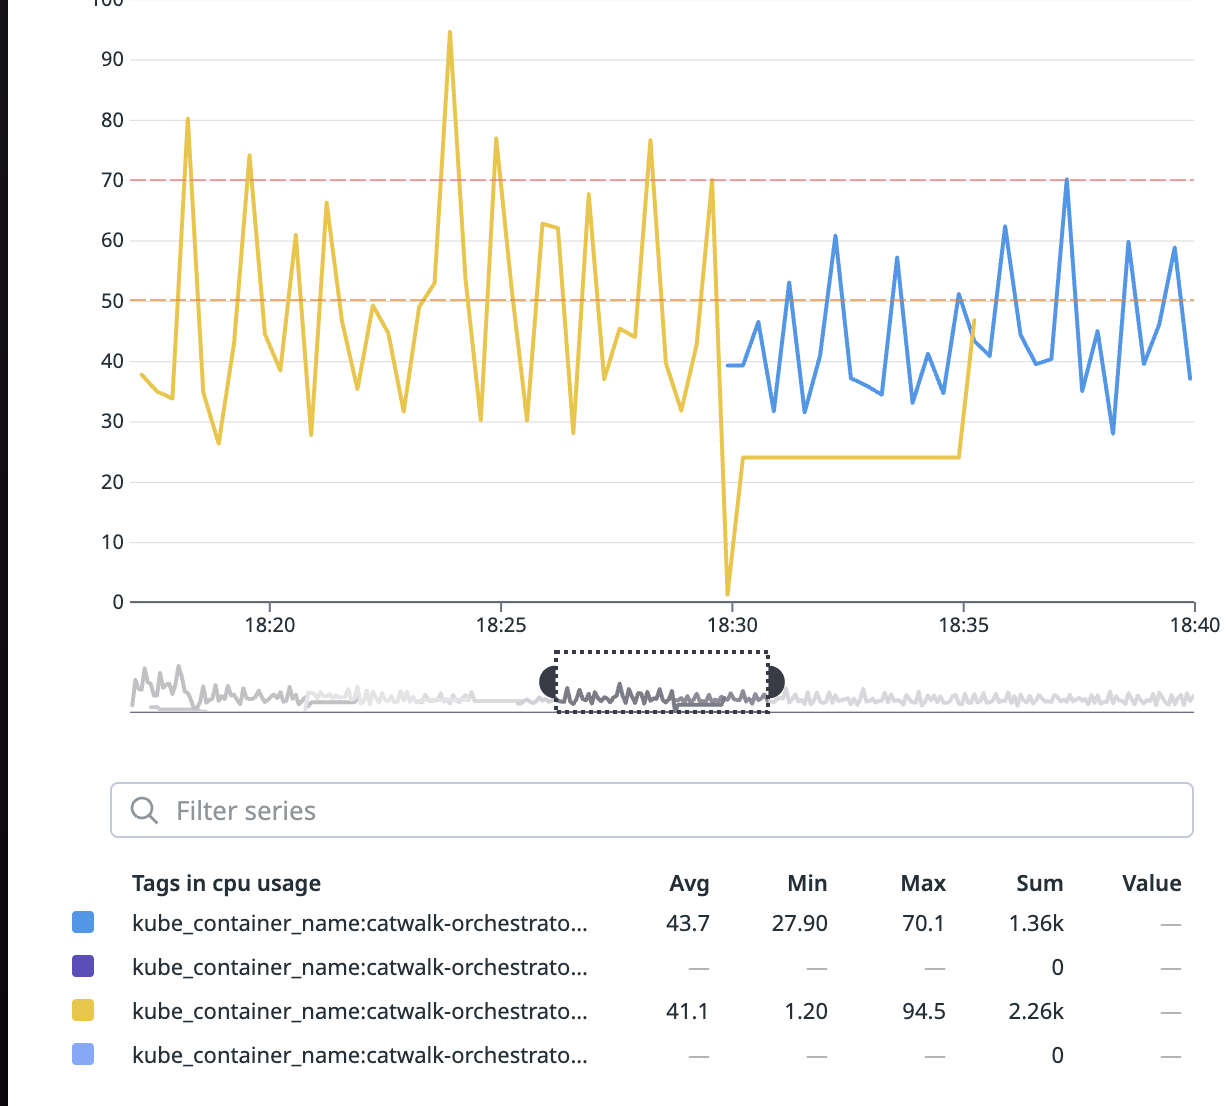
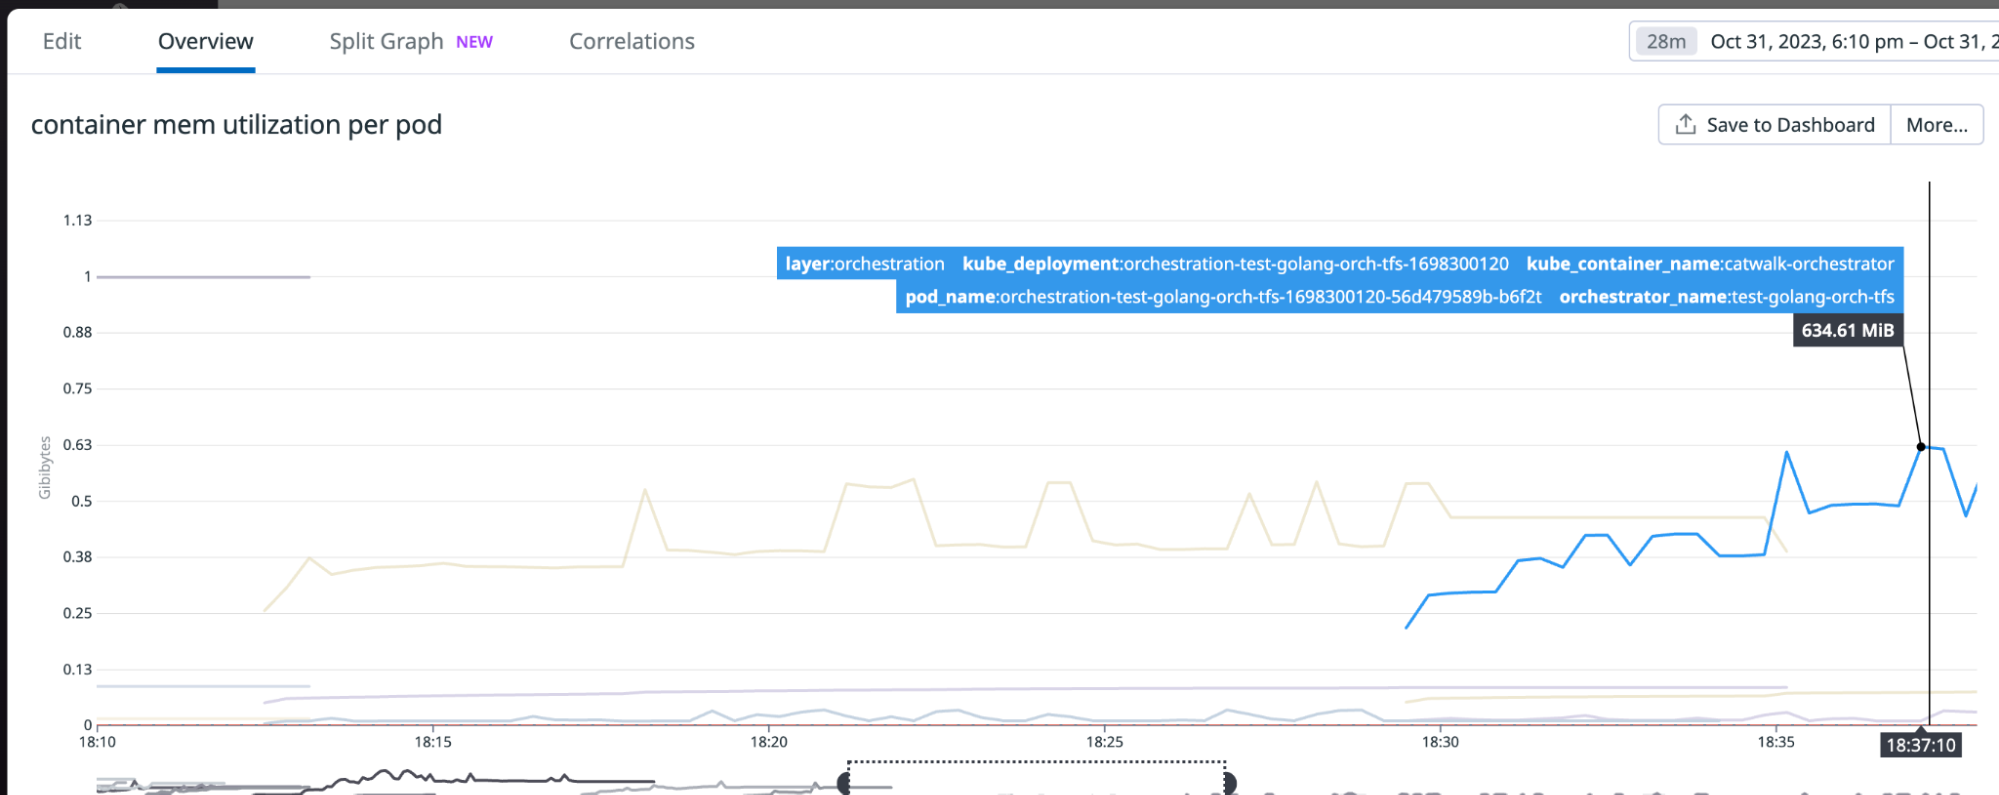
LLMs also excel in helping to streamline fraud investigations, as LLMs are able to contextualise several different data points and information and derive useful insights from them.
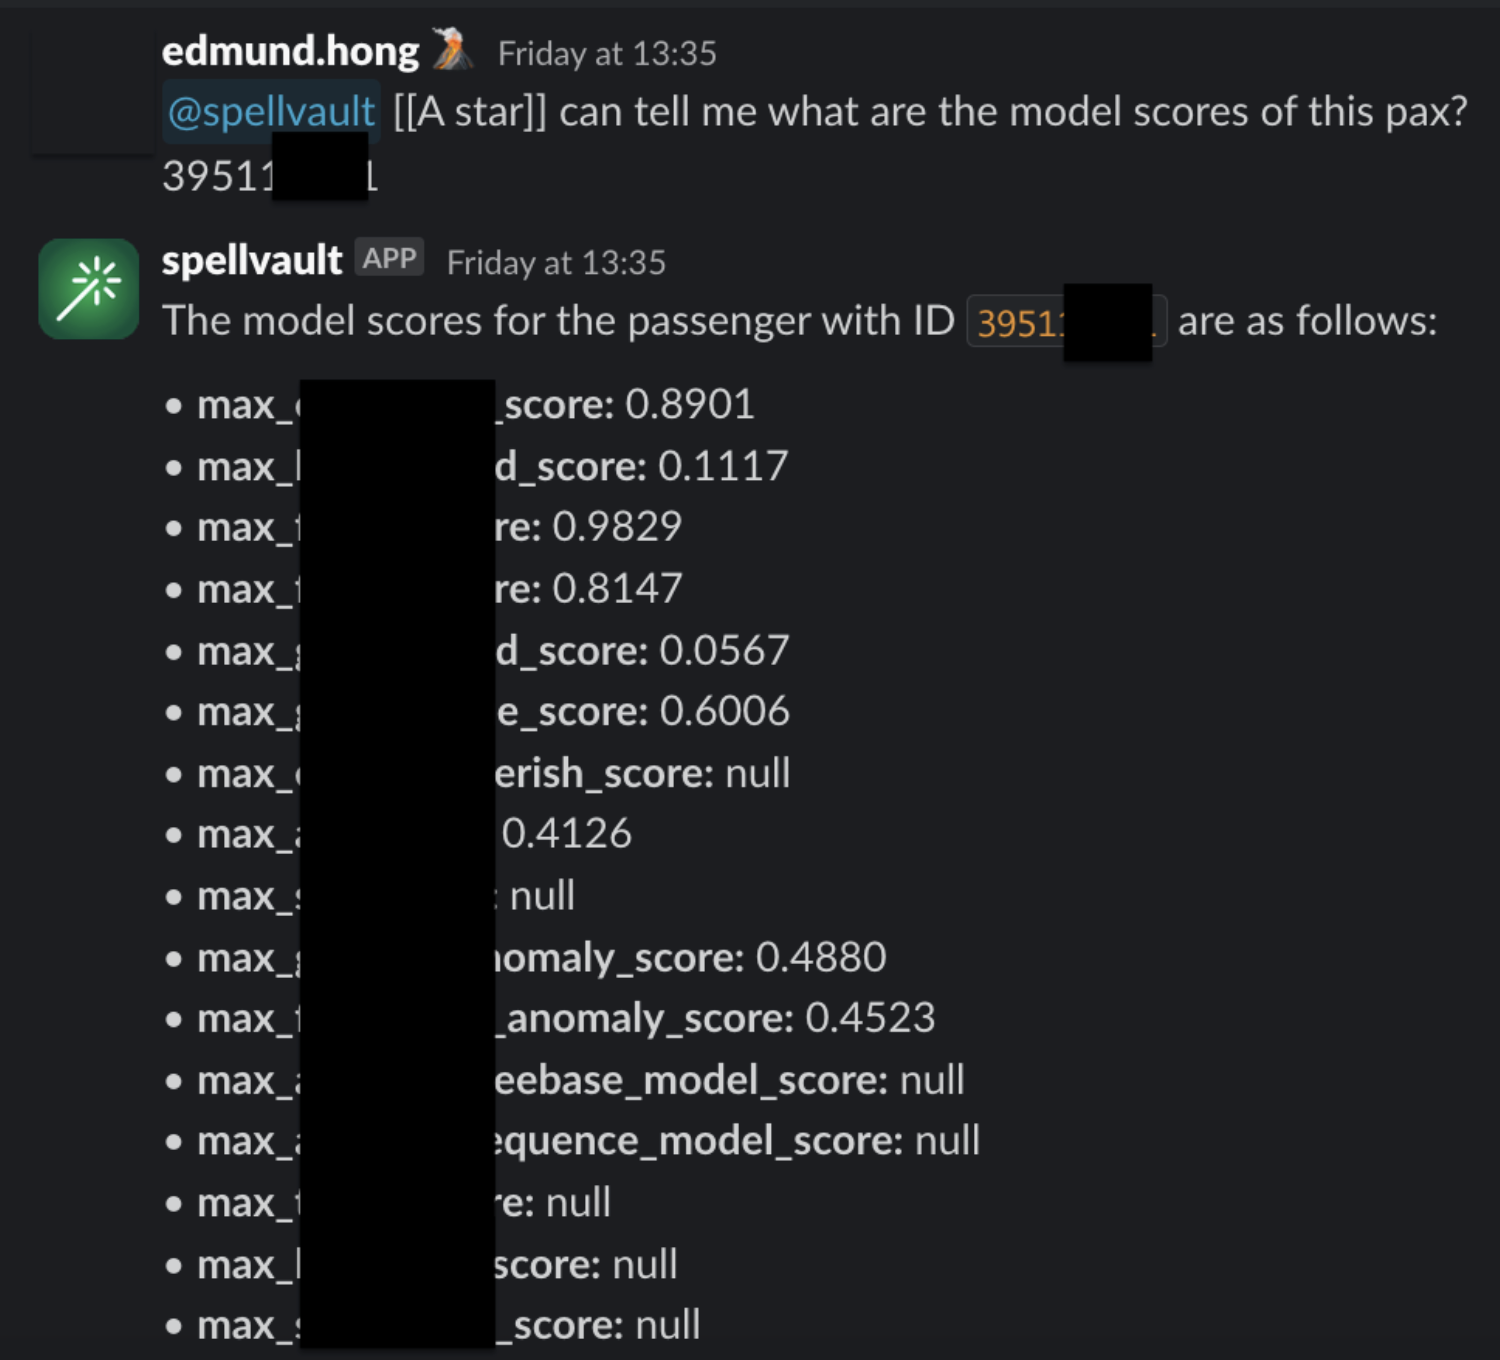
Introducing A* bot, the team’s very own LLM fraud investigation helper.
A set of frequently used queries for fraud investigation is made available as Data-Arks APIs. Upon a user prompt or query, SpellVault selects the most relevant queries using RAG, executes them and provides a summary of the results to users through Slack.
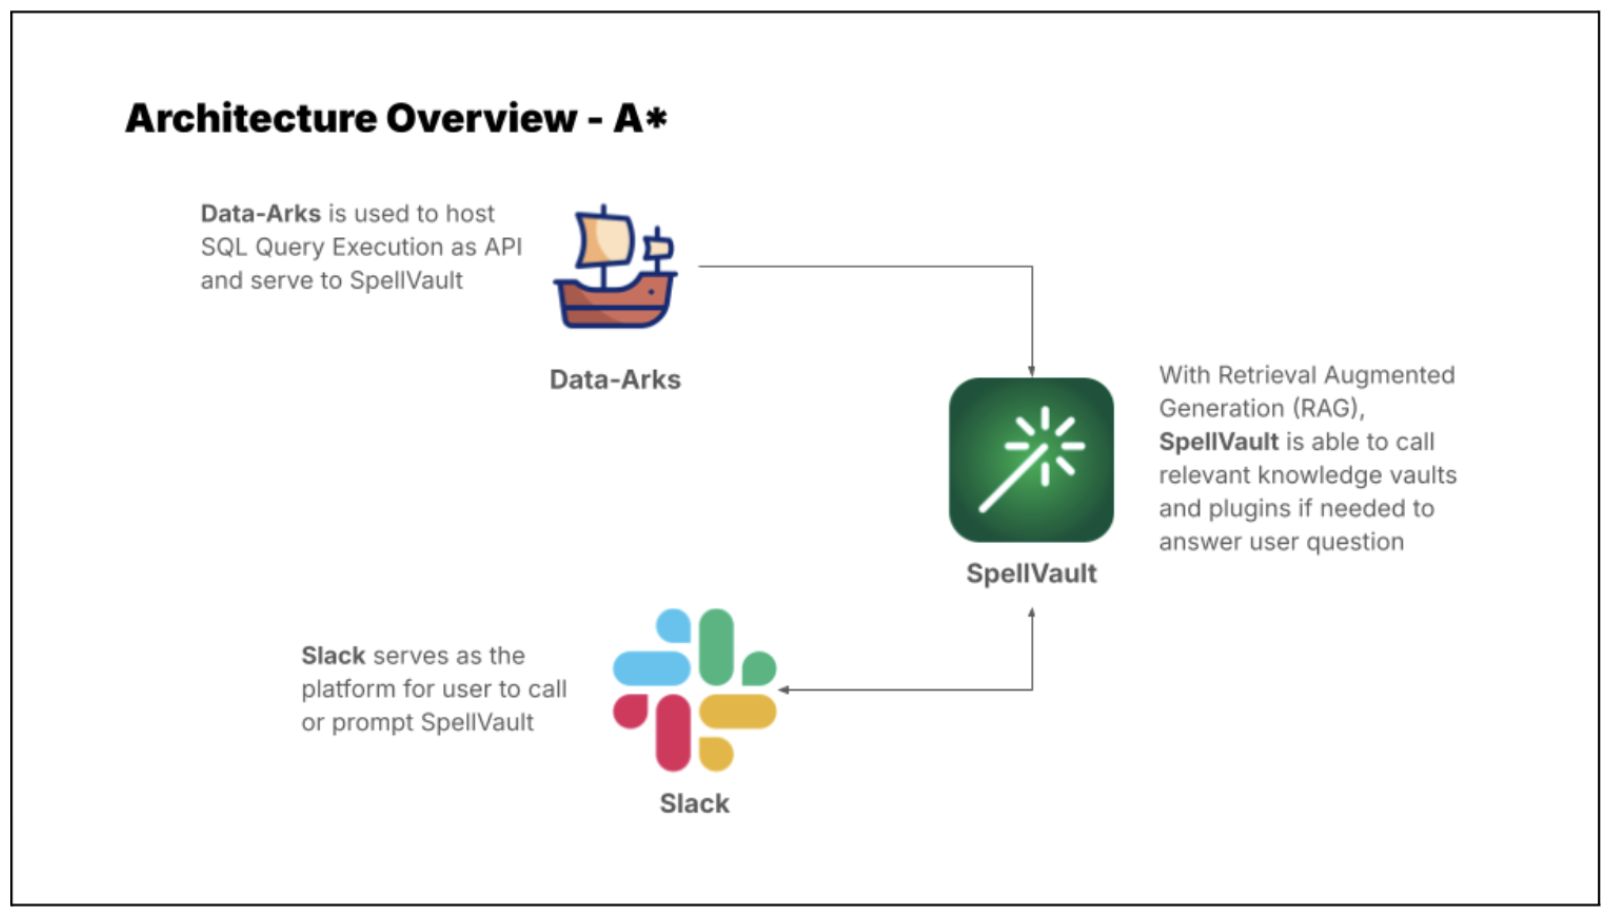
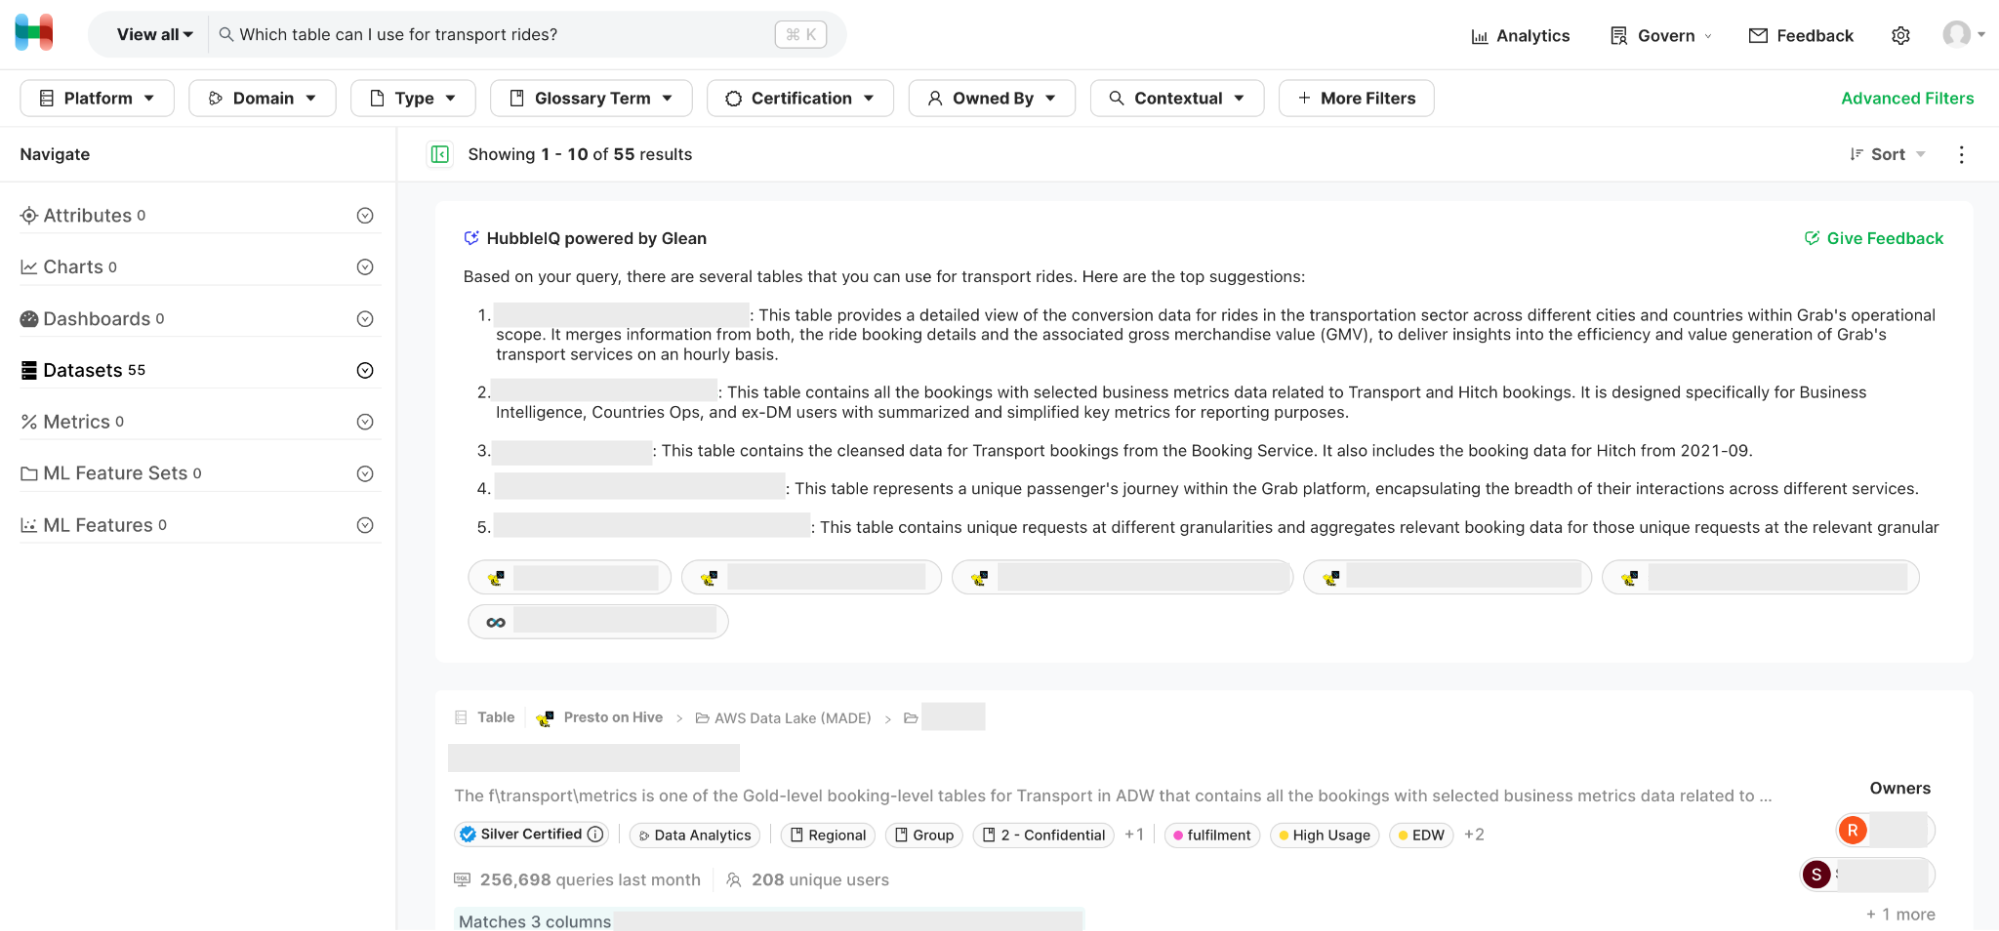
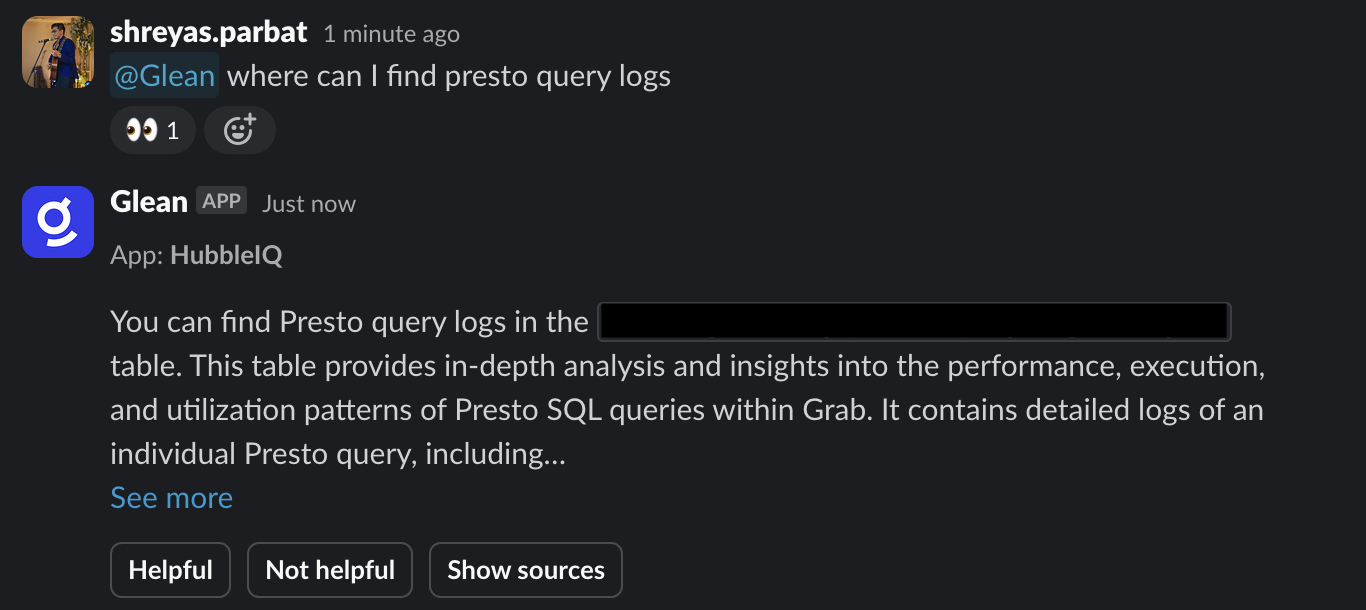
Figure 5 shows a sample of fraud investigation responses from A* bot. Scaling to multiple queries for a fraud investigation process, what was once a time-consuming fraud investigation can now be reduced to a matter of minutes, as the A* bot is capable of providing all the necessary information simultaneously.
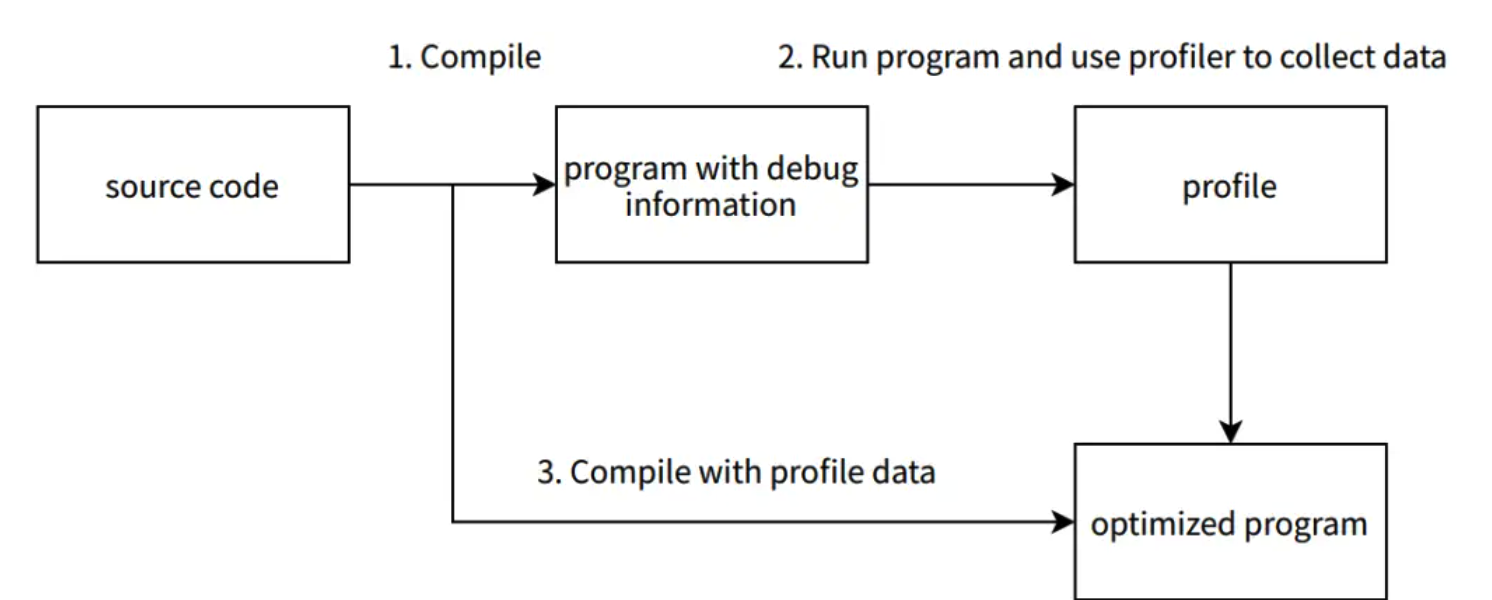
RAG vs fine-tuning
On deciding between RAG or fine-tuning to improve LLM accuracy, three key factors tipped the scales in favour of the RAG approach:
-
Effort and cost considerations
Fine-tuning requires significant computational cost as it involves taking a base model and further training it with smaller, domain specific data and context. RAG is computationally less expensive as it relies on retrieving only relevant data and context to augment a model’s response. As the same base model can be used for different use cases, RAG is the preferred choice due to its flexibility and cost efficiency. -
Ability to respond with the latest information
Fine-tuning requires model re-training with each new information update, whereas RAG simply retrieves required context and data from a knowledge base to enhance its response. Thus, by using RAG, LLM is able to answer questions using the most current information from our production database, eliminating the need for model re-training. -
Speed and scalability
Without the burden of model re-training, the team can rapidly scale and build out new LLM applications with a well managed knowledge base.
What’s next?
The potential of using RAG-powered LLM can be limitless as the ability of GPT is correlated with the tools it equips. Hence, the process does not stop here and we will try to onboard more tools or integration to GPT. In the near future, we plan to utilise Data-Arks to provide images to GPT as GPT-4o is a multimodal model that has vision capabilities. We are committed to pushing the boundaries of what’s possible with RAG-powered LLM, and we look forward to unveiling the exciting advancements that lie ahead.
We would like to express our sincere gratitude to the following individuals and teams whose invaluable support and contributions have made this project a reality:
– Meichen Lu, a senior data scientist at Grab, for her guidance and assistance in building the MVP and testing the concept.
– The data engineering team, particularly Jia Long Loh and Pu Li, for setting up the necessary services and infrastructure.
Join us
Grab is the leading superapp platform in Southeast Asia, providing everyday services that matter to consumers. More than just a ride-hailing and food delivery app, Grab offers a wide range of on-demand services in the region, including mobility, food, package and grocery delivery services, mobile payments, and financial services across 700 cities in eight countries.
Powered by technology and driven by heart, our mission is to drive Southeast Asia forward by creating economic empowerment for everyone. If this mission speaks to you, join our team today!