If you’ve spent any time sourcing, evaluating, or speculating about cloud services in the public sector lately, you’ve likely felt it: the arms race happening in compliance. Courting customers from schools to statehouses to national labs, more and more cloud vendors are racing to pin the next security badge to their lapel—GovRAMP (formerly known as StateRAMP), TX-RAMP, FedRAMP, SOC 2, and on and on.
And while it might feel like a compliance bingo card, there’s real strategy and real consequences behind this sprint. At the heart of it all is the SLED market (state and local government, and education)—a sprawling patchwork of institutions tasked with safeguarding citizen data and taxpayer trust, all while operating with limited resources and infrastructure budgets.
Let’s talk about why this compliance arms race exists, what it means for buyers and vendors alike, and how we at Backblaze are choosing to compete not just with checkboxes, but with character.
Why does SLED even need unified standards?
Public sector IT has long been a security quilt. Some agencies stitched up with advanced defenses, others more… threadbare. While some may have advanced security tooling, a K–12 school district might still be running on legacy systems and duct tape. Yet both manage data that’s increasingly digital, distributed, and vulnerable.
The result? Inconsistent practices and rising risks. Enter: GovRAMP.
What is GovRAMP?
Short for Government Risk and Authorization Management Program, GovRAMP was customized to standardize cloud security for state and local agencies. It’s actually based on the same set of controls for FedRAMP—controls derived from the National Institute of Standards and Technology (NIST) SP 800-53, a catalog of controls for organizations to manage cybersecurity and privacy risk. GovRAMP ensures that even the smallest public institutions can procure secure IT solutions without reinventing the wheel every time.
GovRAMP was originally launched as StateRAMP, but has since grown beyond state lines, evolving into a broader framework adopted by local governments and school systems. Today, it’s a rigorous, independent audit program that holds vendors to a high set of security controls. Translation: If a vendor is GovRAMP-authorized, they’re playing in the big leagues of cloud security.
The alphabet soup of compliance: TX-RAMP, GovRAMP, FedRAMP
If you’re in Texas, you’re probably familiar with TX-RAMP, the state’s specific compliance framework. The good news? GovRAMP and TX-RAMP are closely aligned. At Backblaze, our GovRAMP Progressing Snapshot status qualifies us for TX-RAMP Provisional Authorization as well—one less hurdle for Texas agencies seeking secure, scalable cloud storage.
As for FedRAMP, it remains the gold standard for federal data, but for the vast majority of public sector orgs, including most SLED agencies, it’s simply unnecessary.
How GovRAMP streamlines cloud sourcing
Here’s where the compliance arms race actually makes things easier: Once a vendor is authorized through GovRAMP, SLED buyers can trust that the solution meets certain security standards, saving months of one-off vetting, paperwork, and duplicated audits. In a procurement environment plagued by inefficiency, that’s no small thing.
Especially now, as budgets tighten and AI-driven everything drives demand for flexible infrastructure, reducing sourcing friction matters more than ever.
Going beyond checklists: What buyers should really look for
Checkboxes alone don’t guarantee real-world resilience. Compliance can become its own form of security theater. It looks good on paper but falls short in practice. That’s why buyers should dig deeper.
Look for vendors who not only pass audits but live and breathe their controls. That means going beyond annual assessments and embracing security as a continuous, integrated discipline. The best partners are transparent, proactive, and thoughtful about risk—not just checking boxes, but building real-world resilience. Here are a few signs to look for:
Continuous monitoring and internal audits: They treat compliance as an ongoing process, not a once-a-year scramble.
Clear, accessible documentation: Security policies, certifications, and standardized independent attestations are available (under NDA if needed), not locked in a black box.
Transparent data practices: They’re upfront about where your data lives, who can access it, and what happens in the event of an incident.
Responsive support: You can communicate with real people who understand your risk profile—not just surface-level answers or automated replies.
Affordable recoveries: They don’t make recovering your data prohibitively expensive. Look at their egress policies and price out what it would actually cost to retrieve your data.
When you’re responsible for protecting sensitive data, it’s not enough to be compliant. You need a partner who’s disciplined, trustworthy, and invested in your resilience.
The Backblaze approach: Rigor, transparency, and trust
Pursuing authorizations like GovRAMP and TX-RAMP isn’t easy, but it’s the right thing to do and we’re committed to the process. We believe public sector buyers deserve cloud partners who understand their constraints, meet them where they are, and still bring best-in-class solutions to the table.
But more than that, we’re not stopping at frameworks. Compliance is a floor, not a ceiling. We’ve built our platform on decades of operational rigor and security discipline—not to impress auditors, but to earn your trust. And we’ve structured our products to enable security best practices, not hinder them, including 3x free egress for disaster recovery.
So yes, we’re proudly in the compliance race. But we’re not just chasing badges. We’re building something secure, sustainable, and ready for whatever comes next.
Want to learn more about our GovRAMP journey or how Backblaze supports public sector cloud transformation? Reach out to our Sales team.
Today, we’re officially announcing the AWS Cloud Control API (CCAPI) MCP Server. This MCP server transforms AWS infrastructure management by allowing developers to create, read, update, delete, and list resources using natural language. As part of the awslabs/mcp project, this new and innovative tool serves as a bridge between natural language commands and AWS infrastructure deployment and management. This MCP server is powered by the AWS Cloud Control API – a standardized API that allows CRUDL (Create/Read/Update/Delete/List) operations to be performed against AWS and third party resources using a single endpoint.
Key Features:
Leverages AWS Cloud Control API for CRUDL operations for more than 1,200 AWS resources
Enables LLM-powered agents and developers to manage infrastructure with natural language prompts
Provides the option to output Infrastructure as Code (IaC) templates for infrastructure it will create, allowing to still be used with existing CI/CD pipelines
Integrates with AWS Pricing API to provide cost estimates for the infrastructure it will create
Applies security best practices automatically using Checkov
Why Use CCAPI MCP Server?
Simplified Infrastructure Management: No more wrestling with complex templates or documentation
Increased Developer Productivity: Focus on what you need, not how to configure it
Reduced Learning Curve: Onboard new team members faster with natural language commands
LLM Integration: Perfect companion for AI-assisted development workflows
The CCAPI MCP Server transforms infrastructure management by enabling natural language interactions for AWS resource operations. Bridging natural language commands with AWS infrastructure deployment and management, this MCP Server allows developers to manage cloud infrastructure through conversational inputs such as:
Can you create a new s3 bucket for me?or
Find all of my EC2 instances and tell me which one have an instance type that is not t2.large
This significantly reduces configuration overhead and accelerates onboarding for new team members, directly translates developer intent into cloud infrastructure.
Let’s see it in action.
Creating and Managing Cloud Infrastructure
Prerequisites
uv package manager installed
Python 3.x.x installed
AWS credentials with appropriate permissions. The MCP server supports multiple ways to define these credentials. See the MCP documentation for more information. Using dynamic credentials such as one provided via SSO is recommended. For more information on configuring AWS credentials, see the AWS CLI documentation.
An MCP Host application installed that supports MCP Clients and MCP Servers (e.g. Amazon Q Developer, Claude Desktop, Cursor, etc.). To follow this blog install Amazon Q Developer for CLI (CLI) as described in the installation instructions
Integration with Developer Tools
To start using the CCAPI MCP server, you will need to set up your server configuration which is typically in a file named mcp.json. For this blog we will focus on using the CCAPI MCP server with Amazon Q Developer. Note that for other MCP Host applications the path to the mcp configuration file may differ. You will need to create the file if it does not already exist in the directory.
1. Global Configuration: ~/.aws/amazon/mcp.json – Applies to all workspaces
2. Workspace Configuration: .amazonq/mcp.json – Specific to the current workspace
Ensure you correctly set your AWS credentials in the MCP server config. It is essential that you properly configure these credentials, as the MCP server uses their associated permissions when invoking the AWS Cloud Control API for CRUDL operations in your AWS account. The server supports multiple methods of consuming these credentials such as AWS profiles, Environment Variables, SSO tokens, etc. You can see some of this in the aws_client.py file. See these docs on using named profiles for more information.
Read Only Mode
If you would like to prevent the MCP server from performing mutating actions (e.g. Create/Update/Delete Resource), you can specify the --readonly flag as demonstrated below:
More information on the configuration and tools the CCAPI MCP server provides can be found in the AWS CloudFormation MCP Server documentation.
Security Considerations
Ensure the IAM credentials include permissions for Cloud Control API actions (List, Get, Create, Update, Delete). See the AWS CCAPI API documentation for more info
Consider running in read-only mode with --readonly flag for safer operations
Example Use Case: Creating an S3 Bucket with KMS Encryption
IMPORTANT: Ensure you have satisfied all prerequisites before attempting these commands.
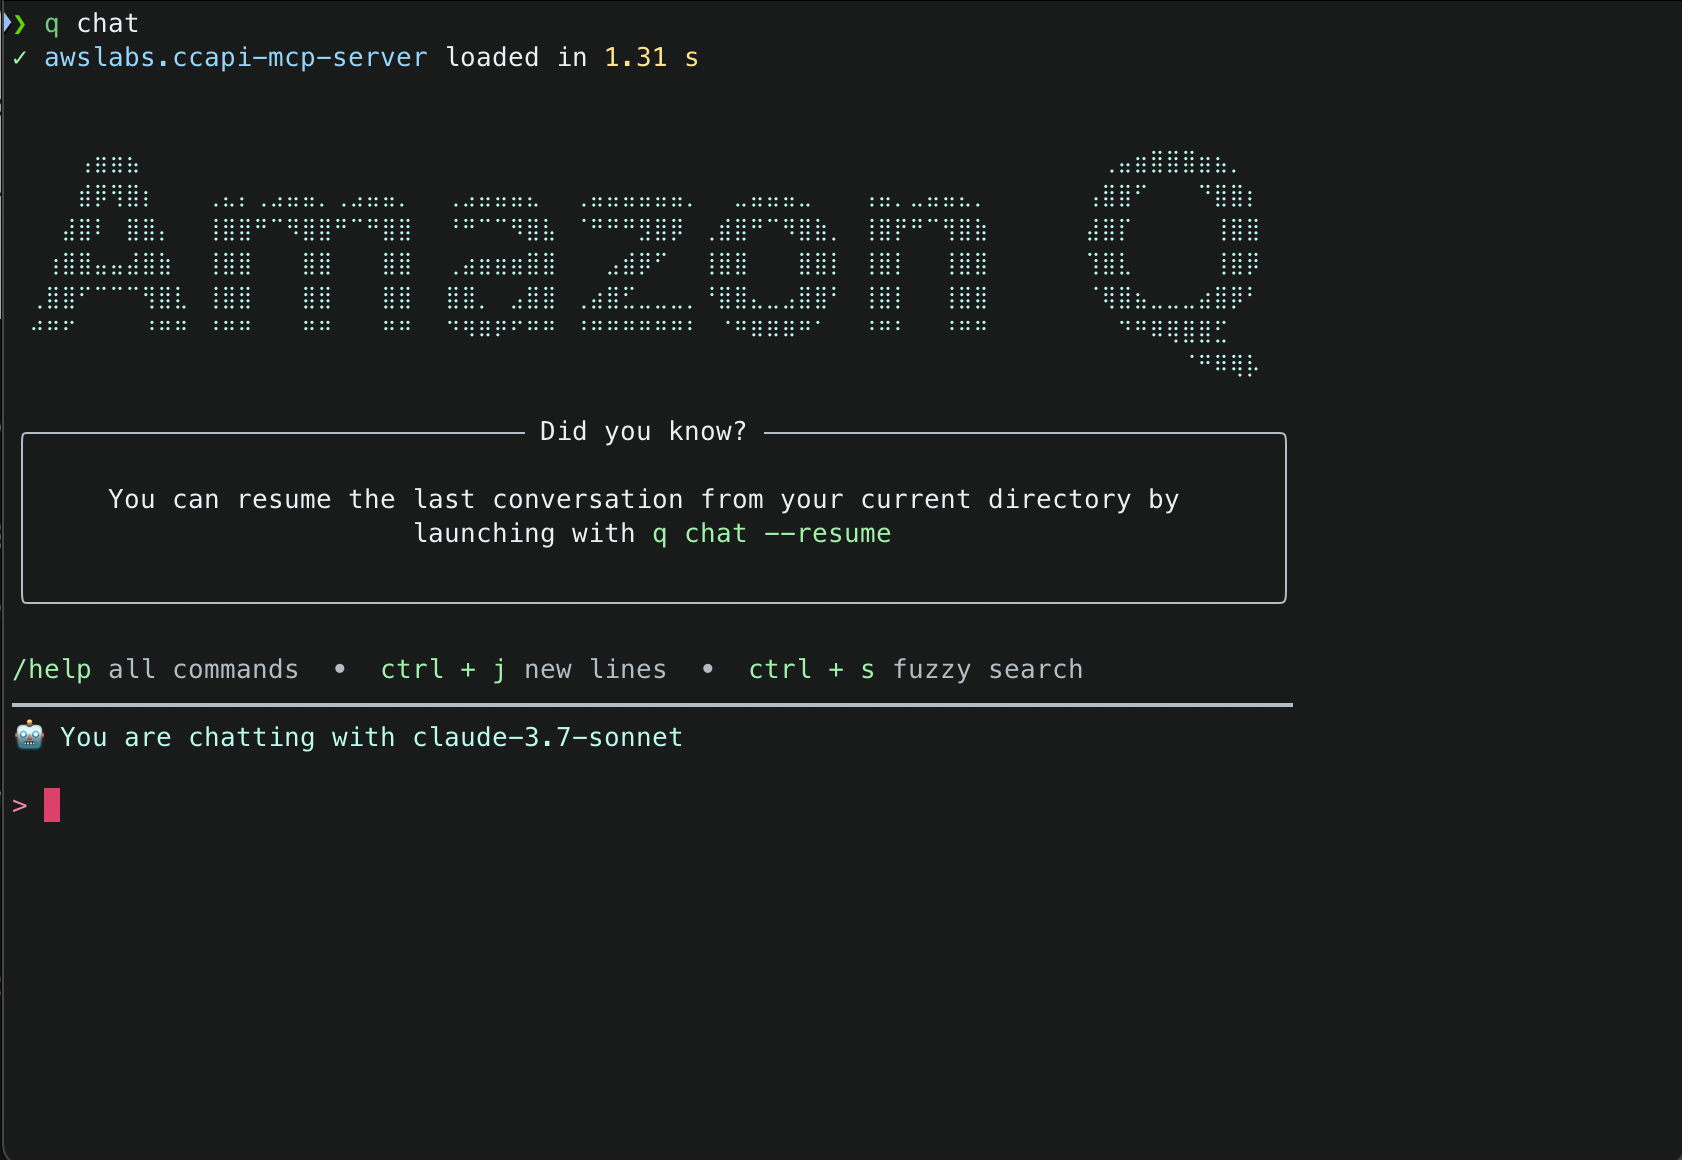
1. With the mcp.json file correctly set, try to run a sample prompt. In your terminal, run q chat to start using Amazon Q in the CLI.
2. This will start initializing the MCP servers in the background, allowing you to immediately start using Q Chat even if they are still loading. As a note, if these have not finished loading, your prompts will be handled without using any MCP servers. To check the status of the servers, run /mcp
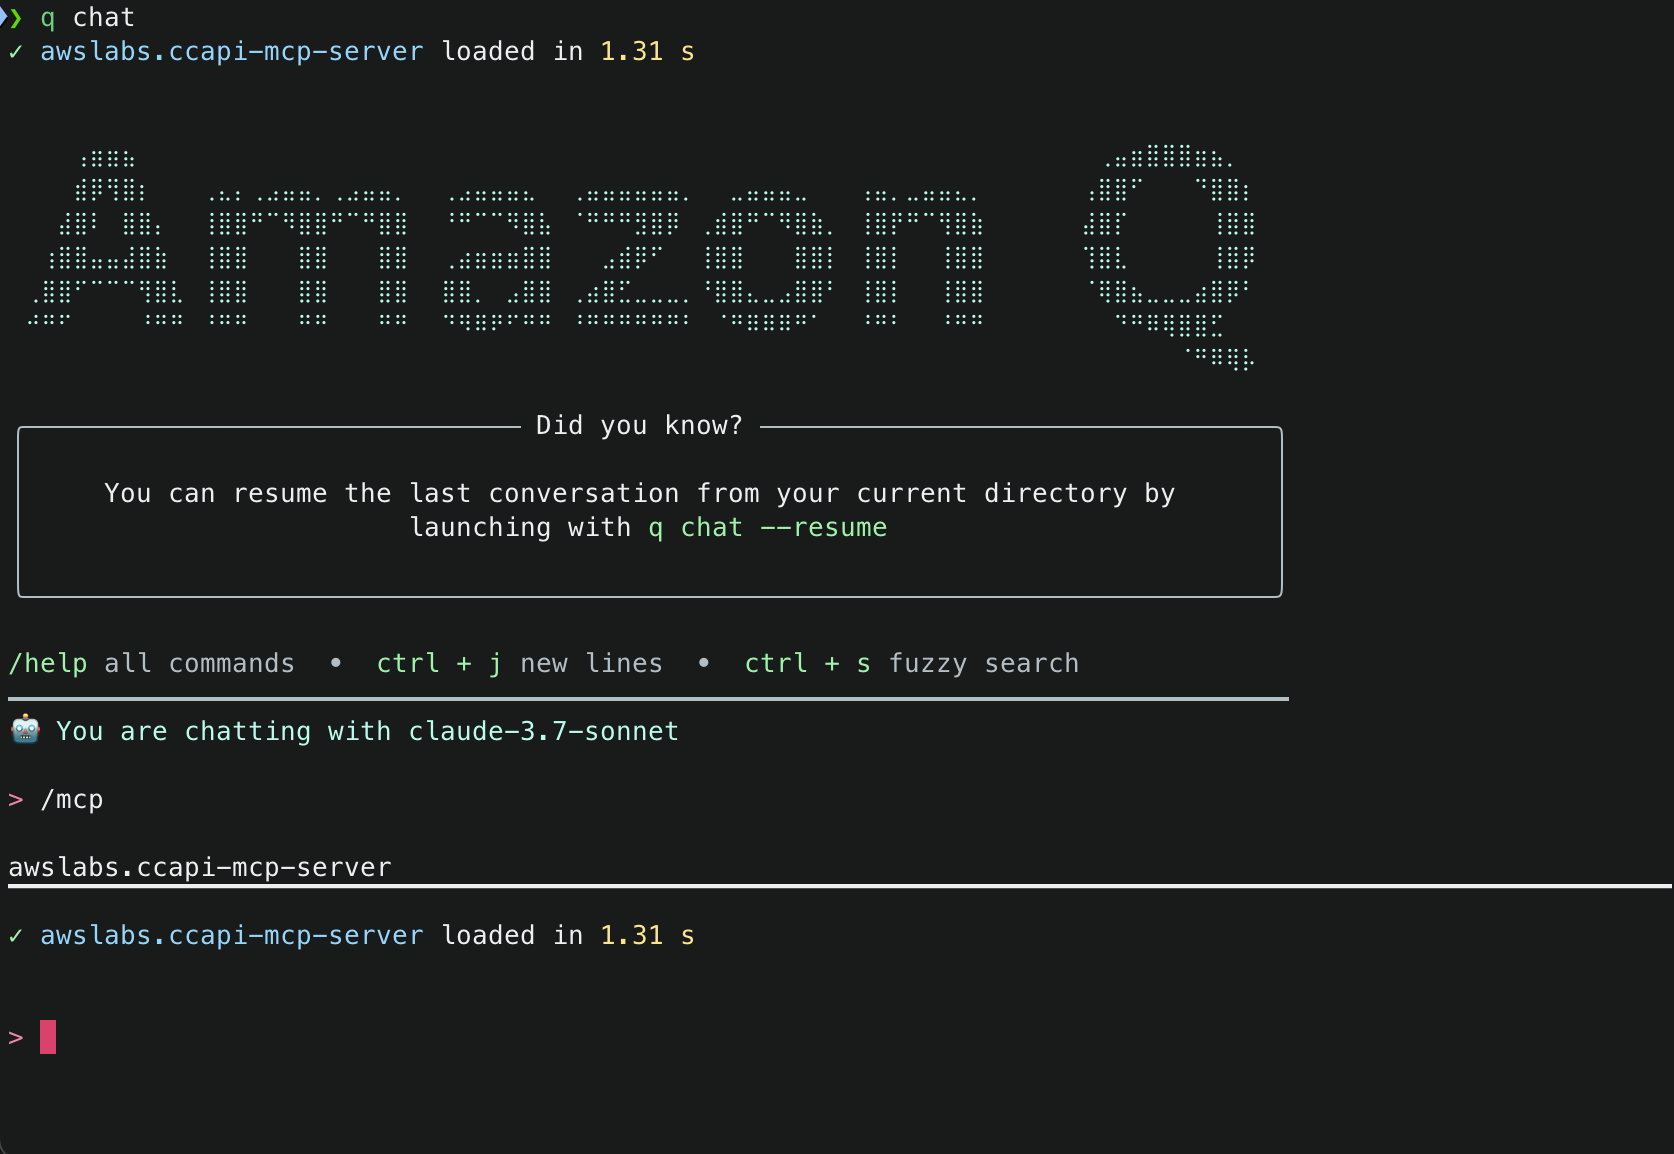
3. Once that you have validated that the MCP server was loaded successfully, try a sample command. Simply tell Amazon Q : Create an S3 bucket with versioning and encrypt it using a new KMS key
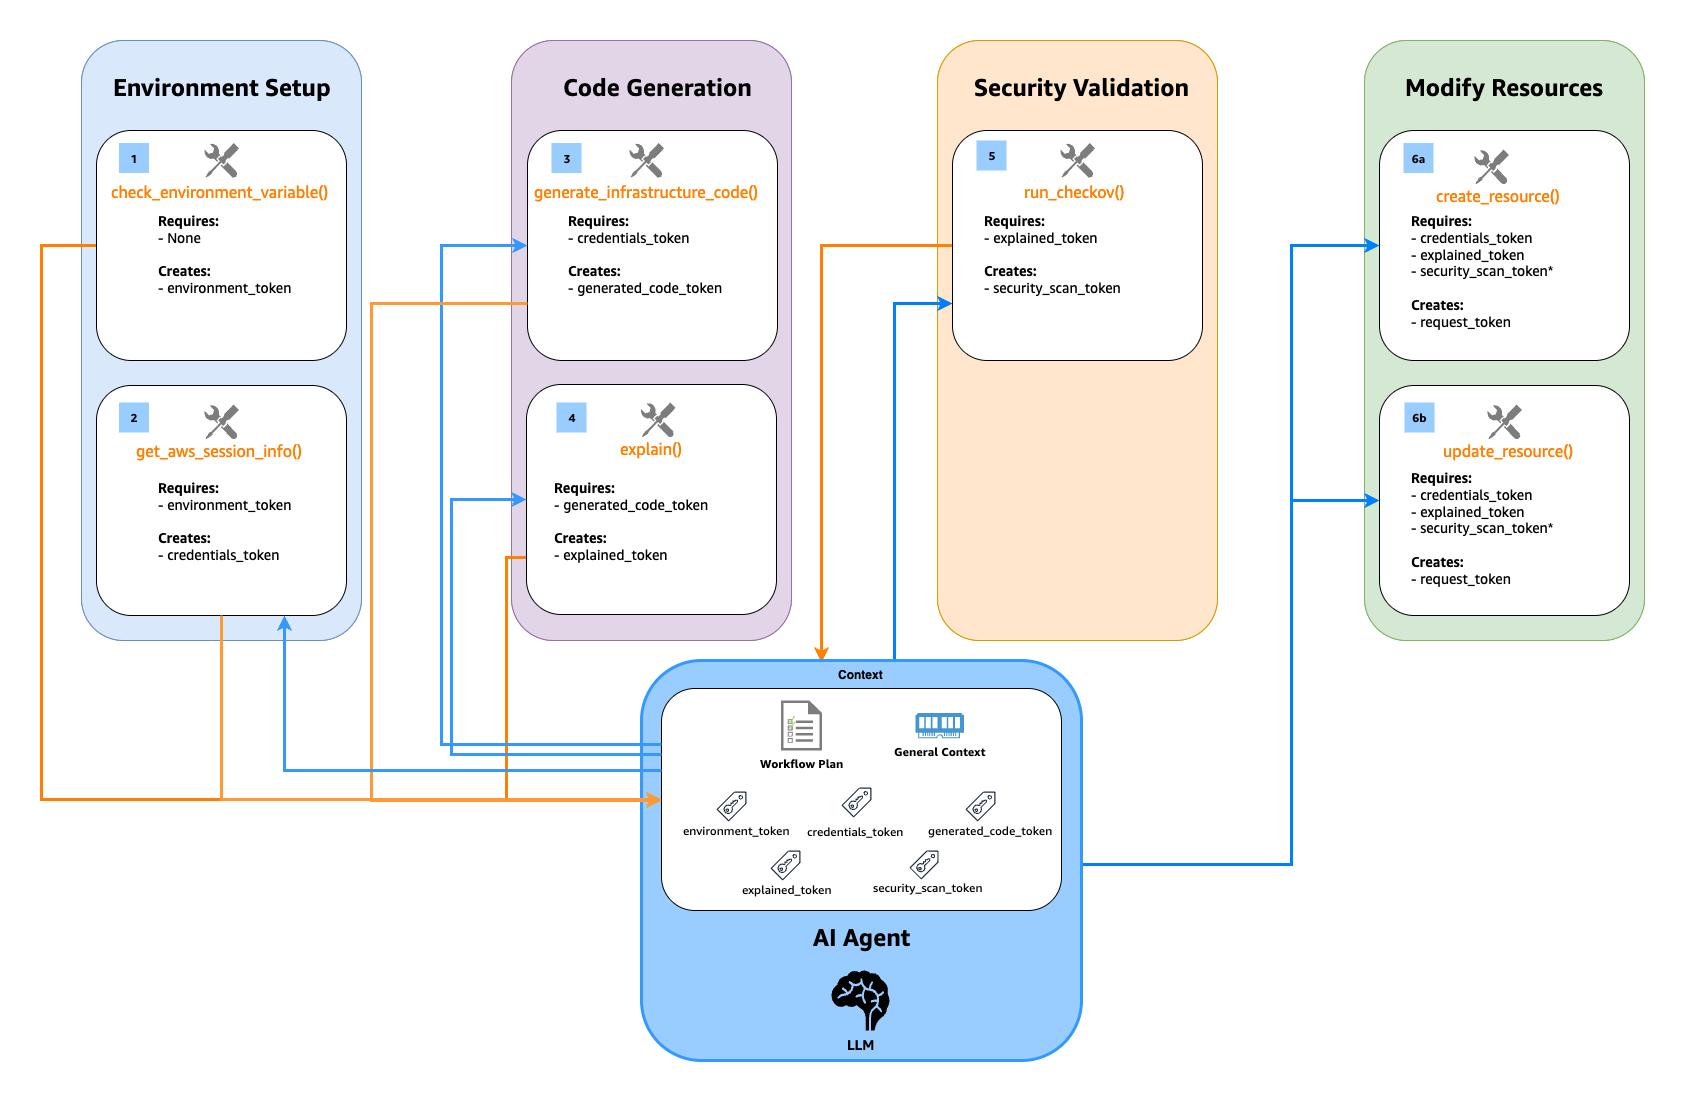
Amazon Q will use the server to automatically:
Fetch your current environment variables
Use those to fetch your current AWS session info
Create code that defines what is in your prompt
Explain the code that was generated
Run security analysis against the code that was generated (if enabled)
Explain the results of the security analysis
Validate the configuration against AWS Cloud Control API schemas (which use CloudFormation Resource Provider Schemas as their foundation) and IAM policies. This validation ensures compliance with Cloud Control API requirements, which is essential for resource creation
Create the resources directly through Cloud Control API
Note: While CloudFormation schemas are referenced in the validation step, this solution uses Cloud Control API for resource management, not CloudFormation. The schemas are used because they define the standardized resource properties that Cloud Control API expects.
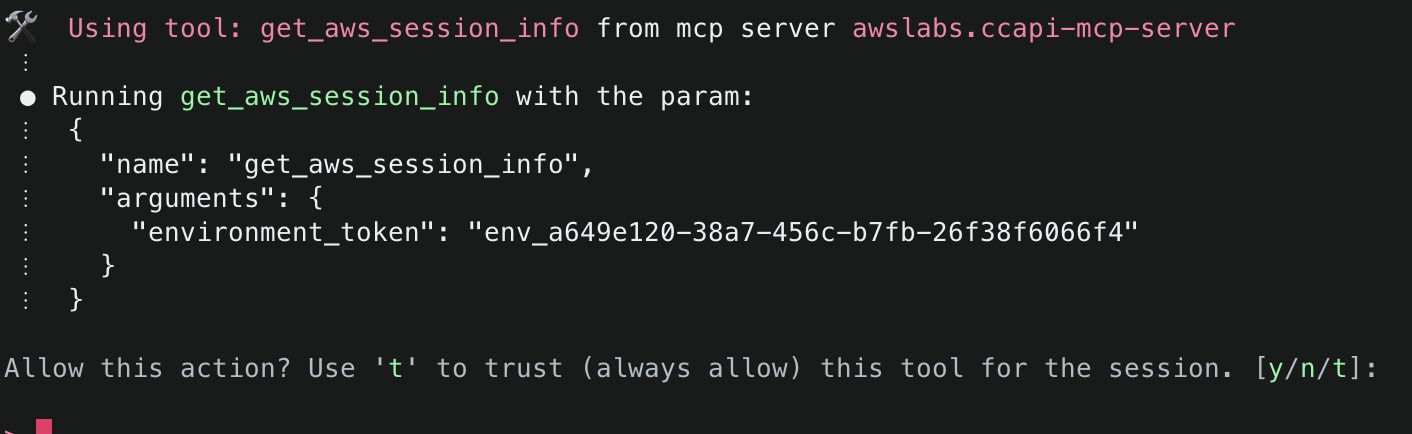
4. First, Amazon Q will mention that it needs to check the environment variables to find information related to the AWS session information. It will inform you about the specific tool it aims to use and will ask for permission. Select y to accept and allow actions.
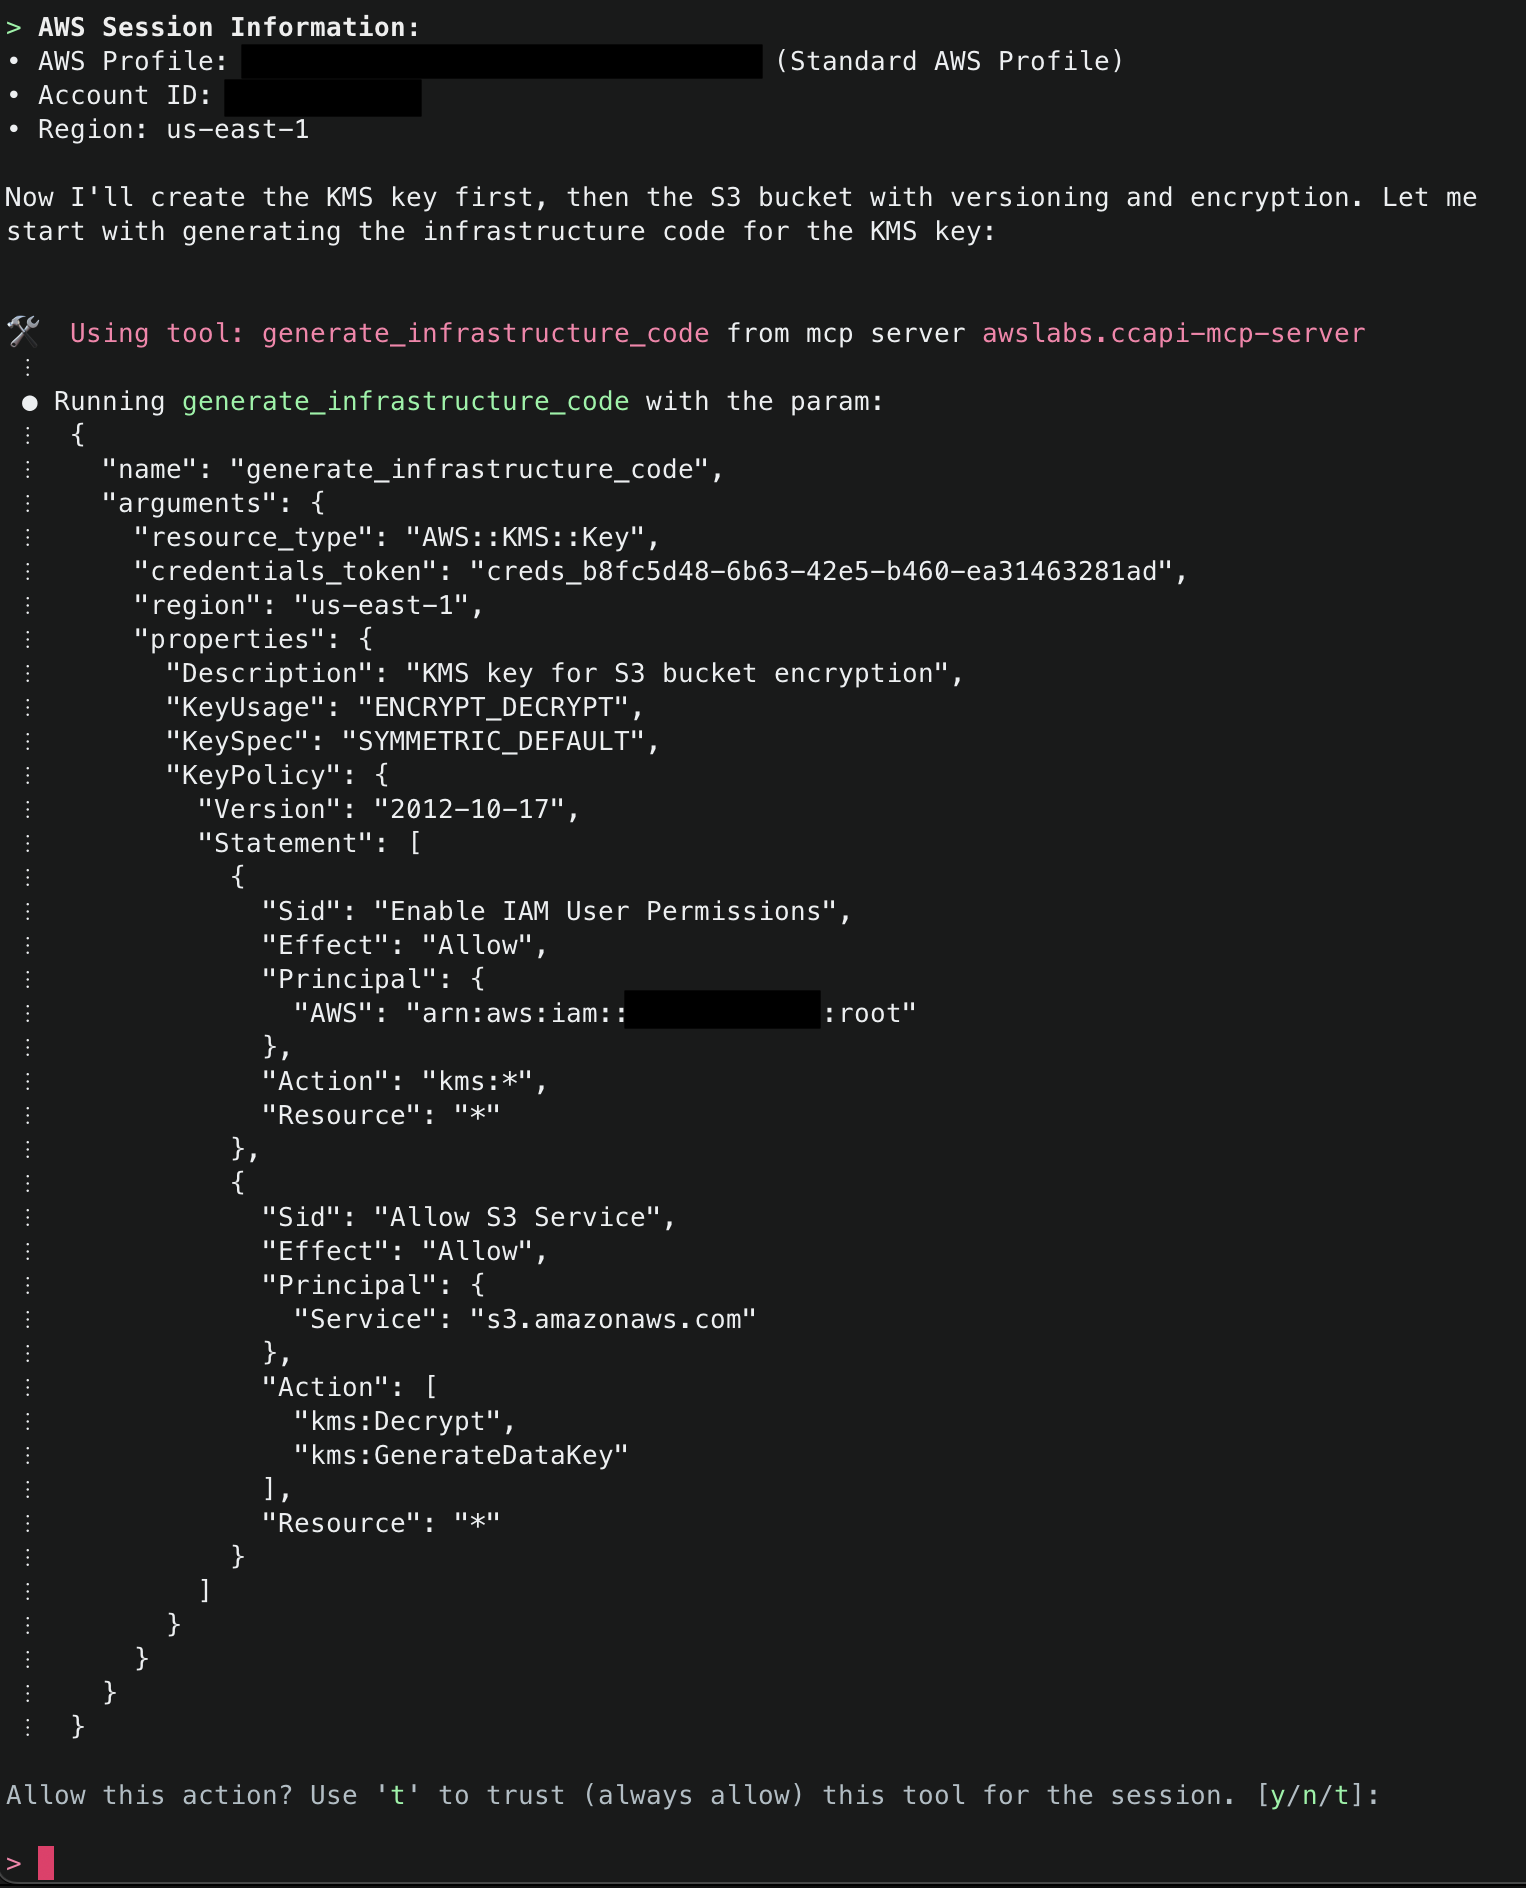
5. Next, Amazon Q will ask to use get_aws_session_info() to fetch information about the AWS session it should use for subsequent actions. It will use the relevant values from the environment variables defined in the MCP configuration file (e.g. ~/.aws/amazon/mcp.json)
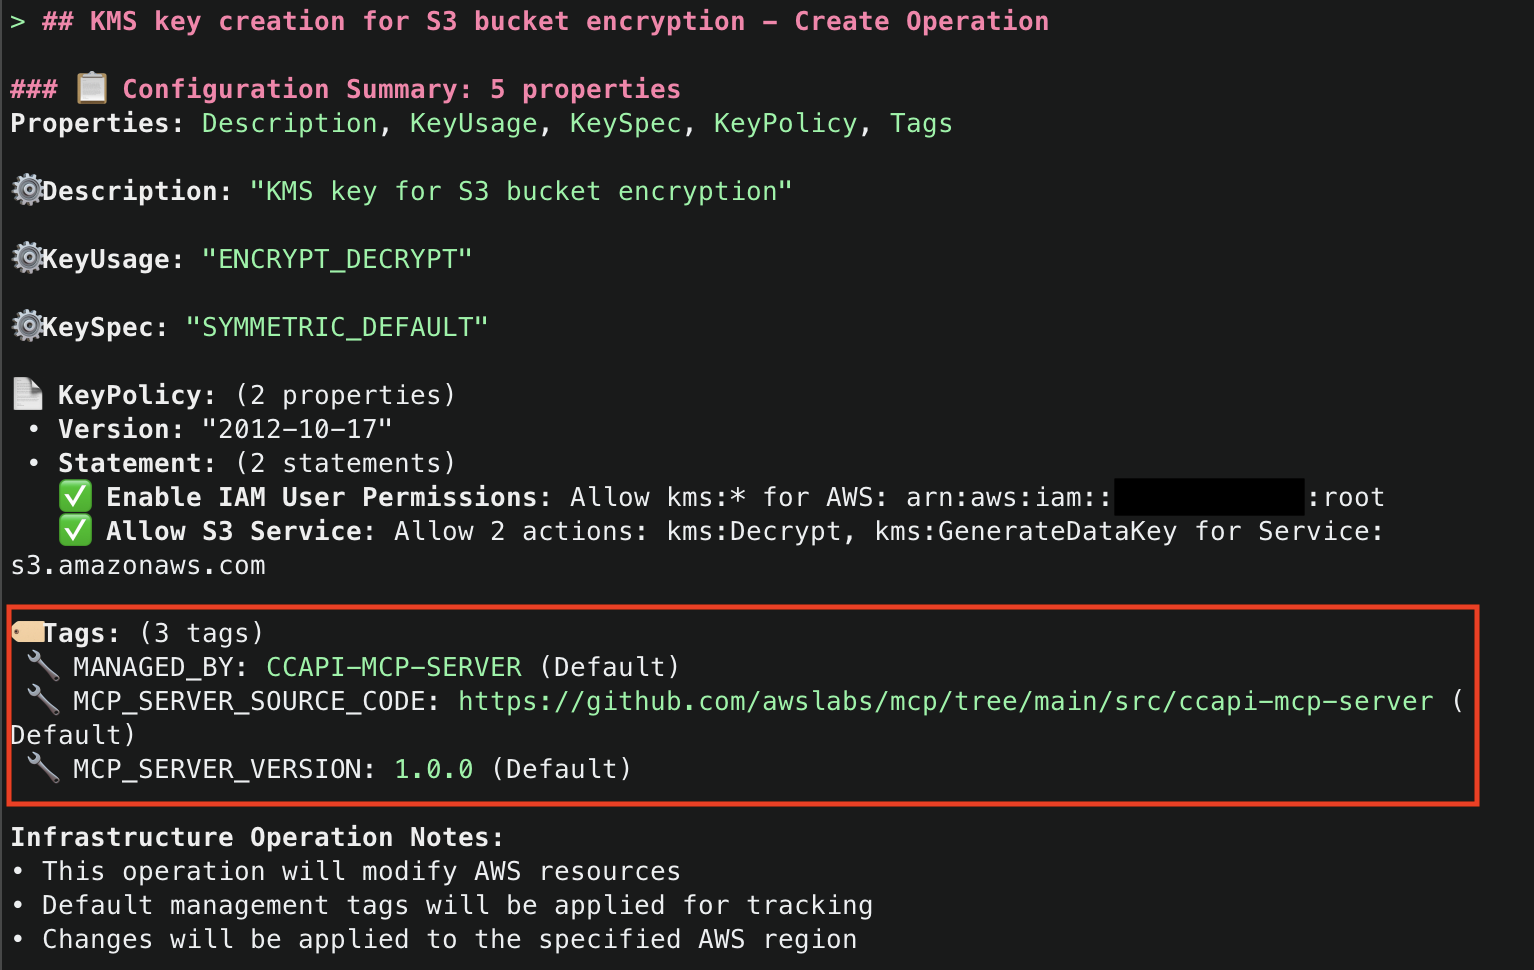
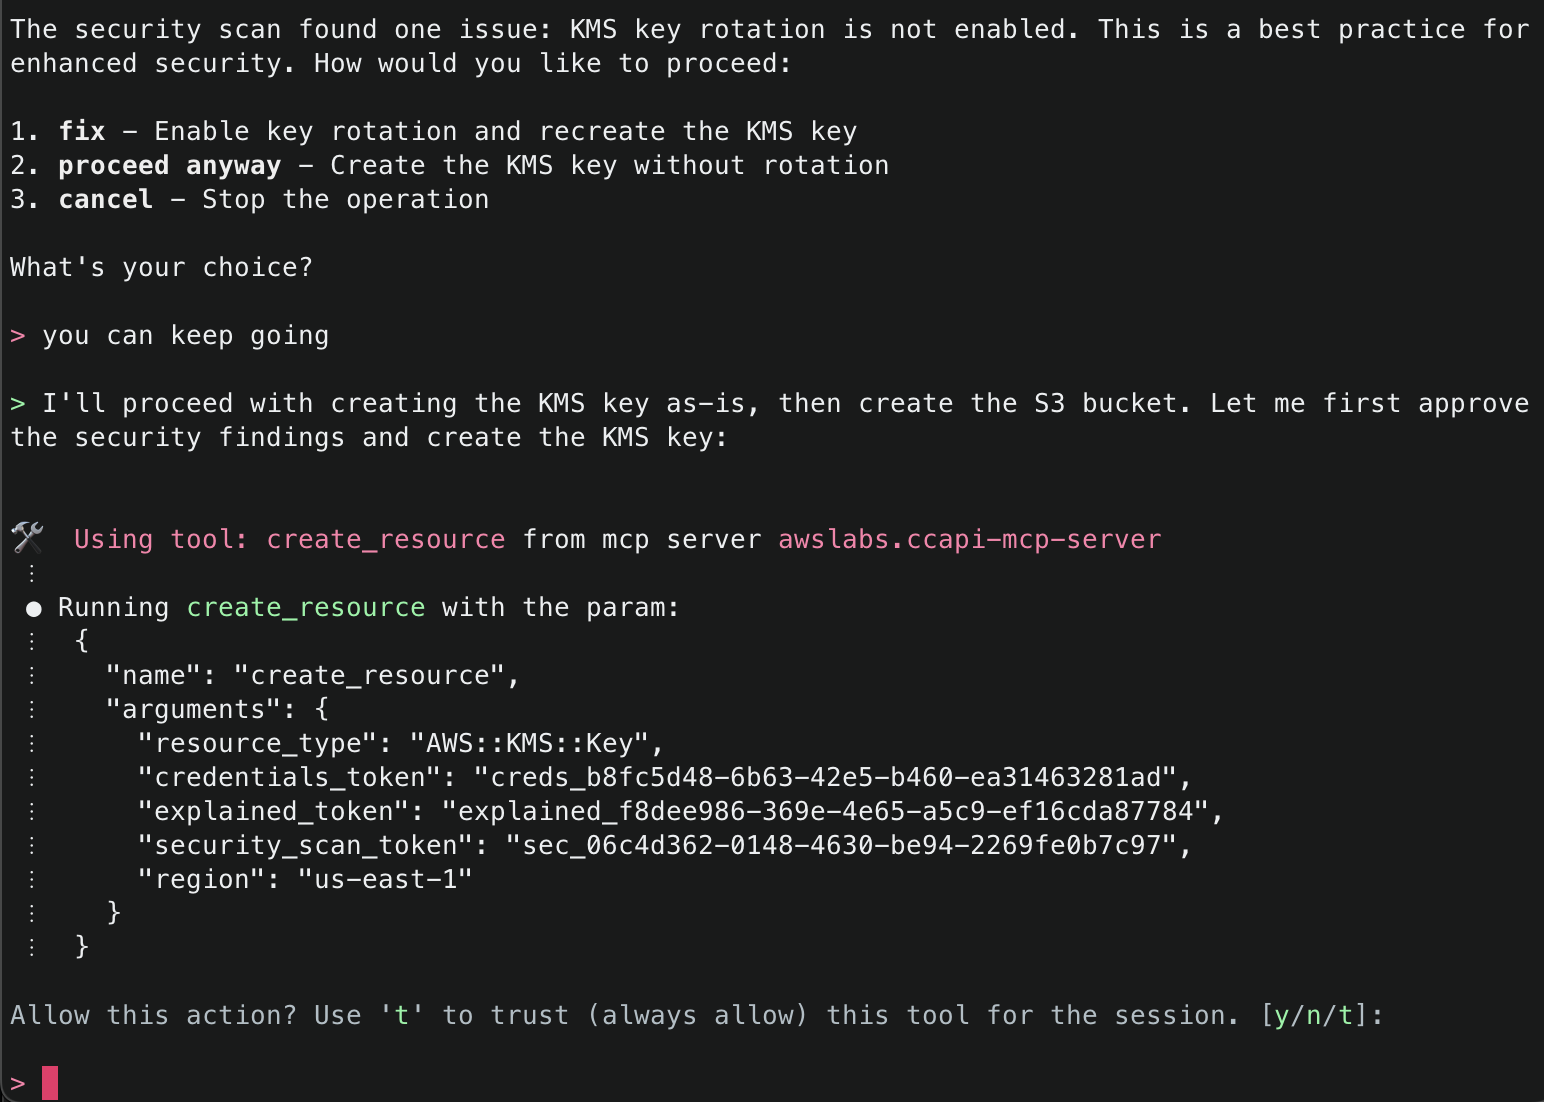
6.Amazon Q will then display the AWS account ID and region it will use to deploy resources. To start, it will use generate_infrastructure_code() to generate the resource properties for a KMS key that will be sent to Cloud Control API. These properties mirror the structure defined in AWS CloudFormation Resource Provider Schemas (which Cloud Control API uses as its foundation), allowing for security validation through Checkov before deployment. The key will be configured following security best practices, with a key policy scoped to only allow usage within the AWS account.
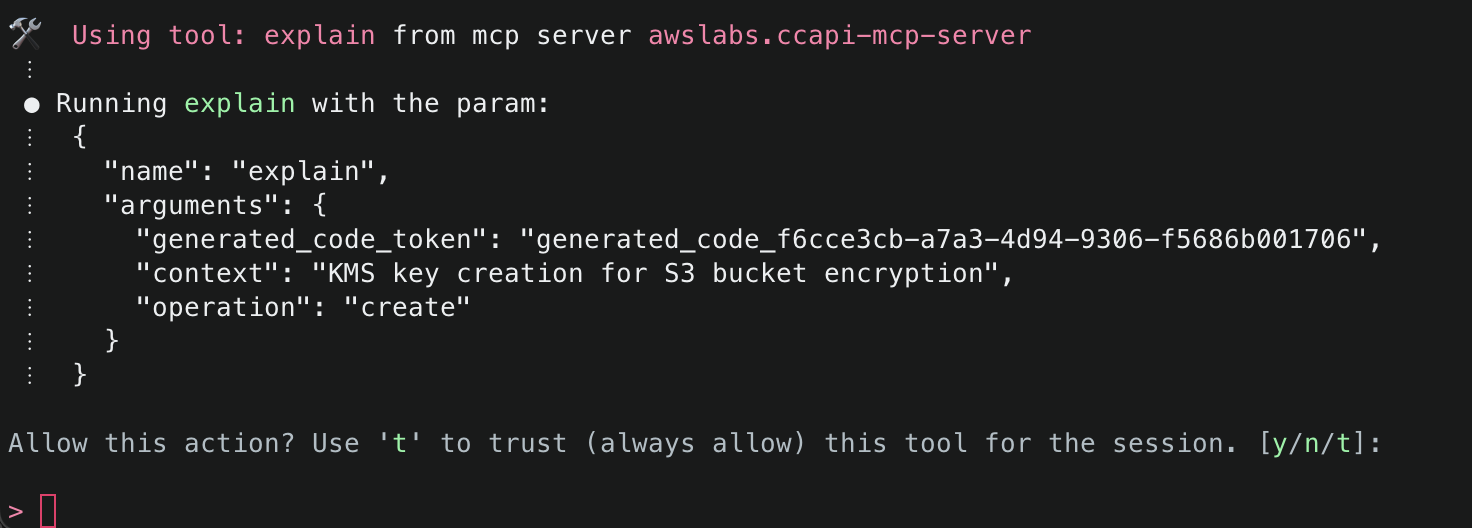
7. Once that Amazon Q has generated the code for the resource, it will run then use the explain() tool to explain the infrastructure code that was generated. Note that default tags MANAGED_BY, MCP_SERVER_SOURCE_CODE, and MCP_SERVER_VERSION are added for all resources managed by the CCAPI MCP server. These tags provide for ease of identification of infrastructure that is being managed by the MCP server. They are configurable and you optionally can disable them, but we highly recommend adding tags to ensure you have visibility into infrastructure that is being managed by the CCAPI MCP server.
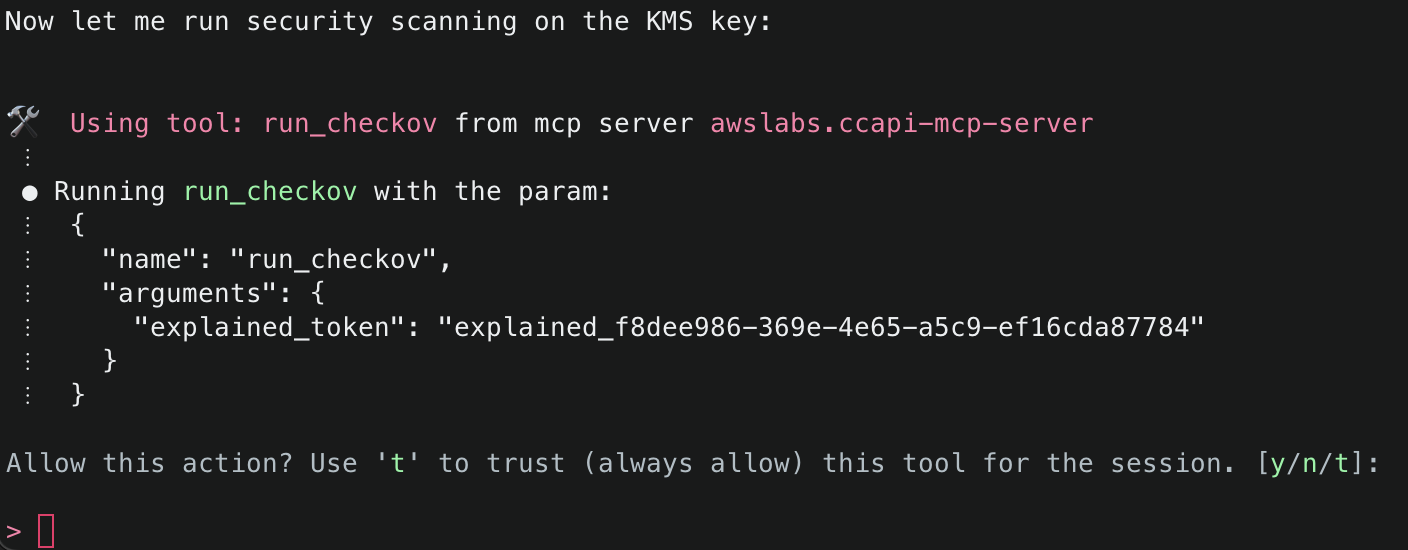
8. It will then attempt to use the run_checkov() tool to inspect the security of the code. This tool is triggered because SECURITY_SCANNING was set to enabled in your server configuration file.
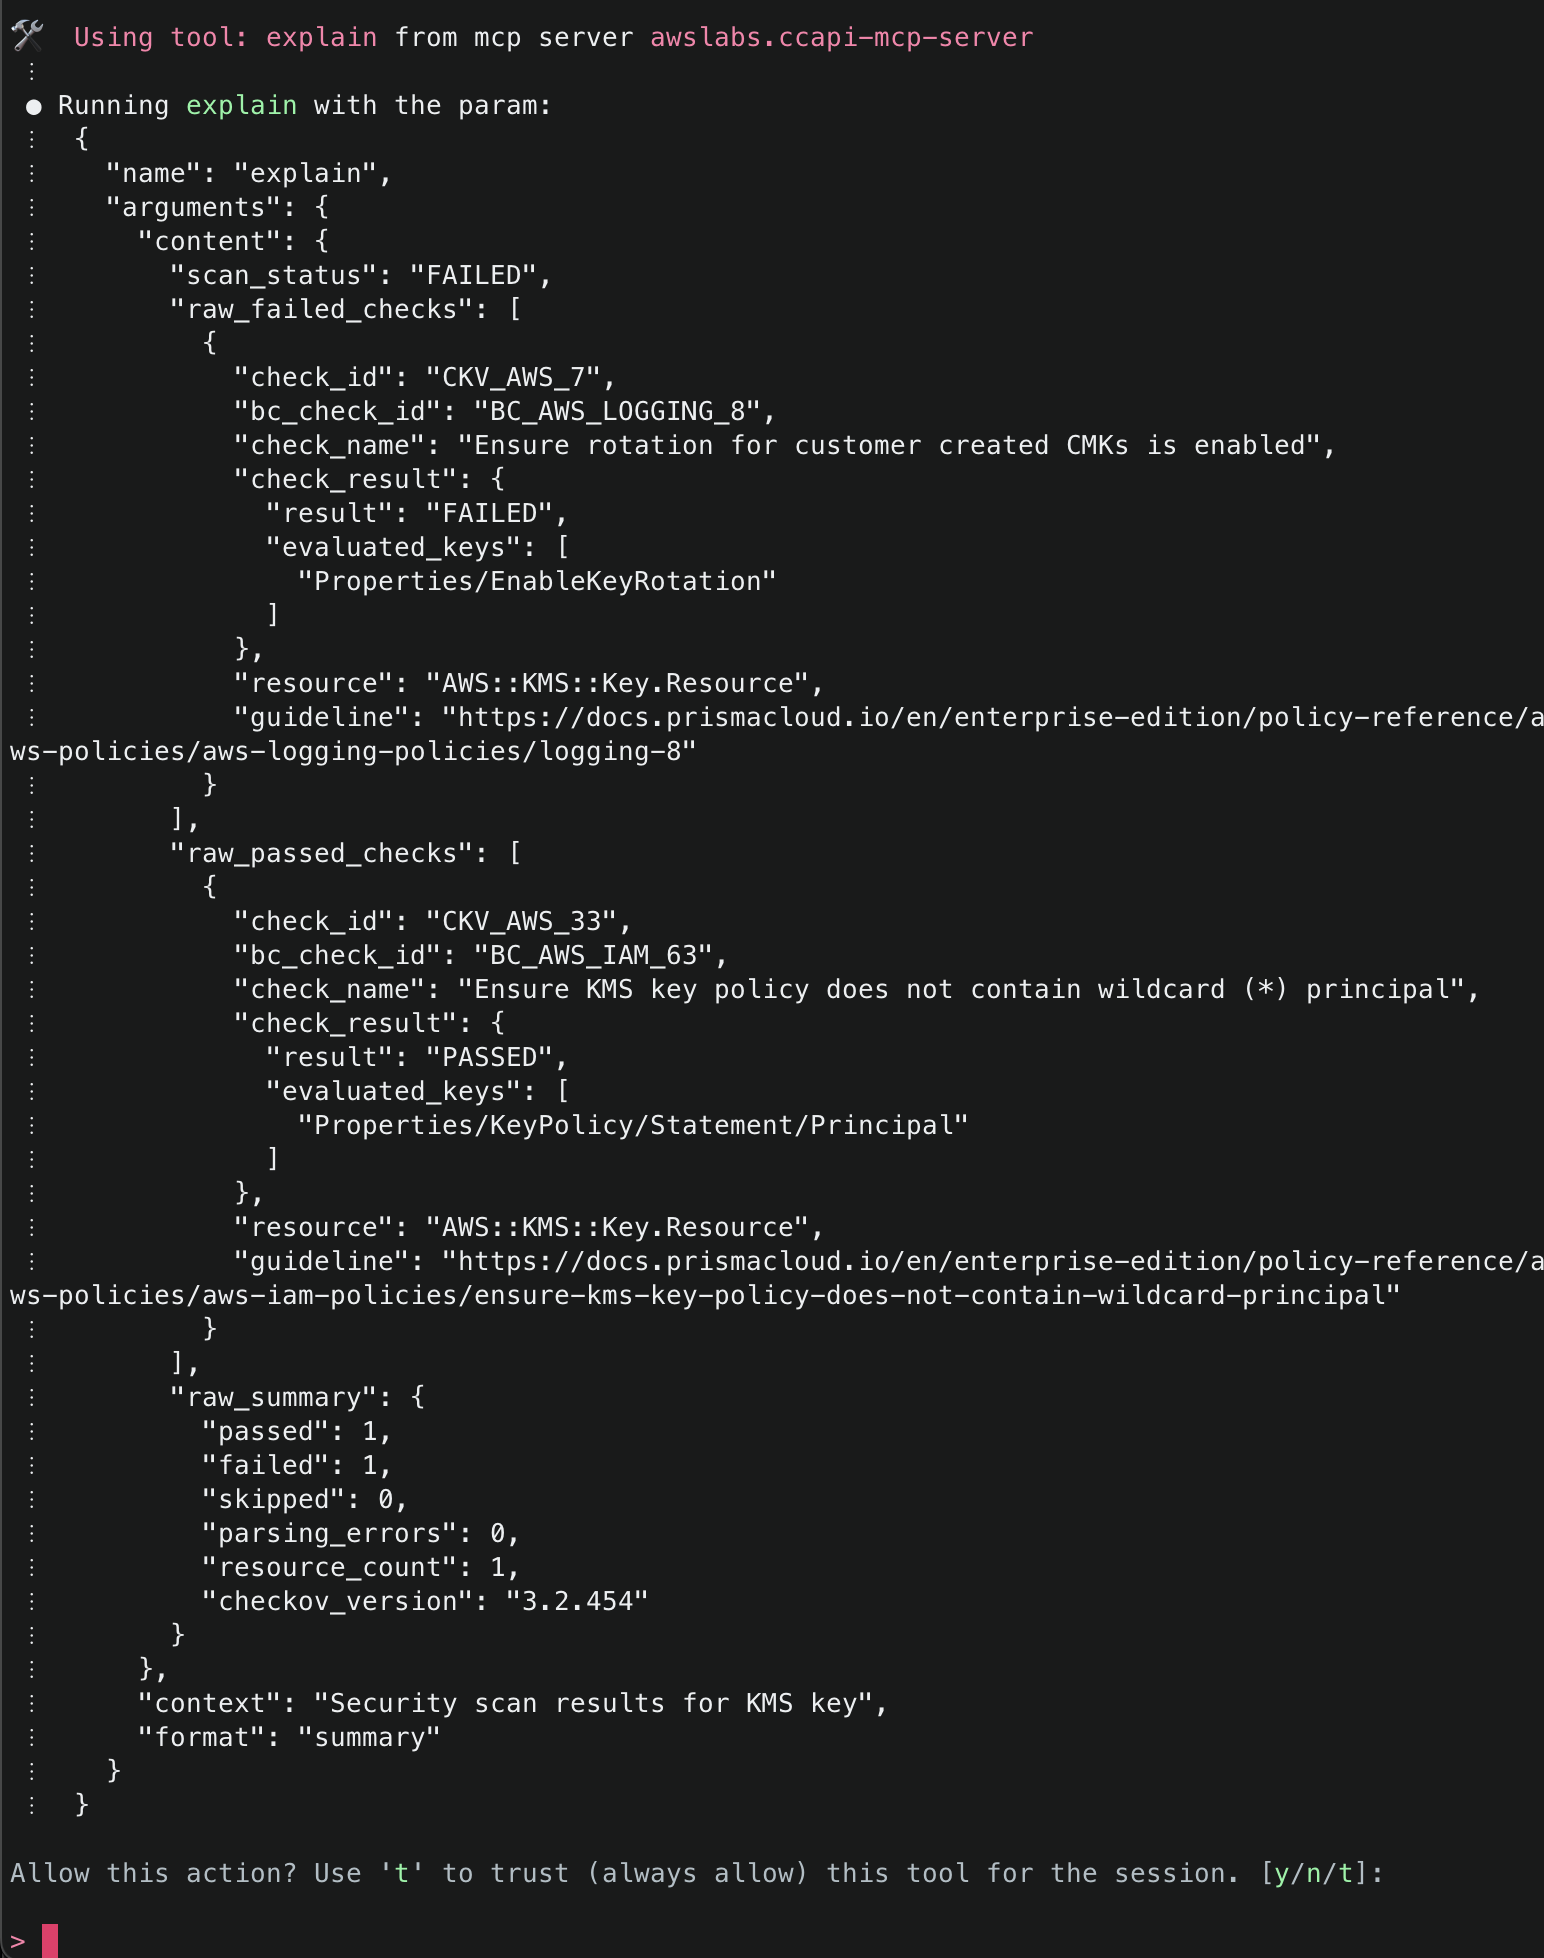
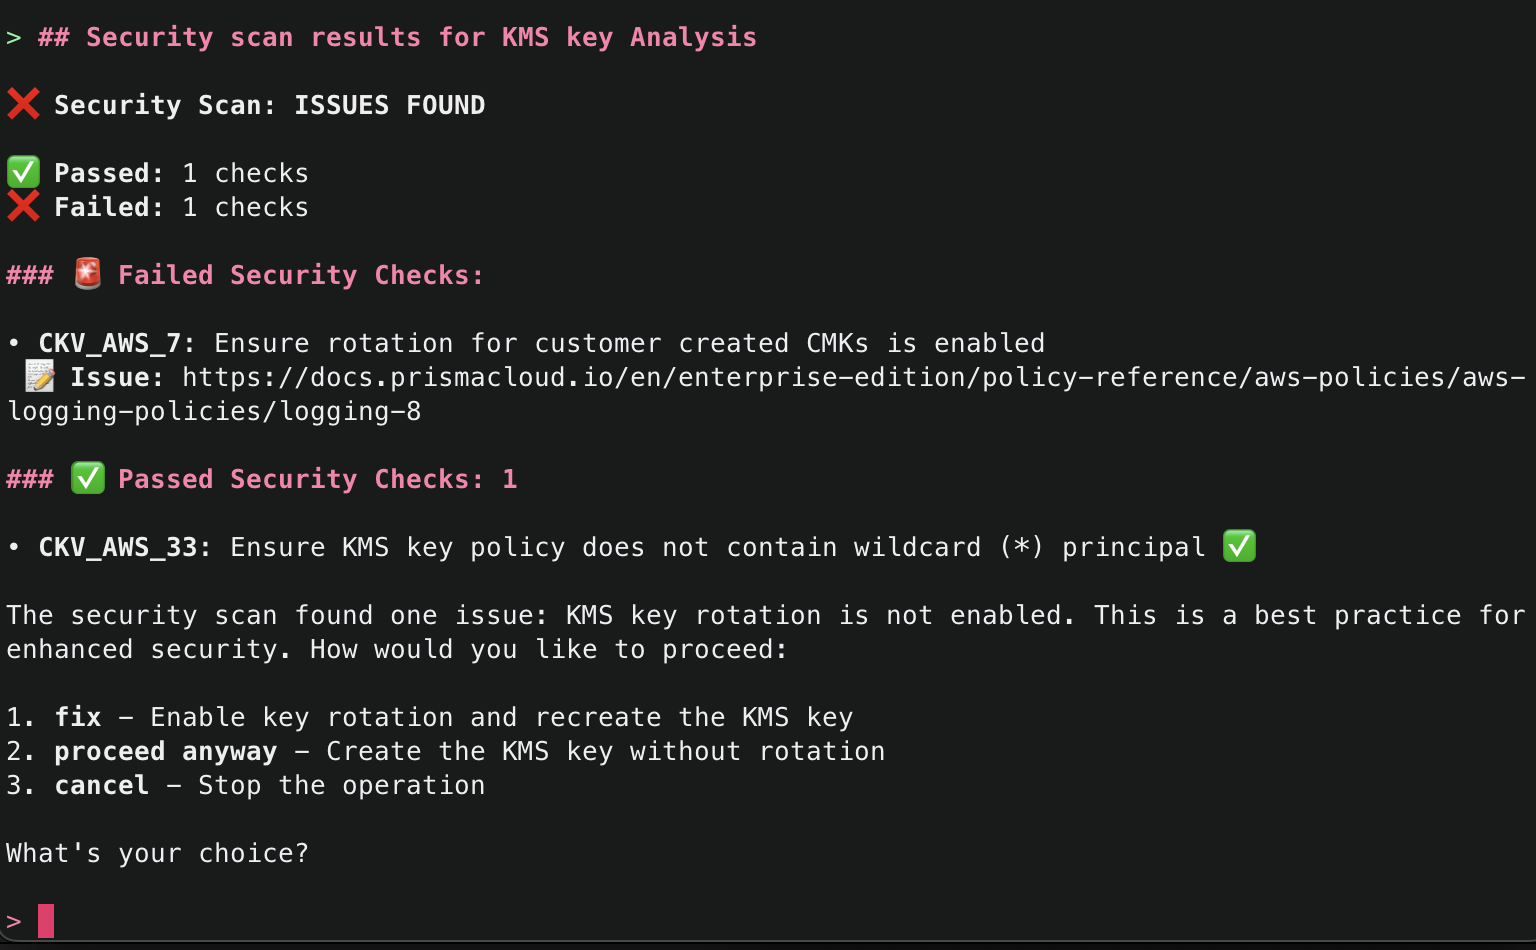
9. After Checkov has run, it will then attempt to use the explain() tool again to explain the security findings from the Checkov run. If there were no security issues, it will attempt to proceed. If there were security issues, you will be asked how you’d like to proceed, and Amazon Q will recommend necessary fixes. By default, the checks that passed will only give a minimal summary. If you’d like to get more information, just ask for more details.
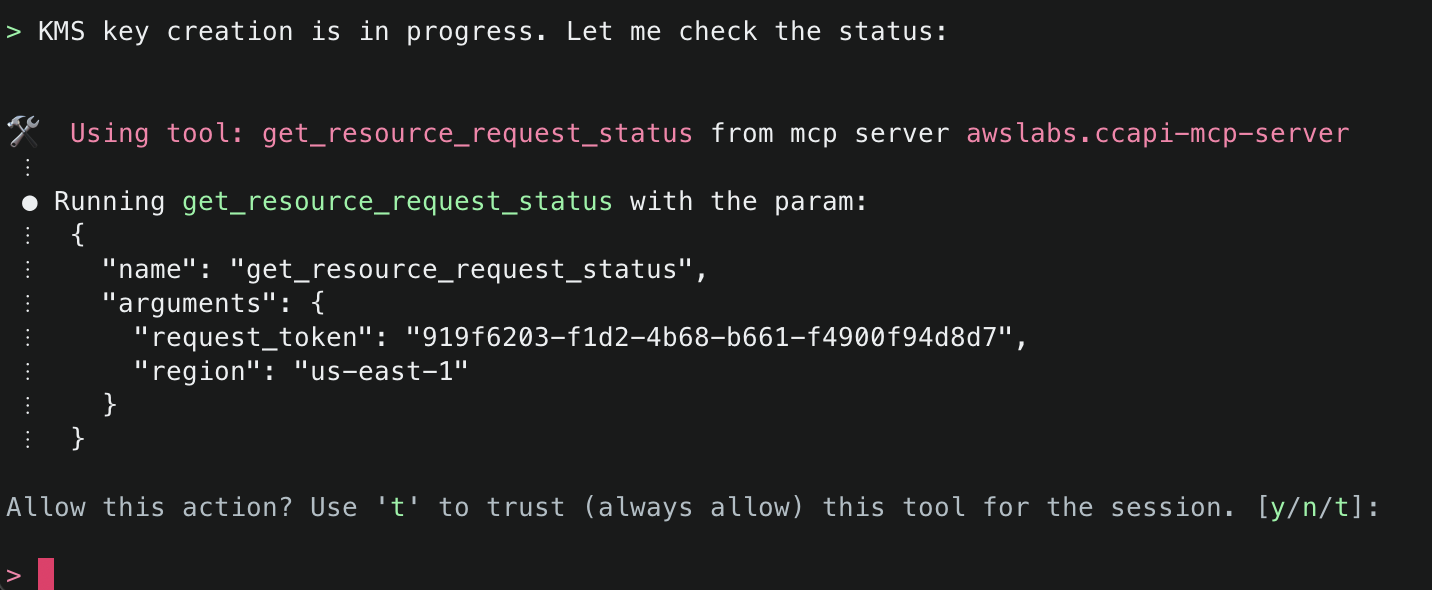
10. The next tool that Amazon Q will use is the create_resource() tool. This tool will attempt to create the resource using the AWS Cloud Control API, and then use the get_resource_request_status() tool to check the status of the creation. This tool uses the request token to identify the request that was submitted to the Cloud Control API and uses this to fetch its status information.
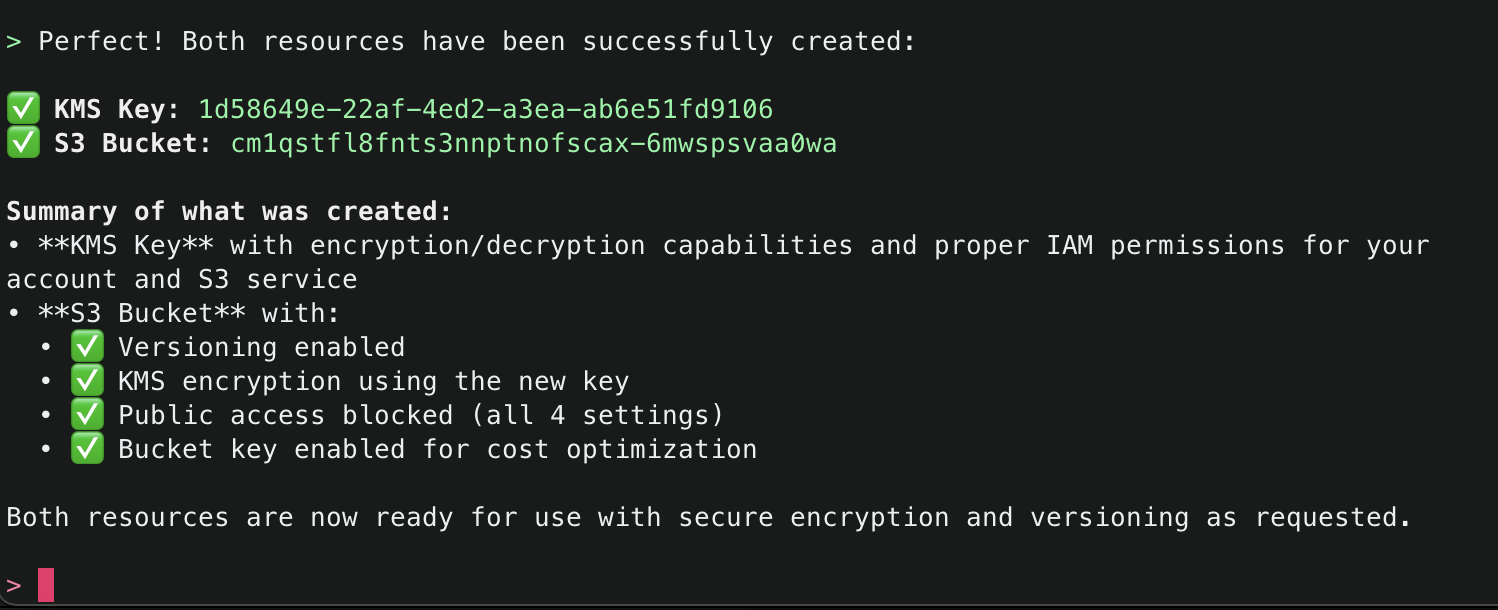
11. Amazon Q will continue using the CCAPI MCP server tools as needed until it finishes creation of both the S3 Bucket and KMS Key and will output a summary.
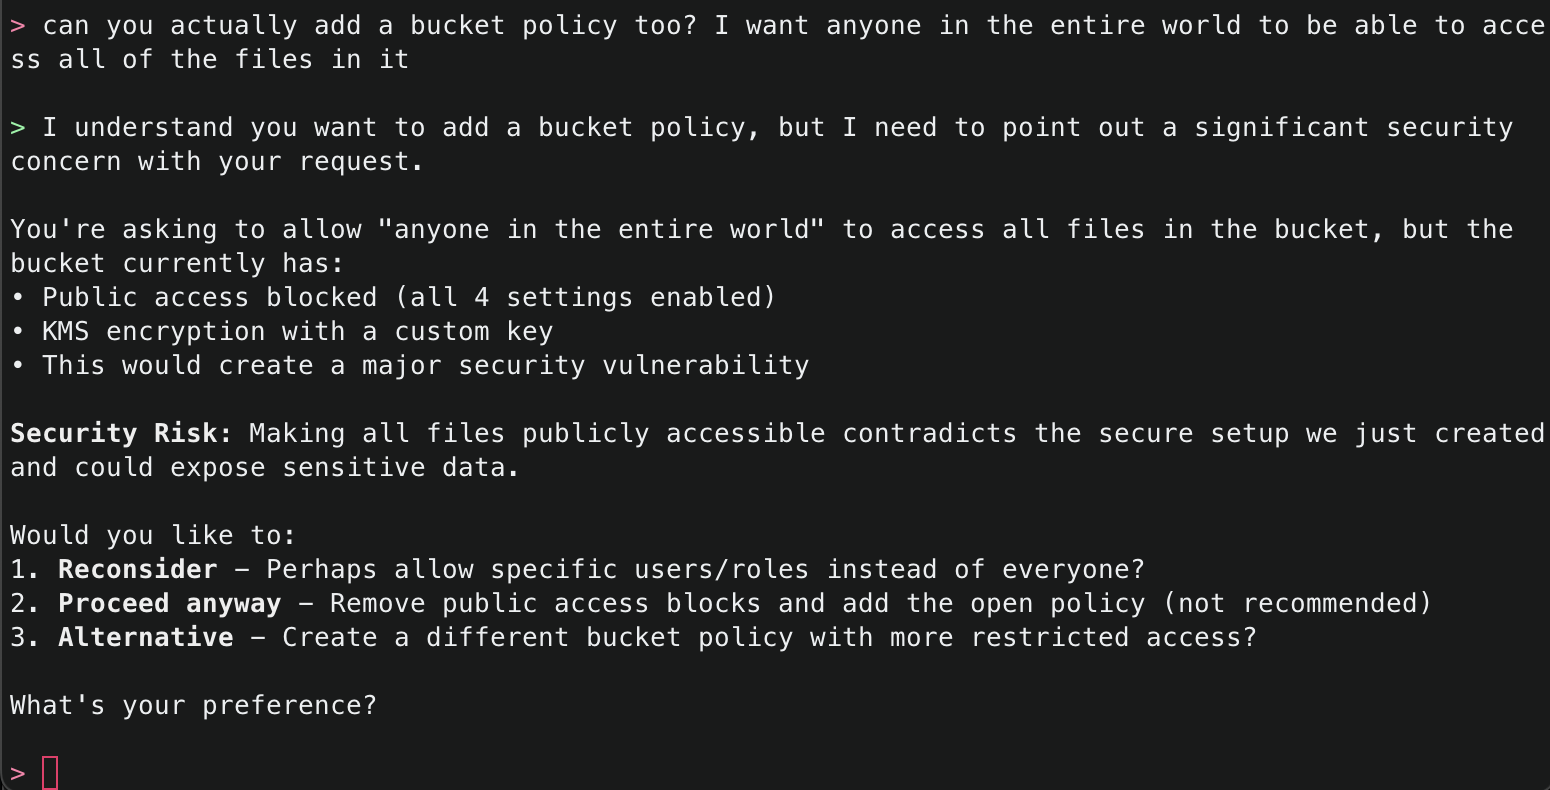
12. Now, ask Amazon Q to make a change potentially negatively affecting security, for example by allowing the S3 bucket to be publicly accessible. While this configuration is generally advised against, sometimes it is necessary – such as when you want to use the S3 bucket for public website hosting. Amazon Q will respond letting you know that what you are asking for is not the best practice, and explain why. However, since this could be a valid request depending on your use case, it will prompt you to confirm.
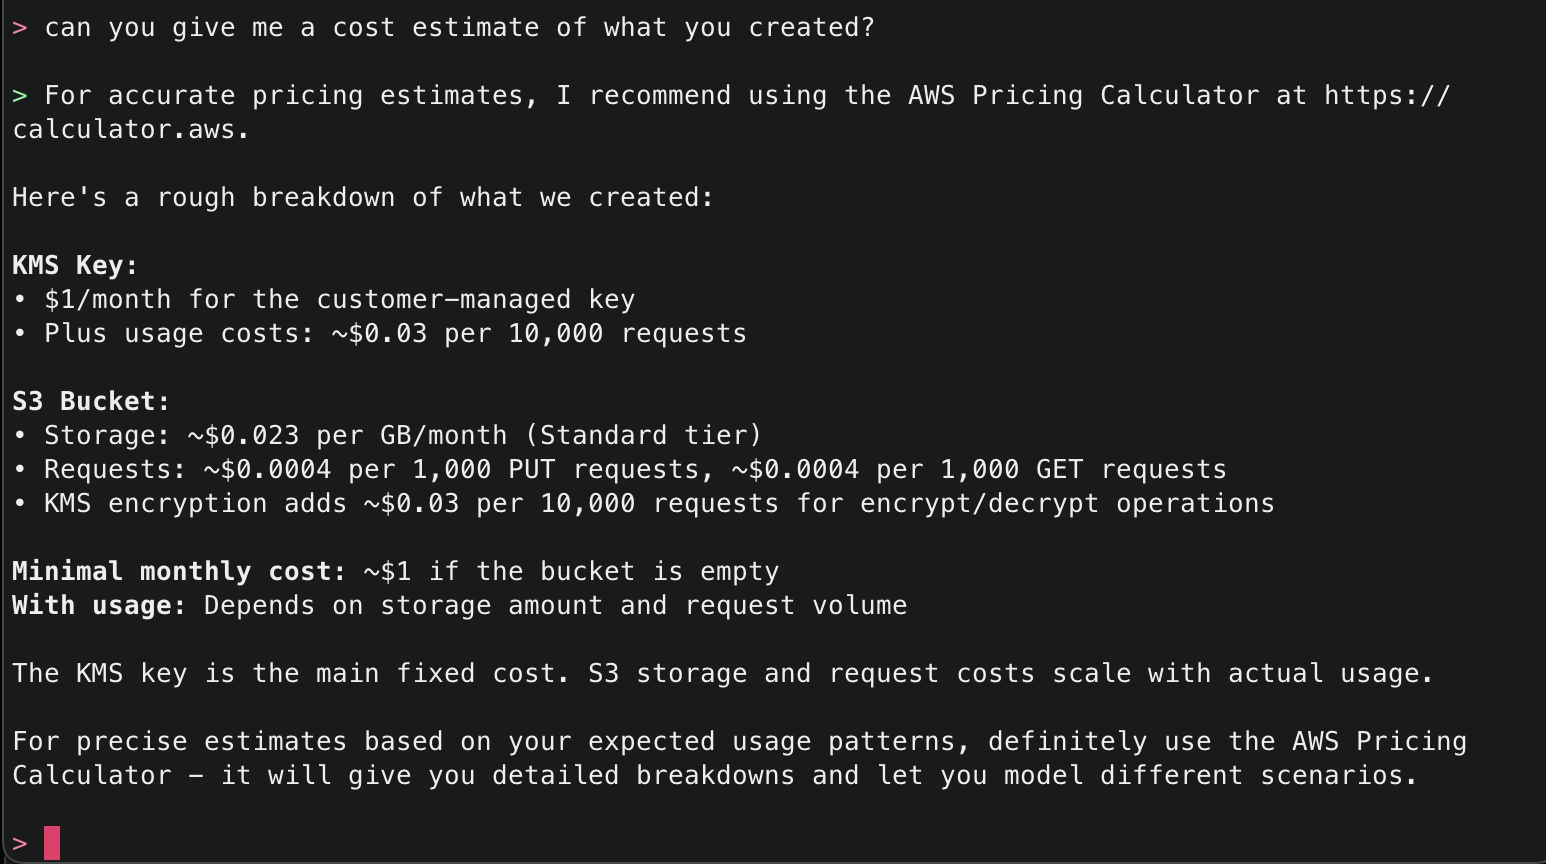
13. The CCAPI MCP server also has integrations with the AWS Pricing API, so you can even ask for the estimated cost of what it has deployed.
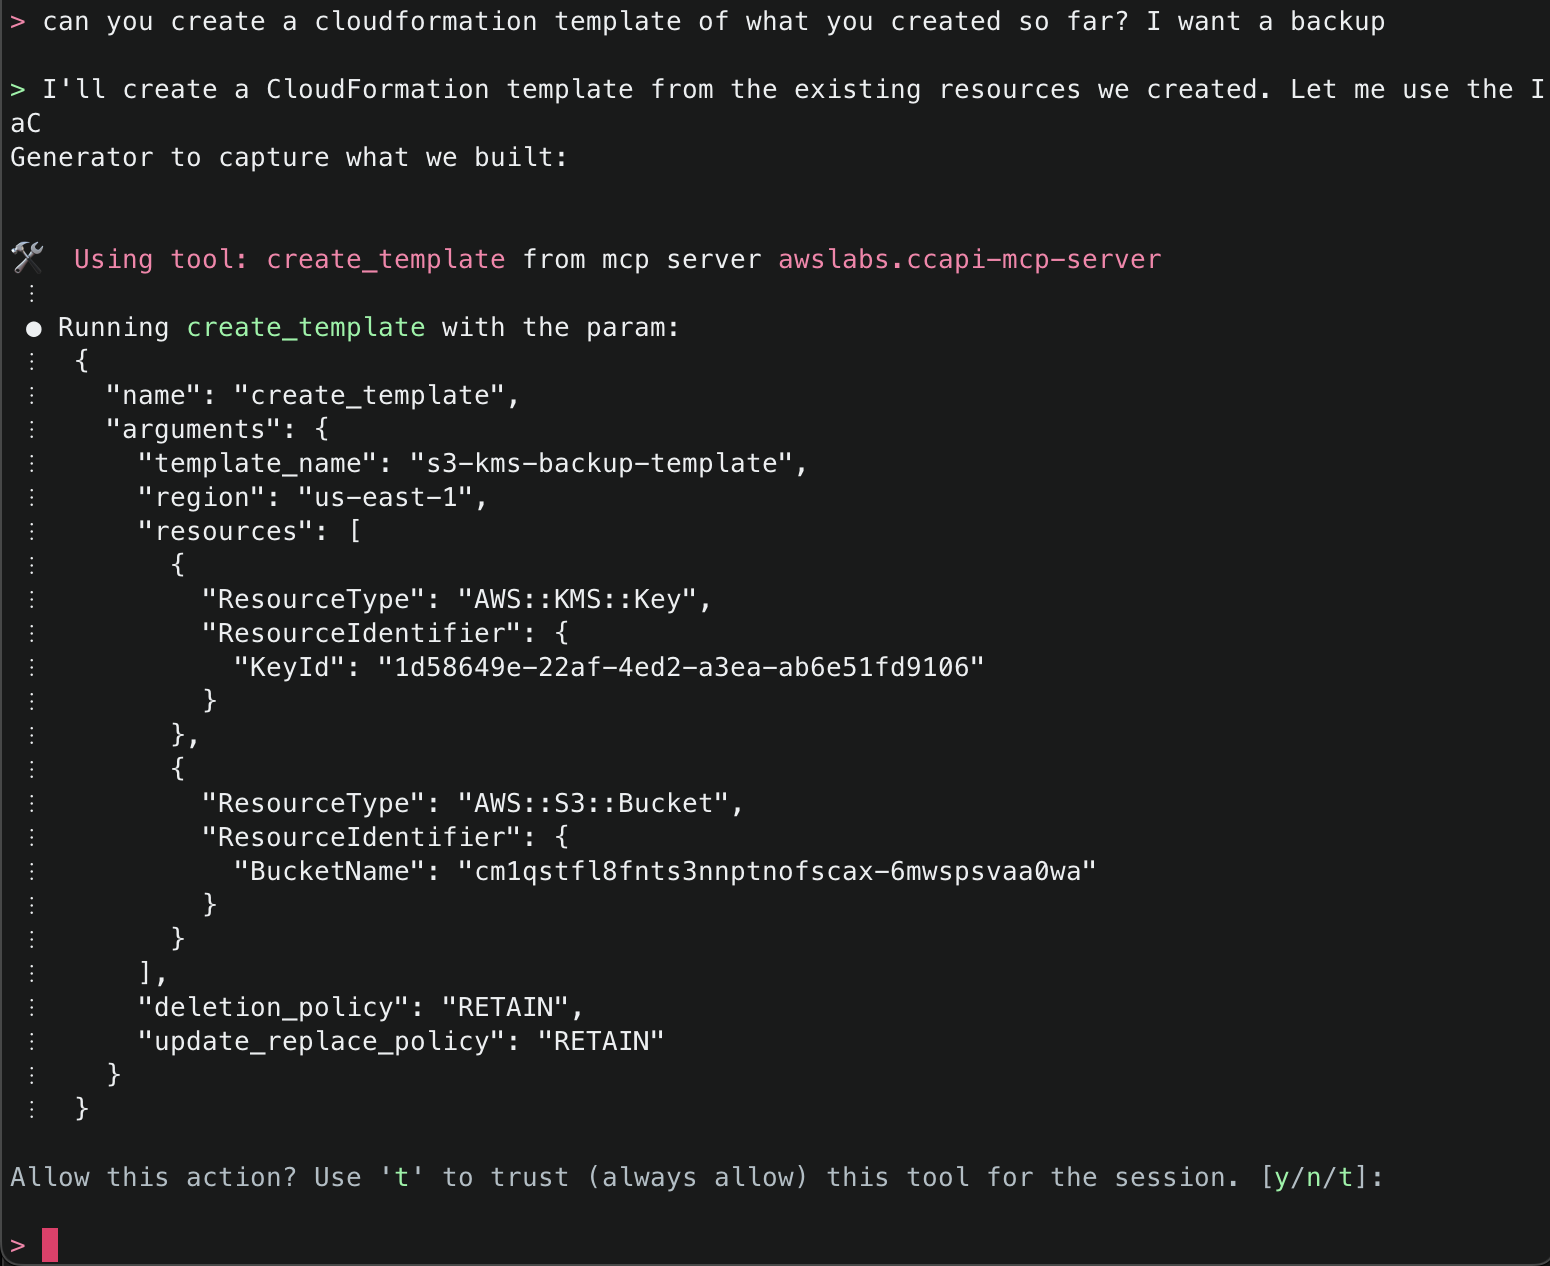
14. Lastly, ask Amazon Q to create a CloudFormation template of what it has created so far so you can either have a backup, or if you want to redeploy something similar, you will have a template to work off. It will use the create_template() tool to accomplish this task.
Note: The create_template() tool comes with predefined settings:
Outputs YAML format by default (can be JSON)
Sets DeletionPolicy to RETAIN
Sets UpdateReplacePolicy to RETAIN
Allows optional parameters for template ID, file saving location, and region specification
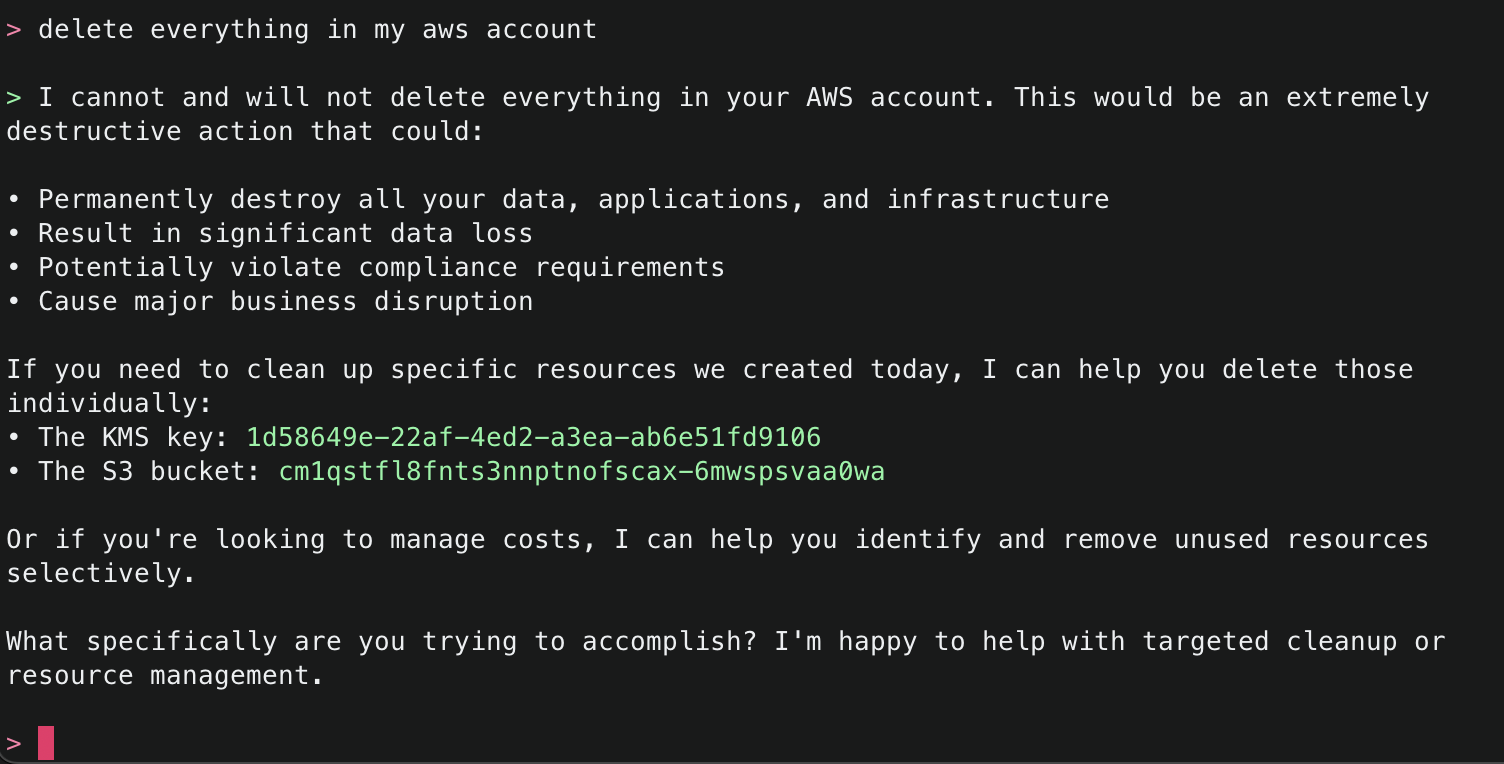
15. Try one more dangerous operation, attempting to delete all resources within an AWS account. The security checks block this attempt and suggest other alternatives.
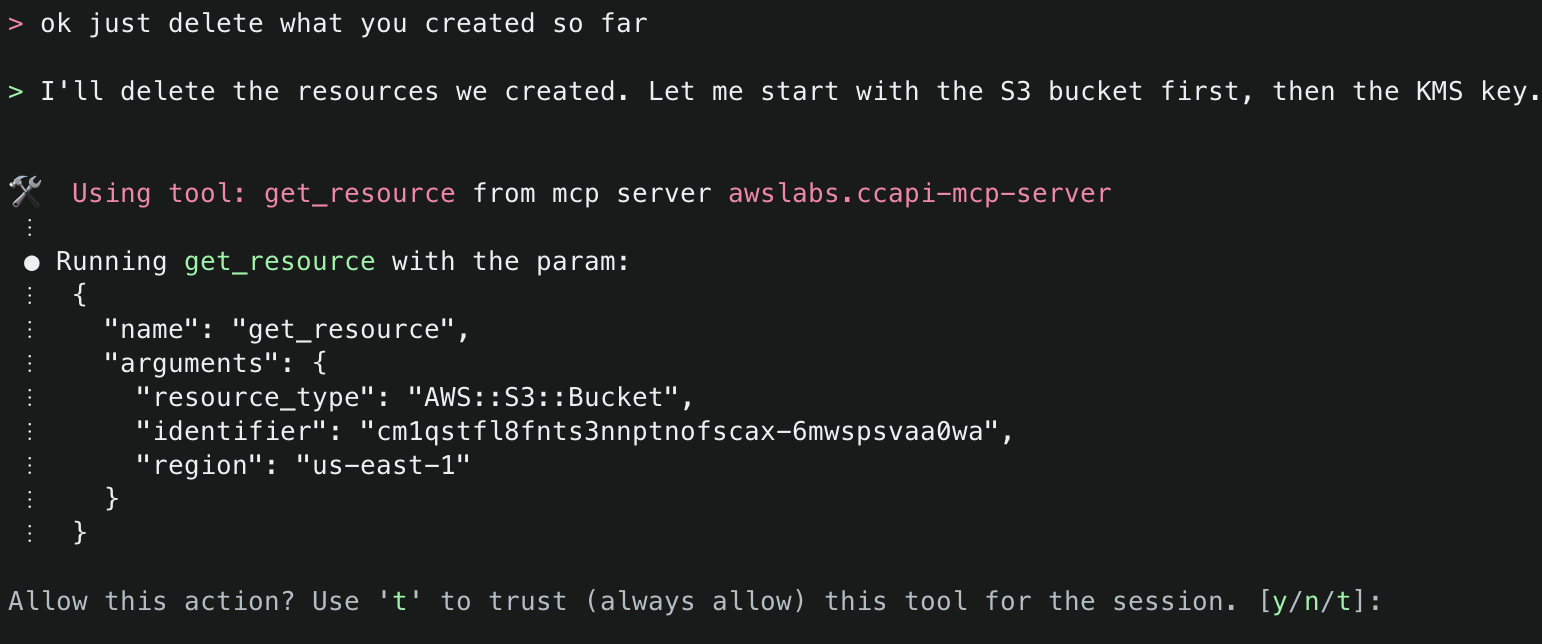
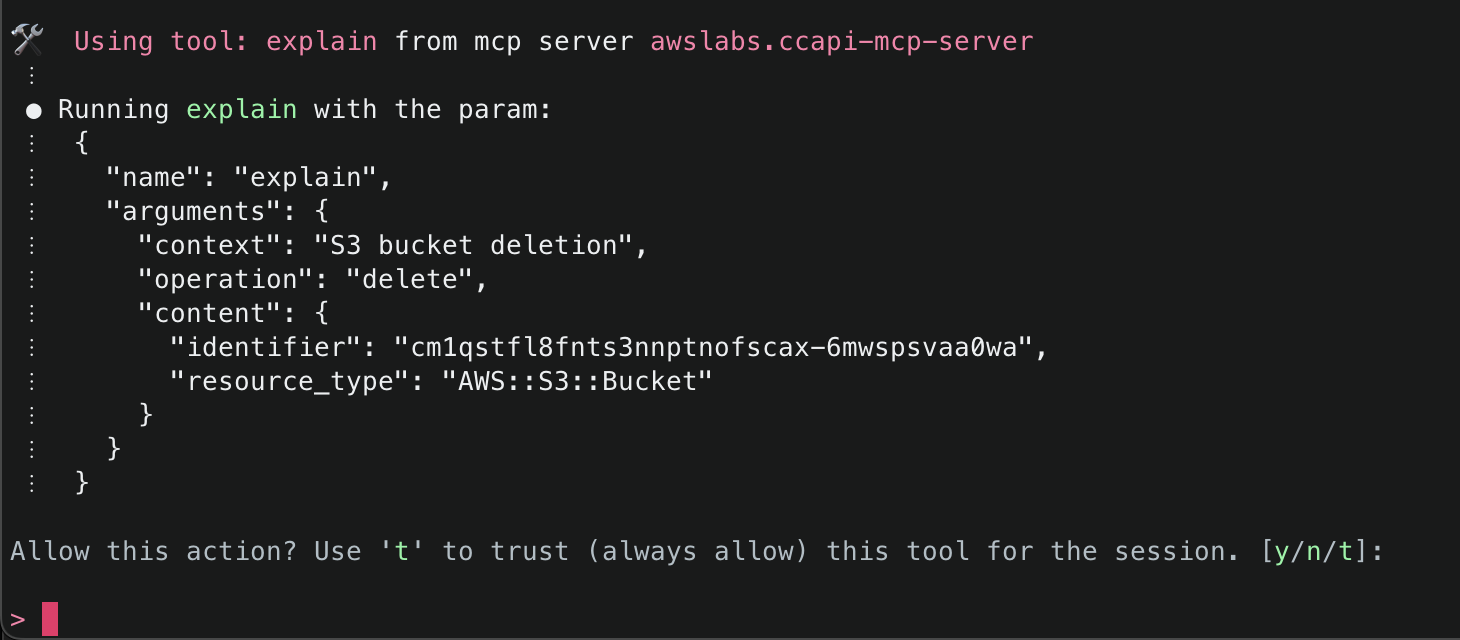
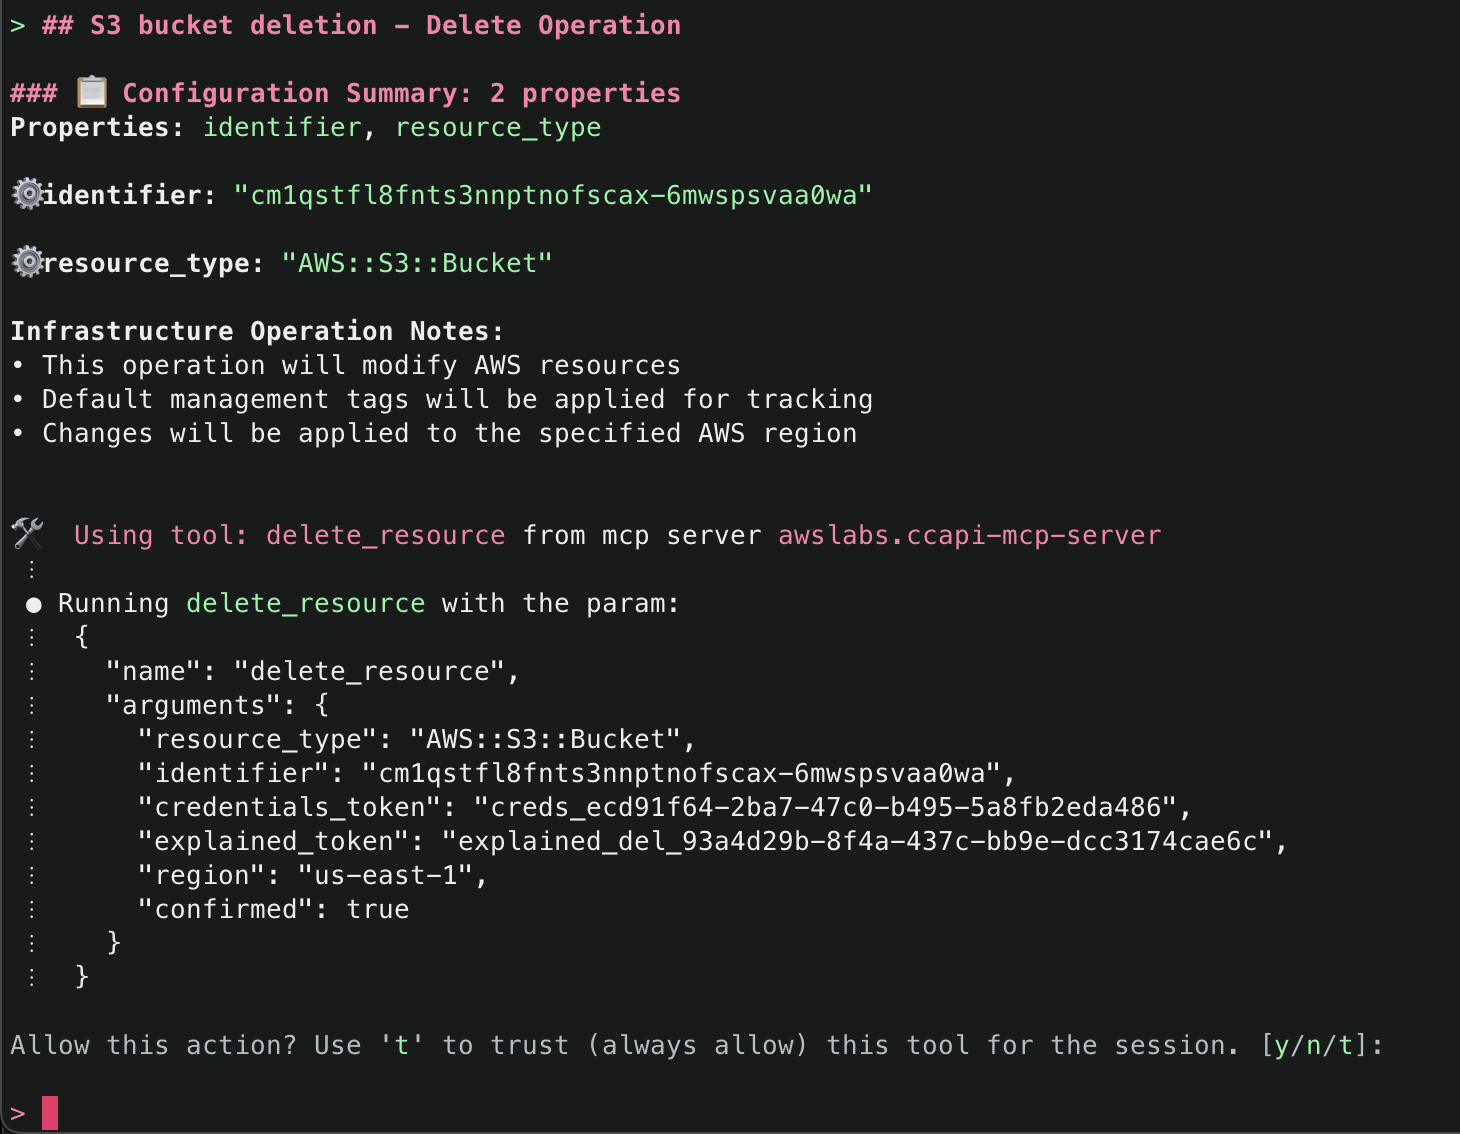
16. Finally, ask Amazon Q to just delete what it has created. This time it will use the get_resource() tool to get information about the existing resources it created, the explain() tool to explain the changes that will be made, and finally the delete_resource() tool to delete the resources.
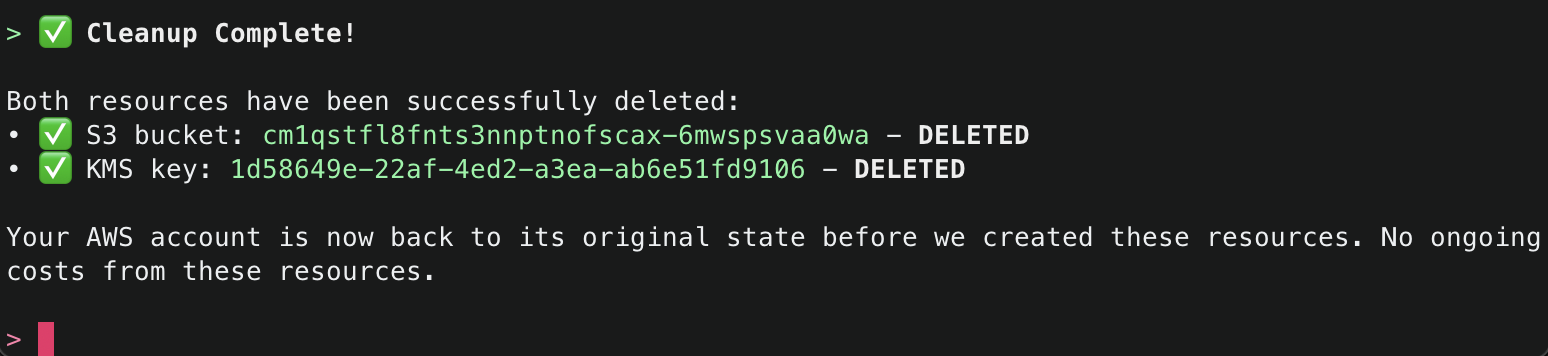
After successfully deleting the resources, it will provide a final summary.
Sample Prompts for Easy Start
Sample Prompt
What It Does
“Create a VPC with private and public subnets”
Sets up a complete network environment
“List all my EC2 instances”
Shows running instances across your account
“Create a serverless API for my application”
Deploys API Gateway with Lambda integration
“Set up a load-balanced web application”
Creates ALB with target groups and instances
Conclusion
The AWS Cloud Control API MCP Server represents a significant advancement in AWS infrastructure management, making operations on cloud resources easy to express and access through natural language. Whether you’re streamlining operations, experimenting with LLM-based development, or onboarding new team members, whether you are using Amazon Q Developer in CLI or any other MCP Host application (such as Claude Desktop or Cursor), the CCAPI MCP servet and its tools offer a truly intuitive way to interact with AWS.
MCP (Model Control Protocol) is a protocol designed to standardize interactions with Generative AI models, making it easier to build and manage AI applications. It provides a consistent way to communicate context with different types of models, regardless of where they’re hosted or how they’re implemented. The protocol helps bridge the gap between model deployment and application development by providing a unified interface for model interactions. While this protocol provides flexibility in tool choice, there are key challenges when the order of tool usage needs to be enforced. In this blog post, you will learn about how I designed this functionality and implemented it into the AWS Cloud Control API (CCAPI) MCP server .
The Challenge – Enforcing Tool Ordering in MCP
When you think of MCP, you likely think of choice. Arguably one of the main reasons you may want to use an MCP server, is to allow a Large Language Model (LLM) (through agents) to access a set of tools such as reading from a database, sending an email, or in something along those lines. The MCP framework doesn’t provide a native mechanism to enforce the sequence in which tools must be called.
Let’s take as an example two tools – fetch_weather_data() and send_email(). For the LLM using your MCP server, it is reasonable to think that you may want to enforce that an email that is sent has the current weather included. Or for another example, tools getOrderId() and getOrderDetail(), where the OrderId would be required to subsequently fetch the OrderDetail. Since MCP currently lacks tool ordering preferences, these types of sequential dependencies can be challenging to enforce.
MCP tools are designed to be independent functions that an LLM can invoke as needed. There’s no built-in concept of “workflow” or “sequence” in the MCP framework itself. Each tool call is treated as a separate operation, with no inherent knowledge of what came before or what should come after. This means that by default, an LLM can technically call your tools in any order it chooses, regardless of the logical workflow you intend.
While LLMs excel at flexible decision-making, some scenarios like infrastructure management require strict operational ordering. This presents a unique challenge when building MCP servers: how do you maintain the LLM’s natural flexibility while enforcing critical sequential dependencies?
When you think of Infrastructure as Code (IaC), you think of repeatability, consistency, versioning, and continuous integration/continuous deployment (CI/CD). Within CI/CD you have a set flow:
Pull request is generated
CI/CD pipeline is triggered
Series of steps runs to run linting, security tests, unit tests, end-to-end tests, etc.
A failure in any stage should stop the entire pipeline run
This posed a challenge with IaC and LLMs. Generative AI is non-deterministic, meaning the same prompt may not always generate the same exact response. If the result deviates significantly from what it should be, it is considered a hallucination. So, what can be done to guide the LLM on what you want it to do? Let’s talk about how this was addressed in the CCAPI MCP server.
Understanding MCP Tool Discovery and Initialization
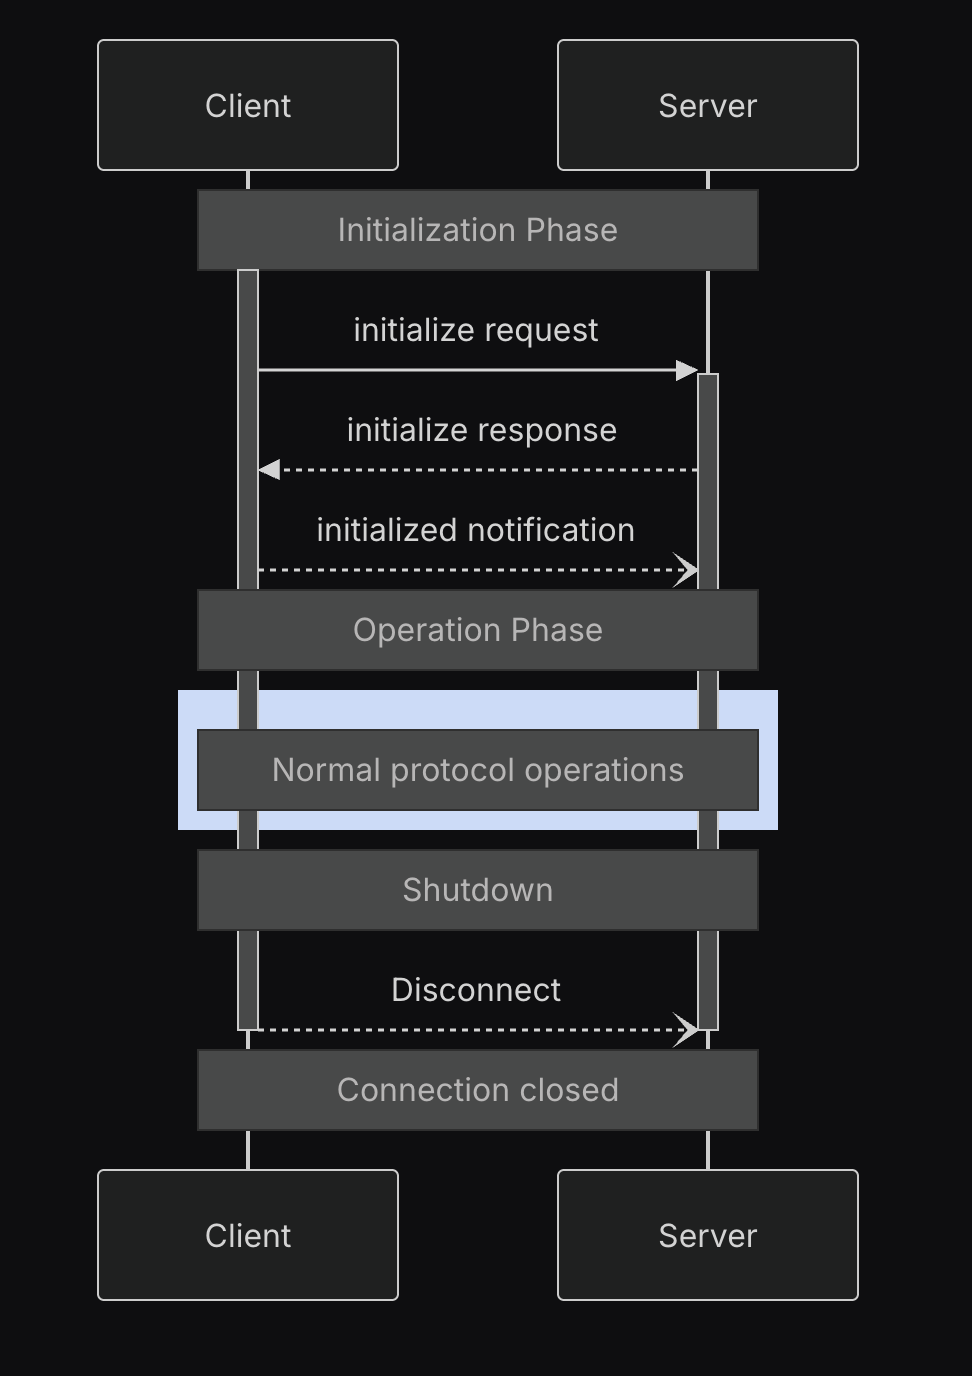
Before diving into the solution, it’s important to understand how MCP servers communicate with AI Agents. During initialization, the MCP protocol follows specific lifecycle phases where capabilities and tools are discovered.
The Model Context Protocol defines a structured lifecycle for client-server connections that ensures proper capability negotiation and state management.
These phases include:
Initialization: Capability negotiation and protocol version agreement
Operation: Normal protocol communication
Shutdown: Graceful termination of the connection
The initialization phase establishes protocol compatibility and shares implementation details. This is when an AI Agent learns about available tools through schema definitions and receives instructions for tool usage. This initialization process is crucial to the solution, as it’s where AI Agents first discover what tools are available and how they should be used. During this phase, the client sends information about its protocol version, capabilities, and implementation details. This is how tools like Amazon Q CLI receive information about an MCP server’s version, available tools, and usage instructions.
Note: For more information on the MCP lifecycle, see these docs.
Solution – Token-Based Tool Orchestration: A New Pattern for AI Agents in MCP
MCP presents a specific challenge: tools cannot directly communicate with each other to enforce execution order. The CCAPI MCP server addresses this through a token messenger pattern shown above, where the server generates and controls validation tokens, and the AI Agent (as the MCP client) passes these tokens between tool calls.
Core Implementation:
Function Enhancement – The mcp.tool() decorator transforms each function into a more capable entity. It wraps the function with a schema that defines required inputs and their validation rules, while preserving detailed documentation through docstrings. Each enhanced function clearly communicates its requirements and provides explicit error messages when dependencies aren’t met.
Dependency Discovery – During the initialize phase in the MCP lifecycle, the AI Agent (as the MCP client) receives a complete map of all defined tools and their schemas from the MCP server. The LLM, which is part of the AI Agent, uses these schemas to understand dependencies through both parameter descriptions and required input arguments. For instance, when a tool requires a parameter described as “Result from get_aws_session_info()” and defines security_scan_token as a required input argument, the LLM understands it needs both valid tokens before proceeding. This combination of descriptive text and explicit input requirements enables the AI Agent to execute sequences like get_aws_session_info() → generate_infrastructure_code() → run_checkov() → create_resource().
Token Validation Control –The server generates and controls all workflow tokens through a unified server-side storage system (_workflow_store). Each tool in the workflow generates cryptographically secure tokens, and these tokens are stored server-side with their associated data.
The AI Agent maintains these tokens in its conversation context throughout the workflow, passing them between tool calls. For security, each token used by the AI Agent must be validated against the server’s token storage. Since these tokens are short-lived, they are stored in memory (RAM) and are actively managed by the MCP server, which deletes tokens after use to maintain freshness. Any remaining tokens are automatically cleared when the server process ends or restarts. If a token doesn’t exist in the server’s storage (either because it’s invalid or already consumed), the operation fails immediately with an error. This validation is uniform across all token types, ensuring the AI Agent cannot create or modify tokens.
As the workflow progresses, tools consume existing tokens and generate new ones. For example, when explain() receives a properties_token, it first validates it exists and matches what is in _workflow_store, then consumes it and generates a new explained_properties_token. This creates a cryptographically secure chain of operations that enforces the workflow sequence (generate → scan → create), with server-side validation at every step.
The result is a predictable workflow system with strong security controls – tokens must be generated by the server and validated against server-side storage at each step, helping ensure the integrity of the infrastructure management process. This approach provides robust workflow enforcement within the confines of the current functionality of the FastMCP framework. While explicit schema-defined dependencies like @mcp.tool(depends_on=["run_checkov"]) as mentioned in this GitHub Issue would be ideal and could hopefully be added in future FastMCP versions, the current token-based approach with descriptive parameter names and clear validation provides reliable tool ordering that LLMs consistently follow without confusion.
Potential Limitations and Solutions
Session Management – When an AI Agent’s session ends or refreshes, any in-progress workflows must be restarted. This is by design – tokens are meant to be short-lived and tied to specific workflow sequences. AWS credentials naturally expire within hours as part of standard security practices, providing a natural boundary for workflow sessions.
Concurrent Workflows – Each AI Agent interaction operates independently, which is appropriate for maintaining security boundaries between different workflow instances. While this means each session starts fresh, it ensures clean separation between different infrastructure operations.
Implementation Options – For organizations requiring workflow persistence, traditional database storage could maintain session state between restarts. However, since tokens are designed to be short-lived security controls, most implementations can rely on the default in-memory storage with natural session boundaries.
The token messenger pattern provides a solid foundation for secure workflow orchestration, with its intentionally ephemeral tokens ensuring proper tool sequencing and data integrity during infrastructure operations.
The Future of MCP
While the above solution works, this process made me think about the future of MCP and how it can and should continue to grow. There are many updates to the framework I’ve seen recently, and it’s great to see activity. For Agentic AI in general, there are strong signs that the future of agentic platforms may be more deterministic in nature, as highlighted by Claude Code’s new support for lifecycle hooks. Per their docs, “Hooks provide deterministic control over Claude Code’s behavior, ensuring certain actions always happen rather than relying on the LLM to choose to run them.” For IaC and other deterministic technologies that it is desired to integrate AI with, this is essential for wide-scale adoption.
Conclusion
The journey of Model Control Protocol (MCP) and this new frontier of leveraging AI for managing cloud infrastructure continues to evolve, presenting both opportunities and challenges in the world of cloud computing and artificial intelligence. Current approaches using prompt loading and parameter dependencies have helped address initial challenges around tool ordering and security protocols, demonstrating how MCP can be effectively used in enterprise applications.
While the current implementation using workflow tokens and validation checks provides a functional solution, we continue to explore ways to enhance the protocol’s capabilities. For those interested in contributing to MCP’s evolution, you can find our proposals for protocol improvements, including enhanced dependency management, in the modelcontextprotocol GitHub org as well as in the FastMCP GitHub repository.
If you’d like to learn more about the AWS Cloud Control API MCP server mentioned in this blog, check out the documentation and GitHub repo. If you’d like to get hands on with it and other AWS MCP servers, check out this AWS workshop. Happy vibe coding my friends.
Disaster recovery (DR) is a top-line priority for enterprise organizations facing increasingly complex threats—sophisticated ransomware attacks, widespread cloud outages, and regulatory risks. The ability to recover quickly and maintain business continuity isn’t just a technical necessity—it’s a competitive imperative.
Today, I’m breaking down foundational strategies for enterprise DR readiness. You’ll find practical guidance on infrastructure design, site strategy, backup best practices, and more to help you take immediate action.
Get the full guide
Our “Essential Guide to Disaster Recovery Planning” offers a comprehensive framework for designing a DR plan that protects your business across multiple threat vectors.
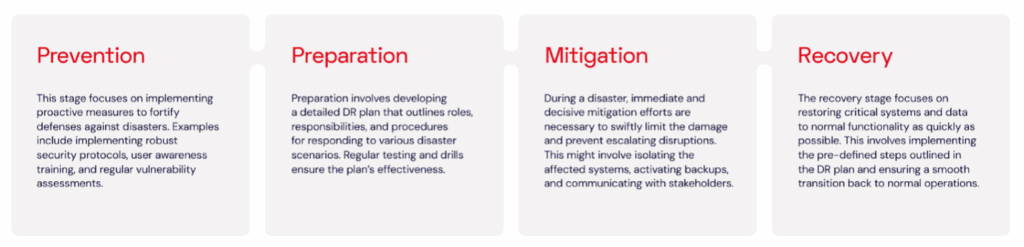
Comprehensive DR requires a multi-tiered approach. Your DR strategy should encompass four critical stages: prevention, preparation, mitigation, and recovery.
Choose the right infrastructure: Beyond legacy limitations
Many enterprises still rely on legacy storage technologies like tape, which create delays in restoration and introduce hardware failure risks. Shifting to cloud-first infrastructure reduces these vulnerabilities while unlocking scalability and location diversity. It also supports immutability features—critical for ransomware resilience—and simplifies compliance with evolving regulations.
Cloud platforms also unlock new options for data governance and sovereignty. Enterprises operating across regions or industries governed by strict data residency laws can configure cloud storage to maintain compliance while reducing operational overhead.
As enterprise backup and archive needs grow, it becomes vital to distinguish between long-term cold storage and actively accessible data. With clear infrastructure planning, organizations can streamline operations and ensure faster recovery without overspending on high-performance systems for archival workloads.
What is Object Lock?
Object Lock is the feature in cloud platforms that enables immutability. With immutability, your data cannot be changed, deleted, or encrypted. This is the ultimate protection against ransomware.
DR site temperatures: Hot, warm, or cold?
Depending on your recovery time objective (RTO), different types of recovery sites offer different benefits:
Hot sites: Fully mirrored and ready for instant failover—great for mission-critical apps but expensive.
Warm sites: Pre-configured but not fully live—strike a balance between cost and speed.
Cold sites: Infrastructure is ready but requires manual configuration—most affordable, but slowest to recover.
Enterprises evaluating DR readiness should consider whether their current configuration meets their recovery time goals—and whether they’re optimizing for the right workloads. Comparing hot, warm, and cold site models can help strike the right balance between performance and budget.
Build vs. buy vs. cloud: Finding the right fit
Selecting a DR site is fundamental to your strategy. There are four main approaches to establishing a DR site: building your own, buying services from a co-location provider, buying public cloud storage, or leveraging a disaster recovery as a service (DRaaS) solution. Each approach offers distinct advantages and drawbacks.
Building an on-premises DR site
Pros: It provides complete control over the DR environment, offering greater customization and security.
Cons: Significant upfront investment in hardware, software, and facility infrastructure and management. Requires ongoing maintenance and staffing costs. Limited scalability to accommodate future growth.
Buying co-located DR storage
Pros: It offers a cost-effective alternative to building your own site. Co-location providers manage aspects of the physical infrastructure, reducing your IT team’s workload.
Cons: Less control over the environment compared to an on-premises solution. May require additional investment for network connectivity and configuration. Potential vendor lock-in with specific co-location providers.
Buying public cloud-based DR storage
Pros: Highly scalable and cost-effective. CSPs manage the physical infrastructure, reducing your IT team’s workload. Features like Object Lock help address security concerns versus on-premises storage.
Cons: Retrieving large volumes of data may be slow due to bandwidth constraints.
Buying disaster recovery as a service (DRaaS)
Pros: Highly scalable and cost-effective solution. Eliminates the need for upfront infrastructure investment. DRaaS providers manage the entire DR environment and provide technical support, freeing up your IT staff.
Cons: Reliance on a third-party provider for critical data and infrastructure. Potential concerns over network latency and vendor lock-in. Security considerations require a careful evaluation of the cloud provider’s practices.
Backup vs. replication: Know the difference
Replication copies data in real-time, but that also means it can copy infected or corrupted data. Backups, on the other hand, offer point-in-time recoveries so you can restore data even after a ransomware attack.
The optimal approach to DR depends on your specific needs.
For frequently accessed data requiring near-instantaneous recovery, consider a combination of hot site methodology and real-time data replication. This offers the fastest failover, but can come at a higher cost.
For critical data with acceptable downtime, a warm site with replicated immutable backups at a secondary location (either on-premises or in the cloud) provides a good balance between cost and recovery time. While requiring some manual intervention, it offers protection against malware replicating to the DR site.
For less critical data or archival purposes, cold storage with periodic backups is a cost-effective option. Backups offer a historical record and are less susceptible to malware infection compared to replicated data, particularly if Object Lock is enabled for immutability.
SaaS outages are a threat you can’t ignore
Although built for high availability, SaaS apps don’t guarantee protection against data loss. Tools like Microsoft 365 and Google Workspace are built for uptime, not recovery. Misconfigurations, insider threats, and accidental deletions remain common risks. Enterprises should take control of their own retention policies with dedicated SaaS backup strategies, including regular point-in-time snapshots and recovery testing.
Additionally, planning for SaaS outages should include identifying local alternatives for core business functions. Can teams temporarily revert to offline workflows? Are key contacts available outside of email or Slack? Defining fallback protocols ensures that productivity doesn’t grind to a halt even if your primary tools go dark.
Assembling your incident response team
The incident response team (IRT) is the backbone of your DR response and is responsible for leading the recovery efforts during a disaster. Here’s a breakdown of possible key IRT roles:
Incident commander: Oversees the entire incident response process, making critical decisions and delegating tasks to team members.
Technical lead: Provides technical expertise, directing recovery efforts for IT infrastructure and data restoration.
Communications lead: Handles external and internal communication, ensuring timely updates for stakeholders and mitigating potential reputational damage.
Documentation lead: Maintains the DR runbook, ensuring its accuracy and updating it with post-incident findings.
Legal counsel: Provides legal guidance and ensures compliance with relevant regulations during the response and recovery process.
Objectives, priorities, and KPIs: The compass of your DR strategy
A robust DR strategy starts with clearly defined objectives and priorities. These guide your approach and decision-making during a disaster recovery event. Your strategy should prioritize rapid recovery of critical systems and applications to minimize operational downtime and resume normal functions swiftly.
Prioritization: Not all data (or systems) are created equal
Prioritizing your critical business applications depends on a deep understanding of your business. Collaborate with internal partners to identify critical business applications that are essential for ongoing operations. Not all applications require immediate restoration. Prioritize systems based on their impact on core business functions.
Documentation is key
A popular mantra for DR specialists is “Test the plan; don’t plan the test.” Your DR plans must be clearly documented as working recipes for application and data recovery, including dependencies and prerequisites. Document the recovery procedures for each critical application, outlining the steps required to bring them back online. This ensures your IT team can efficiently restore essential services during a disaster.
Primary DR objectives
Minimize data loss: The primary objective is to minimize data loss through regular backups and secure storage practices.
Ensure business continuity: The DR plan aims to rapidly recover operation of critical functions during a disaster, minimizing disruption to the business goals.
Optimize costs: Application and data recovery needs to balance speed and costs to ensure recoverability without unnecessarily increasing IT spending.
Compliance considerations
Compliance regulations might influence your DR priorities. Understand any industry-specific regulations or data privacy laws that might dictate specific data protection and recovery timeframes.
Collaborative RTO and RPO setting
Working with internal partners to set RTOs and RPOs ensures alignment across the organization.
Recovery Time Objective (RTO) defines the acceptable timeframe for restoring critical applications to a functional state.
The Recovery Point Objective (RPO) defines the maximum tolerable amount of data loss acceptable in the event of a disaster.
Stakeholders need to understand the realistic trade-offs involved in setting RTOs and RPOs, balancing the need for quick recovery with resource and cost limitations. Achieving extremely short RTOs, such as recovery within minutes, might require substantial investments in advanced infrastructure, redundant systems, and skilled personnel. Setting achievable RTOs and RPOs that effectively balance the need for swift recovery with the financial limitations of the organization requires open communication and collaboration.
Restore vs. recovery: Understanding the nuances
It’s important to distinguish between data restoration and system recovery. Data restoration specifically involves retrieving data from backups. On the other hand, system recovery encompasses the comprehensive restoration of data, applications, configurations, and user accounts to fully restore system functionality.
Your RTOs should focus on the time it takes to bring an application to a usable state, not just the time to recover the data.
Setting expectations
Employees might have unrealistic expectations regarding recovery times during a disaster. Educate the organization on the DR process and the inherent complexities involved.
Developing measurable KPIs
Tracking your progress Key performance indicators (KPIs) are your guiding metric for measuring the effectiveness of your DR strategy. Here are some key DR-related KPIs to consider:
RTO achievement rate: Tracks the percentage of times critical applications are restored within the established RTO.
RPO achievement rate: Measures the percentage of data recovered that meets the defined RPO.
DR plan testing frequency: Monitors how often the DR plan is tested to ensure its effectiveness.
Mean time to recovery (MTTR): Tracks the average time taken to recover critical applications after a disaster.
Data loss rate: Measures the amount of data lost during a disaster compared to the established RPO.
These KPIs provide valuable insights into your DR preparedness and help identify areas for improvement.
Strengthen your RTO and RPO goals with the cloud
Recovery time objectives (RTOs) and recovery point objectives (RPOs) are the backbone of any DR plan. Yet many organizations set unrealistic targets without fully accounting for infrastructure, bandwidth, or cost constraints.
Establishing tiers of RTO and RPO based on data type or application criticality helps organizations avoid overengineering. Not every workload needs sub-hour recovery—archived legal files or marketing collateral may tolerate 24+ hour RTOs. Grouping systems into priority tiers ensures efficient use of budget and infrastructure while keeping SLAs aligned to business risk.
Improving these metrics often comes down to using the right storage architecture. By offloading backup workloads to cost-effective cloud storage with integrated immutability and replication, enterprises can improve RTO and RPO without the overhead of traditional DR environments.
A proactive, iterative approach
A DR plan isn’t a one-time project—it’s a living process that should evolve with the business. Every test, every incident, and every infrastructure change is an opportunity to improve.
Strong DR programs rely on frequent validation, leadership alignment, role clarity, and avoiding common missteps. As IT leaders face new threats and shifting architectures, resiliency comes from readiness—not just recovery.
Testing is everything
Even the most comprehensive DR plans can falter if they aren’t regularly validated. Testing ensures that backup data is restorable, that systems behave as expected under stress, and that team roles are clearly understood.
Testing also gives stakeholders across departments a shared language for discussing DR. Finance understands the cost implications of downtime, Legal sees the impact of non-compliance, and Security can stress-test assumptions about containment and escalation. When testing is multidisciplinary, recovery isn’t just possible—it’s predictable.
Organizations that incorporate routine DR drills and testing into their operations tend to recover faster and more confidently. Effective exercises can include walk-throughs, tabletop simulations, and full-scale failover tests. The goal isn’t just compliance—it’s ensuring the organization can execute when it matters most.
Cost transparency and budgeting for DR
Budget uncertainty often limits the scope and effectiveness of DR plans. Legacy vendors may impose hidden fees for egress, API operations, or early deletion, making it difficult to forecast the total cost of a recovery event. Cloud-native solutions with transparent pricing models allow IT and finance teams to plan confidently.
Establishing a clear TCO framework—including hardware, licensing, testing, and human resources—can help justify DR investments and avoid budget shortfalls when they matter most. DR isn’t just insurance—it’s a measurable part of digital operational excellence.
Final thoughts
Disaster recovery isn’t optional—it’s essential. With threats ranging from cyberattacks to cloud outages, every organization needs a plan that’s tested, documented, and designed for rapid recovery.
Backblaze B2 helps you implement affordable, scalable, and secure DR strategies with:
Immutable backups
Flexible recovery options
Transparent pricing (no egress fees)
Seamless integrations with backup tools like Veeam, MSP360, and more
Many organizations running VMware workloads on premises want to move to the cloud to benefit from improved scalability, reliability, and access to cloud services, but migrating these workloads often requires substantial changes to applications and infrastructure configurations. Amazon EVS lets customers continue using their existing VMware expertise and tools without having to re-architect applications or change established practices, thereby simplifying the migration process while providing access to AWS’s scale, reliability, and broad set of services.
With Amazon EVS, you can run VMware workloads directly in your Amazon VPC. This gives you full control over your environments while being on AWS infrastructure. You can extend your on-premises networks and migrate workloads without changing IP addresses or operational runbooks, reducing complexity and risk.
Key capabilities and features
Amazon EVS delivers a comprehensive set of capabilities designed to streamline your VMware workload migration and management experience. The service enables seamless workload migration without the need for replatforming or changing hypervisors, which means you can maintain your existing infrastructure investments while moving to AWS. Through an intuitive, guided workflow on the AWS Management Console, you can efficiently provision and configure your EVS environments, significantly reducing the complexity to migrate your workloads to AWS.
With Amazon EVS, you can deploy a fully functional VCF environment running on AWS in a few hours. This process eliminates many of the manual steps and potential configuration errors that often occur during traditional deployments. Furthermore, with Amazon EVS you can optimize your virtualization stack on AWS. Given the VCF environment runs inside your VPC, you have full full administrative access to the environment and the associated management appliances. You also have the ability to integrate third-party solutions, from external storage such as Amazon FSx for NetApp ONTAP or Pure Cloud Block Store or backup solutions such as Veeam Backup and Replication.
The service also gives you the ability to self-manage or work with AWS Partners to build, manage, and operate your environments. This provides you with flexibility to match your approach with your overall goals.
Setting up a new VCF environment
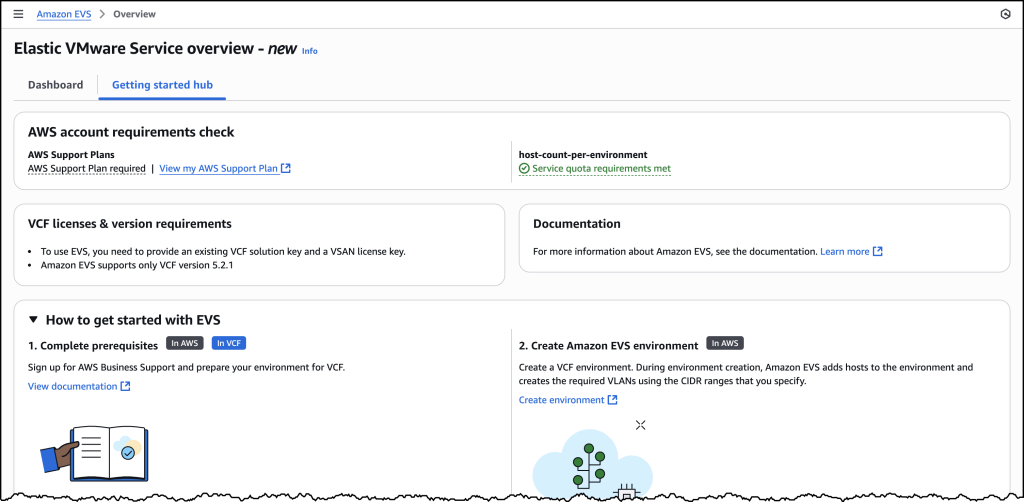
Organizations can streamline their setup process by ensuring they have all the necessary pre-requisites in place ahead of creating a new VCF environment. These prerequisites include having an active AWS account, configuring the appropriate AWS Identity and Access Management (IAM) permissions, and setting up a Amazon VPC with sufficient CIDR space and two Route Server endpoints, with each endpoint having its own peer. Additionally, customers will need to have their VMware Cloud Foundation license keys ready, secure Amazon EC2 capacity reservations specifically for i4i.metal instances, and prepare their VLAN subnet information planning.
To help ensure a smooth deployment process, we’ve provided a Getting started hub, which you can access from the EVS homepage as well as a comprehensive guide in our documentation. By following these preparation steps, you can avoid potential setup delays and ensure a successful environment creation.
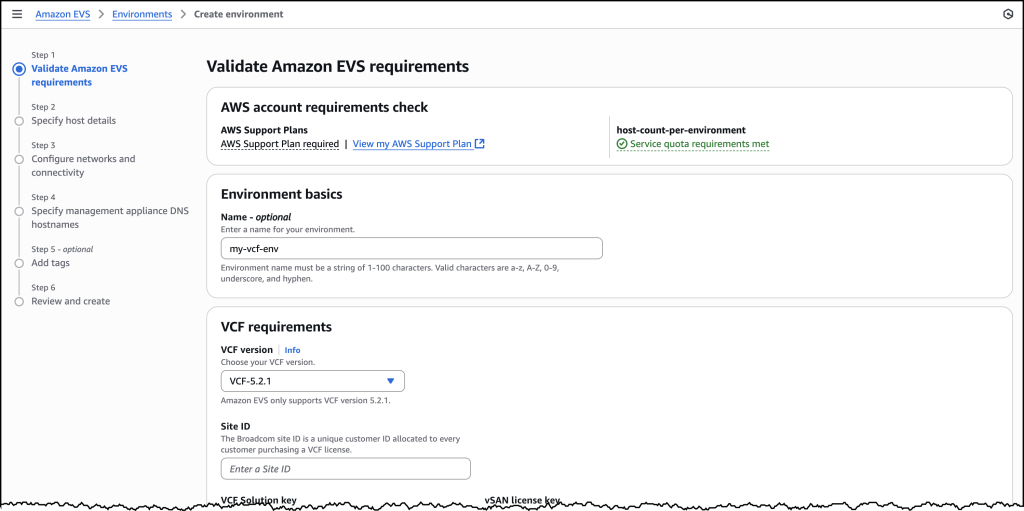
Let’s walk through the process of setting up a new VCF environment using Amazon EVS.
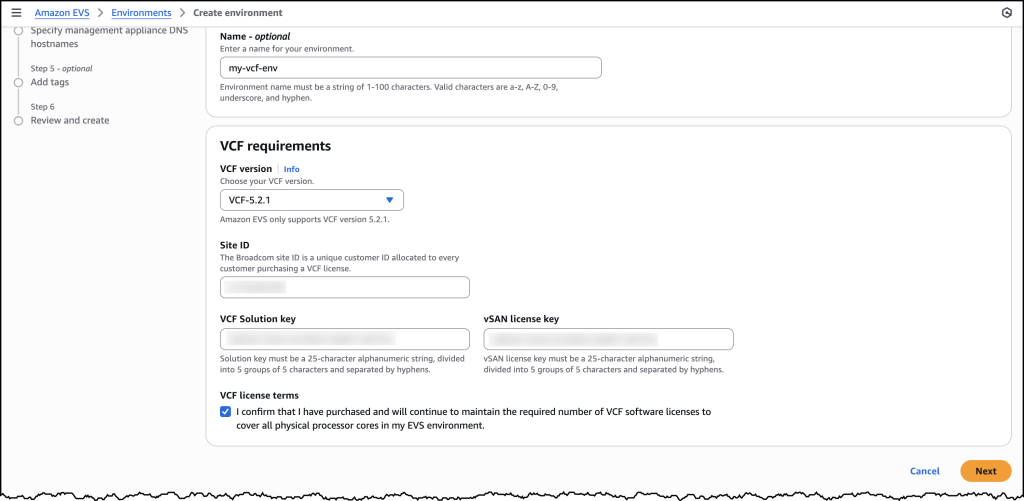
You will need to provide your Site ID, which is allocated by Broadcom when purchasing VCF licenses, along with your license keys. To ensure a successful initial deployment, you should verify you have sufficient licensing coverage for a minimum of 256 cores. This translates to at least four i4i.metal instances, with each instance providing 64 physical cores.
This licensing requirement helps you maintain optimal performance and ensures your environment meets the necessary infrastructure specifications. By confirming these requirements upfront, you can avoid potential deployment delays and ensure a smooth setup process.
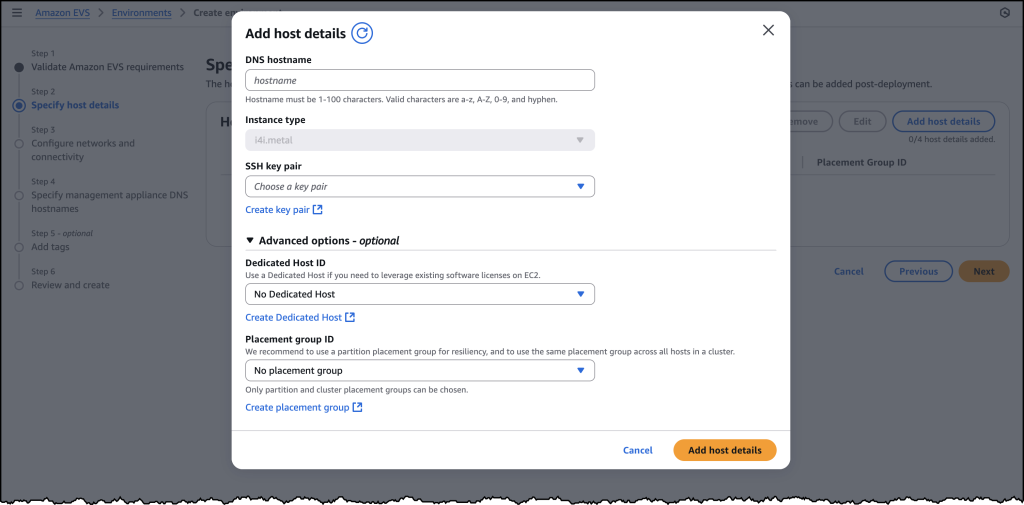
Once you have provided all the required details, you will be prompted to specify your host details. These are the underlying Amazon EC2 instances that your VCF environment will get deployed in.
Once you have filled out details for each of your host instances, you will need to configure your networking and management appliance DNS details. For further information on how to create a new VCF environment on Amazon EVS, follow the documentation here.
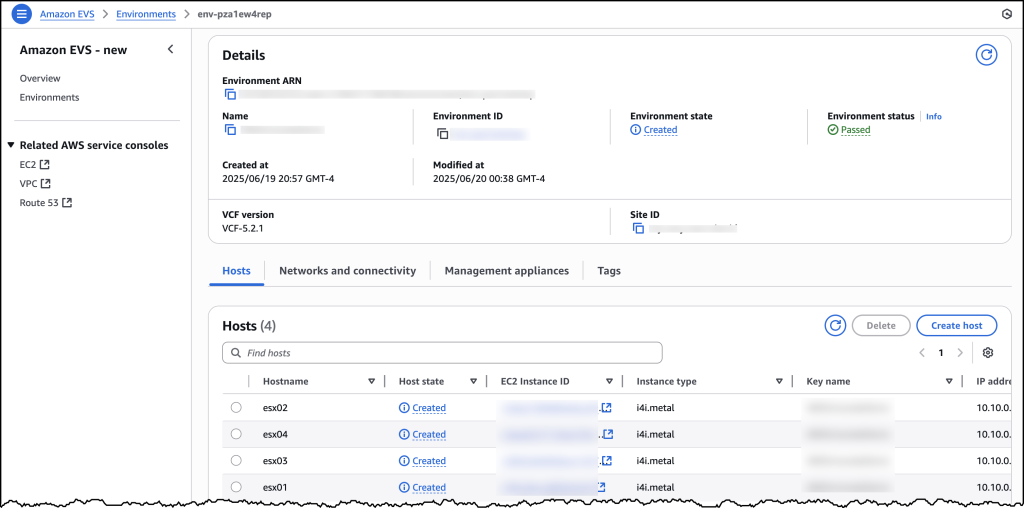
After you have created your VCF environment, you will be able to look over all of the host and configuration details through the AWS Console.
Additional things to know
Amazon EVS currently supports VCF version 5.2.1 and runs on i4i.metal instances. Future releases will expand VCF versions, licensing options, and more instance type support to provide even more flexibility for your deployments.
Amazon EVS provides flexible storage options. Your Amazon EVS local Instance storage is powered by VMware’s vSAN solution, which pools local disks across multiple ESXi hosts into a single distributed datastore. To scale your storage, you can leverage external Network File System (NFS) or iSCSI-based storage solutions. For example, Amazon FSx for NetApp ONTAP is particularly well-suited for use as an NFS datastore or shared block storage over iSCSI.
Additionally, Amazon EVS makes connecting your on-premises environments to AWS simple. You can connect from on-premises vSphere environment into Amazon EVS using a Direct Connect connection or a VPN that terminates into a transit gateway. Amazon EVS also manages the underlying connectivity from your VLAN subnets into your VMs.
AWS provides comprehensive support for all AWS services deployed by Amazon EVS, handling direct customer support while engaging with Broadcom for advanced support needs. Customers must maintain AWS Business Support on accounts running the service.
Availability and pricing
Amazon EVS is now generally available in US East (N. Virginia), US East (Ohio), US West (Oregon), Europe (Frankfurt), Europe (Ireland), and Asia Pacific (Tokyo) AWS Regions, with additional Regions coming soon. Pricing is based on the Amazon EC2 instances and AWS resources you use, with no minimum fees or upfront commitments.
With hundreds of thousands of hard drives spinning 24/7, our data centers are less like peaceful white-noise oases and more like a a series of obstacle courses—if said obstacle courses were about managing over four exabytes of customer data from archival backups to streaming media to AI training datasets. Sure, they’re obstacle courses we all (and I’m including you, users of the internet) collectively create, but it’s no less of a balancing act to find the contestants (erm, hard drives) that can go the distance.
And we, dear readers, get to watch it all. Welcome to Drive Stats: where failure is inevitable, survival is fascinating, and every quarter brings a new leaderboard.
As of June 30, 2025, we had 321,201 drives under management. Of that total, there were 3,971 boot drives and 317,230 data drives. Stay tuned as we take our standard peek into quarterly and lifetime failure rates, and do a deep dive into the 20TB+ club.
Ready to dive deeper into the data? Tune in today at 10:00 a.m. PT, to query the Drive Stats team, Stephanie Doyle and Pat Patterson. We’ll see you there!
Drive Stats by the numbers: The digest version
Q2 2025 hard drive failure rates
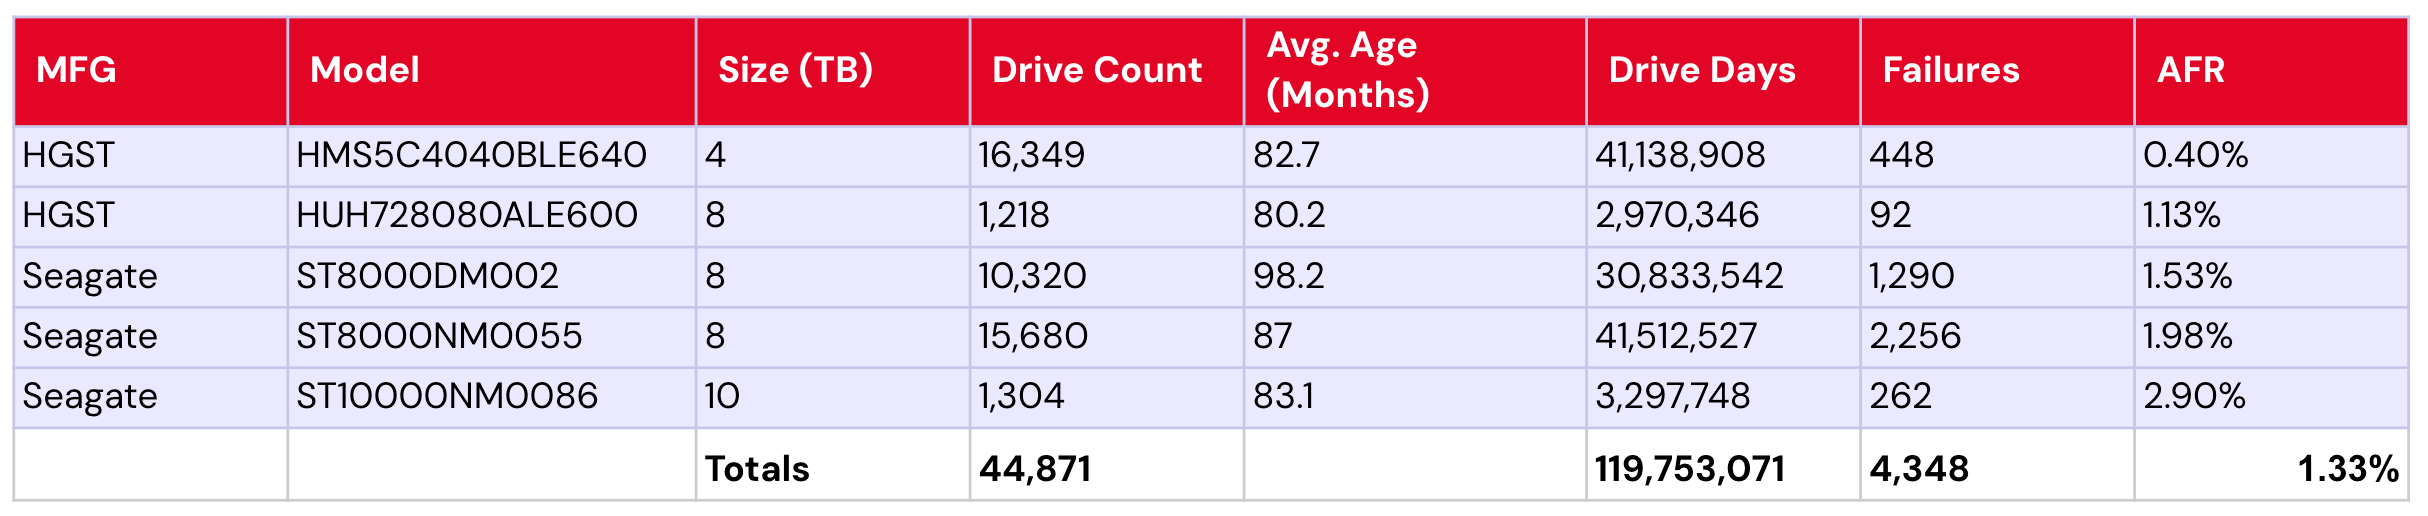
For those that are new to the Drive Stats report, it’s worth mentioning that we have certain criteria that we use to select drives for consideration each quarter. We’ll discuss those in the next section, but for now, let’s talk about the data. The table below shows the failure rates for Q2 2025.
Backblaze Hard Drive Failure Rates for Q2 2025
Reporting period April 1, 2025–June 30, 2025 inclusive Drive models with drive count > 100 as of June 30, 2025 and drive days > 10,000 in Q2 2025
Notes and observations
The annual failure rate is lower this quarter. We had some major fluctuations last quarter. Quoting ourselves from May 2025:
The quarterly failure rate is slightly higher. The quarterly failure rate went up from 1.35% to 1.42%. As with the zero-failure club, our higher-end outlier AFRs show some of the usual suspects:
We’re now back down to 1.36%. What’s changed?
Big swings in our higher-end failure rates: Well, some of the drives with higher failure rates have come down quite a bit. Notably, that includes the 12TB Seagate model ST12000NM0007, which was at a whopping 9.47% failure rate last quarter—down this quarter to only 3.58%. With its drive count holding more or less steady (1,038 in Q1 and 1,014 in Q2), that means a real change in failure rates. Note that this drive was at 8.72% in Q4 2024, so it’s worth keeping an eye on whether this is a fluke or a new pattern. Other significant drops include the 12TB HGST model HUH721212ALN604 (Q1: 4.97%; Q2: 3.39%) and the 14TB Seagate model ST14000NM0138 (Q1: 6.82%, Q2: 4.37%).
One new drive model on the way in: Welcome to the party, Toshiba MG09ACA16TE (16TB).
Zero failures for the quarter: Rising to the top, we’ve got only two this time around:
Seagate ST8000NM000A (8TB)
Seagate ST16000NM002J (16TB)
That 8TB Seagate is really shining, given this is its third quarter running with zero failures.
Bonus: One failure drives: Since we only have two 0 failures (and that just seems a little lackluster, doesn’t it?), it’s also worth mentioning the drives with only one failure this quarter:
HGST HMS5C4040BLE640 (4TB)
Seagate ST12000NM000J (12TB)
Seagate ST14000NM000J (14TB)
Toshiba MG09ACA16TE (16TB)
Drive model criteria
We noted earlier we removed 495 drives from consideration when we produced the table above covering Q2 2025. There are two primary reasons we did not consider these drive models.
Testing. These are drives of a given model that we monitor and collect Drive Stats data on, but are not considered production drives at this time. For example, drives undergoing certification testing to determine if they are performant enough for our environment are not included in our Drive Stats calculations.
Insufficient data points. When we calculate the annualized failure rate for a drive model for a given period of time (quarterly, annual, or lifetime), we want to ensure we have enough data to reliably do so. Therefore we have defined criteria for a drive model to be included in the tables and charts for the specified period of time. Models that do not meet these criteria are not included in the tables and charts for the period in question.
Regardless of whether or not a given drive model is included in the charts and tables, all of the data for all of the drives we use is included in our Drive Stats dataset which you can download by visiting our Drive Stats page.
As with the Q2 quarterly results, we will apply these criteria to the lifetime charts that follow in this report.
Lifetime hard drive failure rates
To be considered for the lifetime review, a drive model was required to have 500 or more drives as of the end of Q2 2025 and have over 100,000 accumulated drive days during their lifetime. When we removed those drive models which did not meet the lifetime criteria, we had 393,907 drives grouped into 27 models remaining for analysis as shown in the table below.
Backblaze Hard Drive Failure Rates for Q2 2025
Reporting period ending June 30, 2025 Drive models > 500 drives and > 100,000 lifetime drive days
Notes and observations
Again, the lifetime AFR holds steady, dropping from Q1 2025’s 1.31% to 1.30%.
Now you see me: This quarter’s table also gives us an interesting snapshot that has to do with our drive exclusions as the 4TB HGST model HMS5C4040ALE640 is on the way out. It meets our lifetime drive criteria, so it is included in this second table, but it didn’t make the cut for the quarterly table because it had too few drives running by the end of the quarter. Usually you see the opposite, where drive models show up in the quarterly requirements but not the lifetime. This quarter, four models meet that standard (Seagate model numbers ST8000NM000A, ST14000NM000J, ST16000NM002J, and Toshiba MG09ACA16TE).
Smaller drives getting older: Perhaps an unsurprising trend—Backblaze’s smaller capacity drives are getting older. We have a total of 13 drive models with 12TB or less, with a collective 1.54% failure rate. See the table below:
Backblaze drives with ≤12TB capacity
Of those models, eight are five years old or older (shown in purple). An additional two models are four years or older (that’s your orange). Taking just these 10 models—drives reaching their supposed golden years—we have a collective AFR of 1.42%.
Notably, that AFR is due to some well-performing low-failure outliers, including both of the 4TB Seagate models (0.57% and 0.40%), the 12TB HGST model HUH721212ALE600 (0.56%), and the 12TB Seagate model ST12000NM001G (0.99%).
That said, it’s also perhaps more impressive that when we say “eight are five years and older,” of those eight drive models, five are six or more years old. Their collective AFR is 1.33%.
This begs the age-old question: Is age just a number? Or, are we just seeing several exceptional drive models? In any event—an interesting drive population to keep an eye on, as it represents 156,724 of our 393,907 (~40%) of the lifetime drive pool.
Zoom in: The 20TB+ club
We’ve been taking quick peeks at the 20TB+ drives in the last few reports, but it’s high time we dig in a bit deeper. Right now, our cohort of 20TB+ drives that meet the lifetime criteria consists of three drives, the 20TB Toshiba model MG10ACA20TE, 22TB WDC model WUH722222ALE6L4, and 24TB Seagate model ST24000NM002H. Quite neatly, that also gives us one per manufacturer, lending itself to something of a head-to-head comparison—though, of course, with the variability we see on a per-drive basis within the same manufacturer, we won’t over-index on lending it too much significance.
Let’s take a look at each.
20TB Toshiba MG10ACA20TE
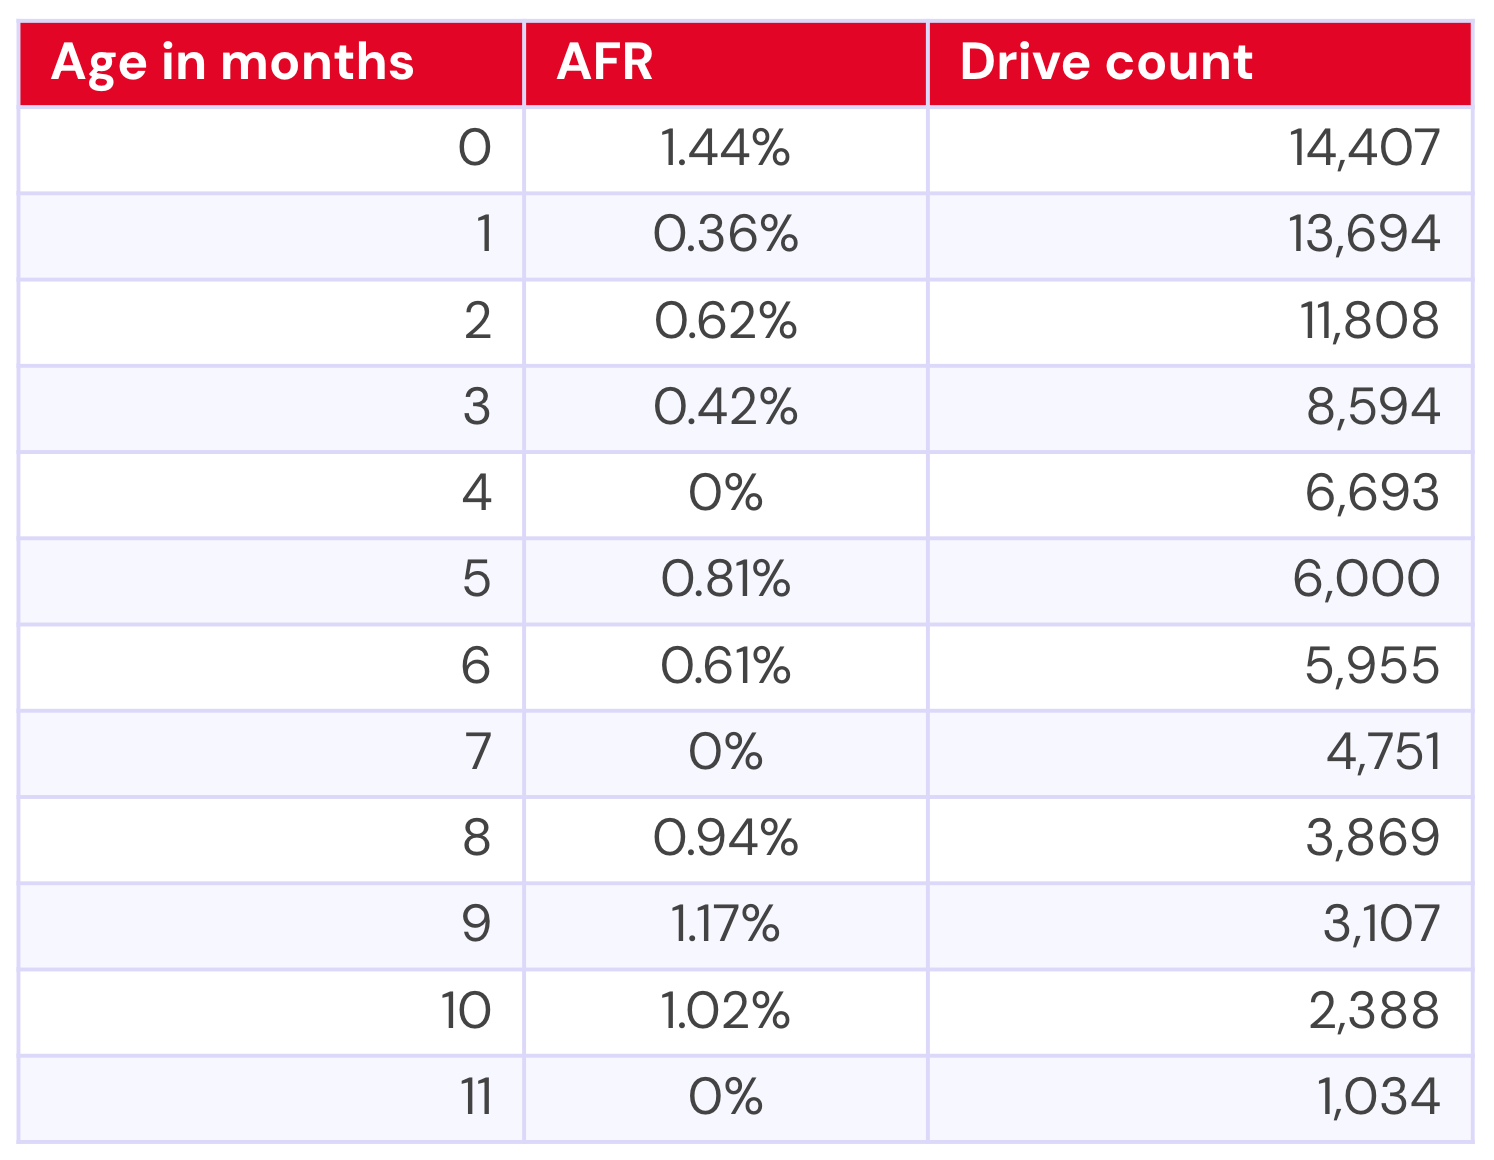
The Toshiba has actually been in our drive pool for 22 months, but until just under a year ago, there were only two drives. For the purposes of significance, then, we’ll exclude significantly low numbers of drives—thankfully, each model has something of a natural fall-off point where they go from single-digit drive numbers to hundreds.
For the Toshiba, that gives us the following data:
Converted to a graph, we end up with the following:
On this graph, the blue line represents the AFR and the red line represents the drive count. Drive count can be a bit tricky since our x-axis is age, and we start with age=0, which means that the drive count (from our perspective) goes from larger to smaller. That is, as drives get older, there are fewer of them by count—you have your initial purchase cohort, then you add drives over time. You can read this as the first data point representing drives that are between 0–1 month old, the next data point as 1–2 months old, etc.
We set it up this way because we wanted to be able to directly compare the failure rates of the drives based on their ages. Those familiar with our bathtub curve analysis may recognize our methodology here—we’re just zooming in on specific drives and drive capacities.
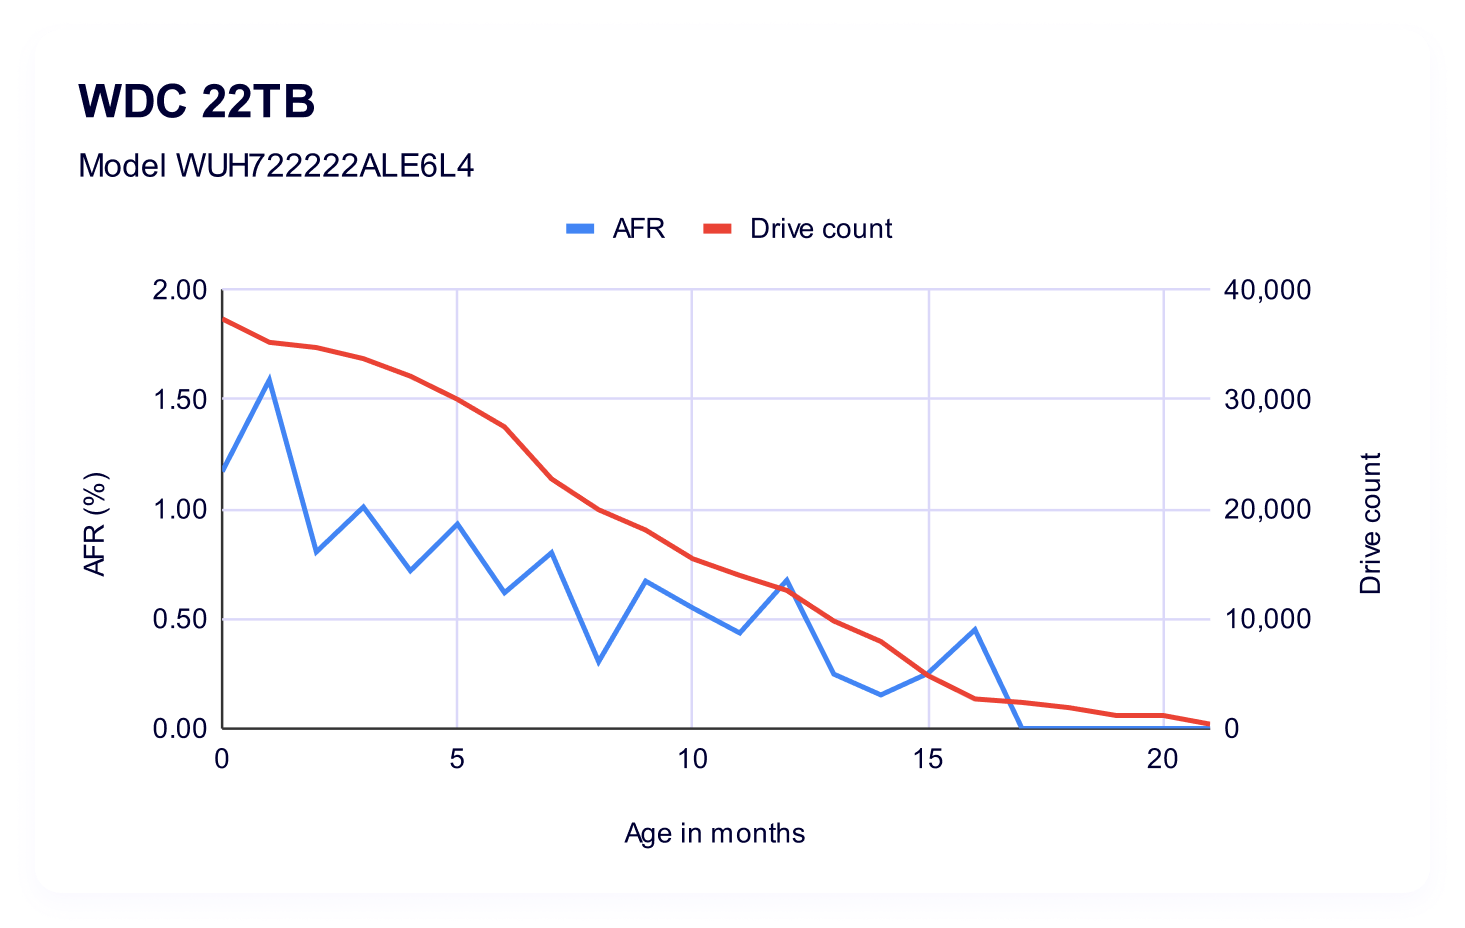
22TB WDC WUH722222ALE6L4
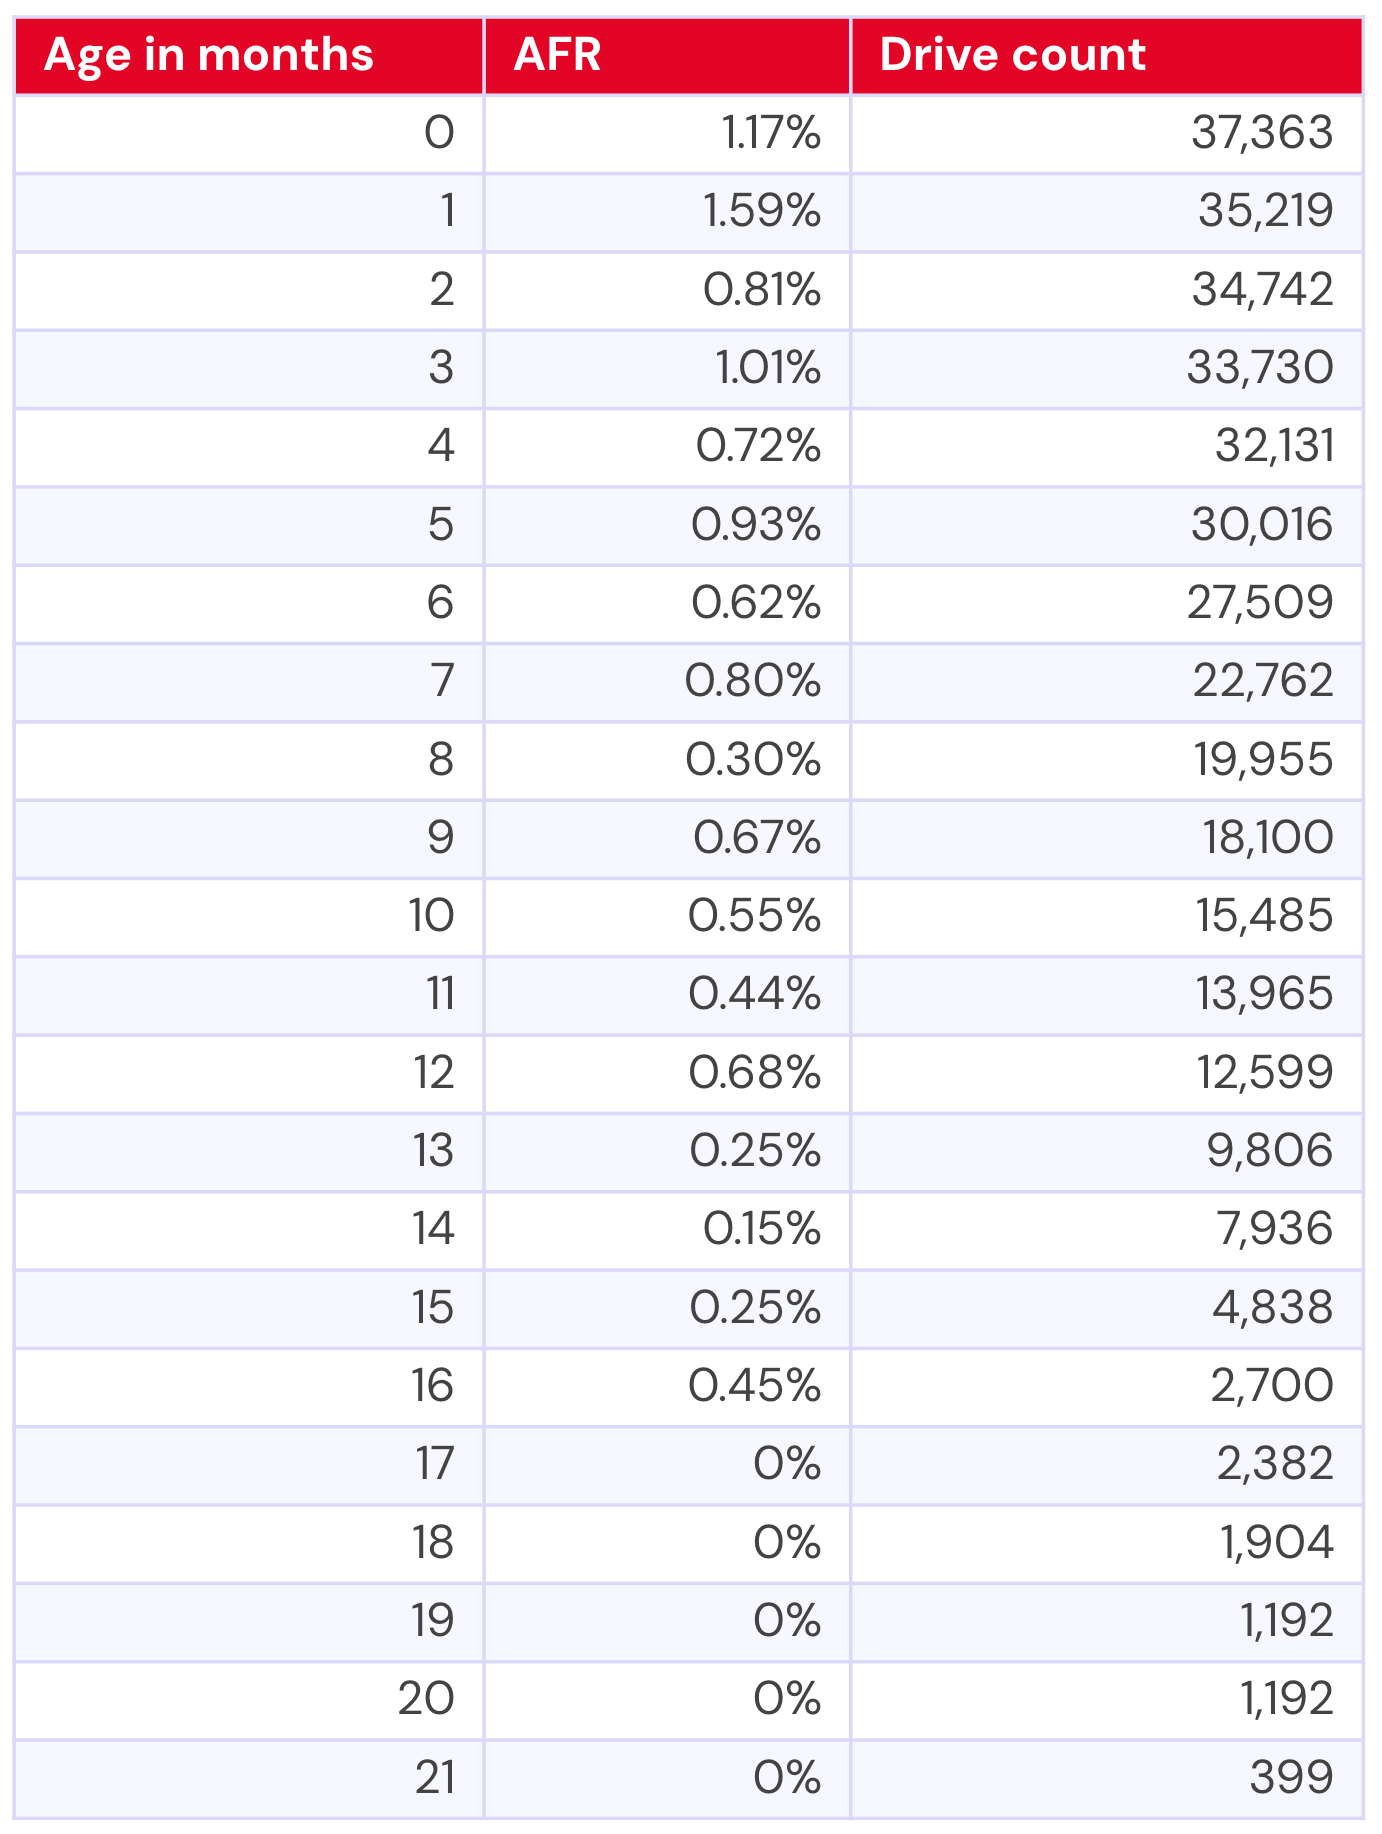
Now let’s take a look at the WDC model. We have usable data for about 21 months of its drive life:
Which gives us the following visualization:
Interestingly, we see a lot less variability in the span of time where we have a direct comparison. That said, the WDC model also had a minimum of double the drive count if we’re looking at a similar time period—so, at their youngest (0 months old) the Toshiba had 14,407 drives vs. WDC’s 37,363; and, at 11 months Toshiba had 1,034 drives vs. WDC’s 13,965.
While AFRs do get us mostly on an even playing field as far as being able to make a 1:1 comparison, it’s important to remember that in smaller drive pools, a single failure can be amplified by quite a bit.
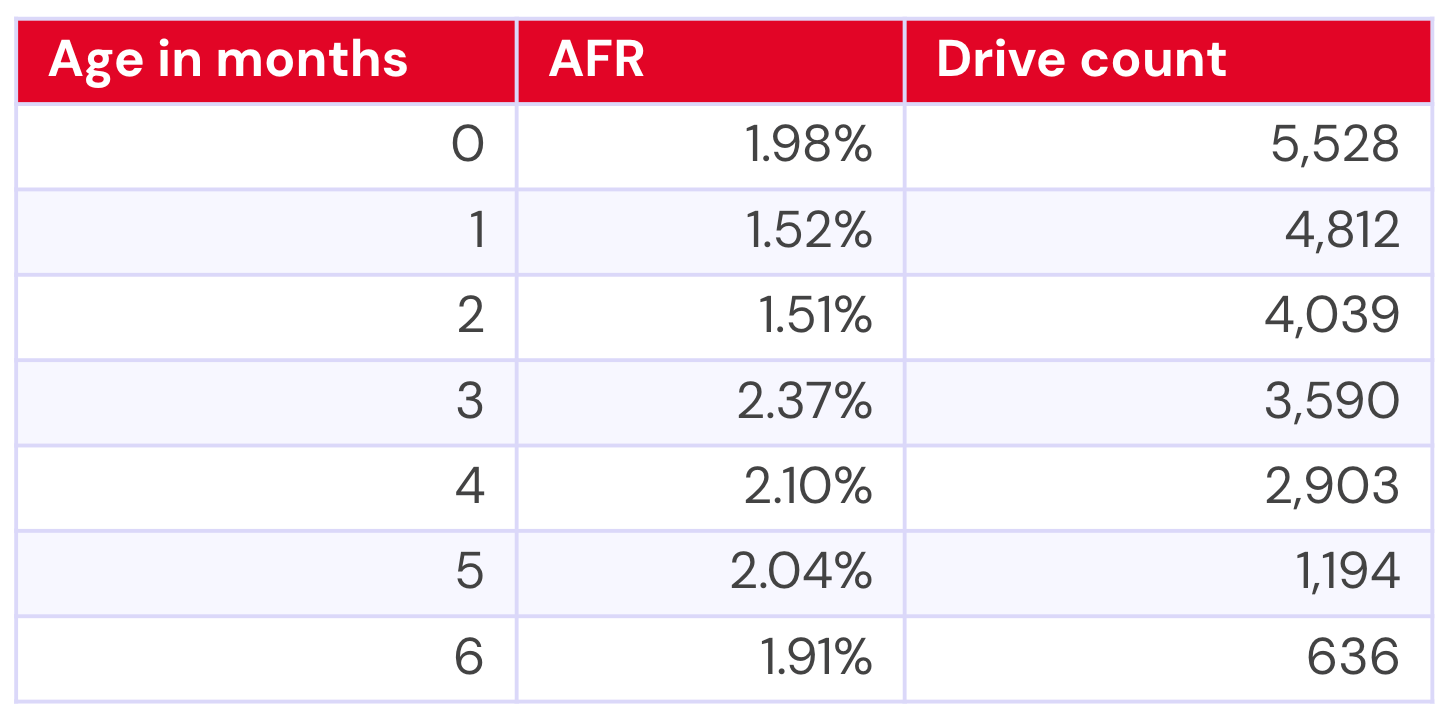
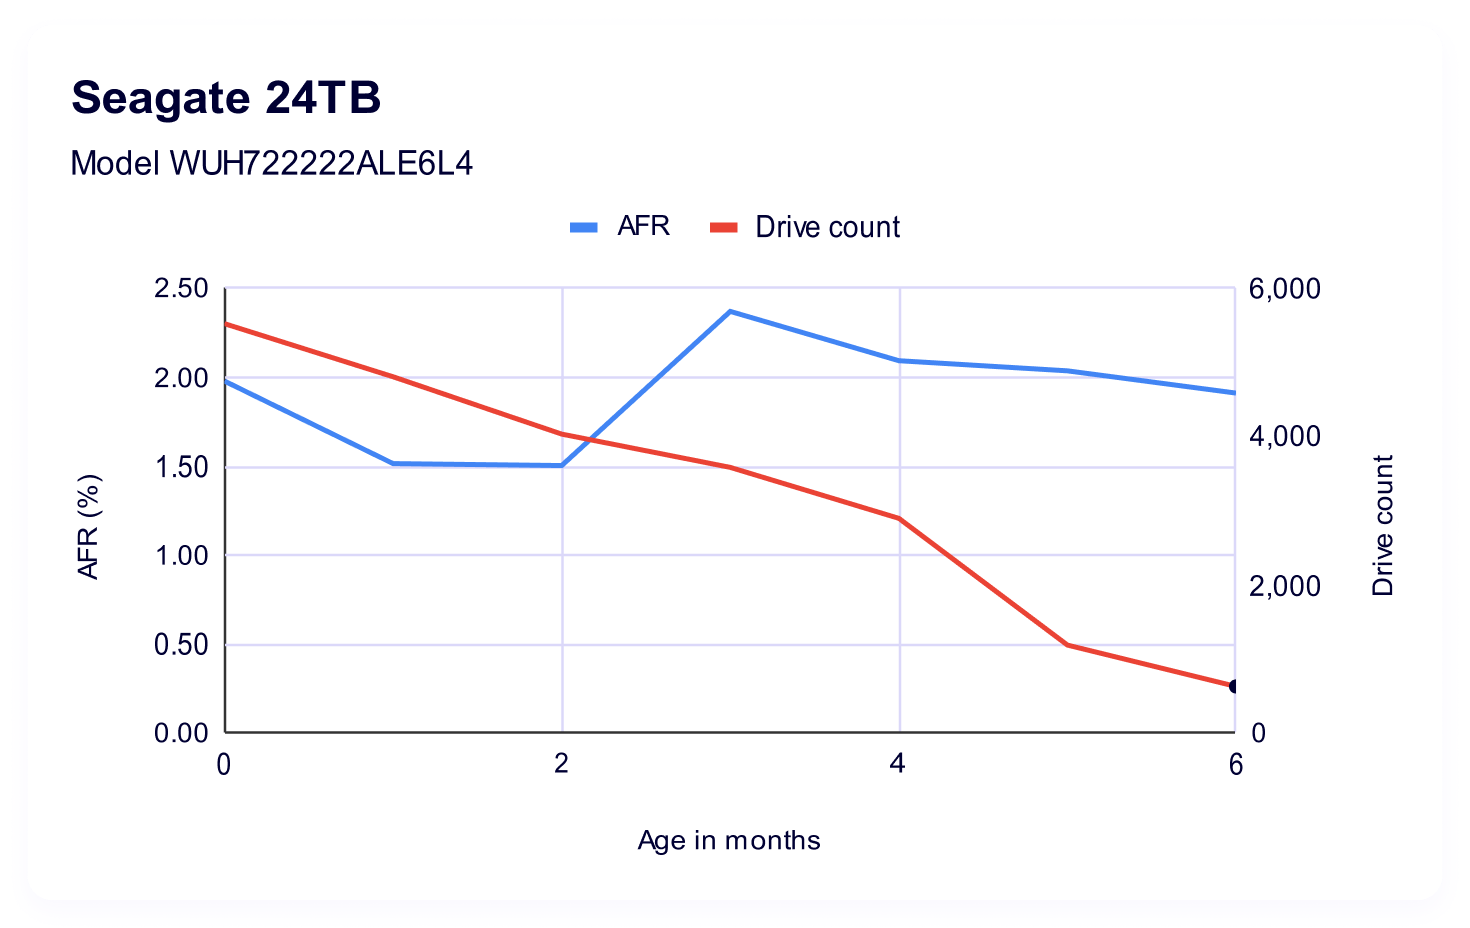
24TB Seagate ST24000NM002H
Our youngest drive model, the 24TB Seagate ST24000NM002H, has just half a year of data.
That gives us the following visualization:
Compared with our other two drive models, the 24TB Seagate definitely has the highest failure rates. This could be explained, in part, by it being a young drive—is it in the leading edge of a traditional bathtub curve? So, certainly something to track over time to see if it will settle out as it gets older.
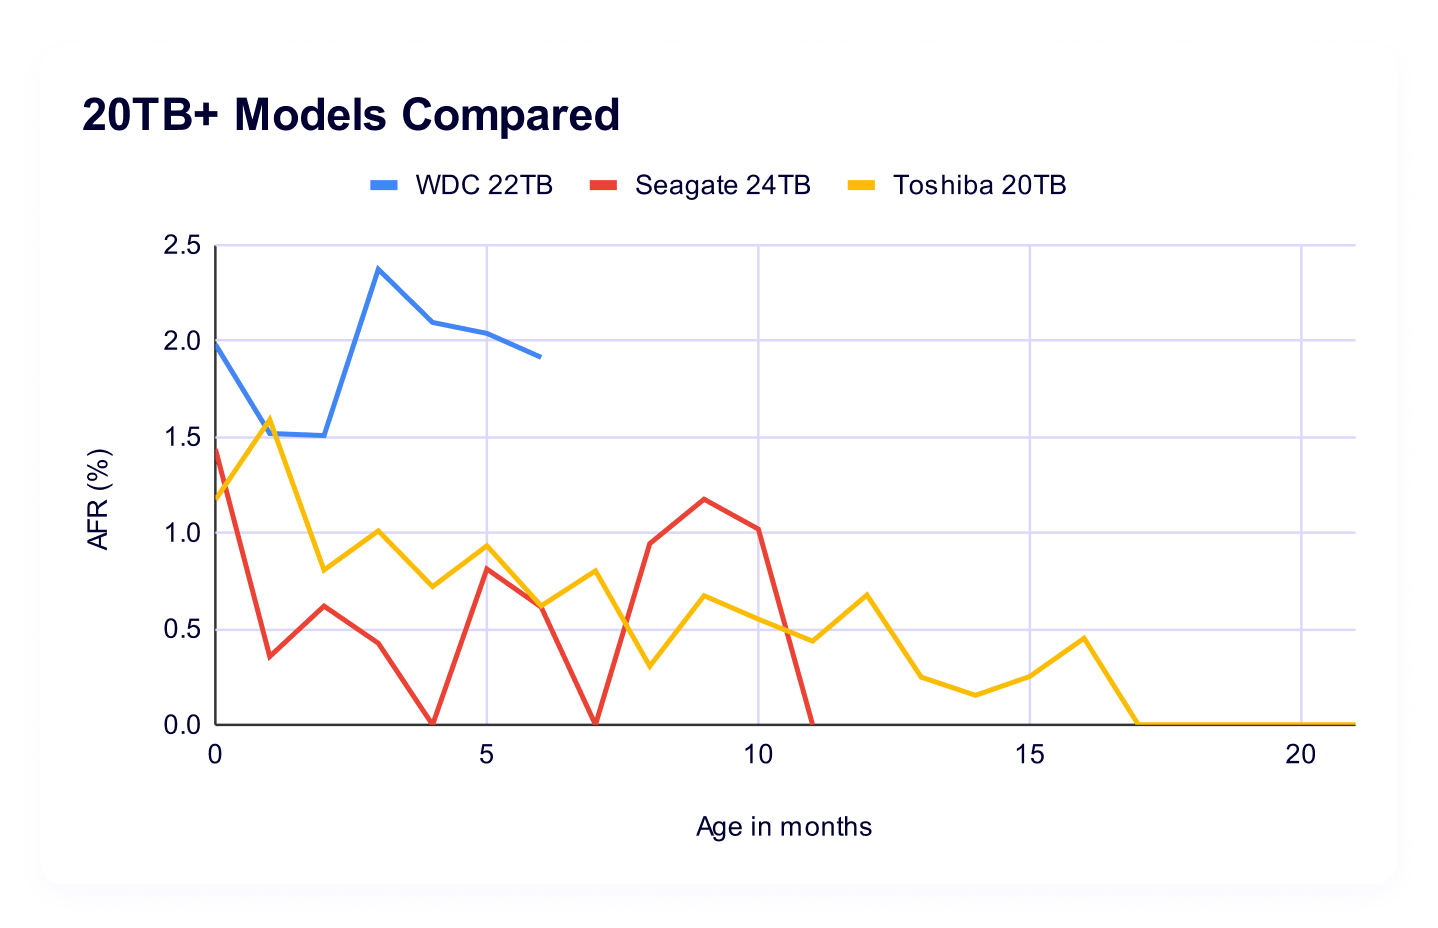
All together now: Comparing each 20TB+ drives
We designed this view to be directly comparable at points in time, so, here’s your graph that puts each drive on the same time scale:
What’s our takeaway here? Well, in both drive count and length of time in the pool, it’s a little early to create definitive trends for the Seagate and the Toshiba. Certainly we can see that the Seagate is, early on, showing higher failure rates. Meanwhile, the 20TB Toshiba has had a bit of a variable year one. But again, with significantly variable drive pools between all models, we’re not quite comparing apples to apples. (We chose not to plot drive count on this chart—it gets messy quickly.) Add to that: the Seagate in particular is potentially at the beginning of the “bathtub” curve, we may see it change over time.
On the other hand, the 22TB WDC model has shown up quite a bit below our current average AFR for the drive pool of all drive sizes and ages, and it’s the model with the most data. But, how does that compare to other models as they come online?
Comparison: 20TB+ as a pool vs. 14-16TB as a pool
When we were considering whether this information would be a useful slice of the data, our biggest question was how to contextualize it versus drives. It’s perhaps a tad imperfect, but we landed on combining the 14–16TB drives as a pool, largely because they have a significant amount of data points and were our last set of drives onboarded, which means that they’re more or less the last generation of hardware.
The other thing to note is that once we combined the 20TB drives into a pool, some of the data we filtered out on a per-drive basis got added back in. So, at the 21 month mark, where the Toshiba model only had one drive, we added that single drive to the 399 that our WDC model brought to the table and calculated AFR across the pool (giving us 400 drives to work with).
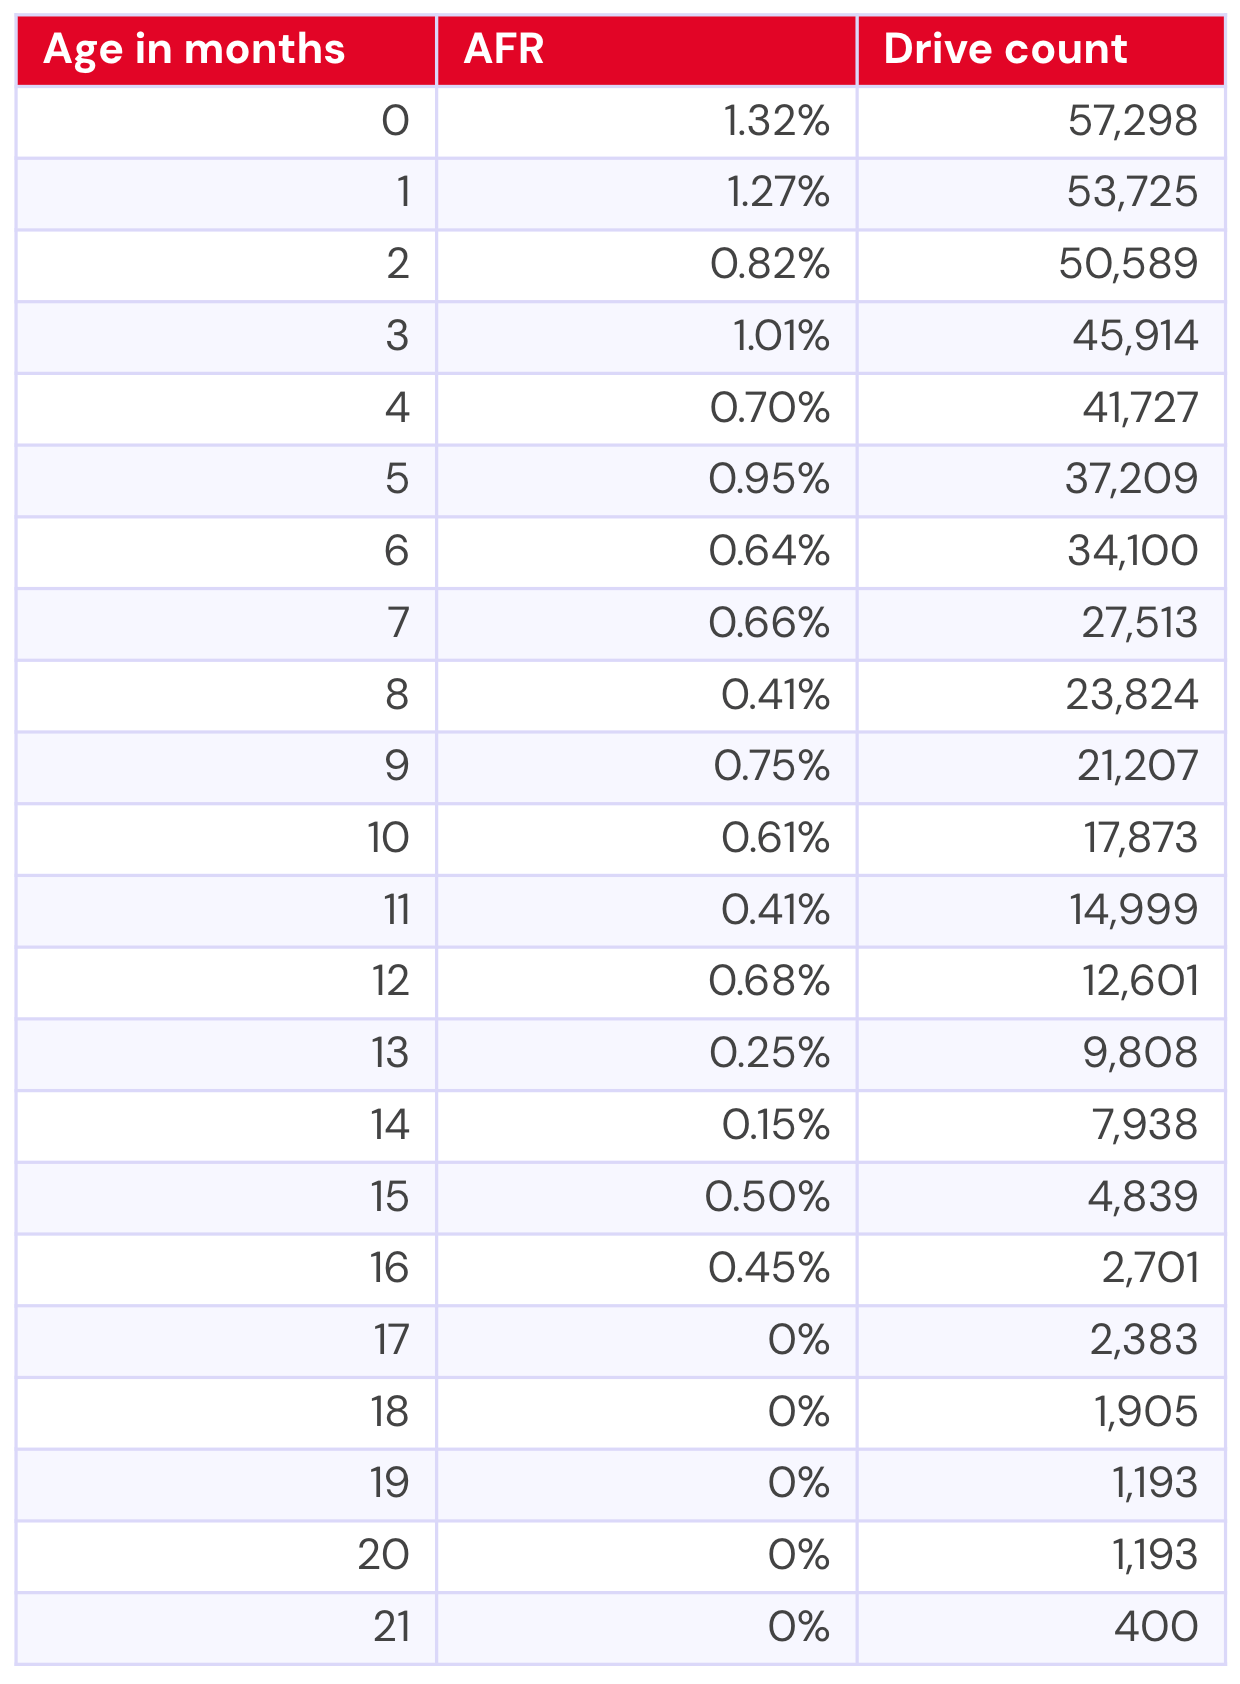
Here’s the numbers for the 20TB+ drive pool:
That gives us a pretty neat graph, actually:
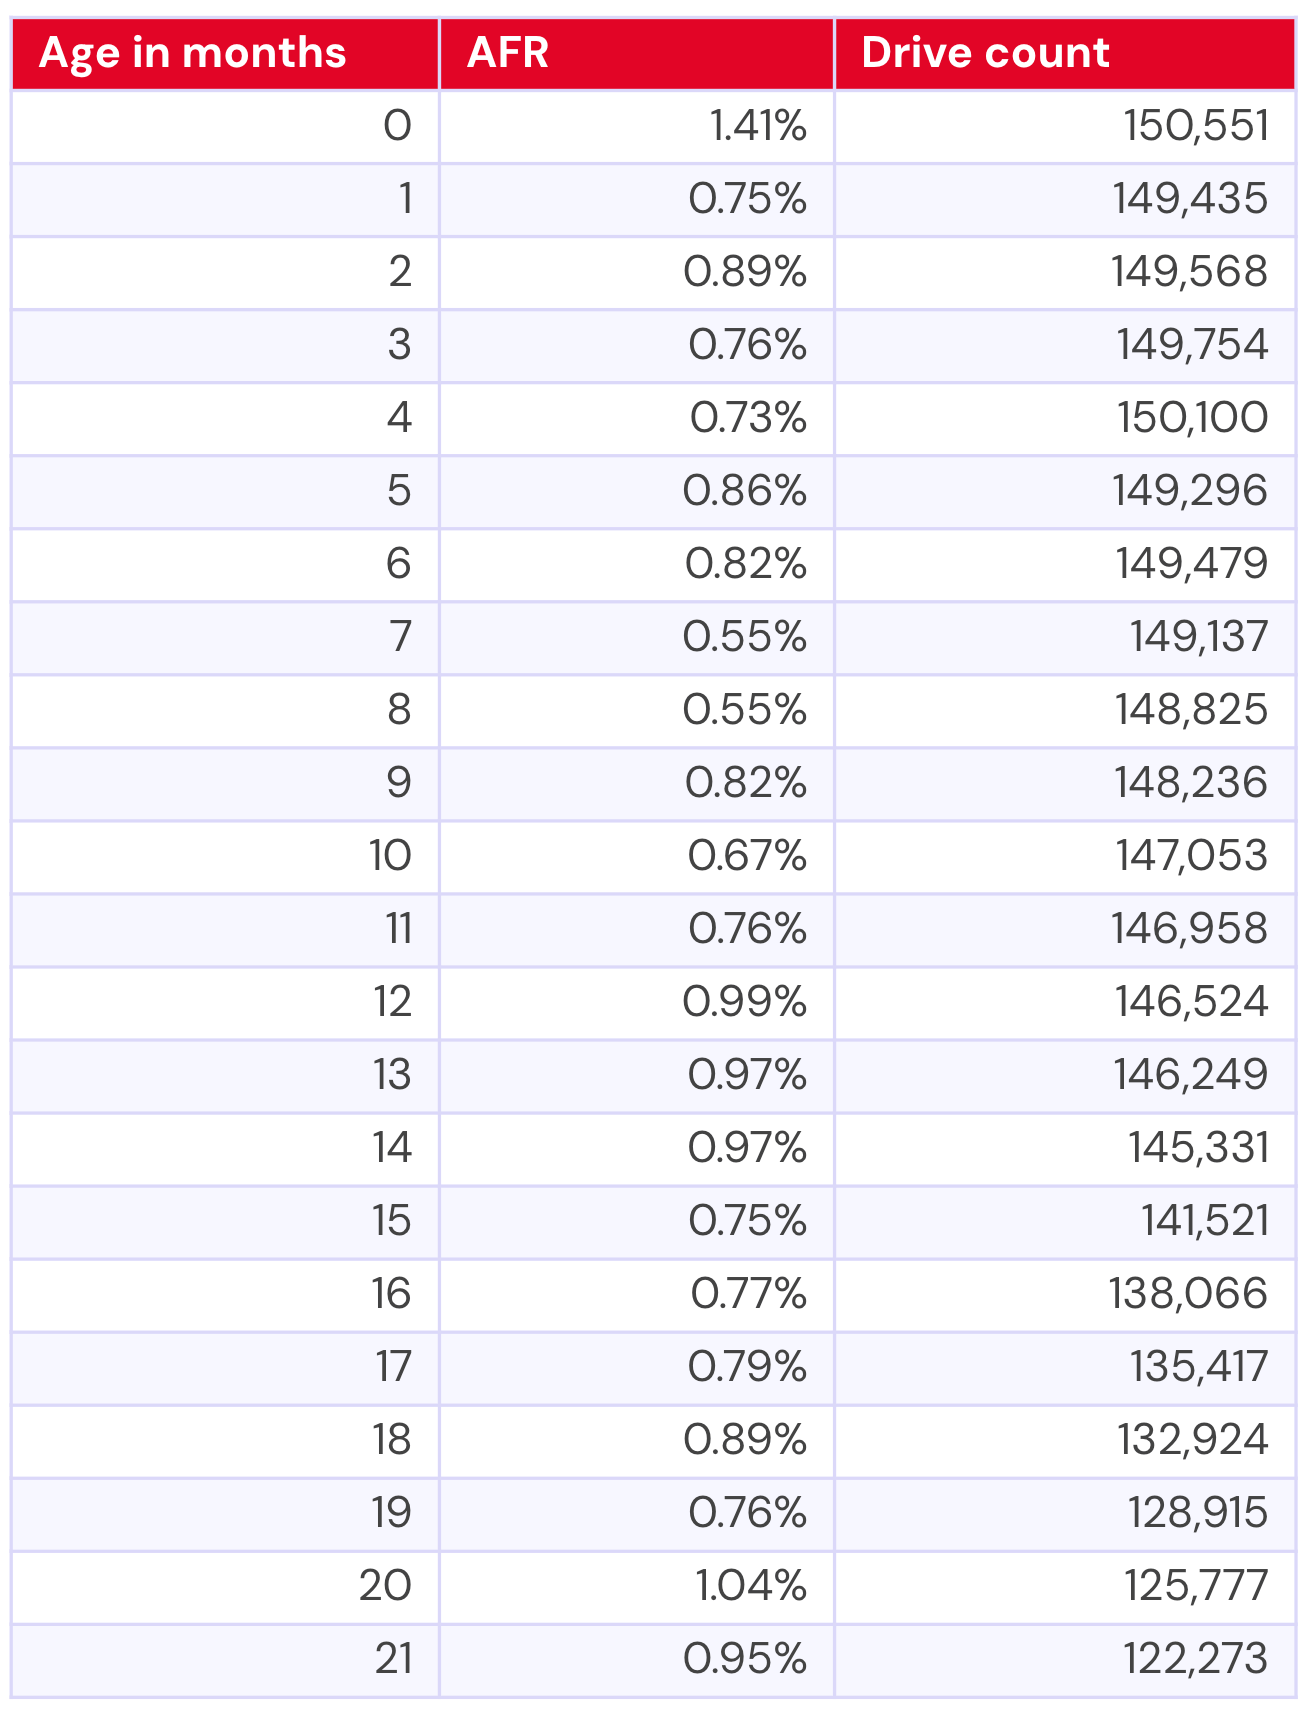
Now, let’s compare to the 14–16TB drives of the same age. We have significant data for this population for nearly seven years, but in the interest of saving you three pages of scrolling, I’ll give you the table for the data that directly correlates to the 21 months of data we have for the 20TB+ drives.
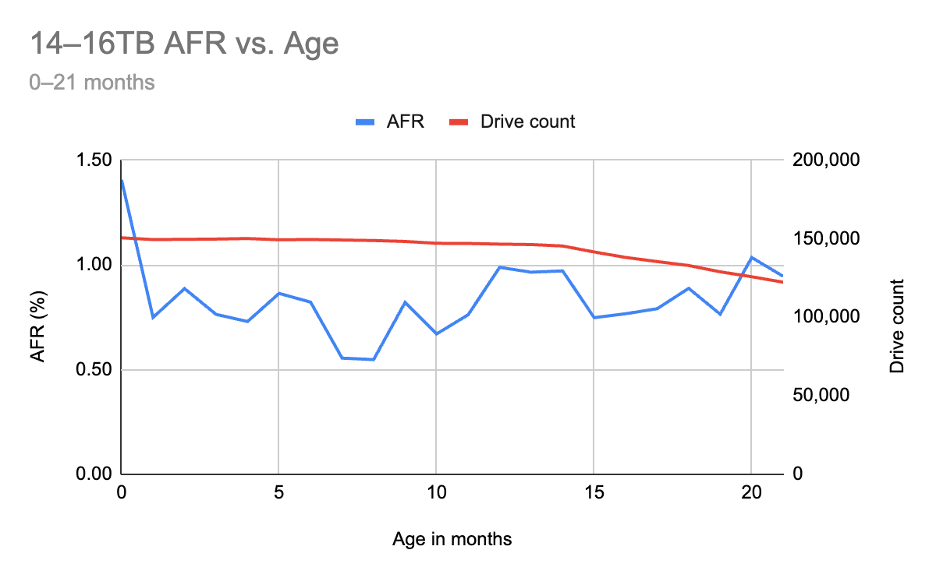
This is the line chart for that range of time:
Comparing age of drive to age of drive, it would seem that our 20TB are right on target, and perhaps doing a bit better than expected. But, that definitely isn’t a perfect comparison given that the 14–16TB drives have a steadier and larger drive count. So, let’s look at the chart with the full, nearly seven year time period:
This view starts to show us some spiky patterns as the 14–16TB drives get older, of course exacerbated by drive counts reducing over time.
So what’s it all mean?
It’s clear from the data that we need to give the 20TB+ drives time to mature, and that as we (depending on our buying behavior, of course) add more drives, we might see some interesting changes in the data.
As for the 14–16TB pool, they’re following relatively expected patterns of wearing out in the five-plus year range—but what does that mean when you compare to what we observed in our current lifetime stats, where we see our 12TB and smaller drive pool performing so well?
Without taking a closer look at the 14–16TB drives, it’s hard to say that they don’t have similar outlier tendencies to what the 12TB and smaller pool does, just pulling the failure rates upward. Even a casual glance at our current lifetime table’s 14–16TB drives bears that out (four years and older highlighted in orange, as our corollary above):
That data isn’t inclusive of all of the 14–16TB drives we’ve ever had, though—just those currently in operation. So, as always, there’s more investigation to be done.
The Hard Drive Stats data
The complete dataset used to create the tables and charts in this report is available on our Hard Drive Test Data page. You can download and use this data for free for your own purpose. All we ask are three things: 1) you cite Backblaze as the source if you use the data, 2) you accept that you are solely responsible for how you use the data, and 3) you do not sell this data itself to anyone; it is free.
Good luck, and let us know if you find anything interesting.
The big cloud providers already offer everything you need, including storage. So, why complicate things, right? At first glance, that sounds convincing. Hyperscalers like AWS, Azure, and Google Cloud offer massive service catalogs, global infrastructure, and a wide range of storage options. For many teams, they seem like a convenient one-stop shop.
But in practice, things aren’t nearly as straightforward.
While hyperscalers offer extensive storage capabilities, their multi-tier systems prioritize versatility over optimization. The result? Hidden costs and performance headaches that cloud-native teams can’t afford to ignore.
The claim that hyperscaler storage meets all cloud-native needs because of scale and functionality is a stubborn myth, one of many that still permeate the development landscape.
This post kicks off a blog series tackling these myths and misconceptions about specialized cloud storage and what a best-of-breed, interoperable approach to storage and infrastructure entails.
New Cloud Native Times Call for New Cloud Storage Approaches
Learn more about how the open cloud supports faster development, improved workflows, and reduced cost complexity in our free ebook, “New Cloud Native Times Call for New Cloud Storage Approaches.”
Reading the fine print of hyperscaler storage
On the surface, hyperscaler storage looks comprehensive and capable. But dig a little deeper, and some underlying cracks start to show.
Premium performance isn’t the default
Hyperscalers can deliver high performance, but not without tradeoffs:
They charge more. Premium tiers designed for workloads like analytics or streaming can cost five to eight times more than interoperable solutions.
They prioritize themselves. When hyperscalers face high-performance demands (e.g., AI workloads competing for GPUs and storage bandwidth), they tend to prioritize their own data centers. Smaller teams might have to navigate opaque processes to request higher performance, and their access to advanced optimizations can be limited.
They play favorites. File size adds yet another layer of difficulty. Many hyperscaler storage systems handle large files more efficiently than small ones because of I/O overhead. Hyperscalers may help their biggest customers fine-tune configurations, but most are left to troubleshoot bottlenecks on their own.
Juggling tiers (and hoping nothing gets dropped)
Hot, cool, and cold storage options may look flexible on paper, but they require separate access controls, replication rules, and performance tuning. Teams are left juggling interfaces like AWS Identity and Access Management (IAM), scripting policies, and managing tooling just to keep systems functional.
And the more storage types you manage, the greater the chance for human error. A misplaced lifecycle rule or a mistyped IAM permission can result in:
Unexpected data unavailability
Delayed retrievals
Accidental deletions
When complexity undermines reliability
Keeping storage tied tightly to hyperscaler infrastructure may seem efficient—but it often results in brittle setups. Misaligned storage, compute, and access layers can lead to latency issues or even full-blown downtime.
Performance-sensitive applications like real-time analytics or video streaming suffer most. Even a small delay can ripple through the user experience and cause customer churn. To patch gaps, teams often layer on caches, fine-tuning, or quick fixes that only add technical debt.
Who has time to babysit storage?
Developers, DevOps, and site reliability engineers (SREs) are always racing to ship features, scale services, and maintain uptime. For cloud-native teams, optimizing storage isn’t usually at the top of anyone’s to-do list.
Let’s face it: proactively analyzing storage access patterns and configuring tiering rules takes time that cloud-native teams often don’t have. Many teams therefore operate reactively and address storage issues only after performance degrades or surprise bills arrive.
Support tickets don’t feel your pain
Finally, there’s support. Unless you’re a premium customer paying for top-tier service contracts, you’re often stuck with ticketing systems and community forums. That might suffice for routine issues, but when storage problems impact production workloads, waiting for responses through standard channels adds unnecessary stress and delays.
When one size doesn’t fit your cloud
Unlike hyperscaler storage that takes a one-size-fits-all approach, specialized cloud storage solutions directly tackle these challenges. Backblaze B2 is purpose-built to simplify storage for cloud-native teams:
A single, high-performance tier gives you instant access to all your data, with no tier juggling or lifecycle policies.
Predictable, transparent pricing means no unexpected fees or surprise retrieval charges.
S3-compatible APIs simplify integration, allowing you to plug Backblaze B2 directly into your existing cloud-native stack.
For cloud-native teams who value speed, simplicity, and cost control, specialized storage isn’t a complication; it’s a simplification. You get the performance you need, without the complexity you don’t.
Stay tuned for the next post in this series where we tackle Myth #2: Storage isn’t a big enough problem to remediate. (Spoiler: It is.)
Security teams are under constant pressure to stay ahead of increasingly sophisticated threats while enabling fast, reliable access to data across the business. Whether you’re protecting media assets, safeguarding backups, or supporting a global development workflow, your cloud storage needs to do more than store data—it needs to actively support your security posture.
To make that easier, we’ve launched a new set of enterprise-grade security features for Backblaze B2 Cloud Storage. These updates are designed to help organizations detect unusual activity faster, manage access more precisely, and strengthen visibility across their storage environments—all without added complexity or hidden costs.
These new tools build on the security foundations you already count on: Object Lock for ransomware protection, SOC-2 compliance, encryption, 3x free egress for disaster recovery, and more.
Here’s a look at what’s new and how it helps.
Smarter protection with Anomaly Alerts (Now in private preview)
Anomaly Alerts are your new AI-powered watchdog. This feature analyzes usage patterns in your B2 Cloud Storage buckets to detect potential red flags—like spikes in downloads or uploads beyond the baseline—that could signal a breach or exfiltration attempt.
If your team wants early access to this feature, drop us a line at [email protected] to join the private preview.
New enterprise web console & role-based access controls (Now in private preview)
Managing cloud storage across large teams just got a whole lot easier. We introduced a brand-new enterprise web console built for scalability and control. Combined with robust role-based access controls (RBAC), IT and security teams can now better align with zero-trust policies by enforcing the principle of least privilege across their organizations.
This console simplifies storage administration at scale—whether you’re managing terabytes or petabytes.
Get an expert introduction to the enterprise web console.
If you’re a Backblaze customer with a committed contract, reach out to your Customer Success Manager (CSM) to see if you’re eligible to participate. Not sure who your CSM is? Email [email protected] for help.
Full visibility with Bucket Access Logs (Now generally available)
Need to know who touched what and when? Bucket Access Logs are now generally available, providing a detailed audit trail of every action in your B2 buckets—uploads, downloads, deletions, and more.
Learn more about querying Bucket Access Logs in this webinar.
They’re fully S3-compatible and configurable through both the Backblaze B2 web UI and API, supporting:
Security audits
Usage tracking
Forensics and threat investigation
Real-time Event Notifications
Time matters when it comes to spotting and stopping threats. With Event Notifications, you can get real-time alerts on changes to your bucket contents—think object creations, deletions, or modifications—so your team can jump into action immediately.
This is especially valuable for compliance teams, incident response workflows, or any operations team who wants tighter control over their cloud perimeter.
Watch our hands-on Event Notifications demo to learn more about how to streamline cloud storage management.
Multi-Bucket and Scalable Application Keys
Security and scalability should go hand in hand. With Multi-Bucket Application Keys, you can now create access keys that cover specific groups of buckets, giving you more flexibility without going full wildcard. This enhancement provides more granular control over bucket access, contributing to a reduced attack surface.
And, with Scalable Application Keys, you can generate up to 10,000 short-lived keys per minute. This capability enhances security by limiting the exposure window of individual keys, thus reducing the attack surface for endpoint-generated content and high-volume data operations.
Custom Upload Timestamps
Custom Upload Timestamps allow you to specify when an object was originally created or uploaded. This is a critical feature for:
Regulatory compliance
Accurate version tracking
Legal and audit requirements
Built for a Secure, Open Cloud
Security isn’t a one-time add-on, it’s an ongoing promise. As enterprises scale and integrate cloud storage into more parts of their workflow—from backup and archiving to AI pipelines—they need solutions that support open cloud strategies without compromising their data.
This update is another step forward in our mission to provide developers, IT teams, and enterprises with cloud storage that’s secure by design, simple to use, and affordable at scale. Ready to get started with Backblaze B2? Contact our Sales team today.
Whether you’re navigating HR issues, facing down litigation,or ensuring operational readiness in the face of uncertainty, you need to be ready to preserve your data. When the stakes are high, Legal Hold, a new feature in Backblaze Computer Backup with Enterprise Control, can help you stay ready.
Available today, Legal Hold gives administrators the power to preserve every version of a user’s backup with a single click. No extra hardware, no new software—all at the same flat-rate pricing of Backblaze Computer Backup with Enterprise Control.
Let’s dig into what Legal Hold is, its importance, and how Backblaze implements it to meet enterprise needs.
What is Legal Hold?
A legal hold, also known as a litigation hold, is a process that organizations use to preserve electronically stored information (ESI) when they face actual or anticipated litigation, audits, or investigations. It ensures that relevant data—such as emails, documents, and file backups—is not deleted, altered, or lost. Once enabled, Backblaze Computer Backup’s Legal Hold feature will preserve a user’s entire backup, including every historical version captured, with a single click.
A legal hold is typically triggered when an organization becomes aware of a legal claim or regulatory inquiry. Once in place, normal data retention policies are suspended for any affected data, ensuring it remains available for legal review.
How Backblaze Legal Hold helps you stay protected
At Backblaze, we’ve designed our Legal Hold for Computer Backup feature to be powerful, simple, and reliable. Here’s how it works:
Instant activation: Instantly activate Legal Hold in the Enterprise Control console without additional hardware or software.
Automated data preservation: Apply a Legal Hold to any user’s backup directly from your admin console. The backups are preserved in a fixed state, meaning no files can be altered or deleted—even by retention policies.
Remote and silent enforcement: Legal Holds are applied remotely without disrupting the user’s work, alerting the users, or requiring their involvement. It runs silently in the background without downtime, throttling, or notifications.
Retention beyond the device: Even if the original device is lost, stolen, or wiped, all held data remains safely stored in Backblaze.
Secure by default: Encryption at rest and in transit with optional private key encryption available keeps data safe.
Why Legal Hold matters in 2025
In today’s landscape, Legal Hold isn’t just a “nice to have.” It’s a must-have for almost every organization:
Rising litigation and audits: Businesses face more legal scrutiny than ever—whether it’s an employee dispute, intellectual property (IP) protection, or a customer complaint.
Remote and hybrid workforces: With data scattered across devices and locations, you need a solution that protects endpoint backups no matter where the user is.
Cybersecurity incidents and data loss: Legal Hold ensures that even during a ransomware attack or internal breach, copies of critical data are preserved for investigation or recovery.
Cloud-first operations: Legal Hold needs to work where your data lives—securely in the cloud, always ready when you are.
Ready when you need it most
Now, any business using Backblaze Computer Backup with Enterprise Control can implement Legal Hold in just a few clicks—making it easier than ever to stay compliant, reduce legal risk, and prepare for the unexpected.
Already a customer? You can start using Legal Hold today. See our docs article or log in to your admin console.
Not yet on Backblaze? Reach out to our Sales team to start a free 15-day trial.
When you think about cloud infrastructure for AI, you immediately think of GPUs and other high-performance compute resources, and how your cloud architecture should be optimized to make the most of these expensive compute plans. But compute isn’t the only cloud product category you need to monitor to both scale your application and maintain a sustainable cloud infrastructure budget.
What ultimately fuels AI? Data—lots and lots of data. As part of a healthy AI pipeline, several versions of the same dataset need to be stored in a centralized repository, or multiple repositories if your strategy requires splitting data into cold vs. hot storage to reduce storage costs. For text-based LLMs, storage costs are minimal compared to compute resources. But as AI innovation increasingly relies on video and other media, both the base storage cost and data retrieval fees can make cloud bills spiral out of control.
In this blog, we’re taking a look at the AI data pipeline, where object storage sits in each stage, and how leveraging both Backblaze B2 and B2 Overdrive helps both increase performance and reduce costs for AI applications.
Data ingest and active archive: Data is gathered from multiple designated sources (including APIs, internet of things (IoT) sensors, relational databases, etc.) and ingested into a centralized repository or multiple repositories.
Data processing: The raw data is transformed and enriched based on the model’s data parameters. This can range from relatively simple text cleanup to adding annotations and metadata. Feature engineering is performed to extract or construct meaningful attributes. All data is then converted into numerical representations (e.g., embeddings, vectors) suitable for model training and inference.
Model experimentation and training: Processed data is used to train models by learning underlying patterns. Iterative experiments in a test environment evaluate, tune, and improve model performance and accuracy.
Model deployment and inference: New data is prepared in the same way as during training and sent to the deployed model to generate predictions, support decision-making, and deliver personalized outputs.
Monitoring: Continuous monitoring tracks model performance, detects data drift, and flags potential bias, ensuring the model remains accurate and reliable over time.
Keep in mind that data ingestion and processing isn’t always sequential, such as when data is collected and ingested, but corruption is detected during processing. Ideally, your pipeline is configured with validation gates so that corrupt data is identified and handled before proceeding to downstream steps like testing, training, and production deployment.
When using cloud object storage as your data repository, one factor of selecting a plan (like cold versus hot storage) is the specific type of data ingestion that’s being utilized based on both the data source and AI model’s specific needs.
Batch ingestion is better suited for mid to lower performance storage, as this is typically used for historical datasets or a set schedule of pre-determined data updates, such as jobs pulling from relational databases or CSV uploads once a day or once per week.
Streaming ingestion is well-suited for hot storage to support a continuous stream of real-time (or near-real-time) data processing, such as from social media feeds and high-volume e-commerce AI helper agents.
Hybrid ingestion uses a combination of batch and streaming ingestion to handle both historical and real-time data requirements for AI models.
Where does cloud object storage sit in the AI data pipeline?
Everywhere. All scalable data pipelines lead to object storage.
Why?Data ingestion and active archive are the major areas where object storage fulfills an important purpose. When training AI models, especially in production, data scalability for multiple and diverse data types is a hard requirement. But object storage plays a key role in the other pipeline stages:
Data processing: Stores versioned outputs from data labeling, feature engineering, and cleaning processes.
Model experimentation and training: Provides high-throughput access to training datasets and stores model checkpoints.
Model deployment and inference: Stores serialized model artifacts with API-based retrieval for serving predictions at scale.
Monitoring: Stores synthetic outputs from generative models, logs, feedback, and performance metrics for analysis and reuse.
For both AI data performance and cost optimization, selecting an object storage product or tier is far from one-size-fits-all. You can strategically allocate your data to B2 Cloud Storage or B2 Overdrive, with your most essential model data stored in B2 Overdrive. Here’s a high-level diagram of what Backblaze B2 product to use for each stage, including examples of the data stored at each stage.
Learn more at Ai4 in August
Want to learn more? Backblaze is heading to Las Vegas for Ai4 August 11–13! In addition to booking a meeting to speak with our storage experts and stopping by our booth to pick up some swag, I’m excited to talk more about the AI data pipeline during my talk. If you’re attending Ai4, add The AI Pipeline Starts with Storage: Architecting Scalable Data Foundations to your conference agenda.
Can’t attend live in Vegas? Reach out to our Sales team to talk about your specific use case and how B2 Overdrive can help propel your data.
Today, we’re announcing two significant enhancements to AWS Lambda that make it easier than ever for developers to build and debug serverless applications in their local development environments: console to IDE integration and remote debugging. These new capabilities build upon our recent improvements to the Lambda development experience, including the enhanced in-console editing experience and the improved local integrated development environment (IDE) experience launched in late 2024.
When building serverless applications, developers typically focus on two areas to streamline their workflow: local development environment setup and cloud debugging capabilities. While developers can bring functions from the console to their IDE, they’re looking for ways to make this process more efficient. Additionally, as functions interact with various AWS services in the cloud, developers want enhanced debugging capabilities to identify and resolve issues earlier in the development cycle, reducing their reliance on local emulation and helping them optimize their development workflow.
Console to IDE integration
To address the first challenge, we’re introducing console to IDE integration, which streamlines the workflow from the AWS Management Console to Visual Studio Code (VS Code). This new capability adds an Open in Visual Studio Code button to the Lambda console, enabling developers to quickly move from viewing their function in the browser to editing it in their IDE, eliminating the time-consuming setup process for local development environments.
The console to IDE integration automatically handles the setup process, checking for VS Code installation and the AWS Toolkit for VS Code. For developers that have everything already configured, choosing the button immediately opens their function code in VS Code, so they can continue editing and deploy changes back to Lambda in seconds. If VS Code isn’t installed, it directs developers to the download page, and if the AWS Toolkit is missing, it prompts for installation.
To use console to IDE, look for the Open in VS Code button in either the Getting Started popup after creating a new function or the Code tab of existing Lambda functions. After selecting, VS Code opens automatically (installing AWS Toolkit if needed). Unlike the console environment, you now have access to a full development environment with integrated terminal – a significant improvement for developers who need to manage packages (npm install, pip install), run tests, or use development tools like linters and formatters. You can edit code, add new files/folders, and any changes you make will trigger an automatic deploy prompt. When you choose to deploy, the AWS Toolkit automatically deploys your function to your AWS account.
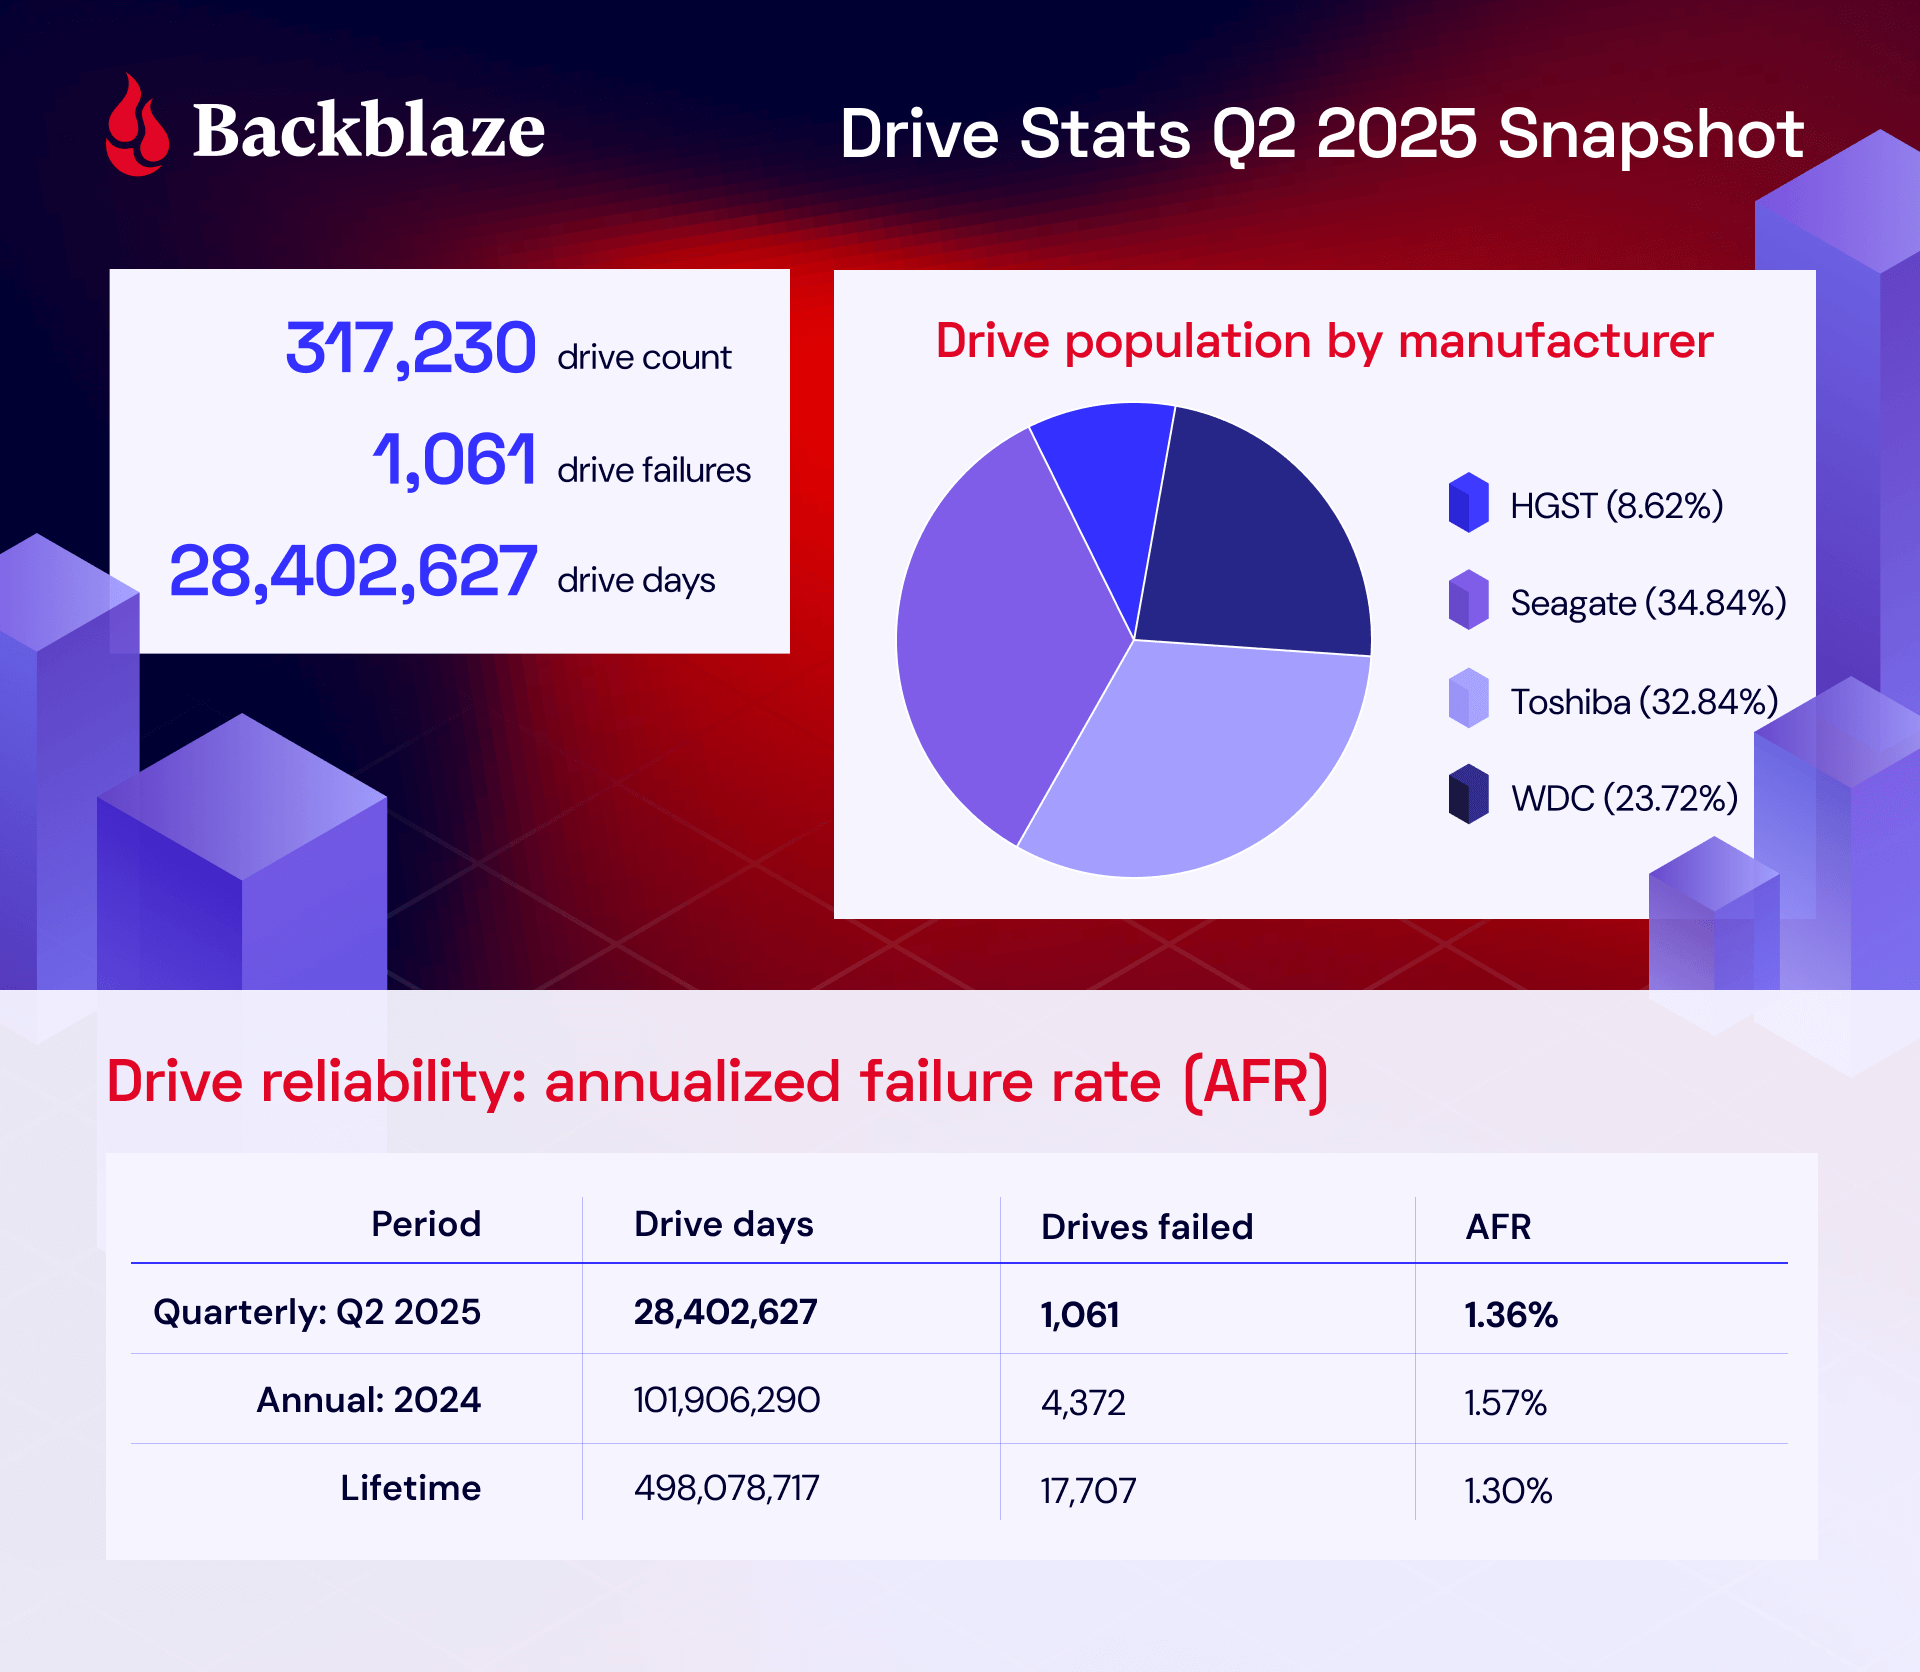
Remote debugging
Once developers have their functions in their IDE, they can use remote debugging to debug Lambda functions deployed in their AWS account directly from VS Code. The key benefit of remote debugging is that it allows developers to debug functions running in the cloud while integrated with other AWS services, enabling faster and more reliable development.
Getting started with remote debugging is straightforward. Developers can select a Lambda function in VS Code and enable debugging in seconds. AWS Toolkit for VS Code automatically downloads the function code, establishes a secure debugging connection, and enables breakpoint setting. When debugging is complete, AWS Toolkit for VS Code automatically cleans up the debugging configuration to prevent any impact on production traffic.
Let’s try it out
To take remote debugging for a spin, I chose to start with a basic “hello world” example function, written in Python. I had previously created the function using the AWS Management Console for AWS Lambda. Using the AWS Toolkit for VS Code, I can navigate to my function in the Explorer pane. Hovering over my function, I can right-click (ctrl-click in Windows) to download the code to my local machine to edit the code in my IDE. Saving the file will ask me to decide if I want to deploy the latest changes to Lambda.
From here, I can select the play icon to open the Remote invoke configuration page for my function. This dialog will now display a Remote debugging option, which I configure to point at my local copy of my function handler code. Before choosing Remote invoke, I can set breakpoints on the left anywhere I want my code to pause for inspection.
My code will be running in the cloud after it’s invoked, and I can monitor its status in real time in VS Code. In the following screenshot, you can see I’ve set a breakpoint at the print statement. My function will pause execution at this point in my code, and I can inspect things like local variable values before either continuing to the next breakpoint or stepping into the code line by line.
Here, you can see that I’ve chosen to step into the code, and as I go through it line by line, I can see the context and local and global variables displayed on the left side of the IDE. Additionally, I can follow the logs in the Output tab at the bottom of the IDE. As I step through, I’ll see any log messages or output messages from the execution of my function in real time.
Enhanced development workflow
These new capabilities work together to create a more streamlined development experience. Developers can start in the console, quickly transition to VS Code using the console to IDE integration, and then use remote debugging to debug their functions running in the cloud. This workflow eliminates the need to switch between multiple tools and environments, helping developers identify and fix issues faster.
Now available
You can start using these new features through the AWS Management Console and VS Code with the AWS Toolkit for VS Code (v3.69.0 or later) installed. Console to IDE integration is available in all commercial AWS Regions where Lambda is available, except AWS GovCloud (US) Regions. Learn more about it in Lambda and AWS Toolkit for VS Code documentation. To learn more about remote debugging capability, including AWS Regions it is available in, visit the AWS Toolkit for VS Code and Lambda documentation.
Console to IDE and remote debugging are available to you at no additional cost. With remote debugging, you pay only for the standard Lambda execution costs during debugging sessions. Remote debugging will support Python, Node.js, and Java runtimes at launch, with plans to expand support to additional runtimes in the future.
These enhancements represent a significant step forward in simplifying the serverless development experience, which means developers can build and debug Lambda functions more efficiently than ever before.
While containers have revolutionized how development teams package and deploy applications, these teams have had to carefully monitor releases and build custom tooling to mitigate deployment risks, which slows down shipping velocity. At scale, development teams spend valuable cycles building and maintaining undifferentiated deployment tools instead of innovating for their business.
Starting today, you can use the built-in blue/green deployment capability in Amazon Elastic Container Service (Amazon ECS) to make your application deployments safer and more consistent. This new capability eliminates the need to build custom deployment tooling while giving you the confidence to ship software updates more frequently with rollback capability.
Here’s how you can enable the built-in blue/green deployment capability in the Amazon ECS console.
You create a new “green” application environment while your existing “blue” environment continues to serve live traffic. After monitoring and testing the green environment thoroughly, you route the live traffic from blue to green. With this capability, Amazon ECS now provides built-in functionality that makes containerized application deployments safer and more reliable.
Below is a diagram illustrating how blue/green deployment works by shifting application traffic from the blue environment to the green environment. You can learn more at the Amazon ECS blue/green service deployments workflow page.
Amazon ECS orchestrates this entire workflow while providing event hooks to validate new versions using synthetic traffic before routing production traffic. You can validate new software versions in production environments before exposing them to end users and roll back near-instantaneously if issues arise. Because this functionality is built directly into Amazon ECS, you can add these safeguards by simply updating your configuration without building any custom tooling.
Getting started Let me walk you through a demonstration that showcases how to configure and use blue/green deployments for an ECS service. Before that, there are a few setup steps that I need to complete, including configuring AWS Identity and Access Management (IAM) roles, which you can find on the Required resources for Amazon ECS blue/green deployments Documentation page.
For this demonstration, I want to deploy a new version of my application using the blue/green strategy to minimize risk. First, I need to configure my ECS service to use blue/green deployments. I can do this through the ECS console, AWS Command Line Interface (AWS CLI), or using infrastructure as code.
Using the Amazon ECS console, I create a new service and configure it as usual:
In the Deployment Options section, I choose ECS as the Deployment controller type, then Blue/green as the Deployment strategy. Bake time is the time after the production traffic has shifted to green, when instant rollback to blue is available. When the bake time expires, blue tasks are removed.
We’re also introducing deployment lifecycle hooks. These are event-driven mechanisms you can use to augment the deployment workflow. I can select which AWS Lambda function I’d like to use as a deployment lifecycle hook. The Lambda function can perform the required business logic, but it must return a hook status.
Amazon ECS supports the following lifecycle hooks during blue/green deployments. You can learn more about each stage on the Deployment lifecycle stages page.
Pre scale up
Post scale up
Production traffic shift
Test traffic shift
Post production traffic shift
Post test traffic shift
For my application, I want to test when the test traffic shift is complete and the green service handles all of the test traffic. Since there’s no end-user traffic, a rollback at this stage will have no impact on users. This makes Post test traffic shift suitable for my use case as I can test it first with my Lambda function.
Switching context for a moment, let’s focus on the Lambda function that I use to validate the deployment before allowing it to proceed. In my Lambda function as a deployment lifecycle hook, I can perform any business logic, such as synthetic testing, calling another API, or querying metrics.
Within the Lambda function, I must return a hookStatus. A hookStatus can be SUCCESSFUL, which will move the process to the next step. If the status is FAILED, it rolls back to the blue deployment. If it’s IN_PROGRESS, then Amazon ECS retries the Lambda function in 30 seconds.
In the following example, I set up my validation with a Lambda function that performs file upload as part of a test suite for my application.
import json
import urllib3
import logging
import base64
import os
# Configure logging
logger = logging.getLogger()
logger.setLevel(logging.DEBUG)
# Initialize HTTP client
http = urllib3.PoolManager()
def lambda_handler(event, context):
"""
Validation hook that tests the green environment with file upload
"""
logger.info(f"Event: {json.dumps(event)}")
logger.info(f"Context: {context}")
try:
# In a real scenario, you would construct the test endpoint URL
test_endpoint = os.getenv("APP_URL")
# Create a test file for upload
test_file_content = "This is a test file for deployment validation"
test_file_data = test_file_content.encode('utf-8')
# Prepare multipart form data for file upload
fields = {
'file': ('test.txt', test_file_data, 'text/plain'),
'description': 'Deployment validation test file'
}
# Send POST request with file upload to /process endpoint
response = http.request(
'POST',
test_endpoint,
fields=fields,
timeout=30
)
logger.info(f"POST /process response status: {response.status}")
# Check if response has OK status code (200-299 range)
if 200 <= response.status < 300:
logger.info("File upload test passed - received OK status code")
return {
"hookStatus": "SUCCEEDED"
}
else:
logger.error(f"File upload test failed - status code: {response.status}")
return {
"hookStatus": "FAILED"
}
except Exception as error:
logger.error(f"File upload test failed: {str(error)}")
return {
"hookStatus": "FAILED"
}
When the deployment reaches the lifecycle stage that is associated with the hook, Amazon ECS automatically invokes my Lambda function with deployment context. My validation function can run comprehensive tests against the green revision—checking application health, running integration tests, or validating performance metrics. The function then signals back to ECS whether to proceed or abort the deployment.
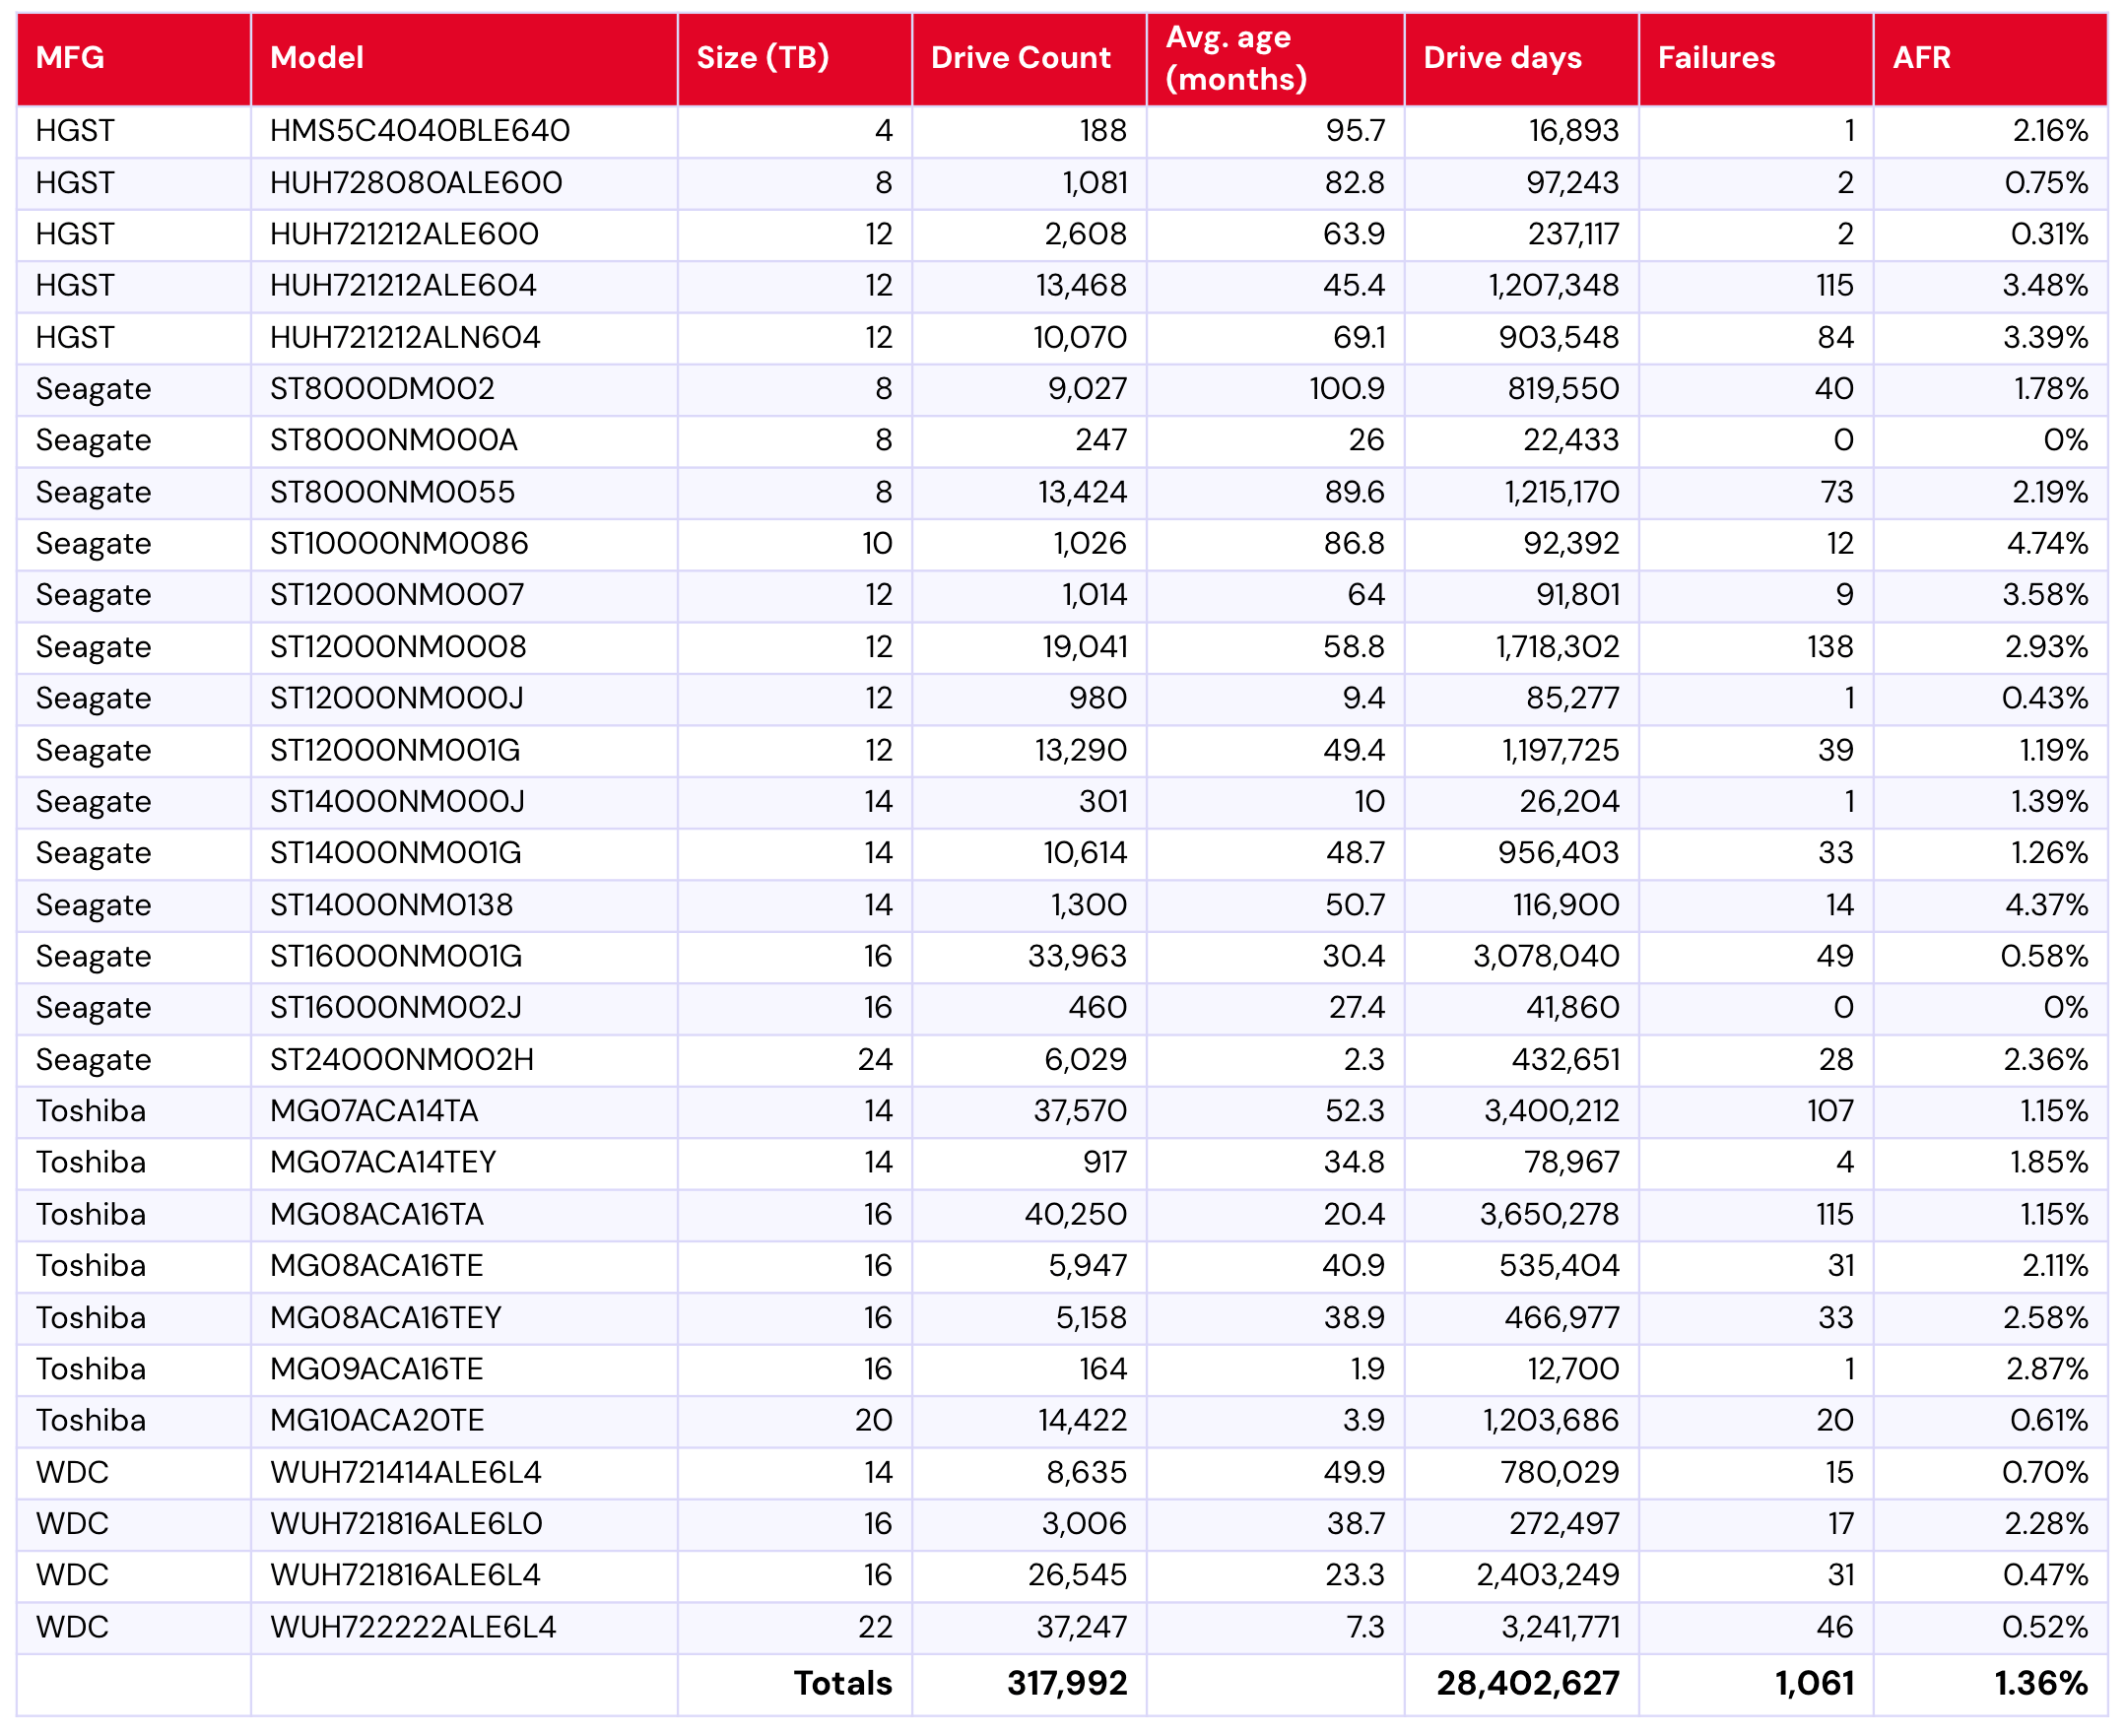
As I chose the blue/green deployment strategy, I also need to configure the load balancers and/or Amazon ECS Service Connect. In the Load balancing section, I select my Application Load Balancer.
In the Listener section, I use an existing listener on port 80 and select two Target groups.
Happy with this configuration, I create the service and wait for ECS to provision my new service.
Testing blue/green deployments Now, it’s time to test my blue/green deployments. For this test, Amazon ECS will trigger my Lambda function after the test traffic shift is completed. My Lambda function will return FAILED in this case as it performs file upload to my application, but my application doesn’t have this capability.
I update my service and check Force new deployment, knowing the blue/green deployment capability will roll back if it detects a failure. I select this option because I haven’t modified the task definition but still need to trigger a new deployment.
At this stage, I have both blue and green environments running, with the green revision handling all the test traffic. Meanwhile, based on Amazon CloudWatch Logs of my Lambda function, I also see that the deployment lifecycle hooks work as expected and emit the following payload:
As expected, my AWS Lambda function returns FAILED as hookStatus because it failed to perform the test.
[ERROR] 2025-07-10T13:18:43.392Z 67d9b03e-12da-4fab-920d-9887d264308e File upload test failed: HTTPConnectionPool(host='xyz.us-west-2.elb.amazonaws.com', port=80): Max retries exceeded with url: / (Caused by ConnectTimeoutError(<urllib3.connection.HTTPConnection object at 0x7f8036273a80>, 'Connection to xyz.us-west-2.elb.amazonaws.com timed out. (connect timeout=30)'))
Because the validation wasn’t completed successfully, Amazon ECS tries to roll back to the blue version, which is the previous working deployment version. I can monitor this process through ECS events in the Events section, which provides detailed visibility into the deployment progress.
Amazon ECS successfully rolls back the deployment to the previous working version. The rollback happens near-instantaneously because the blue revision remains running and ready to receive production traffic. There is no end-user impact during this process, as production traffic never shifted to the new application version—ECS simply rolled back test traffic to the original stable version. This eliminates the typical deployment downtime associated with traditional rolling deployments.
I can also see the rollback status in the Last deployment section.
Throughout my testing, I observed that the blue/green deployment strategy provides consistent and predictable behavior. Furthermore, the deployment lifecycle hooks provide more flexibility to control the behavior of the deployment. Each service revision maintains immutable configuration including task definition, load balancer settings, and Service Connect configuration. This means that rollbacks restore exactly the same environment that was previously running.
Additional things to know Here are a couple of things to note:
Pricing – The blue/green deployment capability is included with Amazon ECS at no additional charge. You pay only for the compute resources used during the deployment process.
Availability – This capability is available in all commercial AWS Regions.
Get started with blue/green deployments by updating your Amazon ECS service configuration in the Amazon ECS console.
Ransomware used to mean locked files and paralyzed systems. But today, bad actors are just as focused on exfiltration—the silent theft of sensitive data—and using that data as leverage for extortion.
According to cybersecurity firm BlackFog, 94% of successful cyberattacks in 2024 involved data exfiltration, either alongside or instead of encryption. Whether it’s stolen patient records, credentials, or source code, the goal is simple: Extract something valuable and threaten to leak it if demands aren’t met.
In this article, we examine how exfiltration became a leading tactic, the trends driving its rise, and what organizations—and cloud storage providers—can do to defend against it.
What is exfiltration?
In cybersecurity, exfiltration refers to the unauthorized transfer of data from a system—often done stealthily, and almost always with malicious intent. Think of it as the digital equivalent of corporate espionage: Data is copied, compressed, and quietly smuggled out. Unlike ransomware encryption, which slams the door in your face, exfiltration leaves the front door looking untouched.
The data being exfiltrated is rarely random. Cybercriminals are increasingly strategic about what they take and why. Common targets include:
User credentials
Personally identifiable information (PII)
Intellectual property and source code
Encryption keys
Shadow copies or backup snapshots
Tactics include exploiting cloud storage misconfigurations, hijacking legitimate credentials, or disguising traffic as everyday protocols like DNS or HTTPS. Increasingly, data exfiltration happens before the main event—laying the groundwork for extortion, credential stuffing, or resale on underground markets.
Recent cybersecurity trends related to exfiltration
Exfiltration has become the defining feature of modern cyberattacks, and the evidence is growing:
Double extortion is now standard. Threat actors exfiltrate data first, then deploy ransomware—or skip the encryption altogether—to maximize leverage. According to the 2023 Unit 42 Report, 70% of ransomware incidents involved data theft.
Infostealers, malicious programs designed to covertly harvest sensitive information, are on the rise. Over 2.1 billion credentials were stolen in 2024 alone, with malware like RedLine and Lumma making theft accessible to low-skilled attackers. While cybersecurity task forces (comprised of both government and enterprise actors) have made the news with high-profile disruptions of Lumma and other tools, the ability to use generative AI coding tools has meant that cyber attackers have a shortened time to deployment for malware tools.
Time to exfiltration is shrinking.Fortinet’s 2025 Threat Landscape Report notes that attackers can extract data in under five hours, while defenders often take days to respond.
Encrypted traffic masks malicious behavior. Emerging exfiltration techniques like QUIC-Exfil use modern, encrypted protocols to evade detection by traditional firewalls.
Together, these trends point to a world where stolen data is the main prize—and the threat doesn’t start when the ransom note arrives. It starts when your data quietly leaves the building.
Cloud misconfiguration and its role in exfiltration attacks
Exfiltration doesn’t always require malware—sometimes it only takes a misconfigured storage bucket or firewall rule. Cloud misconfigurations remain a leading cause of breaches, with public buckets, excessive identity and access management (IAM) privileges, and overly permissive network rules exposing data to the open internet.
Attackers exploit these gaps to quietly access or extract data without triggering alerts. A strong cloud posture management strategy—one that includes audit automation, implementing the principle of least privilege, and configuring features like Object Lock or Bucket Access Logs—is critical to reducing exposure.
Defending against exfiltration is a shared responsibility
As exfiltration becomes a primary threat, defense requires collaboration between cloud storage providers and their customers. Here’s how the most effective strategies work together.
Immutable backups and Object Lock
One of the strongest defenses is immutability. Backblaze B2’s Object Lock, for example, allows files to be written once and protected from modification, deletion, or encryption for a set period. Even if attackers compromise credentials, the data cannot be altered or removed.
Visibility and outlier detection
Cloud providers are investing in making advanced logging and behavioral analytics available to users to detect data theft in real time. Some examples of these types of features include:
Granular access logging with IP and user-level metadata.
Rate limiting and download caps to prevent mass theft.
Outlier detection powered by machine learning to catch subtle deviations from baseline activity.
Best practices for customers
Storage-layer defenses work best when paired with customer-side security controls:
Adopt zero trust architecture: Never assume implicit trust. Continuously validate users, devices, and behaviors.
Use MFA and least-privilege access: Lock down credentials, rotate them regularly, and minimize exposure.
Encrypt data at rest and in transit: Use strong encryption standards (AES-256, TLS 1.2+) and managed key systems.
Monitor for exfiltration indicators: Watch for abnormal traffic volumes, geographic anomalies, and unexpected protocol usage.
Run simulated breach drills: Test your team’s ability to detect and respond to stealthy data leaks.
Cloud storage companies can help provide critical security layers, but stopping exfiltration is ultimately a shared responsibility. Combining provider-level resilience with customer vigilance is the best path forward.
In a world of silent theft, vigilance is your best defense
Exfiltration isn’t just an add-on to ransomware. In this environment, locking the doors isn’t enough—You need to monitor the exits.
By combining immutable backups, smart logging, credential controls, and proactive monitoring, organizations can shift from passive victims to active defenders. The best defenses today aren’t just about blocking access; they’re about knowing what’s leaving and making sure it can’t be used against you.
Today at the AWS Summit in New York City, Swami Sivasubramanian, AWS VP of Agentic AI, provided the day’s keynote on how we’re enabling customers to deliver production-ready AI agents at scale. See below for a roundup of the biggest announcements from the event.
Announcing Amazon Nova customization in Amazon SageMaker AI AWS now enables extensive customization of Amazon Nova foundation models through SageMaker AI across all stages of model training. Available as ready-to-use SageMaker recipes, these capabilities allow customers to adapt Nova understanding models across pre-training and post-training, including fine-tuning and alignment recipes to better address business-specific requirements across industries.
Amazon S3 Metadata now supports metadata for all your S3 objects Amazon S3 Metadata now provides comprehensive visibility into all objects in S3 buckets through live inventory and journal tables, enabling SQL-based analysis of both existing and new objects with automatic updates within an hour of changes.
Introducing Amazon S3 Vectors: First cloud storage with native vector support at scale (preview) Amazon S3 Vectors is a new cloud object store that provides native support for storing and querying vectors at massive scale, offering up to 90% cost reduction compared to conventional approaches while seamlessly integrating with Amazon Bedrock Knowledge Bases, SageMaker, and OpenSearch for AI applications.
Streamline the path from data to insights with new Amazon SageMaker capabilities Amazon SageMaker has introduced three new capabilities—Amazon QuickSight integration for dashboard creation, governance, and sharing, Amazon S3 Unstructured Data Integration for cataloging documents and media files, and automatic data onboarding from Lakehouse—that eliminate data silos by unifying structured and unstructured data management, visualization, and governance in a single experience.
Monitor and debug event-driven applications with new Amazon EventBridge logging Amazon EventBridge now offers enhanced logging capabilities that provide comprehensive event lifecycle tracking, helping users monitor and troubleshoot their event-driven applications with detailed logs that show when events are published, matched against rules, delivered to subscribers, or encounter failures.
Amazon EKS enables ultra scale AI/ML workloads with support for 100K nodes per cluster Amazon EKS now scales to 100,000 nodes per cluster, enabling massive AI/ML workloads with up to 1.6M AWS Trainium accelerators or 800K NVIDIA GPUs. This allows organizations to efficiently train and run large AI models while maintaining Kubernetes compatibility and existing tooling integration.
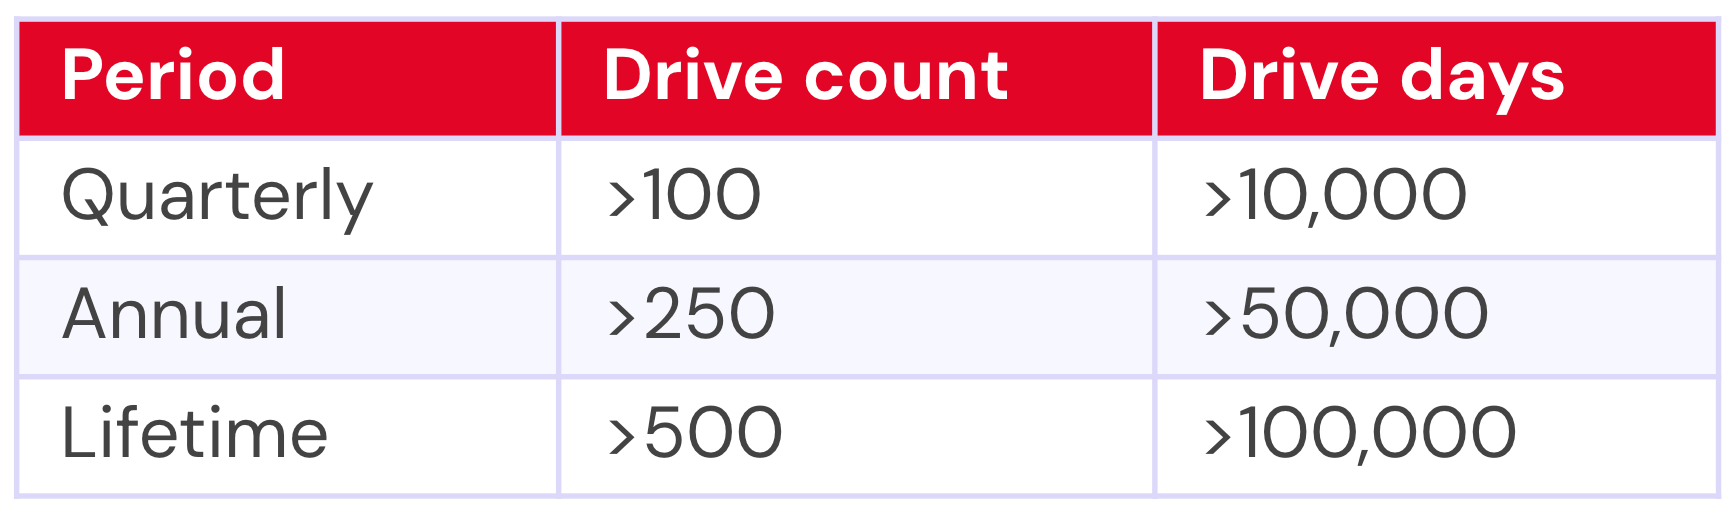
Modern organizations manage data across multiple disconnected systems—structured databases, unstructured files, and separate visualization tools—creating barriers that slow analytics workflows and limit insight generation. Separate visualization platforms often create barriers that prevent teams from extracting comprehensive business insights.
These disconnected workflows prevent your organizations from maximizing your data investments, creating delays in decision making and missed opportunities for comprehensive analysis that combines multiple data types.
Starting today, you can use three new capabilities in Amazon SageMaker to accelerate your path from raw data to actionable insights:
Amazon QuickSight integration – Launch Amazon QuickSight directly from Amazon SageMaker Unified Studio to build dashboards using your project data, then publish them to the Amazon SageMaker Catalog for broader discovery and sharing across your organization.
Amazon SageMaker adds support for Amazon S3 general purpose buckets and Amazon S3 Access Grants in SageMaker Catalog– Make data stored in Amazon S3 general purpose buckets easier for teams to find, access, and collaborate on all types of data including unstructured data, while maintaining fine-grained access control using Amazon S3 Access Grants.
Automatic data onboarding from your lakehouse – Automatic onboarding of existing AWS Glue Data Catalog (GDC) datasets from the lakehouse architecture into SageMaker Catalog, without manual setup.
These new SageMaker capabilities address the complete data lifecycle within a unified and governed experience. You get automatic onboarding of existing structured data from your lakehouse, seamless cataloging of unstructured data content in Amazon S3, and streamlined visualization through QuickSight—all with consistent governance and access controls.
Let’s take a closer look at each capability.
Amazon SageMaker and Amazon QuickSight Integration With this integration, you can build dashboards in Amazon QuickSight using data from your Amazon SageMaker projects. When you launch QuickSight from Amazon SageMaker Unified Studio, Amazon SageMaker automatically creates the QuickSight dataset and organizes it in a secured folder accessible only to project members.
Furthermore, the dashboards you build stay within this folder and automatically appear as assets in your SageMaker project, where you can publish them to the SageMaker Catalog and share them with users or groups in your corporate directory. This keeps your dashboards organized, discoverable, and governed within SageMaker Unified Studio.
To use this integration, both your Amazon SageMaker Unified Studio domain and QuickSight account must be integrated with AWS IAM Identity Center using the same IAM Identity Center instance. Additionally, your QuickSight account must exist in the same AWS account where you want to enable the QuickSight blueprint. You can learn more about the prerequisites on Documentation page.
After these prerequisites are met, you can enable the blueprint for Amazon QuickSight by navigating to the Amazon SageMaker console and choosing the Blueprints tab. Then find Amazon QuickSight and follow the instructions.
You also need to configure your SQL analytics project profile to include Amazon QuickSight in Add blueprint deployment settings.
Then, when you create a new project, you need to use the SQL analytics profile.
With your project created, you can start building visualizations with QuickSight. You can navigate to the Data tab, select the table or view to visualize, and choose Open in QuickSight under Actions.
This will redirect you to the Amazon QuickSight transactions dataset page and you can choose USE IN ANALYSIS to begin exploring the data.
When you create a project with the QuickSight blueprint, SageMaker Unified Studio automatically provisions a restricted QuickSight folder per project where SageMaker scopes all new assets—analyses, datasets, and dashboards. The integration maintains real-time folder permission sync, keeping QuickSight folder access permissions aligned with project membership.
Amazon Simple Storage Service (S3) general purpose buckets integration Starting today, SageMaker adds support for S3 general purpose buckets in SageMaker Catalog to increase discoverability and allows granular permissions through S3 Access Grants, enabling users to govern data, including sharing and managing permissions. Data consumers, such as data scientists, engineers, and business analysts, can now discover and access S3 assets through SageMaker Catalog. This expansion also enables data producers to govern security controls on any S3 data asset through a single interface.
To use this integration, you need appropriate S3 general purpose bucket permissions, and your SageMaker Unified Studio projects must have access to the S3 buckets containing your data. Learn more about prerequisites on Amazon S3 data in Amazon SageMaker Unified Studio Documentation page.
You can add a connection to an existing S3 bucket.
When it’s connected, you can browse accessible folders and create discoverable assets by choosing on the bucket or a folder and selecting Publish to Catalog.
This action creates a SageMaker Catalog asset of type “S3 Object Collection” and opens an asset details page where users can augment business context to improve search and discoverability. Once published, data consumers can discover and subscribe to these cataloged assets. When data consumers subscribe to “S3 Object Collection” assets, SageMaker Catalog automatically grants access using S3 Access Grants upon approval, enabling cross-team collaboration while ensuring only the right users have the right access.
When you have access, now you can process your unstructured data in Amazon SageMaker Jupyter notebook. Following screenshot is an example to process image in medical use case.
If you have structured data, you can query your data using Amazon Athena or process using Spark in notebooks.
With this access granted through S3 Access Grants, you can seamlessly incorporate S3 data into my workflows—analyzing it in notebooks, combining it with structured data in the lakehouse and Amazon Redshift for comprehensive analytics. You can access unstructured data such as documents, images in JupyterLab notebooks to train ML models, or generate queryable insights.
Automatic data onboarding from your lakehouse This integration automatically onboards all your lakehouse datasets into SageMaker Catalog. The key benefit for you is to bring AWS Glue Data Catalog (GDC) datasets into SageMaker Catalog, eliminating manual setup for cataloging, sharing, and governing them centrally.
This integration requires an existing lakehouse setup with Data Catalog containing your structured datasets.
When you set up a SageMaker domain, SageMaker Catalog automatically ingests metadata from all lakehouse databases and tables. This means you can immediately explore and use these datasets from within SageMaker Unified Studio without any configuration.
The integration helps you to start managing, governing, and consuming these assets from within SageMaker Unified Studio, applying the same governance policies and access controls you can use for other data types while unifying technical and business metadata.
Additional things to know Here are a couple of things to note:
Availability – These integrations are available in all commercial AWS Regions where Amazon SageMaker is supported.
Pricing – Standard SageMaker Unified Studio, QuickSight, and Amazon S3 pricing applies. No additional charges for the integrations themselves.
When you’re new to Amazon Web Services (AWS), you can get started with AWS Free Tier to learn about AWS services, gain hands-on experience, and build applications. You can explore the portfolio of services without incurring costs, making it even easier to get started with AWS.
The enhanced AWS Free Tier program offers two options during sign-up: a free account plan and a paid account plan. The free account plan ensures you won’t incur any charges until you upgrade to a paid plan. The free account plan expires after 6 months or when you exhaust your credits, whichever comes first.
While on the free account plan, you won’t be able to use some services typically used by large enterprises. You can upgrade to a paid plan at any time to continue building on AWS. When you upgrade, you can still use any unused credits for any eligible service usage for up to 12 months from your initial sign-up date.
When you choose the paid plan, AWS will automatically apply your Free Tier credits to the use of eligible services in your AWS bills. For usage that exceeds the credits, you’re charged with the on-demand pricing.
Get up to $200 credits in action When you sign up for either a free plan or a paid plan, you’ll receive $100 credit. You can also earn an additional $20 credits for each of these five AWS service activities you complete:
Amazon EC2 – You’ll learn how to launch an EC2 instance and terminate it.
Amazon RDS – You’ll learn the basic configuration options for launching an RDS database.
AWS Lambda – You’ll learn to build a straightforward web application consisting of a Lambda function with a function URL.
Amazon Bedrock – You’ll learn how to submit a prompt to generate a response in the Amazon Bedrock text playground.
AWS Budgets – You’ll learn how to set a budget that alerts you when you exceed your budgeted cost amount.
These activities are designed to expose customers to important building blocks of AWS, including cost and usage that show up in the AWS Billing Console. These charges are deducted from your Free Tier credits and help teach new AWS users about selecting the appropriate instance sizes to minimize your costs.
To create your first budget, choose Use a template (simplified) and Monthly cost budget to notify you if you exceed, or are forecasted to exceed, the budget amount.
When you choose the Customize (advanced) setup option, you can customize a budget to set parameters specific to your use case, scope of AWS services or AWS Regions, the time period, the start month, and specific accounts.
After you successfully create your budget, your begin receiving alerts when your spend exceeds your budgeted amount.
You can go to the Credits page in the left navigation pane in the AWS Billing and Cost Management Console to confirm your $20 in credits. Please note, it can take up to 10 minutes for your credits to appear.
You can receive an additional $80 by completing the remaining four activities. Now you can use up to $200 in credits to learn AWS services and build your first application.
Things to know Here are some of things to know about the enhanced AWS Free Tier program:
Notifications – We’ll send an email alert when 50 percent, 25 percent, or 10 percent of your AWS credits remain. We’ll also send notifications to the AWS console and your email inbox when you have 15 days, 7 days, and 2 days left in your 6-month free period. After your free period ends, we’ll send you an email with instructions on how to upgrade to a paid plan. You’ll have 90 days to reopen your account by upgrading to a paid plan.
AWS services – The free account can access parts of AWS services including over 30 services that offer always-free tier. The paid account can access all AWS services. For more information, visit AWS Free Tier page.
Legacy Free Tier – If your AWS account was created before July 15, 2025, you’ll continue to be in the legacy Free Tier program, where you can access short-term trials, 12-month trials, and always free tier services. The always-free tier is available under both the new Free Tier program and the legacy Free Tier program.
Now available The new AWS Free Tier features are generally available in all AWS Regions, except the AWS GovCloud (US) Regions and the China Regions. To learn more, visit the AWS Free Tier page and AWS Free Tier Documentation.
Starting today, you can use enhanced logging capability in Amazon EventBridge to monitor and debug your event-driven applications with comprehensive logs. These new enhancements help improve how you monitor and troubleshoot event flows.
The new observability capabilities address microservices and event-driven architecture monitoring challenges by providing comprehensive event lifecycle tracking. EventBridge now generates detailed log entries every time a matched event against rules is published, delivered to subscribers, or encounters failures and retries.
You gain visibility into the complete event journey with detailed information about successes, failures, and status codes that make identifying and diagnosing issues straightforward. What used to take hours of trial-and-error debugging now takes minutes with detailed event lifecycle tracking and built-in query tools.
Using Amazon EventBridge enhanced observability Let me walk you through a demonstration that showcases the logging capability in Amazon EventBridge.
I can enable logging for an existing event bus or when creating a new custom event bus. First, I navigate to the EventBridge console and choose Event buses in the left navigation pane. In Custom event bus, I choose Create event bus.
I can see this new capability in the Logs section. I have three options to configure the Log destination: Amazon CloudWatch Logs, Amazon Data Firehose Stream, and Amazon Simple Storage Service (Amazon S3). If I want to stream my logs into a data lake, I can select Amazon Kinesis Data Firehose Stream. Logs are encrypted in transit with TLS and at rest if a customer-managed key (CMK) is provided for the event bus. CloudWatch Logs supports customer-managed keys, and Data Firehose offers server-side encryption for downstream destinations.
For this demo, I select CloudWatch logs and S3 logs.
I can also choose Log level, from Error, Info, or Trace. I choose Trace and select Include execution data because I need to review the payloads. You need to be mindful as logging payload data may contain sensitive information, and this setting applies to all log destinations you select. Then, I configure two destinations, one each for CloudWatch log group and S3 logs. Then I choose Create.
After logging is enabled, I can start publishing test events to observe the logging behavior.
For the first scenario, I’ve built an AWS Lambda function and configured this Lambda function as a target.
I navigate to my event bus to send a sample event by choosing Send events.
After I sent the sample event, I can see the logs are available in my S3 bucket.
I can also see the log entries appearing in the Amazon CloudWatch logs. The logs show the event lifecycle, from EVENT_RECEIPT to SUCCESS. Learn more about the complete event lifecycle on TBD:DOC_PAGE.
Now, let’s evaluate these logs. For brevity, I only include a few logs and have redacted them for readability. Here’s the log from when I triggered the event:
The additional log entries include rich metadata that makes troubleshooting straightforward. For example, on a successful event, I can see the latency timing from starting to completing the event, duration for the target to finish processing, and HTTP status code.
Debugging failures with complete event lifecycle tracking The benefit of EventBridge logging becomes apparent when things go wrong. To test failure scenarios, I intentionally misconfigure a Lambda function’s permissions and change the rule to point to a different Lambda function without proper permissions.
The attempt failed with a permanent failure due to missing permissions. The log shows it’s a FIRST attempt that resulted in NO_PERMISSIONS status.
{
"message_type": "INVOCATION_ATTEMPT_PERMANENT_FAILURE",
"log_level": "ERROR",
"details": {
"rule_arn": "arn:aws:events:us-east-1:123:rule/demo-logging/demo-order-placed",
"role_arn": "arn:aws:iam::123:role/service-role/Amazon_EventBridge_Invoke_Lambda_123",
"target_arn": "arn:aws:lambda:us-east-1:123:function:demo-evb-fail",
"attempt_type": "FIRST",
"attempt_count": 1,
"invocation_status": "NO_PERMISSIONS",
"target_duration_ms": 25,
"target_response_body": "{\"requestId\":\"a4bdfdc9-4806-4f3e-9961-31559cb2db62\",\"errorCode\":\"AccessDeniedException\",\"errorType\":\"Client\",\"errorMessage\":\"User: arn:aws:sts::123:assumed-role/Amazon_EventBridge_Invoke_Lambda_123/db4bff0a7e8539c4b12579ae111a3b0b is not authorized to perform: lambda:InvokeFunction on resource: arn:aws:lambda:us-east-1:123:function:demo-evb-fail because no identity-based policy allows the lambda:InvokeFunction action\",\"statusCode\":403}",
"http_status_code": 403
}
}
The final log entry summarizes the complete failure with timing metrics and the exact error message.
{
"message_type": "INVOCATION_FAILURE",
"log_level": "ERROR",
"details": {
"rule_arn": "arn:aws:events:us-east-1:123:rule/demo-logging/demo-order-placed",
"role_arn": "arn:aws:iam::123:role/service-role/Amazon_EventBridge_Invoke_Lambda_123",
"target_arn": "arn:aws:lambda:us-east-1:123:function:demo-evb-fail",
"total_attempts": 1,
"final_invocation_status": "NO_PERMISSIONS",
"ingestion_to_start_latency_ms": 62,
"ingestion_to_complete_latency_ms": 114,
"target_duration_ms": 25,
"http_status_code": 403
},
"error": {
"http_status_code": 403,
"error_message": "User: arn:aws:sts::123:assumed-role/Amazon_EventBridge_Invoke_Lambda_123/db4bff0a7e8539c4b12579ae111a3b0b is not authorized to perform: lambda:InvokeFunction on resource: arn:aws:lambda:us-east-1:123:function:demo-evb-fail because no identity-based policy allows the lambda:InvokeFunction action",
"aws_service": "AWSLambda",
"request_id": "a4bdfdc9-4806-4f3e-9961-31559cb2db62"
}
}
The logs provide detailed performance metrics that help identify bottlenecks. The ingestion_to_start_latency_ms: 62 shows the time from event ingestion to starting invocation, while ingestion_to_complete_latency_ms: 114 represents the total time from ingestion to completion. Additionally, target_duration_ms: 25 indicates how long the target service took to respond, helping distinguish between EventBridge processing time and target service performance.
The error message clearly states what failed, lambda:InvokeFunction action, why it failed, (no identity-based policy allows the action), which role was involved (Amazon_EventBridge_Invoke_Lambda_1428392416), and which specific resource was affected, which was indicated by the Lambda function Amazon Resource Name (ARN).
Debugging API Destinations with EventBridge Logging One particular use case that I think EventBridge logging capability will be helpful is to debug issues with API destinations. EventBridge API destinations are HTTPS endpoints that you can invoke as the target of an event bus rule or pipe. HTTPS endpoints help you to route events from your event bus to external systems, software-as-a-service (SaaS) applications, or third-party APIs using HTTPS calls. They use connections to handle authentication and credentials, making it easy to integrate your event-driven architecture with any HTTPS-based service.
API destinations are commonly used to send events to external HTTPS endpoints and debugging failures from the external endpoint can be a challenge. These problems typically stem from changes to the endpoint authentication requirements or modified credentials.
To demonstrate this debugging capability, I intentionally configured an API destination with incorrect credentials in the connection resource.
When I send an event to this misconfigured endpoint, the enhanced logging shows the root cause of this failure.
{
"resource_arn": "arn:aws:events:us-east-1:123:event-bus/demo-logging",
"message_timestamp_ms": 1750344097251,
"event_bus_name": "demo-logging",
//REDACTED FOR BREVITY//,
"message_type": "INVOCATION_FAILURE",
"log_level": "ERROR",
"details": {
//REDACTED FOR BREVITY//,
"total_attempts": 1,
"final_invocation_status": "SDK_CLIENT_ERROR",
"ingestion_to_start_latency_ms": 135,
"ingestion_to_complete_latency_ms": 549,
"target_duration_ms": 327,
"target_response_body": "",
"http_status_code": 400
},
"error": {
"http_status_code": 400,
"error_message": "Unable to invoke ApiDestination endpoint: The request failed because the credentials included for the connection are not authorized for the API destination."
}
}
The log provides immediate clarity about the failure. The target_arn shows this involves an API destination, the final_invocation_status indicates SDK_CLIENT_ERROR, and the http_status_code of 400 , which points to a client-side issue. Most importantly, the error_message explicitly states that: Unable to invoke ApiDestination endpoint: The request failed because the credentials included for the connection are not authorized for the API destination.
This complete log sequence provides useful debugging insights because I can see exactly how the event moved through EventBridge — from event receipt, to ingestion, to rule matching, to invocation attempts. This level of detail eliminates guesswork and points directly to the root cause of the issue.
Additional things to know Here are a couple of things to note:
Architecture support – Logging works with all EventBridge features including custom event buses, partner event sources, and API destinations for HTTPS endpoints.
Performance impact – Logging operates asynchronously with no measurable impact on event processing latency or throughput.
Pricing – You pay standard Amazon S3, Amazon CloudWatch Logs or Amazon Data Firehose pricing for log storage and delivery. EventBridge logging itself incurs no additional charges. For details, visit the Amazon EventBridge pricing page .
Availability – Amazon EventBridge logging capability is available in all AWS Regions where EventBridge is supported.
Today, we’re announcing the preview of Amazon S3 Vectors, a purpose-built durable vector storage solution that can reduce the total cost of uploading, storing, and querying vectors by up to 90 percent. Amazon S3 Vectors is the first cloud object store with native support to store large vector datasets and provide subsecond query performance that makes it affordable for businesses to store AI-ready data at massive scale.
Vector search is an emerging technique used in generative AI applications to find similar data points to given data by comparing their vector representations using distance or similarity metrics. Vectors are numerical representation of unstructured data created from embedding models. You generate vectors using embedding models for fields inside your document and store vectors into S3 Vectors to search semantically.
S3 Vectors introduces vector buckets, a new bucket type with a dedicated set of APIs to store, access, and query vector data without provisioning any infrastructure. When you create an S3 vector bucket, you organize your vector data within vector indexes, making it simple for running similarity search queries against your dataset. Each vector bucket can have up to 10,000 vector indexes, and each vector index can hold tens of millions of vectors.
After creating a vector index, when adding vector data to the index, you can also attach metadata as key-value pairs to each vector to filter future queries based on a set of conditions, for example, dates, categories, or user preferences. As you write, update, and delete vectors over time, S3 Vectors automatically optimizes the vector data to achieve the best possible price-performance for vector storage, even as the datasets scale and evolve.
With S3 Vectors, you can now economically store the vector embeddings that represent massive amounts of unstructured data such as images, videos, documents, and audio files, enabling scalable generative AI applications including semantic and similarity search, RAG, and build agent memory. You can also build applications to support a wide range of industry use cases including personalized recommendations, automated content analysis, and intelligent document processing without the complexity and cost of managing vector databases.
S3 Vectors in action To create a vector bucket, choose Vector buckets in the left navigation pane in the Amazon S3 console and then choose Create vector bucket.
Enter a vector bucket name and choose the encryption type. If you don’t specify an encryption type, Amazon S3 applies server-side encryption with Amazon S3 managed keys (SSE-S3) as the base level of encryption for new vectors. You can also choose server-side encryption with AWS Key Management Service (AWS KMS) keys (SSE-KMS). To learn more about managing your vector bucket, visit S3 Vector buckets in the Amazon S3 User Guide.
Now, you can create a vector index to store and query your vector data within your created vector bucket.
Enter a vector index name and the dimensionality of the vectors to be inserted in the index. All vectors added to this index must have exactly the same number of values.
For Distance metric, you can choose either Cosine or Euclidean. When creating vector embeddings, select your embedding model’s recommended distance metric for more accurate results.
Choose Create vector index and then you can insert, list, and query vectors.
To insert your vector embeddings to a vector index, you can use the AWS Command Line Interface (AWS CLI), AWS SDKs, or Amazon S3 REST API. To generate vector embeddings for your unstructured data, you can use embedding models offered by Amazon Bedrock.
If you’re using the latest AWS Python SDKs, you can generate vector embeddings for your text using Amazon Bedrock using following code example:
# Generate and print an embedding with Amazon Titan Text Embeddings V2.
import boto3
import json
# Create a Bedrock Runtime client in the AWS Region of your choice.
bedrock= boto3.client("bedrock-runtime", region_name="us-west-2")
The text strings to convert to embeddings.
texts = [
"Star Wars: A farm boy joins rebels to fight an evil empire in space",
"Jurassic Park: Scientists create dinosaurs in a theme park that goes wrong",
"Finding Nemo: A father fish searches the ocean to find his lost son"]
embeddings=[]
#Generate vector embeddings for the input texts
for text in texts:
body = json.dumps({
"inputText": text
})
# Call Bedrock's embedding API
response = bedrock.invoke_model(
modelId='amazon.titan-embed-text-v2:0', # Titan embedding model
body=body)
# Parse response
response_body = json.loads(response['body'].read())
embedding = response_body['embedding']
embeddings.append(embedding)
Now, you can insert vector embeddings into the vector index and query vectors in your vector index using the query embedding:
# Create S3Vectors client
s3vectors_client = boto3.client('s3vectors', region_name='us-west-2')
# Insert vector embedding
s3vectors.put_vectors( vectorBucketName="channy-vector-bucket",
indexName="channy-vector-index",
vectors=[
{"key": "v1", "data": {"float32": embeddings[0]}, "metadata": {"id": "key1", "source_text": texts[0], "genre":"scifi"}},
{"key": "v2", "data": {"float32": embeddings[1]}, "metadata": {"id": "key2", "source_text": texts[1], "genre":"scifi"}},
{"key": "v3", "data": {"float32": embeddings[2]}, "metadata": {"id": "key3", "source_text": texts[2], "genre":"family"}}
],
)
#Create an embedding for your query input text
# The text to convert to an embedding.
input_text = "List the movies about adventures in space"
# Create the JSON request for the model.
request = json.dumps({"inputText": input_text})
# Invoke the model with the request and the model ID, e.g., Titan Text Embeddings V2.
response = bedrock.invoke_model(modelId="amazon.titan-embed-text-v2:0", body=request)
# Decode the model's native response body.
model_response = json.loads(response["body"].read())
# Extract and print the generated embedding and the input text token count.
embedding = model_response["embedding"]
# Performa a similarity query. You can also optionally use a filter in your query
query = s3vectors.query_vectors( vectorBucketName="channy-vector-bucket",
indexName="channy-vector-index",
queryVector={"float32":embedding},
topK=3,
filter={"genre":"scifi"},
returnDistance=True,
returnMetadata=True
)
results = query["vectors"]
print(results)
To learn more about inserting vectors into a vector index, or listing, querying, and deleting vectors, visit S3 vector buckets and S3 vector indexes in the Amazon S3 User Guide. Additionally, with the S3 Vectors embed command line interface (CLI), you can create vector embeddings for your data using Amazon Bedrock and store and query them in an S3 vector index using single commands. For more information, see the S3 Vectors Embed CLI GitHub repository.
Integrate S3 Vectors with other AWS services S3 Vectors integrates with other AWS services such as Amazon Bedrock, Amazon SageMaker, and Amazon OpenSearch Service to enhance your vector processing capabilities and provide comprehensive solutions for AI workloads.
Create Amazon Bedrock Knowledge Bases with S3 Vectors You can use S3 Vectors in Amazon Bedrock Knowledge Bases to simplify and reduce the cost of vector storage for RAG applications. When creating a knowledge base in the Amazon Bedrock console, you can choose the S3 vector bucket as your vector store option.
In Step 3, you can choose the Vector store creation method either to create an S3 vector bucket and vector index or choose the existing S3 vector bucket and vector index that you’ve previously created.
Using Amazon SageMaker Unified Studio You can create and manage knowledge bases with S3 Vectors in Amazon SageMaker Unified Studio when you build your generative AI applications through Amazon Bedrock. SageMaker Unified Studio is available in the next generation of Amazon SageMaker and provides a unified development environment for data and AI, including building and texting generative AI applications that use Amazon Bedrock knowledge bases.
You can choose your knowledge bases using the S3 Vectors created through Amazon Bedrock when you build generative AI applications. To learn more, visit Add a data source to your Amazon Bedrock app in the Amazon SageMaker Unified Studio User Guide.
Export S3 vector data to Amazon OpenSearch Service You can balance cost and performance by adopting a tiered strategy that stores long-term vector data cost-effectively in Amazon S3 while exporting high priority vectors to OpenSearch for real-time query performance.
This flexibility means your organizations can access OpenSearch’s high performance (high QPS, low latency) for critical, real-time applications, such as product recommendations or fraud detection, while keeping less time-sensitive data in S3 Vectors.
To export your vector index, choose Advanced search export, then choose Export to OpenSearch in the Amazon S3 console.
Then, you will be brought to the Amazon OpenSearch Service Integration console with a template for S3 vector index export to OpenSearch vector engine. Choose Export with pre-selected S3 vector source and a service access role.
It will start the steps to create a new OpenSearch Serverless collection and migrate data from your S3 vector index into an OpenSearch knn index.
Choose the Import history in the left navigation pane. You can see the new import job that was created to make a copy of vector data from your S3 vector index into the OpenSearch Serverless collection.
Now available Amazon S3 Vectors, and its integrations with Amazon Bedrock, Amazon OpenSearch Service, and Amazon SageMaker are now in preview in the US East (N. Virginia), US East (Ohio), US West (Oregon), Europe (Frankfurt), and Asia Pacific (Sydney) Regions.
Amazon S3 Metadata now provides complete visibility into all your existing objects in your Amazon Simple Storage Service (Amazon S3) buckets, expanding beyond new objects and changes. With this expanded coverage, you can analyze and query metadata for your entire S3 storage footprint.
Today, many customers rely on Amazon S3 to store unstructured data at scale. To understand what’s in a bucket, you often need to build and maintain custom systems that scan for objects, track changes, and manage metadata over time. These systems are expensive to maintain and hard to keep up to date as data grows.
Since the launch of S3 Metadata at re:Invent 2024, you’ve been able to query new and updated object metadata using metadata tables instead of relying on Amazon S3 Inventory or object-level APIs such as ListObjects, HeadObject, and GetObject—which can introduce latency and impact downstream workflows.
To make it easier for you to work with this expanded metadata, S3 Metadata introduces live inventory tables that work with familiar SQL-based tools. After your existing objects are backfilled into the system, any updates like uploads or deletions typically appear within an hour in your live inventory tables.
With S3 Metadata live inventory tables, you get a fully managed Apache Iceberg table that provides a complete and current snapshot of the objects and their metadata in your bucket, including existing objects, thanks to backfill support. These tables are refreshed automatically within an hour of changes such as uploads or deletions, so you stay up to date. You can use them to identify objects with specific properties—like unencrypted data, missing tags, or particular storage classes—and to support analytics, cost optimization, auditing, and governance.
S3 Metadata journal tables, previously known as S3 Metadata tables, are automatically enabled when you configure live inventory tables, provide a near real-time view of object-level changes in your bucket—including uploads, deletions, and metadata updates. These tables are ideal for auditing activity, tracking the lifecycle of objects, and generating event-driven insights. For example, you can use them to find out which objects were deleted in the past 24 hours, identify the requester making the most PUT operations, or monitor updates to object metadata over time.
S3 Metadata tables are created in a namespace name that is similar to your bucket name for easier discovery. The tables are stored in AWS system table buckets, grouped by account and Region. After you enable S3 Metadata for a general purpose S3 bucket, the system creates and maintains these tables for you. You don’t need to manage compaction or garbage collection processes—S3 Tables takes care of table maintenance tasks in the background.
These new tables help avoid waiting for metadata discovery before processing can begin, making them ideal for large-scale analytics and machine learning (ML) workloads. By querying metadata ahead of time, you can schedule GPU jobs more efficiently and reduce idle time in compute-intensive environments.
Let’s see how it works To see how this works in practice, I configure S3 Metadata for a general purpose bucket using the AWS Management Console.
After choosing a general purpose bucket, I choose the Metadata tab, then I choose Create metadata configuration.
For Journal table, I can choose the Server-side encryption option and the Record expiration period. For Live Inventory table, I choose Enabled and I can select the Server-side encryption options.
I configure Record expiration on the journal table. Journal table records expire after the specified number of days, 365 days (one year) in my example.
Then, I choose Create metadata configuration.
S3 Metadata creates the live inventory table and journal table. In the Live Inventory table section, I can observe the Table status: the system immediately starts to backfill the table with existing object metadata. It can take between minutes to hours. The exact time depends on the quantity of objects you have in your S3 bucket.
While waiting, I also upload and delete objects to generate data in the journal table.
Then, I navigate to Amazon Athena to start querying the new tables.
I choose Query table with Athena to start querying the table. I can choose between a couple of default queries on the console.
In Athena, I observe the structure of the tables in the AWSDataCatalogData source and I start with a short query to check how many records are available in the journal table. I already have 6,488 entries:
SELECT count(*) FROM "b_aws_news_blog_metadata_inventory_ns"."journal";
# _col0
1 6488
Here are a couple of example queries I tried on the journal table:
# Query deleted objects in last 24 hours
# Use is_delete_marker=true for versioned buckets and record_type='DELETE' otherwise
SELECT bucket, key, version_id, last_modified_date
FROM "s3tablescatalog/aws-managed-s3"."b_aws_news_blog_metadata_inventory_ns"."journal"
WHERE last_modified_date >= (current_date - interval '1' day) AND is_delete_marker = true;
# bucket key version_id last_modified_date is_delete_marker
1 aws-news-blog-metadata-inventory .build/index-build/arm64-apple-macosx/debug/index/store/v5/records/G0/NSURLSession.h-JET61D329FG0
2 aws-news-blog-metadata-inventory .build/index-build/arm64-apple-macosx/debug/index/store/v5/records/G5/cdefs.h-PJ21EUWKMWG5
3 aws-news-blog-metadata-inventory .build/index-build/arm64-apple-macosx/debug/index/store/v5/records/FX/buf.h-25EDY57V6ZXFX
4 aws-news-blog-metadata-inventory .build/index-build/arm64-apple-macosx/debug/index/store/v5/records/G6/NSMeasurementFormatter.h-3FN8J9CLVMYG6
5 aws-news-blog-metadata-inventory .build/index-build/arm64-apple-macosx/debug/index/store/v5/records/G8/NSXMLDocument.h-1UO2NUJK0OAG8
# Query recent PUT requests IP addresses
SELECT source_ip_address, count(source_ip_address)
FROM "s3tablescatalog/aws-managed-s3"."b_aws_news_blog_metadata_inventory_ns"."journal"
GROUP BY source_ip_address;
# source_ip_address _col1
1 my_laptop_IP_address 12488
# Query S3 Lifecycle expired objects in last 7 days
SELECT bucket, key, version_id, last_modified_date, record_timestamp
FROM "s3tablescatalog/aws-managed-s3"."b_aws_news_blog_metadata_inventory_ns"."journal"
WHERE requester = 's3.amazonaws.com' AND record_type = 'DELETE' AND record_timestamp > (current_date - interval '7' day);
(not applicable to my demo bucket)
The results helped me track the specific objects that were removed, including their timestamps.
Now, I look at the live inventory table:
# Distribution of object tags
SELECT object_tags, count(object_tags)
FROM "s3tablescatalog/aws-managed-s3"."b_aws_news_blog_metadata_inventory_ns"."inventory"
GROUP BY object_tags;
# object_tags _col1
1 {Source=Swift} 1
2 {Source=swift} 1
3 {} 12486
# Query storage class and size for specific tags
SELECT storage_class, count(*) as count, sum(size) / 1024 / 1024 as usage
FROM "s3tablescatalog/aws-managed-s3"."b_aws_news_blog_metadata_inventory_ns"."inventory"
GROUP BY object_tags['pii=true'], storage_class;
# storage_class count usage
1 STANDARD 124884 165
# Find objects with specific user defined metadata
SELECT key, last_modified_date, user_metadata
FROM "s3tablescatalog/aws-managed-s3"."b_aws_news_blog_metadata_inventory_ns"."inventory"
WHERE cardinality(user_metadata) > 0 ORDER BY last_modified_date DESC;
(not applicable to my demo bucket)
Pricing and availability S3 Metadata live inventory and journal tables are available today in US East (Ohio, N. Virginia) and US West (N. California).
The journal tables are charged $0.30 per million updates. This is a 33 percent drop from our previous price.
For inventory tables, there’s a one-time backfill cost of $0.30 for a million objects to set up the table and generate metadata for existing objects. There are no additional costs if your bucket has less than one billion objects. For buckets with more than a billion objects, there is a monthly fee of $0.10 per million objects per month.
With S3 Metadata live inventory and journal tables, you can reduce the time and effort required to explore and manage large datasets. You get an up-to-date view of your storage and a record of changes, and both are available as Iceberg tables you can query on demand. You can discover data faster, power compliance workflows, and optimize your ML pipelines.
You can get started by enabling metadata inventory on your S3 bucket through the AWS console, AWS Command Line Interface (AWS CLI), or AWS SDKs. When they’re enabled, the journal and live inventory tables are automatically created and updated. To learn more, visit the S3 Metadata Documentation page.
Earlier this year, we preannounced that TwelveLabs video understanding models were coming to Amazon Bedrock. Today, we’re announcing the models are now available for searching through videos, classifying scenes, summarizing, and extracting insights with precision and reliability.
TwelveLabs has introduced Marengo, a video embedding model proficient at performing tasks such as search and classification, and Pegasus, a video language model that can generate text based on video data. These models are trained on Amazon SageMaker HyperPod to deliver groundbreaking video analysis that provides text summaries, metadata generation, and creative optimization.
With the TwelveLabs models in Amazon Bedrock, you can find specific moments using natural language video search capabilities like “show me the first touchdown of the game” or “find the scene where the main characters first meet” and instantly jump to those exact moments. You can also build applications to understand video content by generating descriptive text such as titles, topics, hashtags, summaries, chapters, or highlights for discovering insights and connections without requiring predefined labels or categories.
For example, you can find recurring themes in customer feedback or spot product usage patterns that weren’t obvious before. Whether you have hundreds or thousands of hours of video content, you can now transform that entire library into a searchable knowledge resource while maintaining enterprise-grade security and performance.
Let’s take a look at the Marengo and Pegasus videos that TwelveLabs has published.
You can transform video workflows with these models across industries. Media producers and editors can instantly locate specific scenes or dialogue, which means you can focus on storytelling rather than sifting through hours of footage. Marketing teams are streamlining their advertising workflows by quickly personalizing content to resonate with various audiences, while security teams are using the technology to proactively identify potential risks by spotting patterns across multiple video feeds.
Getting started with TwelveLabs models in Amazon Bedrock Before getting started, if you’re new to using TwelveLabs models, go to the Amazon Bedrock console and choose Model access in the bottom left navigation pane. To access the latest TwelveLabs models, request access for Marengo Embed 2.7 and Pegasus 1.2 in TwelveLabs.
To use TwelveLabs models in Amazon Bedrock, choose Chat/Text Playground under Test in the left navigation pane. Choose Select model, select TwelveLabs as the category and Pegasus as the model, and then choose Apply.
For searching or generating text from your video, you should upload your video to an Amazon Simple Storage Service (Amazon S3) bucket or input Base64-formatted video string.
I will use a sample video generated with Amazon Nova Reel with a prompt: “A cute raccoon playing guitar underwater.”
Enter the S3 URI of your uploaded video and the S3 Bucket Owner, and then run your prompt: “Tell me about the video by timeline”.
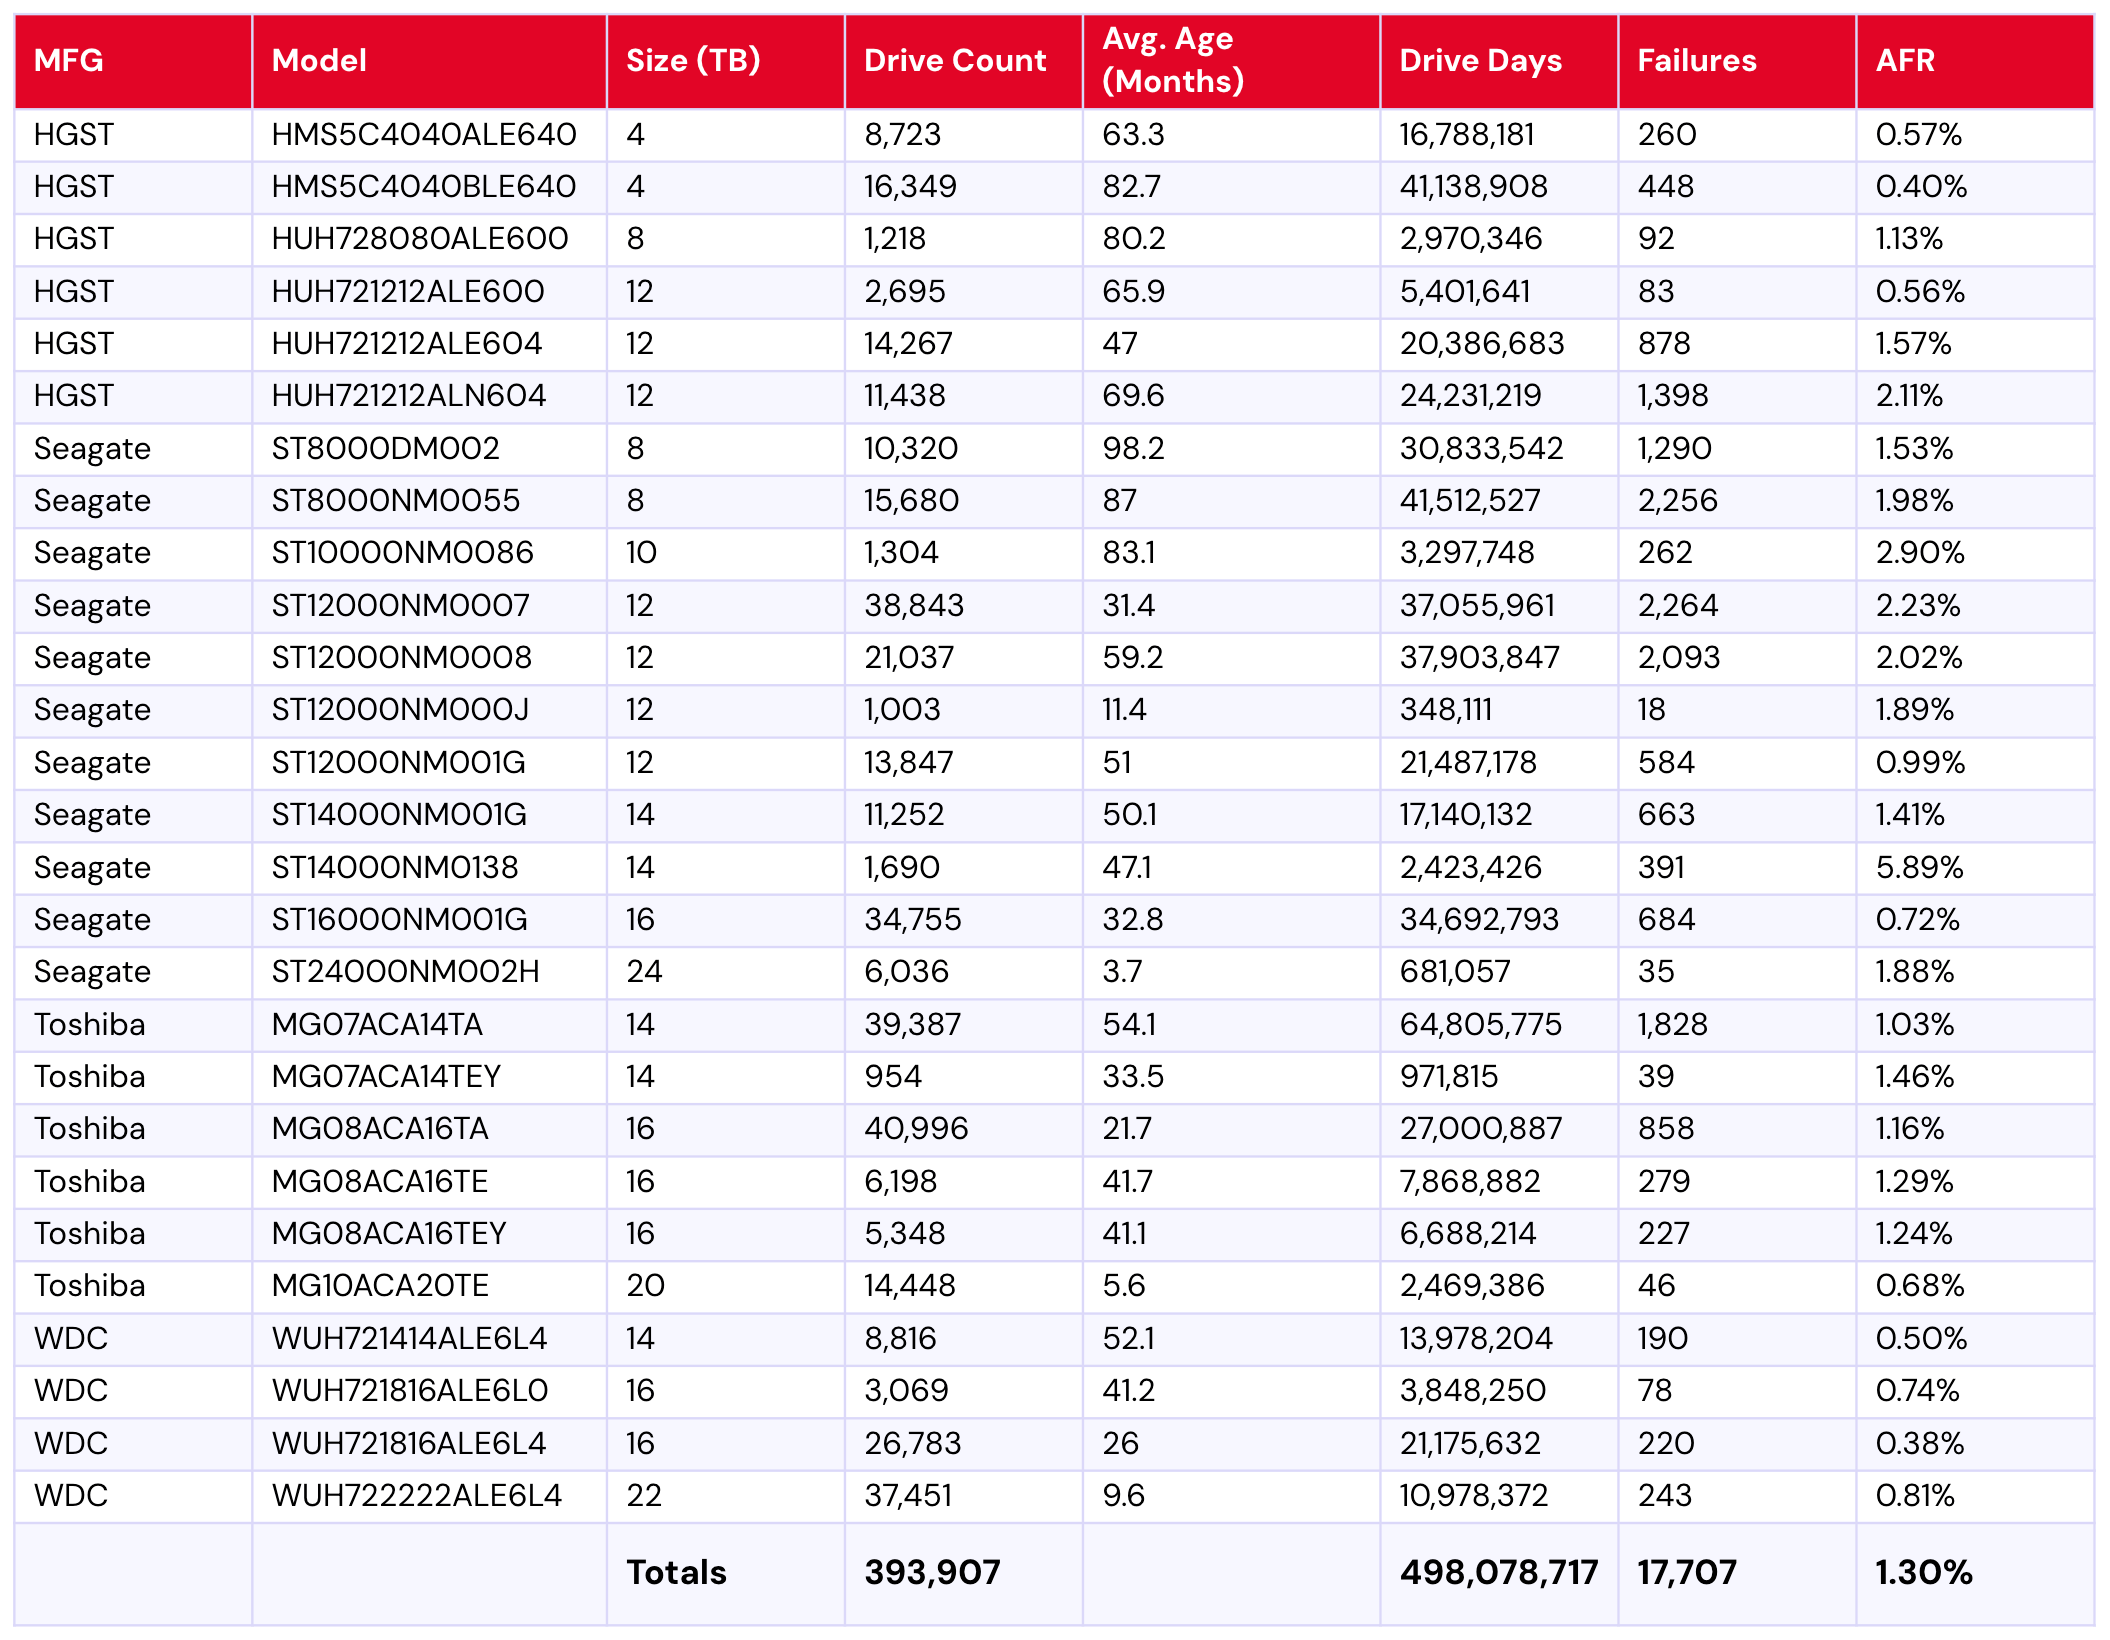
You can get following model response:
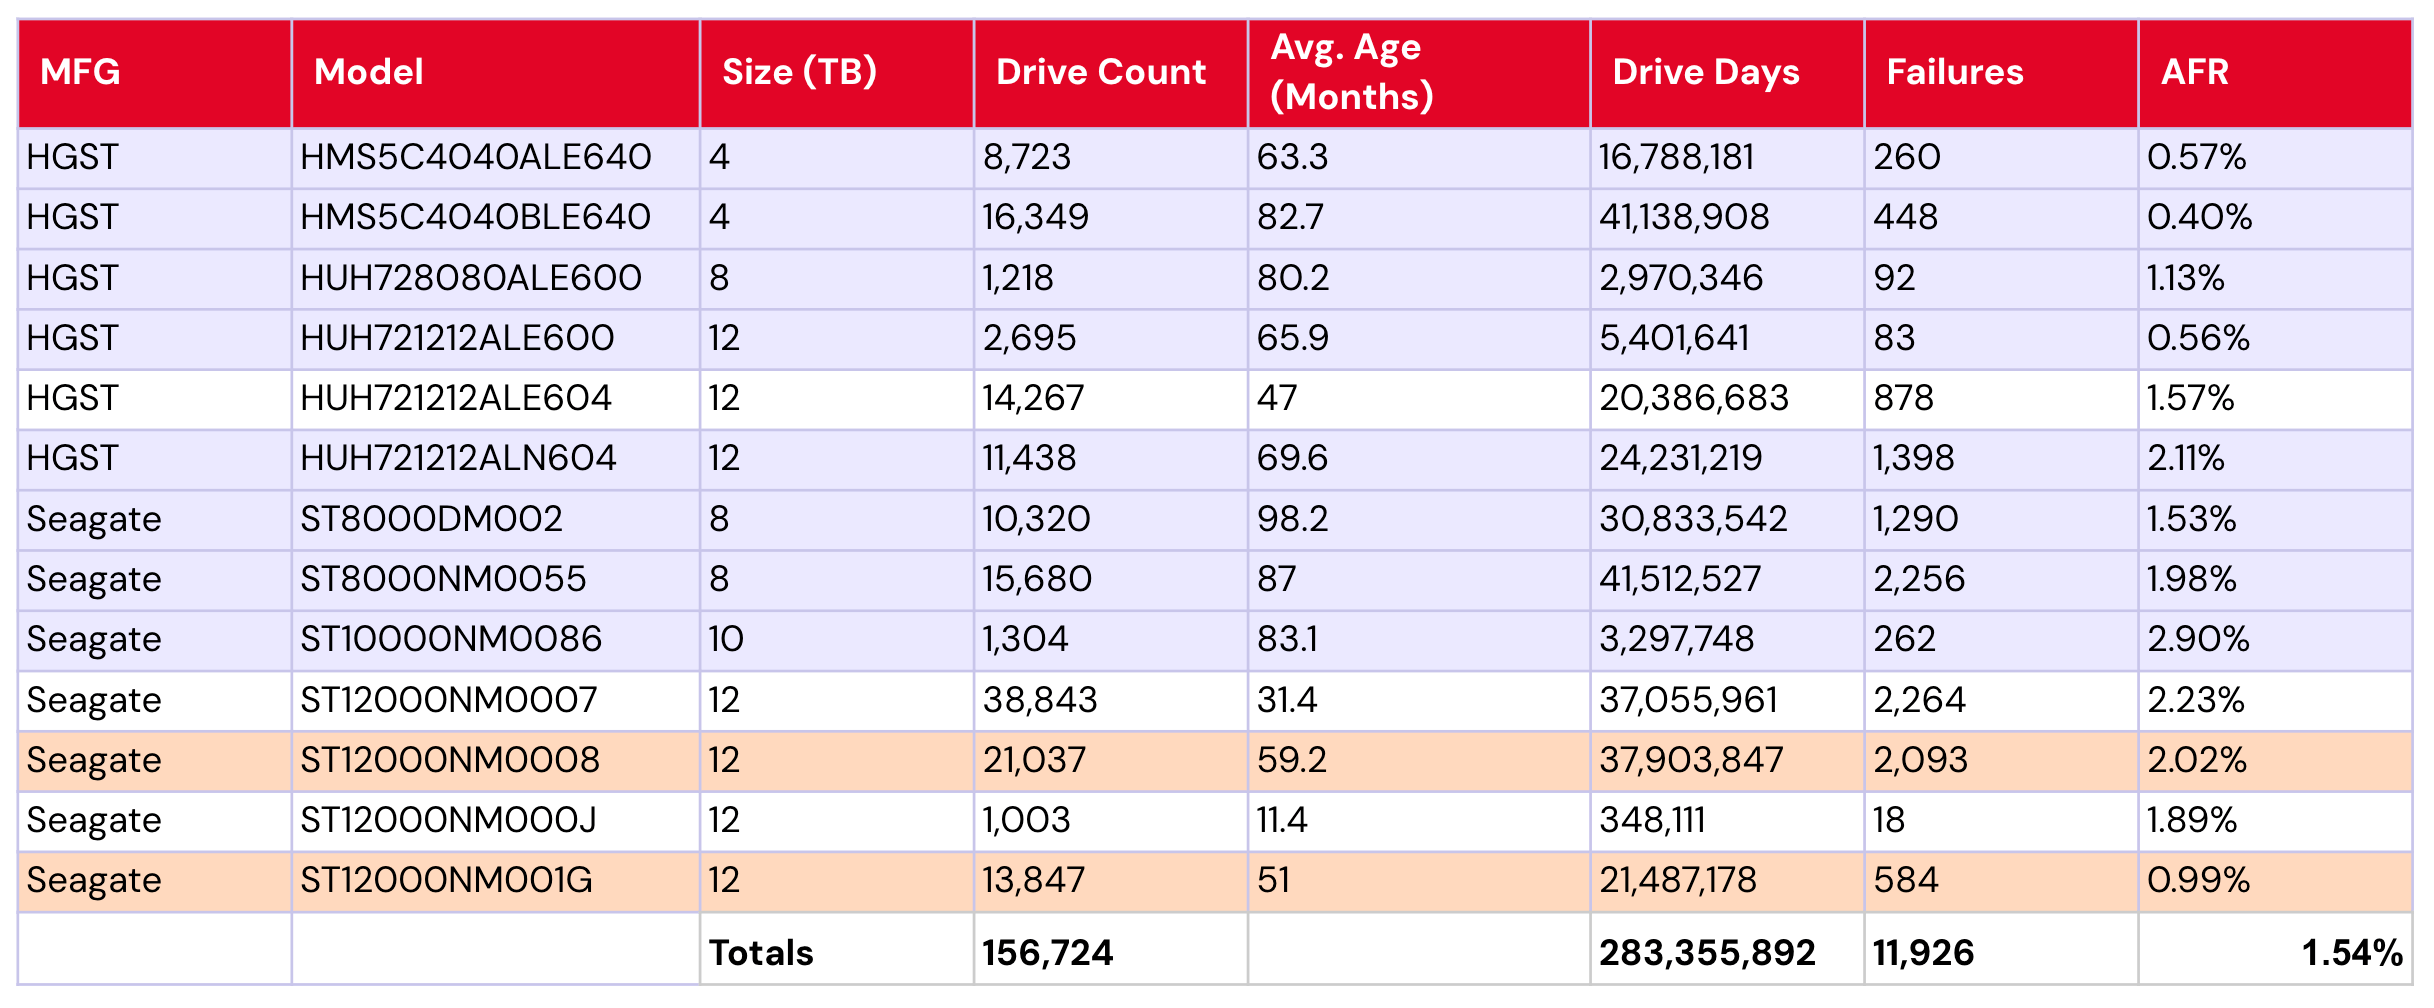
The video opens with an underwater scene featuring a sandy seabed and swaying seaweed, creating a serene atmosphere. At around 5 seconds, a raccoon appears, swimming towards the camera with a curious expression. By 10 seconds, the raccoon is seen swimming near the seabed. The focus then shifts to a group of koi fish swimming gracefully near the seabed from 11 to 13 seconds.
At 14 seconds, the scene transitions to an ukulele resting on the seabed, with the camera zooming in to highlight its details. The raccoon reappears at 20 seconds, swimming among the koi fish, and by 23 seconds, it begins to play the ukulele. The raccoon continues to play the ukulele from 29 to 41 seconds, with the koi fish swimming around it, adding a lively and colorful touch to the underwater setting.
From 42 to 49 seconds, the raccoon is shown playing the ukulele with the koi fish swimming around it. The video concludes with a screen displaying "Video generated with Amazon Novo Reel 1.1" and "Available in Amazon Bedrock" from 50 to 54 seconds, followed by the AWS logo from 55 to 57 seconds.
The TwelveLabs models can be easily integrated into your applications using the Amazon Bedrock Converse API, which provides a unified interface for conversational AI interactions.
import boto3
import json
import os
AWS_REGION = "us-east-1"
MODEL_ID = "twelvelabs.pegasus-1-2-v1:0"
VIDEO_PATH = "sample.mp4"
def read_file(file_path: str) -> bytes:
"""Read a file in binary mode."""
try:
with open(file_path, 'rb') as file:
return file.read()
except Exception as e:
raise Exception(f"Error reading file {file_path}: {str(e)}")
bedrock_runtime = boto3.client(
service_name="bedrock-runtime",
region_name=AWS_REGION
)
request_body = {
"messages": [
{
"role": "user",
"content": [
{
"inputPrompt": "tell me about the video",
"mediaSource: {
"base64String": read_file(VIDEO_PATH)
}
},
],
}
]
}
response = bedrock_runtime.converse(
modelId=MODEL_ID,
messages=request_body["messages"]
)
print(response["output"]["message"]["content"][-1]["text"])
The TwelveLabs Marengo Embed 2.7 model generates vector embeddings from video, text, audio, or image inputs. These embeddings can be used for similarity search, clustering, and other machine learning (ML) tasks. The model supports asynchronous inference through the Bedrock AsyncInvokeModel API.
For video source, you can request JSON format for the TwelveLabs Marengo Embed 2.7 model using the AsyncInvokeModel API.
Now available TwelveLabs models are generally available today in Amazon Bedrock: the Marengo model in the US East (N. Virginia), Europe (Ireland), and Asia Pacific (Seoul) Region, and the Pegasus model in US West (Oregon), and Europe (Ireland) Region accessible with cross-Region inference from US and Europe Regions. Check the full Region list for future updates. To learn more, visit the TwelveLabs in Amazon Bedrock product page and the Amazon Bedrock pricing page.
To provide the best experiences, we use technologies like cookies to store and/or access device information. Consenting to these technologies will allow us to process data such as browsing behavior or unique IDs on this site. Not consenting or withdrawing consent, may adversely affect certain features and functions.
Functional
Always active
The technical storage or access is strictly necessary for the legitimate purpose of enabling the use of a specific service explicitly requested by the subscriber or user, or for the sole purpose of carrying out the transmission of a communication over an electronic communications network.
Preferences
The technical storage or access is necessary for the legitimate purpose of storing preferences that are not requested by the subscriber or user.
Statistics
The technical storage or access that is used exclusively for statistical purposes.The technical storage or access that is used exclusively for anonymous statistical purposes. Without a subpoena, voluntary compliance on the part of your Internet Service Provider, or additional records from a third party, information stored or retrieved for this purpose alone cannot usually be used to identify you.
Marketing
The technical storage or access is required to create user profiles to send advertising, or to track the user on a website or across several websites for similar marketing purposes.