OpenSnitch is an
“interactive application firewall“. Like other firewalls, it uses a
series of rules to decide what network traffic should be permitted. Unlike
many other firewalls, though, OpenSnitch does not ask the user to create a list of rules
ahead of time. Instead, the list of rules can be built up
incrementally as applications make connections — and the user can peruse both
the rules that have built up over time, and statistics on the connections that
have been attempted.
Apache OFBiz below 18.12.16 is vulnerable to unauthenticated remote code execution on Linux and Windows. An attacker with no valid credentials can exploit missing view authorization checks in the web application to execute arbitrary code on the server. Exploitation is facilitated by bypassing previous patches for CVE-2024-32113, CVE-2024-36104, and CVE-2024-38856; this patch bypass vulnerability is tracked as CVE-2024-45195.
Product Description
Apache OFBiz is an open-source web-based enterprise resource planning and customer relationship management suite. The software has features for accounting, catalog and supply chain management, storing payment information, and more. Apache OFBiz is used by numerous large organizations, and previously disclosed vulnerabilities for it have seen exploitation in the wild.
Credit
This issue was reported to the Apache OFBiz team by Ryan Emmons, Lead Security Researcher at Rapid7, as well as by several other researchers. The vulnerability is being disclosed in accordance with Rapid7’s vulnerability disclosure policy. Rapid7 is grateful to the Apache OFBiz open-source community developers for their assistance and collaboration on this issue.
Vulnerability Context
A handful of unauthenticated code execution CVEs for Apache OFBiz have been published in 2024. In August, the Cybersecurity and Infrastructure Security Agency added one of them, CVE-2024-32113, to its Known Exploited Vulnerabilities catalog. Based on our analysis, three of these vulnerabilities are, essentially, the same vulnerability with the same root cause. Since the patch bypass we are disclosing today elaborates on those previous disclosures, we’ll outline them now.
CVE-2024-32113
The first vulnerability in this sequence, CVE-2024-32113, was published on May 8, 2024, and it affected installs before v18.12.13. The OFBiz CVE entry describes this vulnerability as a path traversal vulnerability (CWE-22). When unexpected URI patterns are sent to the application, the state of the application’s current controller and view map is fragmented; controller-view map fragmentation takes place because the application uses multiple different methods of parsing the current URI: one to get the controller, one to get the view map.
As a result, an attacker can confuse the implemented logic to fetch and interact with an authenticated view map via an unauthenticated controller. When this happens, only the controller authorization checks will be performed, which the attacker can use to access admin-only view maps that do things like execute SQL queries or code.
An authenticated administrator view map called “ProgramExport” will execute Groovy scripts, and this view map can be leveraged to execute arbitrary code without authentication. An example payload for this vulnerability, which uses path traversal to fragment the controller-view map state, is shown below.
The OFBiz Jira issue for the vulnerability has the description “Some URLs need to be rejected before they create problems”, which is how a fix was implemented. The remediation changes included code that attempted to normalize URLs before resolving the controller and the view map being fetched. That patch was released as v18.12.13.
CVE-2024-36104
The second CVE entry in this sequence, CVE-2024-36104 was published on June 4, 2024. The vulnerability was again described as a path traversal, and the OFBiz Jira issue description is “Better avoid special encoded characters sequences”. Though the patch is made up of multiple commits, the bulk of the remediation was implemented in bc856f46f8, with the following code added to remove semicolons and URL-encoded periods from the URI.
                    String uRIFiltered = new URI(initialURI)
                            .normalize().toString()
                            .replaceAll(";", "")
                            .replaceAll("(?i)%2e", "");
                    if (!initialURI.equals(uRIFiltered)) {
                        Debug.logError("For security reason this URL is not accepted", MODULE);
                        throw new RuntimeException("For security reason this URL is not accepted");
This CVE was patched in v18.12.14.
Two different example payloads for this vulnerability are shown below, one for each of the sequences stripped by the implemented fix. Both of these payloads also work against OFBiz installations affected by the previous CVE-2024-32113, since the vulnerability has the same root cause.
The third vulnerability in this sequence, CVE-2024-38856, was published on August 5, 2024. This time, the vulnerability was described as an incorrect authorization issue. The CVE’s description states “Unauthenticated endpoints could allow execution of screen rendering code of screens if some preconditions are met (such as when the screen definitions don’t explicitly check user’s permissions because they rely on the configuration of their endpoints).” This more accurately describes the issue. As we’ll see in a moment, it also indicates the approach taken for the fix this time.
SonicWall’s research team, who reported the vulnerability to the OFBiz team, published an excellent blog post that nicely explains the root cause and focuses on the controller-view map state fragmentation, rather than just the method used to trigger it. Amazingly, their blog post reports that a traversal or semicolon sequence was never needed at all! A request to a path like /webtools/control/forgotPassword/ProgramExport would result in the controller being set to “forgotPassword” and the view map being set to “ProgramExport”.
An example payload for this vulnerability is shown below.
This payload also works for systems affected by CVE-2024-32113 and CVE-2024-36104, since the root cause is the same for all three.
The OFBiz Jira issue for this vulnerability is titled “Add permission check for ProgramExport and EntitySQLProcessor”. That’s exactly what the fix does; the fix adds a permission check for ProgramExport and EntitySQLProcessor, two view maps targeted by previous exploits. The three lines below were added to both Groovy files associated with those view maps, effectively preventing access to them without authentication.
if (!security.hasPermission('ENTITY_MAINT', userLogin)) {
    return
}
As a result, both exploit techniques were no longer viable. However, the underlying problem, the ability to fragment the controller-view map state, was not resolved by the v18.12.15 patch.
Exploitation
To recap, all three of the previous vulnerabilities were caused by the same shared underlying issue, the ability to desynchronize the controller and view map state. That flaw was not fully addressed by any of the patches. At the time of our research, the requestUri and overrideViewUri variables could still be desynchronized in the manner described in the SonicWall blog post, albeit not to reach ProgramExport or EntitySQLProcessor. Our testing target was v18.12.15, the latest version available at the time of research.
The framework/webtools/widget/EntityScreens.xml file defines some EntityScreens that might be leveraged by an attacker.
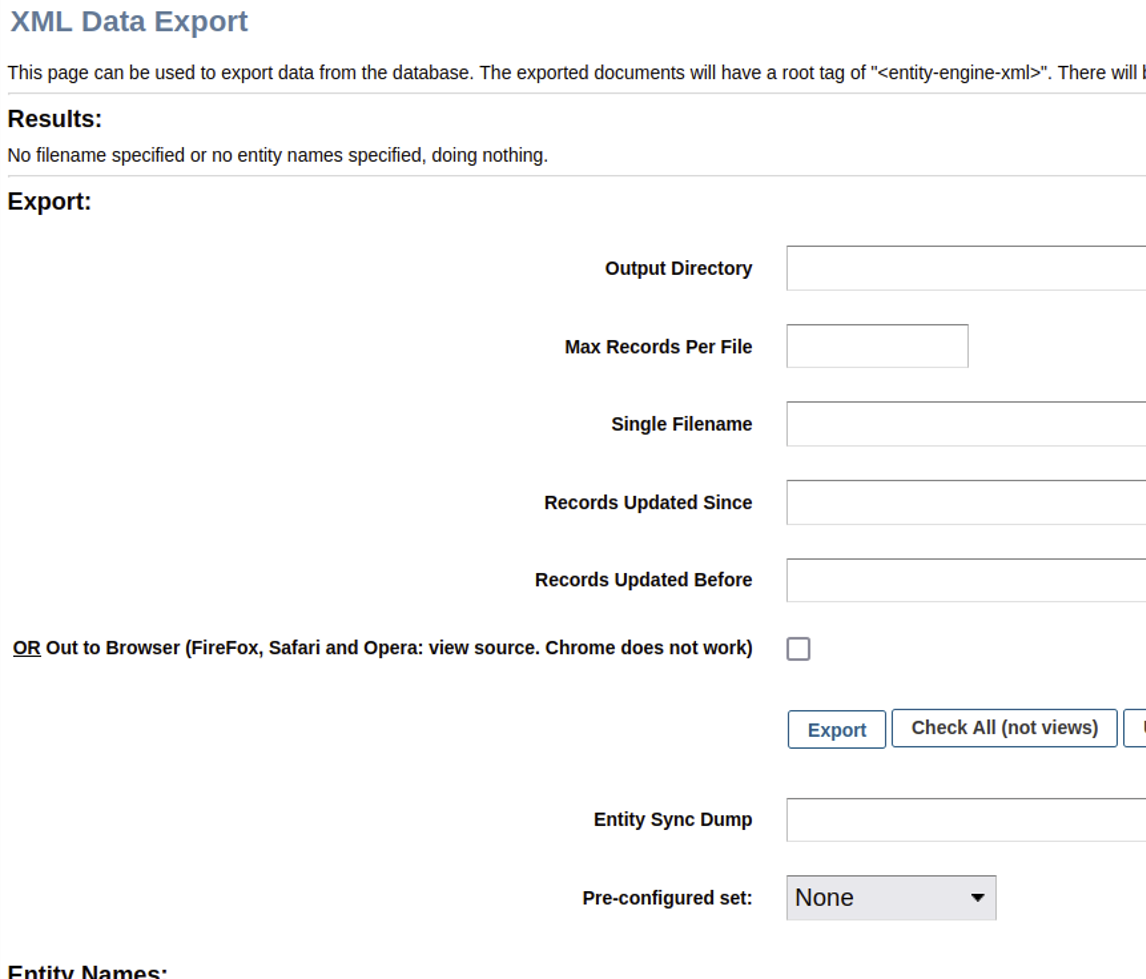
We can’t useProgramExport or EntitySQLProcessor this time, since authorization checks are now enforced. However, an attacker can leverage another view to exploit the application without authentication. A screenshot of the XML Data Export admin dashboard feature for one possible Groovy view screen option, XmlDsDump, is below.
As shown above, the XmlDsDump view can be used to query the database for virtually any stored data and write the resulting data to an arbitrarily named file anywhere on disk. Notably, the affiliated Groovy script XmlDsDump.groovy does not enforce authorization checks.
As a proof of concept, we’ll try to desynchronize the controller-view map state to access the “dump” view without authentication. The following cURL request will attempt to dump all usernames, passwords, and credit card numbers stored by Apache OFBiz into a web-accessible directory.
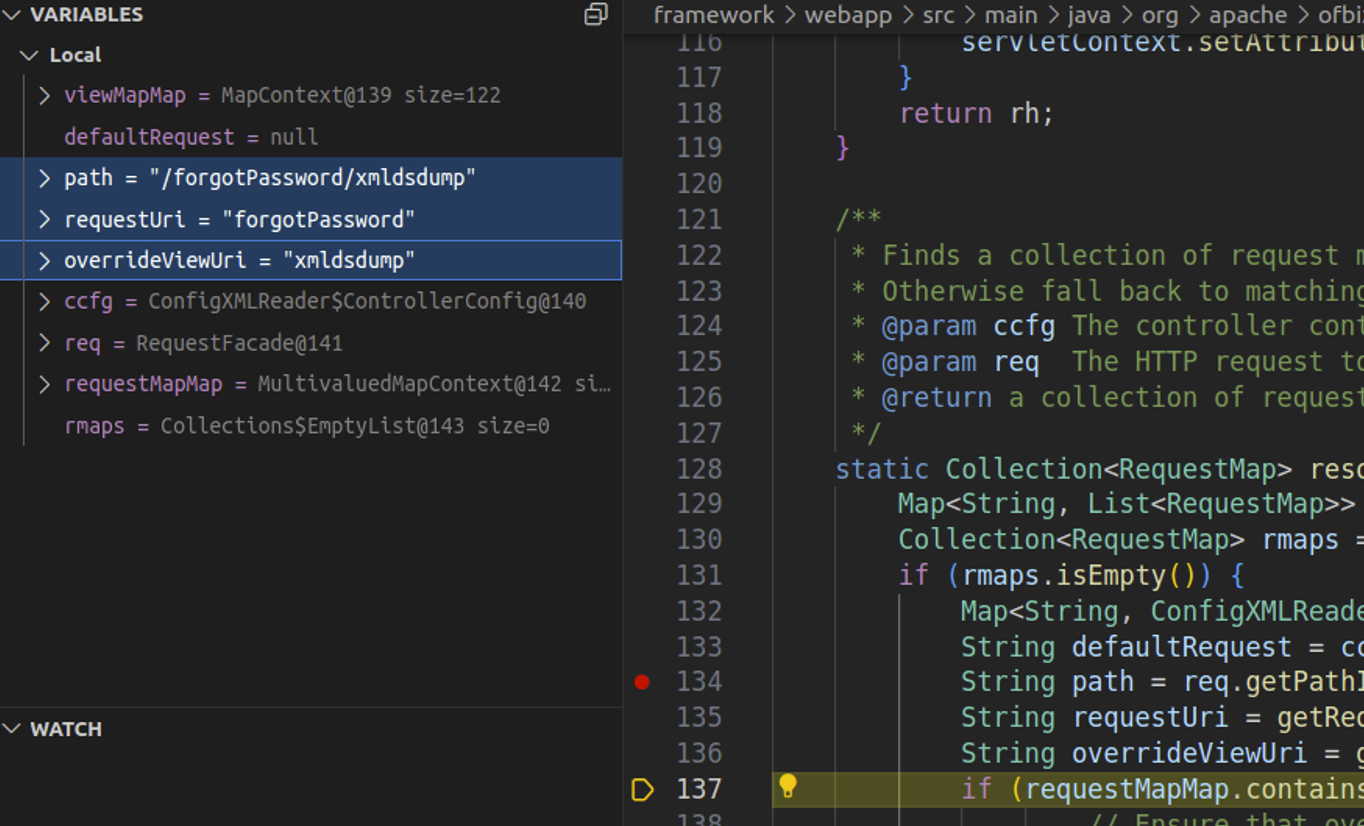
Watching the request in a debugger confirms that the requestUri and overrideViewUri value confusion is still possible in RequestHandler.java. This is depicted in the screenshot below, where our cURL request has resulted in requestUri being set to the unauthenticated endpoint and overrideViewUri being set to the authenticated view.
After the request completes, a second unauthenticated cURL request confirms that the operation completed successfully.
The password hashes and credit card numbers have been written to an accessible file in the web root, demonstrating exploitation via patch bypass. It’s likely that cracking a user password hash would succeed in a real-world attack, since the password hashing algorithm is a weak one. However, to avoid having to crack any hashes, we also leveraged the vulnerability to achieve remote code execution.
Within controller.xml, a view map called viewdatafile is defined at [0].
That script is below. It checks for various request parameters (starting at [2]) to perform file operations. At [3], if DATAFILE_SAVE is present and a datafile was parsed, the datafile contents will be written to the disk location specified by DATAFILE_SAVE.
Apache OFBiz also ships with some example data files in datafiles.adoc. An excerpt of that text is included below.
[..SNIP..]
== Examples

=== Sample fixed width CSV file posreport.csv to be imported:
.An example of fixed width flat file import.
[source,csv]

021196033702    ,5031BB GLITTER GLUE PENS BRIGH  ,1           ,5031BB      ,       1,     299,
021196043121    ,BB4312 WONDERFOAM ASSORTED      ,1           ,BB4312      ,       1,     280,
021196055025    ,9905BB  PLUMAGE MULTICOLOURED   ,1           ,9905BB      ,       4,     396,

=== Sample xml definition file for importing select columns
.Sample xml definition file for importing select columns posschema.xml:
[source,xml]
    <data-files xsi:noNamespaceSchemaLocation="http://ofbiz.apache.org/dtds/datafiles.xsd" xmlns:xsi="http://www.w3.org/2001/XMLSchema-instance">
        <data-file name="posreport" separator-style="fixed-length" type-code="text">
            <record name="tillentry" limit="many">
                <field name="tillCode" type="String" length="16" position="0"></field>
                <field name="name" type="String" length="32" position="17"></field>
                <field name="prodCode" type="String" length="12" position="63"></field>
                <field name="quantity" type="String" length="8" position="76"></field>
                <field name="totalPrice" type="String" length="8" position="85"></field>
            </record>
        </data-file>
    </data-files>

.Another example reading fixed record little endian binary files
[source, xml]
    <data-files xsi:noNamespaceSchemaLocation="http://ofbiz.apache.org/dtds/datafiles.xsd" xmlns:xsi="http://www.w3.org/2001/XMLSchema-instance">
        <data-file name="stockdata" separator-style="fixed-record" type-code="text" record-length="768">
            <record name="stockdataitem" limit="many">
                <field name="barcode" type="NullTerminatedString" length="12" position="0"></field>
                <field name="prodCode" type="NullTerminatedString" length="12" position="68"></field>
                <field name="price" type="LEInteger" length="4" position="80"></field>
                <field name="name" type="NullTerminatedString" length="30" position="16"></field>
            </record>
        </data-file>
    </data-files>

=== Procedure:
In the interface enter something like:

. Definition Filename or URL: posschema.xml
. Data File Definition Name: posreport
. Data Filename or URL: posreport.csv
This information is very helpful for contextualizing what we learned from the Groovy script. We’ll need to provide an XML definition file location, a data file XML definition name, a CSV data file location, and a file path to save the extracted data from the CSV. We’ll also need to specify that both our definition file location and CSV location are remote URLs, which we can do via the DEFINITION_IS_URL and DATAFILE_IS_URL parameters.
Below is our malicious definition file, rceschema.xml. We define a “jsp” String field within a record in the datafile. In the XML, this represents our JSP web shell that will be written to the web root.
Next, we’ll need a CSV containing a single line with a single value, our JSP web shell. This value is 605 characters long, as indicated in our XML definition. Since we’re injecting our payload into a CSV context, we’ll build a string in the JSP to avoid any commas, and we’ll delimit the payload with a comma.
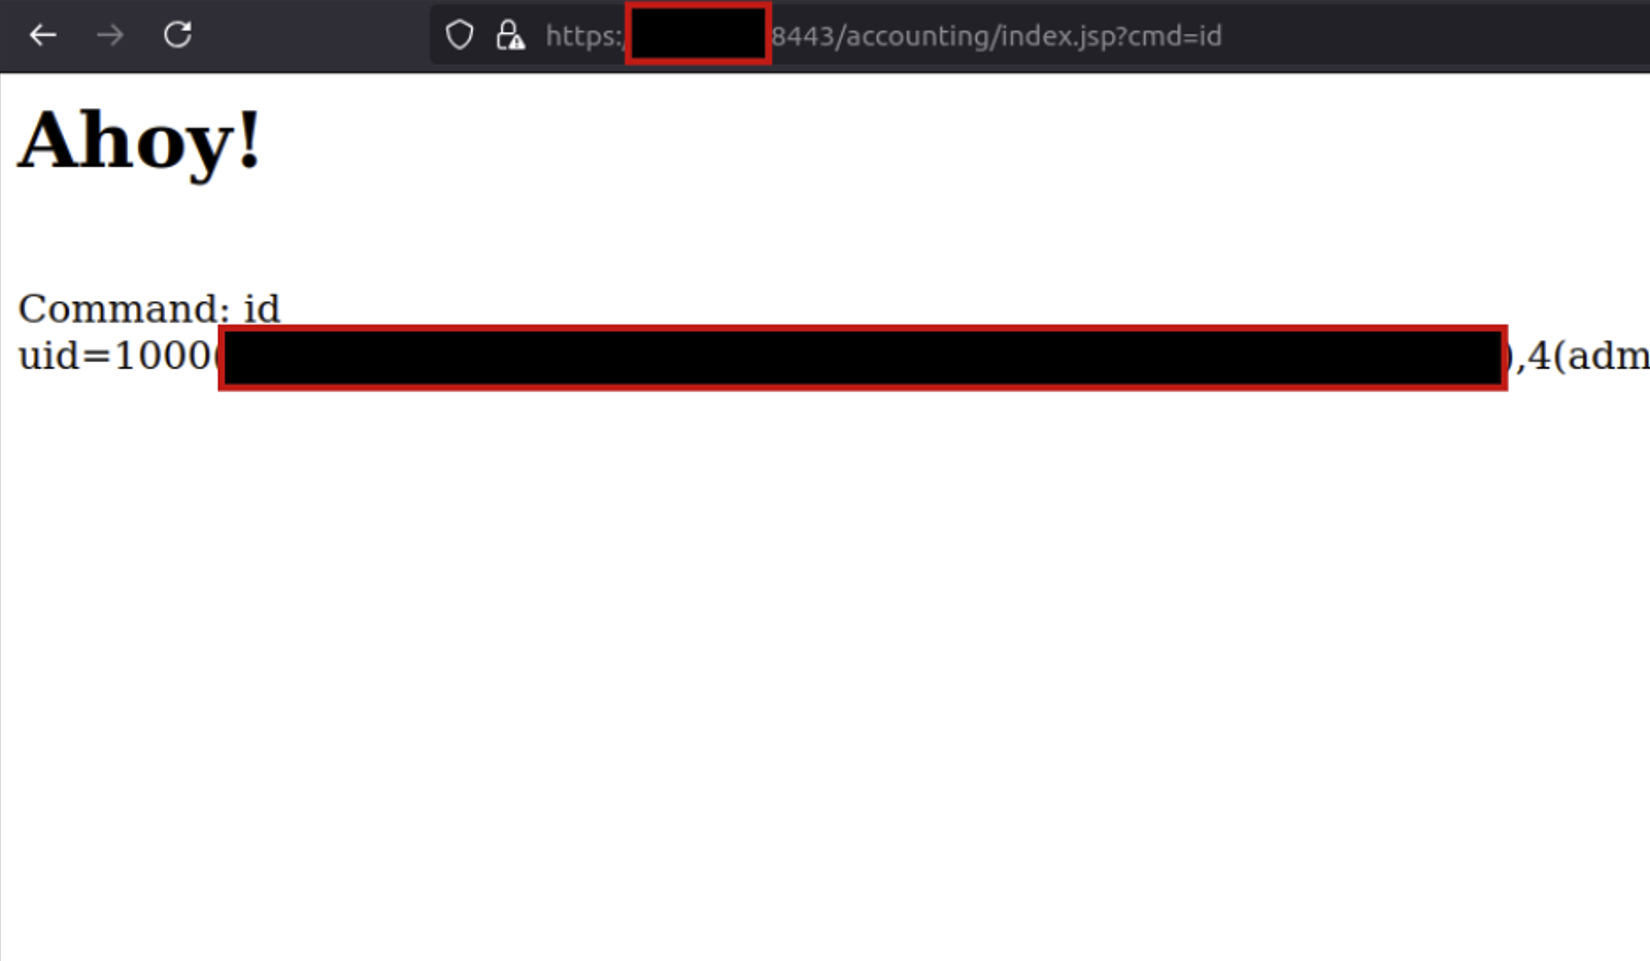
After the server fetches and processes our two files, browsing the targeted accounting/index.jsp path confirms that we’ve established unauthenticated remote code execution.
Remediation
We’d like to thank the Apache OFBiz team, who quickly responded to our disclosure and patched the vulnerability in v18.12.16. In this patch, authorization checks were implemented for the view. This change validates that a view should permit anonymous access if a user is unauthenticated, rather than performing authorization checks purely based on the target controller. OFBiz users should update to the fixed version as soon as possible.
Rapid7 Customers
InsightVM and Nexpose customers will be able to assess their exposure to CVE-2024-32113, CVE-2024-36104, CVE-2024-38856, and CVE-2024-45195 with vulnerability checks expected to be available in today’s (Thursday, September 5) content release.
Disclosure Timeline
August 16, 2024: Rapid7 contacts the Apache OFBiz security team via email.
August 17, 2024: Apache OFBiz community developer acknowledges report.
August 20, 2024: Apache OFBiz community developer indicates that the team has a solution.
August 22, 2024: CVE-2024-45195 reserved by Apache community dev team.
August 24, 2024: Patch sent to Rapid7 for testing.
August 28, 2024: Rapid7 confirms the patch is sufficient to prevent this vector of exploitation.
August 29, 2024: Apache OFBiz developer indicates patch ETA is early September 2024.
September 4, 2024: Apache OFBiz advisory published for CVE-2024-45195 (and other vulnerabilities).
Version 4.21.0 of the Samba Windows interoperability suite has been
released. Changes include some authentication hardening, a number of LDAP
improvements, per-user and per-group veto and hide files, group-managed
service accounts, and quite a bit more.
Amazon Q Developer is a generative artificial intelligence (AI) powered conversational assistant that can help you understand, build, extend, and operate AWS applications. You can ask questions about AWS architecture, your AWS resources, best practices, documentation, support, and more.
With Amazon Q Developer in your IDE, you can write a comment in natural language that outlines a specific task, such as, “Upload a file with server-side encryption.” Based on this information, Amazon Q Developer recommends one or more code snippets directly in the IDE that can accomplish the task. You can quickly and easily accept the top suggestions (tab key), view more suggestions (arrow keys), or continue writing your own code.
However, Amazon Q Developer in the IDE is more than just a code completion plugin. Amazon Q Developer is a generative AI (GenAI) powered assistant for software development that can be used to have a conversation about your code, get code suggestions, or ask questions about building software. This provides the benefits of collaborative paired programming, powered by GenAI models that have been trained on billions of lines of code, from the Amazon internal code-base and publicly available sources.
The challenge
At the 2024 AWS Summit in Sydney, an exhilarating code challenge took center stage, pitting a Blue Team against a Red Team, with approximately 10 to 15 challengers in each team, in a battle of coding prowess. The challenge consisted of 20 tasks, starting with basic math and string manipulation, and progressively escalating in difficulty to include complex algorithms and intricate ciphers.
The Blue Team had a distinct advantage, leveraging the powerful capabilities of Amazon Q Developer, the most capable generative AI-powered assistant for software development. With Q Developer’s guidance, the Blue Team navigated increasingly complex tasks with ease, tapping into Q Developer’s vast knowledge base and problem-solving abilities. In contrast, the Red Team competed without assistance, relying solely on their own coding expertise and problem-solving skills to tackle daunting challenges.
As the competition unfolded, the two teams battled it out, each striving to outperform the other. The Blue Team’s efficient use of Amazon Q Developer proved to be a game-changer, allowing them to tackle the most challenging tasks with remarkable speed and accuracy. However, the Red Team’s sheer determination and technical prowess kept them in the running, showcasing their ability to think outside the box and devise innovative solutions.
The culmination of the code challenge was a thrilling finale, with both teams pushing the boundaries of their skills and ultimately leaving the audience in a state of admiration for their remarkable achievements.
The graph shows the average completion time in which Team Blue “Q Developer” completed more questions across the board in less time than Team Red “Solo Coder”. Within the 1-hour time limit, Team Blue got all the way to Question 19, whereas Team Red only got to Question 16.
There are some assumptions and validations. People who consider themselves very experienced programmers were encouraged to choose team Red and not use AI, to test themselves against team Blue, those using AI. The code challenges were designed to test the output of applying logic. They were specifically designed to be passable without the use of Amazon Q Developer, to test the optimization of writing logical code with Amazon Q Developer. As a result, the code tasks worked well with Amazon Q Developer due to the nature of and underlying training of Amazon Q Developer models. Many people who attended the event were not Python Programmers (we constrained the challenge to Python only), and walked away impressed at how much of the challenge they could complete.
As an example of one of the more complex questions competitors were given to solve was:
Implement the rail fence cipher.
In the Rail Fence cipher, the message is written downwards on successive "rails" of an imaginary fence, then moving up when we get to the bottom (like a zig-zag). Finally the message is then read off in rows.

For example, using three "rails" and the message "WE ARE DISCOVERED FLEE AT ONCE", the cipherer writes out:

W . . . E . . . C . . . R . . . L . . . T . . . E
. E . R . D . S . O . E . E . F . E . A . O . C .
. . A . . . I . . . V . . . D . . . E . . . N . .

Then reads off: WECRLTEERDSOEEFEAOCAIVDEN

Given variable a. Use a three-rail fence cipher so that result is equal to the decoded message of variable a.
The questions were both algorithmic and logical in nature, which made them great for testing conversational natural language capability to solve questions using Amazon Q Developer, or by applying one’s own logic to write code to solve the question.
Top scoring individual per team:
Total Questions Complete
individual time (min)
With Q Developer (Blue Team)
19
30.46
Solo Coder (Red Team)
16
58.06
By comparing the top two competitors, and considering the solo coder was a highly experienced programmer versus the top Q Developer coder, who was a relatively new programmer not familiar with Python, you can see the efficiency gain when using Q Developer as an AI peer programmer. It took the entire 60 minutes for the solo coder to complete 16 questions, whereas the Q Developer coder got to the final question (Question 20, incomplete) in half of the time.
Summary
Integrating advanced IDE features and adopting paired programming have significantly improved coding efficiency and quality. However, the introduction of Amazon Q Developer has taken this evolution to new heights. By tapping into Q Developer’s vast knowledge base and problem-solving capabilities, the Blue Team was able to navigate complex coding challenges with remarkable speed and accuracy, outperforming the unassisted Red Team. This highlights the transformative impact of leveraging generative AI as a collaborative pair programmer in modern software development, delivering greater efficiency, problem-solving, and, ultimately, higher-quality code. Get started with Amazon Q Developer for your IDE by installing the plugin and enabling your builder ID today.
Two years ago, we announced Experience AI, a collaboration between the Raspberry Pi Foundation and Google DeepMind to inspire the next generation of AI leaders.
Today I am excited to announce that we are expanding the programme with the aim of reaching more than 2 million students over the next 3 years, thanks to a generous grant of $10m from Google.org.
Why do kids need to learn about AI
AI technologies are already changing the world and we are told that their potential impact is unprecedented in human history. But just like every other wave of technological innovation, along with all of the opportunities, the AI revolution has the potential to leave people behind, to exacerbate divisions, and to make more problems than it solves.
Part of the answer to this dilemma lies in ensuring that all young people develop a foundational understanding of AI technologies and the role that they can play in their lives.
That’s why the conversation about AI in education is so important. A lot of the focus of that conversation is on how we harness the power of AI technologies to improve teaching and learning. Enabling young people to use AI to learn is important, but it’s not enough.
We need to equip young people with the knowledge, skills, and mindsets to use AI technologies to create the world they want. And that means supporting their teachers, who once again are being asked to teach a subject that they didn’t study.
Experience AI
That’s the work that we’re doing through Experience AI, an ambitious programme to provide teachers with free classroom resources and professional development, enabling them to teach their students about AI technologies and how they are changing the world. All of our resources are grounded in research that defines the concepts that make up AI literacy, they are rooted in real world examples drawing on the work of Google DeepMind, and they involve hands-on, interactive activities.
The Experience AI resources have already been downloaded 100,000 times across 130 countries and we estimate that 750,000 young people have taken part in an Experience AI lesson already.
In November 2023, we announced that we were building a global network of partners that we would work with to localise and translate the Experience AI resources, to ensure that they are culturally relevant, and organise locally delivered teacher professional development. We’ve made a fantastic start working with partners in Canada, India, Kenya, Malaysia, and Romania; and it’s been brilliant to see the enthusiasm and demand for AI literacy from teachers and students across the globe.
Thanks to an incredibly generous donation of $10m from Google.org – announced at Google.org’s first Impact Summit – we will shortly be welcoming new partners in 17 countries across Europe, the Middle East, and Africa, with the aim of reaching more than 2 million students in the next three years.
AI Safety
Alongside the expansion of the global network of Experience AI partners, we are also launching new resources that focus on critical issues of AI safety.
AI and Your Data: Helping young people reflect on the data they are already providing to AI applications in their lives and how the prevalence of AI tools might change the way they protect their data.
Media Literacy in the Age of AI: Highlighting the ways AI tools can be used to perpetuate misinformation and how AI applications can help combat misleading claims.
Using Generative AI Responsibly: Empowering young people to reflect on their responsibilities when using Generative AI and their expectations of developers who release AI tools.
Get involved
In many ways, this moment in the development of AI technologies reminds me of the internet in the 1990s (yes, I am that old). We all knew that it had potential, but no-one could really imagine the full scale of what would follow.
We failed to rise to the educational challenge of that moment and we are still living with the consequences: a dire shortage of talent; a tech sector that doesn’t represent all communities and voices; and young people and communities who are still missing out on economic opportunities and unable to utilise technology to solve the problems that matter to them.
We have an opportunity to do a better job this time. If you’re interested in getting involved, we’d love to hear from you.
The heart and soul of a Zabbix Summit is the wide range of expert speakers who show up each year to share their experience, knowledge, and discoveries. Accordingly, we’re continuing our series of interviews with Summit 2024 speakers by having a chat with MariaDB Sales Engineer Anders Karlsson. He’ll grace our stage at Summit 2024 to talk about his 4 decades of work experience and share how he uses a variety of Zabbix features to monitor MariaDB clusters and MariaDB MaxScale.
Please tell us a bit about yourself and the journey that led you to MariaDB.
I have been working with databases nearly all of my professional life, which is more than 40 years by now. My first IT job was as a system administrator on a development system for Telco equipment running UNIX on a PDP/11 70. This was fun, and I got to use Unix very early (the early 1980’s) and I was also there at the start of the Internet (by emailing through UUCP to the US and then through what was then the Internet).
Following that, I joined another Telco company, which used a rather unknown database technology called Oracle (version 4.1.4). When this company moved their operations from Stockholm (where I lived) to Luxembourg, I decided to leave and look for other opportunities. I heard that Oracle was looking for people and I got a job there as a support engineer. At Oracle I soon got involved with lots of things beyond Tech Support – I was a trainer, a consultant, and eventually a sales engineer.
I left Oracle in the early 1990’s to join a small application development company as a developer, but this really wasn’t for me, so I soon left and joined Informix instead. I was at Informix until 1996 or so and then I worked for some other small companies around the end of the millennium. Next, I joined forces with a couple of old friends to develop a database solution. This wasn’t very successful, and I still needed a job.
I first ended up with TimesTen before they ran out of luck. After a year or so of freelancing, I was approached by an old friend from the Informix days who was now the sales manager for MySQL in Scandinavia. I joined MySQL in 2004 as a sales engineer and was there until Oracle took over. I then worked for a small Swedish startup for a couple of years, but I missed sales engineering, so when I got an offer to join MariaDB in 2012 I said yes.
How long have you been using Zabbix? What kind of Zabbix tasks do you get up to on a daily basis?
I have known about Zabbix and used it occasionally for a while, but while preparing for Zabbix Summit 2024 I have gotten to use it “in anger” a bit more. There are pros and cons to it, but in general I like it. It does have a lot of “Open Source” feel to it, but that is not really an issue for me.
Can you give us a few clues about what we can expect to hear during your Zabbix Summit presentation?
I will focus on monitoring MariaDB Clusters running Galera Cluster and the MariaDB MaxScale database proxy. Monitoring individual MariaDB servers is easy out of the box with Zabbix, but when you have a cluster you have to monitor certain cluster-wide attributes. MariaDB MaxScale keeps track of the state of the server in the cluster in detail and the cluster as whole, and I will show how to pull cluster-wide data from MaxScale using the MaxScale REST/JSON API and how to use that to build triggers and graphs in Zabbix. I will finish up by doing a demo of this with MariaDB MaxScale and a Galera Cluster.
What led you to the topic of Monitoring MariaDB Clusters and MariaDB MaxScale with Zabbix?
The main thing was that although there are community provided Zabbix templates for MariaDB MaxScale, and Galera can be monitored largely by the Zabbix agent, using these typically does not provide as much in terms of cluster-wide monitoring as I would like. It’s important to know how the reads and writes are distributed, what the state of the database cluster is, etc.
How do you see the role of Zabbix in MariaDB in the near future? Are you planning to use it for any other new tasks?
My next goal is to see if I can write a blog for MariaDB on Zabbix monitoring with some emphasis on MariaDB MaxScale.
Cloudflare handles over 60 million HTTP requests per second globally, with approximately 70% received over TCP connections (the remaining are QUIC/UDP). Ideally, every new TCP connection to Cloudflare would carry at least one request that results in a successful data exchange, but that is far from the truth. In reality, we find that, globally, approximately 20% of new TCP connections to Cloudflare’s servers time out or are closed with a TCP “abort” message either before any request can be completed or immediately after an initial request.
This post explores those connections that, for various reasons, appear to our servers to have been halted unexpectedly before any useful data exchange occurs. Our work reveals that while connections are normally ended by clients, they can also be closed due to third-party interference. Today we’re excited to launch a new dashboard and API endpoint on Cloudflare Radar that shows a near real-time view of TCP connections to Cloudflare’s network that terminate within the first 10 ingress packets due to resets or timeouts, which we’ll refer to as anomalous TCP connections in this post. Analyzing this anomalous behavior provides insights into scanning, connection tampering, DoS attacks, connectivity issues, and other behaviors.
Our ability to generate and share this data via Radar follows from a global investigation into connection tampering. Readers are invited to read the technical details in the peer-review study, or see its corresponding presentation. Read on for a primer on how to use and interpret the data, as well as how we designed and deployed our detection mechanisms so that others might replicate our approach.
To begin, let’s discuss our classification of normal vs anomalous TCP connections.
TCP connections from establishment to close
The Transmission Control Protocol (TCP) is a protocol for reliably transmitting data between two hosts on the Internet (RFC 9293). A TCP connection passes through several distinct stages, from connection establishment, to data transfer, to connection close.
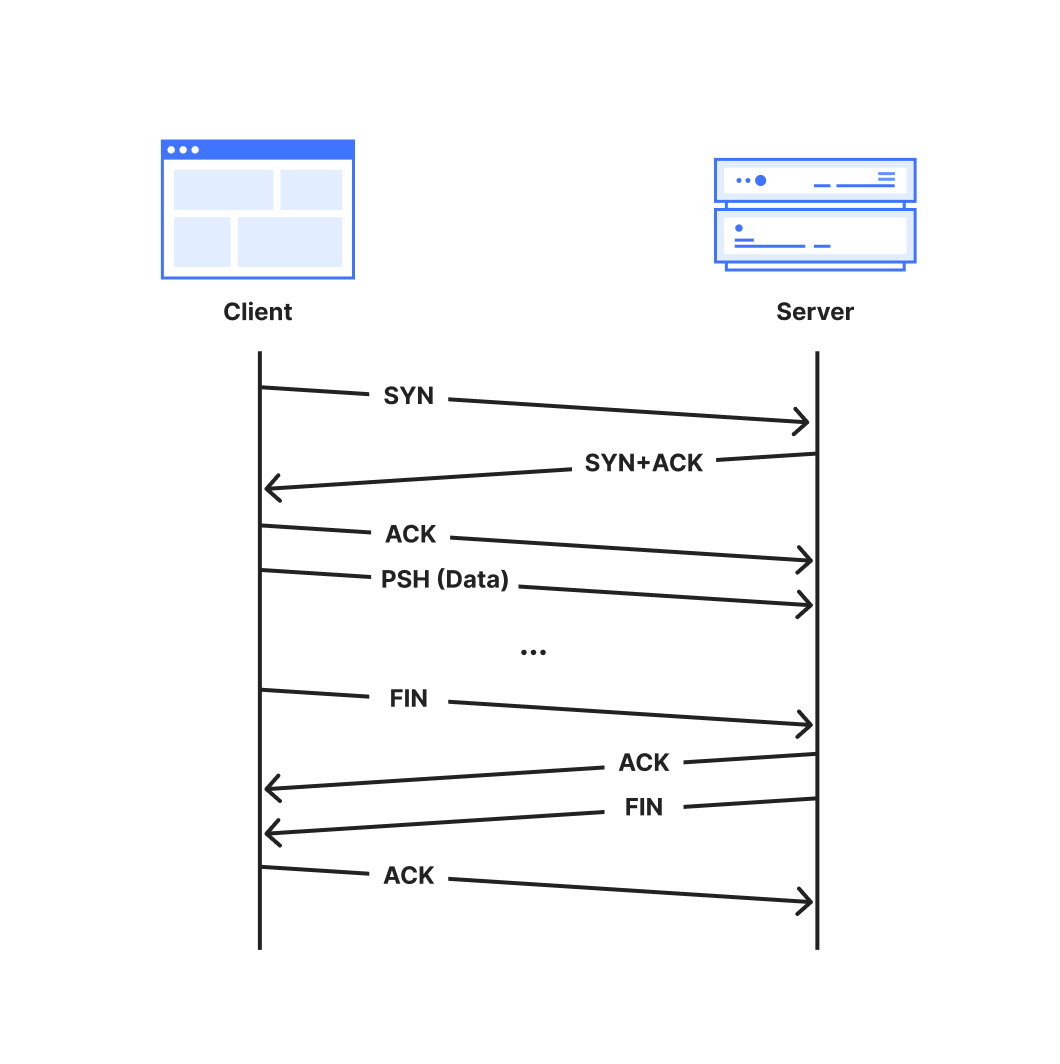
A TCP connection is established with a 3-way handshake. The handshake begins when one party, called the client, sends a packet marked with the ‘SYN’ flag to initialize the connection process. The server responds with a “SYN+ACK” packet where the ‘ACK’ flag acknowledges the client’s initialization ‘SYN’. Additional synchronization information is included in both the initialization packet and its acknowledgement. . Finally, the client acknowledges the server’s SYN+ACK packet with a final ACK packet to complete the handshake.
The connection is then ready for data transmission. Typically, the client will set the PSH flag on the first data-containing packet to signal to the server’s TCP stack to forward the data immediately up to the application. Both parties continue to transfer data and acknowledge received data until the connection is no longer needed, at which point the connection is closed.
RFC 9293 describes two ways in which a TCP connection may be closed:
The normal and graceful TCP close sequence uses a FIN exchange. Either party can send a packet with the FIN flag set to indicate that they have no more data to transmit. Once the other party acknowledges that FIN packet, that direction of the connection is closed. When the acknowledging party is finished transmitting data, it transmits its own FIN packet to close, since each direction of the connection must be closed independently.
An abort or “reset” signal in which one party transmits RST packets, instructing the other party to immediately close and discard any connection state. Resets are generally sent when some unrecoverable error has occurred.
The full lifetime of a connection that closes gracefully with a FIN is captured in the following sequence diagram.
A normal TCP connection starts with a 3-way handshake and ends with a FIN handshake
Additionally, a TCP connection may be terminated by a timeout which specifies the maximum duration that a connection can be active without receiving data or acknowledgements. An inactive connection, for example, can be kept open with keepalive messages. Unless overridden, the global default duration specified in RFC 9293 is five minutes.
We consider TCP connections anomalous when they close via either a reset or timeout from the client side.
Sources of anomalous connections
Anomalous TCP connections may not themselves be problematic but they can be a symptom of larger issues, especially when occurring at early (pre-data) stages of TCP connections. Below is a non-exhaustive list of potential reasons that we might observe resets or timeouts:
Scanners: Internet scanners may send a SYN packet to probe if a server responds on a given port, but otherwise fail to clean up a connection once the probe has elicited a response from the server.
Sudden Application Shutdowns: Applications might abruptly close open connections if they are no longer required. For example, web browsers may send RSTs to terminate connections after a tab is closed, or connections can time out if devices lose power or connectivity.
Network Errors: Unstable network conditions (e.g., a severed cable connection could result in connection timeouts)
Attacks: A malicious client may send attack traffic that appears as anomalous connections. For instance, in a SYN flood (half-open) attack, an attacker repeatedly sends SYN packets to a target server in an attempt to overwhelm resources as it maintains these half-opened connections.
Tampering: Firewalls or other middleboxes capable of intercepting packets between a client and server may drop packets, causing timeouts at the communicating parties. Middleboxes capable of deep packet inspection (DPI) might also leverage the fact that the TCP protocol is unauthenticated and unencrypted to inject packets to disrupt the connection state. See our accompanying blog post for more details on connection tampering.
Understanding the scale and underlying reasons for anomalous connections can help us to mitigate failures and build a more robust and reliable network. We hope that sharing these insights publicly will help to improve transparency and accountability for networks worldwide.
How to use the dataset
In this section, we provide guidance and examples of how to interpret the TCP resets and timeouts dataset by broadly describing three use cases: confirming previously-known behaviors, exploring new targets for followup study, and longitudinal studies to capture changes in network behavior over time.
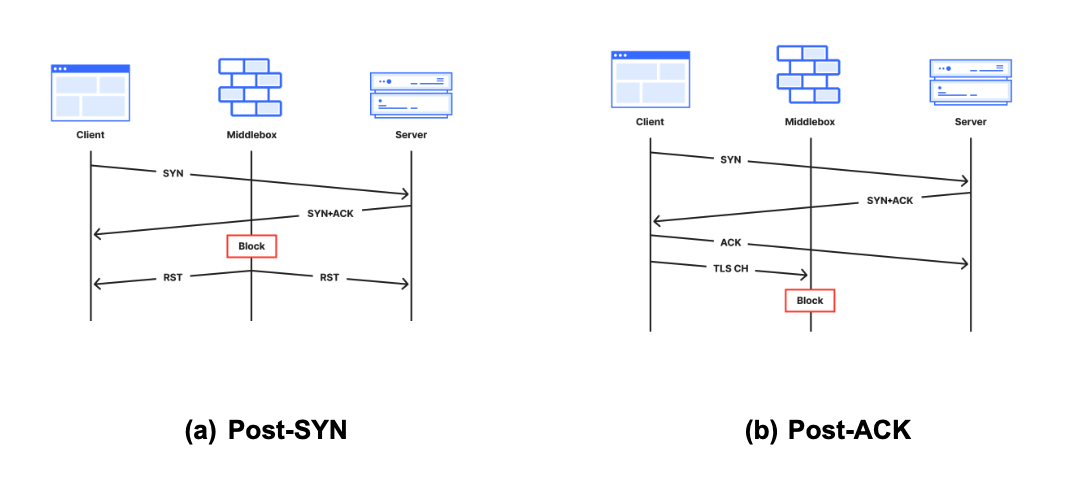
In each example, the plot lines correspond to the stage of the connection in which the anomalous connection closed, which provides valuable clues into what might have caused the anomaly. We place each incoming connection into one of the following stages:
Post-SYN (mid-handshake): Connection resets or timeouts after the server received a client’s SYN packet. Our servers will have replied, but no acknowledgement ACK packet has come back from the client before the reset or timeout. Packet spoofing is common at this connection stage, so geolocation information is especially unreliable.
Post-ACK (immediately post-handshake): Connection resets or timeouts after the handshake completes and the connection is established successfully. Any subsequent data, that may have been transmitted, never reached our servers.
Post-PSH (after first data packet): Connection resets or timeouts after the server received a packet with the PSH flag set. The PSH flag indicates that the TCP packet contains data (such as a TLS Client Hello message) that is ready to be delivered to the application.
Later (after multiple data packets): Connection resets within the first 10 packets from the client, but after the server has received multiple data packets.
None: All other connections.
To keep focus on legitimate connections, the dataset is constructed after connections are processed and filtered by Cloudflare’s attack mitigation systems. For more details on how we construct the dataset, see below.
Start with a self-evaluation
To start, we encourage readers to visit the dashboard on Radar to view the results worldwide, and for their own country and ISP.
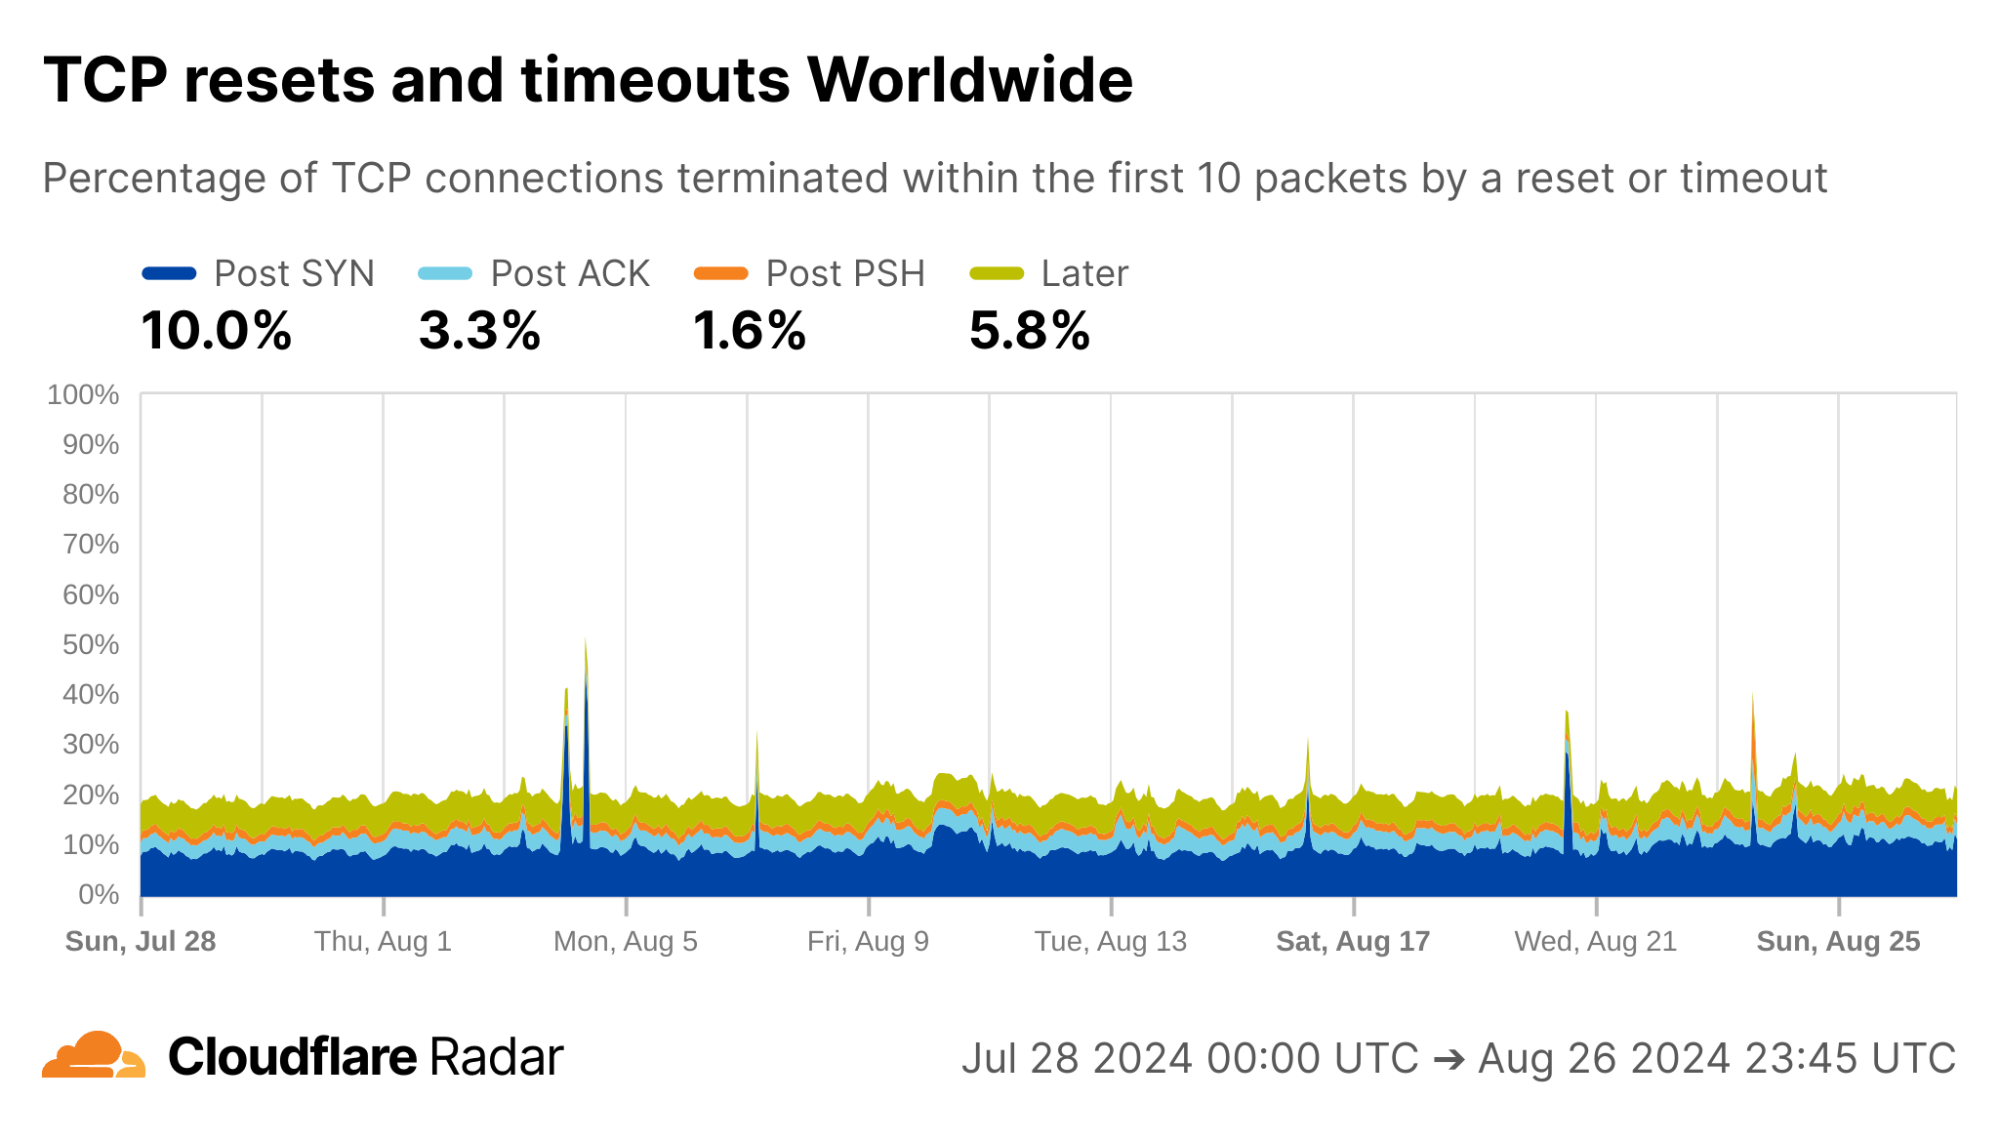
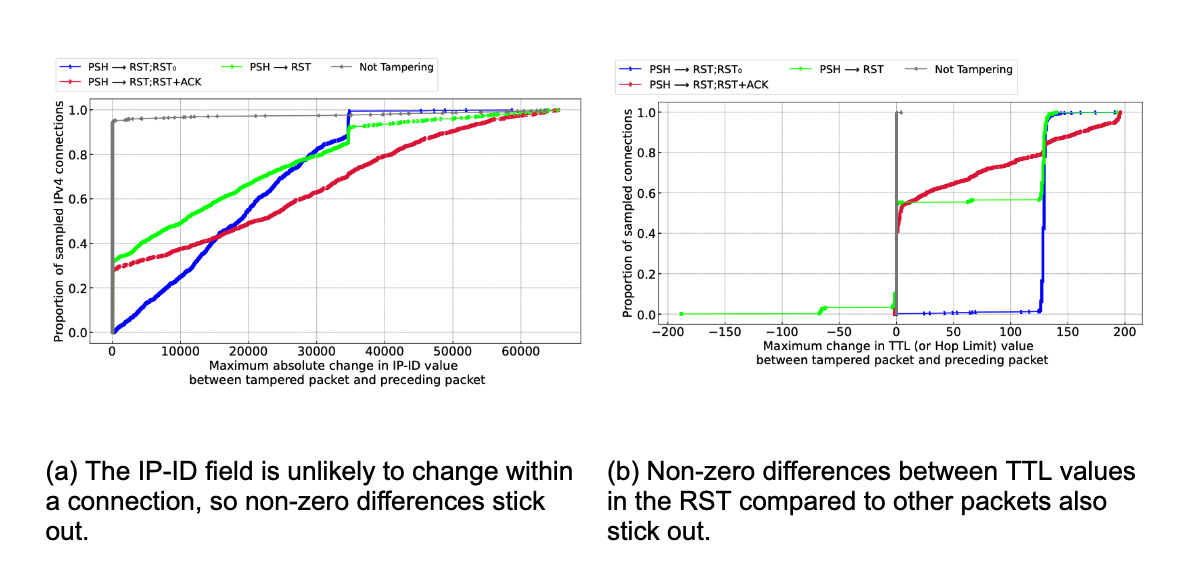
Globally, as shown below, about 20% of new TCP connections to Cloudflare’s network are closed by a reset or timeout within the first 10 packets from the client. While this number seems astonishingly high, it is in-line with prior studies. As we’ll see, rates of resets and timeouts vary widely by country and network, and this variation is lost in the global averages.
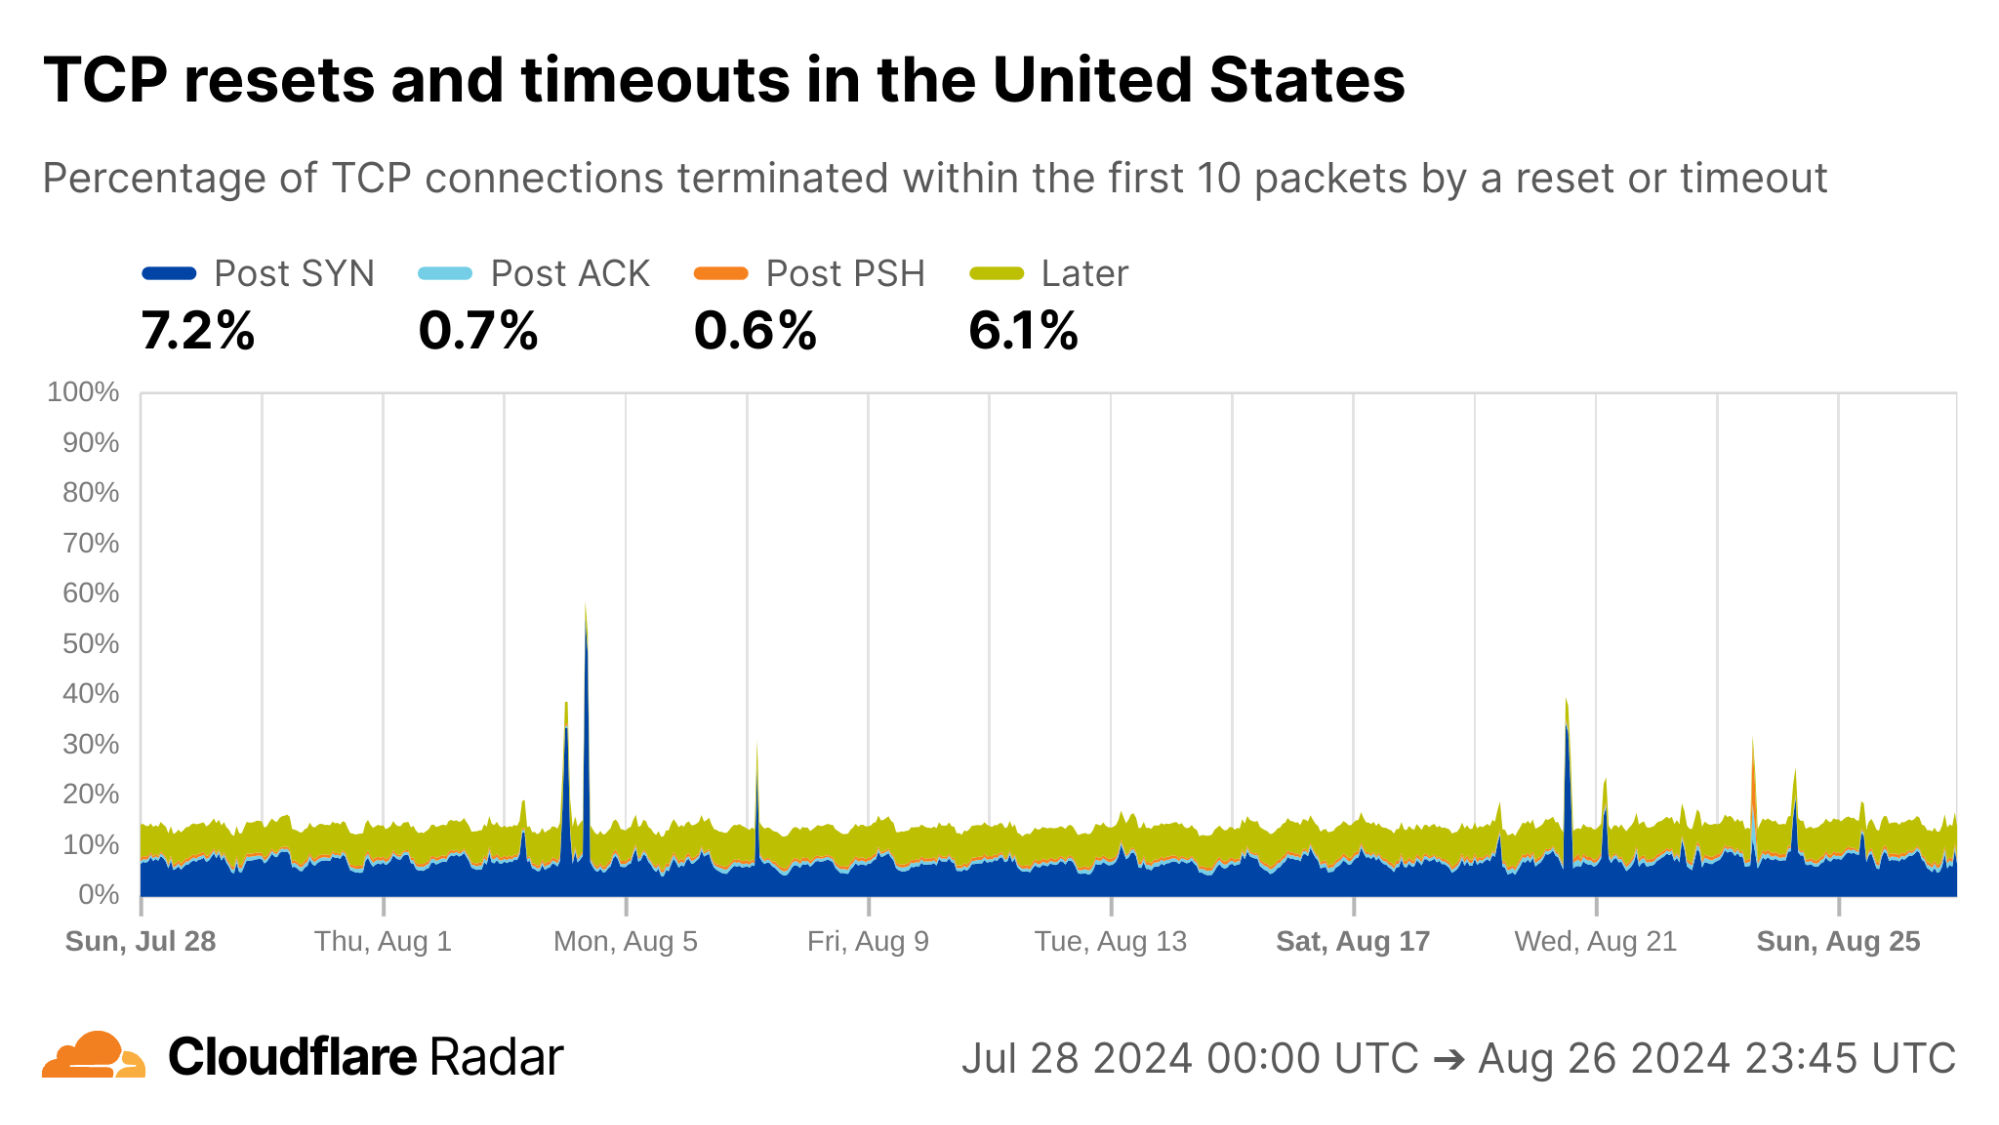
The United States, my home country, shows anomalous connection rates slightly lower than the worldwide averages, largely due to lower rates for connections closing in the Post-ACK and Post-PSH stages (those stages are more reflective of middlebox tampering behavior). The elevated rates of Post-SYN are typical in most networks due to scanning, but may include packets that spoof the true client’s IP address. Similarly, high rates of connection resets in the Later connection stage (after the initial data exchange, but still within the first 10 packets) might be applications responding to human actions, such as browsers using RSTs to close unwanted TCP connections after a tab is closed.
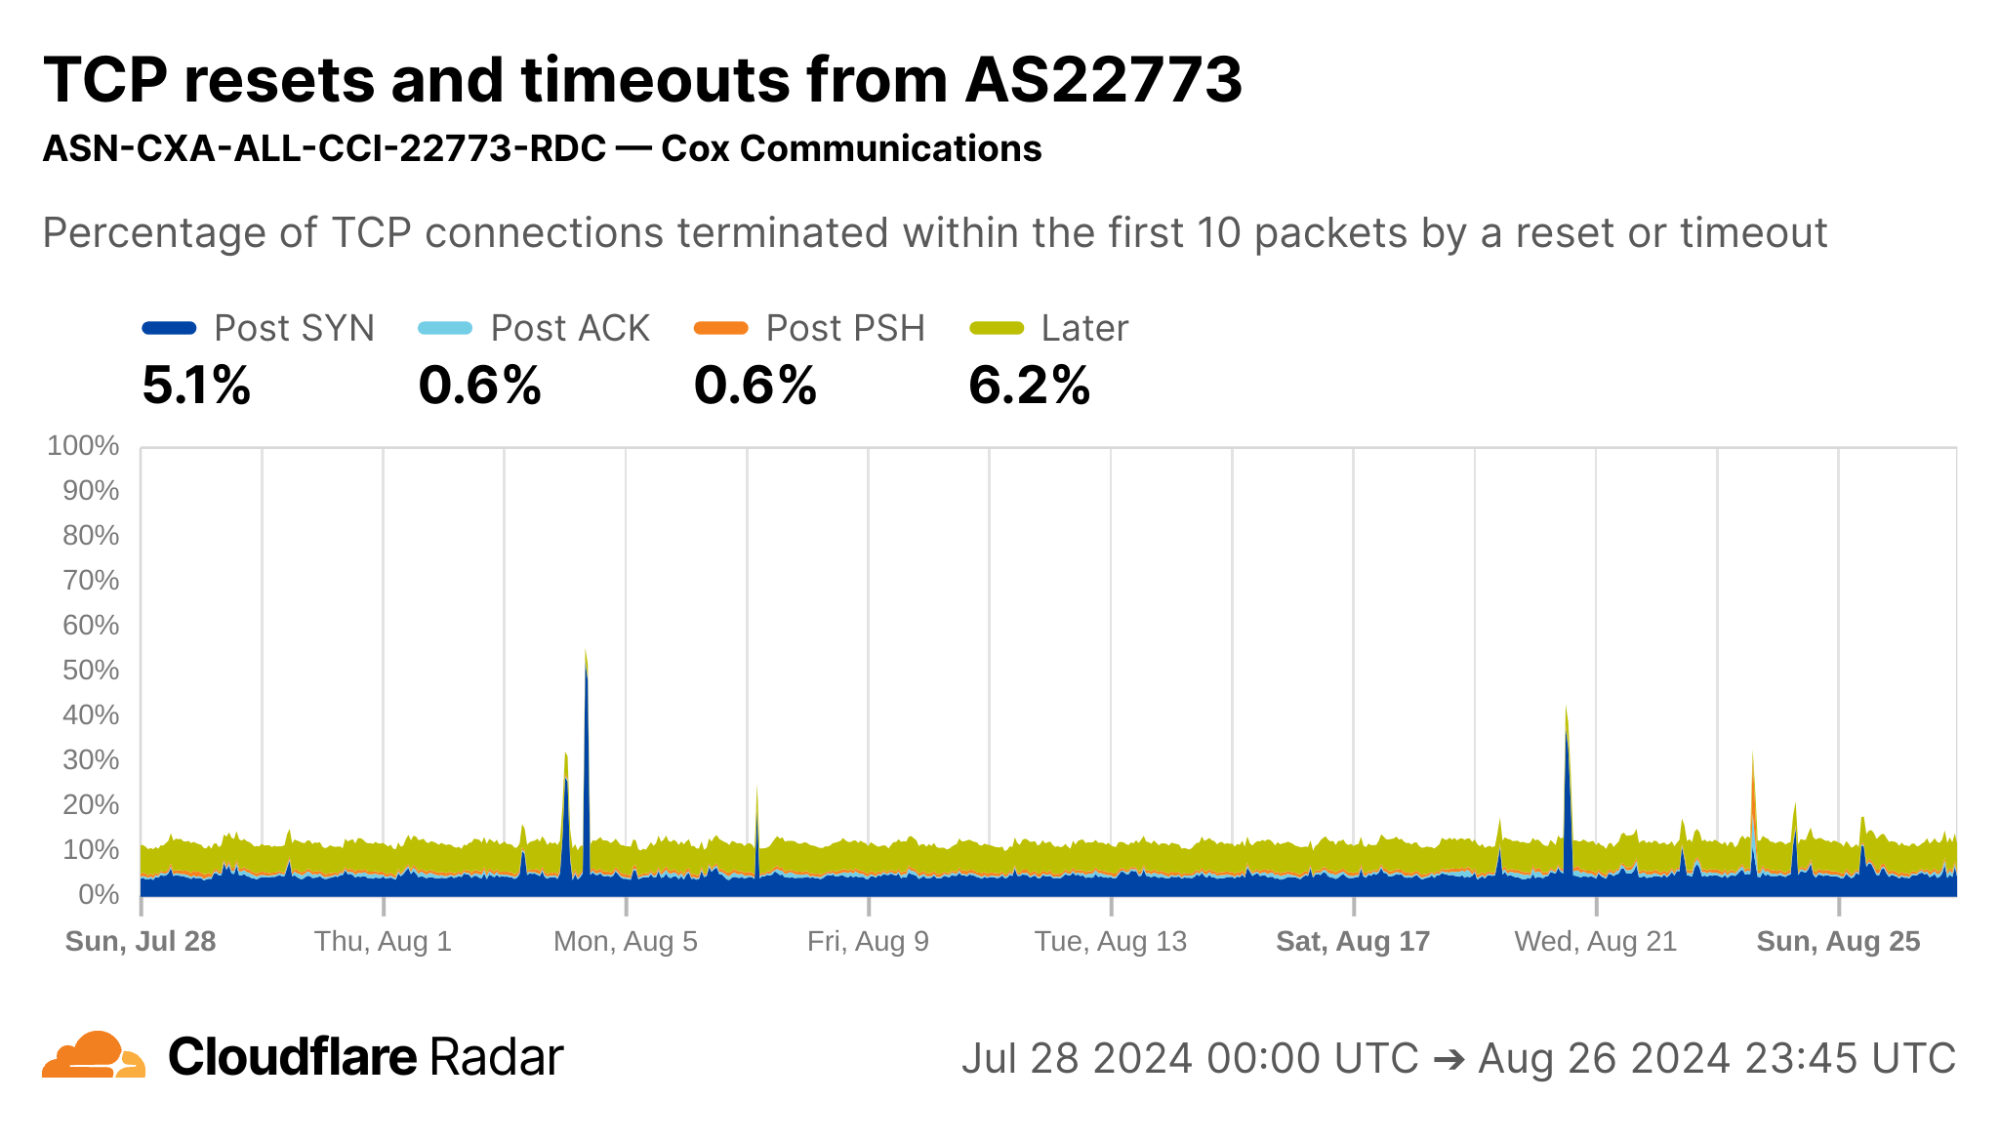
My home ISP AS22773 (Cox Communications) shows rates comparable to the US as a whole. This is typical of most residential ISPs operating in the United States.
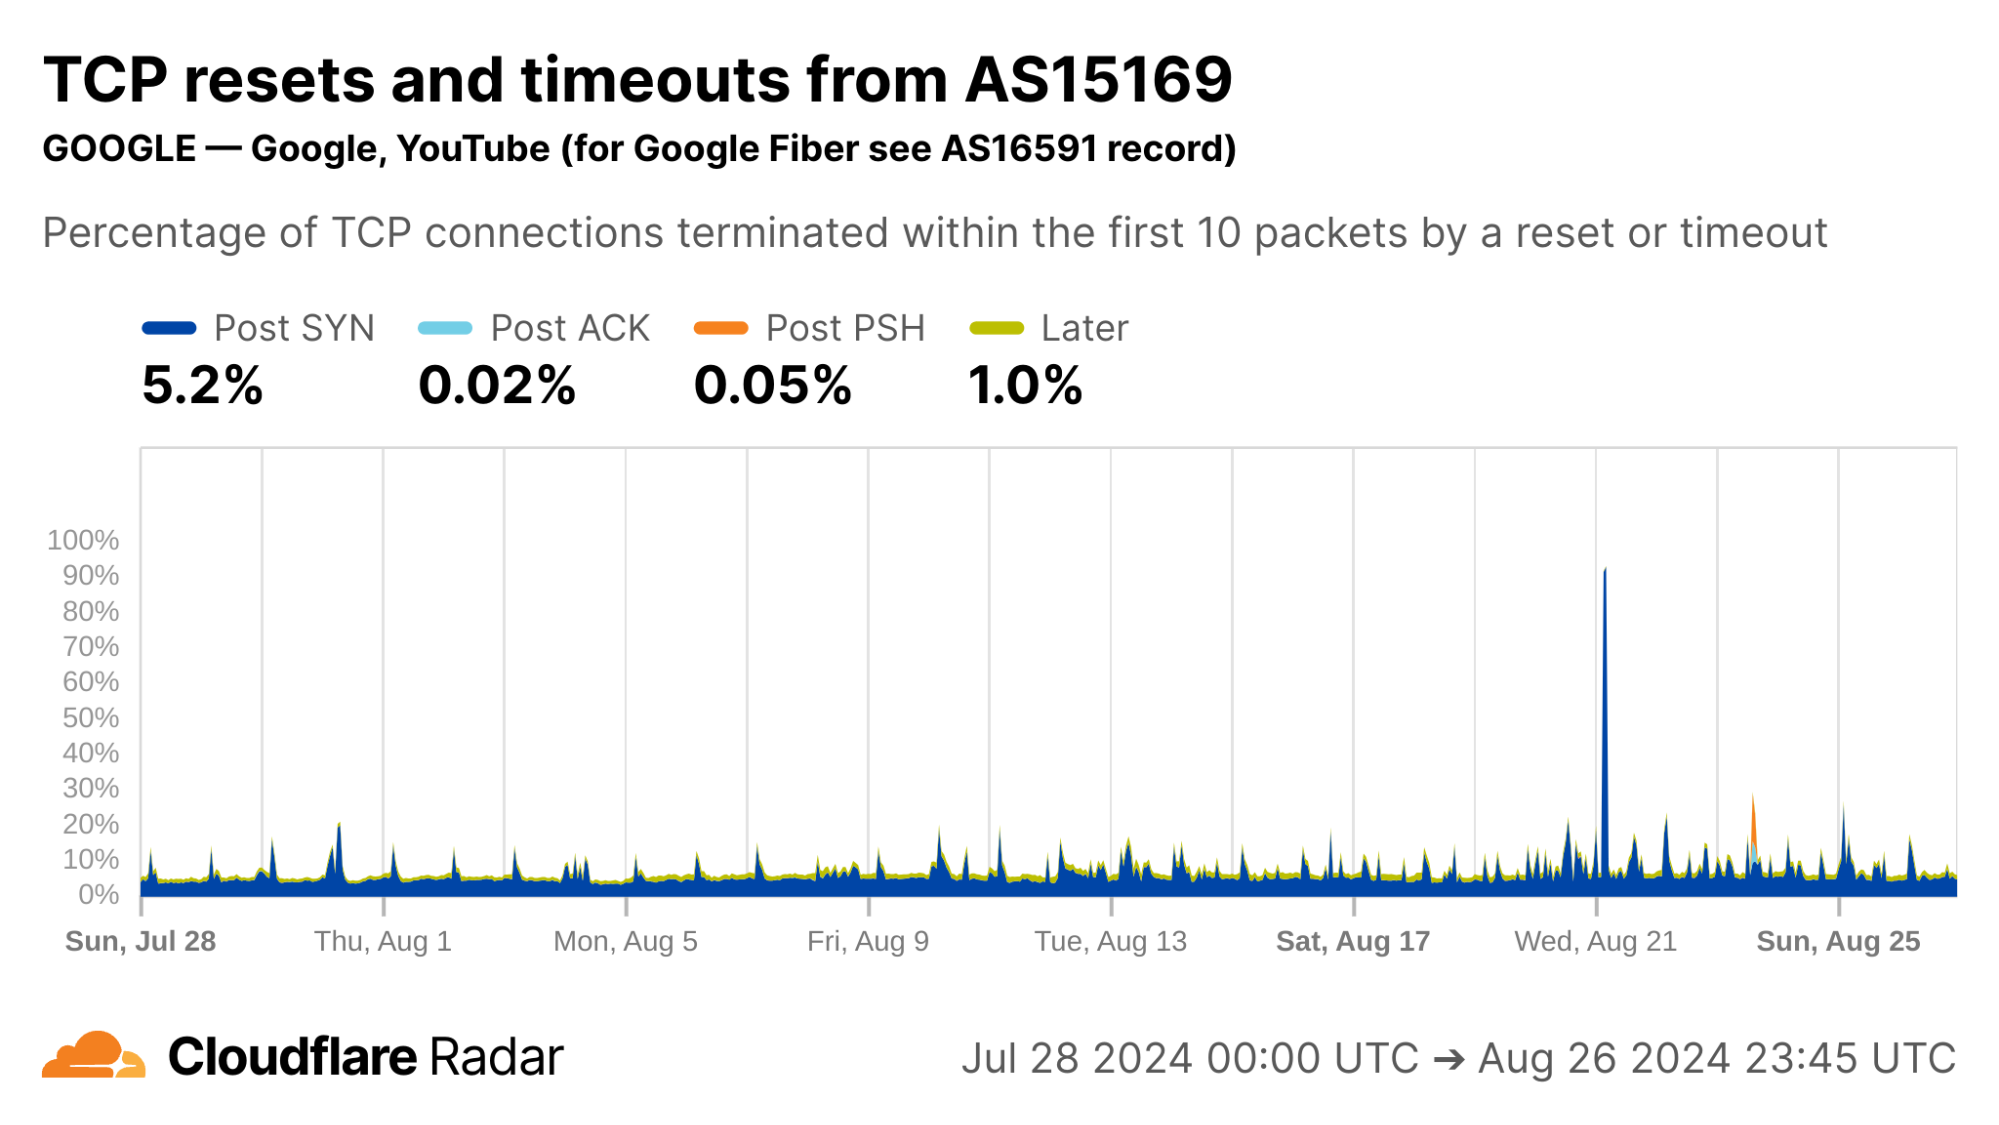
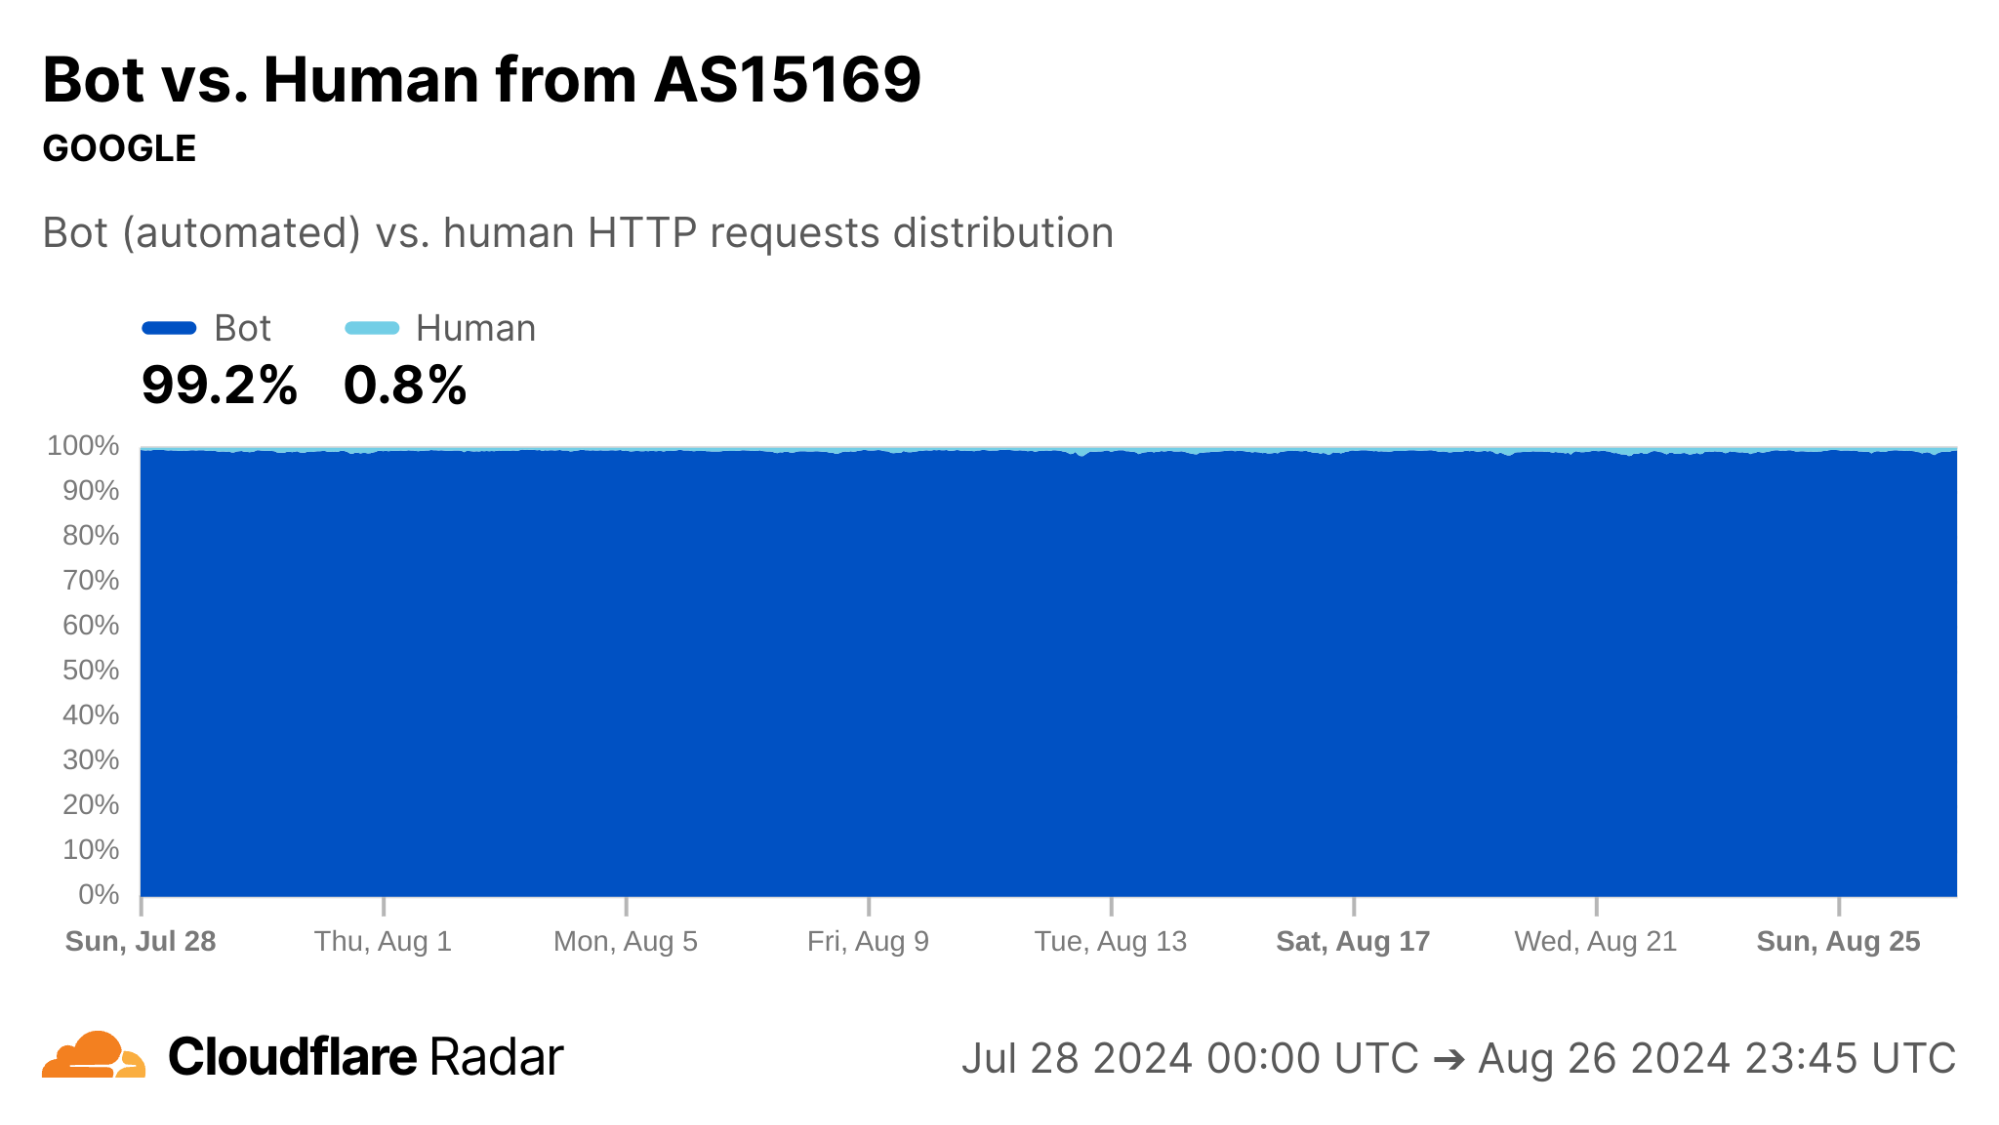
Contrast this against AS15169 (Google LLC), which originates many of Google’s crawlers and fetchers. This network shows significantly lower rates of resets in the “Later” connection stage, which may be explained by the larger proportion of automated traffic, not driven by human user actions (such as closing browser tabs).
Indeed, our bot detection system classifies over 99% of HTTP requests from AS15169 as automated. This shows the value of collating different types of data on Radar.
The new anomalous connections dataset, like most that appear on Radar, is passive – it only reports on observable events, not what causes them. In this spirit, the graphs above for Google’s network reinforce the reason for corroborating observations, as we discuss next.
One view for a signal, more views for corroboration
Our passive measurement approach works at Cloudflare scale. However, it does not identify root causes or ground truth on its own. There are many plausible explanations for why a connection closed in a particular stage, especially when the closure is due to reset packets and timeouts. Attempts to explain by relying solely on this data source can only lead to speculation.
However, this limitation can be overcome by combining with other data sources such as active measurements. For example, corroborating with reports from OONI or Censored Planet, or with on-the-ground reports, can give a more complete story. Thus, one of the major use cases for the TCP resets and timeouts dataset is to understand the scale and impact of previously-documented phenomena.
Corroborating Internet-scale measurement projects
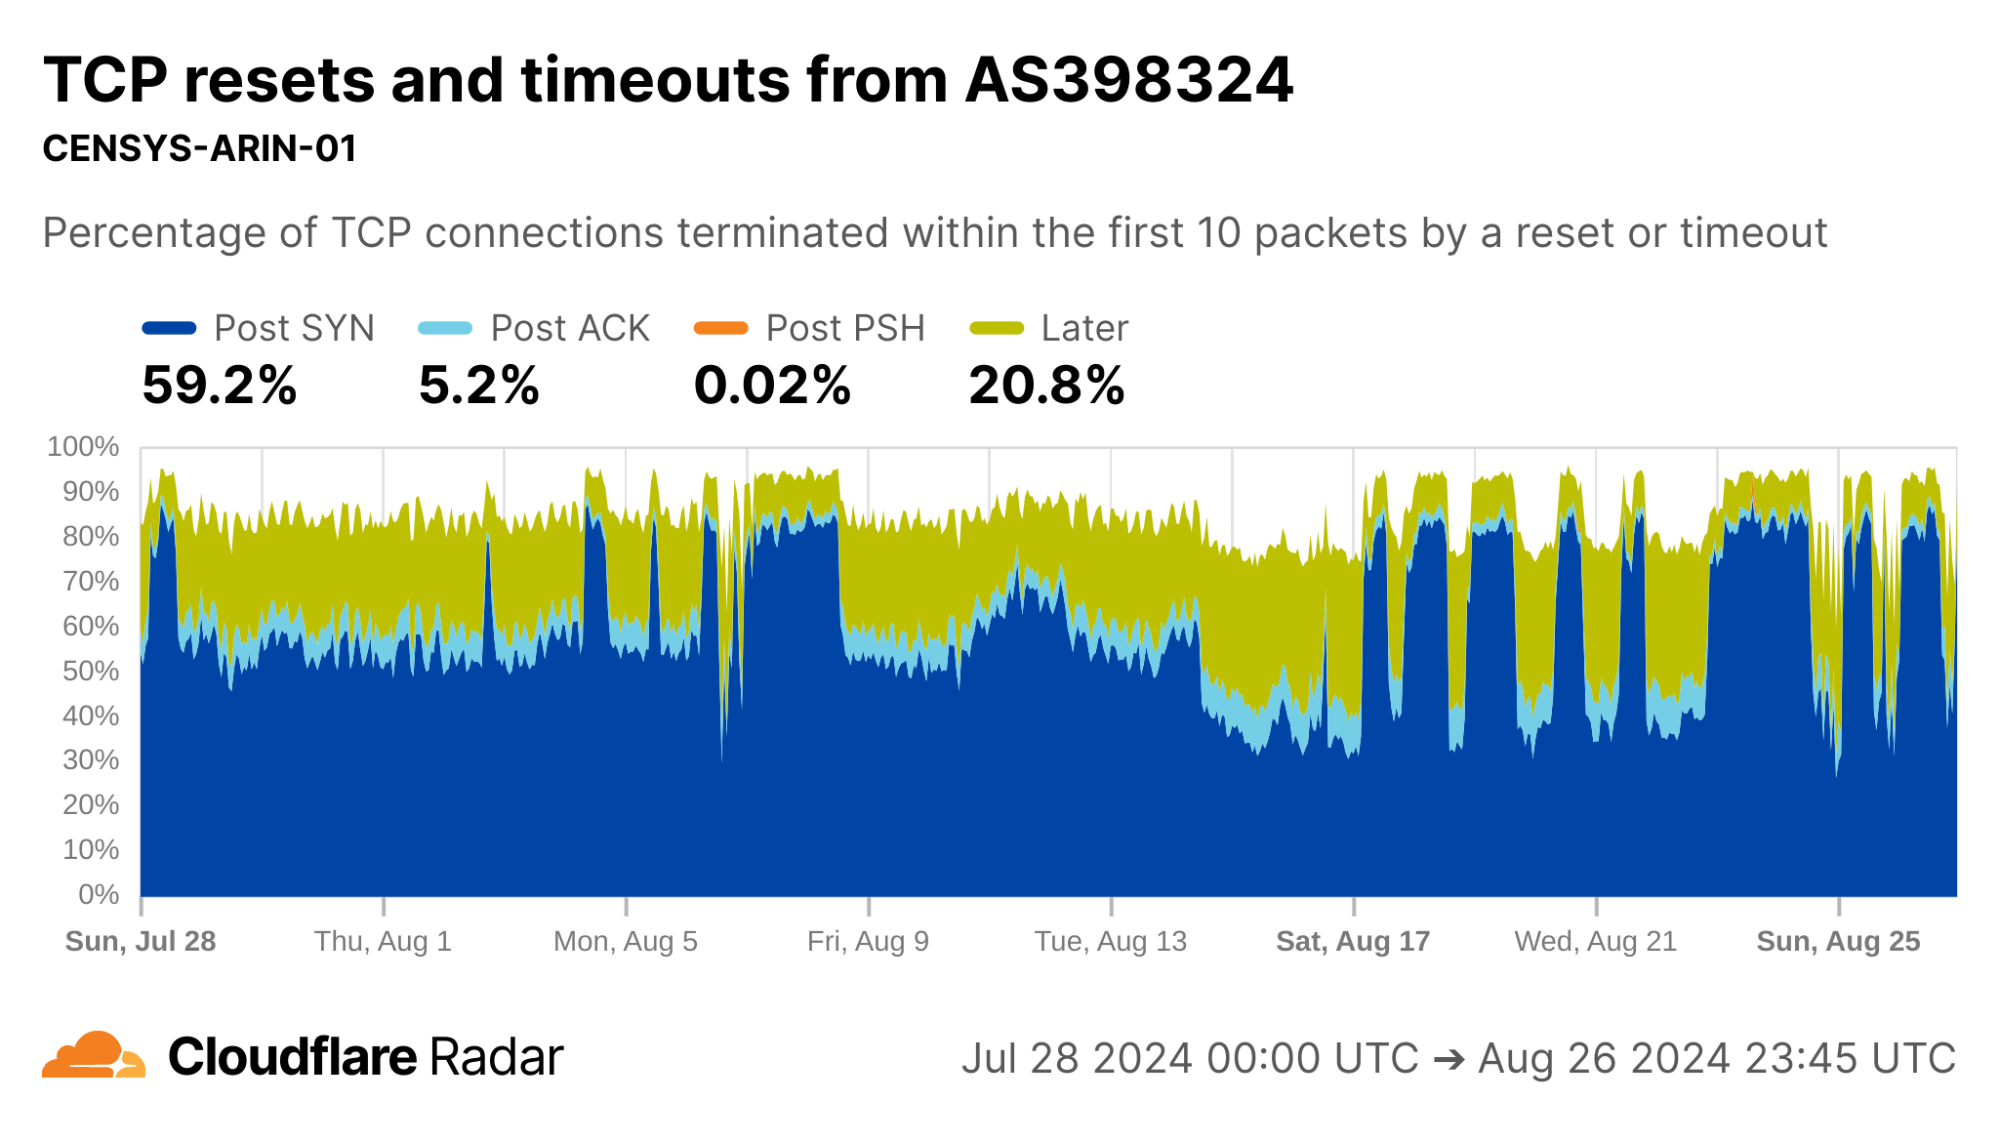
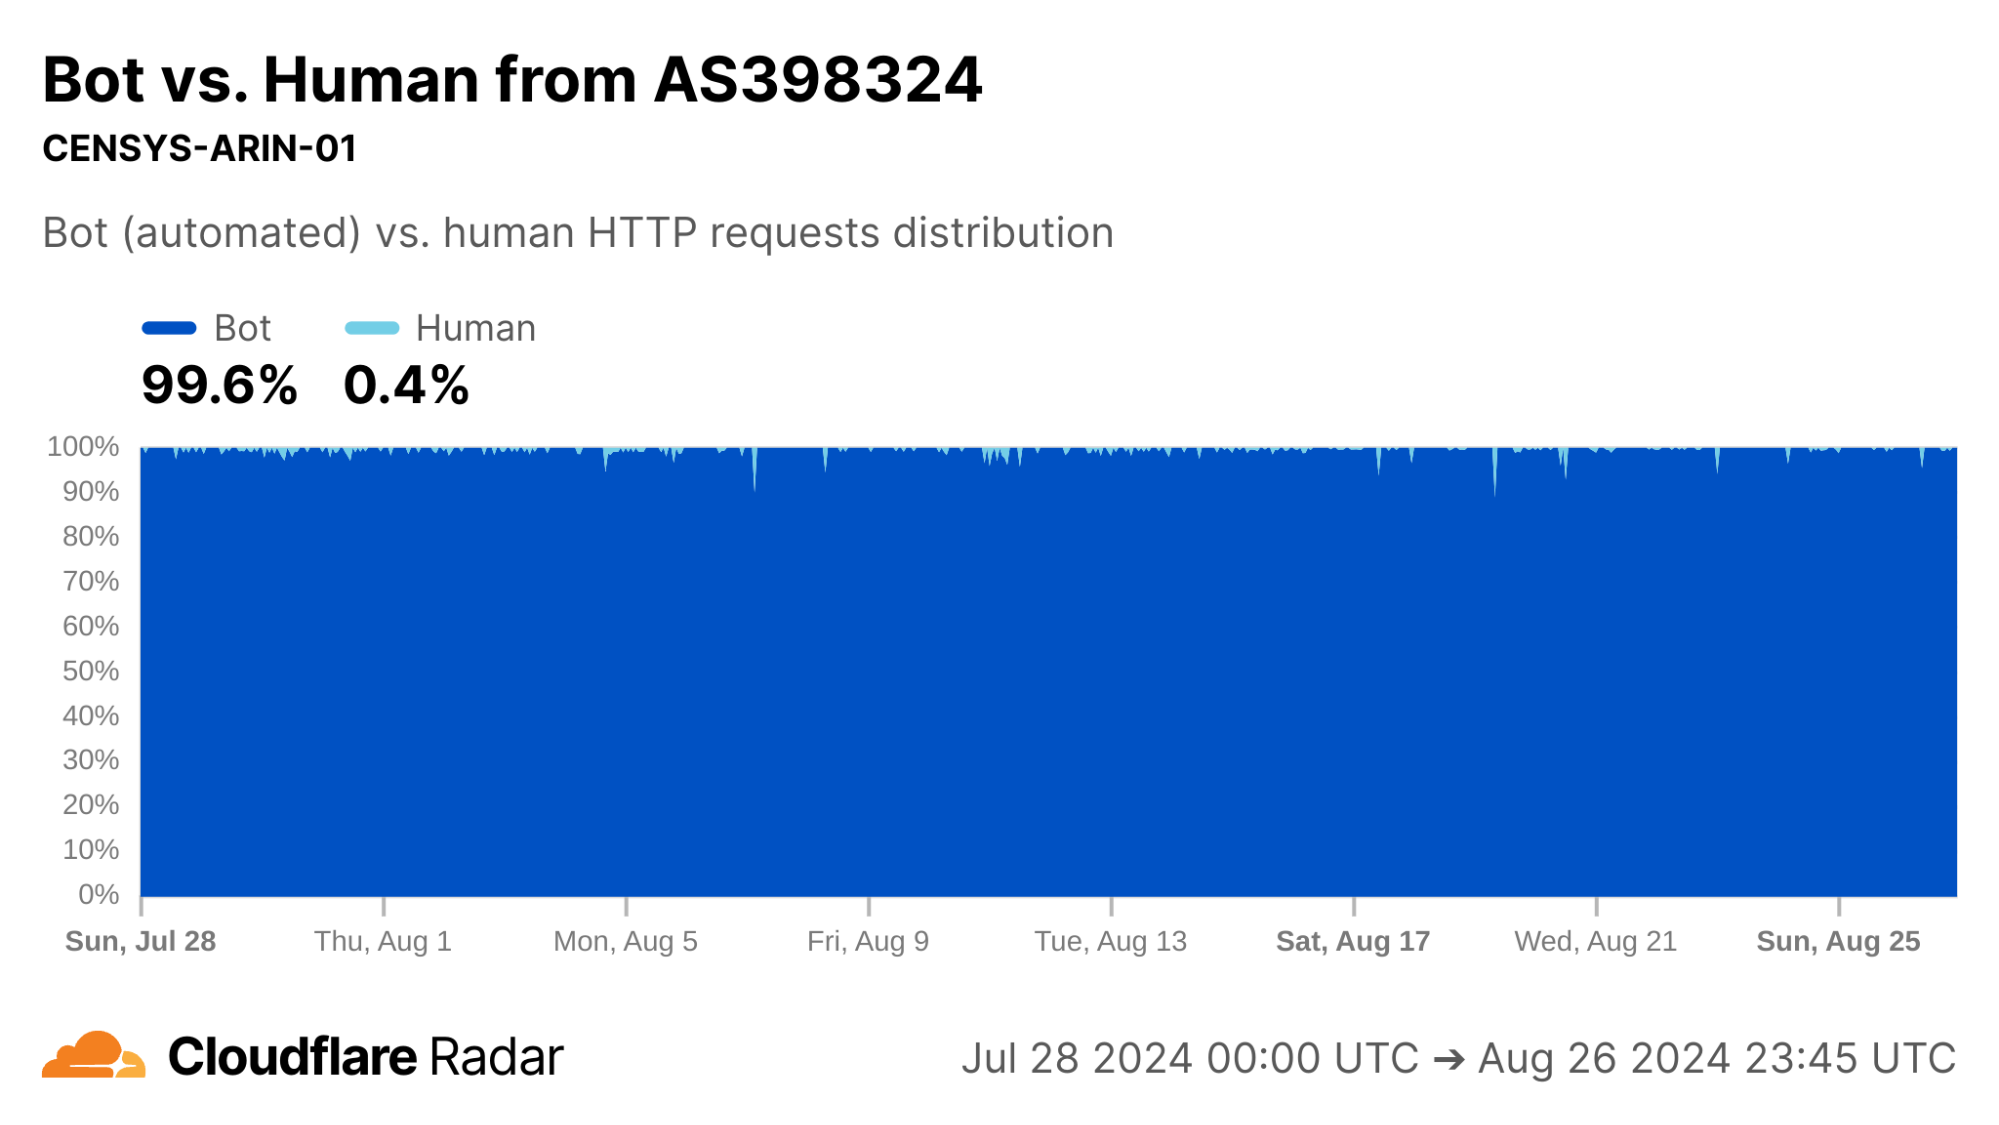
Looking at AS398324 would suggest something terribly wrong, with more than half of connections showing up as anomalous in the Post-SYN stage. However, this network turns out to be CENSYS-ARIN-01, from Internet scanning company Censys. Post-SYN anomalies can be the result of network-layer scanning, where the scanner sends a single SYN packet to probe the server, but does not complete the TCP handshake. There are also high rates of Later anomalies, which could be indicative of application-layer scanning, as indicated by the near 100% proportion of connections being classified as automated.
So far, we’ve looked at networks that generate high volumes of scripted or automated traffic. It’s time to look further afield.
Corroborating connection tampering
The starting point of this dataset was a research project to understand and detect active connection tampering, in a similar spirit to our work on HTTPS interception. The reasons we set out to do are explained in detail in our accompanying blog post.
A well-documented technique in the wild to force connections to close is reset injection. With reset injection, middleboxes on the path to the destination inspect data portions of packets. When the middlebox sees a packet to a forbidden domain name, it injects forged TCP Reset (RST) packets to one or both communicating parties to cause them to abort the connection. If the middlebox did not drop the forbidden packet first, then the server will receive both the client packet that triggered the middlebox tampering – perhaps containing a TLS Client Hello message with a Server Name Indication (SNI) field – followed soon afterwards by the forged RST packet.
In the TCP resets and timeouts dataset, a connection disrupted via reset injection would typically appear as a Post-ACK, Post-PSH, or Later anomaly (but, as a reminder, not all anomalies are due to reset injection).
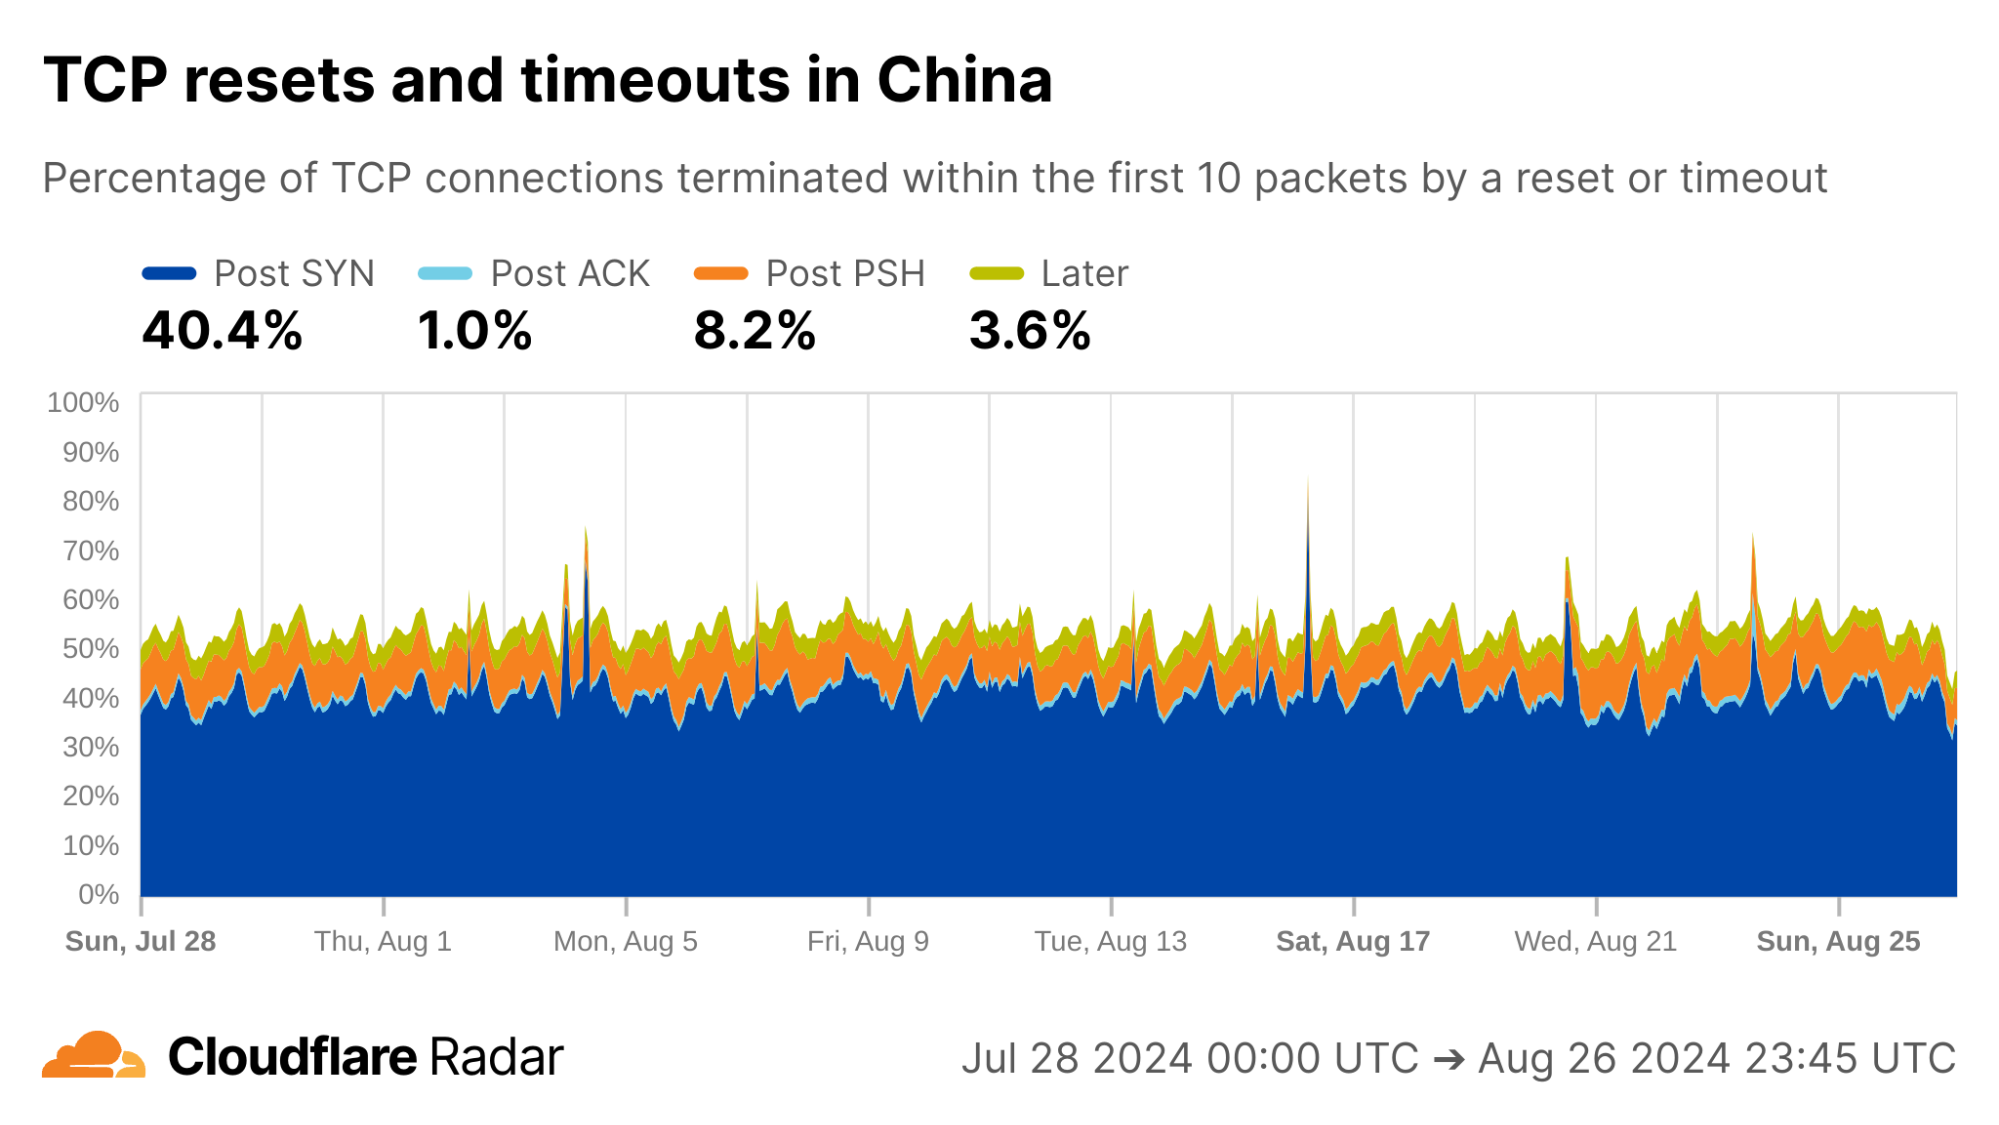
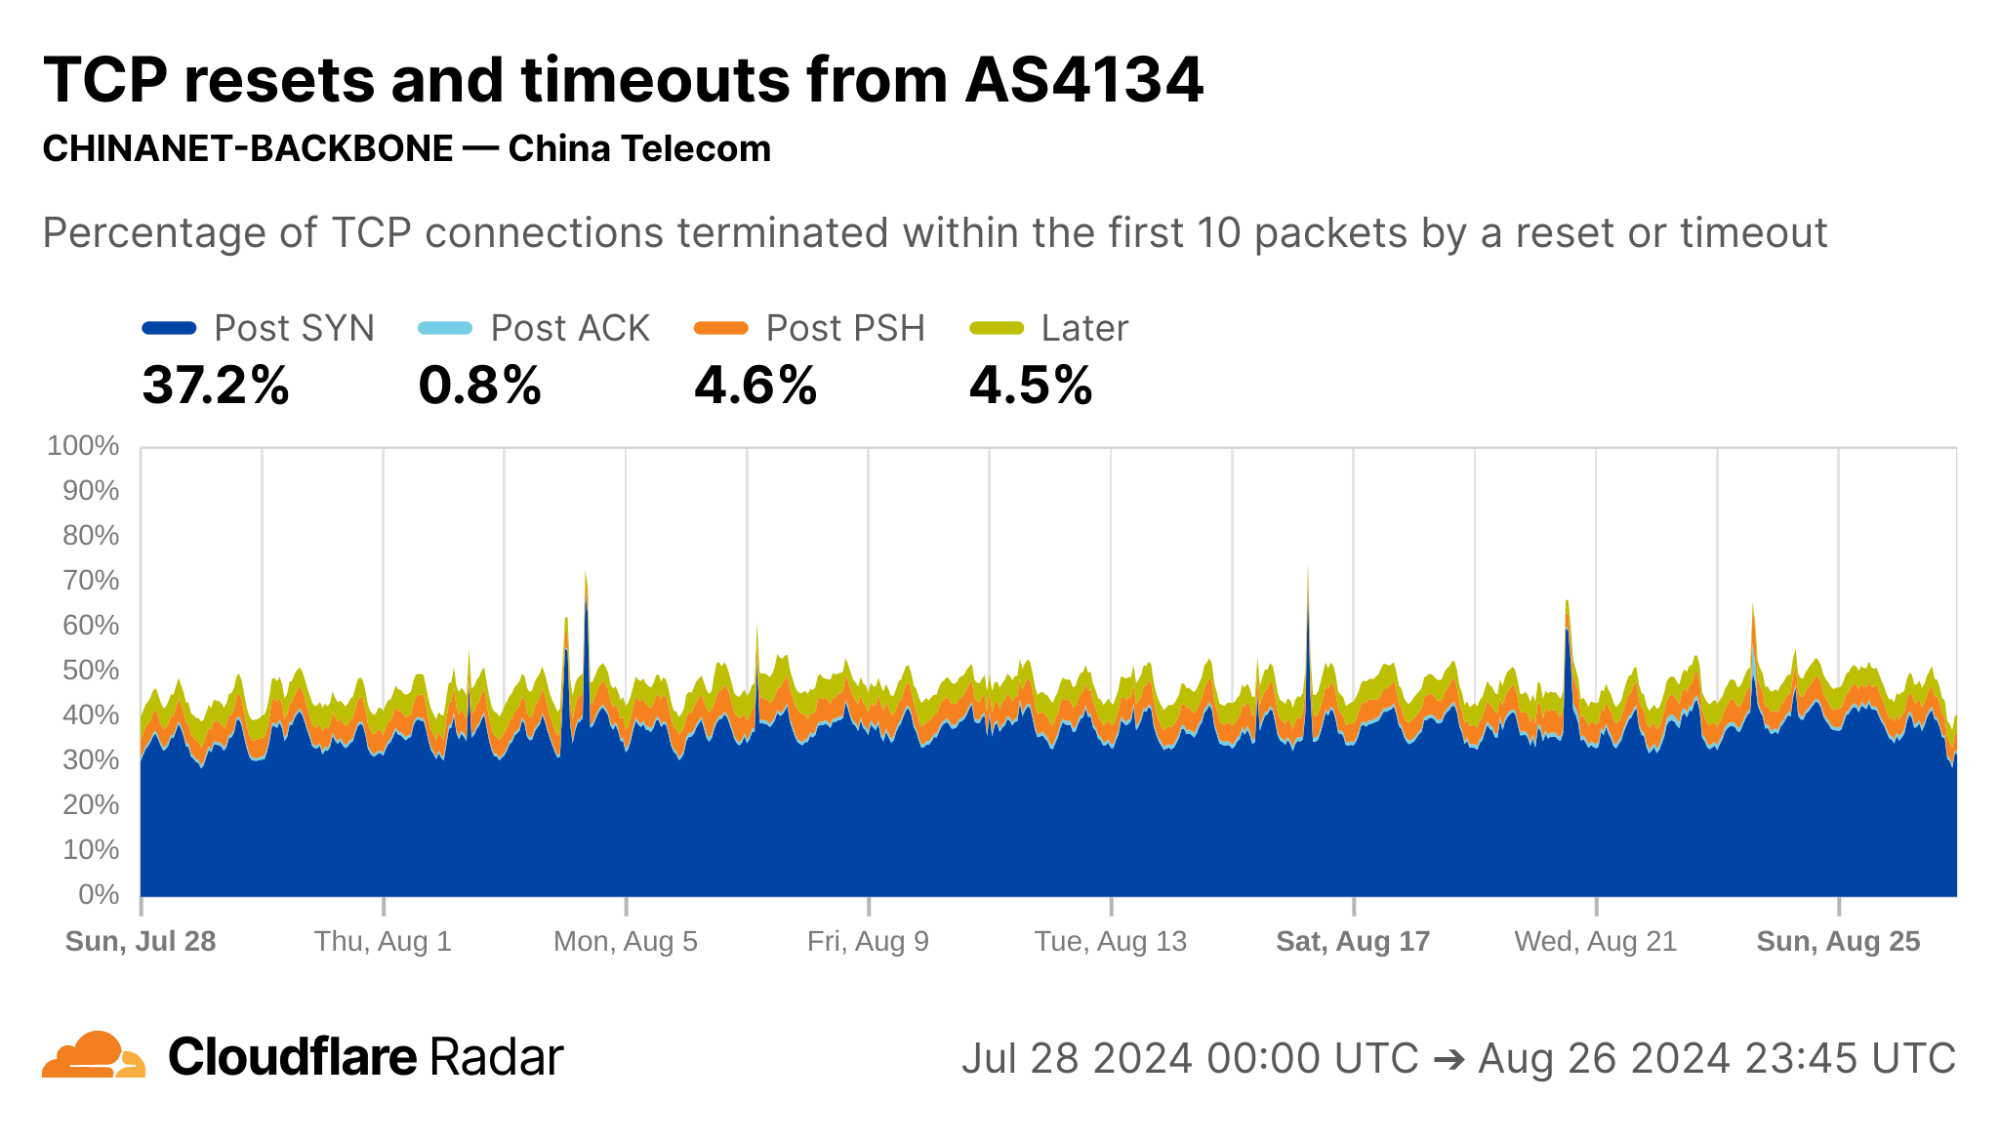
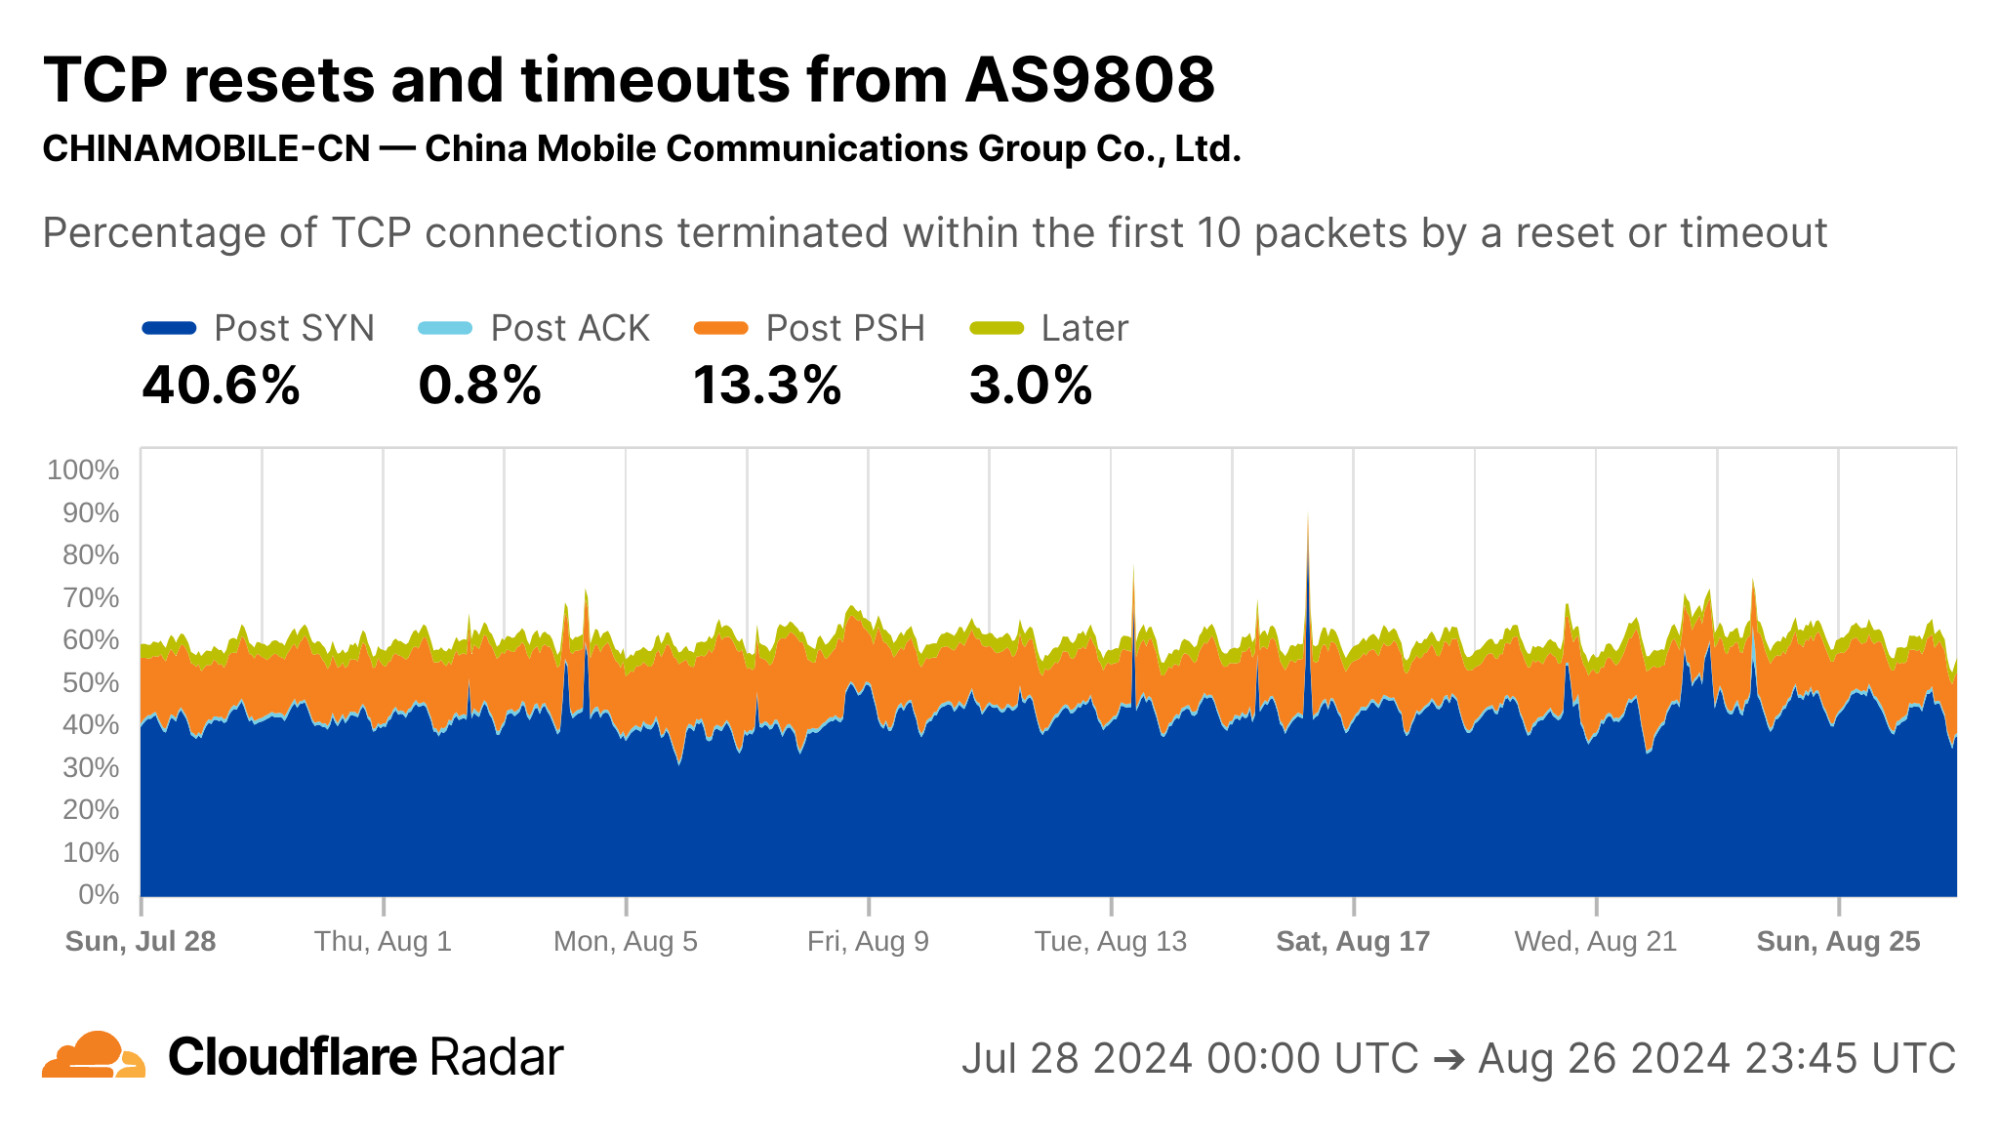
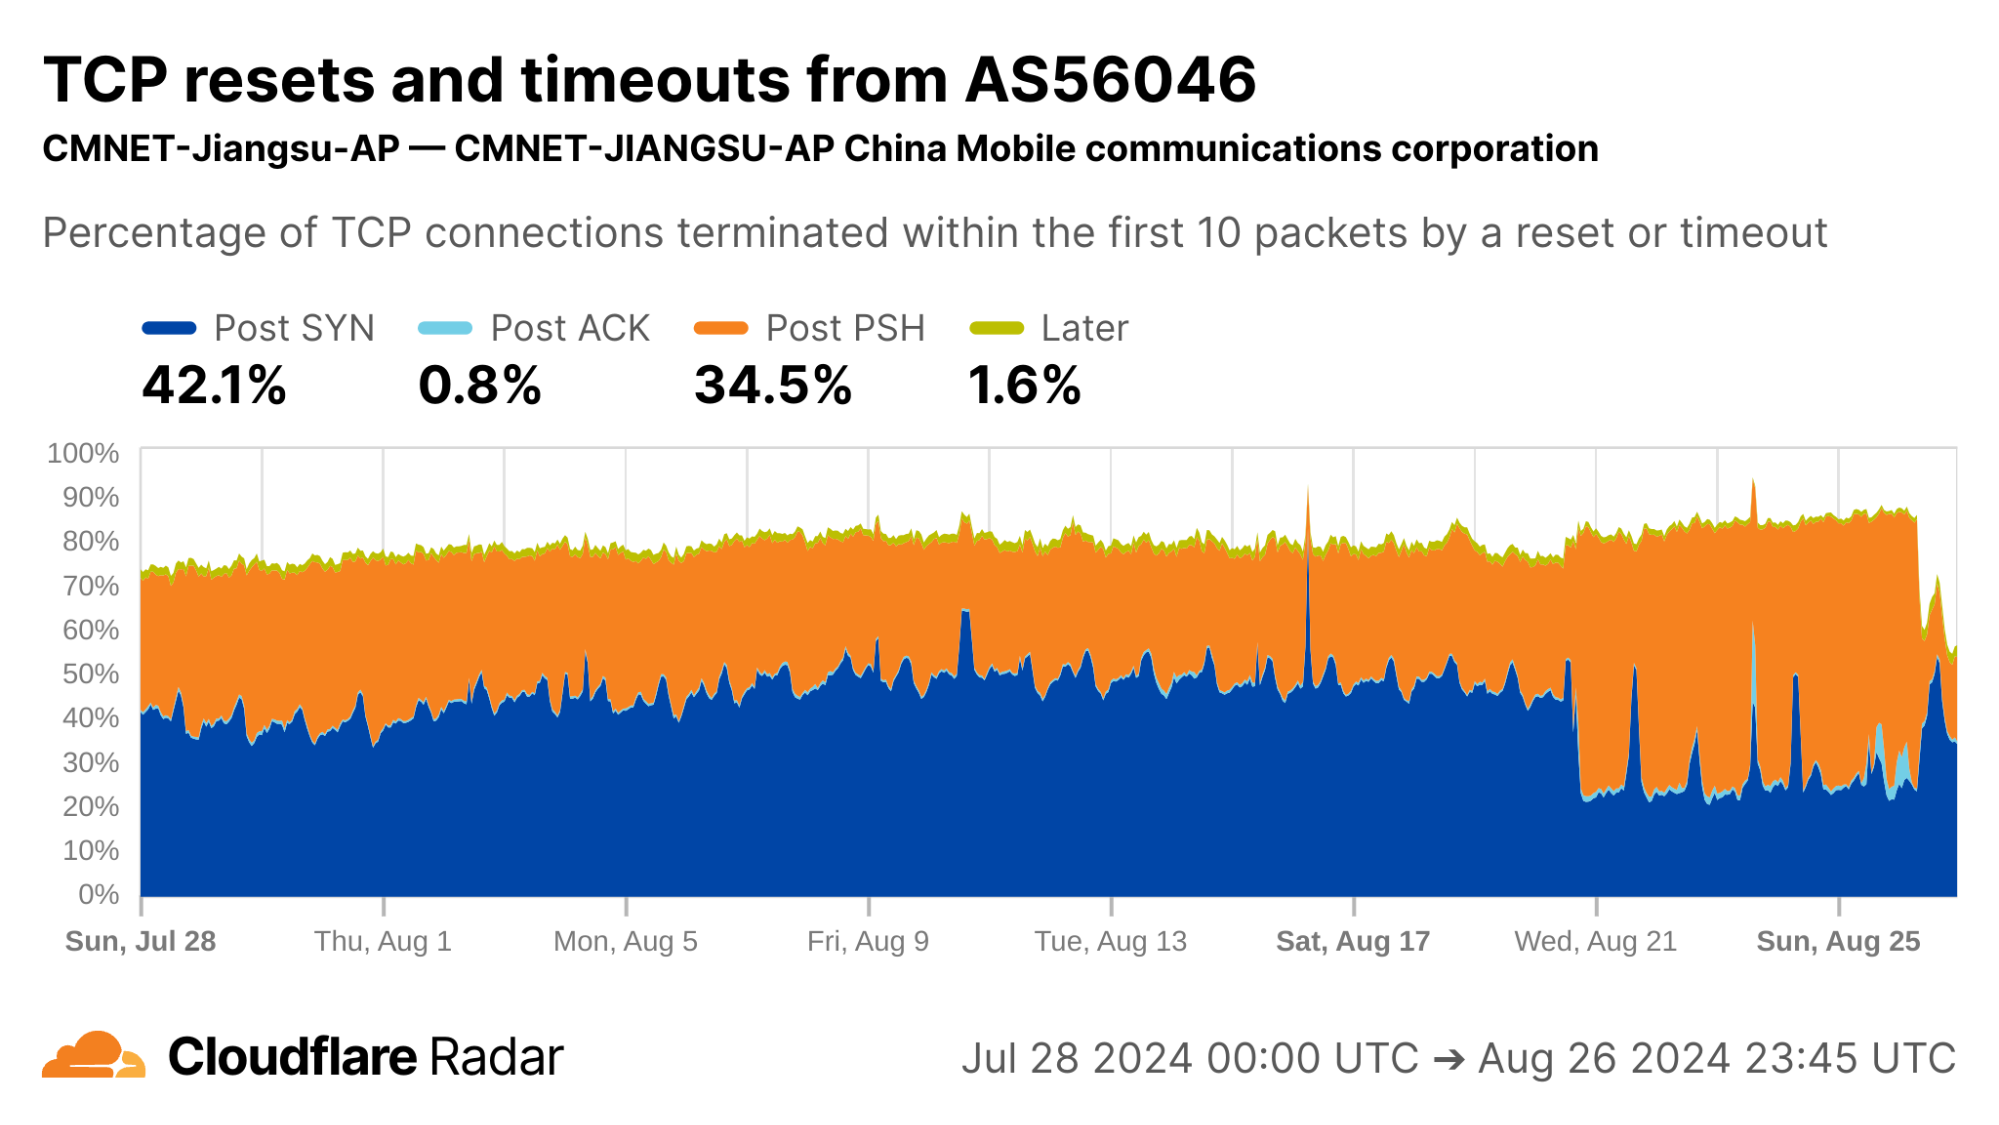
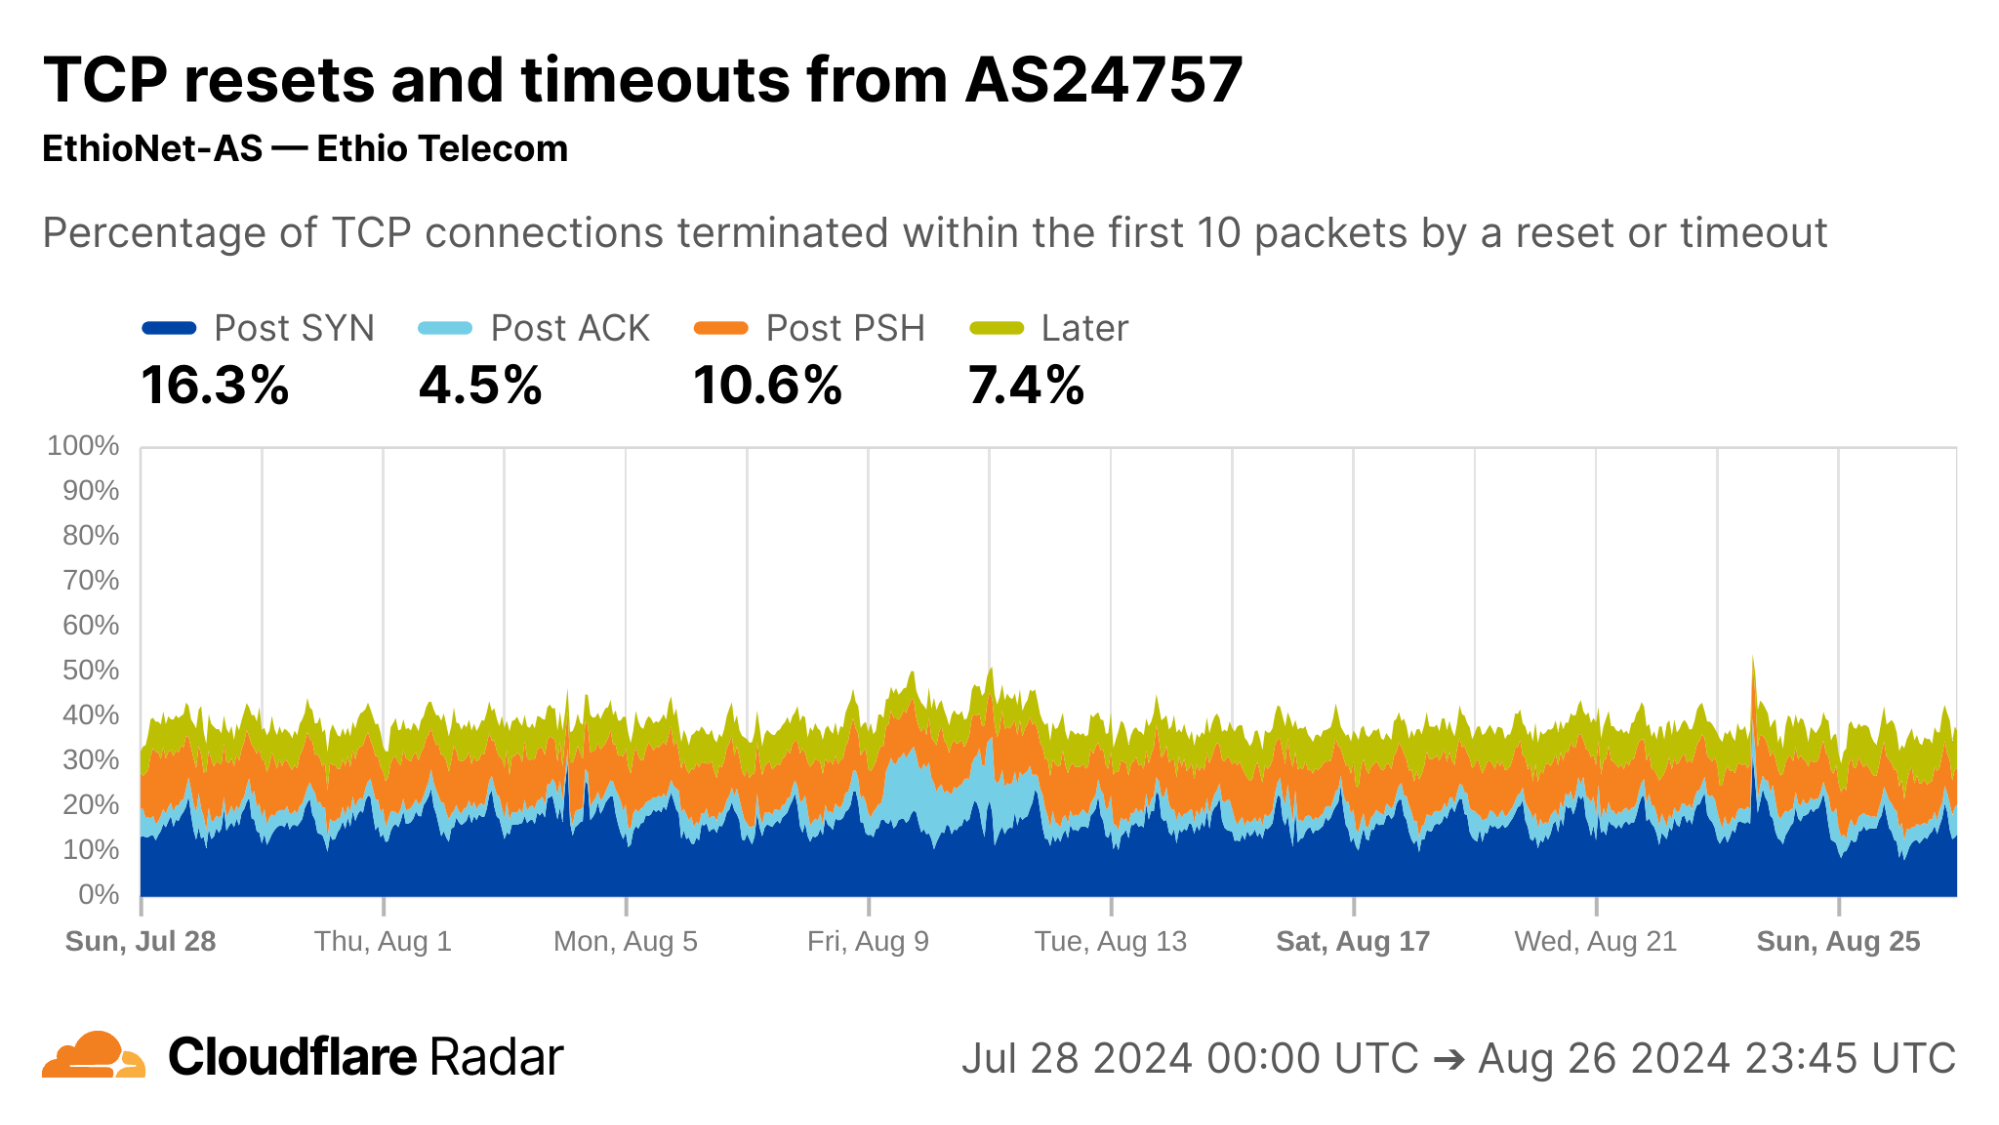
As an example, the reset injection technique is known and commonly associated with the so-called Great Firewall of China (GFW). Indeed, looking at Post-PSH anomalies in connections originating from IPs geolocated to China, we see higher rates than the worldwide average. However, looking at individual networks in China, the Post-PSH rates vary widely, perhaps due to the types of traffic carried or different implementations of the technique. In contrast, rates of Post-SYN anomalies are consistently high across most major Chinese ASes; this may be scanners, spoofed SYN flood attacks, or residualblocking with collateral impact.
See our deep-dive blog post for more information about connection tampering.
Sourcing new insights and targets for followup study
TCP resets and timeouts dataset may also be a source for identifying new or previously understudied network behaviors, by helping to find networks that “stick out” and merit further investigation.
Unattributable ZMap scanning
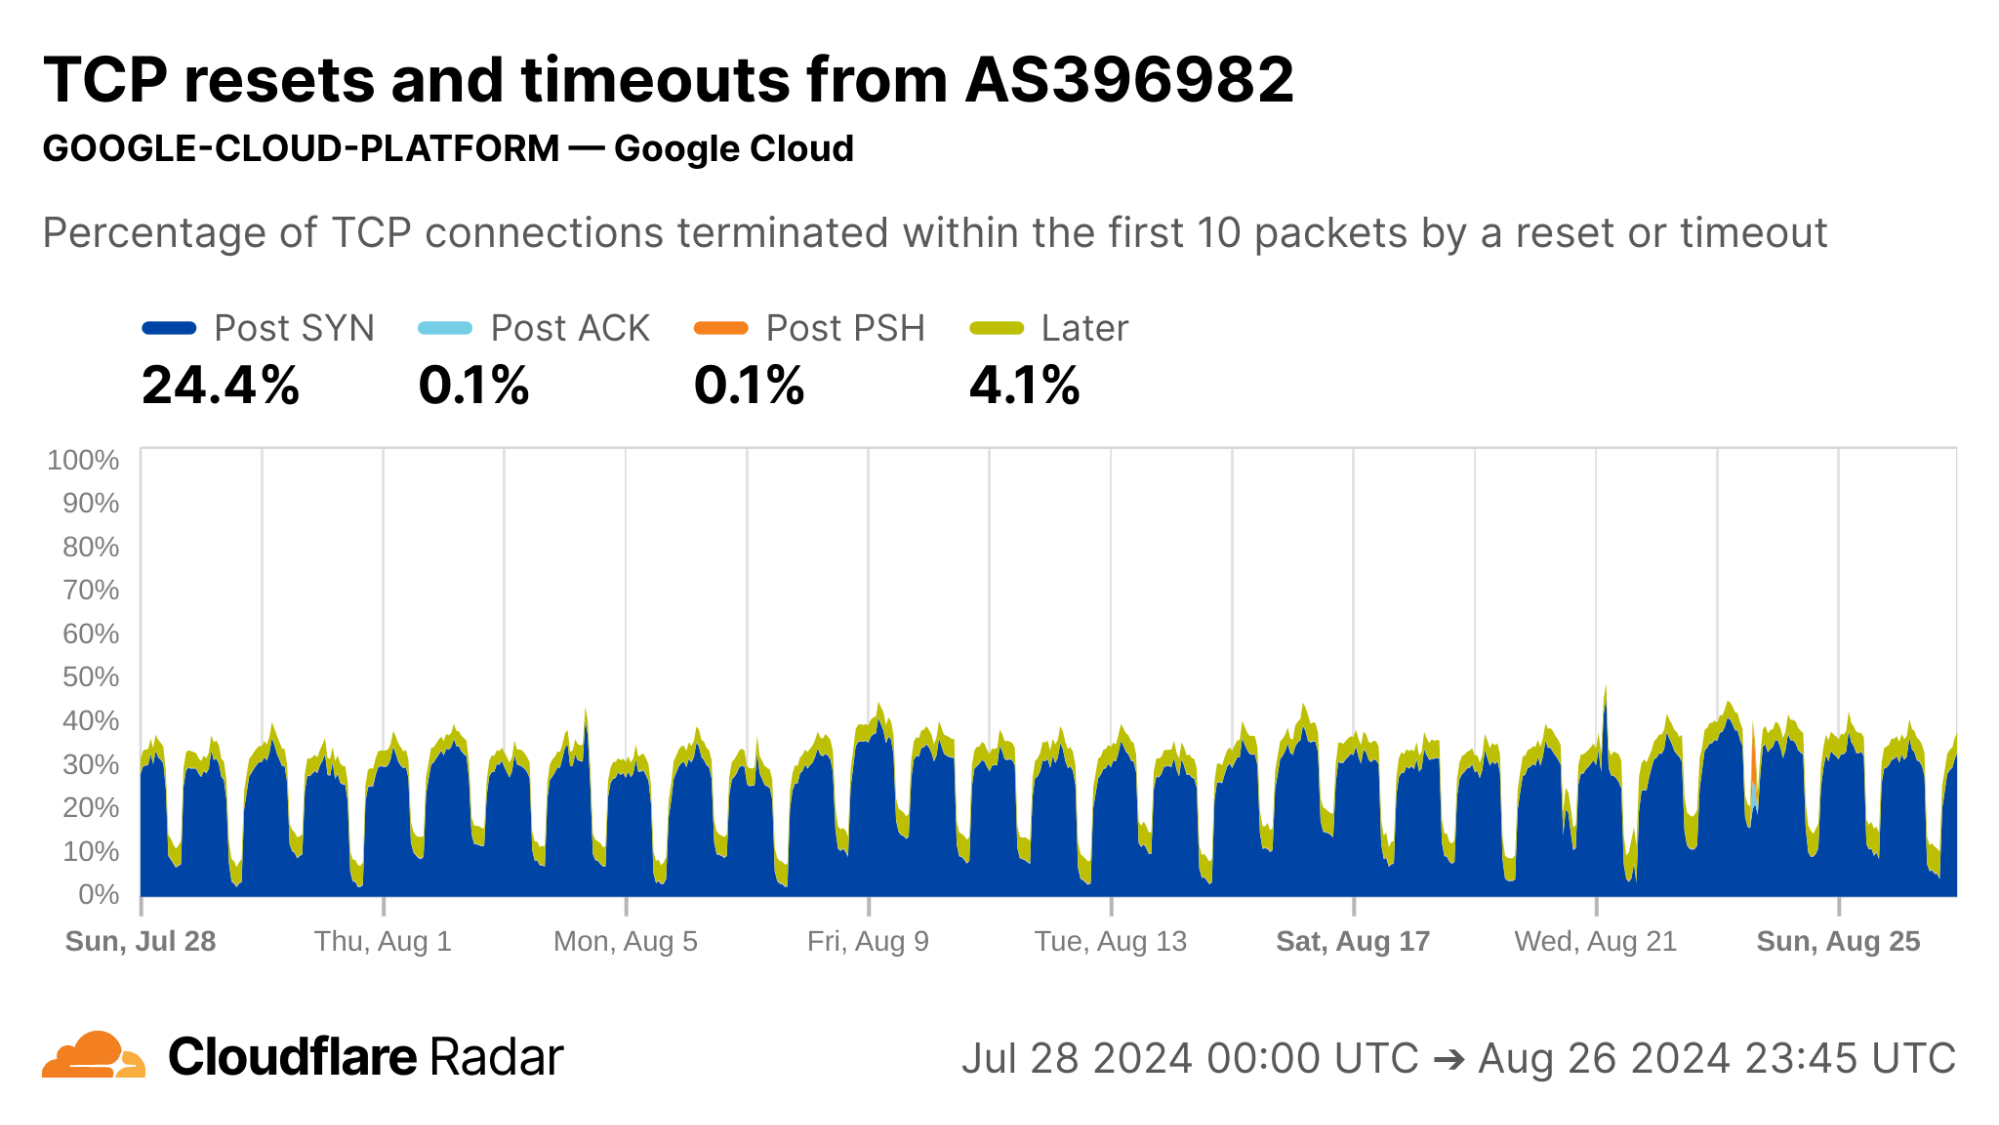
Here is one we’re unable to explain: Every day during the same 18-hour interval, over 10% of connections from UK clients never progress past the initial SYN packets, and just time out.
Internal inspection revealed that almost all of the Post-SYN anomalies come from a scanner using ZMap at AS396982 (GOOGLE-CLOUD-PLATFORM), in what appears to be a full port scan across all IP address ranges. (The ZMap client responsibly self-identifies, based on ZMap’s responsible self-identification as discussed later.) We see a similar level of scan traffic from IP prefixes in AS396982 geolocated to the United States.
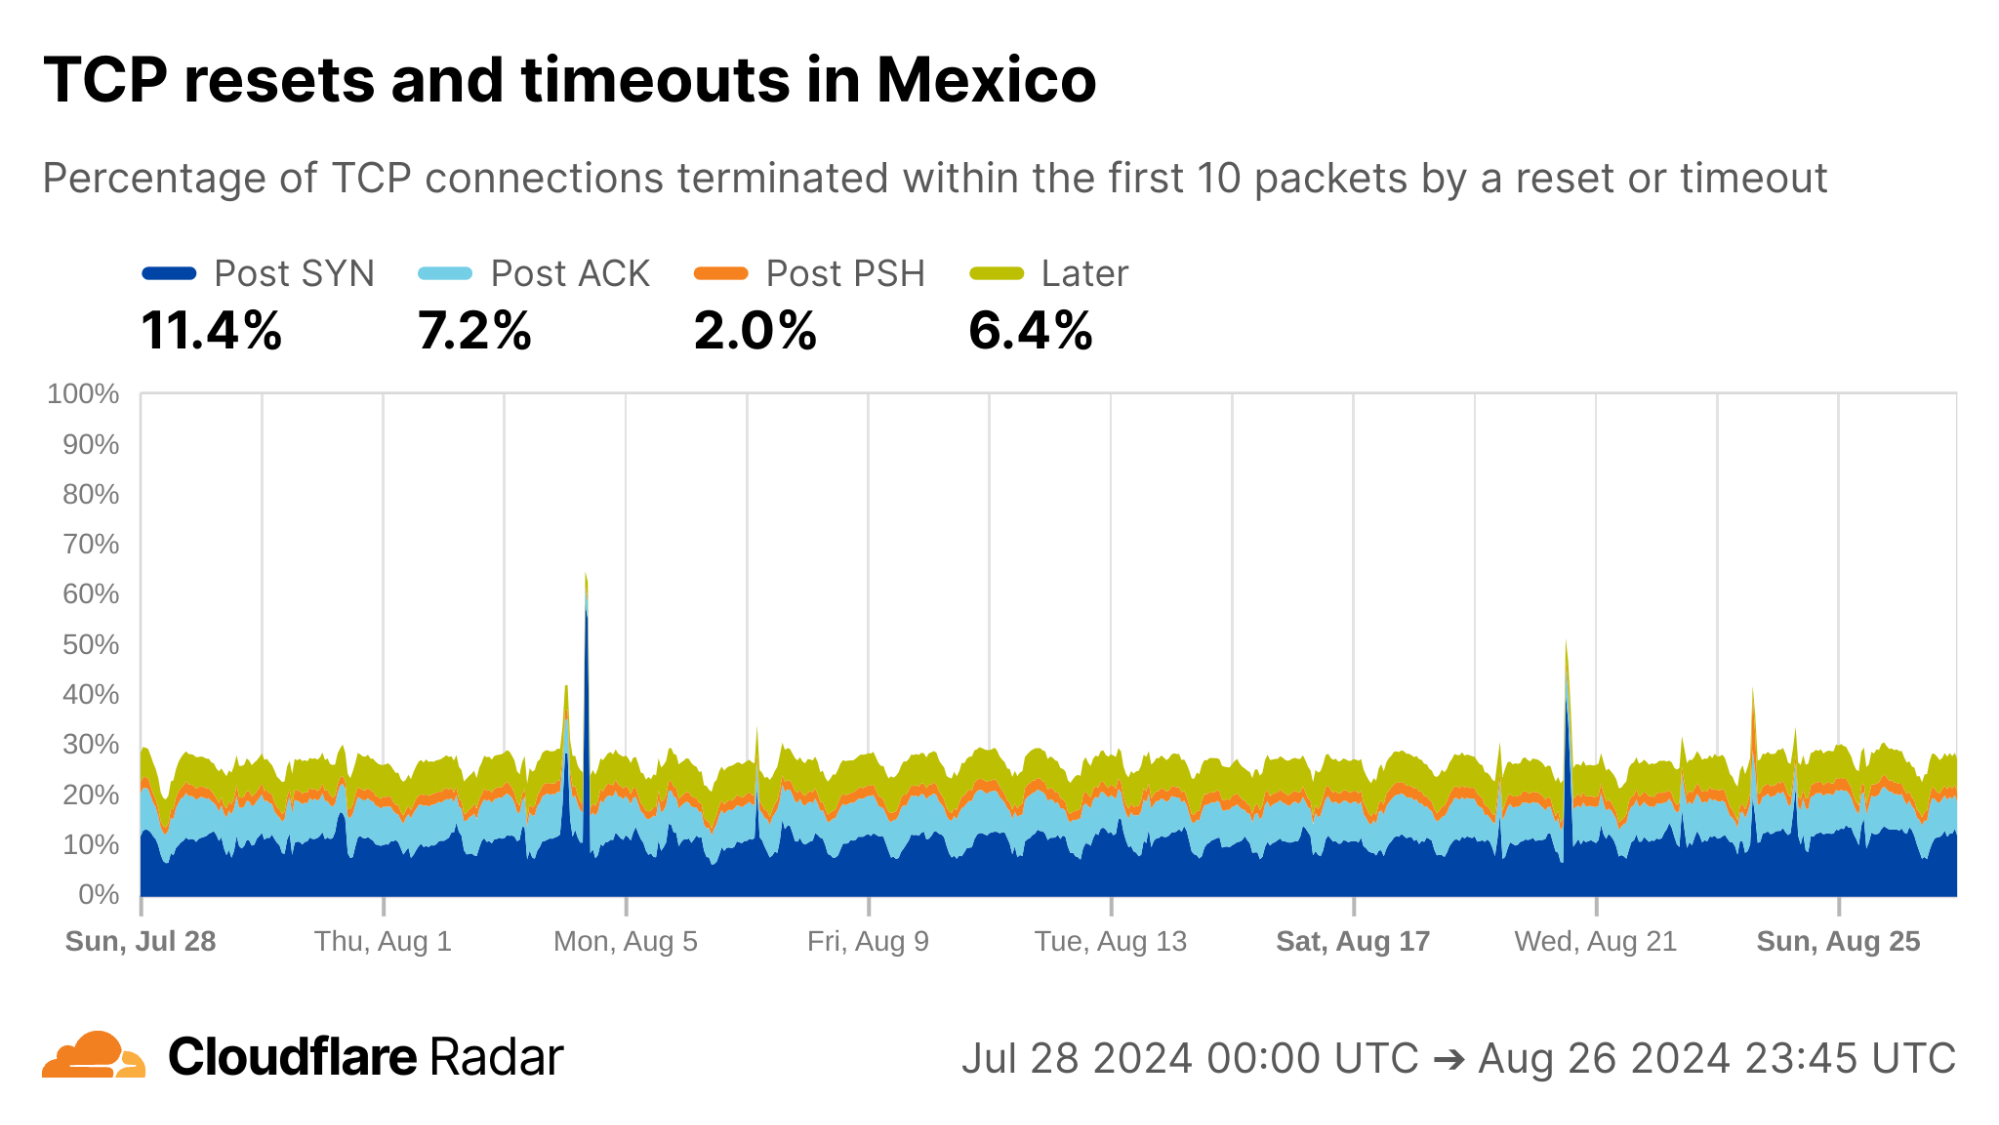
A cursory look at anomaly rates at the country level reveals some interesting findings. For instance, looking at connections from Mexico, the rates of Post-ACK and Post-PSH anomalies often associated with connection tampering are higher than the global average. The profile for Mexico connections is also similar to others in the region. However, Mexico is a country with “no documented evidence that the government or other actors block or filter internet content.”
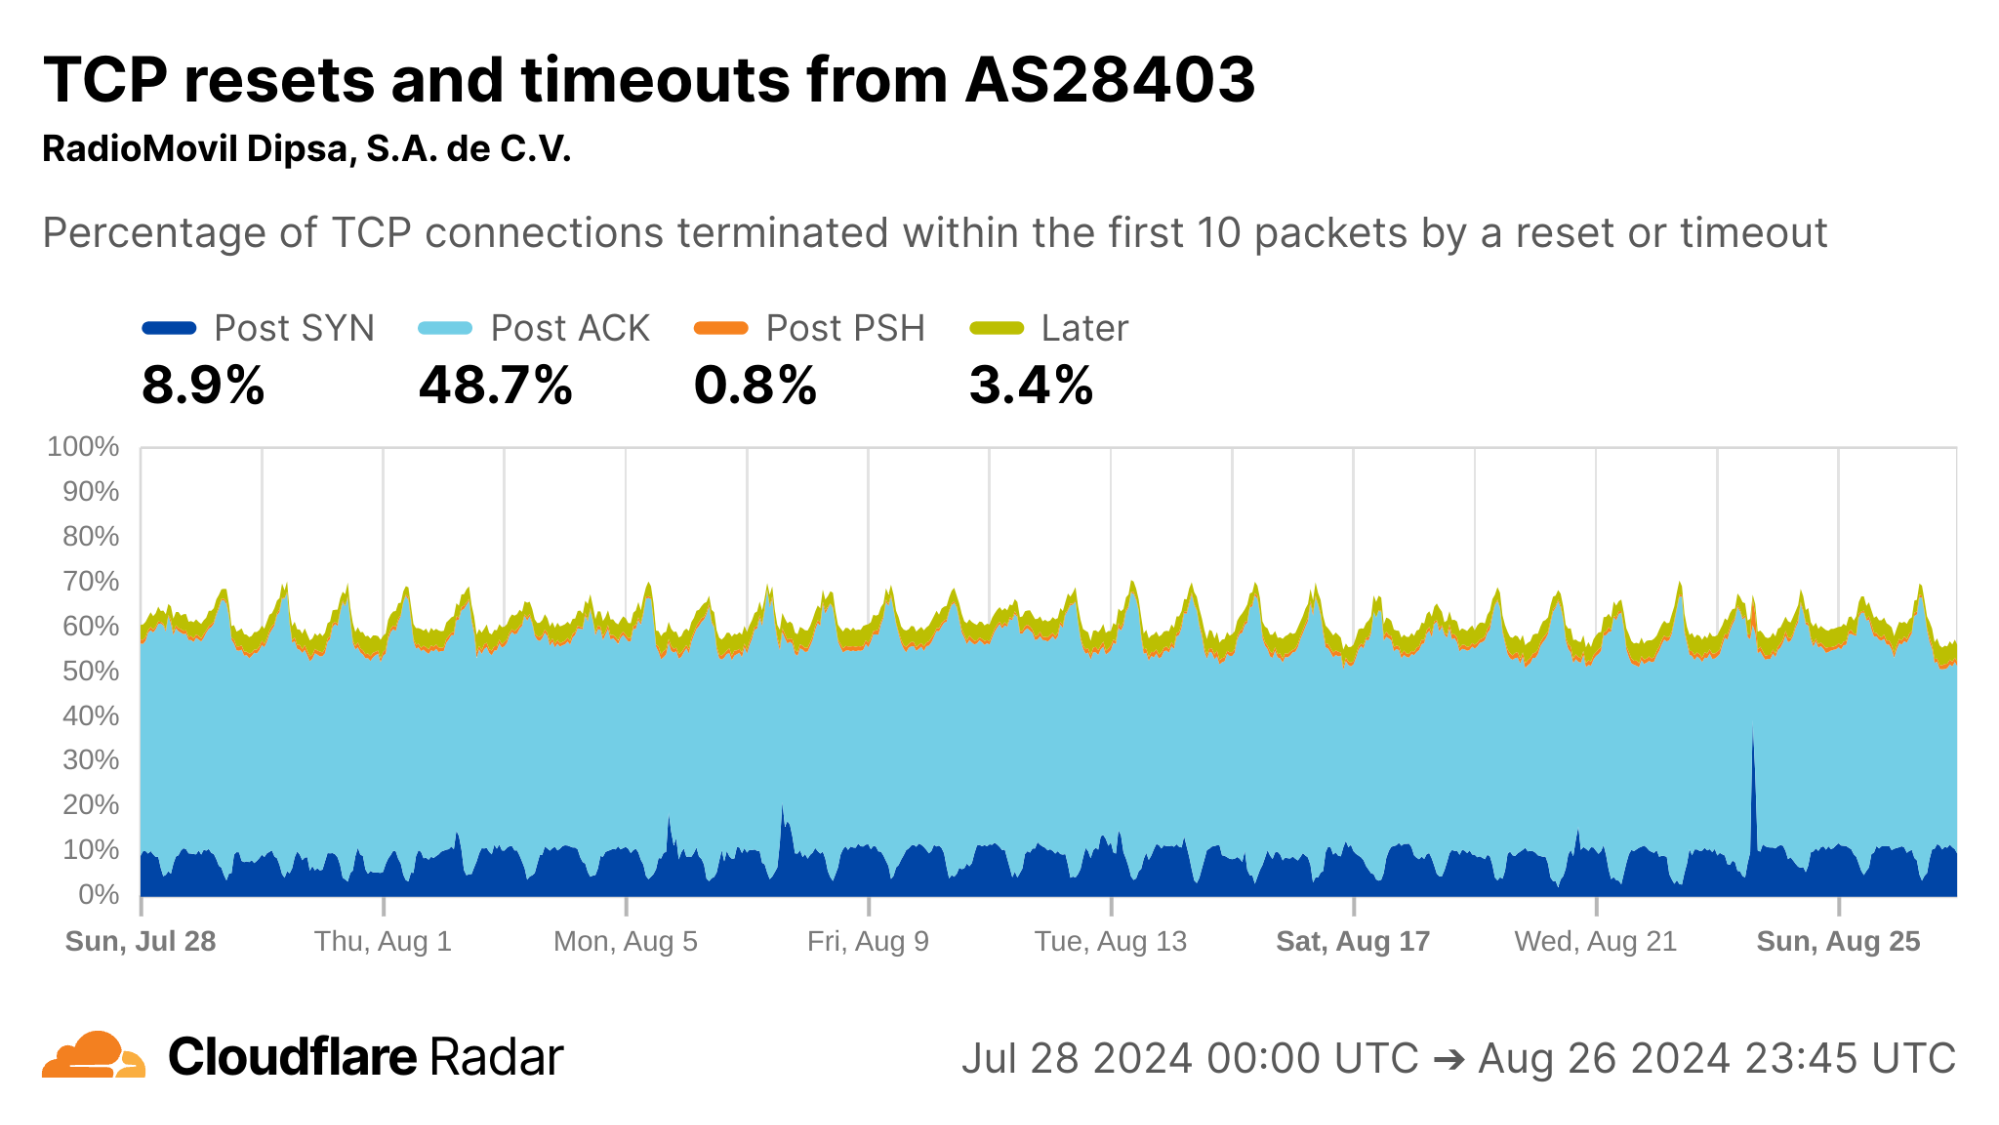
Looking at each of the top ASes by HTTP traffic volume in Mexico, we find that close to 50% of connections from AS28403 (RadioMovil Dipsa, S.A. de C.V., operating as Telcel) are terminated via a reset or timeout directly after the completion of the TCP handshake (Post-ACK connection stage). In this stage, it’s possible a middlebox has seen and dropped a data packet before it gets to Cloudflare.
One explanation for this behavior may be zero-rating, in which a cellular network provider allows access to certain resources (such as messaging or social media apps) at no cost. When users exceed their data transfer limits on their account, the provider might still allow traffic to zero-rated destinations while blocking connections to other resources.
To enforce a zero-rating policy, an ISP might use the TLS Server Name Indication (SNI) to determine whether to block or allow connections. The SNI is sent in a data-containing packet immediately following the TCP handshake. Thus, if an ISP drops the packet containing the SNI, the server would still see the SYN and ACK packets from the client but no subsequent packets, which is consistent with a Post-ACK connection anomaly.
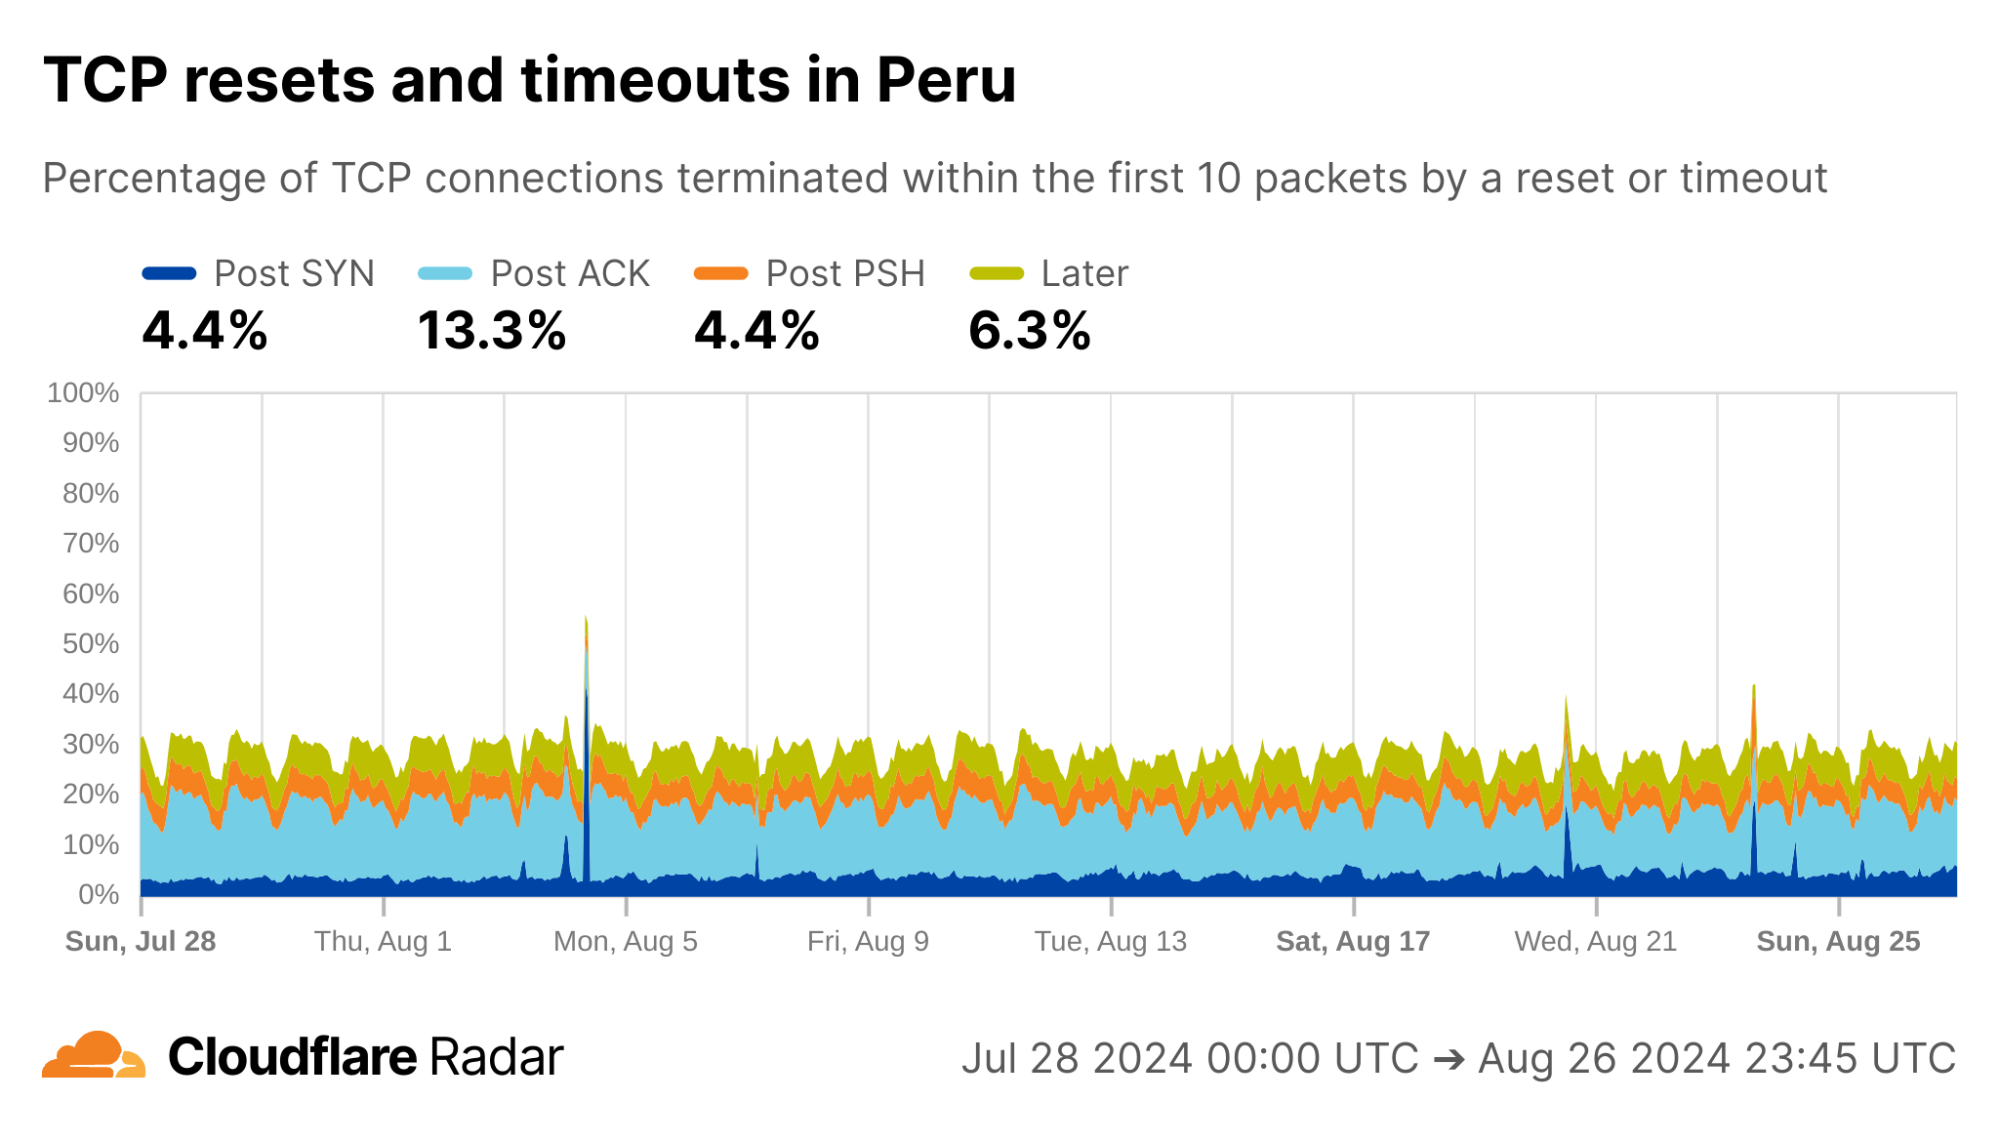
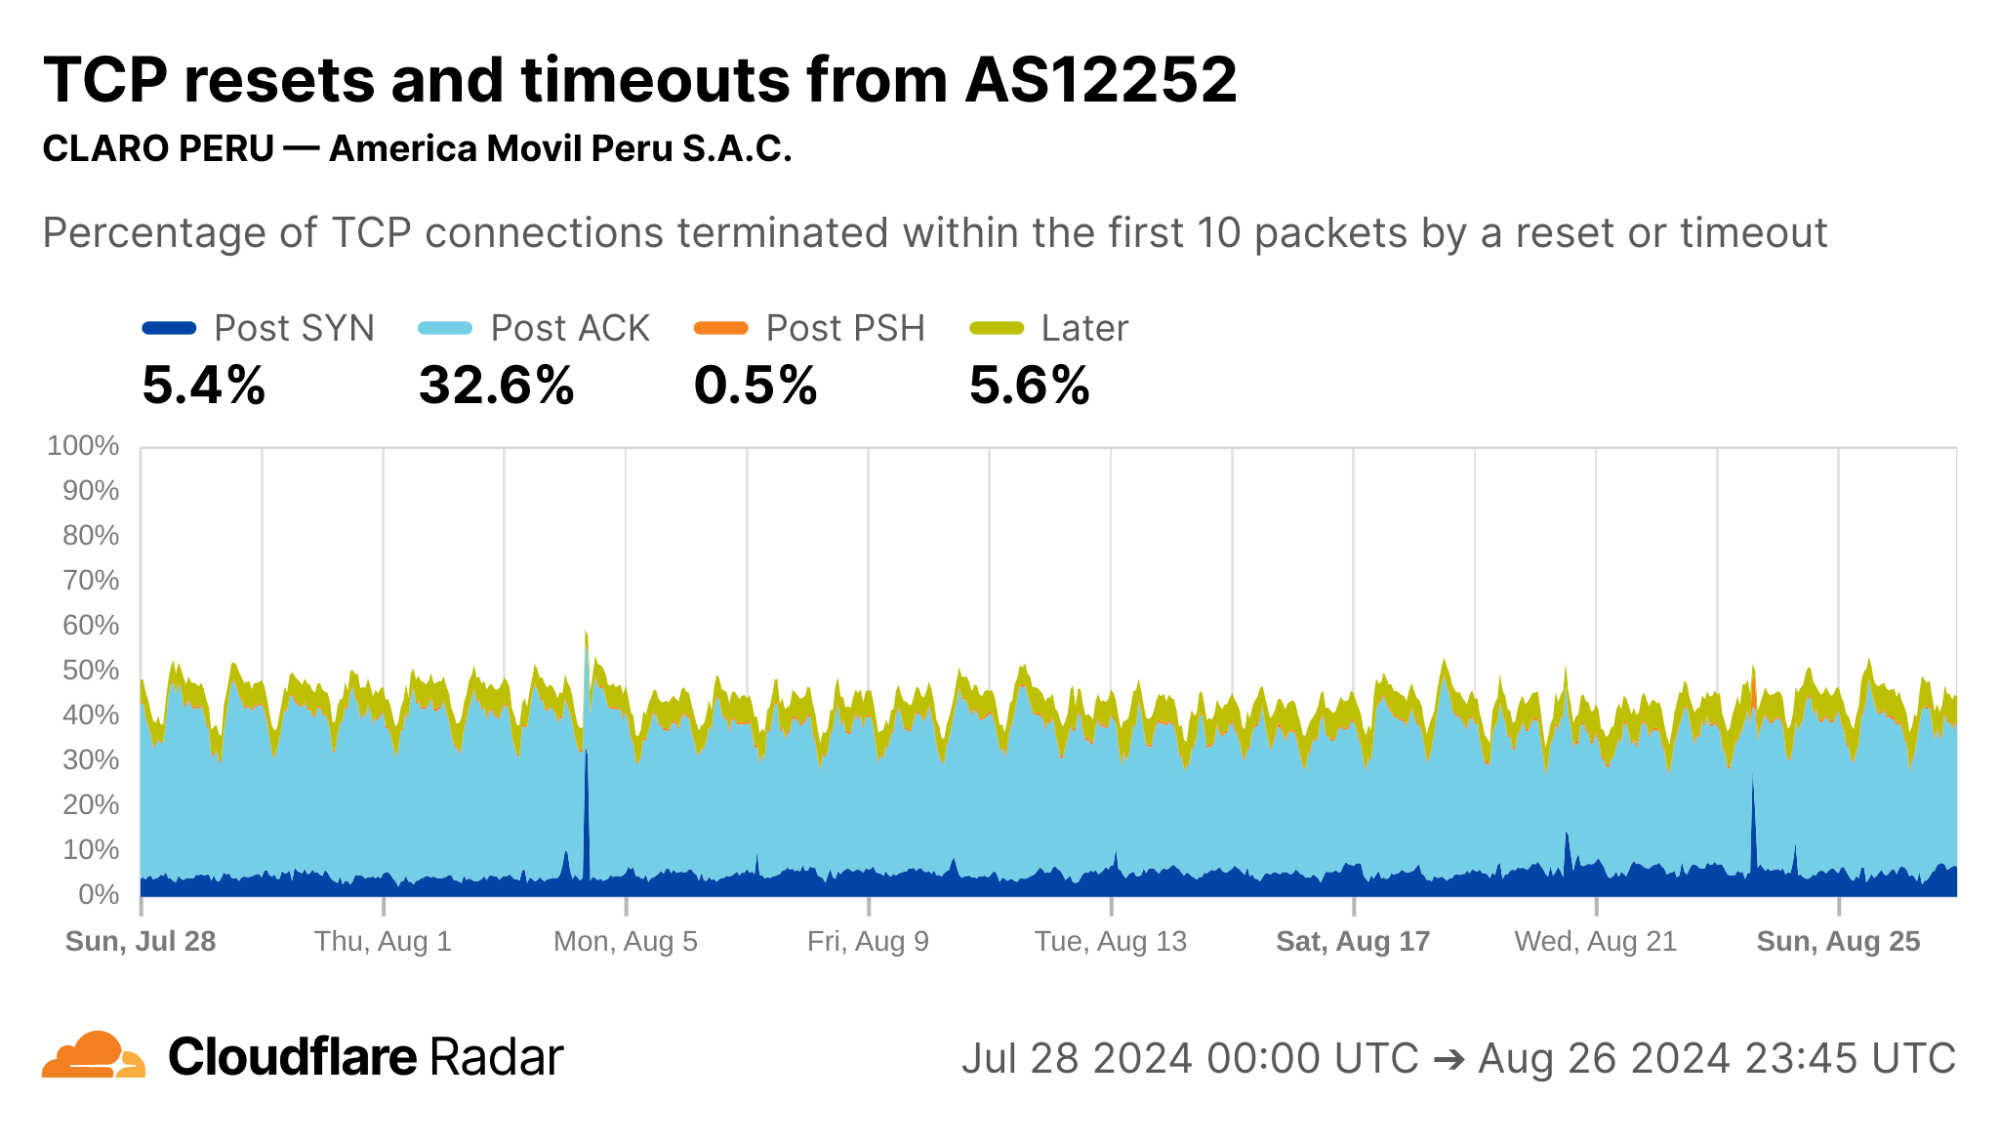
Turning to Peru, another country with a similar profile in the dataset, there are even higher rates of Post-ACK and Post-PSH anomalies compared to Mexico.
Focusing on specific ASes, we see that AS12252 (Claro Peru) shows high rates of Post-ACK anomalies similar to AS28403 in Mexico. Both networks are operated by the same parent company, América Móvil, so one might expect similar network policies and network management techniques to be employed.
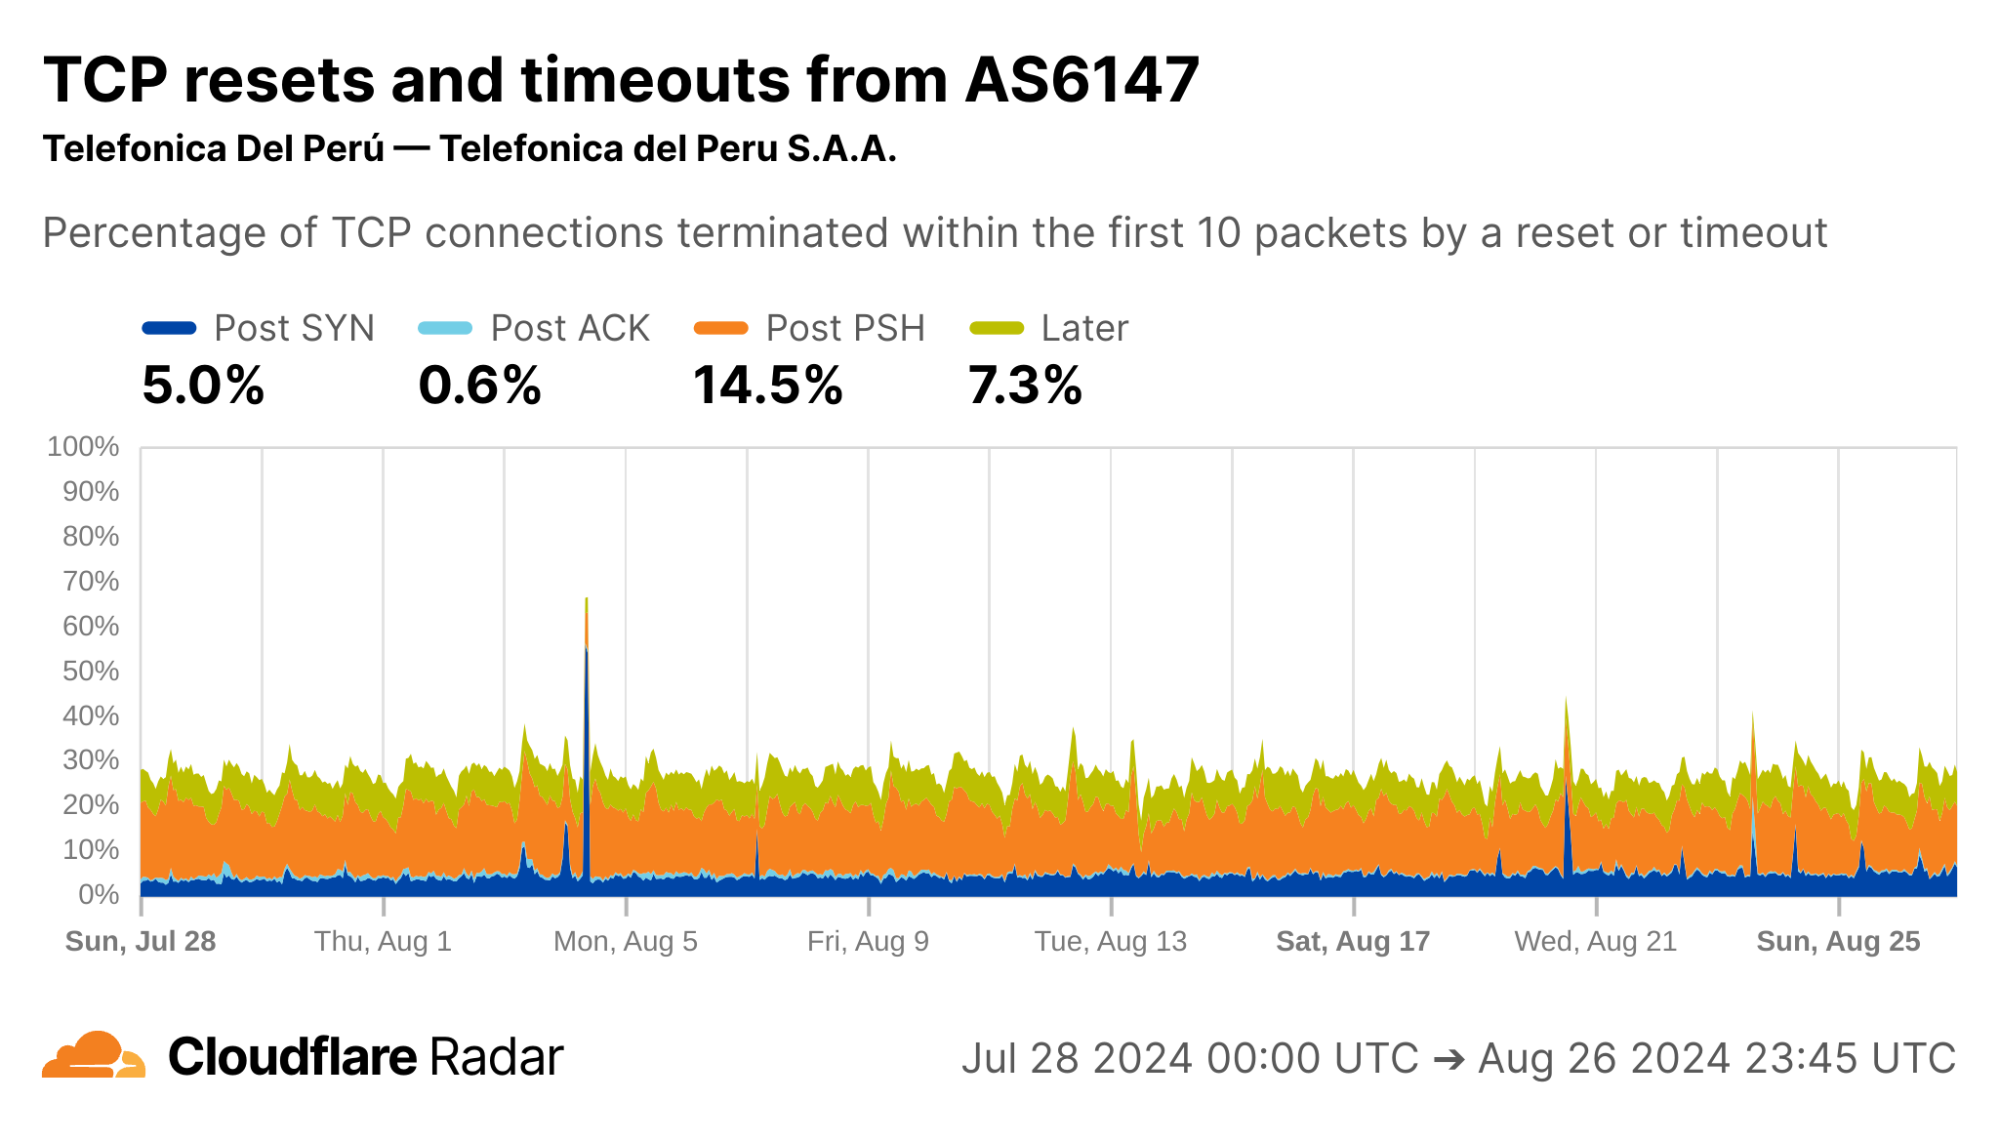
Interestingly, AS6147 (Telefónica Del Perú) instead shows high rates of Post-PSH connection anomalies. This could indicate that this network uses different techniques at the network layer to enforce its policies.
One of the most powerful aspects of our continuous passive measurement is the ability to measure networks over longer periods of time.
Internet shutdowns
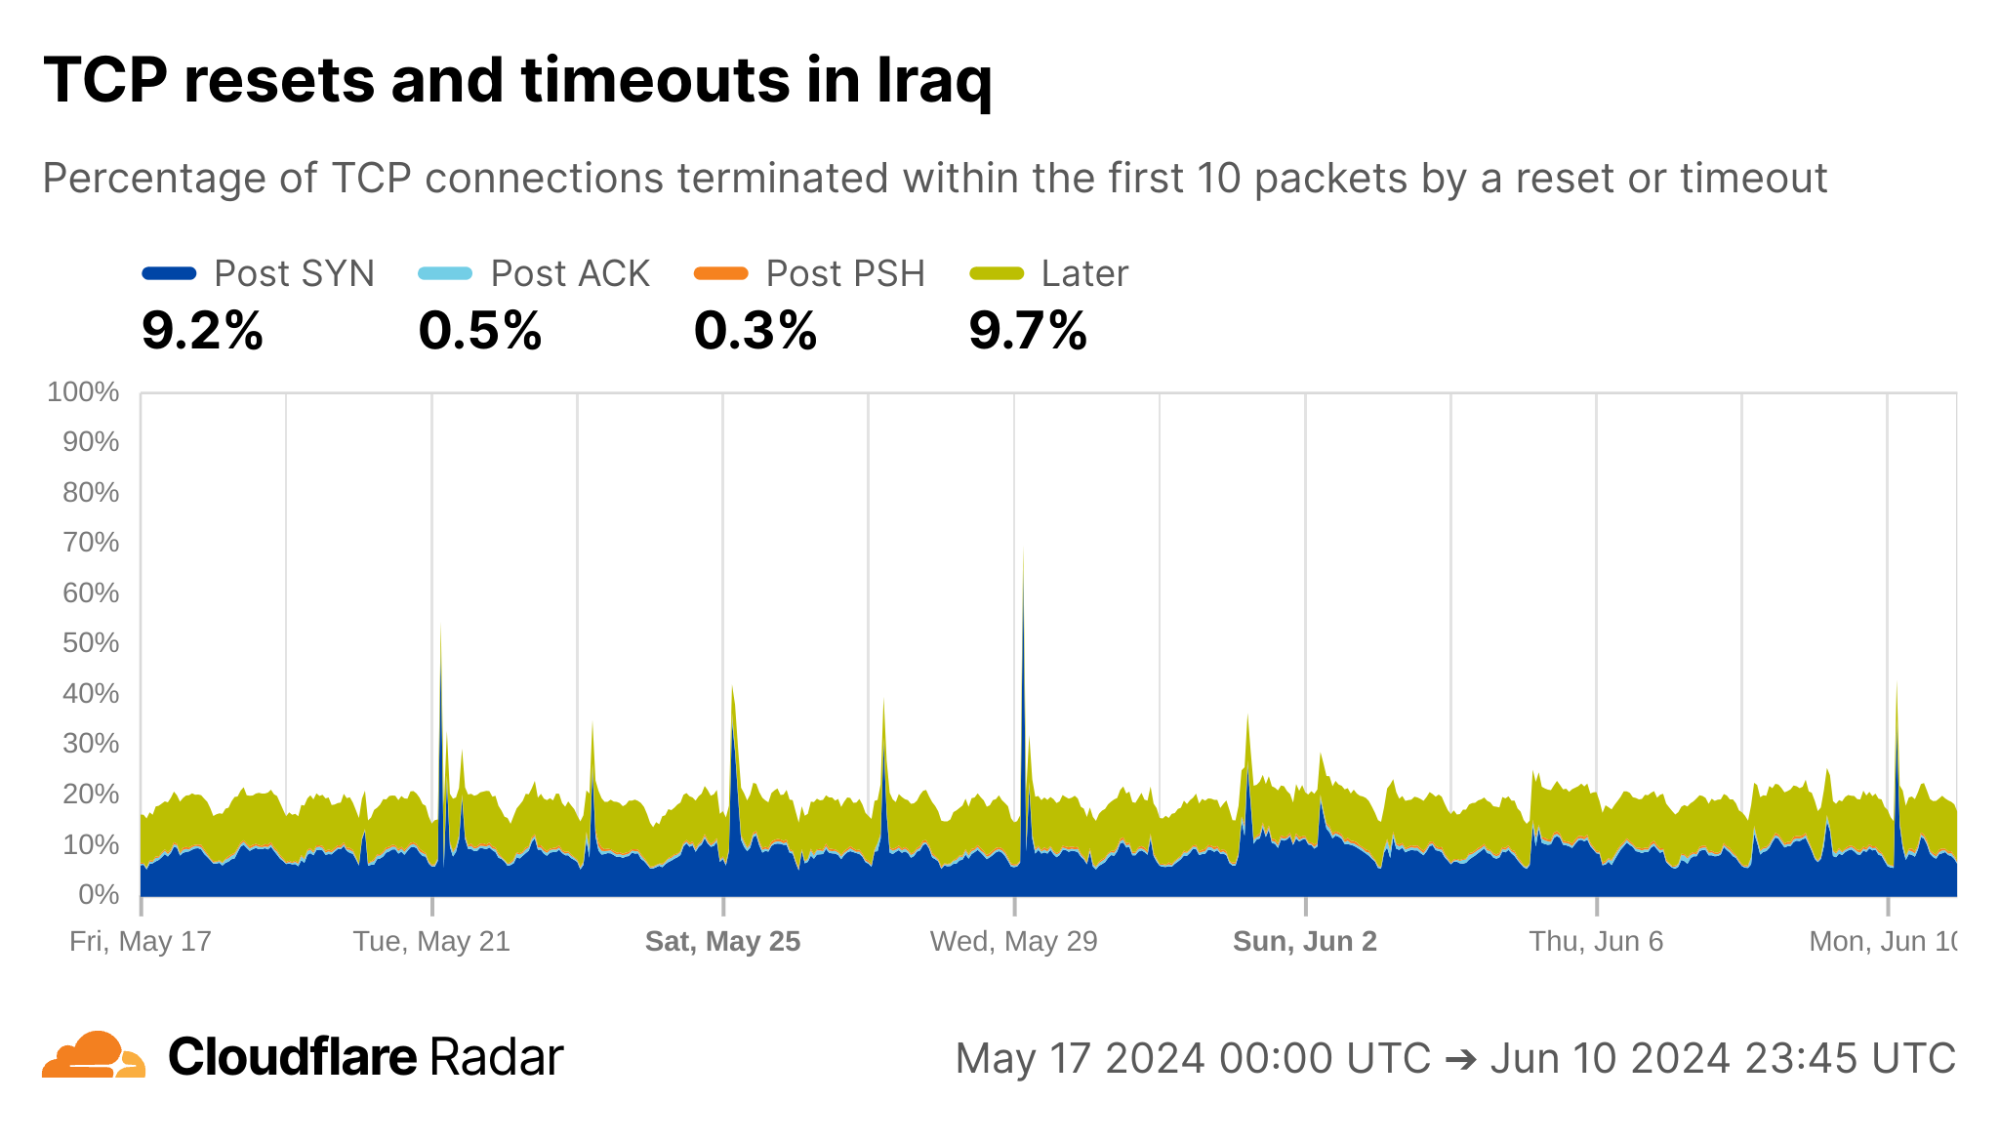
In our June 2024 blog post “Examining recent Internet shutdowns in Syria, Iraq, and Algeria”, we shared the view of exam-related nationwide Internet shutdowns from the perspective of Cloudflare’s network. At that time we were preparing the TCP resets and timeouts dataset, which was helpful to confirm outside reports and get some insight into the specific techniques used for the shutdowns.
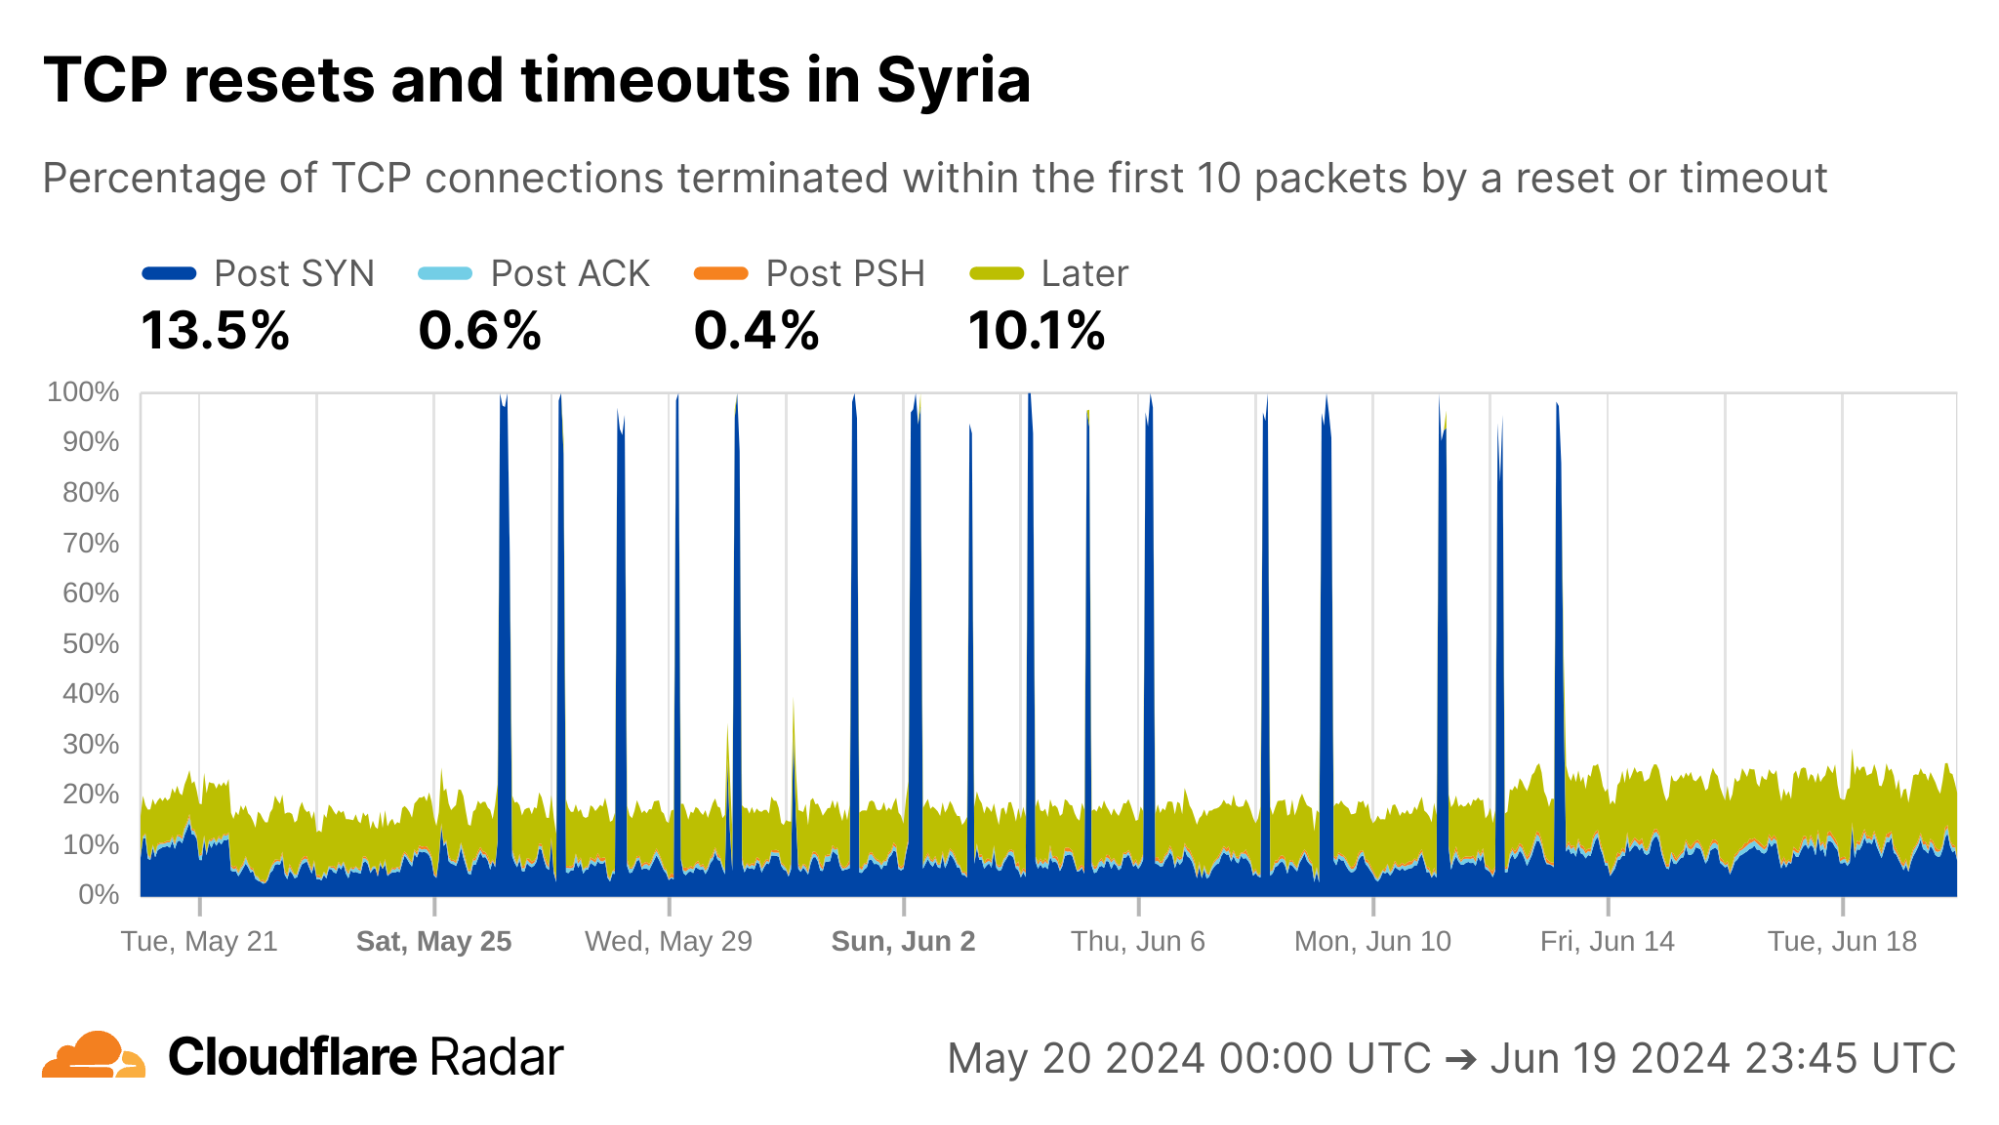
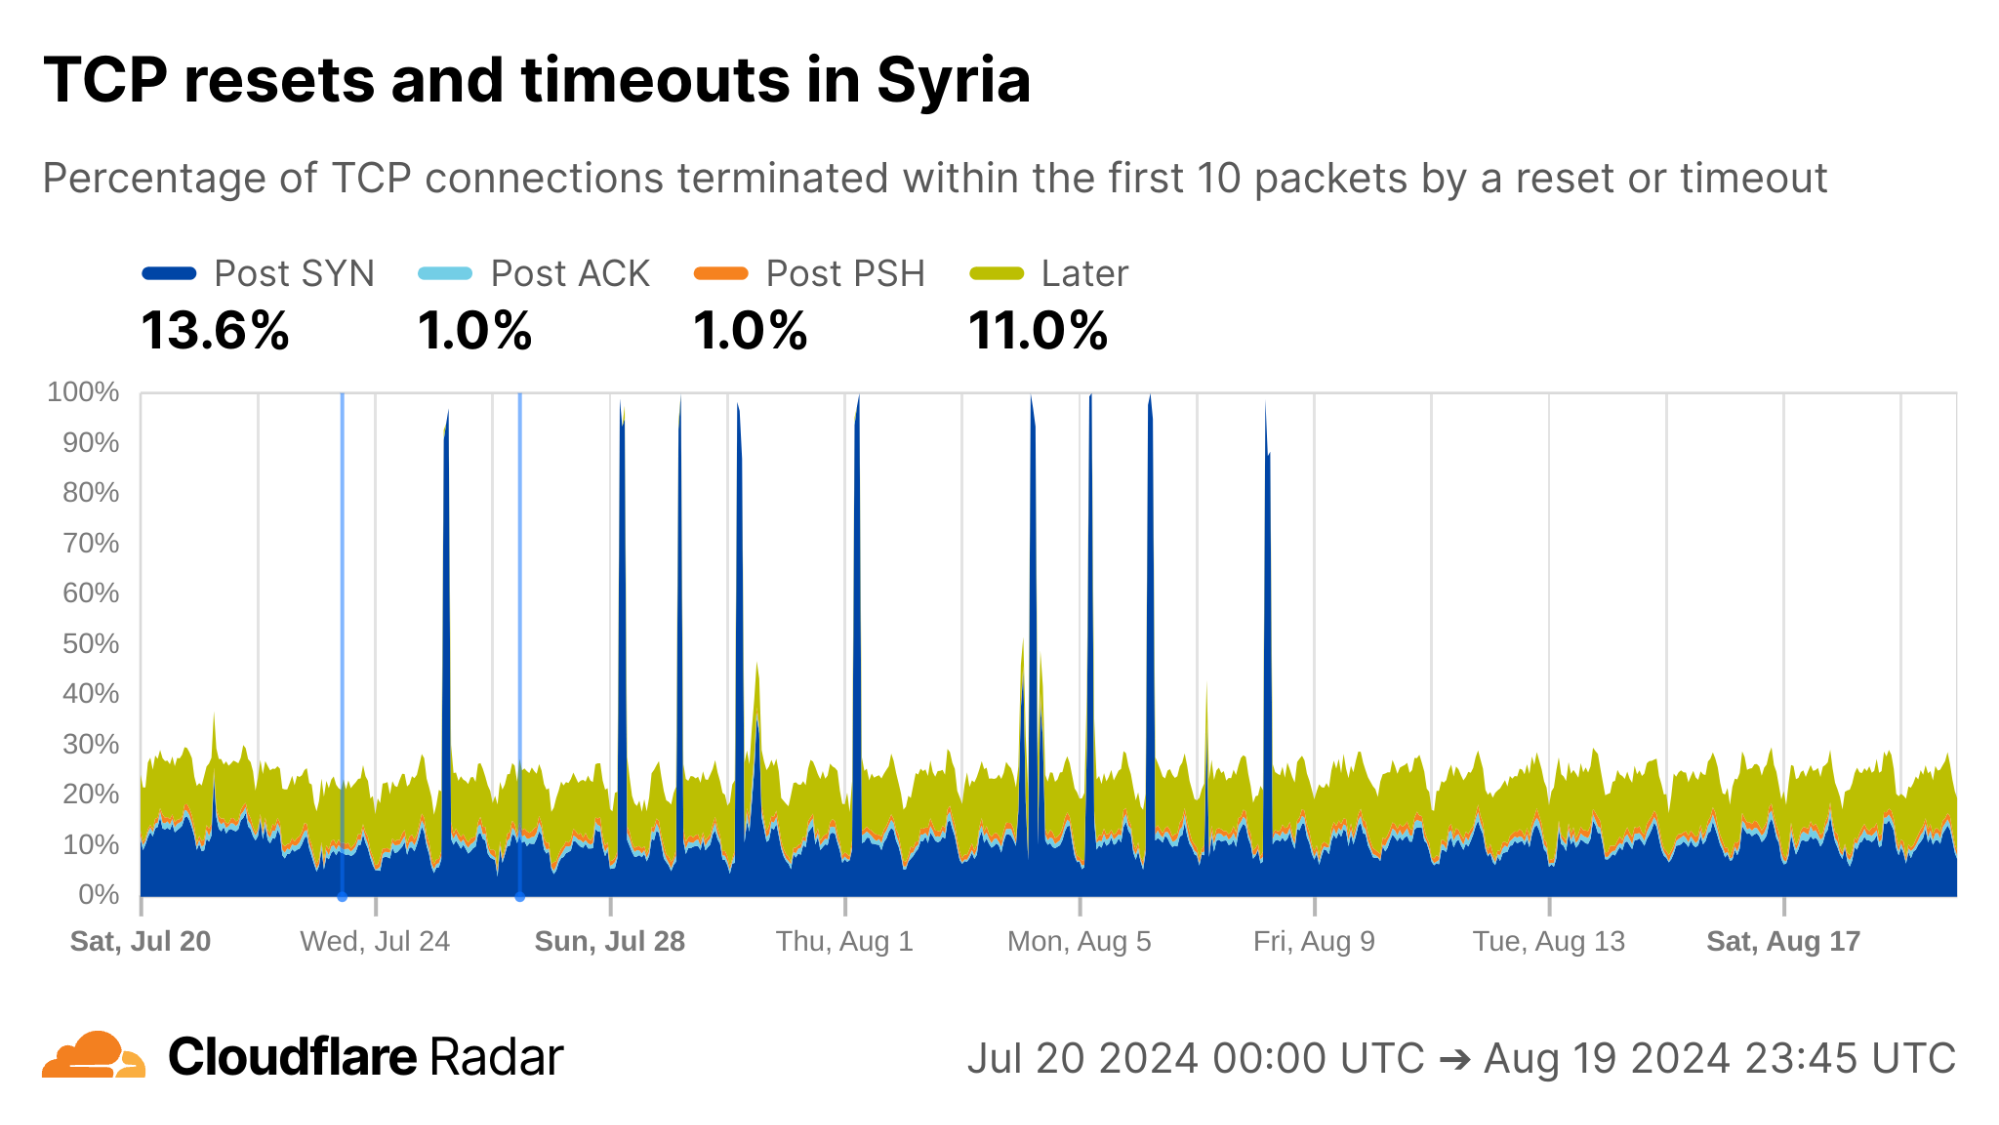
As examples of changing behavior, we can go “back in time” to observe exam-related blocking as it happened. In Syria, during the exam-related shutdowns we see spikes in the rate of Post-SYN anomalies. In reality, we see a near-total drop in traffic (including SYN packets) during these periods.
Looking at connections from Iraq, Cloudflare’s view of exam-related shutdowns appears similar to those in Syria, with multiple Post-SYN spikes, albeit much less pronounced.
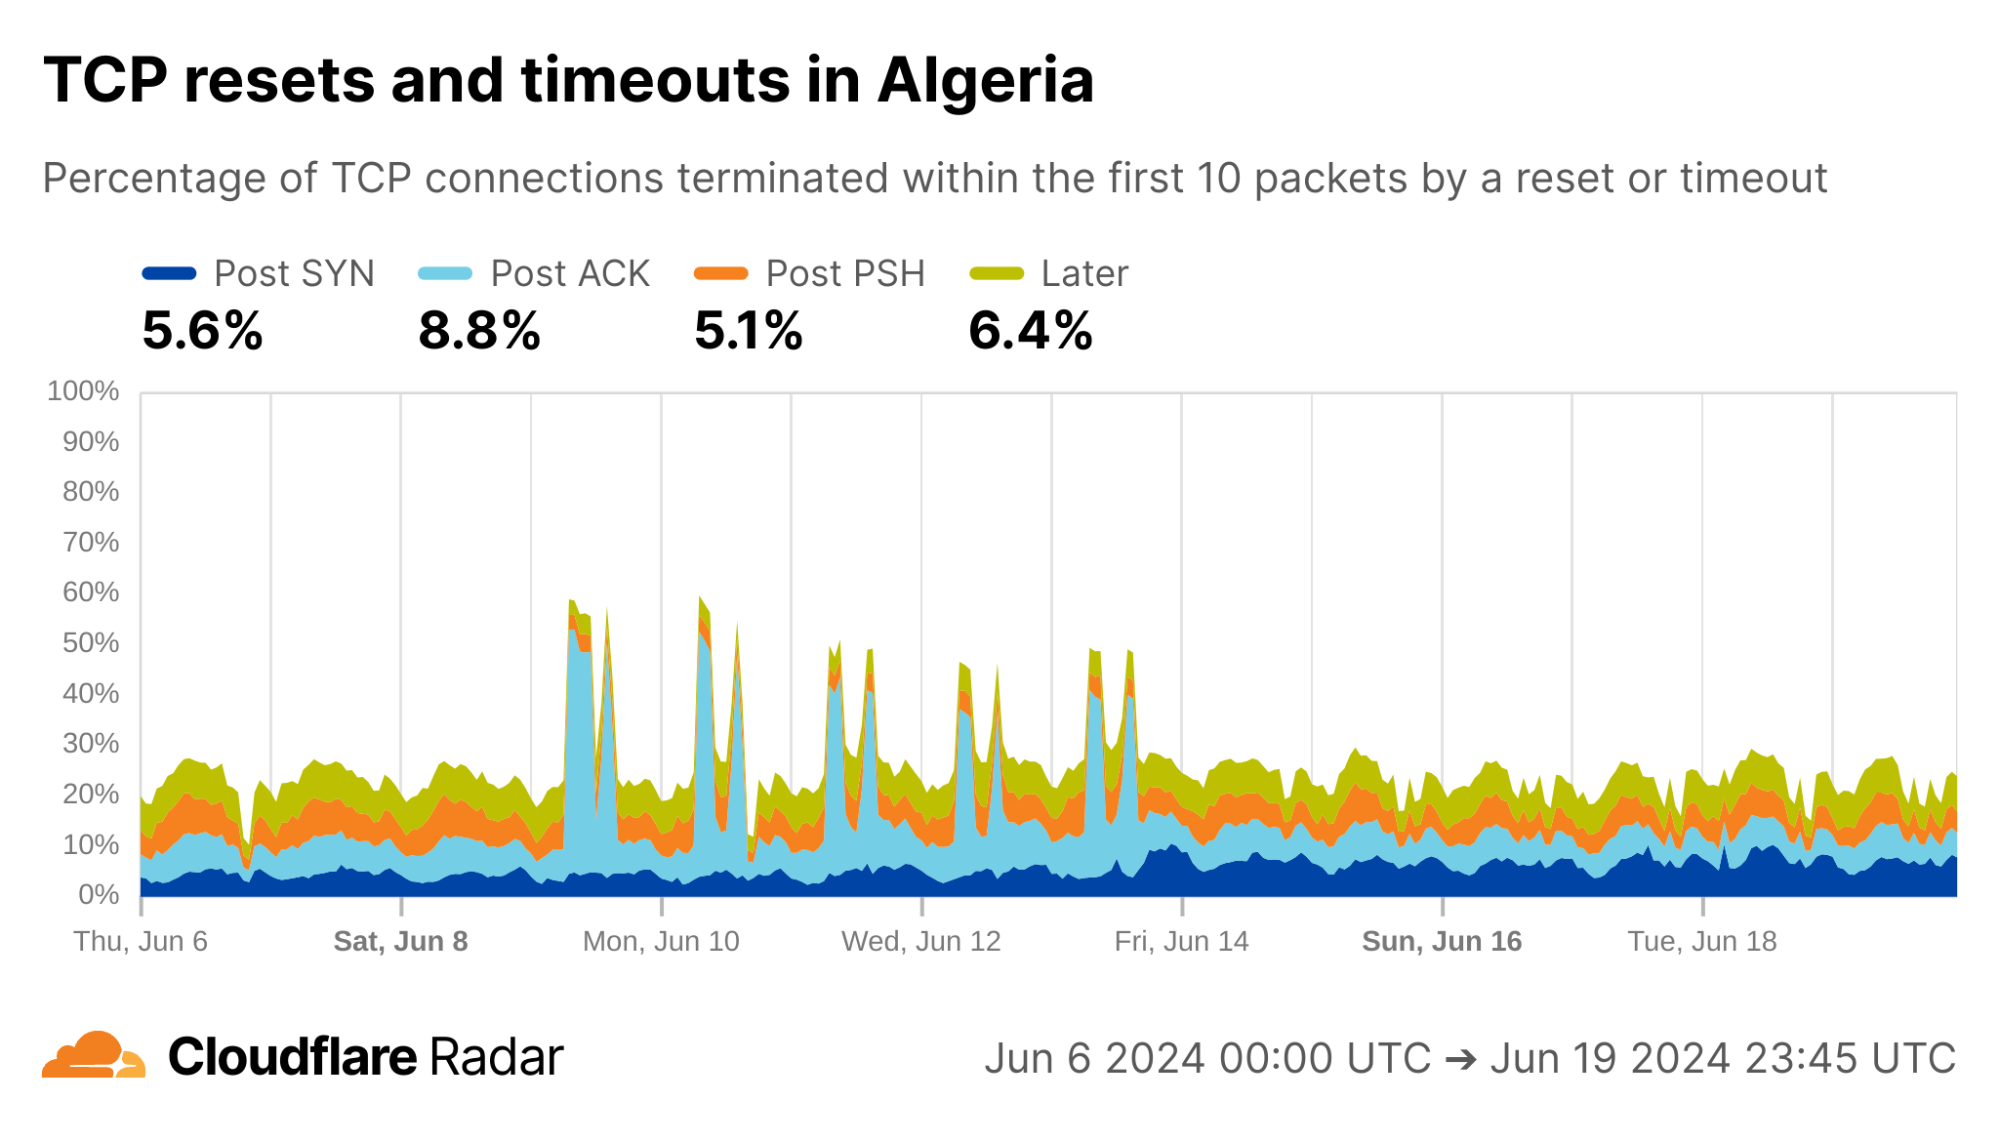
The exams shutdown blog also describes how Algeria took a more nuanced approach for restricting access to content during exam times: instead of full Internet shutdowns, evidence suggests that Algeria instead targeted specific connections. Indeed, during exam periods we see an increase in Post-ACK connection anomalies. This behavior would be expected if a middlebox selectively drops packets that contain forbidden content, while leaving other packets alone (like the initial SYN and ACK).
The examples above reinforce that this data is most useful when correlated with other signals. The data is also available via the API, so others can dive in more deeply. Our detection techniques are also transferable to other servers and operators, as described next.
How to detect anomalous TCP connections at scale
In this section, we discuss how we constructed the TCP resets and timeouts dataset. The scale of Cloudflare’s global network presents unique challenges for data processing and analysis. We share our techniques to help readers to understand our methodology, interpret the dataset, and replicate the mechanisms in other networks or servers.
Our methodology can be summarized as follows:
Log a sample of connections arriving at our client-facing servers. This sampling system is completely passive, meaning that it has no ability to decrypt traffic and only has access to existing packets sent over the network.
Reconstruct connections from the captured packets. A novel aspect of our design is that only one direction needs to be observed, from client to server.
Match reconstructed connections against a set of signatures for anomalous connections terminated by resets or timeouts. These signatures consist of two parts: a connection stage, and a set of tags that indicate specific behaviors derived from the literature and our own observations.
These design choices keep encrypted packets safe and can be replicated anywhere, without needing access to the destination server.
First, sample connections
Our main goal was to design a mechanism that scales, and gives us broad visibility into all connections arriving at Cloudflare’s network. Running traffic captures on each client-facing server works, but does not scale. We would also need to know exactly where and when to look, making continuous insights hard to capture. Instead, we sample connections from all of Cloudflare’s servers and log them to a central location where we could perform offline analysis.
This is where we hit the first roadblock: existing packet logging pipelines used by Cloudflare’s analytics systems log individual packets, but a connection consists of many packets. To detect connection anomalies we needed to see all, or at least enough, packets in a given connection. Fortunately, we were able to leverage a flexible logging system built by Cloudflare’s DoS team for analyzing packets involved in DDoS attacks in conjunction with a carefully crafted invocation of two iptables rules to achieve our goal.
The first iptables rule randomly selects and marks new connections for sampling. In our case, we settled on sampling one in every 10,000 ingress TCP connections. There’s nothing magical about this number, but at Cloudflare’s scale it strikes a balance between capturing enough without straining our data processing and analytics pipelines. The iptables rules only apply to packets after they have passed the DDoS mitigation system. As TCP connections can be long-lived, we sample only new TCP connections. Here is the iptables rule for marking connections to be sampled:
-t mangle -A PREROUTING -p tcp --syn -m state
--state NEW -m statistic --mode random
--probability 0.0001 -m connlabel --label
--set -m comment --comment "Label a sample of ingress TCP connections"
Breaking this down, the rule is installed in the mangle table (for modifying packets) in the chain that handles incoming packets (-A PREROUTING). Only TCP packets with the SYN flag set are considered (-p tcp --syn) where there is no prior state for the connection (--state NEW). The filter selects one in every 10,000 SYN packets (-m statistic –mode random --probability 0.0001) and applies a label to the connection (-m connlabel --label <label> --set).
The second iptables rule logs subsequent packets in the connection, to a maximum of 10 packets. Again, there’s nothing magic about the number 10 other than that it’s generally enough to capture the connection establishment, subsequent request packets, and resets on connections that close before expected.
-t mangle -A PREROUTING -m connlabel --label
 -m connbytes ! --connbytes 11
--connbytes-dir original --connbytes-mode packets
-j NFLOG --nflog-prefix "" -m
comment --comment "Log the first 10 incoming packets of each sampled ingress connection"
This rule is installed in the same chain as the previous rule. It matches only packets from sampled connections (-m connlabel --label <label>), and only the first 10 packets from each connection (-m connbytes ! --connbytes 11 --connbytes-dir original --connbytes-mode packets). Matched packets are sent to NFLOG (-j NFLOG --nflog-prefix "<logging flags>") where they’re picked up by the logging system and saved to a centralized location for offline analysis.
Reconstructing connections from sampled packets
Packets logged on our servers are inserted into ClickHouse tables as part of our analytics pipeline. Each logged packet is stored in its own row in the database. The next challenge is to reassemble packets into the corresponding connections for further analysis. Before we go further, we need to define what a “connection” is for the purpose of this analysis.
We use the standard definition of a connection defined by the network 5-tuple of protocol, source IP address, source port, destination IP address, destination port with the following tweaks:
We only sample packets on the ingress (client-to-server) half of a connection, so do not see the corresponding response packets from server to client. In most cases, we can infer what the server response will be based on our knowledge of how our servers are configured. Ultimately, the ingress packets are sufficient to learn anomalous TCP connection behaviors.
We query the ClickHouse dataset in 15-minute intervals, and group together packets sharing the same network 5-tuple within that interval. This means that connections may be truncated towards the end of the query interval. When analyzing connection timeouts, we exclude incomplete flows where the latest packet timestamp is within 10 seconds of the query cutoff.
Since resets and timeouts are most likely to affect new connections, we only consider sequences of packets starting with a SYN packet marking the beginning of a new TCP handshake. Thus, existing long-lived connections are excluded.
The logging system does not guarantee precise packet interarrival timestamps, so we consider only the set of packets that arrive, not ordered by their arrival time. In some cases, we can determine packet ordering based on TCP sequence numbers but it turns out not to significantly impact the results.
We filter out a small fraction of connections with multiple SYN packets to reduce noise in the analysis.
With the above conditions for how we define a connection, we’re now ready to describe our analysis pipeline in more detail.
Mapping connection close events to stages
TCP connections transition through a series of stages from connection establishment through eventual close. The stage at which an anomalous connection closes provides clues as to why the anomaly occurred. Based on the packets that we receive at our servers, we place each incoming connection into one of four stages (Post-SYN, Post-ACK, Post-PSH, Later), described in more detail above.
The connection close stage alone provides useful insights into anomalous TCP connections from various networks, and this is what is shown today on Cloudflare Radar. However, in some cases we can provide deeper insights by matching connections against more specific signatures.
Applying tags to describe more specific connection behaviors
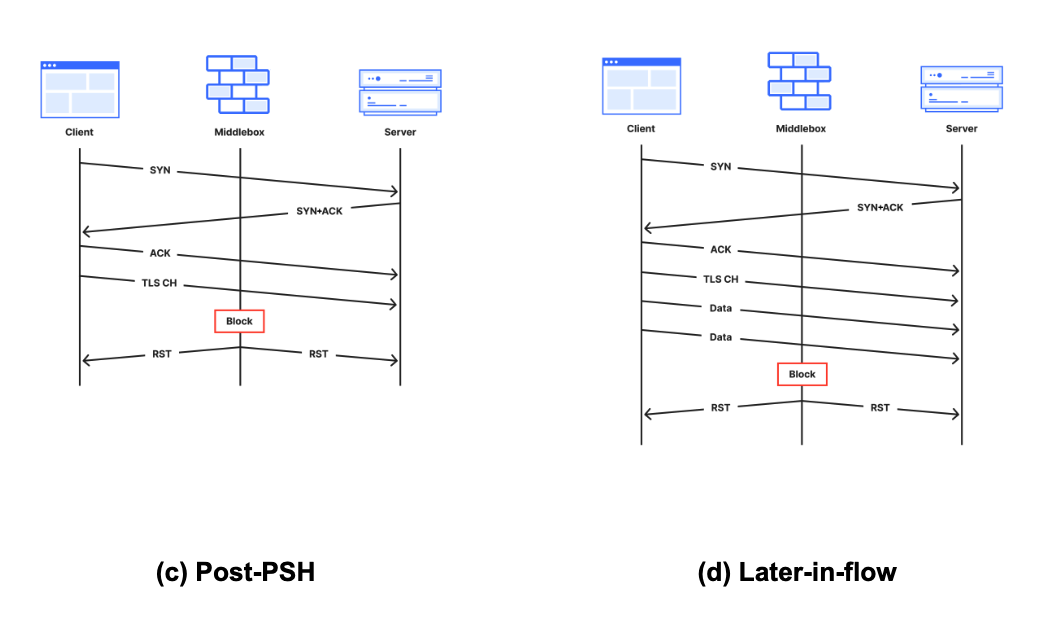
The grouping of connections into stages as described above is done solely based on the TCP flags of packets in the connection. Considering other factors such as packet inter-arrival timing, exact combinations of TCP flags, and other packet fields (IP identification, IP TTL, TCP sequence and acknowledgement numbers, TCP window size, etc.) can allow for more fine-grained matching to specific behaviors.
For example, the popular ZMap scanner software fixes the IP identification field to 54321 and the TCP window size to 65535 in SYN packets that it generates (source code). When we see packets arriving to our network that have these exact fields set, it is likely that the packet was generated by a scanner using ZMap.
Tags can also be used to match connections against known signatures of tampering middleboxes. A large body of active measurements work (for instance, Weaver, Sommer, and Paxson) has found that some middleboxes deployments exhibit consistent behaviors when disrupting connections via reset injection, such as setting an IP TTL field that differs from other packets sent by the client, or sending both a RST packet and a RST+ACK packet. For more details on specific connection tampering signatures, see the blog post and the peer-reviewed paper.
Currently, we define the following tags, which we intend to refine and expand over time. Some tags only apply if another tag is also set, as indicated by the hierarchical presentation below (e.g., the fin tag can only apply when the reset tag is also set).
timeout: terminated due to a timeout
reset: terminated due to a reset (packet with RST flag set)
fin: at least one FIN packet was received alongside one or more RST packets
single_rst: terminated with a single RST packet
multiple_rsts: terminated with multiple RST packets
acknumsame: the acknowledgement numbers in the RST packets were all the same and non-zero
acknumsame0: the acknowledgement numbers in the RST packets were all zero
acknumdiff: the acknowledgement numbers in the RST packets were different and all non-zero
acknumdiff0: the acknowledgement numbers in the RST packets were different and one was zero
single_rstack: terminated with a single RST+ACK packet (both RST and ACK flags set)
multiple_rstacks: terminated with a multiple RST+ACK packets
rst_and_rstacks: terminated with a combination of RST and RST+ACK packets
zmap: SYN packet matches those generated by the ZMap scanner
Connection tags are not currently visible in the Radar dashboard and API, but we plan to release this additional functionality in the future.
What’s next?
Cloudflare’s mission is to help build a better Internet, and we consider transparency and accountability to be a critical part of that mission. We hope that the insights and tools we are sharing help to shed light on anomalous network behaviors around the world.
While the current TCP resets and timeouts dataset should immediately prove useful to network operators, researchers, and Internet citizens as a whole, we’re not stopping here. There are several improvements we’d like to add in the future:
Expand the set of tags for capturing specific network behaviors and expose them in the API and dashboard.
Extend insights to connections from Cloudflare to customer origin servers.
Add support for QUIC, which is currently used for over 30% of HTTP requests to Cloudflare worldwide.
If you’ve found this blog interesting, we encourage you to read the accompanying blog post and paper for a deep dive on connection tampering, and to explore the TCP resets and timeouts dashboard and API on Cloudflare Radar. We welcome you to reach out to us with your own questions and observations at [email protected].
Have you ever made a phone call, only to have the call cut as soon as it is answered, with no obvious reason or explanation? This analogy is the starting point for understanding connection tampering on the Internet and its impact.
We have found that 20 percent of all Internet connections are abruptly closed before any useful data can be exchanged. Essentially, every fifth call is cut before being used. As with a phone call, it can be challenging for one or both parties to know what happened. Was it a faulty connection? Did the person on the other end of the line hang up? Did a third party intervene to stop the call?
On the Internet, Cloudflare is in a unique position to help figure out when a third party may have played a role. Our global network allows us to identify patterns that suggest that an external party may have intentionally tampered with a connection to prevent content from being accessed. Although they are often hard to decipher, the ways connections are abruptly closed give clues to what might have happened. Sources of tampering generally do not try to hide their actions, which leaves hints of their existence that we can use to identify detectable ‘signatures’ in the connection protocol. As we explain below, there are other protocol features that are less likely to be spoofed and that point to third party actions. We can use these hints to build signature patterns of connection tampering that can be recognized.
To be clear, there are many reasons a third party might tamper with a connection. Enterprises may tamper with outbound connections from their networks to prevent users from interacting with spam or phishing sites. ISPs may use connection tampering to enforce court or regulatory orders that demand website blocking to address copyright infringement or for other legal purposes. Governments may mandate large-scale censorship and information control.
Despite the fact that everyone knows it happens, no other large operation has previously looked at the use of connection tampering at scale and across jurisdictions. We think that creates a notable gap in understanding what is happening in the Internet ecosystem, and that shedding light on these practices is important for transparency and the long-term health of the Internet. So today, we’re proud to share a view of global connection tampering practices.
The full technical details were recently peer-reviewed and published in “Global, Passive Detection of Connection Tampering” at ACM SIGCOMM, with its public presentation. We’re also announcing a new dashboard and API on Cloudflare Radar that shows a near real-time view of specific connection timeout and reset events – the two mechanisms dominant in tampering experienced by usersconnecting to Cloudflare’s network globally.
To better understand our perspective, it helps to understand the nature of connection tampering and reasons we’re talking about it.
Global insights for a global audience
Evidence of connection tampering is visible in networks all around the world. We were initially shocked that, globally, about 20% of all connections to Cloudflare close unexpectedly before any useful data exchange occurs — consistent with connection tampering. Here is a snapshot of these anomalous connections seen by Cloudflare that, as of today, we’re sharing on Radar.
It’s not all tampering, but some of it clearly is, as we describe in more detail below. The challenge is filtering through the noise to determine which anomalous connections can confidently be attributed to tampering.
Macro-level analysis and validation
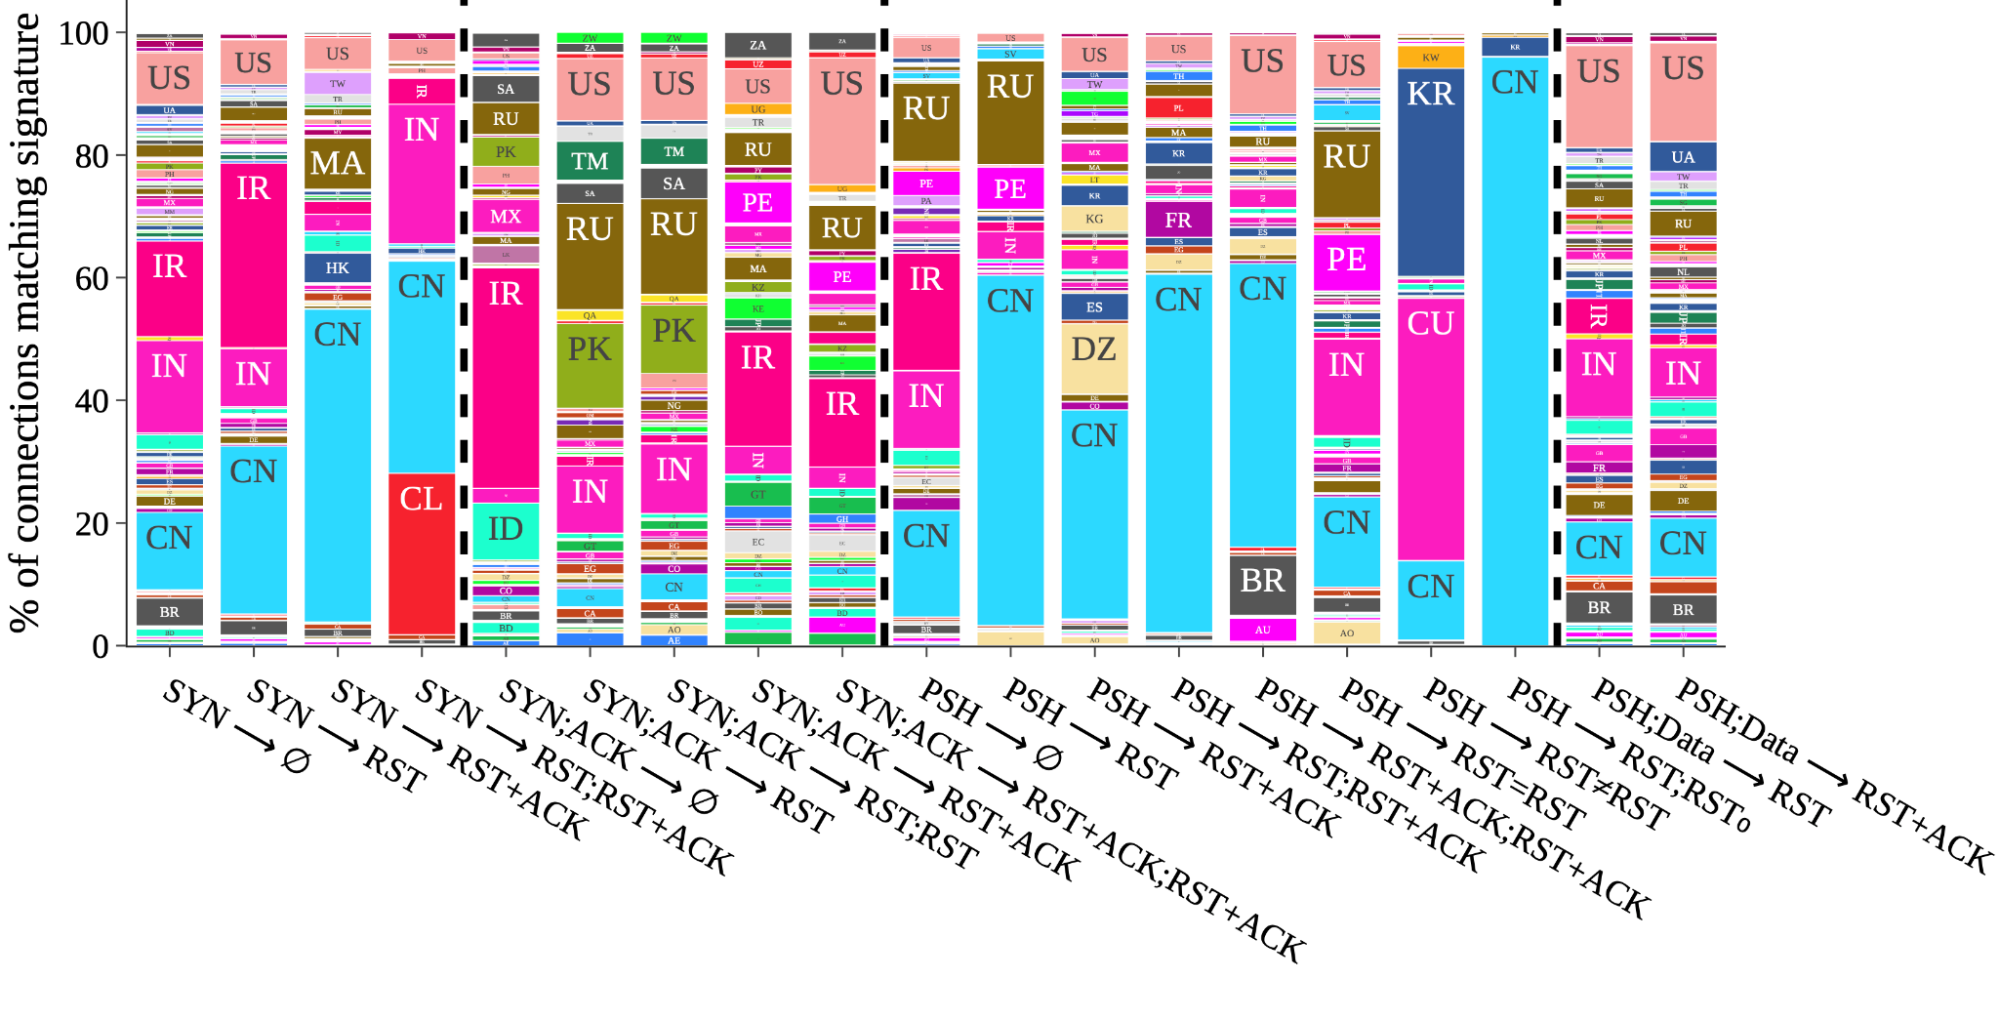
In our work we identified 19 patterns of anomalous connections as being candidate signatures for connection tampering. From those, we found that 14 had been previously reported by active “on the ground” measurement efforts, which presented an opportunity for validation at macro-level: If we observe our tampering signatures from Cloudflare’s network in the same places others observe them from the ground, we could have greater confidence that the signatures capture true cases of connection tampering when observed elsewhere, where there has been no prior reporting. To mitigate the risk of confirmation bias from looking where tampering is known to exist, we decided to look everywhere at the same time.
Taking that approach, the figure below, taken from our peer-review study, is a visual side-by-side comparison of each of the 19 signatures. The data is taken from a two-week interval starting January 26, 2023. Within each signature column is the proportion of matching connections broken down by the country where the connection originated. For example, the column third from the right labeled with ⟨PSH → RST;RST0⟩ indicates that we almost exclusively observed that signature on connections from China. Overall, what we find is a mirror of known cases from public and prior reports, which is an indication that our methodology works.
Figure 1: Signature matching across countries: Each column is the total global number of connections matching a specific signature. Within each column is the proportion of connections initiations from individual countries matching that signature.
Interestingly, by honing in on prevalence, and setting aside the raw number of signature matches, interesting patterns emerge. As a result of this data-driven perspective, unexpected macro-insights also emerge. If we focus on the three most populous countries in the world ranked by number of Internet users, connections from China contribute a substantial portion of matches across no fewer than 9 of the signatures. This is perhaps unsurprising, but reinforces prior studies that find evidence of the Great Firewall (GFW) being made of many different deployments and implementations of blocking mandates. Next, matches on connections from India also contribute substantially to nine 9 different signatures, five of which are in common with signatures where China matches feature highly. Looking at the third most populous, the United States, a visible if not substantial proportion of matches appear on all but two of the signatures.
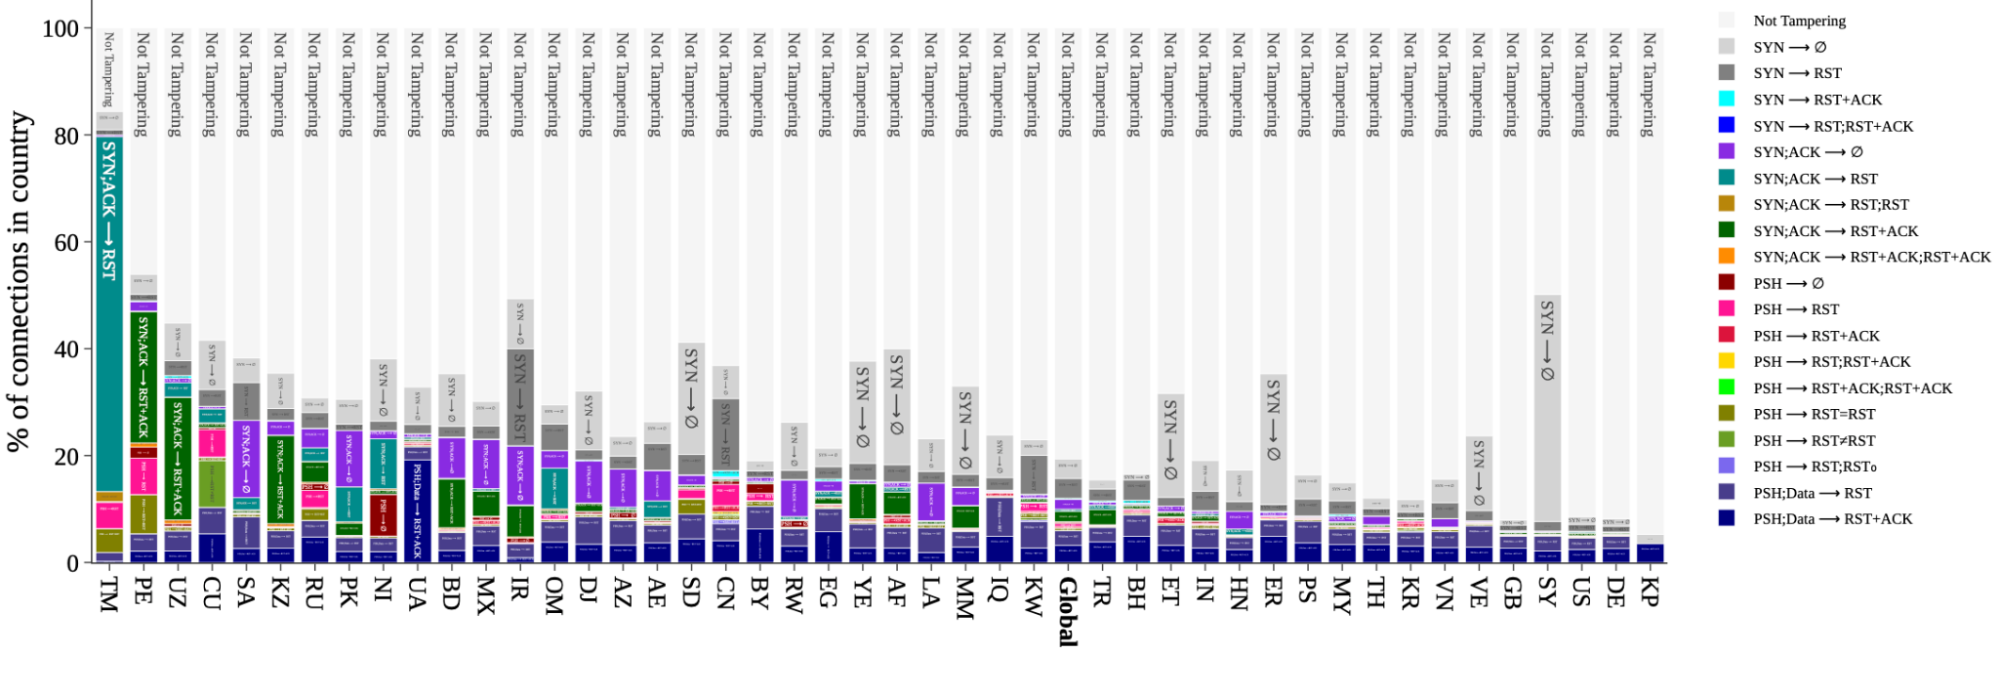
A snapshot of signature distributions per-country, also taken from the peer-review study, appears below for a select set of countries. The global distribution is included for comparison. The dark gray portions marked ⟨SYN → ∅⟩ are included for completeness, but have more non-tampering alternative explanations than the others (for example, as result of a low-rate SYN flood).
Figure 4: Signature distribution per country: The percentage of connections originating from select countries (and globally) that match a particular signature, or are not tampered with.
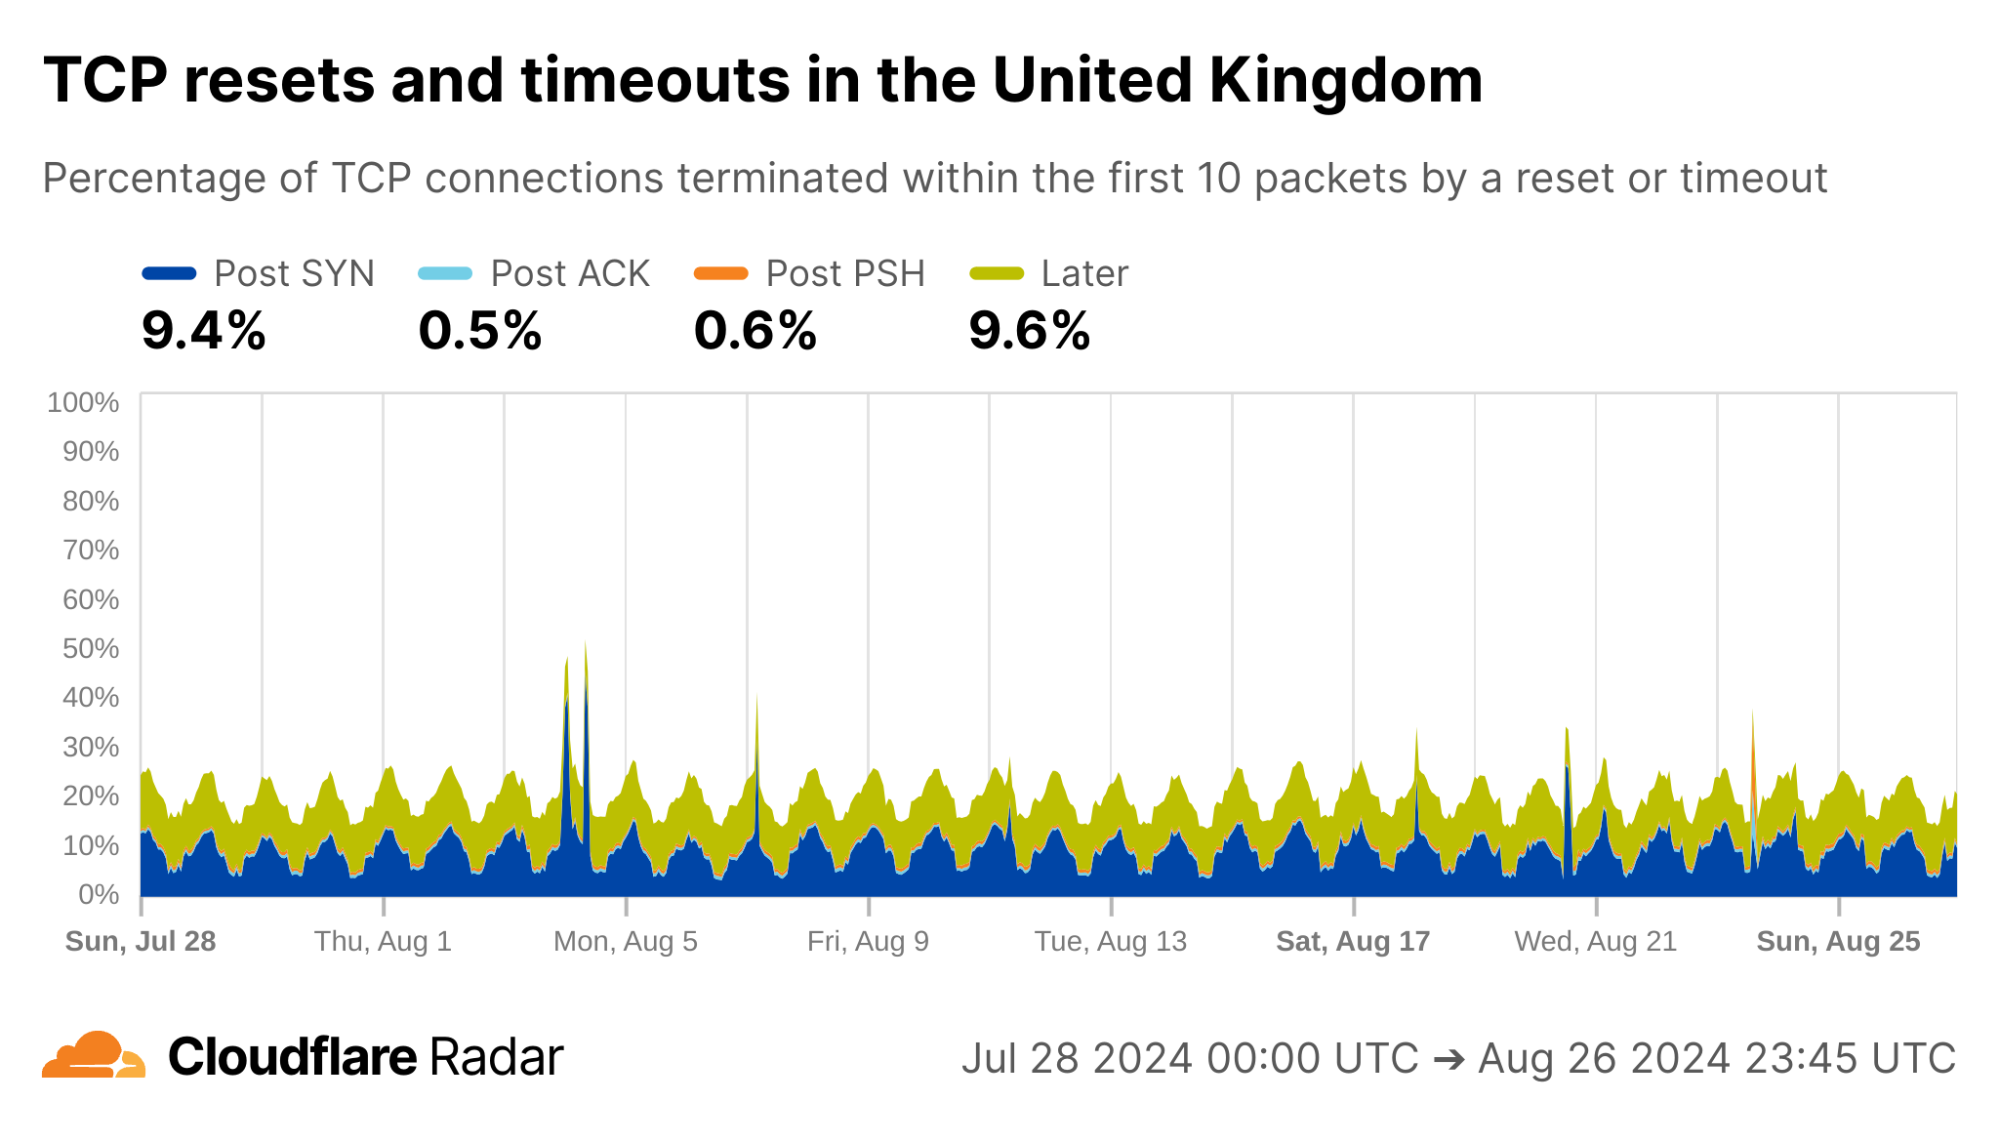
From this perspective we again observe patterns that match prior studies. We focus first on rates above the global average, and ignore the noisiest signature ⟨SYN → ∅⟩ in medium-gray; there are simply too many other explanations for a signature match at this earliest possible stage. Among all connections from Turkmenistan (TM), Russia (RU), Iran (IR), and China (CN), roughly 80%, 30%, 40%, and 30%, respectively, of those connections match a tampering signature. The data also reveals high signature match rates where no prior reports exist. For example, connections from Peru (PE) and Mexico (MX), match roughly 50% and 25%, respectively; analysis of individual networks in these countries suggests a likely explanation is zero-rating in mobile and cellular networks, where an ISP allows access to certain resources (but not others) at no cost. If we look below the global average, Great Britain (GB), the United States (US), and Germany (DE), each match a signature on about 10% of connections.
The data makes clear that connection tampering is widespread, and close to many users, if not most. In many ways, it’s closer than most know. To explain why, we explain connection tampering with a very familiar communication tool, the telephone.
Explaining tampering with telephone calls
Connection tampering is a way for a third party to block access to particular content. However, it’s not enough for the third party to know the type of content it wants to block. The third party can only block an identity by name.
Ultimately, connection tampering is possible only by accident – an unintended side effect of protocol design. On the Internet, the most common identity is the domain name. In a communication on the Internet, the domain name is most often transmitted in the “server name indication (SNI)” field in TLS – exposed in cleartext for all to see.
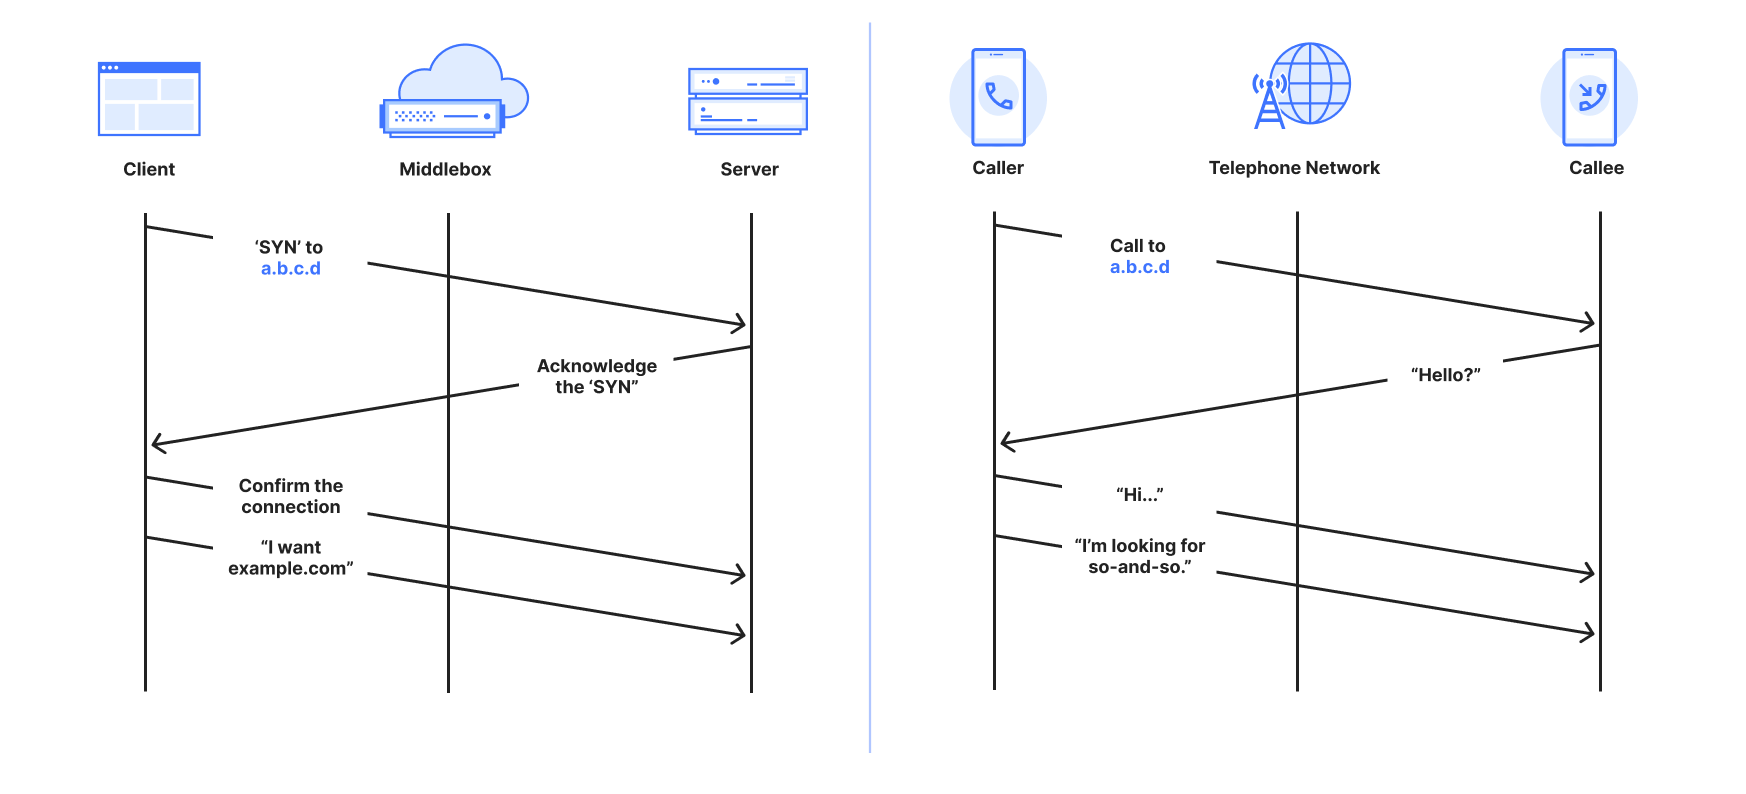
To understand why this matters, it helps to understand what connection tampering looks like in human-to-human communications without the Internet. The Internet itself looks and operates much like the postal system, which relies only on addresses and never on names. However, the way most people use the Internet is much more like the “plain old telephone system,” which requires names to succeed.
In the telephone system, a person first dials a phone number, not a name. The call is connected and usable only after the other side answers, and the caller hears a voice. The caller asks for a name only after the call is connected. The call manifests in the system as energy signals that do not identify the communicating parties. Finally, after the call ends, a new call is required to communicate again.
On the Internet, a client such as a browser “establishes a connection.” Much like a telephone caller, it initiates a connection request to a server’s number, which is an IP address. The longest-standing “connection-oriented” protocol to connect two devices is called the Transmission Control Protocol, or TCP. The domain name is transmitted in isolation from the connection establishment, much like asking for a name once the phone is answered. The connections are “logical” identified by metadata that does not identify communicating parties. Finally, a new connection is established with each new visit to a website.
Comparison between a TCP connection and a telephone call
What happens if a telephone company is required to prevent a call to some party? One option is to modify or manipulate phone directories so a caller can’t get the phone number they need to dial the phone that makes the call; this is the essence of DNS filtering. A second option is to block all calls to the phone number, but this inadvertently affects others, just like IP blocking does.
Once a phone call is initiated, the only way for the telephone company to know who is being called is to listen in on the call and wait for the caller to say, “is so-and-so there?” or “can I speak with so-and-so?” Mobile and cellular calls are no exception. The idea that the number we call is the person who will answer is just an expectation – it has never been the reality. For example, a parent could get a number to give to their child, or a taxi company could leave the mobile phone with whomever is on-shift at the time. As a result, the telephone company must listen in. Once it hears a certain name it can cut the call; neither side would have any idea what has happened – this is the very definition of connection tampering on the Internet.
For the purpose of establishing a communication channel, phone calls and TCP connections are at least comparable, and arguably exactly the same – not least because the domain name is transmitted separately from establishing a connection.
Similarly, on the Internet, the only way for a third party to know the intended recipient of a connection is to “look inside” of packets as they are transmitted. Where a telephone company would have to listen for a name, a third party on the Internet waits to see something it does not like, most often a forbidden name. Recall from above the unintended side-effect of the protocol: the name is visible in the SNI, which is required to help encrypt the data communication. When that happens, the third party causes one or both devices to close the connection by either dropping messages or injecting specially-crafted messages that cause the communicating parties to abort the connection.
The mechanisms to trigger tampering begin with deep packet inspection (DPI), which means looking into the data portions that lie beyond the address and other metadata belonging to the connection. It’s safe to say that this functionality does not come for free; whether it’s an ISP’s router or a parental proxy, DPI is an expensive operation that gets more expensive at large scale or high speed.
One last point worth mentioning is that weaknesses in telephone tampering similarly appear in connection tampering. For example, the sound of Jean and Gene are indistinguishable to any ear, despite being different names. Similarly, tampering with connections to Twitter’s short-form name “t.co” would also affect “microsoft.com” – and has.
A live view of tampering during Mahsa Amini protests
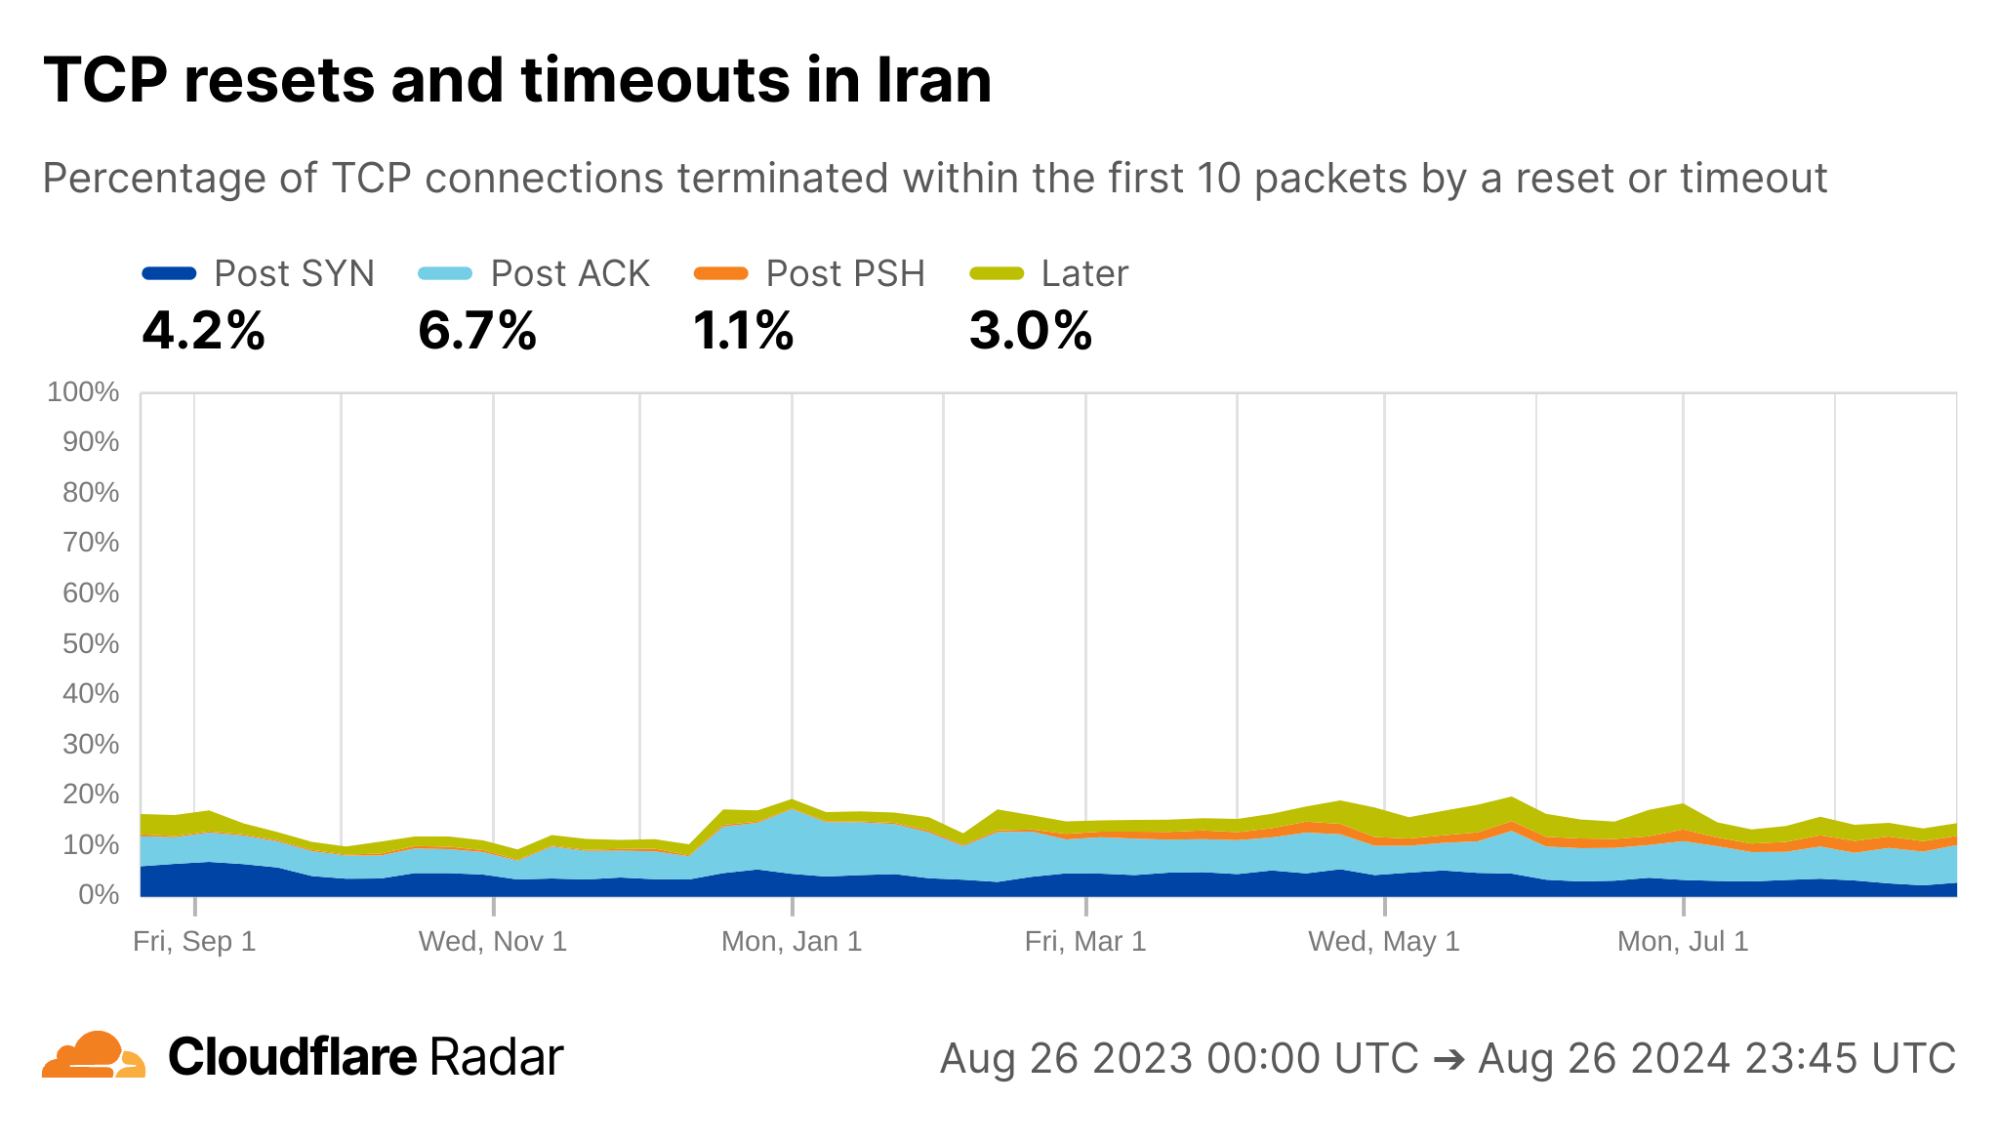
Before we delve deeply into the technical, there is one more motivation that is personal to many at Cloudflare. Transparency is important and the reason we started this work, but it was after seeing the data during the Mahsa Amini protests in Iran in 2022 that we committed internally to share the data on Radar.
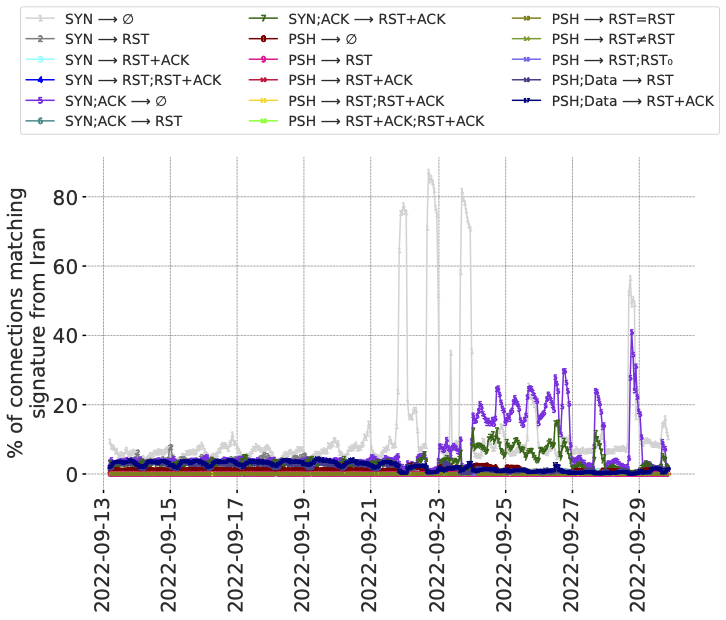
Figure 8: Signature match rates longitudinally in Iran during a period of nation-wide protests. (𝑥-axis is local time.)
The figure below is for connections from Iran during 17 days overlapping the protests. The plot-lines track individual signals of anomalous connections, including signatures of different types of connection tampering. This data pre-dates the Radar service, so we have elected to share this representation from the peer-reviewed paper. It was also the first visual example of the value of the data if it could be shared via Radar.
From the data there are two observations that stick out. First is the way that the lines appear stable before the protests, then increase after the protests began. Second is the variation between the lines over time, in particular the lines in light gray, dark purple, and dark green. Recall that each line is a different tampering signature, so the variation between lines suggests changes in the underlying causes – either the mechanisms at work, or the traffic that invokes them.
We emphasize that a signature match, alone, does not in itself mean there is tampering. However, in the case of Iran in 2022 there were public reports of blocking of various forms. The methods in use at the time, specifically Server Name Indication (SNI)-based blocking of access to content, had also previously been well-documented, and matched with our observations represented by the figure above.
What about today? Below we see the Radar view of the twelve months from August 2023 to August 2024. Each color represents a different stage of the connection where tampering might happen. In the previous 12 months, TCP connection anomalies in Iran are lower than the worldwide averages, overall, but appear significantly higher in the portion of anomalies represented by the light-blue region. This “Post ACK” phase of communication is often associated with SNI-based blocking. (In the graph above, the relevant signatures are represented by the dark purple and dark green lines.) Alongside, the changing proportions of the different plot-lines since mid-December 2023 suggest that techniques have been changing over time.
The importance of an open network measurement community
As a testament to the importance of open measurement and research communities, this work very literally “builds on the shoulders of giants.” It was produced in collaboration with researchers at the University of Maryland, École Polytechnique Fédérale de Lausanne, and the University of Michigan, but does not exist in isolation. There have been extensive efforts to measure connection tampering, most of which comes from the censorship measurement community. The bulk of that work consists of active measurements, in which researchers craft and transmit probes in or along networks and regions to identify blocking behavior. Unsurprisingly, active measurement has both strengths and weaknesses, as described in Section 2 in the paper).
The counterpart to active measurement, and the focus of our project, is passive measurement, which takes an “observe and do nothing” approach. Passive measurement comes with its own strengths and weaknesses but, crucially, it relies on having a good vantage point such as a large network operator. Each of active and passive measurements are most effective when working in conjunction, in this case helping to paint a more complete picture of the impact of connection tampering on users.
Most importantly, when embarking upon any type of measurement, great care must be taken to understand and evaluate the safety of the measurement since the risk imposed on people and networks are often indirect, or hidden from view.
Limitations of our data
We have no doubt about the importance of being transparent with connection tampering, but we also need to be explicit about the limits on the insights that can be gleaned from the data. As passive observers of connections to the Cloudflare network – and only the Cloudflare network – we are only able to see or infer the following:
Signs of connection tampering, but not where it happened. Any software or device between the client’s application and the server systems can tamper with a connection. The list ranges from purpose-built systems, to firewalls in the enterprise or home broadband router, and protection software installed on home or school computers. All we can infer is where the connection started (albeit at the limits of geolocation inaccuracies inherent in the Internet’s design).
(Often, but not always) What triggered the tampering, but not why. Typically, tampering systems are triggered by domain names, keywords, or regular expressions. With enough repetition, and manual inspection, it may be possible to identify the likely cause of tampering, but not the reasons. Many tampering system designs are prone to unintended consequences, among them the t.co example mentioned above.
Who and what is affected, but not who or what could be affected. As passive observers, there are limits on the kinds of inferences we can make. For example, observable tampering on 1000 out of 1001 connections to example.com suggests that tampering is likely on the next connection attempt. However, that says nothing about connections to another-example.com.
Data, data, data: Extracting signals from the noise
If you just want to get and use the data on Radar, see our “how to” guide. Otherwise, let’s understand the data itself.
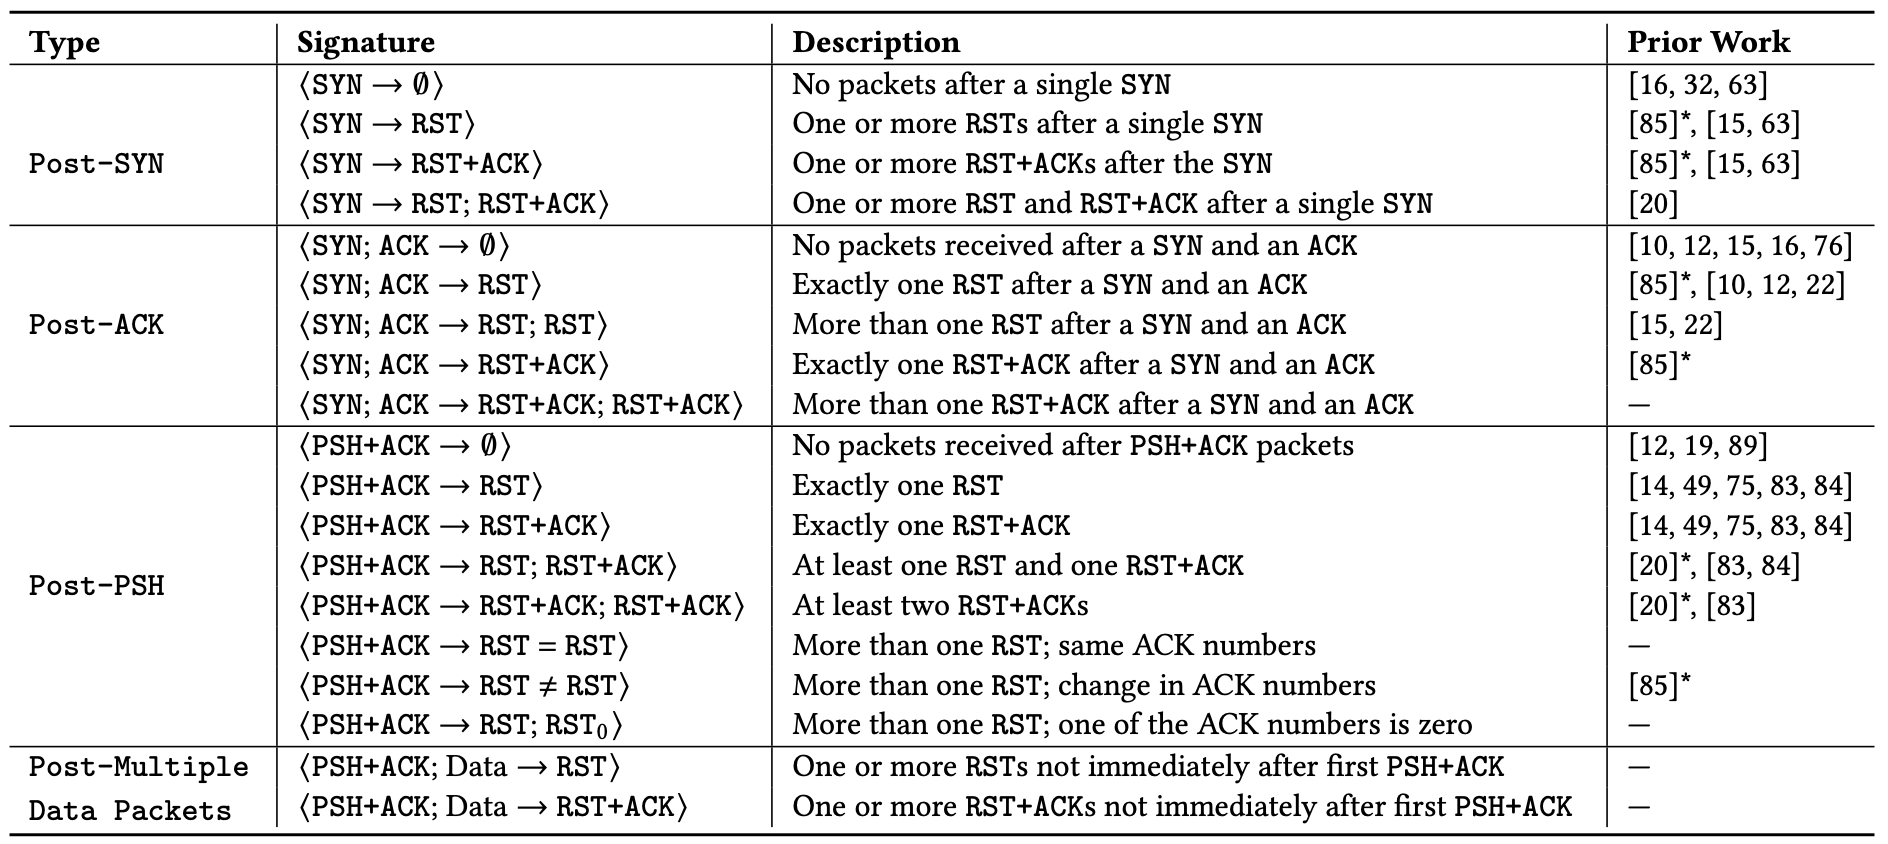
The focus of this work is TCP. In our data there are two mechanisms available to a third-party to force a connection to close: dropping packets to induce timeouts or injecting forged TCP RST packets, each with various deployment choices. Individual tampering signatures may be reflections of those choices. For comparison, a graceful TCP close is initiated with a FIN packet.
Connection tampering signatures
Our detection mechanism evaluates sets of packets in a connection against a set of signatures for connection tampering. The signatures are hand-crafted from signatures identified in prior work, and by analyzing samples of connections to Cloudflare’s network that we classify as anomalous – connections that close early, and ungracefully by way of a RST packet or timeout within the first 10 packets from the client. We analyzed the samples and found that 19 patterns accounted for 86.9% of all possibly tampered connections in the samples, shown in the table below.
Table 1: The comprehensive set of tampering signatures we identify through global passive measurements.
To help reason about tampering, we also classed the 19 signatures above according to the stage of the connection lifetime in which they appear. Each stage implies something about the middlebox, as described below alongside corresponding sequence diagrams:
(a) Post-SYN (mid-handshake): Tampering is likely triggered by the destination IP address because the middlebox has likely not seen application data, which is typically transmitted after the handshake completes.
(b) Post-ACK (immediately after handshake): The connection is established and immediately forced to close before seeing any data. It is possible, even likely, that the middlebox has likely seen a data packet; for example, the host header in HTTP or SNI field in TLS.
(c) Post-PSH (after first data packet): The middlebox has definitely seen the first data packet because the server has received it. The middlebox may have been waiting for a packet with a PSH flag, typically set to indicate data in the packet should be delivered to the application on receipt, without delay. The likely middlebox is likely a monster-on-the-side because it permits the offending packet to reach the destination.
(d) Later-in-flow (after multiple data packets): Tampering at later stages in the connection (not immediately after the first data packet, but still within the first 10 packets). The prevalence of encrypted data in TLS makes this the least likely stage for tampering to occur. The likely triggers are keywords appearing in cleartext later in (HTTP) connections, or by the likes of enterprise proxies and parental protection software that has visibility into encrypted traffic and can reset connections when certain keywords are encountered.
Accounting for alternative explanations
How can we be confident that the signatures above detect middlebox tampering, and not just atypical client behavior? One of the challenges of passive measurement is that we do not have full visibility into the clients connecting to our network, so absolute positives are hard if not impossible. Instead, we look for strong positive evidence of tampering, that must first begin by identifying false positives.
We are aware of the following sources of false positives that can be hard to disambiguate from true sources of tampering. All but the last occur in the first two stages of the connection, before data packets are received.
Scanners are client-side applications that probe servers to elicit responses. Some scanner software uses fixed bits in the header to self-identify, which helps us filter. For example, we found that Zmap accounts for approximately 1% of all ⟨SYN → RST⟩ signature matches.
SYN flood attacks are another likely source of false positives, especially for signatures in the Post-SYN connection stage like the ⟨SYN → ∅⟩ and ⟨SYN → RST⟩ signatures. These are less likely to appear in our dataset collection, which happens after the DDoS protection systems.
Happy Eyeballs is a common technique used by dual-stack clients in which the client initiates an IPv6 connection to the server and, with some delay to favor IPv6, also makes an IPv4 connection. The client keeps the connection that succeeds first and drops the other. Clients that cease transmission or close the connection with a RST instead of a FIN would show up in the data, matching the ⟨SYN → RST⟩ signature.
Browser-triggered RSTs may appear at any stage of the connection, but especially for signatures that match later in a connection (after multiple data packets). It might be triggered, for example, by a user closing a browser tab. Unlike targeted tampering, however, RSTs originating from browsers are unlikely to be biased towards specific services or websites.
How can we separate legitimate client-initiated false positives from third-party tampering? We seek an evidence-based approach to distinguish tampering signatures from other signals within the dataset. For this we turn to individual bits in the packet headers.
Signature validation – letting the data speak
Signature matches in isolation are insufficient to make good determinations. Alongside, we can find further supporting evidence of their accuracy by examining connections in aggregate – if the cause is tampering, and tampering is targeted, then there must be other patterns or markers in common. For example, we expect browser behavior to appear worldwide; however, as we showed above, signatures that match on connections in only some places or some time intervals stick out.
Similarly, we expect certain characteristics in contiguous packets within a connection to also stick out, and indeed they do, namely in the IP-ID and TTL fields in the IP header.
The IP-ID (IP identification) field in the IPv4 packet header is usually a fixed per-connection value, often incremented by the client for each subsequent packet it sends. In other words, we expect the change in IP-ID value in subsequent packets sent from the same client to be small. Thus, large changes in IP-ID value between subsequent packets are unexpected in normal connections, and could be used as an indicator of packet injection. This is exactly what we see in the figure above, marked (a), for a select set of signatures.
The Time-to-Live (TTL) field offers another clue for detecting injected packets. Here, too, most client implementations use the same TTL for each packet sent on a connection, usually set initially to either 64 or 128 and decremented by every router along the packet’s route. If a RST packet does not have the same TTL as other packets in a connection, it’s a strong signal that it was injected. Looking at the figure above, marked (b), we can see marked differences in TTLs, indicating the presence of a third party.
We strongly encourage readers to read the underlying details of how and why these make sense. Connections with high maximum IP-ID and TTL differences give positive evidence for traffic tampering, but the absence of these signals does not necessarily mean that tampering did not occur, as some middleboxes are known to copy IP header values including the IP-ID and TTL from the original packets in the connection. Our interest is in responsibly ensuring our dataset has indicative value.
There is one last caveat: While our tampering signatures capture many forms of tampering, there is still potential for false negatives for connections that were tampered with but escaped our detection. Some examples are connections terminated after the first 10 packets (since we don’t sample that far), FIN injection (a less common alternative to RST injection), or connections where all packets are dropped before reaching Cloudflare’s servers. Our signatures also do not apply to UDP-based protocols such as QUIC. We hope to expand the scope of our connection tampering signatures in the future.
Case studies
To get a sense of how this looks on the Cloudflare network, below we provide further examples of TCP connection anomalies that are consistent with OONI reports of connection tampering.
For additional insights from this specific study, see the full technical paper and presentation. For other regions and networks not listed below, please see the new data on Radar.
Pakistan
Reporting from inside Pakistan suggests changes in users’ Internet experience throughout August 2024. Taking a look at a two-week interval in early August, there is a significant shift in Post-ACK connection anomalies starting on August 9, 2024.
The August 9 Post-ACK spike can be almost entirely attributed to AS56167 (Pak Telecom Mobile Limited), shown below in the first image, where Post-ACK anomalies jumped from under 5% to upwards of 70% of all connections, and has remained high since. Correspondingly, we see a significant reduction in the number of successful HTTP requests reaching Cloudflare’s network from clients in AS56167, below in the second image, which provides evidence that connections are being disrupted. This Pakistan example reinforces the importance of corroborating reports and observations, discussed in more detail in the Radar dataset release.
A OONI report from April 2024 discusses targeted connection tampering in Tanzania. The report states that this blocking is observed on the client side as connection timeouts after the Client Hello message during the TLS handshake, indicating that a middlebox is dropping the packet containing the Client Hello message. On the server side, connections tampered with in this way would appear as Post-ACK timeouts as the PSH packet containing the Client Hello message never reaches the server.
Looking at the Post-ACK data represented in the light-blue portion, below, we find matching evidence: close to 30% of all new TCP connections from Tanzania appear as Post-ACK anomalies. Breaking this down further (not shown in the plots below), approximately one third is due to timeouts, consistent with the OONI report above. The remainder is due to RSTs.
Ethiopia is another location with previously-reported connection tampering. Consistent with this, we see elevated rates of Post-PSH TCP anomalies across networks in Ethiopia. Our internal data shows that the majority of Post-PSH anomalies in this case are due to RSTs, although timeouts are also prevalent.
The majority of traffic arriving to Cloudflare’s servers from IP addresses geolocated in Ethiopia is from AS24757 (Ethio Telecom), shown below in the first image, so it is perhaps unsurprising that its data closely matches the country-wide distribution of connection anomalies. The number of Post-PSH connections originating from AS328988 (SAFARICOM TELECOMMUNICATIONS ETHIOPIA PLC), shown below in the second image, are higher in proportion and account for over 33% of all connections from that network.
Reflecting on the present to promote a resilient future
Connection tampering is a blocking mechanism that is deployed in various forms throughout the Internet. Although we have developed ways to help detect and understand it globally, the experience is just as individual as an interrupted phone call.
Connection tampering is also made possible by accident. It works because domain names are visible in cleartext. But it may not always be this way. For example, Encrypted Client Hello (ECH) is an emerging building block that encrypts the SNI field.
This post is written by Olajide Enigbokan, Senior Solutions Architect and Mohammed Atiq, Solutions Architect
In this post you will learn how to evaluate the throughput for Amazon MQ, a managed message broker service for ActiveMQ, by using the ActiveMQ Classic Maven Performance test plugin. This post will provide recommendations for configuring Amazon MQ to optimize throughput when leveraging ActiveMQ as a broker engine.
Overview on benchmarking throughput for Amazon MQ for ActiveMQ
To get a good balance of cost and performance while leveraging ActiveMQ on Amazon MQ, AWS recommends that customers benchmark during migration, instance type/size upgrade, or downgrade. Benchmarking can help you choose the correct instance type and size for your workload requirements. For common benchmark scenarios and benchmark figures for different instances types and sizes, see AmazonMQ for ActiveMQ Throughput benchmarks.
Performance of your ActiveMQ workload depends on the specifics of your use-case. For example, if you have a workload where durability is extremely important (meaning that messages cannot be lost), enabling persistence mode ensures that messages are persisted to disk before the broker informs the client that the message send action has completed. The faster the disk I/O capacity and the smaller the message size during these writes, the better the message throughput. For this reason, AWS recommends the mq.m5.* instance types for regular development, testing, and production workloads as described in Amazon MQ for ActiveMQ instance types. The mq.t2.micro and mq.t3.micro instance types are intended for product evaluation and are subject to burst CPU credits and baseline performance. Hence, they are not suitable for applications that require fixed performance. In the situation where a larger broker instance type is selected, AWS also recommends batching transactions for persistent store which allows you to send multiple messages per transaction while achieving an overall higher message throughput.
The next section describes the details of setting up your own benchmark for Amazon MQ using the open-source benchmarking tool: ActiveMQ Classic Maven Performance test plugin. The ActiveMQ Classic Maven Performance test plugin benchmark suite is highly recommended due to the ease in setup and deployment process.
Getting started
This walkthrough guides you through the steps for benchmarking your Amazon MQ brokers:
Step 1 – Build and push container image to Amazon ECR
Step 2 – Automate Your Benchmarking Setup with AWS CDK
Architecture of CDK deployment
To streamline the deployment of an active/standby ActiveMQ broker alongside Amazon Elastic Container Service (Amazon ECS) tasks for this walk-through, follow these steps below to set up the environment leveraging AWS Cloud Development Kit (AWS CDK). This will deploy the resources shown in the architecture diagram above.
Clone the mq-benchmarking-sample repository. This repository contains all the necessary code and instructions to automate the benchmarking process using the AWS CDK.
2.3 Create a Virtual Environment:
Change directory (cd) to the cloned repository directory and create a Python virtual environment by running the following command:
cd mq-benchmarking-sample

python -m venv .venv
2.4 Activate Virtual Environment:
Run the following commands to activate your virtual environment:
# Linux
source .venv/bin/activate

# Windows
.\.venv\Scripts\activate
2.5 Install Dependencies:
Install the required Python packages using:
pip install -r requirements.txt
2.6 Customize and Deploy:
In this step, deploy the necessary stacks and their resources for benchmarking in your AWS account. The command ‘cdk deploy’ below deploys three stacks with resources for Amazon ECS, MQ and VPC. Deploy your application with AWS CDK using the command:
This command deploys your application with the specified Docker image. Replace <YOUR CONTAINER REPO URL> and <YOUR CONTAINER REPO TAG> with your specific Docker repo image details from Step 1. An example container repo URL would look like this: public.ecr.aws/xxxxxxxxx/xxxxxxxxxx.
The deployment of the stacks and their resources happen in three stages. Please select “yes” at each stage to deploy the stated changes as shown below:
Deployed stacks and their resources
Optionally, you can include additional context variables in your command as seen below:
Note: In the example command above, the vpc_cidr specified is the same as mq_cidr. If you decide to use the above command, you will need to ensure that your vpc_cidr range is the same as your mq_cidr range. AWS recommends this as security best practice to ensure that your broker endpoint is only accessible from recognized IP ranges, see Security best practices for Amazon MQ.
More details on the above context variables:
broker_instance_type: Represents the instance type for the Amazon MQ Broker. You can start with the instance type mq.m5.large.
vpc_cidr: Allows you to customize the VPC’s CIDR block. The default CIDR is set to 10.42.0.0/16.
mq_cidr: Allows you set a specific security group CIDR range for the broker. This must be set to the vpc_cidr. From the sample command above, this is set to 10.0.0.0/16. For more flexibility with source IP ranges, you can edit the broker security group of your CDK deployment.
mq_username: Allows you to specify a username to access the ActiveMQ web console access and broker.
tasks: Determines the number of ECS tasks (1 or more) to run your Docker image. Since the OpenWire configuration file for both consumers and producers allow you to specify the number of clients that you want, all the clients in one ECS task will share the CPU and memory allocation for that task. You have the option to run multiple ECS tasks (with multiple clients) running the benchmark in parallel.
These adjustments allow for a more customized deployment to fit specific benchmarking needs and scenarios.
2.7 Benchmarking Execution
After deployment, you should see an output similar to the following:
Successful deployment of CDK application with output
1. Retrieve the TASK-ARN and access the Container
The above exec command in “outputs:” requires that you supply a <TASK-ARN> before the command can be run. To retrieve the <TASK-ARN> via the AWS CLI, you will need to do the following:
Run the below command and note down the Task ARN (needed later):
You can also retrieve this value via the Amazon ECS console by going to your ECS Cluster and choosing Tasks.
Access the running ECS task using the ECS Exec feature with the command that is output from the CDK deployment. The command should look like the following:
In both files, provide the brokerURL, username and password as they are required before starting the benchmarking process. The brokerURL and username can be obtained from the Amazon MQ console
Amazon MQ broker
Once you click into the deployed broker, you will find the brokerURL under the Endpoints section for OpenWire.
Endpoints in Amazon MQ console
The endpoint URL for OpenWire should be in this format:
Since you are using an active/standby broker, the test would only leverage the active broker URL and not both. The failover protocol automatically manages this exchange. The password can be retrieved from the AWS Secrets Manager console or via the CLI.
The following parameters and values can be adjusted in both producer and consumer properties file to suite your use case:
sendDuration: The sendDuration which represents the time taken for the producer/consumer test to run. Default value is set to 300000ms.
messageSize: The messageSize which adjusts the size of messages sent is set to 1024KB by default.
deliveryMode: The deliveryMode is set to persistent by default.
numClients: numClients sets the number of concurrent consumers, influencing message processing speed. It is set to 25 by default.
destName: destName represents the name of your destination queue or topic. You can change the name to your preference.
After populating both producer and consumer files with the required parameters, run the following maven commands (one after the other) in separate terminals to start the test:
Once each of the above tests complete, they provide a summary of the tests in stdout as shown below:
#########################################
####    SYSTEM THROUGHPUT SUMMARY    ####
#########################################
System Total Throughput: 562020
System Total Clients: 25
System Average Throughput: 1873.4000000000003
System Average Throughput Excluding Min/Max: 1860.8333333333333
System Average Client Throughput: 74.936
System Average Client Throughput Excluding Min/Max: 74.43333333333334
Min Client Throughput Per Sample: clientName=JmsProducer19, value=2
Max Client Throughput Per Sample: clientName=JmsProducer13, value=169
Min Client Total Throughput: clientName=JmsProducer0, value=20224
Max Client Total Throughput: clientName=JmsProducer5, value=23917
Min Average Client Throughput: clientName=JmsProducer0, value=67.41333333333333
Max Average Client Throughput: clientName=JmsProducer5, value=79.72333333333333
Min Average Client Throughput Excluding Min/Max: clientName=JmsProducer0, value=67.04333333333334
Max Average Client Throughput Excluding Min/Max: clientName=JmsProducer8, value=78.91
[main] INFO org.apache.activemq.tool.reports.XmlFilePerfReportWriter - Created performance report: /app/activemq-perftest/./reports/JmsProducer_numClients25_numDests1_all.xml
[INFO] ------------------------------------------------------------------------
[INFO] BUILD SUCCESS
[INFO] ------------------------------------------------------------------------
[INFO] Total time: 5:05.052s
[INFO] Finished at: Mon Apr 29 10:22:01 UTC 2024
[INFO] Final Memory: 15M/60M
[INFO] ------------------------------------------------------------------------
#########################################
####    SYSTEM THROUGHPUT SUMMARY    ####
#########################################
System Total Throughput: 562023
System Total Clients: 25
System Average Throughput: 1873.4100000000005
System Average Throughput Excluding Min/Max: 1864.6599999999996
System Average Client Throughput: 74.93640000000002
System Average Client Throughput Excluding Min/Max: 74.58639999999998
Min Client Throughput Per Sample: clientName=JmsConsumer13, value=0
Max Client Throughput Per Sample: clientName=JmsConsumer13, value=105
Min Client Total Throughput: clientName=JmsConsumer13, value=22475
Max Client Total Throughput: clientName=JmsConsumer14, value=22495
Min Average Client Throughput: clientName=JmsConsumer13, value=74.91666666666667
Max Average Client Throughput: clientName=JmsConsumer14, value=74.98333333333333
Min Average Client Throughput Excluding Min/Max: clientName=JmsConsumer13, value=74.56666666666666
Max Average Client Throughput Excluding Min/Max: clientName=JmsConsumer14, value=74.63333333333334
[main] INFO org.apache.activemq.tool.reports.XmlFilePerfReportWriter - Created performance report: /app/activemq-perftest/./reports/JmsConsumer_numClients25_numDests1_equal.xml
[INFO] ------------------------------------------------------------------------
[INFO] BUILD SUCCESS
[INFO] ------------------------------------------------------------------------
[INFO] Total time: 5:02.434s
[INFO] Finished at: Mon Apr 29 10:22:02 UTC 2024
[INFO] Final Memory: 14M/68M
[INFO] ------------------------------------------------------------------------
The above output is from a test performed and shown as sample output.
System Average Throughput and System Total Clients are the most useful metrics.
In the reports directory look for two xml files with more detailed throughput metrics. In the JmsProducer_numClients25_numDests1_all.xml file for example, jmsClientSettings and jmsFactorySettings captures different broker switches.
Each of the report files captures exact test and broker environment. Keeping these files around will allow you to compare performance between different test cases and analyze how a set of configurations have impacted performance.
For this test, the average throughput for a producer is around 1873 messages per second for 25 clients. Keep in mind that the broker instance is an mq.m5.large. You can get higher throughput with more clients and a larger broker instance. This test demonstrates the concept of running fast consumers while producing messages.
By following these guidelines and leveraging ECS Exec for direct access, you can deploy the ActiveMQ Classic Maven Performance test plugin, using AWS CDK. This setup allows you to customize and execute benchmark tests on Amazon MQ within an ECS task, facilitating an automated and efficient deployment and testing workflow.
Amazon MQ benchmarking architecture
Amazon MQ for ActiveMQ brokers can be deployed as a single-instance broker or as an active/standby broker. Amazon MQ is architected for high availability (HA) and durability. For HA and broker benchmarking, AWS recommends using the active/standby deployment. After a message is sent to Amazon MQ in persistent mode, the message is written to the highly durable message store which replicates the data across multiple nodes and Availability Zones.
Cleanup
To avoid incurring future charges for the resources deployed in this walkthrough, run the following command and follow the prompts to delete the CloudFormation stacks launched in 2.6 Customize and Deploy:
cdk destroy "*"
Conclusion
This post provides a detailed guide on performing benchmarking for Amazon MQ for ActiveMQ brokers leveraging the ActiveMQ Classic Maven Performance test plugin. Benchmarking plays a crucial role for customers migrating to Amazon MQ, as it offers insights into the broker’s performance under conditions that mirror their existing setup. This process enables customers to fine-tune their configurations and choose the appropriate instance type that aligns with their specific use case, ensuring optimal handling of their workloads’ throughput.
The Agence du Numérique en Santé (ANS), the French governmental agency for health, introduced the HDS certification to strengthen the security and protection of personal health data. By achieving this certification, AWS demonstrates our continuous commitment to adhere to the heightened expectations for cloud service providers.
The following 24 Regions are in scope for this certification:
US East (N. Virginia)
US East (Ohio)
US West (N. California)
US West (Oregon)
Asia Pacific (Hong Kong)
Asia Pacific (Hyderabad)
Asia Pacific (Jakarta)
Asia Pacific (Mumbai)
Asia Pacific (Osaka)
Asia Pacific (Seoul)
Asia Pacific (Singapore)
Asia Pacific (Sydney)
Asia Pacific (Tokyo)
Canada (Central)
Europe (Frankfurt)
Europe (Ireland)
Europe (London)
Europe (Milan)
Europe (Paris)
Europe (Stockholm)
Europe (Zurich)
Middle East (UAE)
Israel (Tel Aviv)
South America (São Paulo)
The HDS certification demonstrates that AWS provides a framework for technical and governance measures to secure and protect personal health data according to HDS requirements. Our customers who handle personal health data can continue to manage their workloads in HDS-certified Regions with confidence.
For up-to-date information, including when additional Regions are added, visit the AWS Compliance Programs page and choose HDS.
AWS strives to continuously meet your architectural and regulatory needs. If you have questions or feedback about HDS compliance, reach out to your AWS account team.
To learn more about our compliance and security programs, see AWS Compliance Programs. As always, we value your feedback and questions; reach out to the AWS Compliance team through the Contact Us page.
If you have feedback about this post, submit comments in the Comments section below.
The call for candidates
has gone out for the 2024 election of members of the Linux Foundation
Technical Advisory Board:
The TAB exists to provide advice from the kernel community to the
Linux Foundation and holds a seat on the LF’s board of directors;
it also serves to facilitate interactions both within the community
and with outside entities. Over the last year, the TAB has
overseen the organization of the Linux Plumbers Conference, advised
on the setup of the kernel CVE numbering authority, worked behind
the scenes to help resolve a number of contentious community
discussions, worked with the Linux Foundation on community
conference planning, and more.
To provide the best experiences, we use technologies like cookies to store and/or access device information. Consenting to these technologies will allow us to process data such as browsing behavior or unique IDs on this site. Not consenting or withdrawing consent, may adversely affect certain features and functions.
Functional
Always active
The technical storage or access is strictly necessary for the legitimate purpose of enabling the use of a specific service explicitly requested by the subscriber or user, or for the sole purpose of carrying out the transmission of a communication over an electronic communications network.
Preferences
The technical storage or access is necessary for the legitimate purpose of storing preferences that are not requested by the subscriber or user.
Statistics
The technical storage or access that is used exclusively for statistical purposes.The technical storage or access that is used exclusively for anonymous statistical purposes. Without a subpoena, voluntary compliance on the part of your Internet Service Provider, or additional records from a third party, information stored or retrieved for this purpose alone cannot usually be used to identify you.
Marketing
The technical storage or access is required to create user profiles to send advertising, or to track the user on a website or across several websites for similar marketing purposes.