Имат думата ЛГБТИ учениците. Докато не е забранено да говорят

Post Syndicated from Светла Енчева original https://www.toest.bg/imat-dumata-lgbti-uchenitsite-dokato-ne-e-zabraneno-da-govoryat/

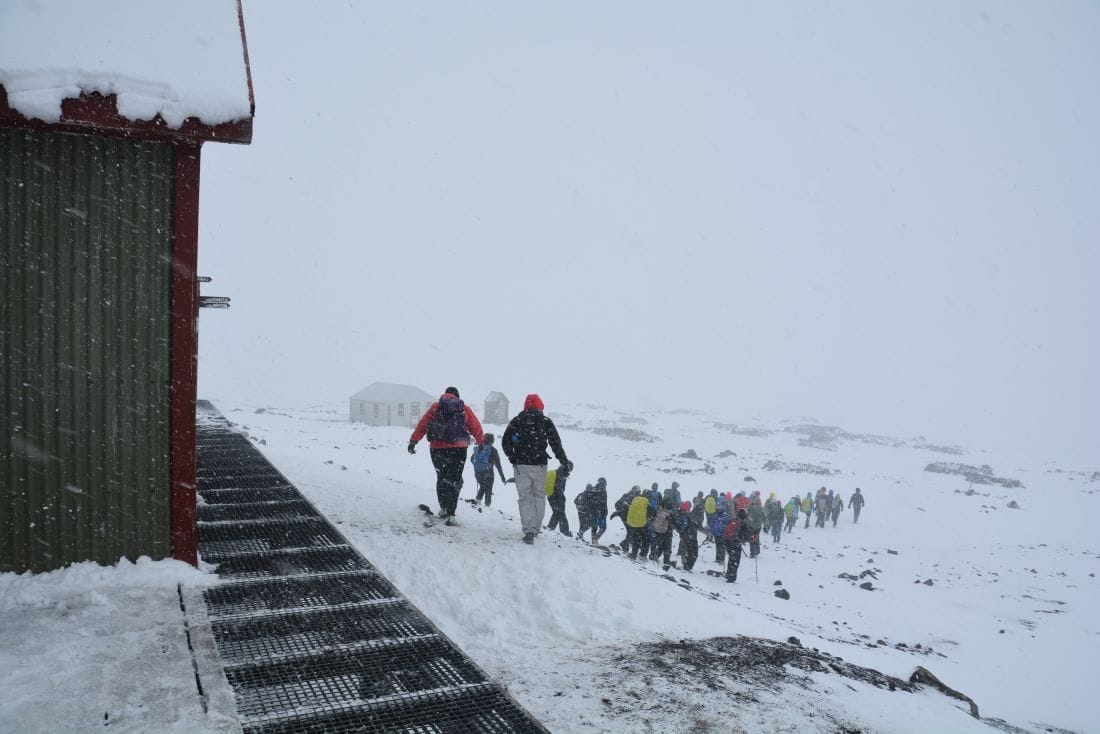
 Страх ме е да излизам от класната си стая. В коридора има момчета, който крещят: „Мразя гейчета и транс!“

Имат думата ЛГБТИ учениците. Докато не е забранено да говорят

Думите са на анонимен участник във второто национално проучване на нагласите към ЛГБТИ (лесбийки, гей, бисексуални, транс и интерсекс) учениците в българските училища. Докладът върху проучването беше представен в средата на ноември 2024 г. Изследването е проведено от фондация „Сингъл Степ“, като огромната част от работата е извършена от клиничната психоложка Нели Цветкова. То е анонимно и в него участват 1009 ученици от всички области в страната.

Тук следва да направя уточнението, че съм редакторка на доклада. Приех поканата да го редактирам заради важността на темата му в контекста на промените в Закона за предучилищното и училищното образование (ЗПУО), с които се забранява изразяването на всичко, свързано с ЛГБТИ, в училище. Самото изследване е проведено преди забраната, но анализът на резултатите е извършен след нея.

Няколко думи за изследването

То е проведено онлайн и не е представително. Не би и могло да бъде – за да има представително изследване, трябва да се направи извадка от генералната съвкупност, тоест от всички, които са представени в него. За тази цел трябва да е известно кои са те. Не съществува обаче статистика на ЛГБТИ хората, още по-малко на ЛГБТИ тийнейджърите. А и няма как да има, защото много от тях не са разкрити.

Друг въпрос е колко представителни са например предизборните проучвания в България, като имаме предвид, че по данни на ЦИК имащите право на глас са повече от цялото население на България според НСИ.

Въпреки че изследването на „Сингъл Степ“ не е представително и е на принципа на отзовалите се, то дава реалистична представа за общата ситуация. Участниците в него са сравнително пропорционално разпределени в различните области на страната. Освен това в анализа са приложени статистически коефициенти на корелация – например между нивата на тормоз и успеха в училище. Това е нещо, което няма да видите често в изследванията на общественото мнение, тиражирани в медиите.

Проучването не е просто „моментна снимка“ – то надгражда изследване по същата тема от 2018 г., проведено от „Сингъл Степ“ в сътрудничество с „Билитис“. Това дава възможност в анализа да се откроят разлики и да се очертаят тенденции.

Няколко думи за контекста и репресиите

Второто изследване на ЛГБТИ учениците в България се провежда шест години след първото. Всъщност това са годините, последвали конспиративната пропагандна кампания срещу Конвенцията на Съвета на Европа за превенция и борба с насилието над жени и домашното насилие, по-известна като Истанбулската конвенция. В резултат на създадената обществена истерия последваха решения на Конституционния и Върховния касационен съд, в резултат на които възможността за промяна на юридическия пол в България на практика беше премахната. Сравнението на резултатите от двете изследвания хвърля светлина върху щетите, нанесени върху ЛГБТИ тийнейджърите.

Самото проучване от 2024 г. се използва срещу създателите му и срещу неправителствените организации изобщо, преди резултатите от него да видят бял свят наред с популяризираната от бившата председателка на БСП Корнелия Нинова брошура за сексуалното здраве на лесбийките, дело на Фондация „Билитис“.

На заседание на парламентарната Комисия по въпросите на младежта и демографската политика представители на „Сингъл Степ“ и „Билитис“ бяха подложени на продължаващо с часове подобие на разпит. Те бяха питани за източниците им на финансиране, които впрочем са публични и прозрачни, а председателят на „Сингъл Степ“ Иван Димов трябваше да отговаря на въпроса дали има лиценз да извършва такова проучване. На положителния му отговор депутатка от „Възраждане“ реагира, че ще поиска отнемане на този лиценз.

А според присъстващата в залата директорка на Държавната психиатрична болница „Св. Иван Рилски“ д-р Цветеслава Гълъбова начинът на провеждане на проучването бил „престъпление срещу децата“. Не става ясно кое е престъпното в една анонимна онлайн анкета, нито кое кара един психиатър да стигне до подобно заключение.

От „Възраждане“ подават сигнали срещу „Сингъл Степ“ в редица институции, в резултат на което организацията месеци наред е обект на проверки. До този момент няма институция, която да е открила нещо нередно нито в дейността на организацията, нито в начина на провеждане на изследването.

Някои по-важни акценти от изследването

Шестте години на усилващи се анти-ЛГБТИ послания след кампанията срещу Истанбулската конвенция дават тревожни, макар и не неочаквани плодове. Увеличил се е делът на учениците, които споделят, че са чували хомофобски коментари в училище много често. През 2018 г. така отговарят 54,5%, а през 2024 г. – 62,5%. При това става въпрос за повишаване на хомофобските коментари не само от страна на учениците, а и на учителите. През 2018 г. 57,4% от участниците в изследването са чували такива реплики от свои учители, а шест години по-късно делът им е 68% – над 10% повече.

Успоредно с това намалява готовността на представителите на училищния персонал да вземат мерки, когато учениците споделят с тях, че са станали обект на тормоз или нападение по хомофобски или трансфобски причини. В 53,5% от случаите учителите не предприемат нищо, в сравнение с 46,6% през 2018 г. 14,3% от респондентите дори посочват, че учителите са им казали да си променят поведението – да не се държат „като гей“, да си променят облеклото и т.н. (преди шест години този дял е 11,4%).

Участници в изследването споделят, че избягват някои места в училище, където е вероятно да бъдат тормозени, например съблекални. В някои училища дори има обособени зони за хомофобски тормоз:

Из училище има хомофобски стикери и лепенки с обозначено място за среща за побой над ЛГБТИ+ хора.

Влошеният климат в училище води до по-ниски образователни резултати и влошено психично здраве. Анализът на изследването показва връзка между нивата на вербален тормоз и академичните постижения на учениците – колкото по-голям е тормозът, толкова повече се влошава успехът. Аналогично, по-високите нива на тормоз водят и до засилване на депресивните състояния.

Особено тревожен резултат е, че почти половината от анкетираните – 49,6% – сериозно са обмисляли самоубийство през последната година. През 2018 г. този дял е 41,2%.

Затова не е учудващо, че близо две трети (60,1%) от участниците в изследването планират да емигрират. Нито че почти три четвърти (72,4%) от обмислящите да напуснат България посочват като основен мотив сексуалната си ориентация или половата си идентичност.

Все пак, наблюдават се и отделни положителни тенденции. Например през 2018 г. 77,5% от учениците са можели да посочат поне един представител на училищния персонал, който според тях подкрепя ЛГБТИ хората. През 2024 г. така смятат вече 82,5% от участниците в изследването.

Също така, въпреки влошената обществена среда в резултат на антиджендър кампанията, ЛГБТИ учениците, изглежда, разполагат с повече източници на информация, което им помага да се самоопределят по-прецизно. Въпреки че такива опции не присъстват в анкетната карта, през 2024 г. 7,3% от участниците в изследването се определят в свободен текст като пансексуални, а 11,5% – като небинарни. През 2018 г. няма такива отговори. Тогава няма и никой, посочил, че е интерсекс (тоест полът му чисто биологически не може да се определи еднозначно като мъжки или женски), а шест години по-късно като такива са се определили 8 души.

А след още шест години?

Пренасянето на тенденции механично в бъдещето невинаги е добър прогностичен метод, защото някои неочаквани събития – или пък процеси, които дълго време са останали невидими – могат да обърнат тенденциите. С уговорката, ако в следващите шест години не настъпи обрат, резултатите от едно следващо проучване на ЛГБТИ учениците в България биха били още по-тревожни. Предпоставките за това са и от вътрешно-, и от външнополитическо естество.

Промените в образователния закон ще доведат до допълнително влошаване на училищната среда за ЛГБТИ тийнейджърите. Те ще могат да разчитат на по-малка подкрепа от преди поради страх (в някои случаи основателен) от страна на учители, училищни психолози и директори, че ако ги защитят или се опитат да им помогнат, това може да изложи тях (т.е. представителите на училищния персонал) на риск. Такива случаи вече има – например в Природо-математическата гимназия в София.

Освен това до приемането на поправката в ЗПУО против „пропагандата“ в училище ЛГБТИ учениците може и да са били дискриминирани и тормозени, но законодателството е на тяхна страна.

С определянето на „правилна“ и „неправилна“ сексуална ориентация и полова идентичност със закон и със забраната за обсъждане на „неправилните“, ЛГБТИ хората се оказват извън закона. За един тийнейджър това означава, че „вече е забранено да си гей“.

Във външнополитическо отношение преизбирането на Доналд Тръмп за президент на САЩ по всяка вероятност ще доведе до допълнителна публична легитимация на хомофобията и трансфобията. Както и до обличането на тази легитимация в различни правни форми. Перспективата България да направи геополитически завой към Русия също не вещае нищо добро за ЛГБТИ хората.

Тези тенденции биха могли и да се обърнат – например при един по-силен Европейски съюз, сплотен около стоящите в основата му демократични ценности. Или (което на този етап граничи с фантастиката, но нека не го изключваме напълно) при наличие на политически субекти с достатъчно обществена подкрепа в България, последователно отстояващи демократични ценности.

По-важен въпрос от този за резултатите от едно бъдещо изследване на ЛГБТИ учениците в България е дали изобщо ще има такова. Целта на многобройните проверки по сигнали на „Възраждане“, на които е подложен екипът на „Сингъл Степ“, е опит да се затвори устата на организацията, така че да няма информация какви са ефектите върху младите хора от сеенето на омраза с политически цели. Номерът очевидно не минава, но на един следващ етап подобни опити могат да приемат и законова форма. И подобни изследвания да се окажат забранени.

Тази хипотеза следва да се приеме сериозно, но не за да се плашим. А защото става все по-важно да не забравяме, че човешките права, демокрацията и свободата, включително свободата на изследване, не са даденост, а трябва да се отстояват непрекъснато. Ако гледаме на тях като на благодеяние, то много лесно може да бъде оттеглено.

NSO Group Spies on People on Behalf of Governments

Post Syndicated from Bruce Schneier original https://www.schneier.com/blog/archives/2024/11/nso-group-spies-on-people-on-behalf-of-governments.html

The Israeli company NSO Group sells Pegasus spyware to countries around the world (including countries like Saudi Arabia, UAE, India, Mexico, Morocco and Rwanda). We assumed that those countries use the spyware themselves. Now we’ve learned that that’s not true: that NSO Group employees operate the spyware on behalf of their customers.

Legal documents released in ongoing US litigation between NSO Group and WhatsApp have revealed for the first time that the Israeli cyberweapons maker ­ and not its government customers ­ is the party that “installs and extracts” information from mobile phones targeted by the company’s hacking software.

Hosting containers at the edge using Amazon ECS and AWS Outposts server

Post Syndicated from aostan original https://aws.amazon.com/blogs/compute/hosting-containers-at-the-edge-using-amazon-ecs-and-aws-outposts-server/

This post is written by Craig Warburton, Hybrid Cloud Senior Solutions Architect and Sedji Gaouaou, Hybrid Cloud Senior Solutions Architect

In today’s fast-paced digital landscape, businesses are increasingly looking to process data and run applications closer to the source, at the edge of the network. For those seeking to use the power of containerized workloads in edge environments, AWS Outposts servers offer a compelling solution. This fully managed service brings the AWS infrastructure, services, APIs, and tools to virtually any on-premises or edge location, allowing users to run container-based applications seamlessly across their distributed environments. In this post, we explore how Outposts servers can empower organizations to deploy and manage containerized workloads at the edge, bringing cloud-native capabilities closer to where they’re needed most.

Solution overview

Amazon Elastic Container Service (Amazon ECS) is a fully managed container orchestration service that can be used with Outposts servers. This combination allows users to run containerized applications at the edge with the same ease and flexibility as in the AWS cloud.

By using Outposts server with Amazon ECS, users can effectively extend their container-based workloads to the edge, enabling new use cases and improving application performance for latency-sensitive operations.

The following diagram illustrates an example architecture where a user is looking to deploy a microservices based PHP web application and instance based MySQL database. Furthermore, a container based load balancer appliance is used to receive and distribute traffic to the web application container. The example application writes its data to a MySQL database, which is hosted on an external storage array. The application is deployed on the Outpost server, and can communicate with the database across the user data center network.

In this post we will show how users can deploy an example microservice based application. Each section of this post walks through Steps 1 through 4 shown in the following diagram.

Figure 1: Solution overview

Figure 1: Solution overview

Walkthrough

Prerequisites

Before deploying the sample application, you must have ordered, received, and successfully installed an Outposts server. The server is operational and visible in the AWS Management Console.

This walkthrough assumes you have access to Amazon Elastic Container Registry (Amazon ECR) that is used for the container repository.

You need the following AWS Identity and Access Management (IAM) role provisioned with the necessary permissions included in the policy to permit the load balancer to read the required Amazon ECS attributes. Refer to the user guide Create a role to delegate permissions to an IAM user section to help you through creating an IAM role and associated policy. The Amazon ECS task IAM role needs the following policy configuration to read the necessary Amazon ECS information:

{
    "Version": "2012-10-17",
    "Statement": [
        {
            "Sid": "LoadBalancerECSReadAccess",
            "Effect": "Allow",
            "Action": [
                "ecs:ListClusters",
                "ecs:DescribeClusters",
                "ecs:ListTasks",
                "ecs:DescribeTasks",
                "ecs:DescribeContainerInstances",
                "ecs:DescribeTaskDefinition",
                "ec2:DescribeInstances",
                "ssm:DescribeInstanceInformation"
            ],
            "Resource": [
                "*"
            ]
        }
    ]
}

You also need the Amazon ECS task execution IAM role (ecsTaskExecutionRole) that will grant the Amazon ECS container service the necessary permissions to make AWS API calls on your behalf.

Step 1: Setting up Amazon ECS on Outposts server

Amazon ECS is used in this walkthrough to deploy our container workloads to the Outposts server. Before deploying workloads, an ECS cluster on Outposts needs to be created.

In this configuration, the Amazon ECS cluster targets the private subnets (10.0.1.0/24 and 10.0.2.0/24) and the Amazon Elastic Compute Cloud Amazon (EC2) instances configured on the Outpost server for deployments.

To assist in targeting the deployment of our Amazon ECS services to specific instances with an attached Local Network Interface (LNI), our Amazon EC2 instances are assigned a logical role using custom Amazon ECS container instance attributes. Custom attributes are used to configure task placement constraints, as shown in the following figure.

Figure 2: Amazon ECS container instances used for tasks

Figure 2: Amazon ECS container instances used for tasks

One of the container instances is assigned the role of loadbalancer, as shown in the following figure. Follow the developer guide section to Define which container instances Amazon ECS uses for tasks, and add the following custom attribute to one of your instances:

  • Name = role, Value = loadbalancer

Figure 3: Instance with the Custom Attibutes - loadbalancer

Figure 3: Instance with the Custom Attibutes – loadbalancer

The other container instance is assigned the role of webserver, as shown in the following figure. Add the following custom attribute to each of the remaining instance:

  • Name = role, Value = webserver

Figure 4: Instance with the Custom Attibutes - webserver

Figure 4: Instance with the Custom Attributes – webserver

Step 2: Deploying a load balancer with host mode to use LNI

In this section, you deploy a task for the load balancer as seen in Step 2 of the Solution overview.

First, you must enable the private subnet, where your load balancer is deployed, for LNIs:

aws ec2 modify-subnet-attribute \

    --subnet-id subnet-1a2b3c4d \

    --enable-lni-at-device-index 1

Now add an LNI to the container instance with the attibute “loadbalancer”. This instance can now access your local network.

To deploy the load balancer, create an Amazon ECS task definition named “task-definition-loadbalancer.json”, which describes the container configuration to implement the load balancer as followed:

{
    "containerDefinitions": [
        {
            "name": "loadbalancer",
            "image": "traefik:latest",
            "cpu": 0,
            "portMappings": [
                {
                    "containerPort": 80,
                    "hostPort": 80,
                    "protocol": "tcp"
                },
                {
                    "containerPort": 8080,
                    "hostPort": 8080,
                    "protocol": "tcp"
                }
            ],
            "essential": true,
            "command": [
                "--api.dashboard=true",
                "--api.insecure=true",
                "--accesslog=true",
                "--providers.ecs.ecsAnywhere=false",
                "--providers.ecs.region=<AWS_REGION>",
                "--providers.ecs.autoDiscoverClusters=true",
                "--providers.ecs.clusters=<YOUR_CLUSTER_NAME>",
                "--providers.ecs.exposedByDefault=true"
            ],
            "environment": [],
            "mountPoints": [],
            "volumesFrom": [],
            "systemControls": []
        }
    ],
    "family": "loadbalancer",
    "taskRoleArn": <TASK_ROLE_ARN>,
    "executionRoleArn": <EXECUTION_ROLE_ARN>,
    "networkMode": "host",
    "volumes": [],
    "placementConstraints": [
        {
            "type": "memberOf",
            "expression": "attribute:role == loadbalancer"
        }
    ],
    "requiresCompatibilities": [
        "EC2"
    ],
    "cpu": "256",
    "memory": "128",
    "tags": []
}

Replace the string <TASK_ROLE_ARN> with the Amazon Resource Name (ARN) of the IAM role configured with the LoadBalancerECSReadAccess policy and the string <EXECUTION_ROLE_ARN> with the ARN of the IAM role configured with the ecsTaskExecutionRole policy as configured in the Prerequisites section, <AWS_REGION> with the AWS Region where you deployed your ECS cluster, <YOUR_CLUSTER_NAME> with your cluster name.

Some points to consider:

  • The Amazon ECS Network mode is set to “host”. The load balancer task uses the host’s network to access the LNI.
  • The task definition includes the placement constraint matching the loadbalancer custom attribute value.

Lastly, register the task definition with your cluster and create the loadbalancer service using the following AWS Command Line Interface (AWS CLI) command:

aws ecs register-task-definition --cli-input-json file://task-definition-loadbalancer.json

aws ecs create-service--cluster <CLUSTER_NAME> --service-name loadbalancer --task-definition loadbalancer:1 --desired-count 1

Replace the string <CLUSTER_NAME> with the target Amazon ECS cluster name.

The load balancer is now running.

Connecting to the Amazon EC2 instance with the attibute loadbalancer using Session Manager, you can get the following LNI IP address:

Figure 5: Getting the LNI IP

Figure 5: Getting the LNI IP

You can access the web user interface by browsing to the URL from your local network:

http://<HOST_IP>:8080/dashboard/

Replace the string <HOST_IP> with the Amazon EC2 instance host LNI IP address, or DNS hostname.

Step 3: Deploying sample web application in awsvpc mode

First, make sure that the AWSVPC Trunking is turned on, as shown in the following figure:

Figure 6: Enabling AWSVPC Trunking

Figure 6: Enabling AWSVPC Trunking

Create an Amazon ECS task definition for our application named “task-definition-webapp.json”, which describes the container configuration to implement the example web application as followed:

Replace the <PLACEHOLDER> values for your application.

{
    "containerDefinitions": [
        {
            "name": "whoami",
            "image": "<CONTAINER-IMAGE>:latest",
            "cpu": 0,
            "portMappings": [
                {
                    "name": "<WEBAPP>",
                    "containerPort": 80,
                    "hostPort": 80,
                    "protocol": "tcp"
                }
            ],
            "essential": true,
            "environment": [],
            "mountPoints": [],
            "volumesFrom": [],
            "dockerLabels": {
"traefik.http.routers.<WEBAPP>-host.rule":     "Host(`<WEBAPP>.domain.com`)",
               "traefik.http.routers.<WEBAPP>-path.rule": "Path(`/<WEBAPP>`)",
               "traefik.http.services.<WEBAPP>.loadbalancer.server.port": "80"
            },
            "systemControls": []
        }
    ],
    "family": "<WEBAPP>",
    "networkMode": "awsvpc",
    "volumes": [],
    "placementConstraints": [
        {
            "type": "memberOf",
            "expression": "attribute:role == webserver"
        }
    ],
    "requiresCompatibilities": [
        "EC2"
    ],
    "cpu": "256",
    "memory": "128",
    "tags": []
}

In the task-definition-webapp.json, consider the following:

  • The task definition includes the placement constraint matching the webserver custom attribute value.
  • Docker label traefik.http.routers is used to configure host and path based routing rules.
  • As the example web application container exposes the single TCP port 80, Docker label traefik.http.services.<WEBAPP> is used to configure this port for private communication with the Traefik load balancer.

Register the task definition with your cluster and create the loadbalancer service using the following AWS CLI command:

aws ecs register-task-definition --cli-input-json file://task-definition-webapp.json

aws ecs create-service--cluster <CLUSTER_NAME> --service-name <WEBAPP> --task-definition <WEBAPP>:1 --desired-count 1

Replace the string <CLUSTER_NAME> with the target Amazon ECS cluster name and the string <WEBAPP> with your application.

You can access the whoami application by browsing to the URL from your local network:

http://<HOST_IP>/<WEBAPP>

Step 4: Provision DB instance and attach an external storage

The web application has been successfully deployed, so we will move on to the deployment and configuration of the database server next. First, deploy an Amazon EC2 instance to host a MySQL database. As shown in the following screenshot, use the AWS Console to choose an instance type (this is dependent on your Outposts server instance capacity configuration) and configure its network settings to target the correct VPC and the subnet deployed to the Outposts server.

Figure 7: Provisioning a database instance

Figure 7: Provisioning a database instance

When the instance is available, deploy MySQL following a standard documented approach to install on a Linux host from the vendor. After successfully installing MySQL, configure users and tables necessary for the application. The sample application configuration file can now be updated to allow the PHP web server container to connect to the MySQL database, as well as create a user and list the users, as shown in the following figures.

Figure 8: Updating the application config file to use the database instance

Figure 8: Updating the application config file to use the database instance

Figure 9: Sample application connected to database

Figure 9: Sample application connected to database

For the database instance, make sure that the data associated with the application is stored on an existing storage array in the user data center. To do this, you must complete the following:

(a) Enable connectivity to the user network through the LNI.

(b) Mount the iSCSI volume in the EC2 instance.

(c) Configure MySQL to use this iSCSI volume.

To enable connectivity, follow the same process described in step 2 of this post to add an Elastic Network Interface (ENI) with the correct device index to present the LNI to the instance. The following screenshots show a second ENI configured on the instance and associated with the LNI along with the interface and address configuration of the instance that shows two addresses (VPC and user network addresses).

Figure 10: Network interface configuration

Figure 10: Network interface configuration

Now that connectivity has been established to the user network, you can configure the storage array to present an ISCSI volume to the database instance and mount that volume. The following screenshot shows the /mnt mountpoint being used with iSCSI multi-path across four volumes.

Figure 11: iSCSI volume mount

Figure 11: iSCSI volume mount

Finally, configure MySQL to use the iSCSI volume to store data by stopping the MySQL service, updating the default configuration file /etc/my.cnf, and restarting MySQL, as shown in the following figure.

Figure 12: MySQL configuration

Figure 12: MySQL configuration

Clean up:

Please follow the below instructions to clean up after testing:

  • Delete the <WEBAPP> service
  • Delete the loadbalancer service
  • Delete your Amazon ECS cluster
  • Delete the MySQL Database EC2 instance
  • Delete all VPCs

Conclusion

This post has demonstrated how to deploy a sample container-based web application while connecting to the user network, allowing access to the application and connecting to existing storage appliances.

AWS Outposts server allows users to run containers at the edge, addressing challenges related to low latency, local data processing, and data residency. Amazon ECS allows you to deploy consistently, whether in-Region or at the edge, allowing users to develop once and deploy many times.

Get started with Outposts servers by visiting the Outposts servers webpage and learn more about Amazon ECS to begin deploying your containarized workloads at the edge!

Били. Метаморфози

Post Syndicated from Тоест original https://www.toest.bg/bili-metamorfozi/

Били. Метаморфози

Появява се
и тази представа за рая:
в куче или в лъв да се вселиш,
защо не и в тигър като тебе, Били,
да лежиш под прозорците в онази стая, обляна от
светлина със знаменателна текстура,
да си един от домашните любимци
на светеца, който превежда ли, превежда
свещените писания.
Преди светът да почне сам
да си превежда най-насъщното
на милионите езици на своите потребности.

И се появява
напращяла благородна смелост,
готова да се хвърли,
да разкъса сред звънтеж
на рицарски доспехи.

Тигре Били,
ревът ти пурпурен
достоен е да украсява някой герб.
Преди гербът на бутафория да се обърне.

И се появява
на задна уличка
възрастна жена с рокля на цветя
и с поглед, който обяснява.

С каишка те разхожда.
А ти, проскубан леко, безсилен
срещу пиратските нашествия
на днешното ти време, котарако Били,
рицарски подкрепяш този поглед,
блясъка в него, който се рее
в това стечение на светлината. 

Калоян Игнатовски


Калоян Игнатовски (р. 1976) е автор на четири стихосбирки, последната от които – „Водата на деня“, е публикувана през август 2024 г. Литературен преводач от английски и испански език, редактор. През 2012 г. заедно със Силвия Чолева и Иглика Василева основава Издателство за поезия ДА.


Според Екатерина Йосифова „четящият стихотворение сутрин… добре понася другите часове“ от деня. Убедени, че поезията държи умовете ни будни, а сърцата – отворени, в края на всеки месец ви предлагаме по едно стихотворение. Защото и в най-смутни времена доброто стихотворение е добра новина.

На север: Снежни лета в една исландска хижа (втора част)

Post Syndicated from Светла Стоянова original https://www.toest.bg/na-sever-snezhni-leta-v-edna-islandska-hizha-vtora-chast/

<< Към първа част

На север: Снежни лета в една исландска хижа (втора част)

Дойде август. Дни наред ветровете са със скорост 70 км/ч, вали обилно, снегът преминава в дъжд и обратното. Повечето туристи не са подготвени за зимни условия и молят за място в хижата, искали да палаткуват, но такъв вариант в това време няма. „Не погледнахте ли прогнозата, преди да тръгнете? Не чухте ли, че идват страшни ветрове? – питам ги, а те смутено клатят глави. – Излагате се на опасност, ветровете в Исландия могат да ви повалят, а спре ли човек да си почине, измръзването идва неочаквано бързо.“ Тази вечер хижата е със свръхколичество матраци, оползотворен е всеки метър, приютяваме и последния стигнал дотук. Надяваме се останалите да са направили обратен завой навреме…

Бяхме назначени за хижари в една от високопланинските хижи в Исландия. Нейното привидно сложно име – „Храпънтинюскер“ (исл. Hrafntinnusker) – е и името на местността. Дългите думи в исландския език се състоят от множество прости като в немския. В случая с „Храпънтинюскер“ се започва отзад напред: „скер“ е братовчед на английското skerry, означаващо „скален остров, шхери“, а „храпънтина“ означава „обсидиан, вулканично черно стъкло“. Но загадката не се изчерпва с това, защото вместо международната дума „обсидиан“ исландците създават своя сложна дума от храпън“ ‘гарван’ и тина“ ‘камък’. Тоест

„Храпънтинюскер“ буквално означава Скалният остров на гарвановия камък.

Името много подхожда на местността, която в периметър от 3 км е обсипана именно с лъскавия като гарванови пера камък. Съседните ни хижи също имаха подобни живописни имена, като „Аулфтавахтън“ – Езерото с лебедите, „Квангил“ – Каньонът с лечебната пищялка, или „Тоурсмьорк“ – Долината на Тор.

Във всяка хижа работят между двама и шестима хижари, които се подготвят за цялото лято с хранителни запаси, тъй като най-близкият магазин е на 3–4 часа път пеш, а после още толкова с автомобил по неравен планински път. В моя случай бяхме двама и работихме в продължение на три месеца.

Ежедневно приемахме по стотина туристи – в хижата, къмпинга или просто преминаващи.

Осведомявахме ги за времето, за допълнителни живописни пътеки наоколо, както и за състоянието на пътя до следващата спирка от прехода. Отговаряхме за това хижата да бъде приветлива и уютна, както и колчетата по пътеката да бъдат видими дори и в мъгла. При възникнали проблеми оказвахме помощ и намирахме решения. Продавахме ограничен набор от суха храна и други полезни неща, като ръчно плетени ръкавици, чорапи и шапки от топла исландска вълна.

През летните месеци постоянно имаше или топящ се сняг, или нов снеговалеж. При откриването на сезона през юни всичко бе потънало в три метра сняг, затова трябваше да изкопаем снежен тунел, за да стигнем до вратата. С лопати оформихме импровизирано стълбище в снега, което с всеки следващ ден се снишаваше от топенето. Отварянето на вратата също си беше усилие, тъй като снегът бе натежал от едната страна на къщата и бе изместил всички прави линии.

В началото на сезона ни закараха с огромен планински автомобил. За лятото се бяхме подсигурили с десетина кашона зимнина и провизии. Предварително бяхме приготвили десетки буркани с конфитюр от ръчно брани боровинки и ревен, както и най-разнообразни ферментации – кисело зеле, червено цвекло и моркови. Бяхме купили 20 кг брашно от пшеница, ръж и ечемик, за да си правим квасен хляб и палачинки. Имахме и домашно кисело мляко и сирене. Запасихме се колкото можахме с пресни плодове и зеленчуци, както и със суха храна, като ориз, булгур, паста, леща, боб, нахут и др. От време на време приятели ни идваха на гости и ни носеха шоколади и кафе, а мама пък изпращаше с колетчета сушени гъби и домати, ядки и вкусни рибни консервички. В останалите случаи слизахме пеш 12 км по планинска пътека и 500 м денивелация до съседните хижи. Оттам до града се стигаше със специален автобус, който прекосяваше три реки по пътя си.

Електричеството в хижата се осигуряваше от соларни панели, а водата се набавяше от близката ледникова река. Отоплението представляваше сложна система, свързана с горещ извор, който поддържаше температура до 20 градуса. Затова в добре затопленото коридорче изсъхваха и най-мокрите якета и обувки. В края на сезона през септември обаче водопроводните тръби замръзваха и носехме вода на гръб от близката река. Хижата разполагаше с три помещения с легла и матраци без чаршафи, тъй като всеки си носеше спален чувал. Освен трите общи спални за 50 души имаше и кухня с котлони и посуда, тъй като всички туристи си готвеха сами. Често идваха и организирани групи с екскурзовод, който вечер влизаше в ролята на готвач.

Мобилен обхват имаше само по височините, но за работа разполагахме с безжичен интернет от сателит. Когато връзката изчезнеше, се катерехме по близкия хълм с лаптоп в ръка в слънце и мъгла, за да проверим прогнозата за времето и да можем да информираме туристите. За къмпингуващите имаше заслон, както и импровизирани заоблени стени от обсидиан, които предпазваха палатките от силните ветрове. С другите пет хижи общувахме чрез радиостанция.

Всеки петък вечер след края на работния ден по традиция се провеждаше конкурс по радиопоезия.

Темата се даваше предния ден и всяка хижа се включваше със стихотворение, плод на споделено творчество. След като всички творби се изчетяха по шумолящата радиостанция, участниците даваха оценки и победителите получаваха правото да измислят темата за следващия път. Стихотворчеството ни сплотяваше, когато времето не позволяваше на нас, хижарите, да си ходим на гости. Освен по радиостанцията, понякога си изпращахме и истински писма, пренасяни от хижа на хижа чрез наземните ни пощенски гълъби – туристите.

При спешни случаи на линия беше планински спасителен екип, който пристигаше с автомобил за първа помощ или с медикоптер. През сезоните имахме случаи с навехнати крайници, алергични реакции, камъни в бъбреците и сърдечни проблеми. Първата помощ и транспортът до болнично заведение са безплатни за пострадалите, тъй като държавата ги осигурява. Но тъй като пострадалите често се оказват недостатъчно подготвени чуждестранни туристи, някои исландци не желаят да плащат данъци за спасяването на хора, които не знаят къде са тръгнали.

На няколко километра от хижата е издигната каменна пирамида в памет на загинал преди десетина години младеж. Той пренебрегва съвета на местните да не тръгва заради очакваното влошаване на времето и буря. Подценява прогнозата и без карта, навигация или представа за пътя се изгубва и изпада в хипотермия. Спасителните служби го намират твърде късно. Въпреки строгите мерки, подобен случай имахме и ние:

Беше 29 юни, а навън се вихреше снежна буря. В 18 ч. ми се обадиха от 112 – възрастен мъж се е загубил по пътя. Вероятно е наблизо, но не може да продължи, защото е изтощен и не знае накъде да върви. В подобни ситуации обикновено отговаря местната спасителна служба, чийто пункт е на около 10 км, но предвид факта, че човекът вероятно е близо до хижата, ни помолиха да го потърсим. Бързо облякох непромокаемото яке и светлоотразителната жилетка, приготвих вода, шоколад, допълнителен чифт ръкавици и с бинокъл на врата и радиостанция на колана хукнах да го търся. Снежната буря беше поутихнала, но видимостта беше лоша – като неясна черно-бяла снимка. Новият слой сняг беше заличил напълно пътеката. Познавах околността добре, вървях в указаната посока и поглеждах през бинокъла. Надявах се, че мъжът е останал на пътеката или поне е близо до нея, защото иначе периметърът на търсене щеше много да се увеличи.

Вървях в бялата пустош и търсех. Следвах каменните пирамиди, обозначаващи пътя, и изведнъж забелязах очертанията на човешка фигура. Той ли беше? Помахах и ми отвърна! Възрастен мъж без ръкавици и шапка, с мътни, мокри очила, вир-вода насред снега. Беше се подпрял на камъните и едва се държеше на краката си. Хванах го под ръка и му подадох щека. Олюлявайки се от умора, той закуцука. Залисах го с въпроси за семейството и страната му и малко по малко духът му се възвърна, а стъпките станаха по-уверени. Така извървяхме отсечката до хижата. Посъветвахме го да обмисли добре дали да продължи нататък с прехода, но отпочинал, на следващия ден той все пак пое напред с нови сили.

На север: Снежни лета в една исландска хижа (втора част)
Училищна група от 50 деца тръгва на път в снежната мъгла през август © Светла Стоянова

През сезоните се запознахме с чудесни хора, чухме вдъхновяващи истории за оцеляване в дивото и в истински свирепото исландско време. Хората пристигаха откъде ли не – от Австралия до Япония, от Мексико до България. Сред тях

най-възрастният турист беше 81-годишен, а най-малкият – едва на годинка.

Хората се движеха по двойки, с приятели, с малки деца, в организирани групи, но и соло. За едни преходът беше предизвикателство за тялото и духа, за други – по-натоварваща екскурзия. Някои от тях посещаваха Исландия само за да усетят пеш отличителните страни на исландската природа, придвижвайки се бавно от пейзаж в пейзаж и далеч от удобствата на модерния свят.

Заради срещите ни със стотиците туристи – от опитните планинари до напълно безпомощните, подценили ситуацията – се чувствам задължена да спомена, че за да минимизираме неприятните ситуации при преходи на подобни труднодостъпни места, преди всичко трябва да сме добре подготвени – със здрави обувки, с водонепромокаеми дрехи, както и с резервни за смяна. Винаги да си носим достатъчно храна за всеки от дните, аптечка, навигация или карта и компас, но и да знаем как да ги използваме. Да проучим добре какво ни очаква като терен, физическо натоварване и метеорологични условия, както и да предупредим някой близък къде отиваме. Защото планината е голяма и лошото време дебне отвсякъде.

Вървиш ли, бъди готов да те повали ненадеен порив. Изправиш ли се, трябва да посрещнеш следващия удар. Стисни здраво щеки, напрегни мускули и гледай напред – кой знае, може би ще утихне…

Тук дървета няма и вятърът не се вижда. Само се чува. Той вие, свисти и фучи, блъска се в къщата, обикаля я като вихрушка и продължава все така вихрено по пътя си. Нависоко разстила облаците като с точилка, а те се разливат на пластове като палачинки, удàри ли залезният час, сменят палитрата си неколкократно. В ниското вятърът помита вулканичния прах на вълни, а той остава да виси във въздуха като сива мъгла.

Знамето на хижата стои като заковано в една-единствена посока и плющи на къси амплитуди като птица, учеща се да лети. Сякаш и то още малко и ще литне, ще бъде отвяно и понесено в безкрая. Пилонът, който сам не спира да се клати заплашително, го държи и не го пуска. Това обаче коства живота на знамето, което конец по конец се разбридва, нишка по нишка се разкъсва и се оплита само в себе си. Поредното знаме, което не устоя на вятъра. Да се опитам ли да го зашия? Не, и най-здравият ми шев едва ли ще го спаси.

(Следва продължение.)

На север: Снежни лета в една исландска хижа (втора част)
Знаме на вятъра © Светла Стоянова

Time-based snapshot copy for Amazon EBS

Post Syndicated from Jeff Barr original https://aws.amazon.com/blogs/aws/time-based-snapshot-copy-for-amazon-ebs/

You can now specify a desired completion duration (15 minutes to 48 hours) when you copy an Amazon Elastic Block Store (Amazon EBS) snapshot within or between AWS Regions and/or accounts. This will help you to meet time-based compliance and business requirements for critical workloads. For example:

Testing – Distribute fresh data on a timely basis as part of your Test Data Management (TDM) plan.

Development – Provide your developers with updated snapshot data on a regular and frequent basis.

Disaster Recovery – Ensure that critical snapshots are copied in order to meet a Recovery Point Objective (RPO).

Regardless of your use case, this new feature gives you consistent and predictable copies. This does not affect the performance or reliability of standard copies—you can choose the option and timing that works best for each situation.

Creating a Time-Based Snapshot Copy
I can create time-based snapshot copies from the AWS Management Console, CLI (copy-snapshot), or API (CopySnapshot). While working on this post I created two EBS volumes (100 GiB and 1 TiB), filled each one with files, and created snapshots:

To create a time-based snapshot, I select the source as usual and choose Copy snapshot from the Action menu. I enter a description for the copy, choose the us-east-1 AWS Region as the destination, select Enable time-based copy, and (because this is a time-critical snapshot), enter a 15 minute Completion duration:

When I click Copy snapshot, the request will be accepted (and the copy will become Pending) only if my account’s throughput quotas are not already exceeded due to the throughput consumed by other active copies that I am making to the destination region. If the account level throughput quota is already exceeded, the console will display an error.

I can click Launch copy duration calculator to get a better idea of the minimum achievable copy duration for the snapshot. I open the calculator, enter my account’s throughput limit, and choose an evaluation period:

The calculator then uses historical data collected over the course of previous snapshot copies to tell me the minimum achievable completion duration. In this example I copied 1,800,000 MiB in the last 24 hours; with time-based copy and my current account throughput quota of 2000 MiB/second I can copy this much data in 15 minutes.

While the copy is in progress, I can monitor progress using the console or by calling DescribeSnapshots and examining the progress field of the result. I can also use the following Amazon EventBridge events to take actions (if the copy operation crosses regions, the event is sent in the destination region):

copySnapshot – Sent after the copy operation completes.

copyMissedCompletionDuration – Sent if the copy is still pending when the deadline has passed.

Things to Know
And that’s just about all there is to it! Here’s what you need to know about time-based snapshot copies:

CloudWatch Metrics – The SnapshotCopyBytesTransferred metric is emitted in the destination region, and reflect the amount of data transferred between the source and destination region in bytes.

Duration – The duration can range from 15 minutes to 48 hours in 15 minute increments, and is specified on a per-copy basis.

Concurrency – If a snapshot is being copied and I initiate a second copy of the same snapshot to the same destination, the duration for the second one starts when the first one is completed.

Throughput – There is a default per-account limit of 2000 MiB/second between each source and destination pair. If you need additional throughput in order to meet your RPO you can request an increase via the AWS Support Center. Maximum per-snapshot throughput is 500 MiB/second and cannot be increased.

Pricing – Refer to the Amazon EBS Pricing page for complete pricing information.

Regions – Time-based snapshot copies are available in all AWS Regions.

Jeff;

Run Apache XTable in AWS Lambda for background conversion of open table formats

Post Syndicated from Matthias Rudolph original https://aws.amazon.com/blogs/big-data/run-apache-xtable-in-aws-lambda-for-background-conversion-of-open-table-formats/

This post was co-written with Dipankar Mazumdar, Staff Data Engineering Advocate with AWS Partner OneHouse.

Data architecture has evolved significantly to handle growing data volumes and diverse workloads. Initially, data warehouses were the go-to solution for structured data and analytical workloads but were limited by proprietary storage formats and their inability to handle unstructured data. This led to the rise of data lakes based on columnar formats like Apache Parquet, which came with different challenges like the lack of ACID capabilities.

Eventually, transactional data lakes emerged to add transactional consistency and performance of a data warehouse to the data lake. Central to a transactional data lake are open table formats (OTFs) such as Apache Hudi, Apache Iceberg, and Delta Lake, which act as a metadata layer over columnar formats. These formats provide essential features like schema evolution, partitioning, ACID transactions, and time-travel capabilities, that address traditional problems in data lakes.

In practice, OTFs are used in a broad range of analytical workloads, from business intelligence to machine learning. Moreover, they can be combined to benefit from individual strengths. For instance, a streaming data pipeline can write tables using Hudi because of its strength in low-latency, write-heavy workloads. In later pipeline stages, data is converted to Iceberg, to benefit from its read performance. Traditionally, this conversion required time-consuming rewrites of data files, resulting in data duplication, higher storage, and increased compute costs. In response, the industry is shifting toward interoperability between OTFs, with tools that allow conversions without data duplication. Apache XTable (incubating), an emerging open source project, facilitates seamless conversions between OTFs, eliminating many of the challenges associated with table format conversion.

In this post, we explore how Apache XTable, combined with the AWS Glue Data Catalog, enables background conversions between OTFs residing on Amazon Simple Storage Service (Amazon S3) based data lakes, with minimal to no changes to existing pipelines in a scalable and cost-effective way, as shown in the following diagram.

This post is one of multiple posts about XTable on AWS. For more examples and references to other posts, refer to the following GitHub repository.

Apache XTable

Apache XTable (incubating) is an open source project designed to enable interoperability among various data lake table formats, allowing omnidirectional conversions between formats without the need to copy or rewrite data. Originally open sourced in November 2023 under the name OneTable, with contributions from amongst others OneHouse, it was licensed under Apache 2.0. In March 2024, the project was donated to the Apache Software Foundation (ASF) and rebranded as Apache XTable, where it is now incubating. XTable isn’t a new table format but provides abstractions and tools to translate the metadata associated with existing formats. The primary objective of XTable is to allow users to start with any table format and have the flexibility to switch to another as needed.

Inner workings and features

At a fundamental level, Hudi, Iceberg, and Delta Lake share similarities in their structure. When data is written to a distributed file system, these formats consist of a data layer, typically Parquet files, and a metadata layer that provides the necessary abstraction (see the following diagram). XTable uses these commonalities to enable interoperability between formats.

The synchronization process in XTable works by translating table metadata using the existing APIs of these table formats. It reads the current metadata from the source table and generates the corresponding metadata for one or more target formats. This metadata is then stored in a designated directory within the base path of your table, such as _delta_log for Delta Lake, metadata for Iceberg, and .hoodie for Hudi. This allows the existing data to be interpreted as if it were originally written in any of these formats.

XTable provides two metadata translation methods: Full Sync, which translates all commits, and Incremental Sync, which only translates new, unsynced commits for greater efficiency with large tables. If issues arise with Incremental Sync, XTable automatically falls back to Full Sync to provide uninterrupted translation.

Community and future

In terms of future plans, XTable is focused on achieving feature parity with OTFs’ built-in features, including adding critical capabilities like support for Merge-on-Read (MoR) tables. The project also plans to facilitate synchronization of table formats across multiple catalogs, such as AWS Glue, Hive, and Unity catalog.

Run XTable as a continuous background conversion mechanism

In this post, we describe a background conversion mechanism for OTFs that doesn’t require changes to data pipelines. The mechanism periodically scans a data catalog like the AWS Glue Data Catalog for tables to convert with XTable.

On a data platform, a data catalog stores table metadata and typically contains the data model and physical storage location of the datasets. It serves as the central integration with analytical services. To maximize ease of use, compatibility, and scalability on AWS, the conversion mechanism described in this post is built around the AWS Glue Data Catalog.

The following diagram illustrates the solution at a glance. We design this conversion mechanism based on Lambda, AWS Glue, and XTable.

In order for the Lambda function to be able to detect the tables inside the Data Catalog, the following information needs to be associated with a table: source format and target formats. For each detected table, the Lambda function invokes the XTable application, which is packaged into the functions environment. Then XTable translates between source and target formats and writes the new metadata on the same data store.

Solution overview

We implement the solution with the AWS Cloud Development Kit (AWS CDK), an open source software development framework for defining cloud infrastructure in code, and provide it on GitHub. The AWS CDK solution deploys the following components:

  • A converter Lambda function that contains the XTable application and starts the conversion job for the detected tables
  • A detector Lambda function that scans the Data Catalog for tables that are to be converted and invokes the converter Lambda function
  • An Amazon EventBridge schedule that invokes the detector Lambda function on an hourly basis

Currently, the XTable application needs to be built from source. We therefore provide a Dockerfile that implements the required build steps and use the resulting Docker image as the Lambda function runtime environment.

In case you don’t have sample data available for testing, we provide scripts for generating sample datasets on GitHub. Data and metadata are shown in blue in the following detail diagram.

Converter Lambda function: Run XTable

The converter Lambda function invokes the XTable JAR, wrapped with the third-party library jpype, and converts the metadata layer of the respective data lake tables.

The function is defined in the AWS CDK through the DockerImageFunction, which uses a Dockerfile and builds a Docker container as part of the deploy step. With this mechanism, we can bundle the XTable application inside our Lambda function.

First, we download the XTtable GitHub repository and build the jar with the maven CLI. This is done as a part of the Docker container build process:

# Dockerfile # clone sources
RUN git clone --depth 1 --branch <xtable_branch> https://github.com/apache/incubator-xtable.git

# build xtable jar
WORKDIR /incubator-xtable
RUN /apache-maven-<maven_version>/bin/mvn package -DskipTests=true
WORKDIR /

To automatically build and upload the Docker image, we create a DockerImageFunction in the AWS CDK and reference the Dockerfile in its definition. To successfully run Spark and therefore XTable in a Lambda function, we need to set the LOCAL_IP variable of Spark to localhost and therefore to 127.0.0.1:

# cdk_stack.py
detector = _lambda.DockerImageFunction(
    scope=self,
    id="Converter",
    # Dockerfile in ./src directory
    code=_lambda.DockerImageCode.from_image_asset(
        directory="src", cmd=["detector.handler"]
    )
    environment={"SPARK_LOCAL_IP": "127.0.0.1"}
    ...
)

To call the XTtable JAR, we use a third-party Python library called jpype, which handles the communication with the Java virtual machine. In our Python code, the XTtable call is as follows:

# call java class with configuration files
run_sync = jpype.JPackage("org").apache.xtable.utilities.RunSync.main
run_sync(
    [
        "--datasetConfig",
        "<path_to_dataset_config>",
        "--icebergCatalogConfig",
        "<path_to_catalog_config>",
    ]
)

For more information on XTable application parameters, see Creating your first interoperable table.

Detector Lambda function: Identify tables to convert in the Data Catalog

The detector Lambda function scans the tables in the Data Catalog. For a table that will be converted, it invokes the converter Lambda function through an event. This decouples the scanning and conversion parts and makes our solution more resilient to potential failures.

The detection mechanism searches in the table parameters for the parameters xtable_table_type and xtable_target_formats. If they exist, the conversion is invoked. See the following code:

# detector.py
# create paginator to loop through AWS Glue tables
tables = glue_client.get_paginator("get_tables").paginate(
    DatabaseName=database["Name"]
)
for table_list in tables:
    table_list = table_list["TableList"]
…
# loop through all tables and check for required custom glue parameters
for table in table_list:
    required_parameters={"xtable_table_type", "xtable_target_formats"}
    # if required table parameters exist pass on table for conversion
    if required_parameters <= table["Parameters"].keys():
        yield table

EventBridge Scheduler rule

In the AWS CDK, you define an EventBridge Scheduler rule as follows. Based on the rule, EventBridge will then call the Lambda detector function every hour:

# cdk_stack.py
event = events.Rule(
    scope=self,
    id="DetectorSchedule",
    schedule=events.Schedule.rate(Duration.hours(1)),
)
event.add_target(targets.LambdaFunction(detector))

Prerequisites

Let’s dive deeper into how to deploy the provided AWS CDK stack. You need one of the following container runtimes:

  • Finch (an open source client for container development)
  • Docker

You also need the AWS CDK configured. For more details, see Getting started with the AWS CDK.

Build and deploy the solution

Complete the following steps:

  1. To deploy the stack, clone the GitHub repo, change into the folder for this post (xtable_lambda), and deploy the AWS CDK stack:
    git clone https://github.com/aws-samples/apache-xtable-on-aws-samples.git
    cd xtable_lambda
    cdk deploy

This deploys the described Lambda functions and the EventBridge Scheduler rule.

  1. When using Finch, you need to set the CDK_DOCKER environment variable before deployment:
    export CDK_DOCKER=finch

After successful deployment, the conversion mechanism starts to run every hour.

  1. The following parameters need to exist on the AWS Glue table that will be converted:
    1. "xtable_table_type": "<source_format>"
    2. "xtable_target_formats": "<target_format>, <target_format>"

On the AWS Glue console, the parameters look like the following screenshot and can be set under Table properties when editing an AWS Glue table.

  1. Optionally, if you don’t have sample data, the following scripts can help you set up a test environment either with your local machine or in an AWS Glue for Spark job:
    # local: create hudi dataset on S3
    cd scripts
    pip install -r requirements.txt
    python ./create_hudi_s3.py

Convert a streaming table (Hudi to Iceberg)

Let’s assume we have a Hudi table on Amazon S3, which is registered in the Data Catalog, and want to periodically translate it to Iceberg format. Data is streaming in continuously. We have deployed the provided AWS CDK stack and set the required AWS Glue table properties to translate the dataset to the Iceberg format. In the following steps, we run the background job, see the results in AWS Glue and Amazon S3, and query it with Amazon Athena, a serverless and interactive analytics service that provides a simplified and flexible way to analyze petabytes of data.

In Amazon S3 and AWS Glue, we can see our Hudi dataset and table along with the metadata folder .hoodie. On the AWS Glue console, we set the following table properties:

  • "xtable_target_type": "HUDI"
  • "xtable_table_formats": "ICEBERG"

Our Lambda function is invoked periodically every hour. After the run, we can find the Iceberg-specific metadata folder in our S3 bucket, which was generated by XTable.

If we look at the Data Catalog, we can see the new table <table_name>_converted was registered as an Iceberg table.

img-registered-table-after-conversion

With the Iceberg format, we can now take advantage of the time travel feature by querying the dataset with a downstream analytical service like Athena. In the following screenshot, you can see at Name: that the table is in Iceberg format.

Querying all snapshots, we can see that we created three snapshots with overwrites after the initial one.

We then take the current time and query the dataset representation of 180 minutes ago, resulting in the data from the first snapshot committed.

Summary

In this post, we demonstrated how to build a background conversion job for OTFs, using XTable and the Data Catalog, which is independent from data pipelines and transformation jobs. Through Xtable, it allows for efficient translation between OTFs, because data files are reused and only the metadata layer is processed. The integration with the Data Catalog provides wide compatability with AWS analytical services.

You can reuse the Lambda based XTable deployment in other solutions. For instance, you could use it in a reactive mechanism for near real-time conversion of OTFs, which is invoked by Amazon S3 object events resulting from changes to OTF metadata.

For further information about XTable, see the project’s official website. For more examples and references to other posts on using XTable on AWS, refer to the following GitHub repository.


About the authors

Matthias Rudolph is a Solutions Architect at AWS, digitalizing the German manufacturing industry, focusing on analytics and big data. Before that he was a lead developer at the German manufacturer KraussMaffei Technologies, responsible for the development of data platforms.

Dipankar Mazumdar is a Staff Data Engineer Advocate at Onehouse.ai, focusing on open-source projects like Apache Hudi and XTable to help engineering teams build and scale robust analytics platforms, with prior contributions to critical projects such as Apache Iceberg and Apache Arrow.

Stephen Said is a Senior Solutions Architect and works with Retail/CPG customers. His areas of interest are data platforms and cloud-native software engineering.

Introducing Provisioned Mode for Kafka Event Source Mappings with AWS Lambda

Post Syndicated from Chris McPeek original https://aws.amazon.com/blogs/compute/introducing-provisioned-mode-for-kafka-event-source-mappings-with-aws-lambda/

This post is written by Tarun Rai Madan, Principal Product Manager, Serverless Compute and Rajesh Kumar Pandey, Principal Software Engineer, Serverless Compute

AWS is announcing the general availability of Provisioned Mode for AWS Lambda Event Source Mappings (ESMs) that subscribe to Apache Kafka event sources including Amazon MSK and self-managed Kafka. Provisioned Mode allows you to optimize the throughput of your Kafka ESM by provisioning event polling resources that remain ready to handle sudden spikes in traffic. Controlling the throughput of your ESM helps you build highly responsive and scalable event-driven Kafka applications with stringent performance requirements.

Overview

When you build modern applications using Event-Driven Architectures (EDAs), your event producers publish events, which are then processed by event source connectors like an ESM, and routed to serverless compute consumers like Lambda functions. Apache Kafka is a popular open-source platform for building real-time streaming data applications using Lambda functions as consumers. AWS Lambda’s fully-managed MSK ESM or self-managed Kafka ESM reads events from Kafka as an event source, performs operations like filtering and batching, and invokes Lambda functions. Both ESMs offer built-in integrations with event sources, auto-scaling, and features like batching and filtering. When a Kafka ESM is created, Lambda ESM allocates one event poller to start polling for messages in a Kafka topic. The ESM then evaluates the message backlog – using the OffsetLag metric – for all partitions in the topic, and auto-scales event pollers to process messages efficiently.

Many real-time applications using Kafka are sensitive to sudden spikes in traffic, which could lead to noticeable delays in your end users’ experience. Previously, there were no controls to optimize the throughput for performance-sensitive workloads when using Kafka ESMs. This forced you to explore alternative solutions for workloads with strict performance requirements, which added architectural complexity. To harness the power of Lambda for such performance-sensitive applications, you need to be able to control your Kafka ESM’s throughput and ensure responsive auto-scaling behavior.

What’s new

Provisioned Mode for ESM is a feature that helps you control the throughput of your ESM, and achieve an enhanced performance profile for performance-sensitive applications, particularly ones that see sudden spikes in traffic. You can use Provisioned Mode for Kafka ESM with a range of Kafka or Kafka-compatible streaming data platform providers like Amazon MSK, Confluent, Redpanda, and self-managed Kafka. Key benefits include:

  1. Controls to optimize throughput: You can now fine-tune the throughput of your ESM by configuring a minimum and maximum number of resources called “event pollers”. An event poller (or a “poller”) represents a compute resource that underpins an ESM in the Provisioned Mode, and allocates up to 5 MB/s throughput.
  2. Responsive auto-scaling: With Provisioned Mode, your Kafka ESM detects the increase in OffsetLag metric for all partitions in your Kafka topic, and auto-scales event pollers in a responsive manner. During idle periods, your ESM automatically scales down to the minimum event pollers set by you.
  3. Simplified networking experience and charges: Previously, you were required to configure AWS PrivateLink or NAT Gateway to enable Lambda to poll messages from Kafka clusters in your VPC and invoke Lambda functions. With Provisioned Mode, you are no longer required to configure PrivateLink or NAT Gateway. This approach reduces overhead and improves the developer experience, allowing you to focus on building applications rather than managing networking setup. Consequently, you are not charged for PrivateLink VPC endpoints when using Kafka as an event source with Lambda in the Provisioned Mode for ESM, which reduces your networking charges.

Activating Provisioned Mode for ESM

To activate Provisioned Mode for a new or existing Kafka ESM, you can configure the minimum event pollers, the maximum event pollers, or both for your ESM. The allowed values range from 1 to 200 for minimum event pollers, and from 1 to 2000 for maximum event pollers.

Note that you must configure at least one of minimum or maximum event pollers to activate Provisioned Mode. When you configure only the minimum number of event pollers (‘Min-only’), your ESM allocates this minimum quantity and can dynamically scale up to a maximum. This maximum is determined by the OffsetLag and is limited by either the number of partitions or the default maximum event pollers, whichever is lower. When you configure only the maximum number of event pollers (“Max-only”), your ESM starts with one minimum poller by default, and can scale up to the maximum event pollers or number of partitions, whichever is lower. When you configure both the minimum and maximum number of event pollers (“Min and Max”), your ESM can auto-scale between this range of minimum and maximum event pollers configured.

Activating using AWS CLI

You can activate Provisioned Mode for ESM during creation of a new ESM, or by updating an existing ESM. Specify the –provisioned-poller-config parameter.

aws lambda create-event-source-mapping \
    --region <region-name> \
    --function-name <function-name> \
    --event-source-arn <event-source-arn> \
    --provisioned-poller-config '{"MinimumPollers":<number>, "MaximumPollers":<number>}'

Activating using AWS Lambda Console

Select Configure provisioned mode to activate Provisioned Mode when creating a new ESM, or updating an existing one.

Image of Activating Provisioned Mode for ESM in Console.Figure 1: Activating Provisioned Mode for ESM in Console

Provisioned Mode for Kafka ESM in action

To see the performance profile with Provisioned Mode for Kafka ESM, deploy a Lambda function that subscribes to an Amazon MSK topic. Use the reference pattern on Serverless Land and see this blog post outlining steps to configure MSK ESM for a Lambda function. In this case, a producer writes 20 million messages, each with 1KB payload size to an MSK topic – distributed evenly across 100 partitions. Use a batch size of 100, with function duration at 100ms, and set the StartingPosition to TRIM_HORIZON to process from the beginning of the stream.

Note the baseline performance profile observed with the default On-Demand mode. Then analyze two configurations with the Provisioned Mode activated.

  • Scenario 1 uses different configurations for minimum event pollers
  • Scenario 2 uses the default minimum event pollers and lets Lambda manage the event pollers through autoscaling.

Baseline performance profile for Kafka ESM On-demand

With Provisioned Mode disabled, Lambda takes approximately 20 minutes to drain the backlog of 20 million messages. It takes 4 minutes to reach the maximum concurrent executions. Use this result as a baseline to compare against Provisioned Mode for ESM.

Image of Baseline performance without Provisioned Mode for ESM.

Figure 2: Baseline performance without Provisioned Mode for ESM

Scenario 1: Configuring minimum event pollers, and auto-scaling

To optimize the ESM throughput for this workload and reduce the time to drain the message backlog, configure the minimum event pollers. Select values of 10 and 100 for minimum event pollers, and observe the results.

Configuring 10 minimum event pollers

Lambda drains the backlog of 20 million messages in approximately 11 minutes with minimum pollers set to 10. This is 45% faster than the baseline without Provisioned Mode. It takes approximately 6 minutes to reach maximum concurrent executions.

Image of Performance profile with minimum event pollers set to 10.

Figure 3: Performance profile with minimum event pollers set to 10

Configuring 100 minimum event pollers

To further improve the processing performance, configure the minimum event pollers to 100. Lambda now takes 6 minutes to drain the backlog of 20 million messages, which is 70% faster than the baseline. It instantly reaches the maximum concurrent executions.

Image of Performance profile with minimum event pollers set to 100.

Figure 4: Performance profile with minimum event pollers set to 100

Scenario 2: Default minimum event pollers, and auto-scaling

In some cases, the workload may not be as performance-sensitive. With the same volume of 20M messages in your Kafka topic, activate Provisioned Mode for ESM. Start with the default minimum event pollers (set to 1) and let Lambda auto-scale the event pollers based on incoming traffic.

Lambda automatically scales up your event pollers to process the incoming messages, and scales them down as the backlog is cleared. With the default minimum and maximum event pollers, Lambda takes approximately 12 minutes to clear the backlog of 20 million messages, which is 40% faster than the baseline. Lambda takes 7 minutes to reach maximum concurrent executions.

Image of Performance profile with minimum event pollers set to 1.

Figure 5: Performance profile with minimum event pollers set to 1

The following table summarizes the performance improvement for the analyzed workload using Provisioned Mode for ESM.

ESM Mode Time to drain message backlog Percentage improvement
On-demand Mode 20 minutes Baseline
Provisioned Mode: Scenario 1 (fine-tuned minimum event pollers)
Minimum event pollers = 10 11 minutes 45%
Minimum event pollers = 100 6 minutes 70%
Provisioned Mode: Scenario 2 (default minimum event pollers)
Minimum event pollers = 1 12 minutes 40%

Table: Performance profile for reference test case before and after activating Provisioned Mode for ESM

Observability and Pricing

You can observe the usage of event pollers by monitoring the ProvisionedPollers Amazon CloudWatch metric, which measures the number of event pollers that actively processed at least one event in the last 5-minute window.

Pricing is based on the provisioned minimum event pollers and the number of event pollers consumed during automatic scaling. Provisioned Mode introduces a billing unit called Event Poller Unit (EPU). Each EPU supports up to 20 MB/s of throughput for event polling. The number of event pollers allocated on an EPU depends on the throughput consumed by each event poller. You pay for the number of EPUs used and the duration they run for, measured in Event Poller Unit hours. For details, refer to AWS Lambda pricing.

Best practices and considerations

The optimal configuration of minimum and maximum event pollers for your Kafka Event Source Mapping (ESM) depends on your application’s performance requirements. Start with the default minimum event pollers to baseline the performance profile, and adjust event pollers based on observed message processing patterns and your application’s performance requirements. For workloads with spiky traffic and strict performance needs, increase the minimum event pollers to handle sudden surges. You can fine-tune the minimum required event pollers by evaluating your desired throughput, your observed throughput – which depends on factors like the ingested messages per second and average payload size, and using the throughput capacity of one event poller (up to 5 MB/s) as reference. Note that to maintain ordered processing within a partition, Lambda caps the maximum event pollers at the number of partitions in the topic.

Update your network settings to remove PrivateLink VPC endpoints and associated permissions for existing ESMs when you activate Provisioned Mode.

Conclusion

Provisioned Mode for Lambda ESM allows you to fine-tune the throughput for your Kafka ESMs by configuring a minimum and maximum number of event pollers. This provides a responsive auto-scaling behavior for Kafka applications that have stringent performance requirements and see unpredictable and spiky traffic. You can fine-tune your configured event pollers based on your requirements and monitor usage via CloudWatch metrics. Provisioned Mode also simplifies network configuration by removing the requirement to configure PrivateLink.

For more serverless learning resources, visit Serverless Land.

5 Ways to Use Event Notifications to Advance Your Media Better, Faster

Post Syndicated from Jeremy Milk original https://www.backblaze.com/blog/5-ways-to-use-event-notifications-to-advance-your-media-better-faster/

A decorative image showing a cloud with digital lines and media icons.

In the hurry-up-and-wait world of media production, anything you can do to speed through the hurry-ups and avoid or shorten the waits is not just a gift—it’s an advantage that can mean happier team members, delighted clients and fans, and more revenue.

Backblaze Event Notifications can help.This new B2 Cloud Storage feature can help you streamline a range of your production tasks—like automatically starting transcoding of video and distributing new images—across your preferred workflow tools. 

Today, I’m sharing five ways you can use Backblaze Event Notifications to operationalize media production efficiencies. If you’re interested in Event Notifications for applications, check out this post; and stay tuned for a future post on how to use Event Notifications for IT backup.

Event Notifications for media production: Simplified automation

Event Notifications monitors your B2 Cloud Storage for data changes that you designate—think raw video uploads, content version updates, deletions, etc.—and delivers near real-time alerts where you want them about these changes. These alerts can be used to create awareness faster, and even more powerfully, to initiate streamlined end-to-end processes that can save you time and hassle, and avoid unnecessary manual tasks and/or the cost of complex intermediaries.

What are webhooks?

Webhooks, if you’re not familiar with the term, are HTTP-based callback functions that enable event-based communications between software applications. Backblaze Event Notifications can uniquely work with any external service that accepts webhooks. This means you can use it to your advantage across your media production workflow—and this is novel when most vendors’ alerts features are limited to closed ecosystems or require significant and sometimes costly workarounds to communicate beyond a limited set of production tools.

Top 5 use cases for media production

Here are specific, practical ways people producing and managing media can take advantage of Event Notifications for immediate benefits.

1. New content processing

Event Notifications can be used to trigger tasks immediately after new content is uploaded. Imagine one of your team members uploads a video or image: Event Notifications can be sent to a transcoding service to format it and a tagging service to categorize it for better content organization. Set up to furthermore extract valuable metadata too—all in near real time, without manual intervention. 

General workflow (abbreviated)

By automating these processes, companies can ensure that user-generated content is formatted correctly, appropriately tagged, and moderated without delay. This not only saves time but guarantees a consistent user experience.

What’s more, you can even go full Jedi Knight and handle errors programmatically with Event Notifications logic that triggers reprocessing tasks whenever issues arise.

2. Integrated alerts in go-to tools

Event Notifications can easily integrate with your communication tools like Slack and productivity tools like Zapier, to inform internal and external stakeholders of updates without them needing to check for them manually. Users have told us this is a great way to keep people updated when assets are added, updated, or advanced to key stages in production and post cycles—setting them up to consider taking downstream actions that don’t lend themselves to further process automation.

Asset change announcement workflow

Additionally, for teams using workflow tools such as Zapier to connect various services, Event Notifications makes it simple to trigger actions across multiple platforms, enabling powerful, automated workflows with your data in B2 Cloud Storage.

3. Over-the-top (OTT) streaming automation

Regardless of whether your streaming model is AVOD, TVOD, or SVOD, Event Notifications can help automate processing and distribution workflows. Users can enable them so that every time a new title is added to B2 Cloud Storage, it then triggers alerts that initiate transcoding, compression, and prep for delivery or playback via content delivery network (CDN).

OTT streaming platform workflow

4. Backup completion monitoring

An important (if unglamorous) aspect of managing media is backing it up for extra safekeeping. After all, it’s a precious asset worth a lot of money now and later. So whether you back up nightly, monthly, at project’s end, or on some other cadence, with Event Notifications, customers can set up to receive updates when their media backups are successfully uploaded to a Backblaze B2 Bucket—providing peace of mind when data is protected.

We’ve also had a few users already tell us that not seeing backup completion alerts when expected helped them realize that they had other, previously unknown workflow hiccups to address.

Backup complete workflow

Tangentially related, media organizations are also using Backblaze Cloud Replication to programmatically store their content to two or more geographically distributed locations for added protection—this isn’t the same as Event Notifications, but is another automation tool for enhancing your protection posture.

5. Monitor data usage

Since Event Notifications messages are sent within seconds of files being uploaded and deleted, and they contain the size of the file in question, you can easily and reliably track your data usage in near real time, helping you identify trends and potential issues. For example, if you know large raw files are coming in and then messages indicating much smaller than expected file sizes were uploaded, it can alert you to begin to QC it.

We’ve also seen such data monitoring prove highly beneficial to IT personnel who support them because the near real-time monitoring allows faster responses to situations as they are happening, thereby mitigating risks, reducing costs, and/or nipping issues in the bud so the production teams remain disruption and distraction free.

Monitoring workflow

Beyond these example use cases, Event Notifications opens up a wide range of possibilities for automating and optimizing workflows. This flexibility makes it easy to automate how your infrastructure interacts with and reacts to file changes in B2 Cloud Storage, simplifying workflows across your distributed services. So go ahead and get creative—and please do share with us the cool things you’re doing with Event Notifications.

Why Event Notifications matter for production workflows

The benefits of real-time notifications extend beyond simply saving time—they transform the way teams work, automate processes, and reduce the margin for error.

  • Awareness: Instant notifications for uploads, updates, or deletions keep everyone on the same page.
  • Actionable insights: Real-time alerts provide critical information that helps make informed decisions quickly.
  • Flexibility: Direct connections to services like media asset managers (MAMs), transcoding applications, and CDNs mean more choice to stick with your preferred stack and less lock-in to specific vendors or tools.
  • Cost efficiency: Automating tasks like media transcoding, data processing, or content delivery reduces the need for manual labor, saving on operational costs and freeing up resources for other strategic initiatives.

Improved security: By instantly alerting teams to changes or unusual activity, Event Notifications help maintain data integrity and support proactive security measures.

How Event Notifications compares

Unlike other offerings like Amazon’s messaging services, which are limited to specific ecosystems, Backblaze Event Notifications integrates directly with any service that accepts webhooks, offering true flexibility and avoiding vendor lock-in.

Event Notifications is also designed for at-least-once delivery, ensuring critical notifications are not missed. This reliability is important for teams building workflows that require precision and a level of consistency their end users expect. 

The pricing for Event Notifications is simple and transparent. Backblaze B2 Reserve customers enjoy unlimited free Event Notifications, while pay-as-you-go Backblaze B2 customers enjoy 2,500 calls per day free and then $0.004 per 10,000 transactions. This straightforward pricing applies no matter the service receiving the notification. This enables businesses to confidently scale their event-driven workflows, knowing exactly what to expect in terms of costs, regardless of the services they choose to integrate with. 

Ready to add automation to your media tasks?

For existing customers working with a Backblaze account manager, Event Notifications is already enabled for you, and your account manager can assist with any questions. If you’re an existing customer not currently working with an account manager, please contact our Support team to request access to Event Notifications. 

New customers can contact our Sales team to learn more about how Event Notifications can streamline workflows and how to get started.

Once Event Notifications are enabled, log in to your Backblaze B2 account, navigate to the Buckets page, and click on the Event Notifications section. From there, you can set up notification rules for the events you want to track or configure notifications using our API.

For detailed instructions and best practices, visit our Event Notifications documentation.

The post 5 Ways to Use Event Notifications to Advance Your Media Better, Faster appeared first on Backblaze Blog | Cloud Storage & Cloud Backup

[$] Arch Linux finally starts licensing PKGBUILDs

Post Syndicated from jzb original https://lwn.net/Articles/998778/

Arch Linux is popular as a base
for other Linux distributions
; examples of Arch-derivatives include EndeavourOS, Manjaro, Parabola, and SteamOS.
There’s one small problem: the control files used to describe how to build
packages for Arch Linux have no stated license. That creates a bit of
uncertainty about the rights and responsibilities for the downstream
derivatives. So far, that doesn’t seem to have been a problem, nor has
it stopped other projects from assuming that reuse is
allowed. However, the Arch project is looking to add some clarity by
explicitly assigning a liberal license to its package
sources. Currently the project is in the process of reaching out to
contributors to see if they have any objections.

Analyzing your AWS Cost Explorer data with Amazon Q Developer: Now Generally Available

Post Syndicated from Riya Dani original https://aws.amazon.com/blogs/devops/analyzing-your-aws-cost-explorer-data-with-amazon-q-developer-now-generally-available/

We are excited to announce the general availability of the cost analysis capability in Amazon Q Developer. This powerful feature integrates Q Developer’s natural language processing capabilities with AWS Cost Explorer, revolutionizing how you analyze and understand your AWS costs. Initially launched in preview on April 30, 2024, the Amazon Q cost analysis capability now offers enhanced functionality, allowing users to gain deeper insights into their cloud spending through simple, conversational interactions.

In this blog, we will highlight the key features and capabilities of analyzing your Cost Explorer data with Amazon Q Developer, including its ability to handle complex cost queries, provide context-aware responses, and offer actionable insights into your AWS spending.

Simplifying Cost Analysis with Natural Language Queries

At the heart of Amazon Q for AWS cost management is its ability to understand and respond to natural language queries. This feature reduces the learning curve to get valuable cost insights from Cost Explorer.

Users can now simply type their questions in plain English, such as:

  • “What were my top 5 most expensive services last month?”
  • “How much did my S3 costs increase between Q1 and Q2?”
  • “Did we receive any credits last quarter, and if so, how much?”

Q Developer interprets these questions, processes the relevant data, and provides detailed, actionable insights.

For our first example, imagine you’re a Cloud Architect who wants to understand the cost implications of recent architectural changes. You could open Amazon Q in the AWS Management Console and enter a prompt such as: “Show me the breakdown of EC2 costs by instance type for the last 30 days”

User entering prompt in Amazon Q Developer chat in the AWS Management Console about breakdown of EC2 instance types for a specific time period, and Amazon Q listing the results.

Figure 1: Q Developer listing breakdown of EC2 instance types for a specific time period

As shown in Figure 1, Q Developer provides a detailed breakdown of the EC2 instance types for the last 30 days.

Let’s consider another scenario. A FinOps professional responsible for reporting on cloud costs across multiple departments could ask “What were last month’s costs broken down by Cost Category “Cost Center”?

Amazon Q Developer in the AWS Management Console providing a detailed cost breakdown by cost category in response to a user's natural language query.

Figure 2: Q Developer delivers a comprehensive cost analysis breakdown by cost category for the previous month.

Figure 2 showcases Q Developer’s capability to instantly generate detailed cost insights based on custom categories. This feature empowers users to make data-driven decisions for more effective cost allocation and budget planning.

Finally, let’s say you are an IT professional who wants to understand what your future costs will look like, based on current workloads and recent trends. You could ask “What are my forecasted costs for Q1 of next year?”

Amazon Q Developer in the AWS Management Console providing a cost forecast for Q1 of 2025.

Figure 3: Q Developer provides forecasted cost data from AWS Cost Explorer.

Figure 3 shows Q Developer ’s ability to provide both historical and forecasted costs, helping customers plan and predict their spending.

Here are some other examples of questions you can now explore when analyzing your Cost Explorer data with Amazon Q:

  • What percentage of our total costs last month were attributed to tag key = “Environment”, value = “Dev”?
  • Which services had the highest month-over-month cost increase in September?“
  • Which linked accounts spent the most last month?
  • What is our forecasted spend for the next three months?
  • What were my costs broken down by tag key “Project”?”

Verifying data and diving deeper

Q Developer provides transparency on the specific AWS Cost Explorer parameters that were used to retrieve the data to answer your questions. This transparency allows you to verify that the data presented is exactly what you were looking for. Additionally, each response includes a link to a matching view in AWS Cost Explorer, so you can dive deeper and visualize your data.

Amazon Q Developer in the AWS Management Console providing a link to visualize the data in AWS Cost Explorer.

Figure 4: Q Developer provides a link to a matching view in AWS Cost Explorer.

Figure 4 demonstrates how Q Developer bridges natural language queries with AWS Cost Explorer’s powerful visualization capabilities. This integration allows users to effortlessly transition from conversational insights to comprehensive graphical representations of their cost data, facilitating more thorough analysis and informed decision-making.

Conclusion

The general availability of Q Developer for AWS Cost Management marks a significant milestone in simplifying cloud financial management. By leveraging natural language processing and context-aware responses, Amazon Q makes it easier than ever for users across various roles – from FinOps professionals to application developers– to gain valuable insights into their AWS spending.

These new features streamline the process of cost analysis and forecasting, improving efficiency and enabling data-driven decision-making for AWS users. We encourage you to explore Amazon Q for cost analysis and experience firsthand how it can transform your approach to cloud cost management.

To get started with cost analysis in Q Developer, simply log in to the AWS Management Console and click on Amazon Q icon on the right side of the console. For more information on pricing and availability, please visit our Cost analysis in Amazon Q Developer documentation.

Riya Dani

Riya Dani is a Solutions Architect at Amazon Web Services (AWS), working with Enterprise customers to provide technical guidance. She has an area of specialization in DevOps and Machine Learning technology. Riya has a passion for learning and holds a Bachelor’s & Master’s degree in Computer Science from Virginia Tech.

Cloudflare incident on November 14, 2024, resulting in lost logs

Post Syndicated from Jamie Herre original https://blog.cloudflare.com/cloudflare-incident-on-november-14-2024-resulting-in-lost-logs

On November 14, 2024, Cloudflare experienced an incident which impacted the majority of customers using Cloudflare Logs. During the roughly 3.5 hours that these services were impacted, about 55% of the logs we normally send to customers were not sent and were lost. We’re very sorry this happened, and we are working to ensure that a similar issue doesn’t happen again.

This blog post explains what happened and what we’re doing to prevent recurrences. Also, the systems involved and the particular class of failure we experienced will hopefully be of interest to engineering teams beyond those specifically using these products.

Failures within systems at scale are inevitable, and it’s essential that subsystems protect themselves from failures in other parts of the larger system to prevent cascades. In this case, a misconfiguration in one part of the system caused a cascading overload in another part of the system, which was itself misconfigured. Had it been properly configured, it could have prevented the loss of logs.

Background

Cloudflare’s network is a globally distributed system enabling and supporting a wide variety of services. Every part of this system generates event logs which contain detailed metadata about what’s happening with our systems around the world. For example, an event log is generated for every request to Cloudflare’s CDN. Cloudflare Logs makes these event logs available to customers, who use them in a number of ways, including compliance, observability, and accounting.

On a typical day, Cloudflare sends about 4.5 trillion individual event logs to customers. Although this represents less than 10% of the over 50 trillion total customer event logs processed, it presents unique challenges of scale when building a reliable and fault-tolerant system.

System architecture

Cloudflare’s network is composed of tens of thousands of individual servers, network hardware components, and specialized software programs located in over 330 cities around the world. Although Cloudflare’s Edge Log Delivery product will send customers their event logs directly from each server, most customers opt not to do this because doing so will create significant complication and cost at the receiving end.

By analogy, imagine the postal service ringing your doorbell once for each letter instead of once for each packet of letters. With thousands or millions of letters each second, the number of separate transactions that would entail becomes prohibitive.

Fortunately, we also offer Logpush, which collects and pushes logs to customers in more predictable file sizes and which scales automatically with usage. In order to provide this feature several services work together to collect and push the logs, as illustrated in the diagram below:


Logfwdr

Logfwdr is an internal service written in Golang that accepts event logs from internal services running across Cloudflare’s global network and forwards them in batches to a service called Logreceiver. Logfwdr handles many different types of event logs, and one of its responsibilities is to determine which event logs should be forwarded and where they should be sent based on the type of event log, which customers it represents, and associated rules about where it should be processed. Configuration is provided to Logfwdr to enable it to make these determinations.

Logreceiver

Logreceiver (also written in Golang) accepts the batches of logs from across Cloudflare’s global network and further sorts them depending on the type of event and its purpose. For Cloudflare Logs, Logreceiver demultiplexes the batches into per-customer batches and forwards them to be buffered by Buftee. Currently, Logreceiver is handling about 45 PB (uncompressed) of customer event logs each day.

Buftee

It’s common for data pipelines to include a buffer. Producers and consumers of the data might be operating at different cadences, and parts of the pipeline will experience variances in how quickly they can process information. Using a buffer makes it easier to manage these situations, and helps to prevent data loss if downstream consumers are broken. It’s also convenient to have a buffer that supports multiple downstream consumers with different cadences (like the pipe fitting function of a tee.)

At Cloudflare, we use an internal system called Buftee (written in Golang) to support this combined function. Buftee is a highly distributed system which supports a large number of named “buffers”. It supports operating on named “prefixes” (collections of buffers) as well as multiple representations/resolutions of the same time-indexed dataset. Using Buftee makes it possible for Cloudflare to handle extremely high throughput very efficiently.

For Cloudflare Logs, Buftee provides buffers for each Logpush job, containing 100% of the logs generated by the zone or account referenced by each job. This means that failure to process one customer’s job will not affect progress on another customer’s job. Handling buffers in this way avoids “head of line” blocking and also enables us to encrypt and delete each customer’s data separately if needed.

Buftee typically handles over 1 million buffers globally. The following is a snapshot of the number of buffers managed by Buftee servers in the period just prior to the incident.


Logpush

Logpush is a Golang service which reads logs from Buftee buffers and pushes the results in batches to various destinations configured by customers. A batch could end up, for example, as a file in R2. Each job has a unique configuration, and only jobs that are active and configured will be pushed. Currently, we push over 600 million such batches each day.

What happened

On November 14, 2024, we made a change to support an additional dataset for Logpush. This required adding a new configuration to be provided to Logfwdr in order for it to know which customers’ logs to forward for this new stream. Every few minutes, a separate system re-generates the configuration used by Logfwdr to decide which logs need to be forwarded. A bug in this system resulted in a blank configuration being provided to Logfwdr.

This bug essentially informed Logfwdr that no customers had logs configured to be pushed. The team quickly noticed the mistake and reverted the change in under five minutes.

Unfortunately, this first mistake triggered a second, latent bug in Logfwdr itself. A failsafe introduced in the early days of this feature, when traffic was much lower, was configured to “fail open”. This failsafe was designed to protect against a situation when this specific Logfwdr configuration was unavailable (as in this case) by transmitting events for all customers instead of just those who had configured a Logpush job. This was intended to prevent the loss of logs at the expense of sending more logs than strictly necessary when individual hosts were prevented from getting the configuration due to intermittent networking errors, for example.

When this failsafe was first introduced, the potential list of customers was smaller than it is today. This small window of less than five minutes resulted in a massive spike in the number of customers whose logs were sent by Logfwdr.

Even given this massive overload, our systems would have continued to send logs if not for one additional problem. Remember that Buftee creates a separate buffer for each customer with their logs to be pushed. When Logfwdr began to send event logs for all customers, Buftee began to create buffers for each one as those logs arrived, and each buffer requires resources as well as the bookkeeping to maintain them. This massive increase, resulting in roughly 40 times more buffers, is not something we’ve provisioned Buftee clusters to handle. In the lead-up to impact, Buftee was managing 40 million buffers globally, as shown in the figure below.


A short temporary misconfiguration lasting just five minutes created a massive overload that took us several hours to fix and recover from. Because our backstops were not properly configured, the underlying systems became so overloaded that we could not interact with them normally.  A full reset and restart was required.

Root causes

The bug in the Logfwdr configuration system was easy to fix, but it’s the type of bug that was likely to happen at some point.  We had planned for it by designing the original “fail open” behavior.  However, we neglected to regularly test that the broader system was capable of handling a fail open event.

The bigger failure was that Buftee became unresponsive.  Buftee’s purpose is to be a safeguard against bugs like this one.  A huge increase in the number of buffers is a failure mode that we had predicted, and had put mechanisms in Buftee to prevent this failure from cascading.  Our failure in this case was that we had not configured these mechanisms.  Had they been configured correctly, Buftee would not have been overwhelmed.

It’s like having a seatbelt in a car, yet not fastening it. The seatbelt is there to protect you in case of an accident but if you don’t actually buckle it up, it’s not going to do its job when you need it. Similarly, while we had the safeguard of Buftee in place, we hadn’t ‘buckled it up’ by configuring the necessary settings. We’re very sorry this happened and are taking steps to prevent a recurrence as described below.

Going forward

We’re creating alerts to ensure that these particular misconfigurations will be impossible to miss, and we are also addressing the specific bug and the associated tests that triggered this incident.

Just as importantly, we accept that mistakes and misconfigurations are inevitable. All our systems at Cloudflare need to respond to these predictably and gracefully. Currently, we conduct regular “cut tests” to ensure that these systems will cope with the loss of a datacenter or a network failure. In the future, we’ll also conduct regular “overload tests” to simulate the kind of cascade which happened in this incident to ensure that our production systems will handle them gracefully.

Logpush is a robust and flexible platform for customers who need to integrate their own logging and monitoring systems with Cloudflare. Different Logpush jobs can be deployed to support multiple destinations or, with filtering, multiple subsets of logs.