All posts by Netflix Technology Blog

Towards a Reliable Device Management Platform

Post Syndicated from Netflix Technology Blog original https://netflixtechblog.com/towards-a-reliable-device-management-platform-4f86230ca623

By Benson Ma, Alok Ahuja

Introduction

At Netflix, hundreds of different device types, from streaming sticks to smart TVs, are tested every day through automation to ensure that new software releases continue to deliver the quality of the Netflix experience that our customers enjoy. In addition, Netflix continuously works with its partners (such as Roku, Samsung, LG, Amazon) to port the Netflix SDK to their new and upcoming devices (TVs, smart boxes, etc), to ensure the quality bar is reached before allowing the Netflix application on the device to go out into the world. The Partner Infrastructure team at Netflix provides solutions to support these two significant efforts by enabling device management at scale.

Background

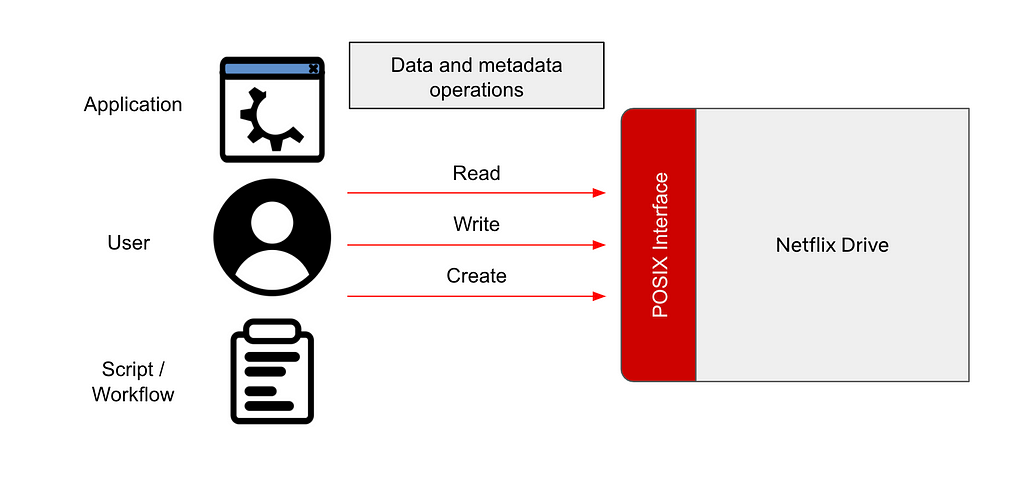
To normalize the diversity of networking environments across both the Netflix and Partner networks and create a consistent and controllable computing environment on which users can run regression and Netflix application certification testing for devices, the Partner Infrastructure team provides a customized embedded computer called the Reference Automation Environment (RAE). Complementing the hardware is the software on the RAE and in the cloud, and bridging the software on both ends is a bi-directional control plane. Together, they form the Device Management Platform, which is the infrastructural foundation for Netflix Test Studio (NTS). Users then effectively run tests by connecting their devices to the RAE in a plug-and-play fashion.

The platform allows for effective device management at scale, and its feature set is broadly divided into two areas:

  1. Provide a service-level abstraction for controlling devices and their environments (hardware and software topologies).
  2. Collect and aggregate information and state updates for all devices attached to the RAEs in the fleet. In this blog post, we will focus on the latter feature set.

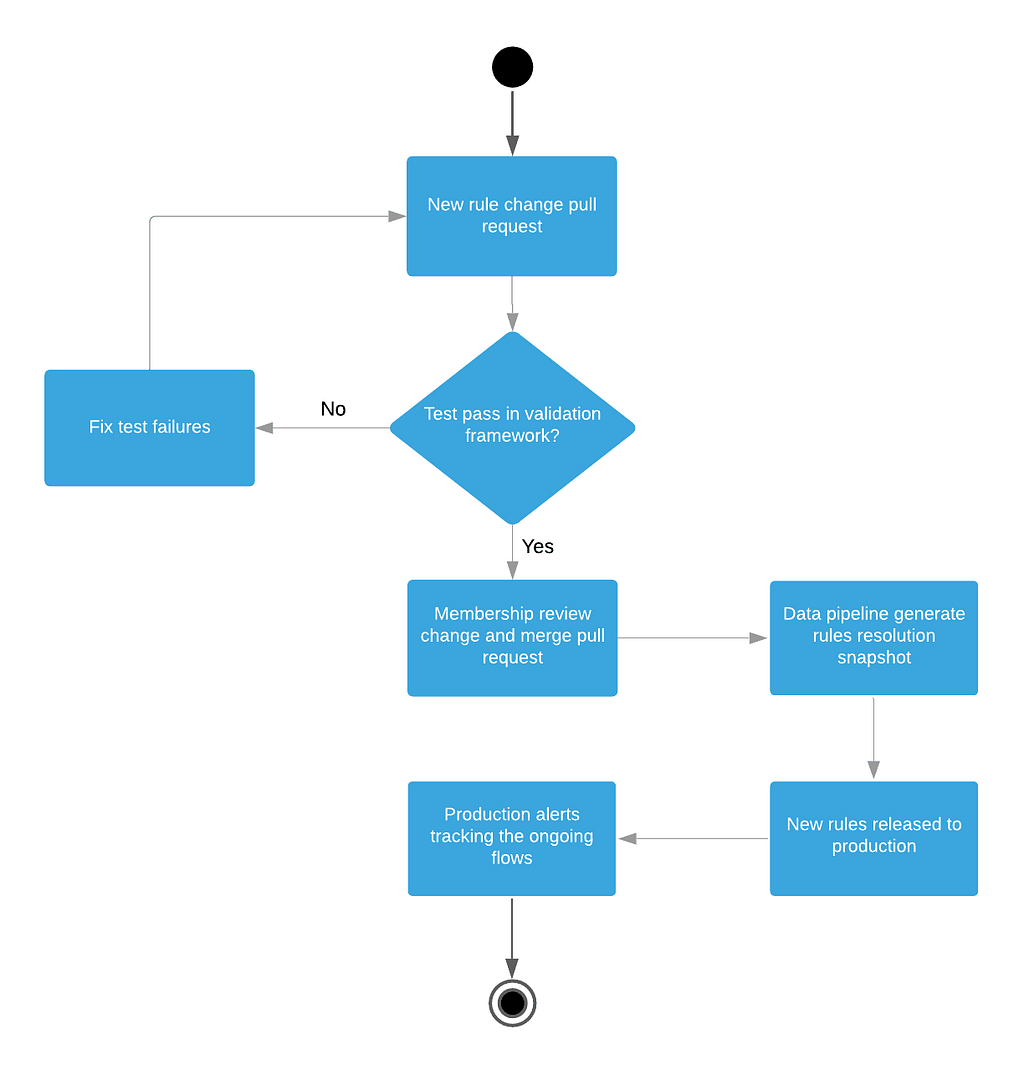
Over the lifecycle of a device connected to the RAE, the device can change attributes at any time. For example, when running tests, the state of the device will change from “available for testing” to “in test.” In addition, because many of these devices are pre-production devices and thus subject to frequent firmware changes, attributes that are generally static in production devices can sometimes change as well, such as the MAC address and the Electronic Serial Number (ESN) assigned to the Netflix installation on the device. As such, it is very critical to be able to keep device information up to date for device tests to work properly. In the Device Management Platform, this is achieved by having device updates be event-sourced through the control plane to the cloud so that NTS will always have the most up-to-date information about the devices available for testing. The challenge, then, is to be able to ingest and process these events in a scalable manner, i.e., scaling with the number of devices, which will be the focus of this blog post.

System Setup

Architecture

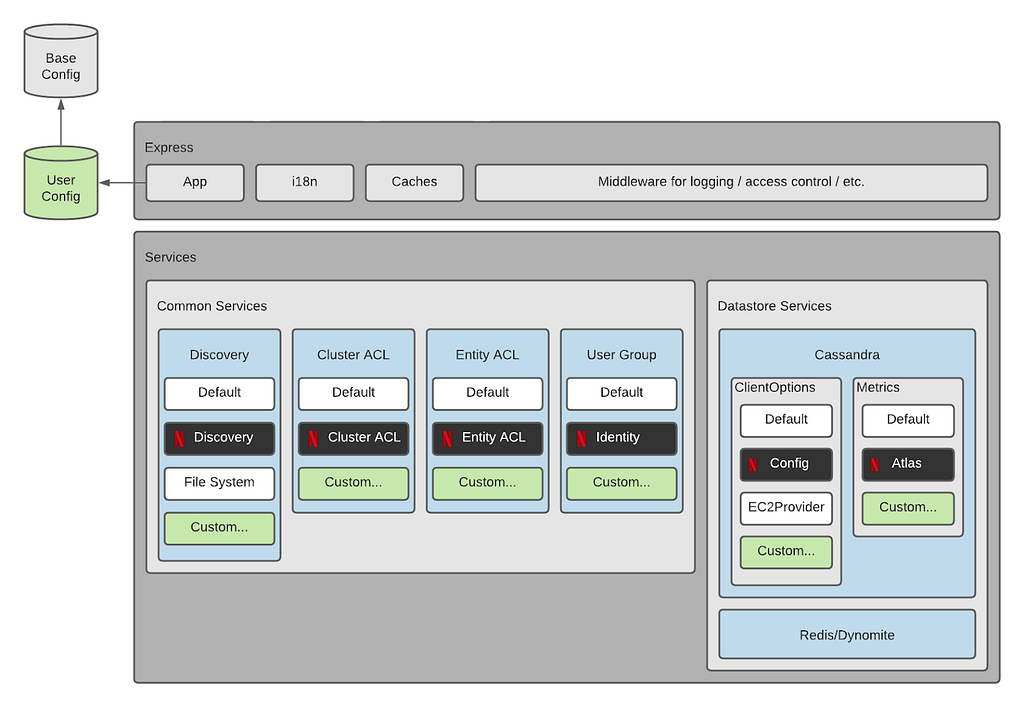
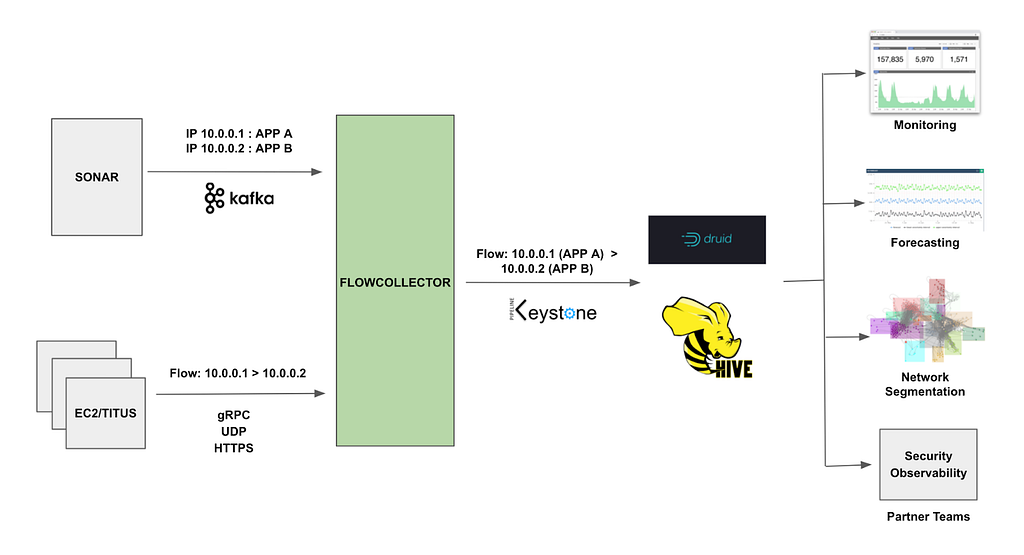
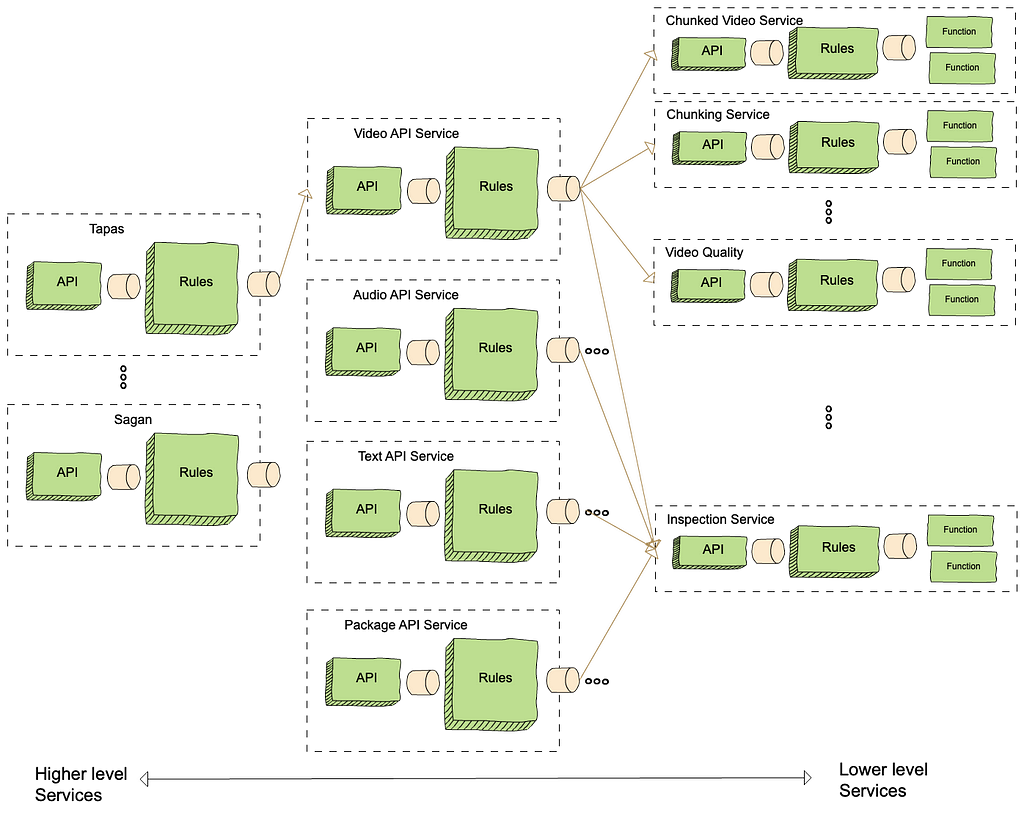
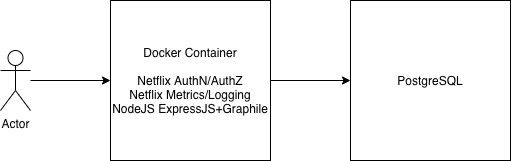
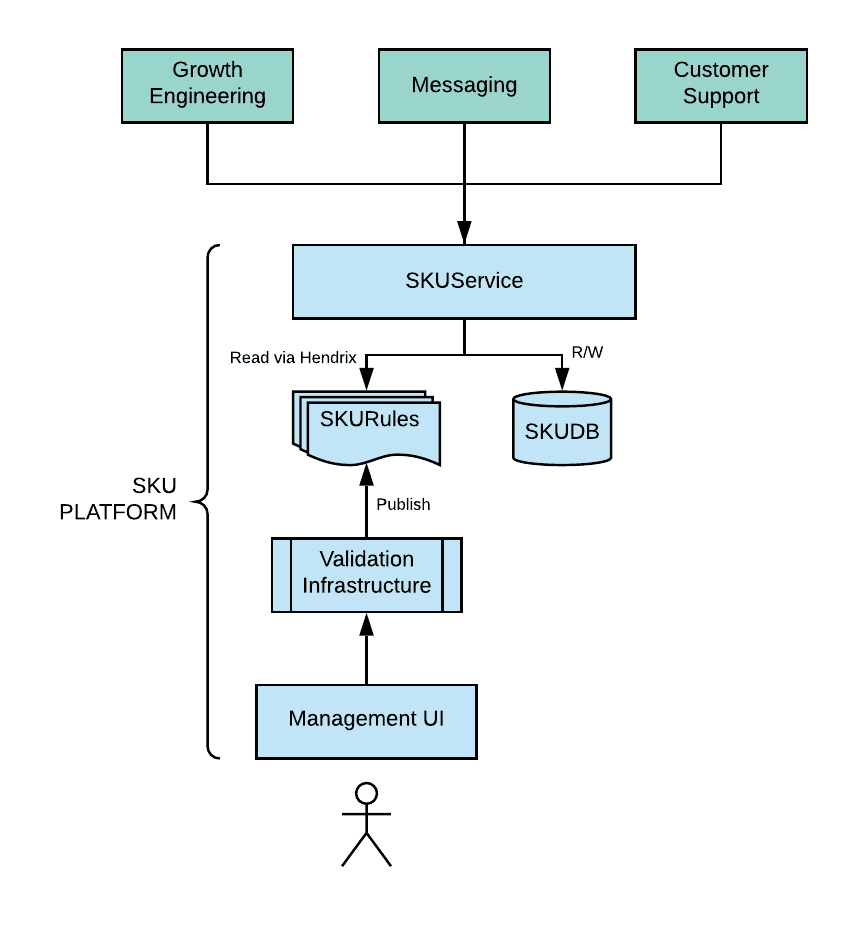
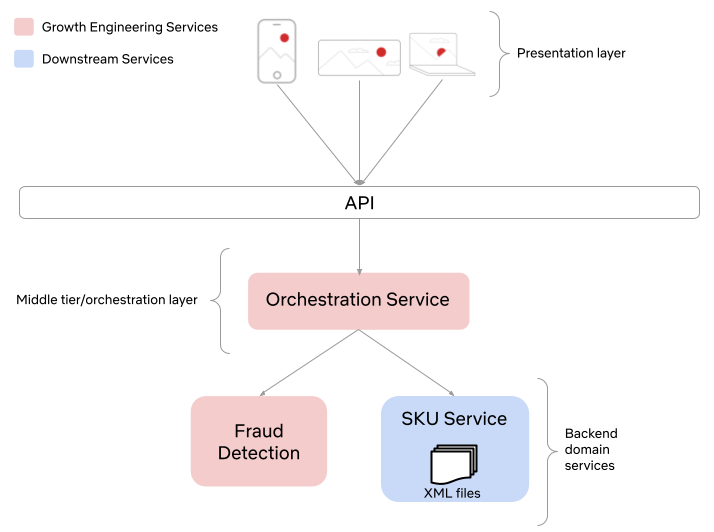
The following diagram summarizes the architecture description:

Figure 1: Event-sourcing architecture of the Device Management Platform.

The RAE is configured to be effectively a router that devices under test (DUTs) are connected to. On the RAE, there exists a service called the Local Registry, which is responsible for detecting, onboarding, and maintaining information about all devices connected to the LAN side of the RAE. When a new hardware device is connected, the Local Registry detects and collects a set of information about it, such as networking information and ESN. At periodic intervals, the Local Registry probes the device to check on its connection status. As the device attributes and properties change over time, these changes are saved into the Local Registry and simultaneously published upstream to the Device Management Platform’s control plane. In addition to attribute changes, a complete snapshot of the device record is published upstream by the Local Registry at regular intervals as a form of state reconciliation. These checkpoint events enable faster state reconstruction by consumers of the data feed while guarding against missed updates.

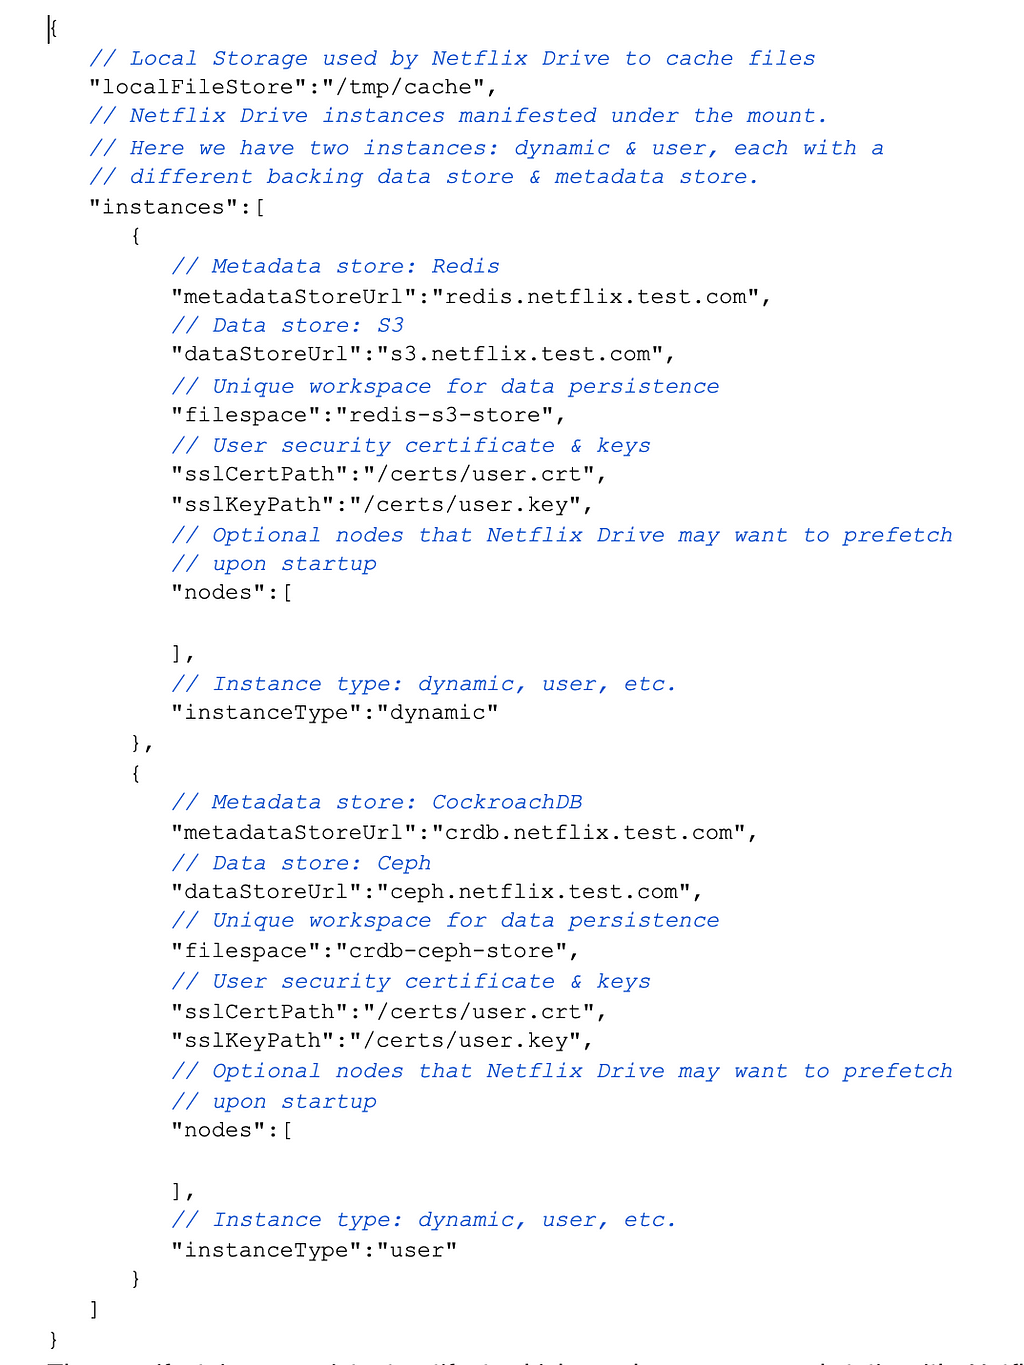
On the cloud side, a service called the Cloud Registry ingests the device information updates published by the Local Registry instance, processes them, and subsequently pushes materialized data into a datastore backed by CockroachDB. CockroachDB is chosen as the backing data store since it offered SQL capabilities, and our data model for the device records was normalized. In addition, unlike other SQL stores, CockroachDB is designed from the ground up to be horizontally scalable, which addresses our concerns about Cloud Registry’s ability to scale up with the number of devices onboarded onto the Device Management Platform.

Control Plane

MQTT forms the basis of the control plane for the Device Management Platform. MQTT is an OASIS standard messaging protocol for the Internet of Things (IoT) and was designed as a highly lightweight yet reliable publish/subscribe messaging transport that is ideal for connecting remote devices with a small code footprint and minimal network bandwidth. MQTT clients connect to the MQTT broker and send messages prefixed with a topic. In contrast, the broker is responsible for receiving all messages, filtering them, determining who is subscribed to which topic, and sending the messages to the subscribed clients accordingly. The key features that make MQTT highly appealing to us are its support for hierarchical topics, client authentication and authorization, per-topic ACLs, and bi-directional request/response message patterns, all of which are crucial for the business use cases we have for the control plane.

Inside the control plane, device commands and device information updates are prefixed with a topic string that includes both the RAE serial number and the device_session_id, which is a UUID corresponding to a device session. Embedding these two bits of information into the topic for every message allows for us to apply topic ACLs and effectively control which RAEs and DUTs users can see and interact with, in the safety and isolation against other users’ devices.

Since Kafka is a supported messaging platform at Netflix, a bridge is established between the two protocols to allow cloud-side services to communicate with the control plane. Through the bridge, MQTT messages are converted directly to Kafka records, where the record key is set to be the MQTT topic that the message was assigned to. Since device information updates published on MQTT contain the device_session_id in the topic, this means that all device information updates for a given device session will effectively appear on the same Kafka partition, thus giving us a well-defined message order for consumption.

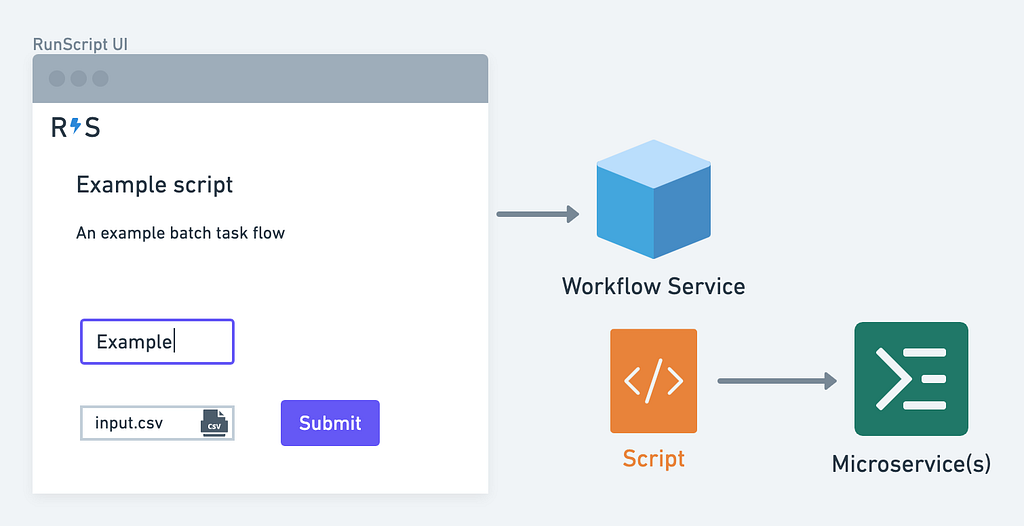
Canary Test Workloads

In addition to serving the regular message traffic between users and DUTs, the control plane itself is stress-tested at roughly 3-hour intervals, where nearly 3000 ephemeral MQTT clients are created to connect to and generate flash traffic on the MQTT brokers. This is intended to be a canary test to verify that the brokers are online and able to handle sudden influxes of client connections and high message loads. As such, we can see that the traffic load on the Device Management Platform’s control plane is very dynamic over time.

Adherence to the Paved-Path

At Netflix, we emphasize building out solutions that use paved-path tooling as much as possible (see posts here and here). In particular, the flavor of Spring Boot Native maintained by the Runtime team is the basis for many of the web services developed inside Netflix (including the Cloud Registry). The Netflix Spring package comes with all the integrations needed for applications to work seamlessly within the Netflix ecosystem. In particular, the Kafka integration is the most relevant for this blog post.

Translating to System Requirements

Given the system setup that we have described, we came up with a list of fundamental business requirements that the Cloud Registry’s Kafka-based device updates processing solution must address.

Back-Pressure Support

Because the processing workload varies significantly over time, the solution must first and foremost scale with the message load by providing back-pressure support as defined in the Reactive Streams specification — in other words, the solution should be able to switch between push and pull-based back-pressure models depending on the downstream being able to cope with the message production rate or not.

In-Order Processing

The semantics of correct device information updates ingestion requires that messages be consumed in the order that they are produced. Since message order is guaranteed per Kafka partition, and all updates for a given device session are assigned to the same partition, this means that the order of processing of updates for each device can be enforced as long as only one thread is assigned per partition. At the same time, events arriving on different partitions should be processed in parallel for maximum throughput.

Fault Tolerance

If the underlying KafkaConsumer crashes due to ephemeral system or network events, it should be automatically restarted. If an exception is thrown during the consumption of a message, the exception should be gracefully caught, and message consumption should seamlessly continue after the offending message is dropped.

Graceful Shutdown

Application shutdowns are necessary and inevitable when a service is re-deployed, or its instance group is resized. As such, processor shutdowns should be invokable from outside of the Kafka consumption context to facilitate graceful application termination. In addition, since Kafka messages are usually pulled down in batches by the KafkaConsumer, the implemented solution should, upon receiving the shutdown signal, consume and drain all the already-fetched messages remaining in its internal queue prior to shutting down.

Paved-Path Integration

As mentioned earlier, Spring is heavily employed as the paved-path solution for developing services at Netflix, and the Cloud Registry is a Spring Boot Native application. Thus, the implemented solution must integrate with Netflix Spring facilities for authentication and metrics support at the very minimum — the former for access to the Kafka clusters and the latter for service monitoring and alerts. In addition, the lifecycle management of the implemented solution must also be integrated into Spring’s lifecycle management.

Long-Term Maintainability

The implemented solution must be friendly enough for long-term maintenance support. This means that it must at the very least be unit- and functional-testable for rapid and iterative feedback-driven development, and the code must be reasonably ergonomic to lower the learning curve for new maintainers.

Adopting a Stream Processing Framework

There are many frameworks available for reliable stream processing for integration into web services (for example, Kafka Streams, Spring KafkaListener, Project Reactor, Flink, Alpakka-Kafka, to name a few). We chose Alpakka-Kafka as the basis of the Kafka processing solution for the following reasons.

  1. Alpakka-Kafka turns out to satisfy all of the system requirements we laid out, including the need for Netflix Spring integration. It further provides advanced and fine-grained control over stream processing, including automatic back-pressure support and streams supervision.
  2. Compared to the other solutions that may satisfy all of our system requirements, Akka is a much more lightweight framework, with its integration into a Spring Boot application being relatively short and concise. In addition, Akka and Alpakka-Kafka code is much less terse than the other solutions out there, which lowers the learning curve for maintainers.
  3. The maintenance costs over time for an Alpakka-Kafka-based solution is much lower than that for the other solutions, as both Akka and Alpakka-Kafka are mature ecosystems in terms of documentation and community support, having been around for at least 12 and 6 years, respectively.

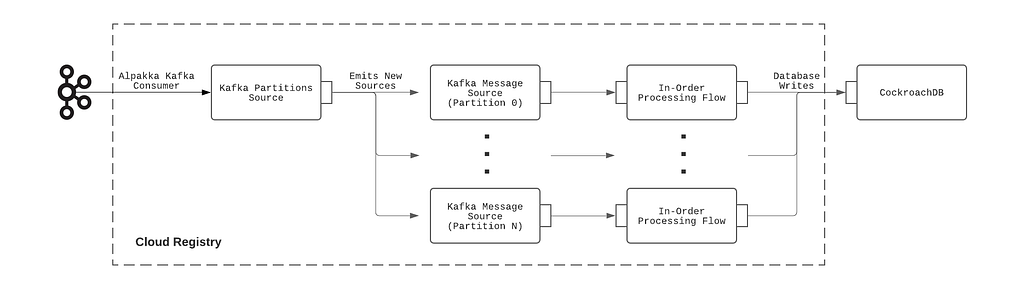
The construction of the Alpakka-based Kafka processing pipeline can be summarized with the following diagram:

Figure 2: Kafka processing pipeline employed by the Cloud Registry.

Implementation

The integration of Alpakka-Kafka streams with the Netflix Spring application context is very straightforward and is implemented as follows:

  1. Import the Alpakka-Kafka library in build.gradle, but exclude the kafka-client transitive dependency that comes packaged with it so that the Netflix internal-enhanced variant is used.
  2. Build a Spring @Configuration class that autowires the KafkaProperties bean injected by the Netflix Spring runtime and, using the Kafka settings available from that bean, construct an Alpakka-Kafka ConsumerSettings bean.
  3. Construct an Alpakka-Kafka processing graph using the ConsumerSettings bean as an input.

Because this integration explicitly uses the Netflix-enhanced KafkaConsumer and Netflix Spring-injected Kafka settings, the authentication, and metrics-logging facilities that come with the paved-path Spring KafkaListener are immediately enjoyed by the Alpakka-Kafka-based solution.

Testing

Functional testing of the Alpakka-Kafka consumers is very straightforward with the EmbeddedKafka library, which provides an in-memory Kafka instance to run tests against. To scale up testing with the complexity of the Kafka message processing pipeline, the message processing code was separated from the Alpakka-Kafka graph code. This allowed the message processing code to be tested separately using functional tests while minimizing the surface area of required testing by EmbeddedKafka-based Kafka integration tests.

Results

Prior to Alpakka-Kafka

The original Kafka processing solution implemented in the Cloud Registry was built on Spring KafkaListener, primarily due to its immediate availability as a paved-path solution provided by Netflix Spring. A timeline of the transition from Spring KafkaListener to Alpakka-Kafka is presented here for a better understanding of the motivations for the transition.

Memory and GC Troubles

The Spring KafkaListener-based solution was deployed earlier this year, during which messages on the Kafka topic were sparse because the Local Registry was not fully in production at the time. Upstream event sourcing was fully enabled on the producer side at around 2021–07–15 15:00 PST. By the following morning, alerts were received regarding high memory consumption and GC latencies, to the point where the service was unresponsive to HTTP requests. An investigation of the JVM memory dump revealed an internal Kafka message concurrent queue whose size had grown uncontrollably to over 1.3 million elements.

The cause for this abnormal queue growth is due to Spring KafkaListener’s lack of native back-pressure support. With KafkaListener, the Kafka message fetch rate is fixed on application startup. However, it can be adjusted by tuning the max-poll-interval-ms and max-poll-records configuration values, which need to be somehow determined empirically beforehand for best performance. This setup is neither optimal nor break-proof since the Kafka message processing rate will vary depending on environmental factors, such as database latencies in our system setup. As a result, the KafkaListener ends up effectively over-consuming messages over time, which is manifested in the growth of its internal message queue.

After doubling the number of service instances and increasing the instance sizes with only mediocre success, the decision was made to look into an alternative Kafka processing solution with full back-pressure management capabilities.

Kafka Topic Metrics

The enabling of event-sourcing from Local Registry significantly increased the Device Management Platform’s control plane traffic, as evidenced by the 9x growth of Kafka topic message publication frequency from 100 messages / 90 kB incoming per second to 900 messages / 840kB incoming per second (Figure 3).

Figure 3: Message traffic over time before and after event-sourcing was enabled.

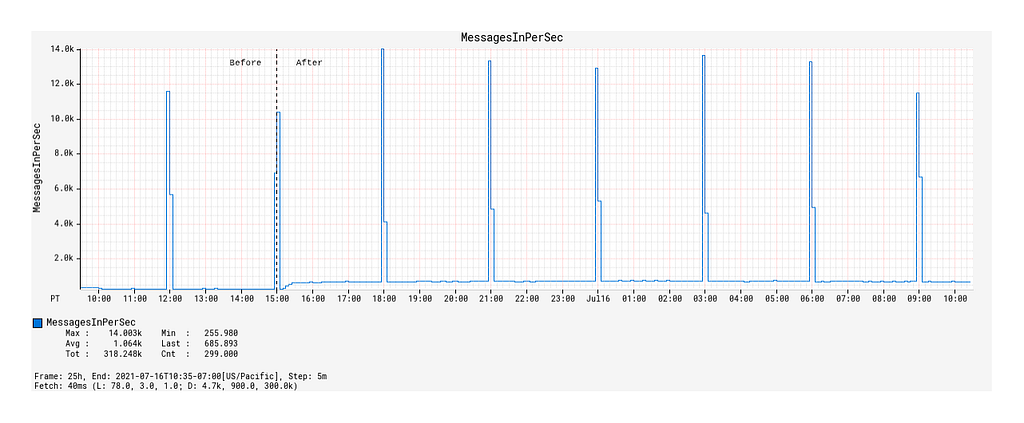
The spikes that occur on 3-hour intervals shown here correspond to the canary runs mentioned earlier that effectively load-test the Kafka topic with a flood of new records. Hereafter, they will be referred to as burst events. While the average message publication rate is low compared to the data systems out there that produce hundreds of thousands, if not millions, events per second, it does highlight the significance of having back-pressure management in place even at the lower end of the message load spectrum.

Kafka Consumption Improvements with Alpakka-Kafka

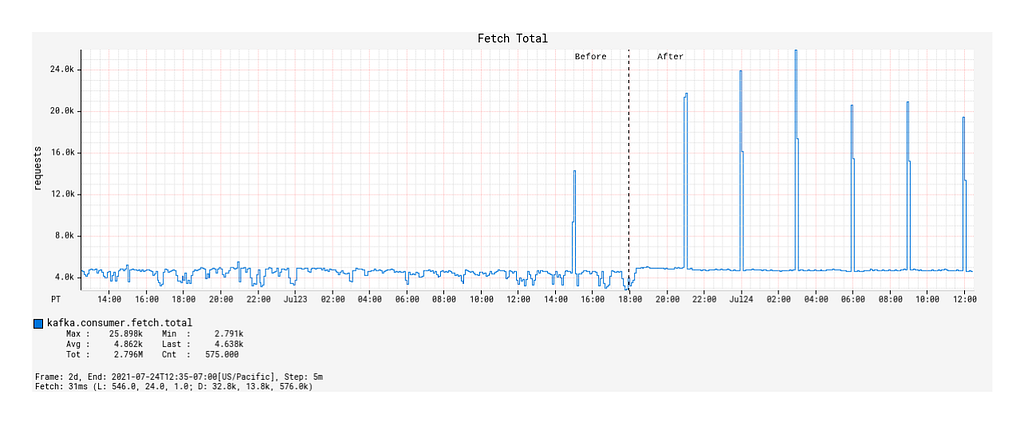
We now compare the Kafka consumption between the Spring KafkaListener-based Kafka processing solution and the Alpakka-Kafka-based solution, the latter of which was deployed to production on 2021–07–23 18:00 PST. In particular, we will look at three indicators of Kafka consumption performance: the message fetch rate, the max consumer lag, and the commit rate.

Fetch Request Metrics

Upon deployment of the Alpakka-Kafka-based processor, we made a few observations:

  • Prior to the deployment, the number of fetch calls over time generally remained unchanged across burst events but was otherwise actually quite unstable over time (Figure 4).
  • After the deployment, the fetch calls over time followed a 1:1 correspondence with the Kafka topic’s message publication rate, including the interval burst events (Figure 4). Outside of the burst event windows, the number of fetch calls over time was very stable.
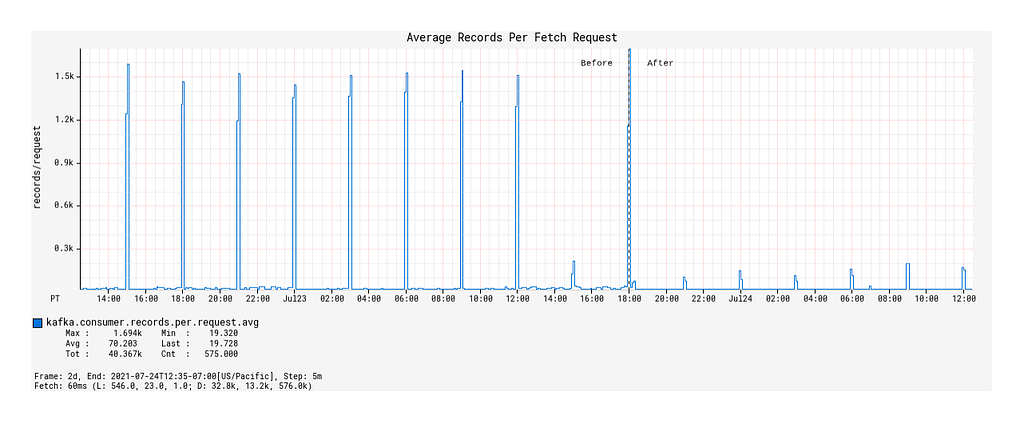
  • Surprisingly, the average number of records fetched per fetch request during the burst events windows decreased compared to that of the Spring KafkaListener-based processor (Figure 5).

What we can infer from these observations is that, with native back-pressure support in place, the Alpakka-Kafka-based processor is able to dynamically scale its Kafka consumption such that it is never under-consuming or over-consuming Kafka messages. This behavior keeps the processor constantly busy enough, but without overloading it with a growing queue of messages pulled from Kafka that eventually overflows the JVM’s memory and GC capacity.
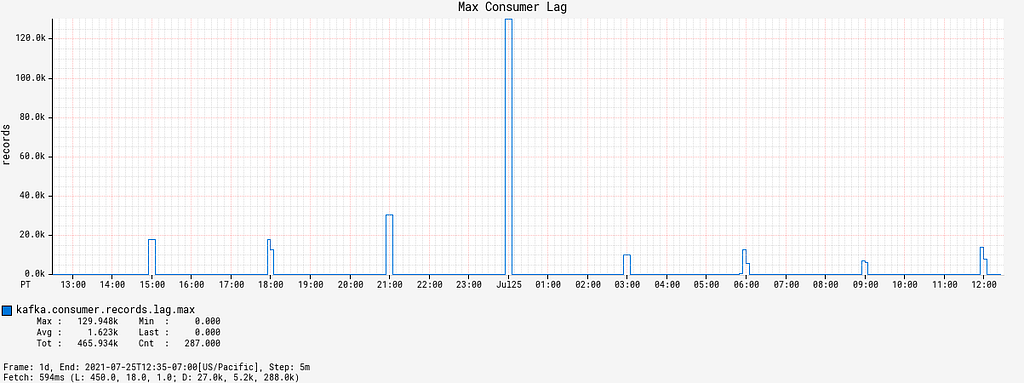
Figure 4: Record fetch calls made by the KafkaConsumer over time, before and after deployment of the Alpakka-Kafka-based processor.
Figure 5: Average number of records fetched per fetch request over time, before and after deployment.

Max Consumer Lag

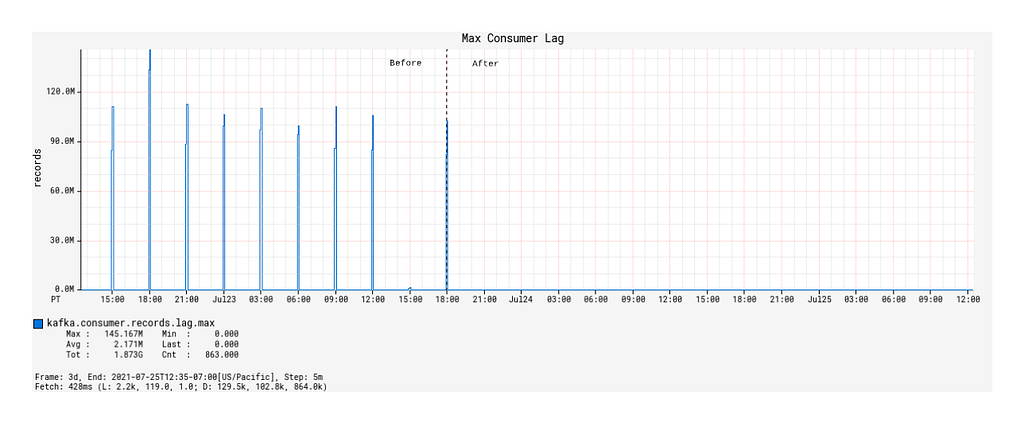
Except for JVM and service uptime, the most significant improvements with the Alpakka-Kafka-based processor manifested in the Kafka consumer lag metrics. While the Spring KafkaListener was deployed, the max consumer lag generally floated long-term at around 60,000 records, excluding the burst event time windows (this is not visually discernible from the graph due to the orders of magnitude differences in plotted values). From a functional point of view, this was unacceptable, as such a large constant lag value implies that device information updates will take a significantly long enough time to propagate into service such that it will be noticeable by our users. The situation exacerbates during the burst event windows, where the max consumer lag would increase to values of over 100 million records (Figure 6).

Since the deployment of the Alpakka-Kafka-based processor, the max consumer lag over time has averaged at zero outside of the burst event windows. Inside the burst event windows, the max consumer lag increases ephemerally to roughly 20,000 records, with only one outlier in the 48 hour time period since deployment (Figure 7). These metrics show us that the Kafka consumption patterns employed by Alpakka-Kafka and the streaming capabilities of Akka, in general, perform exceptionally well at scale, from the quiet use case to the presence of sudden huge message loads.

Figure 6: Max consumer lag of the KafkaConsumer over time, before and after deployment.
Figure 7: Max consumer lag of the KafkaConsumer over time, magnified to the time window some time after deployment.

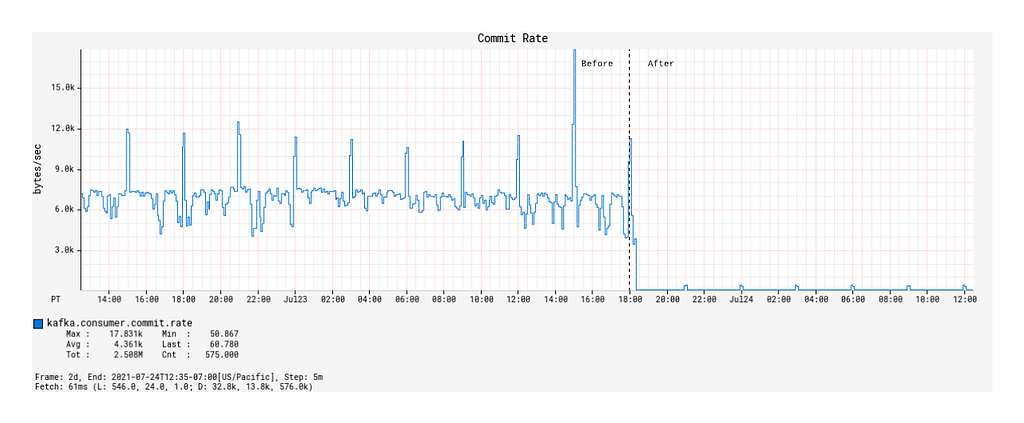
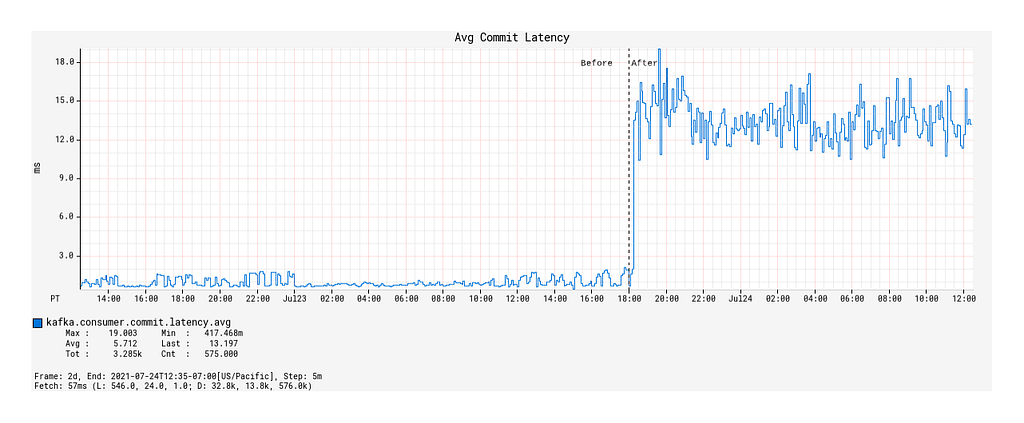
Commit Rate and Average Commit Latency

When a Kafka consumer fetches records, it can perform manual or automatic offset commits — this is configurable through enable.auto.commit. Contrary to the name, the semantics of manual vs auto commit don’t necessarily refer to how the offset commits are performed, but when in relations to the record fetch-process cycle. With auto commits, messages are acknowledged to have been received as soon as they are fetched and irrespective of processing, whereas with manual commits, the consumer can decide to acknowledge only after a message is properly processed.

By default, when enable.auto.commit is set to false, the Spring KafkaListener performs an offset commit every time a record is processed, i.e., the acknowledgement mode is set to AckMode.RECORD. This is exceedingly inefficient, and is known to reduce the message consumption throughput of the consumer. With the Alpakka-Kafka-based processor, we opted for making record commits in batches (set to 1000 by default), with a max interval of 1 second allowed between commits. This behavior is similar to the AckMode.COUNT_TIME acknowledgement mode in Spring KafkaListener, but with the added benefit of automatically attempting to complete outstanding commit requests when the Kafka consumption fails or terminates.

Under a manual offset commit scheme, it is always possible to re-process Kafka messages in the case of failures. To retain the (mainly) exactly-once processing that is guaranteed by the automatic offset commit scheme, the Kafka processor was updated to store device updates using idempotent upserts, i.e., perform an upsert conditioned on the timestamp of record in the database being earlier than the timestamp of the update to be upserted. This effectively ensures exactly-once processing on a per-event basis.

With the deployment of the Alpakka-Kafka-based processor, the commit rate was significantly lowered from roughly 7 kbytes/sec to 50 bytes/sec (Figure 8), but the average commit latency increased from 1 ms on average to 12 ms (Figure 9). Nonetheless, this is a considerable reduction in the network overhead spent on committing offsets, and has contributed significantly to the improved throughput of the Kafka processing.

Figure 8: Rate of offset commits made by the KafkaConsumer over time, before and after deployment.
Figure 9: Average latency per offset commit over time, before and after deployment.

Conclusion

Kafka streams processing can be difficult to get right. Many system implementation details need to be considered in light of the business requirements. Fortunately, the primitives provided by Akka streams and Alpakka-Kafka empower us to achieve exactly this by allowing us to build streaming solutions that match the business workflows we have while scaling up developer productivity in building out and maintaining these solutions. With the Alpakka-Kafka-based processor in place in the Cloud Registry, we have ensured fault tolerance in the consumer side of the control plane, which is key to enabling accurate and reliable device state aggregation within the Device Management Platform.

Though we have achieved fault-tolerant message consumption, it is only one aspect of the design and implementation of the Device Management Platform. The reliability of the platform and its control plane rests on significant work made in several areas, including the MQTT transport, authentication and authorization, and systems monitoring, all of which we plan to discuss in detail in future blog posts. In the meantime, as a result of this work, we can expect the Device Management Platform to continue to scale to increasing workloads over time as we onboard ever more devices into our systems.


Towards a Reliable Device Management Platform was originally published in Netflix TechBlog on Medium, where people are continuing the conversation by highlighting and responding to this story.

Data Movement in Netflix Studio via Data Mesh

Post Syndicated from Netflix Technology Blog original https://netflixtechblog.com/data-movement-in-netflix-studio-via-data-mesh-3fddcceb1059

By Andrew Nguonly, Armando Magalhães, Obi-Ike Nwoke, Shervin Afshar, Sreyashi Das, Tongliang Liu, Wei Liu, Yucheng Zeng

Background

Over the next few years, most content on Netflix will come from Netflix’s own Studio. From the moment a Netflix film or series is pitched and long before it becomes available on Netflix, it goes through many phases. This happens at an unprecedented scale and introduces many interesting challenges; one of the challenges is how to provide visibility of Studio data across multiple phases and systems to facilitate operational excellence and empower decision making. Netflix is known for its loosely coupled microservice architecture and with a global studio footprint, surfacing and connecting the data from microservices into a studio data catalog in real time has become more important than ever.

Operational Reporting is a reporting paradigm specialized in covering high-resolution, low-latency data sets, serving detailed day-to-day activities¹ and processes of a business domain. Such a paradigm aspires to assist front-line operations personnel and stakeholders in “running the business”²; performing their tasks through means such as ad hoc analysis, decision-support, and tracking (of tasks, assets, schedules, etc). The paradigm spans across methods, tools, and technologies and is usually defined in contrast to analytical reporting and predictive modeling which are more strategic (vs. tactical) in nature.

At Netflix Studio, teams build various views of business data to provide visibility for day-to-day decision making. With dependable near real-time data, Studio teams are able to track and react better to the ever-changing pace of productions and improve efficiency of global business operations using the most up-to-date information. Data connectivity across Netflix Studio and availability of Operational Reporting tools also incentivizes studio users to avoid forming data silos.

The Journey

In the past few years, Netflix Studio has gone through few iterations of data movement approaches. In the initial stage, data consumers set up ETL pipelines directly pulling data from databases. With this batch style approach, several issues have surfaced like data movement is tightly coupled with database tables, database schema is not an exact mapping of business data model, and data being stale given it is not real time etc. Later on, we moved to event driven streaming data pipelines (powered by Delta), which solved some problems compared to the batch style, but had its own pain points, such as a high learning curve of stream processing technologies, manual pipeline setup, a lack of schema evolution support, inefficiency of onboarding new entities, inconsistent security access models, etc.

With the latest Data Mesh Platform, data movement in Netflix Studio reaches a new stage. This configuration driven platform decreases the significant lead time when creating a new pipeline, while offering new support features like end-to-end schema evolution, self-serve UI and secure data access. The high level diagram below indicates the latest version of data movement for Operational Reporting.

Operational Reporting Architecture Overview

For data delivery, we leverage the Data Mesh platform to power the data movement. Netflix Studio applications expose GraphQL queries via Studio Edge, which is a unified graph that connects all data in Netflix Studio and provides consistent data retrieval. Change Data Capture(CDC) source connector reads from studio applications’ database transaction logs and emits the change events. The CDC events are passed on to the Data Mesh enrichment processor, which issues GraphQL queries to Studio Edge to enrich the data. Once the data has landed in the Iceberg tables in Netflix Data Warehouse, they could be used for ad-hoc or scheduled querying and reporting. Centralized data will be moved to third party services such as Google Sheets and Airtable for the stakeholders. We will deep dive into Data Delivery and Data Consumption in the following sections.

Data Delivery via Data Mesh

What is Data Mesh?

Data Mesh is a fully managed, streaming data pipeline product used for enabling Change Data Capture (CDC) use cases. In Data Mesh, users create sources and construct pipelines. Sources mimic the state of an externally managed source — as changes occur in the external source, corresponding CDC messages are produced to the Data Mesh source. Pipelines can be configured to transform and store data to externally managed sinks.

Data Mesh provides a drag-and-drop, self-service user interface for exploring sources and creating pipelines so that users can focus on delivering business value without having to worry about managing and scaling complex data streaming infrastructure.

CDC and data source

Change data capture or CDC, is a semantic for processing changes in a source for the purpose of replicating those changes to a sink. The table changes could be row changes (insert row, update row, delete row) or schema changes (add column, alter column, drop column). As of now, CDC sources have been implemented for data stores at Netflix (MySQL, Postgres). CDC events can also be sent to Data Mesh via a Java Client Producer Library.

Reusable Processors and Configuration Driven

In Data Mesh, a processor is a configurable data processing application that consumes, transforms, and produces CDC events. A processor has 1 or more inputs and 0 or more outputs. Processors with 0 outputs are sink connectors; which write events to externally managed sinks (e.g. Iceberg, ElasticSearch, etc).

Processors with Different Inputs/Outputs

Data Mesh allows developers to contribute processors to the platform. Processors are not necessarily centrally developed and managed. However, the Data Mesh platform team strives to provide and manage the most highly leveraged processors (e.g. source connectors and sink connectors)

Processors are reusable. The same processor image package is used multiple times for all instances of the processor. Each instance is configured to fit each use case. For example, a GraphQL enrichment processor can be provisioned to query GraphQL Services to enrich data in different pipelines; an Iceberg sink processor can be initialized multiple times to write data to different databases/tables with different schema.

End-to-End Schema Evolution

Schema is a key component of Data Mesh. When an upstream schema evolves (e.g. schema change in the MySQL table), Data Mesh detects the change, checks the compatibility and applies the change to the downstream. With schema evolution, Data Mesh ensures the Operational Reporting pipelines always produce data with the latest schema.

We will cover a few core concepts in the Data Mesh Schema domain.

Consumer schema
Consumer schema defines how data is consumed by the downstream processors. See example below.

Consumer Schema Example
Consumer Schema Example

Schema Compatibility
Data Mesh uses Consumer Schema compatibility to achieve flexible yet safe schema evolution. If a field consumed by an Operational Reporting pipeline is removed from CDC source, Data Mesh categorizes this change as incompatible, pauses the pipeline processing and notifies the pipeline owner. On the other hand, if a required field is not consumed by any consumer, dropping such fields would be compatible.

Two Types of Processors
1. Pass through all fields from upstream to downstream.

  • Example: Filter Processor, Sink Processors
Opt in to schema Evolution example

2. Only uses a subset of fields from upstream.

  • Example: Project Processor, Enrichment Processor
Opt out to schema Evolution example

In Data Mesh, we introduce the Opt-in to Schema Evolution boolean flag to differentiate those two types of use cases.

  • Opt in: All the upstream fields will be propagated to the processor. For example, when a new field is added upstream, it will be propagated automatically.
  • Opt out: Only a subset of fields (defined using ‘Is Consumed’ checkboxes) is propagated and used in the processor. Upstream changes to the rest of the fields won’t affect this processor.

Schema Propagation
After the Schema Compatibility is checked, Data Mesh Platform will propagate the schema change based on the end user’s intention. With the opt-in to schema Evolution flag, Operational Reporting pipelines can keep the schema up-to-date with upstream data stores. As part of schema propagation, the platform also syncs the schema from the pipeline to the Iceberg sink.

Schema Evolution Diagram

Enrichment Processor via GraphQL

In the current Data Mesh Operational Reporting pipelines, the most commonly used intermediate processor is the GraphQL Enrichment Processor. It takes in the column value from CDC events coming from Source Connector as GraphQL query input, then submits a query to Studio Edge to enrich the data. With Studio Edge’s single data model, it centralizes data modeling efforts, which is highly leveraged by Studio UI Apps, Backend services and Search platforms. Enriching the data via Studio Edge helps us achieve consistent data modeling across the whole ecosystem for Operational Reporting.

Here is the example of GraphQL processor configuration, pipeline builder only need config the following fields to provision an enrichment processor:

GraphQL Enrichment Processor Configuration Example

The image below is a sample Operational Reporting pipeline in the production environment to sink the Movie related data. Teams who want to move their data no longer need to learn and write customized Stream Processing jobs. Instead they just need to configure the pipeline topology in the UI while getting other features like schema evolution and secure data access out of the box.

Operational Reporting Pipeline Example

Iceberg Sink

Apache Iceberg is an open source table format for huge analytics datasets. Data Mesh leverages Iceberg tables as data warehouse sinks for downstream analytics use cases. Currently Iceberg sink is appended only. Views are built on top of the raw Iceberg tables to retrieve the latest record for every primary key based on the operational timestamp, which indicates when the record is produced in the sink. Current pipeline consumers are directly consuming Views instead of raw tables.

The compaction process is needed to optimize the performance of downstream queries on the business view as well as lower costs of S3 GET OBJECT operations. A daily process ranks the records by timestamp to generate a data frame of compacted records. Old data files are overwritten with a set of new data files that contain only the compacted data.

Data Quality

Data Mesh provides metrics and dashboards at both the processor and pipeline level for operational observability. Operational Reporting pipeline owners will get alerts if something goes wrong with their pipelines. We also have two types of auditing on the data tables generated from Data Mesh pipelines to guarantee data quality: end-to-end auditing and synthetic events.

Most of the business views created on top of the Iceberg tables can tolerate a few minutes of latency. However, it is paramount that we validate the complete set of identifiers such as a list of movie ids across producers and consumers for higher overall confidence in the data transport layer of choice. For end-to-end audits, the objective is to run the audits hourly via Big data Platform Scheduler, which is a centralized and integrated tool provided by Netflix data platform for running workflows in an efficient, reliable and reproducible way. The audits check for equality (i.e. query results should be the same), the symmetric difference between two data sets should be empty across multiple runs, and the eventual consistency within the SLA. An hourly notification is sent when a set of primary keys consistently do not match between source of truth and target Data Mesh tables.

End to End (Black Box) Auditing Example

Synthetic events audits are artificially triggered change events to imitate common CUD operations of services. It is generating heartbeat signals at a constant frequency with the objective of using them as a baseline to verify the health of the pipeline regardless of traffic patterns or occasional silences.

Data Consumption

Our studio partners rely on data to make informed decisions and to collaborate during all the phases related to production. The Studio Tech Solutions team provides near real-time reports in some data tool of choice, which we call trackers to empower the decision making.

For the past few years, many of these trackers were powered by hand-curated SQL scripts and API calls being managed by CRON schedulers implemented in a Java Service called Lego. Lego was the main tool for the STS team, and at its peak, Lego managed 300+ trackers.

This strategy had its own set of challenges: being schema-less and treating every report column like a string not always worked out, the volatile reliance on direct RDS connections and rate limits from third party APIs would often make jobs fail. We had a set of “core views” which would be specifically tailored for reports, but this caused queries that just required a very small subset of fields to be slow and expensive due to the view doing a huge amount of joining and aggregation work before being able to retrieve that small subset.

Besides the issues, this worked fine when we didn’t have many trackers to maintain, but as we created more trackers to the point of having many hundreds, we started having issues around maintenance, awareness, knowledge sharing and standardization. New team members had a hard time getting onboard, figuring out which SQL powered which tracker was tough, the lack of standards made every SQL look different and having to update trackers as the data sources changed was a nightmare.

With this in mind, the Studio Tech Solutions focused efforts in building Genesis, a Semantic Data Layer that allows the team to map data points in Data Source Definitions defined as YAML files and then use those to generate the SQL needed for the trackers, based on a selection of fields, filters and formatters specified in an Input Definition file. Genesis takes care of joining, aggregating, formatting and filtering data based on what is available in the Data Source Definitions and specified by the user through the Input Definition being executed.

Genesis Data Source and Input definition example

Genesis is a stateless CLI written in Node.js that reads everything it needs from the file system based on the paths specified in the arguments. This allows us to hook Genesis into Jenkins Jobs, providing a GitOps and CI experience to maintain existing trackers, as well as create new trackers. We can simply change the data layer, trigger an empty pull request, review the changes and have all our trackers up to date with the data source changes.

As of the date of writing, Genesis powers 240+ trackers and is growing everyday, empowering thousands of partners in our studios globally to collaborate, annotate and share information using near-real-time data.

Git-based Tracker management workflow powered by Genesis and the Big Data Scheduler

The generated queries are then used in Workflow Definitions for multiple trackers. The Netflix Data Warehouse offers support for users to create data movement workflows that are managed through our Big Data Scheduler, powered by Titus.

We use the scheduler to execute our queries and move the results to a data tool, which often is a Google Sheet Tab, Airtable base or Tableau dashboard. The scheduler offers templated jobs for moving data from a Presto SQL output to these tools, making it easy to create and maintain hundreds of data movement workflows.

The diagram below summarizes the data consumption flow when building trackers:

Data Consumption Overview

As of July 2021, the Studio Tech Solutions team is finishing a migration from all the trackers built in Lego to use Genesis and the Data Portal. This strategy has increased the Studio Tech Solutions team performance and stability. Trackers are now easy for the team to create, review, change, monitor and discover.

Now and Future

In conclusion, our studio partners have a tracker available to them, populated with near real-time data and tailored to their needs. They can manipulate, annotate, and collaborate using a flexible tool they are familiar with.

Along the journey, we have learned that evolving data movement in complex domains could take multiple iterations and needs to be driven by the business impact. The great cross-functional partnership and collaboration among all data stakeholders is crucial to shape the ideal data product.

However, our story doesn’t end here. We still have a long journey ahead of us to fulfill the vision of such ideal data product, especially in areas such as:

  • Self-servicing data pipelines provisioning via configuration
  • Providing toolings for data discoverability, understandability, usage visibility and change management
  • Enabling data domain orientation and ownership/governance management
  • Bootstrapping trackers in our Studio ecosystem instead of third party tools. Along the same line as the point above, this would allow us to maintain high standards of data governance, lineage, and security.
  • Read-write reports and trackers using GraphQL mutations

These are some of the interesting areas that Netflix Studio is planning to invest in. We will have follow up blog posts on these topics in future. Please stay tuned!

Endnotes

¹ Inmon, Bill. Operational and Informational Reporting, Information Management, July 1st, 2000.
² Dehghani, Zhamak. Data Mesh: Delivering Data-driven Value at Scale, O’Reilly Media, Inc., 2021.

Acknowledgements

Data Movement via Data Mesh has been a success in Netflix Studio owing to multiple teams’ efforts. We would like to acknowledge the following colleagues: Amanda Benhamou, Andreas Andreakis, Anthony Preza, Bo Lei, Charles Zhao, Justin Cunningham, Kasturi Chatterjee, Kevin Zhu, Stephanie Barreyro, Yoomi Koh.


Data Movement in Netflix Studio via Data Mesh was originally published in Netflix TechBlog on Medium, where people are continuing the conversation by highlighting and responding to this story.

Data Engineers of Netflix — Interview with Kevin Wylie

Post Syndicated from Netflix Technology Blog original https://netflixtechblog.com/data-engineers-of-netflix-interview-with-kevin-wylie-7fb9113a01ea

Data Engineers of Netflix — Interview with Kevin Wylie

This post is part of our “Data Engineers of Netflix” series, where our very own data engineers talk about their journeys to Data Engineering @ Netflix.

Kevin Wylie is a Data Engineer on the Content Data Science and Engineering team. In this post, Kevin talks about his extensive experience in content analytics at Netflix since joining more than 10 years ago.

Kevin grew up in the Washington, DC area, and received his undergraduate degree in Mathematics from Virginia Tech. Before joining Netflix, he worked at MySpace, helping implement page categorization, pathing analysis, sessionization, and more. In his free time he enjoys gardening and playing sports with his 4 kids.

His favorite TV shows: Ozark, Breaking Bad, Black Mirror, Barry, and Chernobyl

Since I joined Netflix back in 2011, my favorite project has been designing and building the first version of our entertainment knowledge graph. The knowledge graph enabled us to better understand the trends of movies, TV shows, talent, and books. Building the knowledge graph offered many interesting technical challenges such as entity resolution (e.g., are these two movie names in different languages really the same?), and distributed graph algorithms in Spark. After we launched the product, analysts and scientists began surfacing new insights that were previously hidden behind difficult-to-use data. The combination of overcoming technical hurdles and creating new opportunities for analysis was rewarding.

Kevin, what drew you to data engineering?

I stumbled into data engineering rather than making an intentional career move into the field. I started my career as an application developer with basic familiarity with SQL. I was later hired into my first purely data gig where I was able to deepen my knowledge of big data. After that, I joined MySpace back at its peak as a data engineer and got my first taste of data warehousing at internet-scale.

What keeps me engaged and enjoying data engineering is giving super-suits and adrenaline shots to analytics engineers and data scientists.

When I make something complex seem simple, or create a clean environment for my stakeholders to explore, research and test, I empower them to do more impactful business-facing work. I like that data engineering isn’t in the limelight, but instead can help create economies of scale for downstream analytics professionals.

What drew you to Netflix?

My wife came across the Netflix job posting in her effort to keep us in Los Angeles near her twin sister’s family. As a big data engineer, I found that there was an enormous amount of opportunity in the Bay Area, but opportunities were more limited in LA where we were based at the time. So the chance to work at Netflix was exciting because it allowed me to live closer to family, but also provided the kind of data scale that was most common for Bay Area companies.

The company was intriguing to begin with, but I knew nothing of the talent, culture, or leadership’s vision. I had been a happy subscriber of Netflix’s DVD-rental program (no late fees!) for years.

After interviewing, it became clear to me that this company culture was different than any I had experienced.

I was especially intrigued by the trust they put in each employee. Speaking with fellow employees allowed me to get a sense for the kinds of people Netflix hires. The interview panel’s humility, curiosity and business acumen was quite impressive and inspired me to join them.

I was also excited by the prospect of doing analytics on movies and TV shows, which was something I enjoyed exploring outside of work. It seemed fortuitous that the area of analytics that I’d be working in would align so well with my hobbies and interests!

Kevin, you’ve been at Netflix for over 10 years now, which is pretty incredible. Over the course of your time here, how has your role evolved?

When I joined Netflix back in 2011, our content analytics team was just 3 people. We had a small office in Los Angeles focused on content, and significantly more employees at the headquarters in Los Gatos. The company was primarily thought of as a tech company.

At the time, the data engineering team mainly used a data warehouse ETL tool called Ab Initio, and an MPP (Massively Parallel Processing) database for warehousing. Both were appliances located in our own data center. Hadoop was being lightly tested, but only in a few high-scale areas.

Fast forward 10 years, and Netflix is now the leading streaming entertainment service — serving members in over 190 countries. In the data engineering space, very little of the same technology remains. Our data centers are retired, Hadoop has been replaced by Spark, Ab Initio and our MPP database no longer fits our big data ecosystem.

In addition to the company and tech shifting, my role has evolved quite a bit as our company has grown. When we were a smaller company, the ability to span multiple functions was valued for agility and speed of delivery. The sooner we could ingest new data and create dashboards and reports for non-technical users to explore and analyze, the sooner we could deliver results. But now, we have a much more mature business, and many more analytics stakeholders that we serve.

For a few years, I was in a management role, leading a great team of people with diverse backgrounds and skill sets. However, I missed creating data products with my own hands so I wanted to step back into a hands-on engineering role. My boss was gracious enough to let me make this change and focus on impacting the business as an individual contributor.

As I think about my future at Netflix, what motivates me is largely the same as what I’ve always been passionate about. I want to make the lives of data consumers easier and to enable them to be more impactful. As the company scales and as we continue to invest in storytelling, the opportunity grows for me to influence these decisions through better access to information and insights. The biggest impact I can make as a data engineer is creating economies of scale by producing data products that will serve a diverse set of use cases and stakeholders.

If I can build beautifully simple data products for analytics engineers, data scientists, and analysts, we can all get better at Netflix’s goal: entertaining the world.

Learning more

Interested in learning more about data roles at Netflix? You’re in the right place! Keep an eye out for our open roles in Data Science and Engineering by visiting our jobs site here. Our culture is key to our impact and growth: read about it here. To learn more about our Data Engineers, check out our chats with Dhevi Rajendran and Samuel Setegne.


Data Engineers of Netflix — Interview with Kevin Wylie was originally published in Netflix TechBlog on Medium, where people are continuing the conversation by highlighting and responding to this story.

Exploring Data @ Netflix

Post Syndicated from Netflix Technology Blog original https://netflixtechblog.com/exploring-data-netflix-9d87e20072e3

By Gim Mahasintunan on behalf of Data Platform Engineering.

Supporting a rapidly growing base of engineers of varied backgrounds using different data stores can be challenging in any organization. Netflix’s internal teams strive to provide leverage by investing in easy-to-use tooling that streamlines the user experience and incorporates best practices.

In this blog post, we are thrilled to share that we are open-sourcing one such tool: the Netflix Data Explorer. The Data Explorer gives our engineers fast, safe access to their data stored in Cassandra and Dynomite/Redis data stores.

Netflix Data Explorer on GitHub

History

We began this project several years ago when we were onboarding many new Dynomite customers. Dynomite is a high-speed in-memory database, providing highly available cross datacenter replication while preserving Redis-like semantics. We wanted to lower the barrier for adoption so users didn’t need to know datastore-specific CLI commands, could avoid mistakenly running commands that might negatively impact performance, and allow them to access the clusters they frequented every day.

As the project took off, we saw a similar need for our other datastores. Cassandra, our most significant footprint in the fleet, seemed like a great candidate. Users frequently had questions on how they should set up replication, create tables using an appropriate compaction strategy, and craft CQL queries. We knew we could give our users an elevated experience, and at the same time, eliminate many of the common questions on our support channels.

We’ll explore some of the Data Explorer features, and along the way, we’ll highlight some of the ways we enabled the OSS community while still handling some of the unique Netflix-specific use cases.

Multi-Cluster Access

By simply directing users to a single web portal for all of their data stores, we can gain a considerable increase in user productivity. Furthermore, in production environments with hundreds of clusters, we can reduce the available data stores to those authorized for access; this can be supported in OSS environments by implementing a Cluster Access Control Provider responsible for fetching ownership information.

Browsing your accessible clusters in different environments and regions

Schema Designer

Writing CREATE TABLE statements can be an intimidating experience for new Cassandra users. So to help lower the intimidation factor, we built a schema designer that lets users drag and drop their way to a new table.

The schema designer allows you to create a new table using any primitive or collection data type, then designate your partition key and clustering columns. It also provides tools to view the storage layout on disk; browse the supported sample queries (to help design efficient point queries); guide you through the process of choosing a compaction strategy, and many other advanced settings.

Dragging and dropping your way to a new Cassandra table

Explore Your Data

You can quickly execute point queries against your cluster in Explore mode. The Explore mode supports full CRUD of records and allows you to export result sets to CSV or download them as CQL insert statements. The exported CQL can be a handy tool for quickly replicating data from a PROD environment to your TEST environment.

Explore mode gives you quick access to table data

Support for Binary Data

Binary data is another popular feature used by many of our engineers. The Data Explorer won’t fetch binary value data by default (as the persisted data might be sizable). Users can opt-in to retrieve these fields with their choice of encoding.

Choosing how you want to decode blob data

Query IDE

Efficient point queries are available in the Explore mode, but you may have users that still require the flexibility of CQL. Enter the Query mode, which includes a powerful CQL IDE with features like autocomplete and helpful snippets.

Example of free-form Cassandra queries with autocomplete assistance

There are also guardrails in place to help prevent users from making mistakes. For instance, we’ll redirect the user to a bespoke workflow for deleting a table if they try to perform a “DROP TABLE…” command ensuring the operation is done safely with additional validation. (See our integration with Metrics later in this article.)

As you submit queries, they will be saved in the Recent Queries view as well — handy when you are trying to remember that WHERE clause you had crafted before the long weekend.

Dynomite and Redis Features

While C* is feature-rich and might have a more extensive install base, we have plenty of good stuff for Dynomite and Redis users too. Note, the terms Dynomite and Redis are used interchangeably unless explicitly distinguished.

Key Scanning

Since Redis is an in-memory data store, we need to avoid operations that inadvertently load all the keys into memory. We perform SCAN operations across all nodes in the cluster, ensuring we don’t strain the cluster.

Scanning for keys on a Dynomite cluster

Dynomite Collection Support

In addition to simple String keys, Dynomite supports a rich collection of data types, including Lists, Hashes, and sorted and unsorted Sets. The UI supports creating and manipulating these collection types as well.

Editing a Redis hash value

Supporting OSS

As we were building the Data Explorer, we started getting some strong signals that the ease-of-use and productivity gains that we’d seen internally would benefit folks outside of Netflix as well. We tried to balance codifying some hard-learned best practices that would be generally applicable while maintaining the flexibility to support various OSS environments. To that end, we’ve built several adapter layers into the product where you can provide custom implementations as needed.

The application was architected to enable OSS by introducing seams where users could provide their implementations for discovery, access control, and data store-specific connection settings. Users can choose one of the built-in service providers or supply a custom provider.

The diagram below shows the server-side architecture. The server is a Node.js Express application written in TypeScript, and the client is a Single Page App written in Vue.js.

Data Explorer architecture and service adapter layers

Demo Environment

Deploying a new tool in any real-world environment is a time commitment. We get it, and to help you with that initial setup, we have included a dockerized demo environment. It can build the app, pull down images for Cassandra and Redis, and run everything in Docker containers so you can dive right in. Note, the demo environment is not intended for production use.

Overridable Configuration

The Data Explorer ships with many default behaviors, but since no two production environments are alike, we provide a mechanism to override the defaults and specify your custom values for various settings. These can range from which port numbers to use to which features should be disabled in a production environment. (For example, the ability to drop a Cassandra table.)

CLI Setup Tool

To further improve the experience of creating your configuration file, we have built a CLI tool that provides a series of prompts for you to follow. The CLI tool is the recommended approach for building your configuration file, and you can re-run the tool at any point to create a new configuration.

The CLI allows you to create a custom configuration

You can also generate multiple configuration files and easily switch between them when working with different environments. We have instructions on GitHub on working with more than one configuration file.

Service Adapters

It’s no secret that Netflix is a big proponent of microservices: we have discovery services for identifying Cassandra and Dynomite clusters in the environment; access-control services that identify who owns a data store and who can access it; and LDAP services to find out information about the logged-in user. There’s a good chance you have similar services in your environment too.

To help enable such environments, we have several pre-canned configurations with overridable values and adapter layers in place.

Discovery

The first example of this adapter layer in action is how the application finds Discovery information — these are the names and IP addresses of the clusters you want to access. The CLI allows you to choose from a few simple options. For instance, if you have a process that can update a JSON file on disk, you can select “file system.” If instead, you have a REST-based microservice that provides this information, then you can choose “custom” and write a few lines of code necessary to fetch it.

Choosing to discover our data store clusters by reading a local file

Metrics

Another example of this service adapter layer is integration with an external metrics service. We progressively enhance the UI by displaying keyspace and table metrics by implementing a metrics service adapter. These metrics provide insight into which tables are being used at a glance and help our customers make an informed decision when dropping a table.

Without metrics support
With optional metrics support

OSS users can enable the optional Metrics support via the CLI. You then just need to write the custom code to fetch the metrics.

CLI enabling customization of advanced features

i18n Support

While internationalization wasn’t an explicit goal, we discovered that providing Netflix-specific messages in some instances yielded additional value to our internal users. Fundamentally, this is similar to how resource bundles handle different locales.

We are making en-NFLX.ts available internally and en-US.ts available externally. Enterprise customers can enhance their user’s experience by creating custom resource bundles (en-ACME.ts) that link to other tools or enhance default messages. Only a small percentage of the UI and server-side exceptions use these message bundles currently — most commonly to augment messages somehow (e.g., provide links to internal slack channels).

Final Thoughts

We invite you to check out the project and let us know how it works for you. By sharing the Netflix Data Explorer with the OSS community, we hope to help you explore your data and inspire some new ideas.


Exploring Data @ Netflix was originally published in Netflix TechBlog on Medium, where people are continuing the conversation by highlighting and responding to this story.

Introducing Netflix Timed Text Authoring Lineage

Post Syndicated from Netflix Technology Blog original https://netflixtechblog.com/introducing-netflix-timed-text-authoring-lineage-6fb57b72ad41

A Script Authoring Specification

By: Bhanu Srikanth, Andy Swan, Casey Wilms, Patrick Pearson

The Art of Dubbing and Subtitling

Dubbing and subtitling are inherently creative processes. At Netflix, we strive to make shows as joyful to watch in every language as in the original language, whether a member watches with original or dubbed audio, closed captions, forced narratives, subtitles or any combination they prefer. Capturing creative vision and nuances in translation is critical to achieving this goal. Creating a dub or a subtitle is a complex, multi-step process that involves:

  • Transcribing and timing the dialogue in the original language from a completed show to create a source transcription text
  • Notating dialogue events with character information and other annotations
  • Generating localization notes to guide further adaptation
  • Translating the dialogue to a target language
  • Adapting the translation to the dubbing and subtitling specifications; ex. matching the actor’s lip movements in the case of dubs and considering reading speeds and shot changes for subtitles

Authoring Scripts

Script files are the essence and the driving force in the localization workflow. They carry dialogue, timecodes and other information as they travel from one tool to another to be transcribed, translated, and adapted for performance by voice artists. Dub scripts, Audio Description, Forced Narratives, Closed Captions, and Subtitles all need to be authored in complex tools that manage the timing, location, and formatting of the text on screen.

Currently, scripts get delivered to Netflix in various ways — Microsoft Word, PDF, Microsoft Excel, Rich Text files, etc., to name a few. These carry crucial information such as dialogues, timecodes, annotations, and other localization contexts. However, the variety of these file formats and inconsistent way of specifying such information across them has made efforts to streamline the localization workflow unattainable in the past.

Timed Text Authoring Lineage, an Authoring Specification

We decided to remove this stumbling block by developing a new authoring specification called Timed Text Authoring Lineage (TTAL). It enables a seamless exchange of script files between various authoring and prompting tools in the localization pipeline. A TTAL file carries all pertinent information such as type of script, dialogues, timecode, metadata, original language text, transcribed text, language information etc. We have designed TTAL to be robust and extensible to capture all of these details.

By defining vocabulary and annotations around timed text, we strive to simplify our approach to capturing, storing, and sharing materials across the localization pipeline. The name TTAL is carefully crafted to convey its purpose and usage:

  • “Timed Text” in the name means it carries the dialogue along with the corresponding timecode
  • “Authoring” underscores that this is used for authoring scripts in dubbing and subtitling
  • The “Lineage” part of the name speaks to how the script has evolved from the time the show was produced in one language to the time when it was performed in another language by the voice actors or subtitled in other languages.

In a nutshell, TTAL has been designed to simplify script authoring, so the creative energy is spent on the art of dubbing and subtitling rather than managing adapted and recorded script delivery.

Example TTAL Workflow In Dubbing

We have been piloting the authoring and exchange of TTAL scripts as well as the associated workflow with our technology partners and English dubbing partners over the last few months. We receive adapted scripts before recording and again once recording is complete. This workflow, illustrated below, has enabled our dubbing partners to deliver more accurate scripts at crucial moments.

Prompting Tools

As an initial step, we worked closely with several dubbing technology providers to incorporate TTAL into their product using JSON as the underlying format. We appreciate the efforts put forth by the developers of these products for test driving TTAL and giving us crucial feedback to improve it.

Third-party tools that support import and export of scripts in TTAL are:

Servicing The Ultimate Goal

Having tools in the localization pipeline adopt TTAL as a unified way to exchange scripts will be beneficial to all players in the ecosystem in more ways than one. It will improve the capture of consistently structured dub scripts giving us the ability to better parse and leverage the contents of scripts, pave the path for streamlining the workflow, and enable interoperability between tools in the localization pipeline. Ultimately, all these will serve Netflix’s unwavering goal of fulfilling and maintaining the creative vision throughout the localization process.

Moving Forward

This is just the beginning. We have laid a solid foundation for enabling interoperability by developing a specification for script authoring. We have worked with a few dubbing technology developers to incorporate TTAL into their products, and have modified the specification based on feedback from these early adopters. In addition, we have piloted the workflow with our English dubbing partners.

These efforts have proven that Timed Text Authoring Lineage fills a crucial gap and benefits the entire localization ecosystem, from individual transcribers and script authors, dubbing and subtitling service providers, to technology developers and content creators. We are confident that enabling tools to exchange scripts seamlessly will remove operational headaches and make additional time and effort available for the art of transcribing, translation and adaptation of subtitles and dubs.

Finally, TTAL is an evolving specification. As the adoption of TTAL continues, we expect to learn more and improve the specifications. We are committed to continued collaboration with our localization partners and tool developers to mature this further. If you are interested in incorporating TTAL in the tools you are developing, please reach out to us at [email protected] to learn more about this exciting new specification and explore how you can use TTAL in your workflows. Please check out this video to learn how TTAL exports work in VoiceQ, one of the first prompting tools to incorporate TTAL.


Introducing Netflix Timed Text Authoring Lineage was originally published in Netflix TechBlog on Medium, where people are continuing the conversation by highlighting and responding to this story.

How Netflix uses eBPF flow logs at scale for network insight

Post Syndicated from Netflix Technology Blog original https://netflixtechblog.com/how-netflix-uses-ebpf-flow-logs-at-scale-for-network-insight-e3ea997dca96

By Alok Tiagi, Hariharan Ananthakrishnan, Ivan Porto Carrero and Keerti Lakshminarayan

Netflix has developed a network observability sidecar called Flow Exporter that uses eBPF tracepoints to capture TCP flows at near real time. At much less than 1% of CPU and memory on the instance, this highly performant sidecar provides flow data at scale for network insight.

Challenges

The cloud network infrastructure that Netflix utilizes today consists of AWS services such as VPC, DirectConnect, VPC Peering, Transit Gateways, NAT Gateways, etc and Netflix owned devices. Netflix software infrastructure is a large distributed ecosystem that consists of specialized functional tiers that are operated on the AWS and Netflix owned services. While we strive to keep the ecosystem simple, the inherent nature of leveraging a variety of technologies will lead us to challenges such as:

  • App Dependencies and Data Flow Mappings: With the number of micro services growing by the day without understanding and having visibility into an application’s dependencies and data flows, it is difficult for both service owners and centralized teams to identify systemic issues.
  • Pathway Validation: Netflix velocity of change within the production streaming and studio environment can result in the inability of services to communicate with other resources.
  • Service Segmentation: The ease of the cloud deployments has led to the organic growth of multiple AWS accounts, deployment practices, interconnection practices, etc. Without having network visibility, it’s difficult to improve our reliability, security and capacity posture.
  • Network Availability: The expected continued growth of our ecosystem makes it difficult to understand our network bottlenecks and potential limits we may be reaching.

Cloud Network Insight is a suite of solutions that provides both operational and analytical insight into the cloud network infrastructure to address the identified problems. By collecting, accessing and analyzing network data from a variety of sources like VPC Flow Logs, ELB Access Logs, eBPF flow logs on the instances, etc, we can provide network insight to users and central teams through multiple data visualization techniques like Lumen, Atlas, etc.

Flow Exporter

The Flow Exporter is a sidecar that uses eBPF tracepoints to capture TCP flows at near real time on instances that power the Netflix microservices architecture.

What is BPF?

Berkeley Packet Filter (BPF) is an in-kernel execution engine that processes a virtual instruction set, and has been extended as eBPF for providing a safe way to extend kernel functionality. In some ways, eBPF does to the kernel what JavaScript does to websites: it allows all sorts of new applications to be created.

An eBPF flow log record represents one or more network flows that contain TCP/IP statistics that occur within a variable aggregation interval.

The sidecar has been implemented by leveraging the highly performant eBPF along with carefully chosen transport protocols to consume less than 1% of CPU and memory on any instance in our fleet. The choice of transport protocols like GRPC, HTTPS & UDP is runtime dependent on characteristics of the instance placement.

The runtime behavior of the Flow Exporter can be dynamically managed by configuration changes via Fast Properties. The Flow Exporter also publishes various operational metrics to Atlas. These metrics are visualized using Lumen, a self-service dashboarding infrastructure.

So how do we ingest and enrich these flows at scale ?

Flow Collector is a regional service that ingests and enriches flows. IP addresses within the cloud can move from one EC2 instance or Titus container to another over time. We use Sonar to attribute an IP address to a specific application at a particular time. Sonar is an IPv6 and IPv4 address identity tracking service.

Flow Collector consumes two data streams, the IP address change events from Sonar via Kafka and eBPF flow log data from the Flow Exporter sidecars. It performs real time attribution of flow data with application metadata from Sonar. The attributed flows are pushed to Keystone that routes them to the Hive and Druid datastores.

The attributed flow data drives various use cases within Netflix like network monitoring and network usage forecasting available via Lumen dashboards and machine learning based network segmentation. The data is also used by security and other partner teams for insight and incident analysis.

Summary

Providing network insight into the cloud network infrastructure using eBPF flow logs at scale is made possible with eBPF and a highly scalable and efficient flow collection pipeline. After several iterations of the architecture and some tuning, the solution has proven to be able to scale.

We are currently ingesting and enriching billions of eBPF flow logs per hour and providing visibility into our cloud ecosystem. The enriched data allows us to analyze networks across a variety of dimensions (e.g. availability, performance, and security), to ensure applications can effectively deliver their data payload across a globally dispersed cloud-based ecosystem.

Special Thanks To

Brendan Gregg


How Netflix uses eBPF flow logs at scale for network insight was originally published in Netflix TechBlog on Medium, where people are continuing the conversation by highlighting and responding to this story.

Data Engineers of Netflix — Interview with Dhevi Rajendran

Post Syndicated from Netflix Technology Blog original https://netflixtechblog.com/data-engineers-of-netflix-interview-with-dhevi-rajendran-a9ab7c7b36e5

Data Engineers of Netflix — Interview with Dhevi Rajendran

Dhevi Rajendran

This post is part of our “Data Engineers of Netflix” interview series, where our very own data engineers talk about their journeys to Data Engineering @ Netflix.

Dhevi Rajendran is a Data Engineer on the Growth Data Science and Engineering team. Dhevi joined Netflix in July 2020 and is one of many Data Engineers who have onboarded remotely during the pandemic. In this post, Dhevi talks about her passion for data engineering and taking on a new role during the pandemic.

Before Netflix, Dhevi was a software engineer at Two Sigma, where she was most recently on a data engineering team responsible for bringing in datasets from a variety of different sources for research and trading purposes. In her free time, she enjoys drawing, doing puzzles, reading, writing, traveling, cooking, and learning new things.

Her favorite TV shows: Atlanta, Barry, Better Call Saul, Breaking Bad, Dark, Fargo, Succession, The Killing

Her favorite movies: Das Leben der Anderen, Good Will Hunting, Intouchables, Mother, Spirited Away, The Dark Knight, The Truman Show, Up

Dhevi, so what got you into data engineering?

While my background has mostly been in backend software engineering, I was most recently doing backend work in the data space prior to Netflix. One great thing about working with data is the impact you can create as an engineer.

At Netflix, the work that data engineers do to produce data in a robust, scalable way is incredibly important to provide the best experience to our members as they interact with our service.

Beyond the really interesting technical challenges that come with working with big data, there are lots of opportunities to think about higher-level domain challenges as a data engineer. In college, I had done human-computer interaction research on subtitles for the Deaf and hard-of-hearing as well as computational genomics research on Alzheimer’s disease. I’ve always enjoyed learning about new areas and combining this knowledge with my technical skills to solve real-world problems.

What drew you to Netflix?

Netflix’s mission and its culture primarily drew me to Netflix. I liked the idea of being a part of a company that brings joy to so many members around the world with an incredibly powerful platform for their stories to be heard. The blend of creativity and a strong engineering culture at Netflix really appealed to me.

The culture was also something that piqued my interest. I was pretty skeptical of Netflix’s culture memo at first. Many companies have lofty ideals that don’t necessarily translate into the reality of the company culture, so I was surprised to see how consistently the culture memo aligns with the actual culture at the company. I’ve found the culture of freedom and responsibility empowering.

Rather than the typical top-down approach many companies use, Netflix trusts each person to make the right decisions for the company by using their deep knowledge of the problems they’re solving along with the context they gather from their leaders and stakeholders.

This means a lot less red tape, a lot less friction, and a lot more freedom for everyone at the company to do what’s best for the business. I also really appreciate the amount of visibility and input we get into broader strategic decisions that the company makes.

Finally, I was also really excited about joining the Growth Data Engineering team! My team is responsible for building data products relating to how we connect with our new members around the world, which is high-impact and has far-reaching global significance. I love that I get to help Netflix connect with new members around the world and help shape the first impression we make on them.

What is your favorite project or a project that you’re particularly proud of?

I have been primarily involved in the payments space. Not a project per se, but one of the things I’ve enjoyed being involved in is the cross-functional meetings with peers and stakeholders who are working in the payments space. These meetings include product managers, designers, consumer insights researchers, software engineers, data scientists, and people in a wide variety of other roles.

I love that I get to work cross-functionally with such a diverse group of people looking at the same set of problems from a variety of unique perspectives.

In addition to my day-to-day technical work, these meetings have provided me with the opportunity to be involved in the high-level product, design, and strategic discussions, which I value. Through these cross-functional efforts, I’ve also really gotten to learn and appreciate the nuances of payments. From using credit cards (which are fairly common in the US but not as widely adopted outside the US) to physically paying in person, members in different countries prefer to pay for our subscription in a wide variety of ways. It’s incredible to see the thoughtful and deeply member-driven approach we use to think about something as seemingly routine, straightforward, and often taken for granted as payments.

What was it like taking on a new role during the pandemic?

First off, I feel very lucky to have found a new role in this very difficult period. With the amount of change and uncertainty, the past year brought, it somehow felt both fitting and imprudent to voluntarily add a career change to the mix. The prospect was daunting at first. I knew there would be a bunch for me to learn coming into Netflix, considering that I hadn’t worked with the technologies my team uses (primarily Scala and Spark). Looking back now, I’m incredibly grateful for the opportunity and glad that I took it. I’ve already learned so much in the past six months and am excited about how much more I can learn and the impact I can make going forward.

Onboarding remotely has been a unique experience as well. Building relationships and gathering broader context are more difficult right now. I’ve found that I’ve learned to be more proactive and actively seek out opportunities to get to know people and the business, whether through setting up coffee chats, reading memos, or attending meetings covering topics I want to learn more about. I still haven’t met anyone I work with in person, but my teammates, my manager, and people across the company have been really helpful throughout the onboarding process.

It’s been incredible to see how gracious people are with their time and knowledge. The amount of empathy and understanding people have shown to each other, including to those who are new to the company, has made taking the leap and joining Netflix a positive experience.

Learning more

Interested in learning more about data roles at Netflix? You’re in the right place! Keep an eye out for our open roles in Data Science and Engineering here. Our culture is key to our impact and growth: read about it here.


Data Engineers of Netflix — Interview with Dhevi Rajendran was originally published in Netflix TechBlog on Medium, where people are continuing the conversation by highlighting and responding to this story.

Data Engineers of Netflix — Interview with Samuel Setegne

Post Syndicated from Netflix Technology Blog original https://netflixtechblog.com/data-engineers-of-netflix-interview-with-samuel-setegne-f3027f58c2e2

Data Engineers of Netflix — Interview with Samuel Setegne

Samuel Setegne

This post is part of our “Data Engineers of Netflix” interview series, where our very own data engineers talk about their journeys to Data Engineering @ Netflix.

Samuel Setegne is a Senior Software Engineer on the Core Data Science and Engineering team. Samuel and his team build tools and frameworks that support data engineering teams across Netflix. In this post, Samuel talks about his journey from being a clinical researcher to supporting data engineering teams.

Samuel comes from West Philadelphia, and he received his Master’s in Biotechnology from Temple University. Before Netflix, Samuel worked at Travelers Insurance in the Data Science & Engineering space, implementing real-time machine learning models to predict severity and complexity at the onset of property claims.

His favorite TV shows: Bojack Horseman, Marco Polo, and The Witcher

His favorite movies: Scarface, I Am Legend and The Old Guard

Sam, what drew you to data engineering?

Early in my career, I was headed full speed towards life as a clinical researcher. Many healthcare practitioners had strong hunches and wild theories that were exciting to test against an empirical study. I personally loved looking at raw data and using it to understand patterns in the world through technology. However, most challenges that came with my role were domain-related but not as technically demanding. For example — clinical data was often small enough to fit into memory on an average computer and only in rare cases would its computation require any technical ingenuity or massive computing power. There was not enough scope to explore the distributed and large-scale computing challenges that usually come with big data processing. Furthermore, engineering velocity was often sacrificed owing to rigid processes.

Moving into pure Data engineering not only offered me the technical challenges I’ve always craved for but also the opportunity to connect the dots through data which was the best of both worlds.

What is your favorite project or a project you’re particularly proud of?

The very first project I had the opportunity to work on as a Netflix contractor was migrating all of Data Science and Engineering’s Python 2 code to Python 3. This was without a doubt, my favorite project that also opened the door for me to join the organization as a full-time employee. It was thrilling to analyze code from various cross-functional teams and learn different coding patterns and styles.

This kind of exposure opened up opportunities for me to engage with various data engineering teams and advocate for python best practices that helped me drive greater impact at Netflix.

What drew you to Netflix?

What initially caught my attention about a chance to work at Netflix was the variety and quality of content. My family and friends were always ecstatic about having lively and raucous conversations about Netflix shows or movies they recently watched like Marco Polo and Tiger King.

Although other great companies play a role in our daily lives, many of them serve as a kind of utility, whereas Netflix is meant to make us live, laugh, and love by enabling us to experience new voices, cultures, and perspectives.

After I read Netflix’s culture memo, I was completely sold. It precisely described what I always knew was missing in places I’ve worked before. I found the mantra of “people over process” extremely refreshing and eventually learned that it unlocked a bold and creative part of me in my technical designs. For instance, if I feel that a design of an application or a pipeline would benefit from new technology or architecture, I have the freedom to explore and innovate without excessive red tape. Typically in large corporations, you’re tied to strict and redundant processes, causing a lot of fatigue for engineers. When I landed at Netflix, it was a breath of fresh air to learn that we lean into freedom and responsibility and allow engineers to push the boundaries.

Sam, how do you approach building tools/frameworks that can be used across data engineering teams?

My team provides generalized solutions for common and repetitive data engineering tasks. This helps provide “paved path” solutions for data engineering teams and reduces the burden of re-inventing the wheel. When you have many specialized teams composed of highly skilled engineers, the last thing you want for a data engineer is to spend too much time solving small problems that are usually buried inside of the big, broad, and impactful problems. When we extrapolate that to every engineer on every Data Science & Engineering team, it easily adds up and is something worth optimizing.

Any time you have a data engineer spending cycles working on tasks where the data engineering part of their brain is turned off, that’s an opportunity where better tooling can help.

For example, many data engineering teams have to orchestrate notification campaigns when they make changes to critical tables that have downstream dependencies. This is achievable by a Data Engineer but it can be very time-consuming, especially having to track the migration of these downstream users over to your new table or table schema to ensure it’s safe to finalize your changes. This problem was tackled by one of my highly skilled team members who built a centralized migration service that lets Data Engineers easily start “migration campaigns” that can automatically identify downstream users and provide notification and status-tracking capabilities by leveraging Jira. The aim is to enable Data Engineers to quickly fire up one of these campaigns and keep an eye out for its completion while using that extra time to focus on other tasks.

By investing in the right tooling to streamline redundant (yet necessary) tasks, we can drive higher data engineering productivity and efficiency, while accelerating innovation for Netflix.

Learning more

Interested in learning more about data roles at Netflix? You’re in the right place! Keep an eye out for our open roles in Data Science and Engineering by visiting our jobs site here. Our culture is key to our impact and growth: read about it here. Check out our chat with Dhevi Rajendran to know more about starting a new role as a Data Engineer during the pandemic here.


Data Engineers of Netflix — Interview with Samuel Setegne was originally published in Netflix TechBlog on Medium, where people are continuing the conversation by highlighting and responding to this story.

My (Seemingly) Random Walk to Netflix

Post Syndicated from Netflix Technology Blog original https://netflixtechblog.com/my-seemingly-random-walk-to-netflix-293d952953fa

Part of our series on who works in Analytics at Netflix — and what the role entails

By Sean Barnes, Studio Production Data Science & Engineering

I am going to tell you a story about a person that works for Netflix. That person grew up dreaming of working in the entertainment industry. They attended the University of Southern California, double majored in data science and television & film production, and graduated summa cum laude. Upon graduation, they received an offer from Netflix to become an analytics engineer, and pursue their lifelong dream of orchestrating the beautiful synergy of analytics and entertainment. Pretty straightforward, right?!

Such a linear trajectory would make for a compelling candidate, but in reality, many of us encounter a few twists and turns along the way. I am here to tell you that these twists and turns are OK, and in many cases, they make you better off in the long run. Whether they worked at a manufacturer for very large industrial ventilation systems, or in finance, healthcare, or elsewhere in tech (big or small), most people on my team have unique paths to their current positions at Netflix. I am going to tell you my story, but I will also tell you about how bringing together people with diverse backgrounds can have unexpected benefits.

When I was growing up, I developed a strong interest in the space program. I went to space camp (nerd alert!), loved space movies (still do!), loved all things astronomy (still do!), and even recall watching a launch or two at school (yes, on those roll-out TV carts). Like any rational person, I set out on a course to pursue a career that would either put me in space or help to put others up there. I decided to attend the Georgia Institute of Technology (Go Jackets!!) and to major in aerospace engineering. I would eventually enroll in the combined BS/MS program, committing to aerospace long-term and to participating in undergraduate and graduate research. In parallel, I also began working as an intern for the U.S. Federal Government as an engineering analyst, which eventually converted into a full-time position. Along the way, I discovered three things that would have a significant impact on my future trajectory:

  1. No lab for me: I did not like being in a lab, and I did not like the idea of spending a ton of time trying to improve the efficiency of some engineering part/system.
  2. Searching for (and not finding) a specialty: There was not an aerospace engineering discipline that I was really interested in, and trust me, I really tried because I didn’t want to deviate from my linear career trajectory. Structures, dynamics, control systems, fluids, design…pass, pass, pass, pass, and pass!
  3. Programming joy: I discovered an aptitude and joy for programming, and in particular, I really liked developing simulation models that could provide meaningful insights and support decision-making without actually building anything or conducting a real-life experiment.

Given these signals, I made the decision to pivot on my initial plan to work for NASA and designed a new plan more in line with my growing interests. That plan consisted of modifying my MS curriculum to support my newly found enthusiasm for simulation modeling, and transitioning to the Applied Mathematics and Scientific Computation doctoral program at the University of Maryland, College Park. This program was perfect for my interests, and allowed me to develop the interdisciplinary mathematical and computation skills that I have been using ever since. I connected with two advisors who were beginning to explore use cases for operations research in healthcare, which was the perfect opportunity to put my interdisciplinary training to work on meaningful real-world applications. I wrote my dissertation on simulation modeling of infectious disease transmission in healthcare facilities and community populations.

BOOM, I finally figured out what I was supposed to be doing. End of story, right?!

Almost! Hang with me just a smidge longer. After defending my dissertation, I left my position with the U.S. Federal Government to become a tenure-track faculty in the Robert H. Smith School of Business at the University of Maryland, College Park. Yep, I stayed close to home, and worked there for 7 years. I grew a lot during this experience, and really enjoyed working with students and research collaborators. This is also the key period when most of my data science growth occurred, as I was developing my healthcare analytics research program and teaching analytics courses to MS and undergraduate students. Throughout this process, I developed skills in Python programming, data visualization, statistical analysis, machine learning, and optimization, both by doing and by teaching. However, in 2019, I explored several data science opportunities in the tech industry, and I was completely won over by the opportunity to join the Studio Production Data Science & Engineering team at Netflix.

There is a mathematical concept called a random walk, which is essentially a path that is generated via a sequence of (seemingly) random steps. Those steps can be generated in any number of ways (e.g., by flipping a coin, observing changes in the stock market, or using a computer-generated sequence of random numbers), and there are numerous ways to adapt this concept to different applications (e.g., computer science, physics, finance, economics, and more). My (seemingly) random walk to Netflix looks a little something like this:

Acknowledgment to Ritchie King for graphic design

Why is my walk only seemingly random? These steps may appear to be random, but what I now realize is that there are some common themes in my experience that align well with core components of Netflix culture. For instance, I am passionate about using data and models to inform decision-making, whether the application is in aerospace, healthcare, or entertainment. I really enjoy building relationships and collaborating with others. I also enjoy bringing analytics and modeling into new spaces for which these practices are relatively new, such as in healthcare and entertainment. Lastly, I’m a learner and an educator, so I love learning new things and helping others learn as well.

The next observation is also a newly gained perspective. I have recently been reading the book Algorithms to Live By, written by Brian Christian and Tom Griffiths. In the second chapter of the book, the authors describe how the algorithmic tradeoff between exploration and exploitation plays out in real life. Exploration means to seek out new options so that you can learn more about the possibilities, whereas exploitation means to focus on the best option(s) that you have discovered thus far. They provide examples of this tradeoff within the context of how one evaluates which restaurants to visit or which candidate to hire. A lot of my experiences before coming to Netflix were part of my exploration phase, which I now realize is totally OK. I believe this exploration is what is needed to find what truly brings joy, and also eliminate things that do not. And now, I have entered the exploitation phase of my career, where I am fully committed to bringing data science into interdisciplinary spaces.

OK, I know, it’s time to wrap this up.

Let me conclude by sharing a quick story about the unexpected benefits of hiring an infectious disease modeler to help accelerate the use of analytics in studio production. According to the U.S. Centers for Disease Control & Prevention, the first known case of COVID-19 was identified in December 2019, which was less than 6 months after my first day at Netflix. By March 2020 — less than 9 months into my tenure — cases of the virus were prevalent across the U.S. and the nation was beginning to shut down.

At studios across Hollywood, production was halted while executives and frontline workers alike scrambled to learn what they could about the virus and the risks associated with restarting production. Given my background, I emailed the vice president of my group (who hired me), and offered to help in any way that I could. He forwarded my email directly to our CFO [1], which initiated a series of events that included the establishment of a medical advisory board [2], development of a simulation model and risk-scoring framework to help support decisions regarding our safe return to production [3], close collaboration with a truly amazing set of individuals and teams across the company, and even a feature article in The Hollywood Reporter. Most of this work continues to this day, as we hopefully approach better times ahead. I never could have imagined such a sequence of events when I first arrived in Los Angeles.

So for those of you out there who feel like you’re on a (seemingly) random walk…YOU ARE NOT ALONE! Many of us have to do the exploration before we find something that we’re willing to exploit over the long-term, and that process does not always follow the linear trajectory that we imagine when we are taking the first steps away from our origins. Try to find the common themes and skills that you have developed across your diverse experiences, and craft that story for potential employers.

And to the potential employers out there, TAKE SOME RISKS! Think more deeply about what the ‘non-traditional’ candidate may bring to your organization. You never know, some circumstances may arise for which those (seemingly) less-relevant skills and experiences may become more useful than you imagined. By doing so, you’ll be facilitating exploration as an organization, and learning about how to build teams that are truly innovative. So together, employers and employees alike, let’s take our (seemingly) random walks, and explore the possibilities until we find those pockets in space where we can exploit the opportunities and accomplish our greatest goals.

Me (several years ago)

Footnotes

  1. Which, by the way, is a very Netflix thing to do
  2. Featuring one of my long-time infectious disease research collaborators and mentors
  3. Embarrassingly named the Barnes Model and the Barnes Scale, respectively, by one of my stunning colleagues

If this post resonates with you and you’d like to explore opportunities with Netflix, check out our analytics site, search open roles, and learn about our culture. You can also find more stories like this here.


My (Seemingly) Random Walk to Netflix was originally published in Netflix TechBlog on Medium, where people are continuing the conversation by highlighting and responding to this story.

Achieving observability in async workflows

Post Syndicated from Netflix Technology Blog original https://netflixtechblog.com/achieving-observability-in-async-workflows-cd89b923c784

Written by Colby Callahan, Megha Manohara, and Mike Azar.

Managing and operating asynchronous workflows can be difficult without the proper tools and architecture that puts observability, debugging, and tracing at the forefront.

Imagine getting paged outside normal work hours — users are having trouble with the application you’re responsible for, and you start diving into logs. However, they are scattered across multiple systems, and there isn’t an easy way to tie related messages together. Once you finally find useful identifiers, you may begin writing SQL queries against your production database to find out what went wrong. You’re joining tables, resolving status types, cross-referencing data manually with other systems, and by the end of it all you ask yourself why?

An upset on-call

This was the experience for us as the backend team on Prodicle Distribution, which is one of the many services offered in the suite of content production-facing applications called Prodicle.

Prodicle is one of the many applications that is at the exciting intersection of connecting the world of content productions to Netflix Studio Engineering. It enables a Production Office Coordinator to keep a Production’s cast, crew, and vendors organized and up to date with the latest information throughout the course of a title’s filming. (e.g. Netflix original series such as La Casa De Papel), as well as with Netflix Studio.

Users of Prodicle: Production Office Coordinator on their job

As the adoption of Prodicle grew over time, Productions asked for more features, which led to the system quickly evolving in multiple programming languages under different teams. When our team took ownership of Prodicle Distribution, we decided to revamp the service and expand its implementation to multiple UI clients built for web, Android and iOS.

Prodicle Distribution

Prodicle Distribution allows a production office coordinator to send secure, watermarked documents, such as scripts, to crew members as attachments or links, and track delivery. One distribution job might result in several thousand watermarked documents and links being created. If a job has 10 files and 20 recipients, then we have 10 x 20 = 200 unique watermarked documents and (optionally) links associated with them depending on the type of the Distribution job. The recipients of watermarked documents are able to access these documents and links in their email as well as in the Prodicle mobile application.

Prodicle Distribution

Our service is required to be elastic and handle bursty traffic. It also needs to handle third-party integration with Google Drive, making copies of PDFs with watermarks specific to each recipient, adding password protection, creating revocable links, generating thumbnails, and sending emails and push notifications. We are expected to process 1,000 watermarks for a single distribution in a minute, with non-linear latency growth as the number of watermarks increases. The goal is to process these documents as fast as possible and reliably deliver them to recipients while offering strong observability to both our users and internal teams.

Prodicle Distribution Requirements

Asynchronous workflow

Previously, the Distribution feature of Prodicle was treated as its own unique application. In late 2019, our team started integrating it with the rest of the ecosystem by writing a thin Java Domain graph service (DGS) to wrap the asynchronous watermarking functionality that was then in Ruby on Rails. The watermarking functionality, at the start, was a simple offering with various Google Drive integrations for storage and links. Our team was responsible for Google integrations, watermarking, bursty traffic management, and on-call support for this application. We had to traverse multiple codebases, and observability systems to debug errors and inefficiencies in the system. Things got hairy. New feature requests were adding to the maintenance burden for the team.

Initial offering of Prodicle Distribution backend

When we decided to migrate the asynchronous workflow to Java, we landed on these additional requirements: 1. We wanted a scalable service that was near real-time, 2. We wanted a workflow orchestrator with good observability for developers, and 3. We wanted to delegate the responsibility of watermarking and bursty traffic management for our asynchronous functions to appropriate teams.

Migration consideration for Prodicle Distribution’s asynchronous workflow

We evaluated what it would take to do this ourselves or rely on the offerings from our platform teams — Conductor and one of the new offerings Cosmos. Even though Cosmos was developed for asynchronous media processing, we worked with them to expand to generic file processing and tune their workflow platform for our near real-time use case. Early prototypes and load tests validated that the offering could meet our needs. We leaned into Cosmos because of the low variance in latency through the system, separation of concerns between the API, workflow, and the function systems, ease of load testing, customizable API layer and notifications, support for File I/O abstractions and elastic functions. Another benefit was their observability portal and its capabilities with search. We also migrated the ownership of watermarking to another internal team to focus on developing and supporting additional features.

Current architecture of Prodicle Distribution on Cosmos

With Cosmos, we are well-positioned to expand to future use cases like watermarking on images and videos. The Cosmos team is dedicated to improving features and functionality over the next year to make observations of our async workflows even better. It is great to have a team that will be improving the platform in the background as we continue our application development. We expect the performance and scaling to continue to get better without much effort on our part. We also expect other services to move some of their processing functionality into Cosmos, which makes integrations even easier because services can expose a function within the platform instead of GRPC or REST endpoints. The more services move to Cosmos, the bigger the value proposition becomes.

Deployed to Production for Productions

With productions returning to work in the midst of a global pandemic, the adoption of Prodicle Distribution has grown 10x, between June 2020 and April 2021. Starting January 2021 we did an incremental release of Prodicle Distribution on Cosmos and completed the migration in April 2021. We now support hundreds of productions, with tens of thousands of Distribution jobs, and millions of watermarks every month.

With our migration of Prodicle Distribution to Cosmos, we are able to use their observability portal called Nirvana to debug our workflow and bottlenecks.

Observing Prodicle Distribution on Cosmos in Nirvana

Now that we have a platform team dedicated to the management of our async infrastructure and watermarking, our team can better maintain and support the distribution of documents. Since our migration, the number of support tickets has decreased. It is now easier for the on-call engineer and the developers to find the associated logs and traces while visualizing the state of the asynchronous workflow and data in the whole system.

A stress-free on-call


Achieving observability in async workflows was originally published in Netflix TechBlog on Medium, where people are continuing the conversation by highlighting and responding to this story.

Netflix Drive

Post Syndicated from Netflix Technology Blog original https://netflixtechblog.com/netflix-drive-a607538c3055

A file and folder interface for Netflix Cloud Services

Written by Vikram Krishnamurthy, Kishore Kasi, Abhishek Kapatkar, Tejas Chopra, Prudhviraj Karumanchi, Kelsey Francis, Shailesh Birari

In this post, we are introducing Netflix Drive, a Cloud drive for media assets and providing a high level overview of some of its features and interfaces. We intend this to be a first post in a series of posts covering Netflix Drive. In the future posts, we will do an architectural deep dive into the several components of Netflix Drive.

Netflix, and particularly Studio applications (and Studio in the Cloud) produce petabytes of data backed by billions of media assets. Several artists and workflows that may be globally distributed, work on different projects, and each of these projects produce content that forms a part of the large corpus of assets.

Here is an example of globally distributed production where several artists and workflows work in conjunction to create and share assets for one or many projects.

Fig 1: Globally distributed production with artists working on different assets from different parts of the world

There are workflows in which these artists may want to view a subset of these assets from this large dataset, for example, pertaining to a specific project. These artists may want to create personal workspaces and work on generating intermediate assets. To support such use cases, access control at the user workspace and project workspace granularity is extremely important for presenting a globally consistent view of pertinent data to these artists.

Netflix Drive aims to solve this problem of exposing different namespaces and attaching appropriate access control to help build a scalable, performant, globally distributed platform for storing and retrieving pertinent assets.

Netflix Drive is envisioned to be a Cloud Drive for Studio and Media applications and lends itself to be a generic paved path solution for all content in Netflix.

It exposes a file/folder interface for applications to save their data and an API interface for control operations. Netflix Drive relies on a data store that will be the persistent storage layer for assets, and a metadata store which will provide a relevant mapping from the file system hierarchy to the data store entities. The major pieces, as shown in Fig. 2, are the file system interface, the API interface, and the metadata and data stores. We will delve into these in the following sections.

Fig 2: Netflix Drive components

File interface for Netflix Drive

Creative applications such as Nuke, Maya, Adobe Photoshop store and retrieve content using files and folders. Netflix Drive relies on FUSE (File System In User Space) to provide POSIX files and folders interface to such applications. A FUSE based POSIX interface provides feature customization elasticity, deployment configuration flexibility as well as a standard and seamless file/folder interface. A similar user space abstraction is available for Windows (WinFSP) and MacOS (MacFUSE)

The operations that originate from user, application and system actions on files and folders translate to a well defined set of function and system calls which are forwarded by the Linux Virtual File System Layer (or a pass-through/filter driver in Windows) to the FUSE layer in user space. The resulting metadata and data operations will be implemented by appropriate metadata and data adapters in Netflix Drive.

Fig 3: POSIX interface of Netflix Drive

The POSIX files and folders interface for Netflix Drive is designed as a layered system with the FUSE implementation hooks forming the top layer. This layer will provide entry points for all of the relevant VFS calls that will be implemented. Netflix Drive contains an abstraction layer below FUSE which allows different metadata and data stores to be plugged into the architecture by having their corresponding adapters implement the interface. We will discuss more about the layered architecture in the section below.

API Interface for Netflix Drive

Along with exposing a file interface which will be a hub of all abstractions, Netflix Drive also exposes API and Polled Task interfaces to allow applications and workflow tools to trigger control operations in Netflix Drive.

For example, applications can explicitly use REST endpoints to publish files stored in Netflix Drive to cloud, and later use a REST endpoint to retrieve a subset of the published files from cloud. The API interface can also be used to track the transfers of large files and allows other applications to be built on top of Netflix Drive.

Fig 4: Control interface of Netflix Drive

The Polled Task interface allows studio and media workflow orchestrators to post or dispatch tasks to Netflix Drive instances on disparate workstations or containers. This allows Netflix Drive to be bootstrapped with an empty namespace when the workstation comes up and dynamically project a specific set of assets relevant to the artists’ work sessions or workflow stages. Further these assets can be projected into a namespace of the artist’s or application’s choosing.

Alternatively, workstations/containers can be launched with the assets of interest prefetched at startup. These allow artists and applications to obtain a workstation which already contains relevant files and optionally add and delete asset trees during the work session. For example, artists perform transformative work on files, and use Netflix Drive to store/fetch intermediate results as well as the final copy which can be transformed back into a media asset.

Bootstrapping Netflix Drive

Given the two different modes in which applications can interact with Netflix Drive, now let us discuss how Netflix Drive is bootstrapped.

On startup, Netflix Drive expects a manifest that contains information about the data store, metadata store, and credentials (tied to a user login) to form an instance of namespace hierarchy. A Netflix Drive mount point may contain multiple Netflix Drive namespaces.

A dynamic instance allows Netflix Drive to show a user-selected and user-accessible subset of data from a large corpus of assets. A user instance allows it to act like a Cloud Drive, where users can work on content which is automatically synced in the background periodically to Cloud. On restart on a new machine, the same files and folders will be prefetched from the cloud. We will cover the different namespaces of Netflix Drive in more detail in a subsequent blog post.

Here is an example of a typical bootstrap manifest file.

This image shows a bootstrap manifest json which highlights how Netflix Drive can work with different metadata stores (such as Redis, CockroachDB), and data stores (such as Ceph, S3) and tie them together to provide persistence layer for assets
A sample manifest file.

The manifest is a persistent artifact which renders a user workstation its Netflix Drive personality. It survives instance failures and is able to recreate the same stateful interface on any newly deployed instance.

Metadata and Data Store Abstractions

In order to allow a variety of different metadata stores and data stores to be easily plugged into the architecture, Netflix Drive exposes abstract interfaces for both metadata and data stores. Here is a high level diagram explaining the different layers of abstractions in Netflix Drive

Fig 5: Layered architecture of Netflix Drive

Metadata Store Characteristics

Each file in Netflix Drive would have one or many corresponding metadata nodes, corresponding to different versions of the file. The file system hierarchy would be modeled as a tree in the metadata store where the root node is the top level folder for the application.

Each metadata node will contain several attributes, such as checksum of the file, location of the data, user permissions to access data, file metadata such as size, modification time, etc. A metadata node may also provide support for extended attributes which can be used to model ACLs, symbolic links, or other expressive file system constructs.

Metadata Store may also expose the concept of workspaces, where each user/application can have several workspaces, and can share workspaces with other users/applications. These are higher level constructs that are very useful to Studio applications.

Data Store Characteristics

Netflix Drive relies on a data store that allows streaming bytes into files/objects persisted on the storage media. The data store should expose APIs that allow Netflix Drive to perform I/O operations. The transfer mechanism for transport of bytes is a function of the data store.

In the first manifestation, Netflix Drive is using an object store (such as Amazon S3) as a data store. In order to expose file store-like properties, there were some changes needed in the object store. Each file can be stored as one or more objects. For Studio applications, file sizes may exceed the maximum object size for Cloud Storage, and so, the data store service should have the ability to store multiple parts of a file as separate objects. It is the responsibility of the data store service to tie these objects to a single file and inform the metadata store of the single unique Id for these several object parts. This Data store internally implements the chunking of file into several parts, encrypting of the content, and life cycle management of the data.

Multi-tiered architecture

Netflix Drive allows multiple data stores to be a part of the same installation via its bootstrap manifest.

Fig 6: Multiple data stores of Netflix Drive

Some studio applications such as encoding and transcoding have different I/O characteristics than a typical cloud drive.

Most of the data produced by these applications is ephemeral in nature, and is read often initially. The final encoded copy needs to be persisted and the ephemeral data can be deleted. To serve such applications, Netflix Drive can persist the ephemeral data in storage tiers which are closer to the application that allow lower read latencies and better economies for read request, since cloud storage reads incur an egress cost. Finally, once the encoded copy is prepared, this copy can be persisted by Netflix Drive to a persistent storage tier in the cloud. A single data store may also choose to archive some subset of content stored in cheaper alternatives.

Security

Studio applications require strict adherence to security models where only users or applications with specific permissions should be allowed to access specific assets. Security is one of the cornerstones of Netflix Drive design. Netflix Drive dynamic namespace design allows an artist or workflow to access only a small subset of the assets based on the workspace information and access control and is one of the benefits of using Netflix Drive in Studio workflows. Netflix Drive encapsulates the authentication and authorization models in its metadata store. These are translated into POSIX ACLs in Netflix Drive. In the future, Netflix Drive can allow more expressive ACLs by leveraging extended attributes associated with Metadata nodes corresponding to an asset.

Netflix Drive is currently being used by several Studio teams as the paved path solution for working with assets and is integrated with several media suite applications. As of today, Netflix Drive can be installed on CentOS, MacOS and Windows. In the future blog posts, we will cover implementation details, learnings, performance analysis of Netflix Drive, and some of the applications and workflows built on top of Netflix Drive.

If you are passionate about building Storage and Infrastructure solutions for Netflix Data Platform, we are always looking for talented engineers and managers. Please check out our job listings


Netflix Drive was originally published in Netflix TechBlog on Medium, where people are continuing the conversation by highlighting and responding to this story.

Scaling Revenue & Growth Tooling

Post Syndicated from Netflix Technology Blog original https://netflixtechblog.com/scaling-revenue-growth-tooling-87ff969d4241

Written by Nick Tomlin, Michael Possumato, and Rahul Pilani.

This post shares how the Revenue & Growth Tools (RGT) team approaches creating full-stack tools for the teams that are the financial backbone of Netflix. Our primary partners are the teams of Revenue and Growth Engineering (RGE): Growth, Membership, Billing, Payments, and Partner Subscription. Each of these engineering teams — and the operations teams they support — help Netflix acquire, sign up, and manage recurring payments for millions of members every month.

To provide a view of some of the unique challenges and opportunities of our domain, we’ll share some of the core strategies we’ve developed, some of the tools we’ve built as a result, and finally talk about our vision for the future of tooling on our team.

Focusing on impact

Like many teams at Netflix, we are full-cycle developers, responsible for everything from design to ongoing development. As we grow, we must be selective in the projects we take on, and careful about managing our portfolio of full-stack products and tools to scale with the needs of the engineering teams we support. To help us strike the right balance, we focus on the impact of a given feature to help drive our internal product strategy.

Identifying impact requires deep engagement with our users. When someone within our team or organization identifies a new opportunity, we work closely with our engineering colleagues to identify the benefit not only of that team but the surrounding engineering and operational teams. Sometimes the result of this may mean investing in a highly customized tool for maximum impact. Often, this process discovers shared needs that we use to craft new product experiences that deliver value for multiple teams.

Configuration management through Haze

One of the patterns we identified across multiple teams was the need for a stable process around configuration and metadata management. In the past, the approach was to develop singular tools to manage configuration for each backend system. We realized that we could have a much greater impact by focusing on an information-driven UI that could function as a standalone tool to manage any backend data.

Initially, we were targeting our internal rules engine for driving experiences across the Netflix platform as the only configuration backend. The more we talked with our cross-functional partners, the more we saw an opportunity for a generic product. This engagement led us to the Haze platform.

Haze consumes metadata via GraphQL and JSON descriptions to facilitate and orchestrate backend microservice api calls to manage configuration data. Teams can simply define their schemas and the Haze UI can be connected to their systems to act as a user-friendly interface to these APIs (for a deeper look, see this blog post).

By leveraging the DGS framework, and Hawkins we delivered a full-fledged product experience on top of a stable Netflix platform, with the flexibility to evolve for future needs. Collaborating with the engineers we support, and the central platform teams we relied on (like the Hendrix team), ensured that we weren’t problem-solving in a vacuum, and opened the door for more generic solutions that benefit the whole of Netflix and not just our organization.

Haze removes the need for teams to create custom systems to manage configuration and safely expose that configuration to our cross-functional partners. It cuts down on engineering effort, empowers teams, and enables the business to quickly respond to new opportunities and challenges.

Empowering the business through self-service

Scaling systems like signup or payments are essential, but it is only part of the product engineering picture. Engineers need to ensure that operations teams scale to meet the needs of the operations teams that maintain and refine the Netflix product. Things like managing configuration for our payment experiences, migrating data, and managing partner integrations. Initially, much of this can be handled through manual flows that involve spreadsheets, reminders, and emails. This works, but it means a drain on both engineers and business partners and a missed opportunity to empower the business to grow.

Unfortunately, building safe, user-friendly workflows is not a zero-cost solution. Engineering teams have to choose between building bespoke tooling to automate solutions or manually handling requests. Our team has been investigating different workflow solutions to help teams automate common business processes without having to invest in an entirely custom toolchain.

Self servicing workflows through RunScript

One way we are helping engineering teams bridge this gap is with RunScript. RunScript provides a way for engineering teams to write a Kotlin or Java class and get a secure self-service UI to allow engineers and operations users to self-service common workflows. This allows engineers to connect to existing processes, or build their own with a familiar toolchain. This means that business users have the power to access systems by relying on an engineering team.

The service itself is built on top of The DGS framework, Kotlin, and React. These technologies allowed us to rapidly prototype the product, respond to feedback from our cross-functional partners, and provide a solid platform for future growth.

We’ve already replaced some homegrown solutions that required users to individually bootstrap and configure scripts with a generic UI built from in-code definitions. Operational users have a consistent, easy way to interact with backends that don’t have to worry about maintaining a UI; engineers can focus on essential business logic and let the rest of the platform do the heavy lifting. The result is an auditable, repeatable process that saves time and effort for everyone.

What’s next?

Providing the building blocks for automation

We’ve been exploring how to provide a framework for teams to build self-service tools from existing microservices with projects like RunScript. We’d like to expand that scope to provide to allow teams to expose any business workflow as an easy to consume, pluggable unit. We hope this will be an impact multiplier that allows all teams to reap the same time-saving, business empowering benefits, without needing to invest in custom solutions.

By implementing a registry for these common tasks, we want to make it easy to discover and compose the building blocks of the RGE platform into new and powerful workflows.

Federating our domain

Two of the Netflix principles we value the most are “Freedom and Responsibility” and “Highly aligned, loosely coupled” and we want our tools to reflect those philosophies. That means that engineering teams should feel empowered to architect their systems as they see fit. On the flip side, that freedom can make it harder to compose distributed microservices into a meaningful whole. We are investing in a federated GraphQL API to help preserve freedom but drive alignment.

The federated infrastructure will help provide a unified interface across the teams we serve, as well as pave the way for allowing teams to own and expose their information in a consistent and accessible manner.

Bridging platform and product teams

Because we work with both platform teams and product teams, our team has a unique perspective on how tooling works at Netflix: we can build on or suggest platform technologies to our engineering partners, and bring their innovations and feedback to platform teams. This creates a virtuous cycle of feedback, alignment, and innovation where everyone benefits.

We’ve already seen some major wins with adopting things like the DGS framework, and we want to continue to further relationships with central teams to build unique experiences on top of centralized tools.

In the future, we want to take this even further where we act as a “Local Central Team” or LCT within RGE. We would coordinate our activities with other LCTs around Netflix and with central platform teams to share the great work that we are doing and hear about what other teams are building. The potential to engage with an even bigger audience to share and leverage some of the great products we are building together with our partners makes this space even more exciting.

Build great things together

We are just getting started on this journey to build impactful, full-stack experiences that help propel our business forward. The core to bringing these experiences to life is our direct collaboration with our colleagues, using the most impactful tools and technologies available. If this is something that excites you, we’d love for you to join us.


Scaling Revenue & Growth Tooling was originally published in Netflix TechBlog on Medium, where people are continuing the conversation by highlighting and responding to this story.

Production Media Management: Transforming Media Workflows by leveraging the Cloud

Post Syndicated from Netflix Technology Blog original https://netflixtechblog.com/production-media-management-transforming-media-workflows-by-leveraging-the-cloud-1174699e4a08

Written by Anton Margoline, Avinash Dathathri, Devang Shah and Murthy Parthasarathi. Credit to Netflix Studio’s Product, Design, Content Hub Engineering teams along with all of the supporting partner and platform teams.

In this post, we will share a behind-the-scenes look at how Netflix delivers technology and infrastructure to help production crews create and exchange media during production and post production stages. We’ll also cover how our Studio Engineering efforts are helping Netflix productions to spend less time on media logistics by utilizing our cloud based services.

Lights, Camera, Media! Productions take on media management

In a typical live action production, after media is offloaded from the camera and sound recorders on set, it is operated on as files on disk using various tools between departments, like Editorial, Sound and Music, Visual Effects (VFX), Picture Finishing and teams at Netflix. Increasingly, the teams are globally distributed, and each stage of the process generates many terabytes of data.

Media exchanges between different departments constitute a media workflow, and no two productions share the same workflow, known in the industry by the term ‘snowflake workflow’. The stories demand different technical approaches to production, which is why a media workflow for a multi-camera show with visual effects such as Stranger Things, has a different workflow to Formula 1: Drive to Survive with an extensive amount of footage.

Media workflows are always evolving and adapting; driven by changes in production technology (new cameras and formats), post production technology (tools used by Sound, Music, VFX, and Picture Finishing) and consumer technology (adoption of 4K, HDR, and Atmos). It would be impossible to describe all of the complexities and the history of the industry in a single post. For a more comprehensive overview, please refer to Scott Arundale and Tashi Trieu’s book, Modern Post: Workflows and Techniques for Digital Filmmakers.

Workflows are louder than words. Technology empowering Netflix productions today!

Now that we understand what media workflows are, let’s take a look at some of the workflows we’ve enabled.

Collect Camera Media (On-Set/Near-Set)

We enable camera and sound media imports via our partner API integrations or via Netflix media import UIs. Along with the files, metadata plays an important role in downstream workflows, so we make significant efforts to categorize all media into respective assets with the help of the metadata we collect from our partner API integrations as well as our internal video inspection services. Media Workflows:

  • Content Hub (Netflix UI) Import: Imports footage media, which is inspected and, with the help of the metadata, categorized into assets.
  • Partner API Import: We provide external APIs for our partners to exchange media files and metadata to and from the cloud. We have pilot integrations with media management tools including Colorfront’s Express Dailies, Light Iron and Fotokem’s Nextlab and we’re looking to extend this in the future.

Iterate on a Movie Timeline (Editorial)

We enable Editorial workflows to drive media interchange between Editorial and VFX, Sound & Music, Picture Finishing facility and Netflix. Most of the workflows start with an Editor providing an edit decision list timeline with a playable reference (.mov file). Depending on the type of the workflow, this timeline can be shared as is, or transformed into alternative formats required by the tools used in other areas of production. Media Workflows:

  • VFX Plate Generation & Delivery: Editorial turns over an edit decision list timeline which is processed into media references and either matched to already uploaded VFX Plates (ACES EXR images + other files) or, if the plates are not available, they are transcoded from the raw camera media. At the end of the workflow, the VFX facility receives VFX Plates as a downloadable folder.
  • Conform Pull: Editorial shares an edit decision list timeline, which upon processing is turned over to the Picture Finishing facility as a downloadable folder with original camera media trimmed to the parts used in the timeline.
  • Studio Archival (Cut Turnover): As production iterates on the timeline, versions of the timeline (cuts) are shared (turned over) with other areas of production so they can begin their work. Major versions are known as “Locked Cuts”. Utilizing this workflow, an Editor uploads the aforementioned timeline with its related files. The media is transcoded onto different formats and, as required and permitted, shared with other departments downstream, such as dubbing, marketing or PR.

Produce Visual Effects (VFX)

We enable VFX via several media workflows, starting from the initial request from an Editorial department to facilitate the visual effects work, iterating on the produced VFX shots using Media Review workflows, delivering back the finished product by VFX Shot Delivery and, at the very end, archiving everything for safekeeping. Media Workflows:

  • Media Review: VFX Shot delivery and review workflow, used by Editorial, show-side VFX and Netflix. Both Netflix and our productions frequently rely on 3rd party software to manage their VFX assets, which is why this workflow leverages integrations to sync media and metadata.
  • VFX Shot Delivery: VFX Shots are delivered from VFX to Picture Finishing facility.
  • Studio Archival (most VFX media): Shots and other media used to produce visual effects are delivered and archived for safekeeping.

Picture Finishing (Picture Finishing Facility)

We enable Picture Finishing facilities to get all of the ingredients needed to do the conform, where all media used in the timeline is verified and made available for color grading. If the facility also helps with media management on a given production, we have workflows where the Picture Finishing facility would manage VFX Plate delivery to the VFX facility. Media workflows: VFX Plate Delivery: Provides means to procure VFX Plates (ACES EXR images + other files) used by VFX in the process of creating visual effects.

Sound, Music

We enable Editorial to share their versions of the timeline (cuts) in the form of playable timeline references (.mov files) with Sound/Music. We also enable Sound/Music to deliver their final products as Stems and Mixes so they can be used further into the production cycle, such as for mixing, dubbing and safekeeping. Media Workflows: Studio Archival and its variants.

Localization, Marketing/PR, Streaming (Netflix)

We enable our production partners to deliver media from many different aspects of production, some of which are mentioned in the areas above, with many more. In addition to safekeeping the media, Studio Archival media workflows empower media used during production for Marketing, PR and other workflows. Media Workflows: Studio Archival and its variants.

The magic is in the details. VFX Plate Generation & Delivery workflow

Lets dive deeper into VFX Plate Generation & Delivery media workflow to demonstrate the steps required within this media exchange. While describing the details we’ll use the opportunity to refer to how our technology infrastructure enables this workflow among many others.

The VFX Plate Generation & Delivery workflow is a process by which an Editor provides the necessary media to a Visual Effects team, with metadata and raw ingredients necessary to begin their work. This workflow is enabled by camera media workflows, which would have been done earlier to make the camera media and its metadata available.

The VFX Plate Generation & Delivery workflow is started by an Editorial team with an edit decision list timeline file (.edl, .xml) exported from a Non Linear Editing tool. This timeline file contains only the references to media with additional information about time, color, markers and more, but not any of the actual media files. In addition to the timeline, the Editor chooses whether they would want the resulting media to be rescaled to UHD and how many extra frames they would like to have added for each event referenced in the timeline.

After processing the timeline file, each individual media reference is extracted with relevant timecode, media reference, color decisions and markers. To support different editorial tools, each having its own edit decision list timeline format, our Video Encoding platform interprets the timeline into a standardized interchange format called OpenTimelineIO.

Media reference, color decisions and markers are linked with the original camera media and transcoded from raw camera formats onto ACES EXR. Most Visual Effects tools are not able to process raw camera files directly. Along with image media, color metadata is extracted from the timeline to generate Color Decision List files (.cdl, .xml) which are used to communicate color decisions made by an Editor. All of the media transformations and metadata are then persisted as VFX Plate assets.

The Editor then reviews VFX Plate Generation & Delivery details, with all of the timeline events clearly identified and any inconsistencies spotted, such as if raw camera media is not found or there are any challenges with transcoding media. If all looks good, an Editor is able to submit this workflow onto the final step where results are packaged and shared with the Visual Effects team.

To share results with Visual Effects artists, we’re transforming all of the VFX Plate assets and media created earlier and sharing with the recipients, who can either download the files via browser, or use our auto-downloader tools for additional convenience. Concluding this workflow is an email, sharing all the relevant information with the Editorial and VFX teams.

We’re leveraging the VFX Plate Generation & Delivery workflow (among others) on shows including the next installments of our amazing series like Money Heist, Selena and others. We’re excited to help even more productions this year, as we’re continuing to build support for more use cases and polish the experiences.

Walk, before you run. Scalable components powering Media Workflows

Let’s now zoom out and take a look at the foundation that supports the 20+ unique media workflows that we’ve enabled in the last two years, with more being added at an accelerating rate.

No single monolithic service would scale to support the various demands of this platform. Many teams at Netflix contribute to the success of Media Workflows Platform, by providing the foundations we rely on for many of the steps taken.

Media Workflows Platform (also known as “Content Hub”): a component that powers all of our media workflows. At a very high level it is composed of the Platform, UI and Partner APIs.

  • UI + GraphQL Services: facilitating various media workflows, one use case at a time, built with the help of the recently open sourced domain graph service implementation for the federated GraphQL environment.
  • Partner APIs: external partner APIs enabling integrations into Netflix media workflows.
  • Media Workflows Platform: a flexible platform that enables diverse, scalable, easy to customize production media workflows, built on the foundational tenets:

— Resource Management to associate files, assets and other workflows
 — 
Robust Execution Engine execution engine, powered by Conductor
 — 
State Machine defining user and system interaction
 — 
Reusable Steps enabling component reuse across different workflows

Media Inspection and Encoding: scalable media services that are able to handle various media types, including raw camera media. Use cases range from gathering metadata to transforming (change format) or trans-wrapping (trim media).

Universal Asset Management: all media with its metadata maintained in a common asset management system enabling a common framework for consuming media assets in a microservice environment.

Global Storage: global, fault tolerant storage solution that supports file-based workflows in the cloud.

Data Science Platform: all of the layers feed into the data science platform, enabling insights to help us iterate on improving our services using data-driven metrics.

Netflix Platform Tools: paved path services provided in building, deploying and orchestrating our services together.

Take me home. We ❤️ empowering Media Workflows, do you?

We’ve helped productions manage and exchange many petabytes of media which is only accelerating with more usage of the platform. Some of our recent workflows in Editorial are in pilot on a handful of productions, our VFX workflows helped dozens of shows, Media Review assisted hundreds of shows and, our Archival workflows are used on all of our shows. While we’ve innovated on many workflows, we’re continuing to add support for more workflows and are refining existing ones to be more helpful. Our media workflows platform is a robust, scalable and easy to customize solution that helps us create great content!

Thanks for getting this far! If you are just learning about how production media management works, we hope this sparks an interest in our problem space. If you are designing tools to empower media workflows, we hope that by sharing our challenges and approaches to solving them, we can all learn from each other. Realizing common challenges inspires more openness and the standardization we crave. We’re really excited to see the proliferation of open APIs and industry standards for media transformation and interchange such as OpenTimelineIO, OpenColorIO, ACES and more.

If you’re passionate about building production media workflows, or any of the foundational services, we’re always looking for talented engineers. Please check out our job listings for Studio Engineering, Production Media Engineering, Product Management, Content Engineering, Data Science Engineering and many more.


Production Media Management: Transforming Media Workflows by leveraging the Cloud was originally published in Netflix TechBlog on Medium, where people are continuing the conversation by highlighting and responding to this story.

A Day in the Life of an Experimentation and Causal Inference Scientist @ Netflix

Post Syndicated from Netflix Technology Blog original https://netflixtechblog.com/a-day-in-the-life-of-an-experimentation-and-causal-inference-scientist-netflix-388edfb77d21

Stephanie Lane, Wenjing Zheng, Mihir Tendulkar

Source credit: Netflix

Within the rapid expansion of data-related roles in the last decade, the title Data Scientist has emerged as an umbrella term for myriad skills and areas of business focus. What does this title mean within a given company, or even within a given industry? It can be hard to know from the outside. At Netflix, our data scientists span many areas of technical specialization, including experimentation, causal inference, machine learning, NLP, modeling, and optimization. Together with data analytics and data engineering, we comprise the larger, centralized Data Science and Engineering group.

Learning through data is in Netflix’s DNA. Our quasi-experimentation helps us constantly improve our streaming experience, giving our members fewer buffers and ever better video quality. We use A/B tests to introduce new product features, such as our daily Top 10 row that help our members discover their next favorite show. Our experimentation and causal inference focused data scientists help shape business decisions, product innovations, and engineering improvements across our service.

In this post, we discuss a day in the life of experimentation and causal inference data scientists at Netflix, interviewing some of our stunning colleagues along the way. We talked to scientists from areas like Payments & Partnerships, Content & Marketing Analytics Research, Content Valuation, Customer Service, Product Innovation, and Studio Production. You’ll read about their backgrounds, what best prepared them for their current role at Netflix, what they do in their day-to-day, and how Netflix contributes to their growth in their data science journey.

Who we are

One of the best parts of being a data scientist at Netflix is that there’s no one type of data scientist! We come from many academic backgrounds, including economics, radiotherapy, neuroscience, applied mathematics, political science, and biostatistics. We worked in different industries before joining Netflix, including tech, entertainment, retail, science policy, and research. These diverse and complementary backgrounds enrich the perspectives and technical toolkits that each of us brings to a new business question.

We’ll turn things over to introduce you to a few of our data scientists, and hear how they got here.

What brought you to the field of data science? Did you always know you wanted to do data science?

Roxy Du (Product Innovation)

[Roxy D.] A combination of interest, passion, and luck! While working on my PhD in political science, I realized my curiosity was always more piqued by methodological coursework, which led me to take as many stats/data science courses as I could. Later I enrolled in a data science program focused on helping academics transition to industry roles.

Reza Badri (Content Valuation)

[Reza B.] A passion for making informed decisions based on data. Working on my PhD, I was using optimization techniques to design radiotherapy fractionation schemes to improve the results of clinical practices. I wanted to learn how to better extract interesting insight from data, which led me to take several courses in statistics and machine learning. After my PhD, I started working as a data scientist at Target, where I built mathematical models to improve real-time pricing recommendation and ad serving engines.

Gwyn Bleikamp (Payments)

[Gwyn B.]: I’ve always loved math and statistics, so after college, I planned to become a statistician. I started working at a local payment processing company after graduation, where I built survival models to calculate lifetime value and experimented with them on our brand new big data stack. I was doing data science without realizing it.

What best prepared you for your current role at Netflix? Are there any experiences that particularly helped you bring a unique voice/point of view to Netflix?

David Cameron (Studio Production)

[David C.] I learned a lot about sizing up the potential impact of an opportunity (using back of the envelope math), while working as a management consultant after undergrad. This has helped me prioritize my work so that I’m spending most of my time on high-impact projects.

Aliki Mavromoustaki (Content & Marketing)

[Aliki M.] My academic credentials definitely helped on the technical side. Having a background in research also helps with critical thinking and being comfortable with ambiguity. Personally I value my teaching experiences the most, as they allowed me to improve the way I approach and break down problems effectively.

What we do at Netflix

But what does a day in the life of an experimentation/causal inference data scientist at Netflix actually look like? We work in cross-functional environments, in close collaboration with business, product and creative decision makers, engineers, designers, and consumer insights researchers. Our work provides insights and informs key decisions that improve our product and create more joy for our members. To hear more, we’ll hand you back over to our stunning colleagues.

Tell us about your business area and the type of stakeholders you partner with on a regular basis. How do you, as a data scientist, fill in the pieces between product, engineering, and design?

[Roxy D.] I partner with product managers to run AB experiments that drive product innovation. I collaborate with product managers, designers, and engineers throughout the lifecycle of a test, including ideation, implementation, analysis, and decision-making. Recently, we introduced a simple change in kids profiles that helps kids more easily find their rewatched titles. The experiment was conceived based on what we’d heard from members in consumer research, and it was very gratifying to address an underserved member need.

[David C.] There are several different flavors of data scientist in the Artwork and Video team. My specialties are on the Statistics and Optimization side. A recent favorite project was to determine the optimal number of images to create for titles. This was a fun project for me, because it combined optimization, statistics, understanding of reinforcement learning bandit algorithms, as well as general business sense, and it has far-reaching implications to the business.

What are your responsibilities as the data scientist in these projects? What technical skills do you draw on most?

[Gwyn B.] Data scientists can take on any aspect of an experimentation project. Some responsibilities I routinely have are: designing tests, metrics development and defining what success looks like, building data pipelines and visualization tools for custom metrics, analyzing results, and communicating final recommendations with broad teams. Coding with statistical software and SQL are my most widely used technical skills.

[David C.] One of the most important responsibilities I have is doing the exploratory data analysis of the counterfactual data produced by our bandit algorithms. These analyses have helped our stakeholders identify major opportunities, bugs and tighten up engineering pipelines. One of the most common analyses that I do is a look-back analysis on the explore-data. This data helps us analyze natural experiments and understand which type of images better introduce our content to our members.

Wenjing Zheng (Partnerships)
Stephanie Lane (Partnerships)

[Stephanie L. & Wenjing Z.] As data scientists in Partnerships, we work closely with our business development, partner marketing, and partner engagement teams to create the best possible experience of Netflix on every device. Our analyses help inform ways to improve certain product features (e.g., a Netflix row on your Smart TV) and consumer offers (e.g., getting Netflix as part of a bundled package), to provide the best experiences and value for our customers. But randomized, controlled experiments are not always feasible. We draw on technical expertise in varied forms of causal inference — interrupted time series designs, inverse probability weighting, and causal machine learning — to identify promising natural experiments, design quasi-experiments, and deliver insights. Not only do we own all steps of the analysis and communicate findings within Netflix, we often participate in discussions with external partners on how best to improve the product. Here, we draw on strong business context and communication to be most effective in our roles.

What non-technical skills do you draw on most?

[Aliki M.] Being able to adapt my communication style to work well with both technical and non-technical audiences. Building strong relationships with partners and working effectively in a team.

[Gwyn B.] Written communication is among the topmost valuable non-technical assets. Netflix is a memo-based culture, which means we spend a lot of time reading and writing. This is a primary way we share results and recommendations as well as solicit feedback on project ideas. Data Scientists need to be able to translate statistical analyses, test results, and significance into recommendations that the team can understand and action on.

How is working at Netflix different from where you’ve worked before?

[Reza B.] The Netflix culture makes it possible for me to continuously grow both technically and personally. Here, I have the opportunity to take risks and work on problems that I find interesting and impactful. Netflix is a great place for curious researchers that want to be challenged everyday by working on interesting problems. The tooling here is amazing, which made it easy for me to make my models available at scale across the company.

Mihir Tendulkar (Payments)

[Mihir T.] Each company has their own spin on data scientist responsibilities. At my previous company, we owned everything end-to-end: data discovery, cleanup, ETL, analysis, and modeling. By contrast, Netflix puts data infrastructure and quality control under the purview of specialized platform teams, so that I can focus on supporting my product stakeholders and improving experimentation methodologies. My wish-list projects are becoming a reality here: studying experiment interaction effects, quantifying the time savings of Bayesian inference, and advocating for Mindhunter Season 3.

[Stephanie L.] In my last role, I worked at a research think tank in the D.C. area, where I focused on experimentation and causal inference in national defense and science policy. What sets Netflix apart (other than the domain shift!) is the context-rich culture and broad dissemination of information. New initiatives and strategy bets are captured in memos for anyone in the company to read and engage in discourse. This context-rich culture enables me to rapidly absorb new business context and ultimately be a better thought partner to my stakeholders.

Data scientists at Netflix wear many hats. We work closely with business and creative stakeholders at the ideation stage to identify opportunities, formulate research questions, define success, and design studies. We partner with engineers to implement and debug experiments. We own all aspects of the analysis of a study (with help from our stellar data engineering and experimentation platform teams) and broadly communicate the results of our work. In addition to company-wide memos, we often bring our analytics point of view to lively cross-functional debates on roll-out decisions and product strategy. These responsibilities call for technical skills in statistics and machine learning, and programming knowledge in statistical software (R or Python) and SQL. But to be truly effective in our work, we also rely on non-technical skills like communication and collaborating in an interdisciplinary team.

You’ve now heard how our data scientists got here and what drives them to be successful at Netflix. But the tools of data science, as well as the data needs of a company, are constantly evolving. Before we wrap up, we’ll hand things over to our panel one more time to hear how they plan to continue growing in their data science journey at Netflix.

How are you looking to develop as a data scientist in the near future, and how does Netflix help you on that path?

[Reza B.] As a researcher, I like to continue growing both technically and non-technically; to keep learning, being challenged and work on impactful problems. Netflix gives me the opportunity to work on a variety of interesting problems, learn cutting-edge skills and be impactful. I am passionate about improving decision making through data, and Netflix gives me that opportunity. Netflix culture helps me receive feedback on my non-technical and technical skills continuously, providing helpful context for me to grow and be a better scientist.

[Aliki M.] True to our Netflix values, I am very curious and want to continue to learn, strengthen and expand my skill set. Netflix exposes me to interesting questions that require critical thinking from design to execution. I am surrounded by passionate individuals who inspire me and help me be better through their constructive feedback. Finally, my manager is highly aligned with me regarding my professional goals and looks for opportunities that fit my interests and passions.

[Roxy D.] I look forward to continuously growing on both the technical and non-technical sides. Netflix has been my first experience outside academia, and I have enjoyed learning about the impact and contribution of data science in a business environment. I appreciate that Netflix’s culture allows me to gain insights into various aspects of the business, providing helpful context for me to work more efficiently, and potentially with a larger impact.

As data scientists, we are continuously looking to add to our technical toolkit and to cultivate non-technical skills that drive more impact in our work. Working alongside stunning colleagues from diverse technical and business areas means that we are constantly learning from each other. Strong demand for data science across all business areas of Netflix affords us the ability to collaborate in new problem areas and develop new skills, and our leaders help us identify these opportunities to further our individual growth goals. The constructive feedback culture in Netflix is also key in accelerating our growth. Not only does it help us see blind spots and identify areas of improvement, it also creates a supportive environment where we help each other grow.

Learning more

Interested in learning more about data roles at Netflix? You’re in the right place! Check out our post on Analytics at Netflix to find out more about two other data roles at Netflix — Analytics Engineers and Data Visualization Engineers — who also drive business impact through data. You can search our open roles in Data Science and Engineering here. Our culture is key to our impact and growth: read about it here.


A Day in the Life of an Experimentation and Causal Inference Scientist @ Netflix was originally published in Netflix TechBlog on Medium, where people are continuing the conversation by highlighting and responding to this story.

The Netflix Cosmos Platform

Post Syndicated from Netflix Technology Blog original https://netflixtechblog.com/the-netflix-cosmos-platform-35c14d9351ad

Orchestrated Functions as a Microservice

by Frank San Miguel on behalf of the Cosmos team

Introduction

Cosmos is a computing platform that combines the best aspects of microservices with asynchronous workflows and serverless functions. Its sweet spot is applications that involve resource-intensive algorithms coordinated via complex, hierarchical workflows that last anywhere from minutes to years. It supports both high throughput services that consume hundreds of thousands of CPUs at a time, and latency-sensitive workloads where humans are waiting for the results of a computation.

A Cosmos service

This article will explain why we built Cosmos, how it works and share some of the things we have learned along the way.

Background

The Media Cloud Engineering and Encoding Technologies teams at Netflix jointly operate a system to process incoming media files from our partners and studios to make them playable on all devices. The first generation of this system went live with the streaming launch in 2007. The second generation added scale but was extremely difficult to operate. The third generation, called Reloaded, has been online for about seven years and has proven to be stable and massively scalable.

When Reloaded was designed, we were a small team of developers operating a constrained compute cluster, and focused on one use case: the video/audio processing pipeline. As time passed the number of developers more than tripled, the breadth and depth of our use cases expanded, and our scale increased more than tenfold, the monolithic architecture significantly slowed down the delivery of new features. We could no longer expect everyone to possess the specialized knowledge that was necessary to build and deploy new features. Dealing with production issues became an expensive chore that placed a tax on all developers because infrastructure code was all mixed up with application code. The centralized data model that had served us well when we were a small team became a liability.

Our response was to create Cosmos, a platform for workflow-driven, media-centric microservices. The first-order goals were to preserve our current capabilities while offering:

  • Observability — via built-in logging, tracing, monitoring, alerting and error classification.
  • Modularity — An opinionated framework for structuring a service and enabling both compile-time and run-time modularity.
  • Productivity — Local development tools including specialized test runners, code generators, and a command line interface.
  • Delivery — A fully-managed continuous-delivery system of pipelines, continuous integration jobs, and end to end tests. When you merge your pull request, it makes it to production without manual intervention.

While we were at it, we also made improvements to scalability, reliability, security, and other system qualities.

Overview

A Cosmos service is not a microservice but there are similarities. A typical microservice is an API with stateless business logic which is autoscaled based on request load. The API provides strong contracts with its peers while segregating application data and binary dependencies from other systems.

A typical microservice

A Cosmos service retains the strong contracts and segregated data/dependencies of a microservice, but adds multi-step workflows and computationally intensive asynchronous serverless functions. In the diagram below of a typical Cosmos service, clients send requests to a Video encoder service API layer. A set of rules orchestrate workflow steps and a set of serverless functions power domain-specific algorithms. Functions are packaged as Docker images and bring their own media-specific binary dependencies (e.g. debian packages). They are scaled based on queue size, and may run on tens of thousands of different containers. Requests may take hours or days to complete.

A typical Cosmos service

Separation of concerns

Cosmos has two axes of separation. On the one hand, logic is divided between API, workflow and serverless functions. On the other hand, logic is separated between application and platform. The platform API provides media-specific abstractions to application developers while hiding the details of distributed computing. For example, a video encoding service is built of components that are scale-agnostic: API, workflow, and functions. They have no special knowledge about the scale at which they run. These domain-specific, scale-agnostic components are built on top of three scale-aware Cosmos subsystems which handle the details of distributing the work:

  • Optimus, an API layer mapping external requests to internal business models.
  • Plato, a workflow layer for business rule modeling.
  • Stratum, a serverless layer called for running stateless and computational-intensive functions.

The subsystems all communicate with each other asynchronously via Timestone, a high-scale, low-latency priority queuing system. Each subsystem addresses a different concern of a service and can be deployed independently through a purpose-built managed Continuous Delivery process. This separation of concerns makes it easier to write, test, and operate Cosmos services.

Separation of Platform and Application

A Cosmos service request

Trace graph of a Cosmos service request

The picture above is a screenshot from Nirvana, our observability portal. It shows a typical service request in Cosmos (a video encoder service in this case):

  1. There is one API call to encode, which includes the video source and a recipe
  2. The video is split into 31 chunks, and the 31 encoding functions run in parallel
  3. The assemble function is invoked once
  4. The index function is invoked once
  5. The workflow is complete after 8 minutes

Layering of services

Cosmos supports decomposition and layering of services. The resulting modular architecture allows teams to concentrate on their area of specialty and control their APIs and release cycles.

For example, the video service mentioned above is just one of many used to create streams that can be played on devices. These services, which also include inspection, audio, text, and packaging, are orchestrated using higher-level services. The largest and most complex of these is Tapas, which is responsible for taking sources from studios and making them playable on the Netflix service. Another high-level service is Sagan, which is used for studio operations like marketing clips or daily production editorial proxies.

Layering of Cosmos services

When a new title arrives from a production studio, it triggers a Tapas workflow which orchestrates requests to perform inspections, encode video (multiple resolutions, qualities, and video codecs), encode audio (multiple qualities and codecs), generate subtitles (many languages), and package the resulting outputs (multiple player formats). Thus, a single request to Tapas can result in hundreds of requests to other Cosmos services and thousands of Stratum function invocations.

The trace below shows an example of how a request at a top level service can trickle down to lower level services, resulting in many different actions. In this case the request took 24 minutes to complete, with hundreds of different actions involving 8 different Cosmos services and 9 different Stratum functions.

Trace graph of a service request through multiple layers

Workflows rule!

Or should we say workflow rules? Plato is the glue that ties everything together in Cosmos by providing a framework for service developers to define domain logic and orchestrate stateless functions/services. The Optimus API layer has built-in facilities to invoke workflows and examine their state. The Stratum serverless layer generates strongly-typed RPC clients to make invoking a serverless function easy and intuitive.

Plato is a forward chaining rule engine which lends itself to the asynchronous and compute-intensive nature of our algorithms. Unlike a procedural workflow engine like Netflix’s Conductor, Plato makes it easy to create workflows that are “always on”. For example, as we develop better encoding algorithms, our rules-based workflows automatically manage updating existing videos without us having to trigger and manage new workflows. In addition, any workflow can call another, which enables the layering of services mentioned above.

Plato is a multi-tenant system (implemented using Apache Karaf), which greatly reduces the operational burden of operating a workflow. Users write and test their rules in their own source code repository and then deploy the workflow by uploading the compiled code to the Plato server.

Developers specify their workflows in a set of rules written in Emirax, a domain specific language built on Groovy. Each rule has 4 sections:

  • match: Specifies the conditions that must be satisfied for this rule to trigger
  • action: Specifies the code to be executed when this rule is triggered; this is where you invoke Stratum functions to process the request.
  • reaction: Specifies the code to be executed when the action code completes successfully
  • error: Specifies the code to be executed when an error is encountered.

In each of these sections, you typically first record the change in state of the workflow and then perform steps to move the workflow forward, such as executing a Stratum function or returning the results of the execution (For more details, see this presentation).

Latency-sensitive applications

Cosmos services like Sagan are latency sensitive because they are user-facing. For example, an artist who is working on a social media post doesn’t want to wait a long time when clipping a video from the latest season of Money Heist. For Stratum, latency is a function of the time to perform the work plus the time to get computing resources. When work is very bursty (which is often the case), the “time to get resources” component becomes the significant factor. For illustration, let’s say that one of the things you normally buy when you go shopping is toilet paper. Normally there is no problem putting it in your cart and getting through the checkout line, and the whole process takes you 30 minutes.

Resource scarcity

Then one day a bad virus thing happens and everyone decides they need more toilet paper at the same time. Your toilet paper latency now goes from 30 minutes to two weeks because the overall demand exceeds the available capacity. Cosmos applications (and Stratum functions in particular) have this same problem in the face of bursty and unpredictable demand. Stratum manages function execution latency in a few ways:

  1. Resource pools. End-users can reserve Stratum computing resources for their own business use case, and resource pools are hierarchical to allow groups of users to share resources.
  2. Warm capacity. End-users can request compute resources (e.g. containers) in advance of demand to reduce startup latencies in Stratum.
  3. Micro-batches. Stratum also uses micro-batches, which is a trick found in platforms like Apache Spark to reduce startup latency. The idea is to spread the startup cost across many function invocations. If you invoke your function 10,000 times, it may run one time each on 10,000 containers or it may run 10 times each on 1000 containers.
  4. Priority. When balancing cost with the desire for low latency, Cosmos services usually land somewhere in the middle: enough resources to handle typical bursts but not enough to handle the largest bursts with the lowest latency. By prioritizing work, applications can still ensure that the most important work is processed with low latency even when resources are scarce. Cosmos service owners can allow end-users to set priority, or set it themselves in the API layer or in the workflow.

Throughput-sensitive applications

Services like Tapas are throughput-sensitive because they consume large amounts of computing resources (e.g millions of CPU-hours per day) and are more concerned with the completion of tasks over a period of hours or days rather than the time to complete an individual task. In other words, the service level objectives (SLO) are measured in tasks per day and cost per task rather than tasks per second.

For throughput-sensitive workloads, the most important SLOs are those provided by the Stratum serverless layer. Stratum, which is built on top of the Titus container platform, allows throughput sensitive workloads to use “opportunistic” compute resources through flexible resource scheduling. For example, the cost of a serverless function invocation might be lower if it is willing to wait up to an hour to execute.

The strangler fig

We knew that moving a legacy system as large and complicated as Reloaded was going to be a big leap over a dangerous chasm littered with the shards of failed re-engineering projects, but there was no question that we had to jump. To reduce risk, we adopted the strangler fig pattern which lets the new system grow around the old one and eventually replace it completely.

Still learning

We started building Cosmos in 2018 and have been operating in production since early 2019. Today there are about 40 cosmos services and we expect more growth to come. We are still in mid-journey but we can share a few highlights of what we have learned so far:

The Netflix culture played a key role

The Netflix engineering culture famously relies on personal judgement rather than top-down control. Software developers have both freedom and responsibility to take risks and make decisions. None of us have the title of Software Architect; all of us play that role. In this context, Cosmos emerged in fits and starts from disparate attempts at local optimization. Optimus, Plato and Stratum were conceived independently and eventually coalesced into the vision of a single platform. The application developers on the team kept everyone focused on user-friendly APIs and developer productivity. It took a strong partnership between infrastructure and media algorithm developers to turn the vision into reality. We couldn’t have done that in a top-down engineering environment.

Microservice + Workflow + Serverless

We have found that the programming model of “microservices that trigger workflows that orchestrate serverless functions” to be a powerful paradigm. It works well for most of our use cases but some applications are simple enough that the added complexity is not worth the benefits.

A platform mindset

Moving from a large distributed application to a “platform plus applications” was a major paradigm shift. Everyone had to change their mindset. Application developers had to give up a certain amount of flexibility in exchange for consistency, reliability, etc. Platform developers had to develop more empathy and prioritize customer service, user productivity, and service levels. There were moments where application developers felt the platform team was not focused appropriately on their needs, and other times when platform teams felt overtaxed by user demands. We got through these tough spots by being open and honest with each other. For example after a recent retrospective, we strengthened our development tracks for crosscutting system qualities such as developer experience, reliability, observability and security.

Platform wins

We started Cosmos with the goal of enabling developers to work better and faster, spending more time on their business problem and less time dealing with infrastructure. At times the goal has seemed elusive, but we are beginning to see the gains we had hoped for. Some of the system qualities that developers like best in Cosmos are managed delivery, modularity, and observability, and developer support. We are working to make these qualities even better while also working on weaker areas like local development, resilience and testability.

Future plans

2021 will be a big year for Cosmos as we move the majority of work from Reloaded into Cosmos, with more developers and much higher load. We plan to evolve the programming model to accommodate new use cases. Our goals are to make Cosmos easier to use, more resilient, faster and more efficient. Stay tuned to learn more details of how Cosmos works and how we use it.


The Netflix Cosmos Platform was originally published in Netflix TechBlog on Medium, where people are continuing the conversation by highlighting and responding to this story.

Packaging award-winning shows with award-winning technology

Post Syndicated from Netflix Technology Blog original https://netflixtechblog.com/packaging-award-winning-shows-with-award-winning-technology-c1010594ba39

By Cyril Concolato

Introduction

In previous blog posts, our colleagues at Netflix have explained how 4K video streams are optimized, how even legacy video streams are improved and more recently how new audio codecs can provide better aural experiences to our members. In all these cases, prior to being delivered through our content delivery network Open Connect, our award-winning TV shows, movies and documentaries like The Crown need to be packaged to enable crucial features for our members. In this post, we explain these features and how we rely on award-winning standard formats and open source software to enable them.

The Crown

Key Packaging Features

In typical streaming pipelines, packaging is the step that happens just after encoding, as depicted in the figure below. The output of an encoder is a sequence of bytes, called an elementary stream, which can only be parsed with some understanding of the elementary stream syntax. For example, detecting frame boundaries in an AV1 video stream requires being able to parse so-called Open Bitstream Units (OBU) and identifying Temporal Delimiters OBU. However, high level operations performed on client devices, such as seeking, do not need to be aware of the elementary syntax and benefit from a codec-agnostic format. The packaging step aims at producing such a codec-agnostic sequence of bytes, called packaged format, or container format, which can be manipulated, to some extent, without a deep knowledge of the coding format.

Figure 1 — Simplified architecture of a streaming preparation pipeline

A key feature that our members rightfully deserve when playing audio, video, and timed text is synchronization. At Netflix, we strive to provide an experience where you never see the lips of the Queen of England move before you hear her corresponding dialog in The Crown. Synchronization is achieved by fundamental elements of signaling such as clocks or time lines, time stamps, and time scales that are provided in packaged content.

Our members don’t simply watch our series from beginning to end. They seek into Bridgerton when they resume watching. They rewind and replay their favorite chess move in The Queen’s Gambit. They skip introductions and recaps when they frantically binge-watch Lupin. They make playback decisions when they watch interactive titles such as You vs. Wild. Due to the nature of the audio or video compression techniques, a player cannot necessarily start decoding the stream exactly where our members want. Under the hood, players have to locate points in the stream where decoding can start, decode as quickly as they can, until the user seek point is reached before starting playback. This is another basic feature of packaging: signaling frame types and particularly Random Access Points.

When our members’ kids watch Carmen Sandiego in the back seats of their parents’ car or more generally when the network throughput varies, adaptive streaming technologies are applied to provide the best viewing experience under the network conditions. Adaptive streaming technologies require that streams of various qualities be encoded to common constraints but they also rely on another key feature of packaging to offer seamless quality switching, called indexing. Indexing lets the player fetch only the corresponding segments of the new stream.

Many other elements of signaling are provided in our packaged content to enable the viewing to start as quickly as possible and in the best possible conditions. Decryption modules need to be initialized with the appropriate scheme and initialization vector. Hardware video decoders need to know in advance the resolution and bit depth of the video streams to allocate their decoding buffers. Rendering pipelines need to know ahead of time the speaker configuration of audio streams or whether the video streams are HDR or SDR. Being able to signal all these elements is also a key feature of modern packaging formats.

The role of standards and open source software

Our 200+ million members watch Netflix on a wide variety of devices, from smartphones, to laptops, to TVs and many more, developed by a large number of partners. Reducing the friction when on-boarding a new device and making sure that our content will be playable on old devices for a long time is very important. That is where standards play a key role. The ISO Base Media File Format (ISOBMFF) is the key packaging standard in the entertainment industry as recently recognized with a Technology & Engineering Emmy® Award by the National Academy of Television Arts & Sciences (NATAS).

ISOBMFF provides all the key packaging features mentioned above, and as history proves, it is also versatile and extensible, in its capabilities of adding new signaling features and in its support of codec. Streams encoded with well-established codecs such as AVC and AAC can be carried in ISOBMFF files, but the specification is also regularly extended to support the latest codecs. The Media Systems team at Netflix actively contributes to the development, the maintenance, and the adoption of ISOBMFF. As an example, Netflix led the specification for the carriage of AOM’s AV1 video streams in ISOBMFF.

With 20+ years of existence, ISOBMFF accumulated a lot of technical tools for various use cases. Figure 2 illustrates the complexity of ISOBMFF today through the concept of ‘brands’, a concept similar to profiles in audio or video standards. Initially, limited and well-nested, the standard is now very broad and evolving in various directions.

Figure 2 — Illustrating the complexity of the 6th edition of ISOBMFF. Each rectangle represents a ‘brand’ (indicated by a four character code in bold), and its required set of tools (indicated by a ‘+’ line). Brands are nested. All the tools of inner brands are required by outer brands.

For the Netflix streaming service, we rely on a subset of these tools as identified by the Common Media Application Format (CMAF) standard, and the content protection tools defined in the Common Encryption (CENC) standard.

Multimedia standards like ISOBMFF, CMAF and CENC go hand in hand with open source software implementations. Open source software can demonstrate the features of the standard, enabling the industry to understand its benefits and broadening its adoption. Open source software can also help improve the quality of a standard by highlighting possible ambiguities through a neutral, reference implementation. The Media Systems team at Netflix maintains such a reference open source implementation, called Photon, for the SMPTE IMF standard. For ISOBMFF, Netflix uses MP4Box, the reference open source implementation from the GPAC team.

In this packaging ecosystem of standards and open source software, our work within the Media Systems team includes identifying the tools within the existing standards to address new streaming use cases. When such tools don’t exist, we define new standards or expand existing ones, including ISOBMFF and CMAF, and support open source software to match these standards. For example, when our video encoding colleagues design dynamically optimized encoding schemes producing streaming segments with variable durations, we modify our workflow to ensure that segments across video streams with different bit rates remain time aligned. Similarly, when our audio encoding colleagues introduce xHE-AAC, which obsoletes the old assumption that every audio frame is decodable, we guarantee that audio/video segments remain aligned too. Finally, when we want to help the industry converge to a common encryption scheme for new video codecs such as AV1, we coordinate the discussions to select the scheme, in this case pattern-based subsample encryption (a.k.a ‘cbcs’), and lead the way by providing reference bitstreams. And of course, our work includes handling the many types of devices in the field that don’t have proper support of the standards.

Conclusion

We hope that this post gave you a better understanding of a part of the work of the Media Systems team at Netflix, and hopefully next time you watch one of our award-winning shows, you will recognize the part played by ISOBMFF, a key, award-winning technology. If you want to explore another facet of the team’s work, have a look at the other award-winning technology, TTML, that we use for our Japanese subtitles.

We’re hiring!

If this work sounds exciting to you and you’d like to help the Media Systems team deliver an even better experience, Netflix is searching for an experienced Engineering Manager for the team. Please contact Anne Aaron for more info.


Packaging award-winning shows with award-winning technology was originally published in Netflix TechBlog on Medium, where people are continuing the conversation by highlighting and responding to this story.

Beyond REST

Post Syndicated from Netflix Technology Blog original https://netflixtechblog.com/beyond-rest-1b76f7c20ef6

Rapid Development with GraphQL Microservices

by Dane Avilla

The entertainment industry has struggled with COVID-19 restrictions impacting productions around the globe. Since early 2020, Netflix has been iteratively developing systems to provide internal stakeholders and business leaders with up-to-date tools and dashboards with the latest information on the pandemic. These software solutions allow executive leadership to make the most informed decisions possible regarding if and when a given physical production can safely begin creating compelling content across the world. One approach that is gaining mind-share within Netflix is the concept of GraphQL microservices (GQLMS) as a backend platform facilitating rapid application development.

Many organizations are embracing GraphQL as a way to unify their enterprise-wide data model and provide a single entry point for navigating a sea of structured data with its network of related entities. Such efforts are laudable but often entail multiple calendar quarters of coordination between internal organizations followed by the development and integration of all relevant entities into a single monolithic graph.

In contrast to this “One Graph to Rule Them All” approach, GQLMS leverage GraphQL simply as an enriched API specification for building CRUD applications. Our experience using GQLMS for rapid proof-of-concept applications confirmed two theories regarding the advertised benefits of GraphQL:

  • The GraphiQL IDE displays any available GraphQL documentation right alongside the schema, dramatically improving developer ergonomics for API consumers (in contrast to the best-in-class Swagger UI).
  • GraphQL’s strong type system and polyglot client support mean API providers do not need to concern themselves with generating, versioning, and maintaining language-specific API clients (such as those generated with the excellent Swagger Codegen). Consumers of GraphQL APIs can simply leverage the open-source GraphQL client of their preference.
GraphiQL: Auto-generated test GUI for the Star Wars API

Our experience has led to an architecture with a number of best-practices for teams interested in GQLMS as a platform for rapid development.

Graphile

During early GraphQL exploration efforts, Netflix engineers became aware of the Graphile library for presenting PostgreSQL database objects (tables, views, and functions) as a GraphQL API. Graphile supports smart comments allowing control of various features by tagging database tables, views, columns, and types with specifically formatted PostgreSQL comments. Documentation can even be embedded in the database comments such that it displays in the GraphQL schema generated by Graphile.

We hypothesized that a Docker container running a very simple NodeJS web server with the Graphile library (and some additional Netflix internal components for security, logging, metrics, and monitoring) could provide a “better REST than REST” or “REST++” platform for rapid development efforts. Using Docker we defined a lightweight, stand-alone container that allowed us to package the Graphile library and its supporting code into a self-contained bundle that any team can use at Netflix with no additional coding required. Simply pull down the defined Docker base image and run it with the appropriate database connection string. This approach proved to be very successful and yielded several insights into the use of Graphile.

Specifically:

  • Use database views as an “API layer” to preserve flexibility in order to allow modifying tables without changing an existing GraphQL schema (built on the database views).
  • Use PostgreSQL Composite Types when taking advantage of PostgreSQL Aggregate Functions.
  • Increase flexibility by allowing GraphQL clients to have “full access” to the auto-generated GraphQL queries and mutations generated by Graphile (exposing CRUD operations on all tables & views); then later in the development process, remove schema elements that did not end up being used by the UI before the app goes into production.

Database views as API

We decided to put the data tables in one PostgreSQL schema and then define views on those tables in another schema, with the Graphile web app connecting to the database using a dedicated PostgreSQL user role. This ended up achieving several different goals:

  • Underlying tables could be changed independently of the views exposed in the GraphQL schema.
  • Views could do basic formatting (like rendering TIMESTAMP fields as ISO8601 strings).
  • All permissions on the underlying table had to be explicitly granted for the web application’s PostgreSQL user, avoiding unexpected write access.
  • Tables and views could be modified within a single transaction such that the changes to the exposed GraphQL schema happened atomically.

On this last point: changing a table column’s type would break the associated view, but by wrapping the change in a transaction, the view could be dropped, the column could be updated, and then the view could be re-created before committing the transaction. We run Graphile with pgWatch enabled, so as soon as any updates were made to the database, the GraphQL schema immediately updated to reflect the change.

PostgreSQL composite types

Graphile does an excellent job reading the PostgreSQL database schema and transforming tables and basic views into a GraphQL schema, but our experience revealed limitations in how Graphile describes nested types when PostgreSQL Aggregate Functions or JSON Functions exist within a view. Native PostgreSQL functions such as json_build_object will be translated into a GraphQL JSON type, which is simply a String, devoid of any internal structure. For example, take this simplistic view returning a JSON object:

postgres_test_db=# create view postgraphile.json_object_example as
select json_build_object(‘hello world’::text, 1, ‘2’::text, 3)
as json;
postgres_test_db=# select * from postgraphile.json_object_example;
json
— — — — — — — — — — — — -
{“hello world”: 1, “2”: 3}
(1 row)

In the generated schema, the data type is JSON:

The internal structure of the json field (the hello world and 2 sub-fields) is opaque in the generated GraphQL schema.

To further describe the internal structure of the json field — exposing it within the generated schema — define a composite type, and create the view such that it returns that type:

postgres_test_db=# CREATE TYPE postgraphile.custom_type AS (
"hello world" integer,
"2" integer
);

Next, create a function that returns that type:

postgres_test_db=# CREATE FUNCTION postgraphile.custom_type(
"hello world" integer,
"2" integer
)
RETURNS postgraphile.custom_type
AS 'select $1, $2'
LANGUAGE SQL;

Finally, create a view that returns that type:

postgres_test_db=# create view postgraphile.json_object_example2 as
select postgraphile.custom_type(1, 3)
as json;
postgres_test_db=# select * from postgraphile.json_object_example2;
json
— — — -
(1,3)
(1 row)

At first glance, that does not look very useful, but hold that thought: before viewing the generated schema, define comments on the view, custom type, and fields of the custom type to take advantage of Graphile’s smart comments:

postgres_test_db=# comment on
type postgraphile.custom_type
is E’A description for the custom type’;
postgres_test_db=# comment on
view postgraphile.json_object_example2
is E’A description for the view’;
postgres_test_db=# comment on
column postgraphile.custom_type.”hello world”
is E’A description for hello world’;
postgres_test_db=# comment on
column postgraphile.custom_type.field_2
is E’@name field_two\nA description for the second field’;

Now, when the schema is viewed, the json field no longer shows up with opaque type JSON, but with CustomType:

(also note that the comment made on the view — A description for the view — shows up in the documentation for the query field).

Clicking CustomType displays the fields of the custom type, along with their comments:

Notice that in the custom type, the second field was named field_2, but the Graphile smart comment renames the field to field_two and subsequently gets camel-cased by Graphile to fieldTwo. Also, the descriptions for both fields display in the generated GraphQL schema.

Allow “full access” to the Graphile-generated schema (during development)

Initially, the proposal to use Graphile was met with vigorous dissent when discussed as an option in a “one schema to rule them all” architecture. Legitimate concerns about security (how does this integrate with our IAM infrastructure to enforce row-level access controls within the database?) and performance (how do you limit queries to avoid DDoSing the database by selecting all rows at once?) were raised about providing open access to database tables with a SQL-like query interface. However, in the context of GQLMS for rapid development of internal apps by small teams, having the default Graphile behavior of making all columns available for filtering allowed the UI team to rapidly iterate through a number of new features without needing to involve the backend team. This is in contrast to other development models where the UI and backend teams first agree on an initial API contract, the backend team implements the API, the UI team consumes the API and then the API contract evolves as the needs of the UI change during the development life cycle.

Initially, the overall app’s performance was poor as the UI often needed multiple queries to fetch the desired data. However, once the app’s behavior had been fleshed out, we quickly created new views satisfying each UI interaction’s needs such that each interaction only required a single call. Because these requests run on the database in native code, we could perform sophisticated queries and achieve high performance through the appropriate use of indexes, denormalization, clustering, etc.

Once the “public API” between the UI and backend solidified, we “hardened” the GraphQL schema, removing all unnecessary queries (created by Graphile’s default settings) by marking tables and views with the smart comment @omit. Also, the default behavior is for Graphile to generate mutations for tables and views, but the smart comment @omit create,update,delete will remove the mutations from the schema.

Conclusion

For those taking a schema-first approach to their GraphQL API development, the automatic GraphQL schema generation capabilities of Graphile will likely unacceptably restrict schema designers. Graphile may be difficult to integrate into an existing enterprise IAM infrastructure if fine-grained access controls are required. And adding custom queries and mutations to a Graphile-generated schema (i.e. to expose a gRPC service call needed by the UI) is something we currently do not support in our Docker image. However, we recently became aware of Graphile’s makeExtendSchemaPlugin, which allows custom types, queries, and mutations to be merged into the schema generated by Graphile.

That said, the successful implementation of an internal app over 4–6 weeks with limited initial requirements and an ad hoc distributed team (with no previous history of collaboration) raised a large amount of interest throughout the Netflix Studio. Other teams within Netflix are finding the GQLMS approach of:

1) using standard GraphQL constructs and utilities to expose the database-as-API

2) leveraging custom PostgreSQL types to craft a GraphQL schema

3) increasing flexibility by auto-generating a large API from a database

4) and exposing additional custom business logic and data types alongside those generated by Graphile

to be a viable solution for internal CRUD tools that would historically have used REST. Having a standardized Docker container hosting Graphile provides teams the necessary infrastructure by which they can quickly iterate on the prototyping and rapid application development of new tools to solve the ever-changing needs of a global media studio during these challenging times.


Beyond REST was originally published in Netflix TechBlog on Medium, where people are continuing the conversation by highlighting and responding to this story.

Building a Rule-Based Platform to Manage Netflix Membership SKUs at Scale

Post Syndicated from Netflix Technology Blog original https://netflixtechblog.com/building-a-rule-based-platform-to-manage-netflix-membership-skus-at-scale-e3c0f82aa7bc

By Budhaditya Das, Wallace Wang, and Scott Yao

At Netflix, we aspire to entertain the world. From mailing DVDs in the US to a global streaming service with over 200 million subscribers across 190 countries, we have come a long way. For the longest time, Netflix had three plans (basic/standard/premium) with a single 30-day free trial offer at signup. As we expand offerings rapidly across the globe, our ideas and strategies around plans and offers are evolving as well. For example, the mobile plan launch in India and Southeast Asia was a huge success. We are inspired to provide the best offer and plan setup tailored to our customers’ needs to make their choice easier to start a membership.

Membership Engineering at Netflix is responsible for the plan and pricing configurations for every market worldwide. Our team is also the primary source of truth for various offers and promotions. Internally, we use the term SKU (Stock Keeping Unit) to represent these entities. The original SKU catalog is a logic-heavy client library packaged with complex metadata configuration files and consumed by various services. However, with our rapid product innovation speed, the whole approach experienced significant challenges:

  • Business Complexity: The existing SKU management solution was designed years ago when the engagement rules were simple — three plans and one offer homogeneously applied to all regions. As the business expanded globally, the complexity around pricing, plans, and offers increased exponentially.
  • Operational Efficiency: The majority of the changes require metadata configuration files and library code changes, usually taking days of testing and service release to adopt the updates.
  • Reliability: It is exceptionally challenging to effectively gauge the impact of metadata changes in the current form. With 50+ services consuming the SKU catalog library, a small change could inadvertently result in a significant outage with a global blast radius. Additionally, the business implications for pricing-related errors are enormous.
  • Maintainability: With the increase in ongoing experimentation around SKUs, the configuration files have exploded exponentially. Besides, the mixed-use of the metadata files and business logic code adds another layer of maintenance complexity.

To solve the challenges mentioned above and meet our rapidly evolving business needs, we re-architected the legacy SKU catalog from the ground up and partnered with the Growth Engineering team to build a scalable SKU platform. This re-design enabled us to reposition the SKU catalog as an extensible, scalable, and robust rule-based “self-service” platform. It was a massive but necessary undertaking to ensure that Netflix is ready for the next phase of rapid global growth and business challenges.

A Platform Based on Rules

Our initial use case analysis highlighted that most of the change requests were related to enhancing, configuring, or tweaking existing SKU entities to enable business teams to carry out plans or offer related A/B experiments across various geo-locations. Most of these changes are mechanical and amenable to the “self-service” model. This critical insight helped us re-envision the SKU catalog as a seamless, scalable platform that empowers our stakeholders to make rapid changes with confidence while the platform ensures suitable guardrails for data accuracy and integrity. With that idea in mind, we defined the core principles of the new SKU Platform:

  • Ownership Clarity: Membership Engineering team owns the SKU catalog data and provides a platform for stakeholders to configure SKUs based on their needs.
  • Self Service: SKU changes need to be flexibly configurable, validated comprehensively, and released rapidly. In comparison, the API interface for consumer services should be consistent and static regardless of the business requirement iteration.
  • Auditability: SKU changes workflow would require engineers’ review and approval. Bad changes can quickly revert to mitigate issues and provide history for auditing.
  • Observability: SKU resolution insight is critical and helpful for engineers to diagnose what went wrong in the change lifecycle.

Building a scalable SKU catalog platform that allowed for rapid changes with the minimal intervention was challenging. We realized that abstracting out the business rules into a “rules engine” would enable us to achieve our stated goals. After evaluating multiple open-source and commercial rule evaluation frameworks, we chose our internal Rules Management and Evaluation Framework — Hendrix. Hendrix is a simple interpreted language that expresses how configuration values should be computed. These expressions (rules) are evaluated in the current request session context and can access data such as A/B test assignments, necessary member information, customized input, etc. We’ll skip over Hendrix’s specific details and focus on the SKU platform adoption in this article for brevity.

The adoption of an externalized rule evaluation engine was a major game-changer. It allowed us to remove boilerplate code and took us a step forward in becoming a true self-service platform. The rules, now encoded in JSON, were easy to generate, manage and modify via automated means. It eliminated many complex conditional branching logic, making the core codebase simple and easy to enhance. Most importantly, it allowed runtime and quick business logic changes in production without code change deployments. Overall, it simplified SKU selections and increased our testing and product delivery confidence. Here is a snippet of the mobile plan availability rule:

{
parameter: "plans",
default: [Basic, Standard, Premium],
values:
{
feature: "mobilePlanLaunched",
value: [Mobile, Basic, Standard, Premium],
},
],
},
{
feature: "mobilePlanLaunched",
requirements: [
{
type: "request",
key: "country",
oneOf: ["IN", "ID", "MY", "PH", "TH"],
},
],
},

In addition to the rule engine, the following components make up the core building blocks of the new SKU platform:

  • Service Layer — SKUService: A service layer replaced the original SKU catalog client library to provide a unified interface for consumers to access the SKU catalog.
  • Persistence Layer — SKUDB: SKU catalog data was migrated from the metadata configuration files to a relational database. Adding and updating entities is audited and tightly controlled via “privileged” APIs exposed by the service layer.
  • Business Rules — SKURules: Various business rules are defined as Hendrix expressions. For example, our business requirements dictate that a mobile plan should be available for specific markets only, while the rest of the world receives the default set of plans. These rule definitions are hosted in a separate git repository and Hendrix module within SKUService load and refresh it periodically. The changes are administered by the regular git pull request flow and guarded by the validation infrastructure.
  • Observability/Validation Guardrails: A comprehensive validation infrastructure designed to ensure that SKURules changes are accurate and do not break existing behavior.
  • Self Service Management UI: A straightforward visualization tool for rules management and are in the process of supporting direct rules editing.

The new SKU flow for consumer services is simple, generic, and easy to maintain with business rules isolated in SKURules. Consumers pass a map of context to be used as rules evaluation criteria. Rule owners are responsible for making sure the requirements match the rule definition and request context. By choosing a generalized context map, we keep the API interface consistent regardless of the rules change. In-memory rules evaluation returns a list of SKU ids, which hibernates with the SKUDB query for the full entity metadata.

Managing Rules at Scale

As the platform evolved from code towards externalized rules to manage business flows, we realized that maintaining an ever-growing set of volatile rule configurations at Netflix scale was a critical challenge:

  • Debugging is difficult when navigating through an ever-increasing set of rules.
  • The impact of changing an existing rule is tricky to measure due to the nature that Hendrix evaluates rules based on first-match. There is always a possibility of prior rules taking precedence over the later ones if the changes are not handled carefully.
  • Rules naturally have different lifecycles and impacts. Some are short-lived with specific targeted audiences (for most of our A/B tests) compared to the stabilized ones with an enormous impact on our broader member base.
  • Rules’ ownership needed to be defined clearly for long-term maintenance health.

To manage the complexity of rules and the associated lifecycle, we introduced the concept of rules categorization. Based on our use case, we classified our rules into three groups:

Fallback

Fallback rules will execute first and short circuit the evaluation. It should easily understand, with no experimental information and domain-specific context.

Most restricted access and owned by the Membership Engineering team. Since this will impact all later rules, adding rules to this category should be cautious and thoroughly reviewed.

Experimental

Evaluate right after fallback rules, solely serving our A/B tests. Frequent changes are expected to these rules from different stakeholders. Experimental rules can eventually transform into stabilized rules if we decide to ship them.

Stakeholders take ownership of this rule group to initiate fast iteration of product experimentations.

Stabilized

Evaluate at last after fallback and experimental rules. Rarely changed but with a more significant impact on our member base.

Membership Engineering team owns this group to ensure the stability of our broadest SKU offering.

The diagram above demonstrates the rules evaluation order for each group. Categorizing the rules allowed the platform to streamline complex configuration and lifecycle management, enabling our stakeholders to make frequent experimentation changes with confidence.

As we adopted more rules into Hendrix, we recognized that understanding the JSON format structure was not straightforward. To overcome this challenge, our tools team built a UI to visualize the rules configuration. It significantly improved the overall experience of understanding and debugging rules. Here is a sample visualization of our mobile plan availability rules:

Visualization is just the first step in our endeavor to make this a truly self-service platform. The long-term goal is to support complete rule lifecycle management (edition/auditing/validation) via the UI tool.

Build Confidence with Validation Infrastructure

The move towards a rule-based platform shifted a lot of assumptions around change management and deployment. The legacy paradigm involved a fixed process in applying code changes and service release can take a couple of days. With the introduction of external rules, the platform enabled our stakeholders to make near-real-time changes to business flows. It reduces the turnaround time from days to a few hours.

But with great power comes great responsibility. Ensuring the SKU catalog and the associated rules’ correctness is exceptionally critical for the platform’s long-term stability. Errors in pricing will have a direct impact on our members. To protect the integrity of rules and empower stakeholders to make changes, we built a comprehensive infrastructure that implements a series of validation and verification guardrails. The primary goals of the validation infrastructure are as follows:

  • Rule change release workflow: Establish a scalable workflow to ensure rule changes get the expected outcome from the beginning of the pull request to the final deployment stage.
  • Snapshot and auditability: Expose mechanisms to capture a holistic snapshot of SKU rules resolution for auditing.
  • Production alerts: Create an exhaustive set of alerts to detect anomalies and react to them quickly.

Rules are just another representation of code, so the best practices that apply to code management should also apply to rules. For each rule change pull request, we also require the author to include unit-tests to ensure correctness and prevent future changes from breaking the current one unnoticed. Unit-tests are categorized with the same rules group concept. Below is an example from the stabilized rules test that mobile plan is available in India:

{
test: "testMobilePlanAvailableIndia",
context: {
request: [
{
key: "country",
value: "IN",
},
],
},
assertions: {
plans: [Mobile, Basic, Standard, Premium],
},
},

The second component of the validation infrastructure is the audit framework by leveraging our big data platform. Every rule change triggers a pipeline (spark job) that takes a snapshot of various SKUs’ current state with the latest rules. The framework carries out a differential analysis against the preceding version of the snapshot to quickly identify unintended bugs in rule changes. Additionally, the results are stored in a Hive table for auditing purposes.

The last and the most crucial piece of the validation ecosystem are the production alerts. These alerts are built around Netflix’s vast real-time monitoring infrastructure and focus on ensuring that our members, across the world, are getting the expected SKUs. These alerts enable us to quickly flag anomalous trends and notify on-call engineers for speedy resolution. It provides an additional safety layer, which is critical, given the platform’s size and complexity.

With the validation infrastructure providing enhanced reliability for the SKU platform, both Membership engineers and stakeholders can confidently change SKU rules. The diagram below summarizes the complete SKU rule change release workflow.

What’s Next?

We had tremendous success with the new rule-based SKU platform. Engineering efficiency took a significant boost that sped up the operation from weeks of collaboration to few days of effort for AB experiment and product launch. Stakeholders are empowered to make changes to rules reliably thanks to the comprehensive validation infrastructure. Moreover, we are committed to more platform enhancements like better rules debugging experience, one-stop UI for rules management, and continuously evaluating other membership domains’ opportunities to adopt rule-based solutions.

If you have experience or planning to build a rule-based application, we’d love to hear it. We value knowledge sharing, and it’s the drive for industry innovation. Please check our website to learn more about our work building a subscription business at Netflix Scale. Lastly, if you are interested in joining us, Membership Engineering and Revenue Growth Tools are hiring!


Building a Rule-Based Platform to Manage Netflix Membership SKUs at Scale was originally published in Netflix TechBlog on Medium, where people are continuing the conversation by highlighting and responding to this story.

Hawkins: Diving into the Reasoning Behind our Design System

Post Syndicated from Netflix Technology Blog original https://netflixtechblog.com/hawkins-diving-into-the-reasoning-behind-our-design-system-964a7357547

Stranger Things imagery showcasing the inspiration for the Hawkins Design System

by Hawkins team member Joshua Godi; with art contributions by Wiki Chaves

Hawkins may be the name of a fictional town in Indiana, most widely known as the backdrop for one of Netflix’s most popular TV series “Stranger Things,” but the name is so much more. Hawkins is the namesake that established the basis for a design system used across the Netflix Studio ecosystem.

Have you ever used a suite of applications that had an inconsistent user experience? It can be a nightmare to work efficiently. The learning curve can be immense for each and every application in the suite, as the user is essentially learning a new tool with each interaction. Aside from the burden on these users, the engineers responsible for building and maintaining these applications must keep reinventing the wheel, starting from scratch with toolsets, component libraries and design patterns. This investment is repetitive and costly. A design system, such as the one we developed for the Netflix Studio, can help alleviate most of these headaches.

We have been working on our own design system that is widely used across the Netflix Studio’s growing application catalogue, which consists of 80+ applications. These applications power the production of Netflix’s content, from pitch evaluation to financial forecasting and completed asset delivery. A typical day for a production employee could require using a handful of these applications to entertain our members across the world. We wanted a way to ensure that we can have a consistent user experience while also sharing as much code as possible.

In this blog post, we will highlight why we built Hawkins, as well as how we got buy-in across the engineering organization and our plans moving forward. We recently presented a talk on how we built Hawkins; so if you are interested in more details, check out the video.

What is a design system?

Before we can dive into the importance of having a design system, we have to define what a design system means. It can mean different things to different people. For Hawkins, our design system is composed of two main aspects.

General design system component mocks

First, we have the design elements that form the foundational layer of Hawkins. These consist of Figma components that are used throughout the design team. These components are used to build out mocks for the engineering team. Being the foundational layer, it is important that these assets are consistent and intuitive.

Second, we have our React component library, which is a JavaScript library for building user interfaces. The engineering team uses this component library to ensure that each and every component is reusable, conforms to the design assets and can be highly configurable for different situations. We also make sure that each component is composable and can be used in many different combinations. We made the decision to keep our components very atomic; this keeps them small, lightweight and easy to combine into larger components.

At Netflix, we have two teams composed of six people who work together to make Hawkins a success, but that doesn’t always need to be the case. A successful design system can be created with just a small team. The key aspects are that it is reusable, configurable and composable.

Why is a design system important?

Having a solid design system can help to alleviate many issues that come from maintaining so many different applications. A design system can bring cohesion across your suite of applications and drastically reduce the engineering burden for each application.

Examples of Figma components for the Hawkins Design System

Quality user experience can be hard to come by as your suite of applications grow. A design system should be there to help ease that burden, acting as the blueprint on how you build applications. Having a consistent user experience also reduces the training required. If users know how to fill out forms, access data in a table or receive notifications in one application, they will intuitively know how to in the next application.

The design system acts as a language that both designers and engineers can speak to align on how applications are built out. It also helps with onboarding new team members due to the documentation and examples outlined in your design system.

The last and arguably biggest win for design systems is the reduction of burden on engineering. There will only be one implementation of buttons, tables, forms, etc. This greatly reduces the number of bugs and improves the overall health and performance of every application that uses the design system. The entire engineering organization is working to improve one set of components vs. each using their own individual components. When a component is improved, whether through additional functionality or a bug fix, the benefit is shared across the entire organization.

Taking a wide view of the Netflix Studio landscape, we saw many opportunities where Hawkins could bring value to the engineering organization.

Build vs. buy

The first question we asked ourselves is whether we wanted to build out an entire design system from scratch or leverage an existing solution. There are pros and cons to each approach.

Building it yourself— The benefits of DIY means that you are in control every step of the way. You get to decide what will be included in the design system and what is better left out. The downside is that because you are responsible for it all, it will likely take longer to complete.

Leveraging an existing solution — When you leverage an existing solution, you can still customize certain elements of that solution, but ultimately you are getting a lot out of the box for free. Depending on which solution you choose, you could be inheriting a ton of issues or something that is battle tested. Do your research and don’t be afraid to ask around!

For Hawkins, we decided to take both approaches. On the design side, we decided to build it ourselves. This gave us complete creative control over how our user experience is throughout the design language. On the engineering side, we decided to build on top of an existing solution by utilizing Material-UI. Leveraging Material-UI, gave us a ton of components out of the box that we can configure and style to meet the needs of Hawkins. We also chose to obfuscate a number of the customizations that come from the library to ensure upgrading or replacing components will be smoother.

Generating users and getting buy-in

The single biggest question that we had when building out Hawkins is how to obtain buy-in across the engineering organization. We decided to track the number of uses of each component, the number of installs of the packages themselves, and how many applications were using Hawkins in production as metrics to determine success.

There is a definitive cost that comes with building out a design system no matter the route you take. The initial cost is very high, with research, building out the design tokens and the component library. Then, developers have to begin consuming the libraries inside of applications, either with full re-writes or feature by feature.

Graph depicting the cost of building a design system

A good representation of this is the graph above. While an organization may spend a lot of time initially making the design system, it will benefit greatly once it is fully implemented and trusted across the organization. With Hawkins, our initial build phase took about two quarters. The two quarters were split between Q1 consisting of creating the design language and Q2 being the implementation phase. Engineering and Design worked closely during the entire build phase. The end result was a significant number of components in Figma and a large component library leveraging Material-UI. Only then could we start to look for engineering teams to start using Hawkins.

When building out the component library, we set out to accomplish four key aspects that we felt would help drive support for Hawkins:

Document components — First, we ensured that each component was fully documented and had examples using Storybook.

On-call rotation for support — Next, we set up an on-call rotation in Slack, where engineers could not only seek guidance, but report any issues they may have encountered. It was extremely important to be responsive in our communication channels. The more support engineers feel they have, the more receptive they will be to using the design library.

Demonstrate Hawkins usefulness — Next, we started to do “road shows,” where we would join team meetings to demonstrate the value that Hawkins could bring to each and every team. This also provided an opportunity for the engineers to ask questions in person and for us to gather feedback to ensure our plans for Hawkins would meet their needs.

Bootstrap features for proof of concept— Finally, we helped bootstrap out features or applications for teams as a proof of concept. All of these together helped to foster a relationship between the Hawkins team and engineering teams.

Even today, as the Hawkins team, we run through all of the above exercises and more to ensure that the design system is robust and has the level of support the engineering organization can trust.

Handling the outliers

The Hawkins libraries all consist of basic components that are the building blocks to the applications across the Netflix Studio. When engineers increased their usage of Hawkins, it became clear that many folks were using the atomic components to build more complex experiences that were common across multiple applications, like in-app chat, data grids, and file uploaders, to name a few. We did not want to put these components straight into Hawkins because of the complexity and because they weren’t used across the entire Studio. So, we were tasked with identifying a way to share these complex components while still being able to benefit from all the work we accomplished on Hawkins.

To meet this challenge, developers decided to spin up a parallel library that sits right next to Hawkins. This library builds on top of the existing design system to provide a home for all the complex components that didn’t fit into the original design system.

Venn diagram showing the relationship between the libraries

This library was set up as a Lerna monorepo with tooling to quickly jumpstart a new package. We followed the same steps as Hawkins with Storybook and communication channels. The benefit of using a monorepo was that it gave engineering a single place to discover what components are available when building out applications. We also decided to version each package independently, which helped avoid issues with updating Hawkins or in downstream applications.

With so many components that will go into this parallel library, we decided on taking an “open source” approach to share the burden of responsibility for each component. Every engineer is welcome to contribute new components and help fix bugs or release new features in existing components. This model helps spread the ownership out from just a single engineer to a team of developers and engineers working in tandem.

It is the goal that eventually these components could be migrated into the Hawkins library. That is why we took the time to ensure that each repository has the same rules when it came to development, testing and building. This would allow for an easy migration.

Wrapping up

We still have a long way to go on Hawkins. There are still a plethora of improvements that we can do to enhance performance and developer ergonomics, and make it easier to work with Hawkins in general, especially as we start to use Hawkins outside of just the Netflix Studio!

Logo for the Hawkins Design System

We are very excited to share our work on Hawkins and dive into some of the nuances that we came across.


Hawkins: Diving into the Reasoning Behind our Design System was originally published in Netflix TechBlog on Medium, where people are continuing the conversation by highlighting and responding to this story.

Growth Engineering at Netflix- Creating a Scalable Offers Platform

Post Syndicated from Netflix Technology Blog original https://netflixtechblog.com/growth-engineering-at-netflix-creating-a-scalable-offers-platform-69330136dd87

by Eric Eiswerth

Background

Netflix has been offering streaming video-on-demand (SVOD) for over 10 years. Throughout that time we’ve primarily relied on 3 plans (Basic, Standard, & Premium), combined with the 30-day free trial to drive global customer acquisition. The world has changed a lot in this time. Competition for people’s leisure time has increased, the device ecosystem has grown phenomenally, and consumers want to watch premium content whenever they want, wherever they are, and on whatever device they prefer. We need to be constantly adapting and innovating as a result of this change.

The Growth Engineering team is responsible for executing growth initiatives that help us anticipate and adapt to this change. In particular, it’s our job to design and build the systems and protocols that enable customers from all over the world to sign up for Netflix with the plan features and incentives that best suit their needs. For more background on Growth Engineering and the signup funnel, please have a look at our previous blog post that covers the basics. Alternatively, here’s a quick review of what the typical user journey for a signup looks like:

Signup Funnel Dynamics

There are 3 steps in a basic Netflix signup. We refer to these steps that comprise a user journey as a signup flow. Each step of the flow serves a distinct purpose.

  1. Introduction and account creation
    Highlight our value propositions and begin the account creation process.
  2. Plans & offers
    Highlight the various types of Netflix plans, along with any potential offers.
  3. Payment
    Highlight the various payment options we have so customers can choose what suits their needs best.

The primary focus for the remainder of this post will be step 2: plans & offers. In particular, we’ll define plans and offers, review the legacy architecture and some of its shortcomings, and dig into our new architecture and some of its advantages.

Plans & Offers

Definitions

Let’s define what a plan and an offer is at Netflix. A plan is essentially a set of features with a price.

An offer is an incentive that typically involves a monetary discount or superior product features for a limited amount of time. Broadly speaking, an offer consists of one or more incentives and a set of attributes.

When we merge these two concepts together and present them to the customer, we have the plan selection page (shown above). Here, you can see that we have 3 plans and a 30-day free trial offer, regardless of which plan you choose. Let’s take a deeper look at the architecture, protocols, and systems involved.

Legacy Architecture

As previously mentioned, Netflix has had a relatively static set of plans and offers since the inception of streaming. As a result of this simple product offering, the architecture was also quite straightforward. It consisted of a small set of XML files that were loaded at runtime and stored in local memory. This was a perfectly sufficient design for many years. However, there are some downsides as the company continues to grow and the product continues to evolve. To name a few:

  • Updating XML files is error-prone and manual in nature.
  • A full deployment of the service is required whenever the XML files are updated.
  • Updating the XML files requires engaging domain experts from the backend engineering team that owns these files. This pulls them away from other business-critical work and can be a distraction.
  • A flat domain object structure that resulted in client-side logic in order to extract relevant plan and offer information in order to render the UI. For example, consider the data structure for a 30 day free trial on the Basic plan.
{
"offerId": 123,
"planId": 111,
"price": "$8.99",
"hasSD": true,
"hasHD": false,
"hasFreeTrial": true,
etc…
}
  • As the company matures and our product offering adapts to our global audience, all of the above issues are exacerbated further.

Below is a visual representation of the various systems involved in retrieving plan and offer data. Moving forward, we’ll refer to the combination of plan and offer data simply as SKU (Stock Keeping Unit) data.

New Architecture

If you recall from our previous blog post, Growth Engineering owns the business logic and protocols that allow our UI partners to build lightweight and flexible applications for almost any platform. This implies that the presentation layer should be void of any business logic and should simply be responsible for rendering data that is passed to it. In order to accomplish this we have designed a microservice architecture that emphasizes the Separation of Concerns design principle. Consider the updated system interaction diagram below:

There are 2 noteworthy changes that are worth discussing further. First, notice the presence of a dedicated SKU Eligibility Service. This service contains specialized business logic that used to be part of the Orchestration Service. By migrating this logic to a new microservice we simplify the Orchestration Service, clarify ownership over the domain, and unlock new use cases since it is now possible for other services not shown in this diagram to also consume eligible SKU data.

Second, notice that the SKU Service has been extended to a platform, which now leverages a rules engine and SKU catalog DB. This platform unlocks tremendous business value since product-oriented teams are now free to use the platform to experiment with different product offerings for our global audience, with little to no code changes required. This means that engineers can spend less time doing tedious work and more time designing creative solutions to better prepare us for future needs. Let’s take a deeper look at the role of each service involved in retrieving SKU data, starting from the visitor’s device and working our way down the stack.

Step 1 — Device sends a request for the plan selection page
As discussed in our previous Growth Engineering blog post, we use a custom JSON protocol between our client UIs and our middle-tier Orchestration Service. An example of what this protocol might look like for a browser request to retrieve the plan selection page shown above might look as follows:

GET /plans
{
“flow”: “browser”,
“mode”: “planSelection”
}

As you can see, there are 2 critical pieces of information in this request:

  • Flow — The flow is a way to identify the platform. This allows the Orchestration Service to route the request to the appropriate platform-specific request handling logic.
  • Mode — This is essentially the name of the page being requested.

Given the flow and mode, the Orchestration Service can then process the request.

Step 2 — Request is routed to the Orchestration Service for processing
The Orchestration Service is responsible for validating upstream requests, orchestrating calls to downstream services, and composing JSON responses during a signup flow. For this particular request the Orchestration Service needs to retrieve the SKU data from the SKU Eligibility Service and build the JSON response that can be consumed by the UI layer.

The JSON response for this request might look something like below. Notice the difference in data structures from the legacy implementation. This new contextual representation facilitates greater reuse, as well as potentially supporting offers other than a 30 day free trial:

{
“flow”: “browser”,
“mode”: “planSelection”,
“fields”: {
“skus”: [
{
“id”: 123,
“incentives”: [“FREE_TRIAL”],
“plan”: {
“name”: “Basic”,
“quality”: “SD”,
“price” : “$8.99”,
...
}
...
},
{
“id”: 456,
“incentives”: [“FREE_TRIAL”],
“plan”: {
“name”: “Standard”,
“quality”: “HD”,
“price” : “$13.99”,
...
}
...
},
{
“id”: 789,
“incentives”: [“FREE_TRIAL”],
“plan”: {
“name”: “Premium”,
“quality”: “UHD”,
“price” : “$17.99”,
...
}
...
}
],
“selectedSku”: {
“type”: “Numeric”,
“value”: 789
}
"nextAction": {
"type": "Action"
"withFields": [
"selectedSku"
]
}
}
}

As you can see, the response contains a list of SKUs, the selected SKU, and an action. The action corresponds to the button on the page and the withFields specify which fields the server expects to have sent back when the button is clicked.

Step 3 & 4 — Determine eligibility and retrieve eligible SKUs from SKU Eligibility Service
Netflix is a global company and we often have different SKUs in different regions. This means we need to distinguish between availability of SKUs and eligibility for SKUs. You can think of eligibility as something that is applied at the user level, while availability is at the country level. The SKU Platform contains the global set of SKUs and as a result, is said to control the availability of SKUs. Eligibility for SKUs is determined by the SKU Eligibility Service. This distinction creates clear ownership boundaries and enables the Growth Engineering team to focus on surfacing the correct SKUs for our visitors.

This centralization of eligibility logic in the SKU Eligibility Service also enables innovation in different parts of the product that have traditionally been ignored. Different services can now interface directly with the SKU Eligibility Service in order to retrieve SKU data.

Step 5 — Retrieve eligible SKUs from SKU Platform
The SKU Platform consists of a rules engine, a database, and application logic. The database contains the plans, prices and offers. The rules engine provides a means to extract available plans and offers when certain conditions within a rule match. Let’s consider a simple example where we attempt to retrieve offers in the US.

Keeping the Separation of Concerns in mind, notice that the SKU Platform has only one core responsibility. It is responsible for managing all Netflix SKUs. It provides access to these SKUs via a simple API that takes customer context and attempts to match it against the set of SKU rules. SKU eligibility is computed upstream and is treated just as any other condition would be in the SKU ruleset. By not coupling the concepts of eligibility and availability into a single service, we enable increased developer productivity since each team is able to focus on their core competencies and any change in eligibility does not affect the SKU Platform. One of the core tenets of a platform is the ability to support self-service. This negates the need to engage the backend domain experts for every desired change. The SKU Platform supports this via lightweight configuration changes to rules that do not require a full deployment. The next step is to invest further into self-service and support rule changes via a SKU UI. Stay tuned for more details on this, as well as more details on the internals of the new SKU Platform in one of our upcoming blog posts.

Conclusion

This work was a large cross-functional effort. We rebuilt our offers and plans from the ground up. It resulted in systems changes, as well as interaction changes between teams. Where there was once ambiguity, we now have clearly defined ownership over SKU availability and eligibility. We are now capable of introducing new plans and offers in various markets around the globe in order to meet our customer’s needs, with minimal engineering effort.

Let’s review some of the advantages the new architecture has over the legacy implementation. To name a few:

  • Domain objects that have a more reusable and extensible “shape”. This shape facilitates code reuse at the UI layer as well as the service layers.
  • A SKU Platform that enables product innovation with minimal engineering involvement. This means engineers can focus on more challenging and creative solutions for other problems. It also means fewer engineering teams are required to support initiatives in this space.
  • Configuration instead of code for updating SKU data, which improves innovation velocity.
  • Lower latency as a result of fewer service calls, which means fewer errors for our visitors.

The world is constantly changing. Device capabilities continue to improve. How, when, and where people want to be entertained continues to evolve. With these types of continued investments in infrastructure, the Growth Engineering team is able to build a solid foundation for future innovations that will allow us to continue to deliver the best possible experience for our members.

Join Growth Engineering and help us build the next generation of services that will allow the next 200 million subscribers to experience the joy of Netflix.


Growth Engineering at Netflix- Creating a Scalable Offers Platform was originally published in Netflix TechBlog on Medium, where people are continuing the conversation by highlighting and responding to this story.