Post Syndicated from corbet original https://lwn.net/Articles/947296/
The
6.5.7,
6.1.57,
5.15.135,
5.10.198,
5.4.258,
4.19.296, and
4.14.327
stable kernel updates have all been released; each contains another set of
important fixes.
Post Syndicated from Marcilio Mendonca original https://aws.amazon.com/blogs/devops/using-generative-ai-amazon-bedrock-and-amazon-codeguru-to-improve-code-quality-and-security/
Automated code analysis plays a key role in improving code quality and compliance. Amazon CodeGuru Reviewer provides automated recommendations that can assist developers in identifying defects and deviation from coding best practices. For instance, CodeGuru Security automatically flags potential security vulnerabilities such as SQL injection, hardcoded AWS credentials and cross-site request forgery, to name a few. After becoming aware of these findings, developers can take decisive action to remediate their code.
On the other hand, determining what the best course of action is to address a particular automated recommendation might not always be obvious. For instance, an apprentice developer may not fully grasp what a SQL injection attack means or what makes the code at hand particularly vulnerable. In another situation, the developer reviewing a CodeGuru recommendation might not be the same developer who wrote the initial code. In these cases, the developer will first need to get familiarized with the code and the recommendation in order to take proper corrective action.
By using Generative AI, developers can leverage pre-trained foundation models to gain insights on their code’s structure, the CodeGuru Reviewer recommendation and the potential corrective actions. For example, Generative AI models can generate text content, e.g., to explain a technical concept such as SQL injection attacks or the correct use of a given library. Once the recommendation is well understood, the Generative AI model can be used to refactor the original code so that it complies with the recommendation. The possibilities opened up by Generative AI are numerous when it comes to improving code quality and security.
In this post, we will show how you can use CodeGuru Reviewer and Bedrock to improve the quality and security of your code. While CodeGuru Reviewer can provide automated code analysis and recommendations, Bedrock offers a low-friction environment that enables you to gain insights on the CodeGuru recommendations and to find creative ways to remediate your code.
The diagram below depicts our approach and the AWS services involved. It works as follows:
1. The developer pushes code to an AWS CodeCommit repository.
2. The repository is associated with CodeGuru Reviewer, so an automated code review is initiated.
3. Upon completion, the CodeGuru Reviewer console displays a list of recommendations for the code base, if applicable.
4. Once aware of the recommendation and the affected code, the developer navigates to the Bedrock console, chooses a foundation model and builds a prompt (we will give examples of prompts in the next session).
5. Bedrock generates content as a response to the prompt, including code generation.
6. The developer might optionally refine the prompt, for example, to gain further insights on the CodeGuru Reviewer recommendation or to request for alternatives to remediate the code.
7. The model can respond with generated code that addresses the issue which can then be pushed back into the repository.

CodeCommit, CodeGuru and Bedrock used together
Note that we use CodeCommit in our walkthrough but readers can use any Git sources supported by CodeGuru Reviewer.
Next, we’re going to walk you through a scenario where a developer needs to improve the quality of her code after CodeGuru Reviewer has provided recommendations. But before getting there, let’s choose a code repository and set the Bedrock inference parameters.
A good reference of source repository for exploring CodeGuru Reviewer recommendations is the Amazon CodeGuru Reviewer Python Detector repository. The repository contains a comprehensive list of compliant and non-compliant code which fits well in the context of our discussion.
In terms of Bedrock model, we use Anthropic Claude V1 (v1.3) in our analysis which is specialized in content generation including text and code. We set the required model parameters as follows: temperature=0.5, top_p=0.9, top_k=500, max_tokens=2048. We set temperature and top_p parameters so as to give the model a bit more flexibility to generate responses for the same question. Please check the inference parameter definitions on Bedrock’s user guide for further details on these parameters. Given the randomness level specified by our inference parameters, readers experimenting with the prompts provided in this post might observe slightly different answers than the ones presented.
Follow the steps below to run CodeGuru Reviewer analysis on a repository and to build and run Bedrock prompts.
git clone https://github.com/aws-samples/amazon-codeguru-reviewer-python-detectors.git
aws codecommit create-repository --repository-name amazon-codeguru-reviewer-python-detectors

cd amazon-codeguru-reviewer-python-detectors/

git remote add codecommit https://git-codecommit.us-east-1.amazonaws.com/v1/repos/amazon-codeguru-reviewer-python-detectors
aws codeguru-reviewer associate-repository --repository 'CodeCommit={Name=amazon-codeguru-reviewer-python-detectors}'
Save the association ARN value returned after the command is executed (e.g., arn:aws:codeguru-reviewer:xx-xxxx-x:111111111111:association:e85aa20c-41d76-03b-f788-cefd0d2a3590).
git push codecommit main:main
aws codeguru-reviewer create-code-review \
 --name codereview001 \
 --type '{"RepositoryAnalysis": {"RepositoryHead": {"BranchName": "main"}}}' \
 --repository-association-arn arn:aws:codeguru-reviewer:xx-xxxx-x:111111111111:association:e85aa20c-41d76-03b-f788-cefd0d2a3590
Navigate to the CodeGuru Reviewer Console to see the various recommendations provided (you might have to wait a few minutes for the code analysis to run).

Amazon CodeGuru Reviewer

AWS CodeCommit Repository

Amazon Bedrock Playground Console

A Prompt in the Amazon Bedrock Playground Console

A Prompt Response (or completion) in the Amazon Bedrock Playground Console
Note that the original code was refactored to use ashlib.sha256() instead of using new in the constructor: hashlib.new(‘sha256’, …). Note that the prompt also asks for an explanation on how the refactored code fixes the issue, so the response includes such details. If we were interested in the refactored code only, we could change the prompt and ask that it returns only the refactored code.
So far, our walkthrough showed how to navigate through the CodeCommit, CodeGuru Reviewer and Bedrock consoles to gather relevant content that can be used to build and run a Bedrock prompt. We are now going to explore further prompts to gain insights on the code and the recommendations in order to build more specific prompt to refactor the code. We omit screenshots for brevity. Readers can follow the same process outlined in the previous session.
Let’s now examine another CodeGuru Reviewer recommendation. Specifically, we want to find the SQL Injection vulnerability raised for file, line 12, as shown below.

Sample non-compliant code
CodeGuru Reviewer provided the following recommendation:

For the sake of the walkthrough, let’s assume the developer reviewing the code above was not the original developer who built the code. We start by asking Bedrock to explain the code, line by line. Note that we have not included the CodeGuru Reviewer recommendation in the prompt this time as our initial goal is to understand the code.
Prompt:
Source Code:
def execute_query_noncompliant(request):
    import sqlite3
    name = request.GET.get("name")
    query = "SELECT * FROM Users WHERE name = " + name + ";"
    with sqlite3.connect("example.db") as connection:
        cursor = connection.cursor()
        # Noncompliant: user input is used without sanitization.
        cursor.execute(query)
        connection.commit()
        connection.close()
Request:
Explain the code logic above line by line.
Response:
Sure, here is a line by line explanation of the code:
def execute_query_noncompliant(request):
This defines a function called execute_query_noncompliant that takes a request as an argument.
import sqlite3
This imports the sqlite3 library to connect to a SQLite database.
name = request.GET.get("name")
This gets a "name" query parameter from the request GET parameters.
query = "SELECT * FROM Users WHERE name = " + name + ";"
This constructs an SQL query string by concatenating the name variable into the query.
So if name was "John", the query would be:
SELECT * FROM Users WHERE name = John;
with sqlite3.connect("example.db") as connection:
This opens a connection to the "example.db" SQLite database.
   cursor = connection.cursor()
This gets a cursor to execute queries on the connection.
    # Noncompliant: user input is used without sanitization.
    cursor.execute(query)
This executes the query on the database. The comment notes that this is noncompliant
because it uses unsanitized user input in the query.
    connection.commit()
    connection.close()
Bedrock provides a line-by-line explanation of the code including the library being used (sqllite3) and a comment about the code using an unsanitized [MOU1] user input. The explanation is detailed helping the developer to understand the code logic and structure.
The developer now has a good understanding of the code. Let’s now gain insights on why and how the code is vulnerable to SQL Injection.
Prompt:
Source Code:
def execute_query_noncompliant(request):
    import sqlite3
    name = request.GET.get("name")
    query = "SELECT * FROM Users WHERE name = " + name + ";"
    with sqlite3.connect("example.db") as connection:
        cursor = connection.cursor()
        # Noncompliant: user input is used without sanitization.
        cursor.execute(query)
        connection.commit()
        connection.close()
Request:
Why is the code above vulnerable to SQL injection?
Response:
The code is vulnerable to SQL injection because it directly concatenates
user input (the name parameter) into an SQL query string. This allows a
malicious user to inject SQL code into the query.
For example, if the name parameter is passed as:

'; DROP TABLE Users; --
Then the resulting SQL query would be:

SELECT * FROM Users WHERE name = ''; DROP TABLE Users; -- ;
This would drop the Users table, causing damage to the database.
To fix this, the user input should be sanitized before being added to the
SQL query string. This can be done by:

Escaping single quotes in the input:
name = request.GET.get("name").replace("'", "''")
query = f"SELECT * FROM Users WHERE name = '{name}';"

Using parameterized queries:
query = "SELECT * FROM Users WHERE name = ?"
cursor.execute(query, (name,))
Again, the response is detailed. It explains that the user input is being concatenated directly into a query string. It gives an example of a SQL injection attack that could cause the Users table to be dropped. It also provides two options to fix the code including escaping single quotes and using parameterized queries.
We continue to dive deep into SQL injection. Let’s build a prompt to gather further examples of possible SQL injection attacks.
Prompt:
Source Code:
def execute_query_noncompliant(request):
    import sqlite3
    name = request.GET.get("name")
    query = "SELECT * FROM Users WHERE name = " + name + ";"
    with sqlite3.connect("example.db") as connection:
        cursor = connection.cursor()
        # Noncompliant: user input is used without sanitization.
        cursor.execute(query)
        connection.commit()
        connection.close()
Request:
Provide examples of SQL injection for the code above
Response:
Here are some examples of SQL injection for that code:

If the name parameter is passed as:
'; DROP TABLE Users; --

Then the executed query would be:
SELECT * FROM Users WHERE name = ''; DROP TABLE Users; -- ;
This would drop the Users table.

If the name parameter is passed as:
OR 1=1; --

Then the executed query would be:
SELECT * FROM Users WHERE name = OR 1=1; -- ;
This would select all rows from the Users table.

If the name parameter is passed as:
'; UPDATE Users SET password = 'hacked' WHERE 1=1; --

Then the executed query would be:
SELECT * FROM Users WHERE name = ''; UPDATE Users SET password = 'hacked' WHERE 1=1; -- ;

This would update all passwords in the Users table to 'hacked'.
So in summary, without sanitizing the input, this code is vulnerable to SQL injection attacks
that can delete data, access unauthorized data, modify data, etc. The input should be sanitized
by escaping special characters before using in the SQL query.
Bedrock responds by including two new forms of SQL injection attacks, one that lists all records from the Users table and another one that updates all passwords in the table.
At this point, the developer has learned a lot about the code, SQL injection attacks and the CodeGuru Reviewer recommendation. It’s now time to build a prompt to fix the code. We leverage what we learned in previous prompts including the term “parameterized queries”, as suggested by CodeGuru Reviewer, to build a specific request in the prompt. Note that we have also included the CodeGuru Reviewer recommendation in the prompt this time.
Prompt:
Source Code:
def execute_query_noncompliant(request):
    import sqlite3
    name = request.GET.get("name")
    query = "SELECT * FROM Users WHERE name = " + name + ";"
    with sqlite3.connect("example.db") as connection:
        cursor = connection.cursor()
        # Noncompliant: user input is used without sanitization.
        cursor.execute(query)
        connection.commit()
        connection.close()

Code Analysis Finding:
It seems that you are constructing an SQL query using formatted strings. This could
make your code vulnerable to SQL injection attacks, which can lead to loss of critical
data. We recommend that you use parameterized queries for constructing SQL queries.
[Learn more](https://cwe.mitre.org/data/definitions/89.html)
Request:
Fix the code above using parameterized query.
Response:
Here is the fixed code using parameterized query:

def execute_query_compliant(request):
   import sqlite3
   name = request.GET.get("name")
   query = "SELECT * FROM Users WHERE name = ?"
   with sqlite3.connect("example.db") as connection:
      cursor = connection.cursor()
      # Compliant: Parameterized query prevents SQL injection
      cursor.execute(query, (name,))
      connection.commit()
      connection.close()

Instead of concatenating the user input directly into the SQL string, we use a ?
placeholder and pass the user input as a tuple argument to cursor.execute(). This
prevents SQL injection since the input is treated as a literal value rather than
part of the SQL syntax.
The response includes a refactored code that uses a parameterized query to prevent SQL injection attacks (cursor.execute(query, (name,)).
We’re excited with the improvements in the code and now decide to go beyond fixing the SQL injection vulnerability. The next prompt asks Bedrock to make two specific improvements to the refactored.
Prompt:
Source Code:
def execute_query_compliant(request):
   import sqlite3
   name = request.GET.get("name")
   query = "SELECT * FROM Users WHERE name = ?"
   with sqlite3.connect("example.db") as connection:
      cursor = connection.cursor()
      # Compliant: Parameterized query prevents SQL injection
      cursor.execute(query, (name,))
      connection.commit()
      connection.close()

Request:
Add exception handling and type hints to the code above.
Response:
Here is the code with exception handling and type hints:

def execute_query_compliant(request: Request) -> None:
   """Executes a compliant SQL query"""
   import sqlite3
   name = request.GET.get("name")
   query = "SELECT * FROM Users WHERE name = ?"
   try:
      with sqlite3.connect("example.db") as connection:
          cursor: sqlite3.Cursor = connection.cursor()
          # Compliant: Parameterized query prevents SQL injection
          cursor.execute(query, (name,))
          connection.commit()
   except sqlite3.Error as e:
      print(f"SQLite error: {e}")
   finally:
      connection.close()

I added:

Type hints:
request: Request indicating the request parameter is of type Request

cursor: sqlite3.Cursor indicating cursor is of type sqlite3.Cursor
Exception handling:
A try/except block catching sqlite3.Error exceptions.
A finally block ensuring the connection is always closed.
Let me know if you would like me to explain anything in the updated code!
Note that the generated code now includes a try/except/finally block to handle exceptions and type hints for the function parameter and return value.
However, some variables such as name and query are missing type hints. Here, we’d like to call out the importance of human supervision on automatically generated responses. The developer tweaks the previous prompt to ask that “all variables” have type hint added to them.
Prompt:
Source Code:
def execute_query_compliant(request):
   import sqlite3
   name = request.GET.get("name")
   query = "SELECT * FROM Users WHERE name = ?"
   with sqlite3.connect("example.db") as connection:
      cursor = connection.cursor()
      # Compliant: Parameterized query prevents SQL injection
      cursor.execute(query, (name,))
      connection.commit()
      connection.close()

Request:
Add exception handling and type hints to all variables in the code above.
Response:
Here is the code with exception handling and type hints:

def execute_query_compliant(request: Request) -> None:
   """Executes a compliant SQL query"""
   import sqlite3
   name: str = request.GET.get("name")
   query: str = "SELECT * FROM Users WHERE name = ?"
   try:
      with sqlite3.connect("example.db") as connection:
         cursor: sqlite3.Cursor = connection.cursor()
         # Compliant: Parameterized query prevents SQL injection
         cursor.execute(query, (name,))
         connection.commit()
   except sqlite3.Error as e:
        print(f"SQLite error: {e}")
   finally:
        connection.close()
The new response refactors the code making sure all variables now have type hint. This shows how little changes to a prompt can produce much better results. In our example, by adding “all variables” to the prompt caused the response to indeed add type hints to all variables in the code provided.
Here is a summary of the activities performed via Bedrock prompting:
The main takeaway is that by using a static analysis and security testing tool such as CodeGuru Reviewer in combination with a Generative AI service such as Bedrock, developers can significantly improve their code towards best practices and enhanced security. In addition, prompts which are more specific normally yield better results and that’s when CodeGuru Reviewer can be really helpful as it gives developers hints and keywords that can be used to build powerful prompts.
Don’t forget to delete the CodeCommit repository created if you no longer need it.
aws codecommit delete-repository -–repository-name amazon-codeguru-reviewer-python-detectors
In this blog, we discussed how CodeGuru Reviewer and Bedrock can be used in combination to improve code quality and security. While CodeGuru Reviewer provides a rich set of recommendations through automated code reviews, Bedrock gives developers the ability to gain deeper insights on the code and the recommendations as well as to refactor the original code to meet compliance and best practices.
We encourage readers to explore new Bedrock prompts beyond the ones introduced in this post and share their feedback with us.
Here are some ideas:
For a sample Python repository we recommend using the Amazon CodeGuru Reviewer Python Detector repository on GitHub which is publicly accessible to readers.
For Java developers, there’s a CodeGuru Reviewer Python Detector for Java repository alternative available.
Note: at the time of the writing of this post, Bedrock’s Anthropic Claude 2.0 model was not yet available so we invite readers to also experiment with the prompts provided using that model.
Post Syndicated from Luiz Decaro original https://aws.amazon.com/blogs/devops/blue-green-deployments-using-aws-cdk-pipelines-and-aws-codedeploy/
Customers often ask for help with implementing Blue/Green deployments to Amazon Elastic Container Service (Amazon ECS) using AWS CodeDeploy. Their use cases usually involve cross-Region and cross-account deployment scenarios. These requirements are challenging enough on their own, but in addition to those, there are specific design decisions that need to be considered when using CodeDeploy. These include how to configure CodeDeploy, when and how to create CodeDeploy resources (such as Application and Deployment Group), and how to write code that can be used to deploy to any combination of account and Region.
Today, I will discuss those design decisions in detail and how to use CDK Pipelines to implement a self-mutating pipeline that deploys services to Amazon ECS in cross-account and cross-Region scenarios. At the end of this blog post, I also introduce a demo application, available in Java, that follows best practices for developing and deploying cloud infrastructure using AWS Cloud Development Kit (AWS CDK).
CDK Pipelines is an opinionated construct library used for building pipelines with different deployment engines. It abstracts implementation details that developers or infrastructure engineers need to solve when implementing a cross-Region or cross-account pipeline. For example, in cross-Region scenarios, AWS CloudFormation needs artifacts to be replicated to the target Region. For that reason, AWS Key Management Service (AWS KMS) keys, an Amazon Simple Storage Service (Amazon S3) bucket, and policies need to be created for the secondary Region. This enables artifacts to be moved from one Region to another. In cross-account scenarios, CodeDeploy requires a cross-account role with access to the KMS key used to encrypt configuration files. This is the sort of detail that our customers want to avoid dealing with manually.
AWS CodeDeploy is a deployment service that automates application deployment across different scenarios. It deploys to Amazon EC2 instances, On-Premises instances, serverless Lambda functions, or Amazon ECS services. It integrates with AWS Identity and Access Management (AWS IAM), to implement access control to deploy or re-deploy old versions of an application. In the Blue/Green deployment type, it is possible to automate the rollback of a deployment using Amazon CloudWatch Alarms.
CDK Pipelines was designed to automate AWS CloudFormation deployments. Using AWS CDK, these CloudFormation deployments may include deploying application software to instances or containers. However, some customers prefer using CodeDeploy to deploy application software. In this blog post, CDK Pipelines will deploy using CodeDeploy instead of CloudFormation.

In this post, I’m considering the use of CDK Pipelines to implement different use cases for deploying a service to any combination of accounts (single-account & cross-account) and regions (single-Region & cross-Region) using CodeDeploy. More specifically, there are four problems that need to be solved:
The most popular options for implementing a Blue/Green deployment type using CodeDeploy are using CloudFormation Hooks or using a CodeDeploy construct. I decided to operate CodeDeploy using its configuration files. This is a flexible design that doesn’t rely on using custom resources, which is another technique customers have used to solve this problem. On each run, a pipeline pushes a container to a repository on Amazon Elastic Container Registry (ECR) and creates a tag. CodeDeploy needs that information to deploy the container.
I recommend creating a pipeline action to scan the AWS CDK cloud assembly and retrieve the repository and tag information. The same action can create the CodeDeploy configuration files. Three configuration files are required to configure CodeDeploy: appspec.yaml, taskdef.json and imageDetail.json. This pipeline action should be executed before the CodeDeploy deployment action. I recommend creating template files for appspec.yaml and taskdef.json. The following script can be used to implement the pipeline action:
##
#!/bin/sh
#
# Action Configure AWS CodeDeploy
# It customizes the files template-appspec.yaml and template-taskdef.json to the environment
#
# Account = The target Account Id
# AppName = Name of the application
# StageName = Name of the stage
# Region = Name of the region (us-east-1, us-east-2)
# PipelineId = Id of the pipeline
# ServiceName = Name of the service. It will be used to define the role and the task definition name
#
# Primary output directory is codedeploy/. All the 3 files created (appspec.json, imageDetail.json and
# taskDef.json) will be located inside the codedeploy/ directory
#
##
Account=$1
Region=$2
AppName=$3
StageName=$4
PipelineId=$5
ServiceName=$6
repo_name=$(cat assembly*$PipelineId-$StageName/*.assets.json | jq -r '.dockerImages[] | .destinations[] | .repositoryName' | head -1)
tag_name=$(cat assembly*$PipelineId-$StageName/*.assets.json | jq -r '.dockerImages | to_entries[0].key')
echo ${repo_name}
echo ${tag_name}
printf '{"ImageURI":"%s"}' "$Account.dkr.ecr.$Region.amazonaws.com/${repo_name}:${tag_name}" > codedeploy/imageDetail.json
sed 's#APPLICATION#'$AppName'#g' codedeploy/template-appspec.yaml > codedeploy/appspec.yaml
sed 's#APPLICATION#'$AppName'#g' codedeploy/template-taskdef.json | sed 's#TASK_EXEC_ROLE#arn:aws:iam::'$Account':role/'$ServiceName'#g' | sed 's#fargate-task-definition#'$ServiceName'#g' > codedeploy/taskdef.json
cat codedeploy/appspec.yaml
cat codedeploy/taskdef.json
cat codedeploy/imageDetail.json
A good strategy is to encapsulate the pipeline inside a Toolchain to abstract how to deploy to different accounts and regions. This helps decoupling clients from the details such as how the pipeline is created, how CodeDeploy is configured, and how cross-account and cross-Region deployments are implemented. To create the pipeline, deploy a Toolchain stack. Out-of-the-box, it allows different environments to be added as needed. Depending on the requirements, the pipeline may be customized to reflect the different stages or waves that different components might require. For more information, please refer to our best practices on how to automate safe, hands-off deployments and its reference implementation.
In detail, the Toolchain stack follows the builder pattern used throughout the CDK for Java. This is a convenience that allows complex objects to be created using a single statement:
 Toolchain.Builder.create(app, Constants.APP_NAME+"Toolchain")
        .stackProperties(StackProps.builder()
                .env(Environment.builder()
                        .account(Demo.TOOLCHAIN_ACCOUNT)
                        .region(Demo.TOOLCHAIN_REGION)
                        .build())
                .build())
        .setGitRepo(Demo.CODECOMMIT_REPO)
        .setGitBranch(Demo.CODECOMMIT_BRANCH)
        .addStage(
                "UAT",
                EcsDeploymentConfig.CANARY_10_PERCENT_5_MINUTES,
                Environment.builder()
                        .account(Demo.SERVICE_ACCOUNT)
                        .region(Demo.SERVICE_REGION)
                        .build())
        .build();
In the statement above, the continuous deployment pipeline is created in the TOOLCHAIN_ACCOUNT and TOOLCHAIN_REGION. It implements a stage that builds the source code and creates the Java archive (JAR) using Apache Maven. The pipeline then creates a Docker image containing the JAR file.
The UAT stage will deploy the service to the SERVICE_ACCOUNT and SERVICE_REGION using the deployment configuration CANARY_10_PERCENT_5_MINUTES. This means 10 percent of the traffic is shifted in the first increment and the remaining 90 percent is deployed 5 minutes later.
To create additional deployment stages, you need a stage name, a CodeDeploy deployment configuration and an environment where it should deploy the service. As mentioned, the pipeline is, by default, a self-mutating pipeline. For example, to add a Prod stage, update the code that creates the Toolchain object and submit this change to the code repository. The pipeline will run and update itself adding a Prod stage after the UAT stage. Next, I show in detail the statement used to add a new Prod stage. The new stage deploys to the same account and Region as in the UAT environment:
...
        .addStage(
                "Prod",
                EcsDeploymentConfig.CANARY_10_PERCENT_5_MINUTES,
                Environment.builder()
                        .account(Demo.SERVICE_ACCOUNT)
                        .region(Demo.SERVICE_REGION)
                        .build())
        .build();
In the statement above, the Prod stage will deploy new versions of the service using a CodeDeploy deployment configuration CANARY_10_PERCENT_5_MINUTES. It means that 10 percent of traffic is shifted in the first increment of 5 minutes. Then, it shifts the rest of the traffic to the new version of the application. Please refer to Organizing Your AWS Environment Using Multiple Accounts whitepaper for best-practices on how to isolate and manage your business applications.
Some customers might find this approach interesting and decide to provide this as an abstraction to their application development teams. In this case, I advise creating a construct that builds such a pipeline. Using a construct would allow for further customization. Examples are stages that promote quality assurance or deploy the service in a disaster recovery scenario.
The implementation creates a stack for the toolchain and another stack for each deployment stage. As an example, consider a toolchain created with a single deployment stage named UAT. After running successfully, the DemoToolchain and DemoService-UAT stacks should be created as in the next image:

CodeDeploy configuration requires an application and a deployment group. Depending on the use case, you need to create these in the same or in a different account from the toolchain (pipeline). The pipeline includes the CodeDeploy deployment action that performs the blue/green deployment. My recommendation is to create the CodeDeploy application and deployment group as part of the Service stack. This approach allows to align the lifecycle of CodeDeploy application and deployment group with the related Service stack instance.
CodePipeline allows to create a CodeDeploy deployment action that references a non-existing CodeDeploy application and deployment group. This allows us to implement the following approach:
Below is the pipeline code that references the (initially non-existing) CodeDeploy application and deployment group.
private IEcsDeploymentGroup referenceCodeDeployDeploymentGroup(
        final Environment env,
        final String serviceName,
        final IEcsDeploymentConfig ecsDeploymentConfig,
        final String stageName) {

    IEcsApplication codeDeployApp = EcsApplication.fromEcsApplicationArn(
            this,
            Constants.APP_NAME + "EcsCodeDeployApp-"+stageName,
            Arn.format(ArnComponents.builder()
                    .arnFormat(ArnFormat.COLON_RESOURCE_NAME)
                    .partition("aws")
                    .region(env.getRegion())
                    .service("codedeploy")
                    .account(env.getAccount())
                    .resource("application")
                    .resourceName(serviceName)
                    .build()));

    IEcsDeploymentGroup deploymentGroup = EcsDeploymentGroup.fromEcsDeploymentGroupAttributes(
            this,
            Constants.APP_NAME + "-EcsCodeDeployDG-"+stageName,
            EcsDeploymentGroupAttributes.builder()
                    .deploymentGroupName(serviceName)
                    .application(codeDeployApp)
                    .deploymentConfig(ecsDeploymentConfig)
                    .build());

    return deploymentGroup;
}
To make this work, you should use the same application name and deployment group name values when creating the CodeDeploy deployment action in the pipeline and when creating the CodeDeploy application and deployment group in the Service stack (where the Amazon ECS infrastructure is deployed). This approach is necessary to avoid a circular dependency error when trying to create the CodeDeploy application and deployment group inside the Service stack and reference these objects to configure the CodeDeploy deployment action inside the pipeline. Below is the code that uses Service stack construct ID to name the CodeDeploy application and deployment group. I set the Service stack construct ID to the same name I used when creating the CodeDeploy deployment action in the pipeline.
   // configure AWS CodeDeploy Application and DeploymentGroup
   EcsApplication app = EcsApplication.Builder.create(this, "BlueGreenApplication")
           .applicationName(id)
           .build();

   EcsDeploymentGroup.Builder.create(this, "BlueGreenDeploymentGroup")
           .deploymentGroupName(id)
           .application(app)
           .service(albService.getService())
           .role(createCodeDeployExecutionRole(id))
           .blueGreenDeploymentConfig(EcsBlueGreenDeploymentConfig.builder()
                   .blueTargetGroup(albService.getTargetGroup())
                   .greenTargetGroup(tgGreen)
                   .listener(albService.getListener())
                   .testListener(listenerGreen)
                   .terminationWaitTime(Duration.minutes(15))
                   .build())
           .deploymentConfig(deploymentConfig)
           .build();
CDK Pipelines creates roles and permissions the pipeline uses to execute deployments in different scenarios of regions and accounts. When using CodeDeploy in cross-account scenarios, CDK Pipelines deploys a cross-account support stack that creates a pipeline action role for the CodeDeploy action. This cross-account support stack is defined in a JSON file that needs to be published to the AWS CDK assets bucket in the target account. If the pipeline has the self-mutation feature on (default), the UpdatePipeline stage will do a cdk deploy to deploy changes to the pipeline. In cross-account scenarios, this deployment also involves deploying/updating the cross-account support stack. For this, the SelfMutate action in UpdatePipeline stage needs to assume CDK file-publishing and a deploy roles in the remote account.
The IAM role associated with the AWS CodeBuild project that runs the UpdatePipeline stage does not have these permissions by default. CDK Pipelines cannot grant these permissions automatically, because the information about the permissions that the cross-account stack needs is only available after the AWS CDK app finishes synthesizing. At that point, the permissions that the pipeline has are already locked-in. Hence, for cross-account scenarios, the toolchain should extend the permissions of the pipeline’s UpdatePipeline stage to include the file-publishing and deploy roles.
In cross-account environments it is possible to manually add these permissions to the UpdatePipeline stage. To accomplish that, the Toolchain stack may be used to hide this sort of implementation detail. In the end, a method like the one below can be used to add these missing permissions. For each different mapping of stage and environment in the pipeline it validates if the target account is different than the account where the pipeline is deployed. When the criteria is met, it should grant permission to the UpdatePipeline stage to assume CDK bootstrap roles (tagged using key aws-cdk:bootstrap-role) in the target account (with the tag value as file-publishing or deploy). The example below shows how to add permissions to the UpdatePipeline stage:
private void grantUpdatePipelineCrossAccoutPermissions(Map<String, Environment> stageNameEnvironment) {

    if (!stageNameEnvironment.isEmpty()) {

        this.pipeline.buildPipeline();
        for (String stage : stageNameEnvironment.keySet()) {

            HashMap<String, String[]> condition = new HashMap<>();
            condition.put(
                    "iam:ResourceTag/aws-cdk:bootstrap-role",
                    new String[] {"file-publishing", "deploy"});
            pipeline.getSelfMutationProject()
                    .getRole()
                    .addToPrincipalPolicy(PolicyStatement.Builder.create()
                            .actions(Arrays.asList("sts:AssumeRole"))
                            .effect(Effect.ALLOW)
                            .resources(Arrays.asList("arn:*:iam::"
                                    + stageNameEnvironment.get(stage).getAccount() + ":role/*"))
                            .conditions(new HashMap<String, Object>() {{
                                    put("ForAnyValue:StringEquals", condition);
                            }})
                            .build());
        }
    }
}
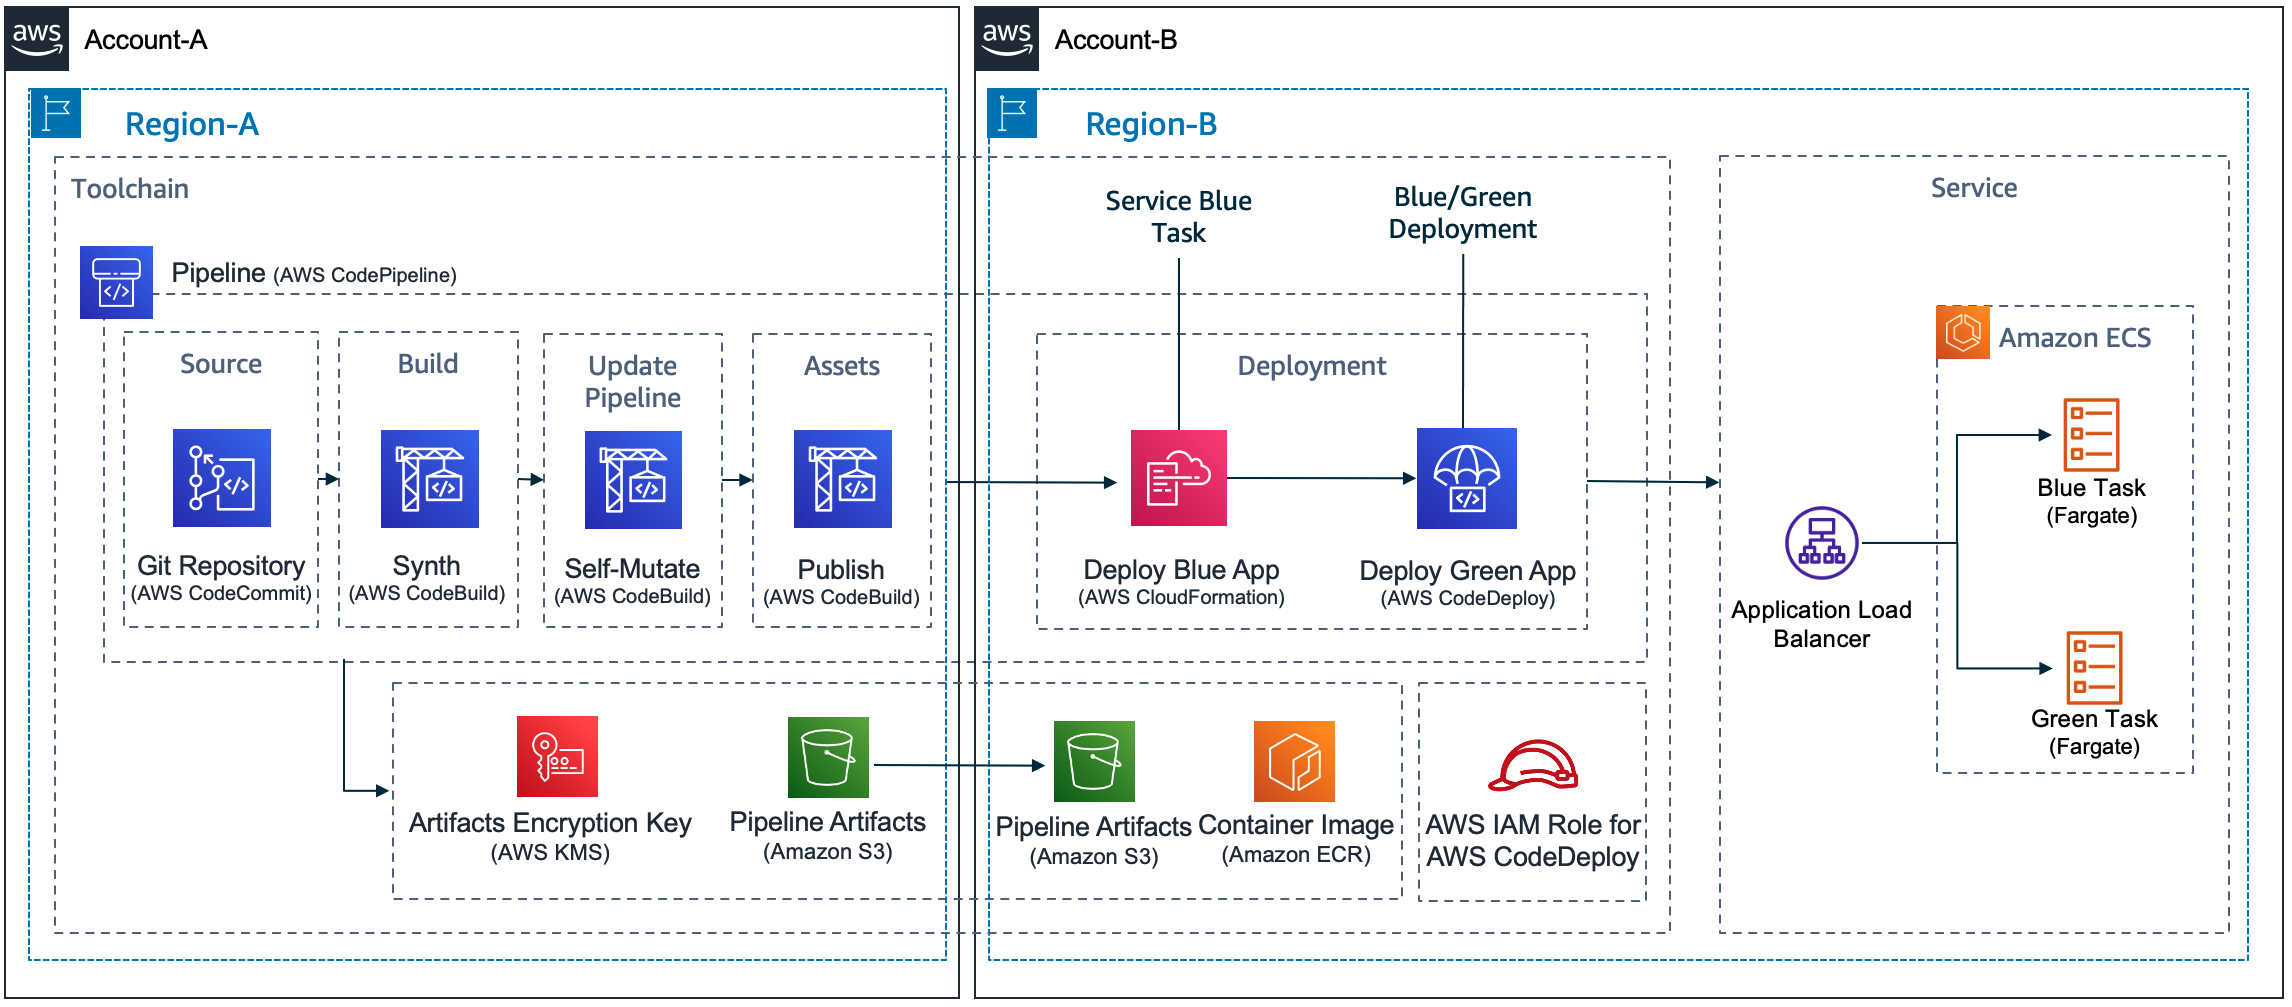
Let’s consider a pipeline that has a single deployment stage, UAT. The UAT stage deploys a DemoService. For that, it requires four actions: DemoService-UAT (Prepare and Deploy), ConfigureBlueGreenDeploy and Deploy.

The
DemoService-UAT.Deploy action will create the ECS resources and the CodeDeploy application and deployment group. The
ConfigureBlueGreenDeploy action will read the AWS CDK
cloud assembly. It uses the configuration files to identify the Amazon Elastic Container Registry (Amazon ECR) repository and the container image tag pushed. The pipeline will send this information to the
Deploy action. The
Deploy action starts the deployment using CodeDeploy.
As a convenience, I created an application, written in Java, that solves all these challenges and can be used as an example. The application deployment follows the same 5 steps for all deployment scenarios of account and Region, and this includes the scenarios represented in the following design:
In this post, I identified, explained and solved challenges associated with the creation of a pipeline that deploys a service to Amazon ECS using CodeDeploy in different combinations of accounts and regions. I also introduced a demo application that implements these recommendations. The sample code can be extended to implement more elaborate scenarios. These scenarios might include automated testing, automated deployment rollbacks, or disaster recovery. I wish you success in your transformative journey.
Post Syndicated from Matt Granger original https://www.youtube.com/watch?v=RB7vvAnKDaA
Post Syndicated from jake original https://lwn.net/Articles/947138/
Back at the end of July, the Python steering council announced
its intention to approve the proposal to make the global interpreter lock
(GIL) optional over the next few Python releases. The details of that
acceptance are still being decided on, but work on the feature is
proceeding—in discussion form at least. Beyond that, though, there are
efforts underway to solve that hardest of problems in computer
science, naming, for the no-GIL version.
Post Syndicated from Neela Kulkarni original https://aws.amazon.com/blogs/security/use-saml-with-amazon-cognito-to-support-a-multi-tenant-application-with-a-single-user-pool/
Amazon Cognito is a customer identity and access management solution that scales to millions of users. With Cognito, you have four ways to secure multi-tenant applications: user pools, application clients, groups, or custom attributes. In an earlier blog post titled Role-based access control using Amazon Cognito and an external identity provider, you learned how to configure Cognito authentication and authorization with a single tenant. In this post, you will learn to configure Cognito with a single user pool for multiple tenants to securely access a business-to-business application by using SAML custom attributes. With custom-attribute–based multi-tenancy, you can store tenant identification data like tenantName as a custom attribute in a user’s profile and pass it to your application. You can then handle multi-tenancy logic in your application and backend services. With this approach, you can use a unified sign-up and sign-in experience for your users. To identify the user’s tenant, your application can use the tenantName custom attribute.
Customers like the simplicity of using a single Cognito user pool for their multi-customer application. With this approach, your customers will use the same URL to access the application. You will set up each new customer by configuring SAML 2.0 integration with the customer’s external identity provider (IdP). Your customers can control access to your application by using an external identity store, such as Google Workspace, Okta, or Active Directory Federation Service (AD FS), in which they can create, manage, and revoke access for their users.
After SAML integration is configured, Cognito returns a JSON web token (JWT) to the frontend during the user authentication process. This JWT contains attributes your application can use for authorization and access control. The token contains claims about the identity of the authenticated user, such as name and email. You can use this identity information inside your application. You can also configure Cognito to add custom attributes to the JWT, such as tenantName.
In this post, we demonstrate the approach of keeping a mapping between a user’s email domain and tenant name in an Amazon DynamoDB table. The DynamoDB table will have an emailDomain field as a key and a corresponding tenantName field.
To illustrate how this works, we’ll start with a demo application that was introduced in the earlier blog post. The demo application is implemented by using Amazon Cognito, AWS Amplify, Amazon API Gateway, AWS Lambda, Amazon DynamoDB, Amazon Simple Storage Service (Amazon S3), and Amazon CloudFront to achieve a serverless architecture. This architecture is shown in Figure 1.
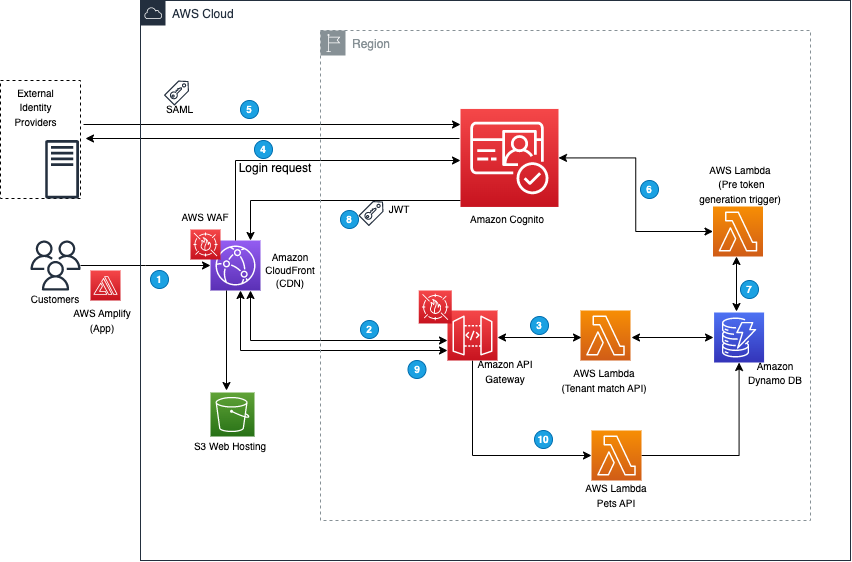
Figure 1: Demo application architecture
The workflow that happens when you access the web application for the first time using your browser is as follows (the numbered steps correspond to the numbered labels in the diagram):

Figure 2: DynamoDB tenant table
You can review the SAML content by using the instructions in How to view a SAML response in your browser for troubleshooting, as shown in Figure 3.

Figure 3: SAML content
This attribute conversion is optional and demonstrates how you can use a PreTokenGeneration Lambda invocation to customize your JWT token claims, mapping the IdP groups to the attributes your application recognizes. You can also use this invocation to make additional authorization decisions. For example, if user is a member of multiple groups, you may choose to map only one of them.
You can implement this example application by using an AWS CloudFormation template to provision your cloud application and AWS resources.
To deploy the demo application described in this post, you need the following prerequisites:

Note: The stack will launch in the N. Virginia (us-east-1) Region. To deploy this solution into other AWS Regions, download the solution’s CloudFormation template from GitHub, modify it, and deploy it to the selected Region.
The stack creates a Cognito user pool called ExternalIdPDemoPoolXXXX in the AWS Region that you have specified. The CloudFormation Outputs field contains a list of values that you will need for further configuration.
The next step is to configure your IdP. Each IdP has its own procedure for configuration, but there are some common steps you need to follow.
To illustrate, we set up three different IdPs to represent three different tenants. Use the following links for instructions on how to configure each IdP:
You will need the metadata URL or file from each IdP, because you will use this to configure your user pool integration. For more information, see Integrating third-party SAML identity providers with Amazon Cognito user pools.
After your IdPs are configured and your CloudFormation stack is deployed, you can configure Cognito.

Figure 4: Select the Cognito user pool

Figure 5: Attribute mappings for the IdP
Upon completion you will see the new IdP displayed as shown in Figure 6.

Figure 6: List of federated IdPs

Figure 7: Select the app client

Figure 8: Select identity providers
The example application uses a serverless backend. There are two API operations defined in this example, as shown in Figure 9. One operation gets tenant details and the other is the /pets API operation, which fetches information on pets based on user identity. The TenantMatch API operation will be run when you sign in with your email address. The operation passes your email address to the backend Lambda function.
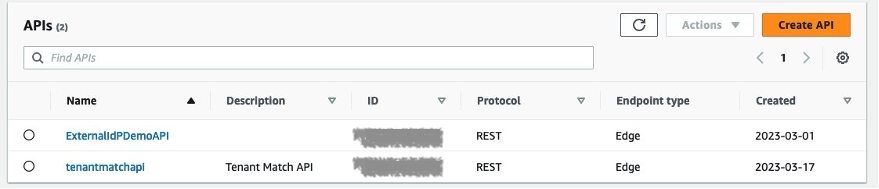
Figure 9: Example APIs
You will see three Lambda functions deployed in the example application, as shown in Figure 10.

Figure 10: Lambda functions
The first one is GetTenantInfo, which is used for the TenantMatch API operation. It reads the data from the TenantTable based on the email domain and passes the record back to the application. The second function is PreTokenGeneration, which reads the mapped custom:groups attribute value, parses it, converts it to an array, and then stores it in the cognito:groups claim. The second Lambda function is invoked by the Cognito user pool after sign-in is successful. In order to customize the mapping, you can edit the Lambda function’s code in the index.js file and redeploy. The third Lambda function is added to support the Pets API operation.
You will see three DynamoDB tables deployed in the example application, as shown in Figure 11.

Figure 11: DynamoDB tables
The TenantTable table holds the tenant details where you must add the mapping between the customer domain and the IdP ID setup in Cognito. This approach can be expanded to add more flexibility in case you want to add custom redirect URLs or Cognito app IDs for each tenant. You must create entries to correspond to the IdPs you have configured, as shown in Figure 12.
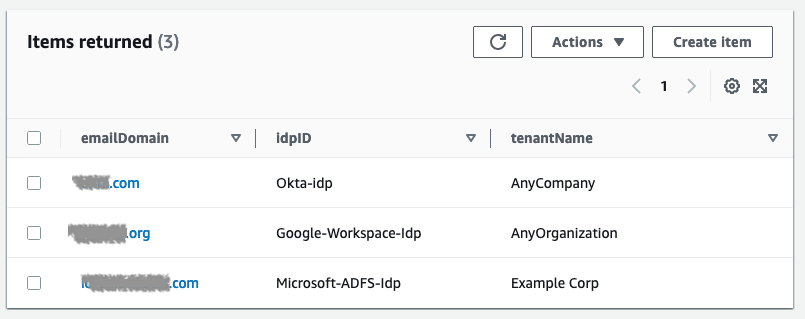
Figure 12: Tenant IdP mappings table
In addition to TenantTable, there is the ExternalIdPDemo-ItemsTable table, which holds the data related to the Pets application, based on user identity. There is also ExternalIdPDemo-UsersTable, which holds user details like the username, last forced sign-out time, and TTL required for the application to manage the user session.
You can now sign in to the example application through each IdP by navigating to the application URL found in the CloudFormation Outputs section, as shown in Figure 13.
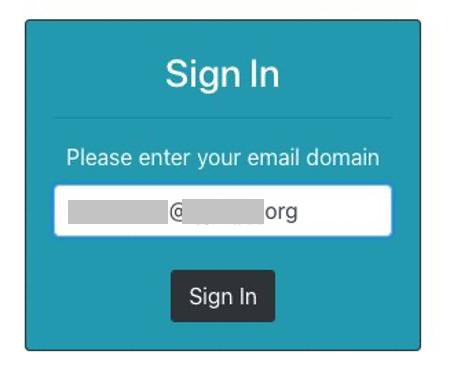
Figure 13: Cognito sign-in screen
You will be redirected to the IdP, as shown in Figure 14.
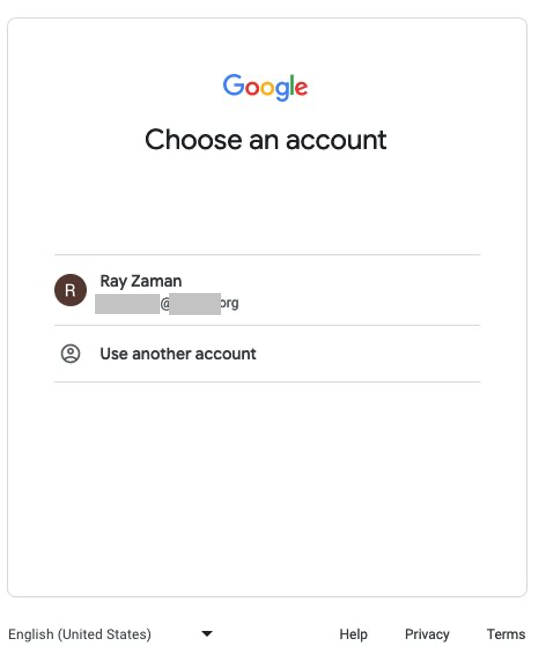
Figure 14: Google Workspace sign-in screen
The AWS Amplify frontend application parses the JWT to identify the tenant name and provide authorization based on group membership, as shown in Figure 15.

Figure 15: Application home screen upon successful sign-in
If a different user logs in with a different role, the AWS Amplify frontend application provides authorization based on specific content of the JWT.
You can integrate your application with your customer’s IdP of choice for authentication and authorization and map information from the IdP to the application. By using Amazon Cognito, you can normalize the structure of the JWT token that is used for this process, so that you can add multiple IdPs, each for a different tenant, through a single Cognito user pool. You can do all this without changing application code. The native integration of Amazon API Gateway with the Cognito user pools authorizer streamlines your validation of the JWT integrity, and after the JWT has been validated, you can use it to make authorization decisions in your application’s backend. By following the example in this post, you can focus on what differentiates your application, and let AWS do the undifferentiated heavy lifting of identity management for your customer-facing applications.
For the code examples described in this post, see the amazon-cognito-example-for-multi-tenant code repository on GitHub. To learn more about using Cognito with external IdPs, see the Amazon Cognito documentation. You can also learn to build software as a service (SaaS) application architectures on AWS. If you have any questions about Cognito or any other AWS services, you may post them to AWS re:Post.
If you have feedback about this post, submit comments in the Comments section below. If you have questions about this post, start a new thread on the AWS Security, Identity, & Compliance re:Post or contact AWS Support.
Want more AWS Security news? Follow us on Twitter.
Post Syndicated from Shoukat Ghouse original https://aws.amazon.com/blogs/big-data/automated-data-governance-with-aws-glue-data-quality-sensitive-data-detection-and-aws-lake-formation/
Data governance is the process of ensuring the integrity, availability, usability, and security of an organization’s data. Due to the volume, velocity, and variety of data being ingested in data lakes, it can get challenging to develop and maintain policies and procedures to ensure data governance at scale for your data lake. Data confidentiality and data quality are the two essential themes for data governance. Data confidentiality refers to the protection and control of sensitive and private information to prevent unauthorized access, especially when dealing with personally identifiable information (PII). Data quality focuses on maintaining accurate, reliable, and consistent data across the organization. Poor data quality can lead to erroneous decisions, inefficient operations, and compromised business performance.
Companies need to ensure data confidentiality is maintained throughout the data pipeline and that high-quality data is available to consumers in a timely manner. A lot of this effort is manual, where data owners and data stewards define and apply the policies statically up front for each dataset in the lake. This gets tedious and delays the data adoption across the enterprise.
In this post, we showcase how to use AWS Glue with AWS Glue Data Quality, sensitive data detection transforms, and AWS Lake Formation tag-based access control to automate data governance.
Let’s consider a fictional company, OkTank. OkTank has multiple ingestion pipelines that populate multiple tables in the data lake. OkTank wants to ensure the data lake is governed with data quality rules and access policies in place at all times.
Multiple personas consume data from the data lake, such as business leaders, data scientists, data analysts, and data engineers. For each set of users, a different level of governance is needed. For example, business leaders need top-quality and highly accurate data, data scientists cannot see PII data and need data within an acceptable quality range for their model training, and data engineers can see all data except PII.
Currently, these requirements are hard-coded and managed manually for each set of users. OkTank wants to scale this and is looking for ways to control governance in an automated way. Primarily, they are looking for the following features:
For the purpose of this post, the following governance policies are defined:
public.sensitive. The table should then also be marked sensitive.data_key, data_load_date, and data_location.data_key is a key column and should meet key requirements of being unique and complete.data_location should match with locations defined in a separate reference (base) table.data_load_date column should be complete.| User Description | Can Access Sensitive Tables | Can Access Sensitive Columns | Min Data Quality Threshold Needed to consume Data |
| Category 1 | Yes | Yes | 100% |
| Category 2 | Yes | No | 50% |
| Category 3 | No | No | 0% |
In this post, we use AWS Glue Data Quality and sensitive data detection features. We also use Lake Formation tag-based access control to manage access at scale.
The following diagram illustrates the solution architecture.

The governance requirements highlighted in the previous table are translated to the following Lake Formation LF-Tags.
| IAM User | LF-Tag: tbl_class | LF-Tag: col_class | LF-Tag: dq_tag |
| Category 1 | sensitive, public | sensitive, public | DQ100 |
| Category 2 | sensitive, public | public | DQ100,DQ90,DQ50_80,DQ80_90 |
| Category 3 | public | public | DQ90, DQ100, DQ_LT_50, DQ50_80, DQ80_90 |
This post uses AWS Step Functions to orchestrate the governance jobs, but you can use any other orchestration tool of choice. To simulate data ingestion, we manually place the files in an Amazon Simple Storage Service (Amazon S3) bucket. In this post, we trigger the Step Functions state machine manually for ease of understanding. In practice, you can integrate or invoke the jobs as part of a data ingestion pipeline, via event triggers like AWS Glue crawler or Amazon S3 events, or schedule them as needed.
In this post, we use an AWS Glue database named oktank_autogov_temp and a target table named customer on which we apply the governance rules. We use AWS CloudFormation to provision the resources. AWS CloudFormation lets you model, provision, and manage AWS and third-party resources by treating infrastructure as code.
Complete the following prerequisite steps:
Sign in to the Lake Formation console and add yourself as a Lake Formation data lake administrator if you aren’t already an admin. If you are setting up Lake Formation for the first time in your Region, then you can do this in the following pop-up window that appears up when you connect to the Lake Formation console and select the desired Region.

Otherwise, you can add data lake administrators by choosing Administrative roles and tasks in the navigation pane on the Lake Formation console and choosing Add administrators. Then select Data lake administrator, identity your users and roles, and choose Confirm.

Run the provided CloudFormation stack to create the solution resources.
You need to provide a unique bucket name and specify passwords for the three users reflecting three different user personas (Category 1, Category 2, and Category 3) that we use for this post.
The stack provisions an S3 bucket to store the dummy data, AWS Glue scripts, results of sensitive data detection, and Amazon Athena query results in their respective folders.
The stack copies the AWS Glue scripts into the scripts folder and creates two AWS Glue jobs Data-Quality-PII-Checker_Job and LF-Tag-Handler_Job pointing to the corresponding scripts.

The AWS Glue job Data-Quality-PII-Checker_Job applies the data quality rules and publishes the results. It also checks for sensitive data in the columns. In this post, we check for the PERSON_NAME and EMAIL data types. If any columns with sensitive data are detected, it persists the sensitive data detection results to the S3 bucket.
AWS Glue Data Quality uses Data Quality Definition Language (DQDL) to author the data quality rules.
The data quality requirements as defined earlier in this post are written as the following DQDL in the script:
The following screenshot shows a sample result from the job after it runs. You can see this after you trigger the Step Functions workflow in subsequent steps. To check the results, on the AWS Glue console, choose ETL jobs and choose the job called Data-Quality-PII-Checker_Job. Then navigate to the Data quality tab to view the results.

The AWS Glue jobLF-Tag-Handler_Job fetches the data quality metrics published by Data-Quality-PII-Checker_Job. It checks the status of the DataQuality_PIIColumns result. It gets the list of sensitive column names from the sensitive data detection file created in the Data-Quality-PII-Checker_Job and tags the columns as sensitive. The rest of the columns are tagged as public. It also tags the table assensitive if sensitive columns are detected. The table is marked as public if no sensitive columns are detected.
The job also checks the data quality score for the DataQuality_BasicChecks result set. It maps the data quality score into tags as shown in the following table and applies the corresponding tag on the table.
| Data Quality Score | Data Quality Tag |
| 100% | DQ100 |
| 90-100% | DQ90 |
| 80-90% | DQ80_90 |
| 50-80% | DQ50_80 |
| Less than 50% | DQ_LT_50 |
The CloudFormation stack copies some mock data to the data folder and registers this location under AWS Lake Formation Data lake locations so Lake Formation can govern access on the location using service-linked role for Lake Formation.

The customer subfolder contains the initial customer dataset for the table customer. The base subfolder contains the base dataset, which we use to check referential integrity as part of the data quality checks. The column data_location in the customer table should match with locations defined in this base table.
The stack also copies some additional mock data to the bucket under the data-v1 folder. We use this data to simulate data quality issues.

It also creates the following resources:
oktank_autogov_temp and two tables under the database:
sensitive, publicDQ100, DQ90, DQ80_90, DQ50_80, DQ_LT_50sensitive, publicAutoGovMachine that you use to trigger the runs for the AWS Glue jobs to check data quality and update the LF-Tags.auto_gov_blog_workgroup_temporary_user1, auto_gov_blog_workgroup_temporary_user2, and auto_gov_blog_workgroup_temporary_user3. These workgroups point to different Athena query result locations for each user. Each user is granted access to the corresponding query result location only. This ensures a specific user doesn’t access the query results of other users. You should switch to a specific workgroup to run queries in Athena as part of the test for the specific user.The CloudFormation stack generates the following outputs. Take note of the values of the IAM users to use in subsequent steps.

After you launch the CloudFormation stack, complete the following steps:
oktank_autogov_temp and table customer.IAMAllowedPrincipals access if present, select it choose Revoke.

Category 1 users can access all data except if the data quality score of the table is below 100%. Therefore, we grant the user the necessary permissions.
oktank_autogov_temp and table customer.UserCategory1 from your CloudFormation stack output.col_class key, add the values public and sensitive.tbl_class key, add the values public and sensitive.dq_tag key, add the value DQ100.

Category 2 users can’t access sensitive columns. They can access tables with a data quality score above 50%.
UserCategory2:
col_class key, add the value public.tbl_class key, add the values public and sensitive.dq_tag key, add the values DQ50_80, DQ80_90, DQ90, and DQ100.
Category 3 users can’t access tables that contain any sensitive columns. Such tables are marked as sensitive by the system. They can access tables with any data quality score.
col_class key, add the value public.tbl_class key, add the value public.dq_tag key, add the values DQ_LT_50, DQ50_80, DQ80_90, DQ90, and DQ100.
You can verify the LF-Tag permissions assigned in Lake Formation by navigating to the Data lake permissions page and searching for the Resource type LF-Tag expression.

Now we can test the workflow. We test three different use cases in this post. You will notice how the permissions to the tables change based on the values of LF-Tags applied to the customer table and the columns of the table. We use Athena to query the tables.
In this first use case, a new table was created on the lake and new data was ingested to the table. The data file cust_feedback_v0.csv was copied to the data/customer location in the S3 bucket. This simulates new data ingestion on a new table called customer.
Lake Formation doesn’t allow any users to access this table currently. To test this scenario, complete the following steps:
UserCategory1 user.auto_gov_blog_workgroup_temporary_user1 in the Athena query editor.

AutoGovMachine state machine.BucketName value with the bucket name you used for the CloudFormation stack earlier (for this post, we use auto-gov-blog):
The state machine triggers the AWS Glue jobs to check data quality on the table and apply the corresponding LF-Tags.

customer under the oktank_autogov_temp database and choose Edit LF-Tags to validate the tags applied on the table.
You can also validate that columns customer_email and customer_name are tagged as sensitive for the col_class LF-Tag.
customer table.
You can check the tags on these columns.

The rest of the columns are tagged as public.

UserCategory1 and run the same query again:This time, the user is able to see the data. This is because the LF-Tag permissions we applied earlier are in effect.

UserCategory2 user to verify permissions.auto_gov_blog_workgroup_temporary_user2 in Athena.This user can access the table but can only see public columns. Therefore, the user shouldn’t be able to see the customer_email and customer_phone columns because these columns contain sensitive data as identified by the system.

DataLakeUser_Category3.auto_gov_blog_workgroup_temporary_user3 in Athena.This user can’t access the table because the table is marked as sensitive due to the presence of sensitive data columns in the table.

Let’s ingest some new data on the table.
cust_feedback_v1.csv from the data-v1 folder in the S3 bucket to the data/customer folder in the S3 bucket using the default options.This new data file has data quality issues because the column data_location breaks referential integrity with the base table. This data also introduces some sensitive data in column comment1. This column was earlier marked as public because it didn’t have any sensitive data.
The following screenshot shows what the customer folder should look like now.

The job classifies column comment1 as sensitive on the customer table. It also updates the dq_tag value on the table because the data quality has changed due to the breaking referential integrity check.
You can verify the new tag values via the Lake Formation console as described earlier. The dq_tag value was DQ100. The value is changed to DQ50_80, reflecting the data quality score for the table.

Also, earlier the value for the col_class tag for the comment1 column was public. The value is now changed to sensitive because sensitive data is detected in this column.

Category 2 users shouldn’t be able to access sensitive columns in the table.
UserCategory2 to Athena and rerun the earlier query:The column comment1 is now not available for UserCategory2 as expected. The access permissions are handled automatically.

Also, because the data quality score goes down below 100%, this new dataset is now not available for the Category1 user. This user should have access to data only when the score is 100% as per our defined rules.
UserCategory1 to Athena and rerun the earlier query:You will see the user is not able to access the table now. The access permissions are handled automatically.

Let’s fix the invalid data and remove the data quality issue.
cust_feedback_v1.csv file from the data/customer Amazon S3 location.cust_feedback_v1_fixed.csv from the data-v1 folder in the S3 bucket to the data/customer S3 location. This data file fixes the data quality issues.AutoGovMachine state machine.When the state machine is complete, the data quality score goes up to 100% again and the tag on the table gets updated accordingly. You can verify the new tag as shown earlier via the Lake Formation console.

The Category1 user can access the table again.

To avoid incurring further charges, delete the CloudFormation stack to delete the resources provisioned as part of this post.
This post covered AWS Glue Data Quality and sensitive detection features and Lake Formation LF-Tag based access control. We explored how you can combine these features and use them to build a scalable automated data governance capability on your data lake. We explored how user permissions changed when data was initially ingested to the table and when data drift was observed as part of subsequent ingestions.
For further reading, refer to the following resources:
 Shoukat Ghouse is a Senior Big Data Specialist Solutions Architect at AWS. He helps customers around the world build robust, efficient and scalable data platforms on AWS leveraging AWS analytics services like AWS Glue, AWS Lake Formation, Amazon Athena and Amazon EMR.
Post Syndicated from Matt Granger original https://www.youtube.com/watch?v=MhfI3xjz9DU
Post Syndicated from Talks at Google original https://www.youtube.com/watch?v=UmRDfzZfPJY
Post Syndicated from The Hook Up original https://www.youtube.com/watch?v=rrmOgSbkMpc
Post Syndicated from corbet original https://lwn.net/Articles/947236/
The GitHub blog describes
a vulnerability in the libcue library (which is used by the GNOME
desktop) that can be exploited by a remote attacker to run code on a
desktop system if the target can be convinced to click on a malicious link.
The video shows me clicking a link in a webpage, which causes a cue
sheet to be downloaded. Because the file is saved to ~/Downloads,
it is then automatically scanned by tracker-miners. And because it
has a .cue filename extension, tracker-miners uses libcue to parse
the file. The file exploits the vulnerability in libcue to gain
code execution and pop a calculator.
Post Syndicated from Patrick Kennedy original https://www.servethehome.com/nvidia-data-center-roadmap-with-gx200nvl-gx200-x100-and-x40-ai-chips-in-2025/
NVIDIA showed its AI GPU roadmap with the NVIDIA X200, GX200, GX200NVL, and X40 chips set for launch in 2025, 2.5 gens ahead of today’s chips
The post NVIDIA Data Center Roadmap with GX200NVL GX200 X100 and X40 AI Chips in 2025 appeared first on ServeTheHome.
Post Syndicated from corbet original https://lwn.net/Articles/947233/
Security updates have been issued by Fedora (chromium, firefox, and kernel), Gentoo (less and libcue), Red Hat (bind, libvpx, nodejs, and python3), Scientific Linux (firefox and thunderbird), SUSE (conmon, go1.20, go1.21, shadow, and thunderbird), and Ubuntu (libcue, ring, and ruby-kramdown).
Post Syndicated from The History Guy: History Deserves to Be Remembered original https://www.youtube.com/watch?v=mCYFZNPE058
Post Syndicated from Tom Scholl original https://aws.amazon.com/blogs/security/how-aws-protects-customers-from-ddos-events/
At Amazon Web Services (AWS), security is our top priority. Security is deeply embedded into our culture, processes, and systems; it permeates everything we do. What does this mean for you? We believe customers can benefit from learning more about what AWS is doing to prevent and mitigate customer-impacting security events.
Since late August 2023, AWS has detected and been protecting customer applications from a new type of distributed denial of service (DDoS) event. DDoS events attempt to disrupt the availability of a targeted system, such as a website or application, reducing the performance for legitimate users. Examples of DDoS events include HTTP request floods, reflection/amplification attacks, and packet floods. The DDoS events AWS detected were a type of HTTP/2 request flood, which occurs when a high volume of illegitimate web requests overwhelms a web server’s ability to respond to legitimate client requests.
Between August 28 and August 29, 2023, proactive monitoring by AWS detected an unusual spike in HTTP/2 requests to Amazon CloudFront, peaking at over 155 million requests per second (RPS). Within minutes, AWS determined the nature of this unusual activity and found that CloudFront had automatically mitigated a new type of HTTP request flood DDoS event, now called an HTTP/2 rapid reset attack. Over those two days, AWS observed and mitigated over a dozen HTTP/2 rapid reset events, and through the month of September, continued to see this new type of HTTP/2 request flood. AWS customers who had built DDoS-resilient architectures with services like Amazon CloudFront and AWS Shield were able to protect their applications’ availability.

Figure 1. Global HTTP requests per second, September 13 – 16
HTTP/2 allows for multiple distinct logical connections to be multiplexed over a single HTTP session. This is a change from HTTP 1.x, in which each HTTP session was logically distinct. HTTP/2 rapid reset attacks consist of multiple HTTP/2 connections with requests and resets in rapid succession. For example, a series of requests for multiple streams will be transmitted followed up by a reset for each of those requests. The targeted system will parse and act upon each request, generating logs for a request that is then reset, or cancelled, by a client. The system performs work generating those logs even though it doesn’t have to send any data back to a client. A bad actor can abuse this process by issuing a massive volume of HTTP/2 requests, which can overwhelm the targeted system, such as a website or application.
Keep in mind that HTTP/2 rapid reset attacks are just a new type of HTTP request flood. To defend against these sorts of DDoS attacks, you can implement an architecture that helps you specifically detect unwanted requests as well as scale to absorb and block those malicious HTTP requests.
As an AWS customer, you benefit from both the security built into the global cloud infrastructure of AWS as well as our commitment to continuously improve the security, efficiency, and resiliency of AWS services. For prescriptive guidance on how to improve DDoS resiliency, AWS has built tools such as the AWS Best Practices for DDoS Resiliency. It describes a DDoS-resilient reference architecture as a guide to help you protect your application’s availability. While several built-in forms of DDoS mitigation are included automatically with AWS services, your DDoS resilience can be improved by using an AWS architecture with specific services and by implementing additional best practices for each part of the network flow between users and your application.
For example, you can use AWS services that operate from edge locations, such as Amazon CloudFront, AWS Shield, Amazon Route 53, and Route 53 Application Recovery Controller to build comprehensive availability protection against known infrastructure layer attacks. These services can improve the DDoS resilience of your application when serving any type of application traffic from edge locations distributed around the world. Your application can be on-premises or in AWS when you use these AWS services to help you prevent unnecessary requests reaching your origin servers. As a best practice, you can run your applications on AWS to get the additional benefit of reducing the exposure of your application endpoints to DDoS attacks and to protect your application’s availability and optimize the performance of your application for legitimate users. You can use Amazon CloudFront (and its HTTP caching capability), AWS WAF, and Shield Advanced automatic application layer protection to help prevent unnecessary requests reaching your origin during application layer DDoS attacks.
AWS remains vigilant, working to help prevent security issues from causing disruption to your business. We believe it’s important to share not only how our services are designed, but also how our engineers take deep, proactive ownership of every aspect of our services. As we work to defend our infrastructure and your data, we look for ways to help protect you automatically. Whenever possible, AWS Security and its systems disrupt threats where that action will be most impactful; often, this work happens largely behind the scenes. We work to mitigate threats by combining our global-scale threat intelligence and engineering expertise to help make our services more resilient against malicious activities. We’re constantly looking around corners to improve the efficiency and security of services including the protocols we use in our services, such as Amazon CloudFront, as well as AWS security tools like AWS WAF, AWS Shield, and Amazon Route 53 Resolver DNS Firewall.
In addition, our work extends security protections and improvements far beyond the bounds of AWS itself. AWS regularly works with the wider community, such as computer emergency response teams (CERT), internet service providers (ISP), domain registrars, or government agencies, so that they can help disrupt an identified threat. We also work closely with the security community, other cloud providers, content delivery networks (CDNs), and collaborating businesses around the world to isolate and take down threat actors. For example, in the first quarter of 2023, we stopped over 1.3 million botnet-driven DDoS attacks, and we traced back and worked with external parties to dismantle the sources of 230 thousand L7/HTTP DDoS attacks. The effectiveness of our mitigation strategies relies heavily on our ability to quickly capture, analyze, and act on threat intelligence. By taking these steps, AWS is going beyond just typical DDoS defense, and moving our protection beyond our borders. To learn more behind this effort, please read How AWS threat intelligence deters threat actors.
If you have feedback about this post, submit comments in the Comments section below. If you have questions about this post, contact AWS Support.
Want more AWS Security news? Follow us on Twitter.
Post Syndicated from Lucas Pardue original http://blog.cloudflare.com/technical-breakdown-http2-rapid-reset-ddos-attack/

Starting on Aug 25, 2023, we started to notice some unusually big HTTP attacks hitting many of our customers. These attacks were detected and mitigated by our automated DDoS system. It was not long however, before they started to reach record breaking sizes — and eventually peaked just above 201 million requests per second. This was nearly 3x bigger than our previous biggest attack on record.
Concerning is the fact that the attacker was able to generate such an attack with a botnet of merely 20,000 machines. There are botnets today that are made up of hundreds of thousands or millions of machines. Given that the entire web typically sees only between 1–3 billion requests per second, it's not inconceivable that using this method could focus an entire web’s worth of requests on a small number of targets.
This was a novel attack vector at an unprecedented scale, but Cloudflare's existing protections were largely able to absorb the brunt of the attacks. While initially we saw some impact to customer traffic — affecting roughly 1% of requests during the initial wave of attacks — today we’ve been able to refine our mitigation methods to stop the attack for any Cloudflare customer without it impacting our systems.
We noticed these attacks at the same time two other major industry players — Google and AWS — were seeing the same. We worked to harden Cloudflare’s systems to ensure that, today, all our customers are protected from this new DDoS attack method without any customer impact. We’ve also participated with Google and AWS in a coordinated disclosure of the attack to impacted vendors and critical infrastructure providers.
This attack was made possible by abusing some features of the HTTP/2 protocol and server implementation details (see CVE-2023-44487 for details). Because the attack abuses an underlying weakness in the HTTP/2 protocol, we believe any vendor that has implemented HTTP/2 will be subject to the attack. This included every modern web server. We, along with Google and AWS, have disclosed the attack method to web server vendors who we expect will implement patches. In the meantime, the best defense is using a DDoS mitigation service like Cloudflare’s in front of any web-facing web or API server.
This post dives into the details of the HTTP/2 protocol, the feature that attackers exploited to generate these massive attacks, and the mitigation strategies we took to ensure all our customers are protected. Our hope is that by publishing these details other impacted web servers and services will have the information they need to implement mitigation strategies. And, moreover, the HTTP/2 protocol standards team, as well as teams working on future web standards, can better design them to prevent such attacks.
HTTP is the application protocol that powers the Web. HTTP Semantics are common to all versions of HTTP — the overall architecture, terminology, and protocol aspects such as request and response messages, methods, status codes, header and trailer fields, message content, and much more. Each individual HTTP version defines how semantics are transformed into a "wire format" for exchange over the Internet. For example, a client has to serialize a request message into binary data and send it, then the server parses that back into a message it can process.
HTTP/1.1 uses a textual form of serialization. Request and response messages are exchanged as a stream of ASCII characters, sent over a reliable transport layer like TCP, using the following format (where CRLF means carriage-return and linefeed):
 HTTP-message   = start-line CRLF
                   *( field-line CRLF )
                   CRLF
                   [ message-body ]
For example, a very simple GET request for https://blog.cloudflare.com/ would look like this on the wire:
GET / HTTP/1.1 CRLFHost: blog.cloudflare.comCRLF
And the response would look like:
HTTP/1.1 200 OK CRLFServer: cloudflareCRLFContent-Length: 100CRLFtext/html; charset=UTF-8CRLF<100 bytes of data>
This format frames messages on the wire, meaning that it is possible to use a single TCP connection to exchange multiple requests and responses. However, the format requires that each message is sent whole. Furthermore, in order to correctly correlate requests with responses, strict ordering is required; meaning that messages are exchanged serially and can not be multiplexed. Two GET requests, for https://blog.cloudflare.com/ and https://blog.cloudflare.com/page/2/, would be:
GET / HTTP/1.1 CRLFHost: blog.cloudflare.comCRLFGET /page/2 HTTP/1.1 CRLFHost: blog.cloudflare.comCRLF
With the responses:
HTTP/1.1 200 OK CRLFServer: cloudflareCRLFContent-Length: 100CRLFtext/html; charset=UTF-8CRLF<100 bytes of data>HTTP/1.1 200 OK CRLFServer: cloudflareCRLFContent-Length: 100CRLFtext/html; charset=UTF-8CRLF<100 bytes of data>
Web pages require more complicated HTTP interactions than these examples. When visiting the Cloudflare blog, your browser will load multiple scripts, styles and media assets. If you visit the front page using HTTP/1.1 and decide quickly to navigate to page 2, your browser can pick from two options. Either wait for all of the queued up responses for the page that you no longer want before page 2 can even start, or cancel in-flight requests by closing the TCP connection and opening a new connection. Neither of these is very practical. Browsers tend to work around these limitations by managing a pool of TCP connections (up to 6 per host) and implementing complex request dispatch logic over the pool.
HTTP/2 addresses many of the issues with HTTP/1.1. Each HTTP message is serialized into a set of HTTP/2 frames that have type, length, flags, stream identifier (ID) and payload. The stream ID makes it clear which bytes on the wire apply to which message, allowing safe multiplexing and concurrency. Streams are bidirectional. Clients send frames and servers reply with frames using the same ID.
In HTTP/2 our GET request for https://blog.cloudflare.com would be exchanged across stream ID 1, with the client sending one HEADERS frame, and the server responding with one HEADERS frame, followed by one or more DATA frames. Client requests always use odd-numbered stream IDs, so subsequent requests would use stream ID 3, 5, and so on. Responses can be served in any order, and frames from different streams can be interleaved.
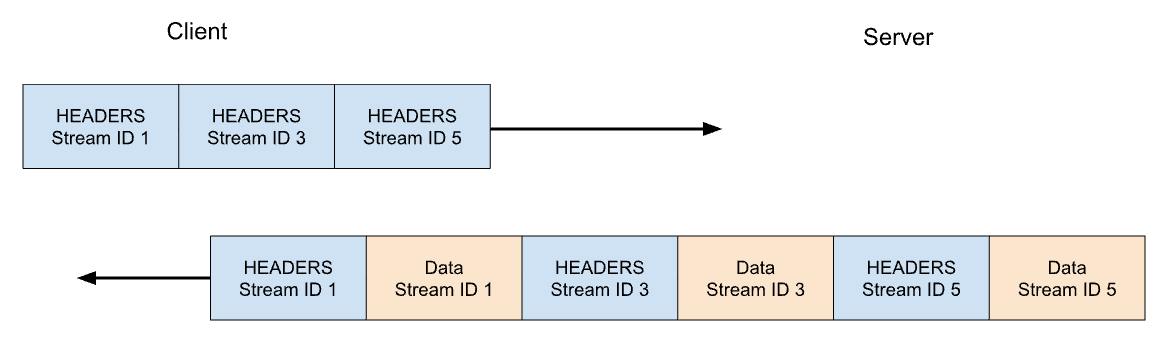
Stream multiplexing and concurrency are powerful features of HTTP/2. They enable more efficient usage of a single TCP connection. HTTP/2 optimizes resources fetching especially when coupled with prioritization. On the flip side, making it easy for clients to launch large amounts of parallel work can increase the peak demand for server resources when compared to HTTP/1.1. This is an obvious vector for denial-of-service.
In order to provide some guardrails, HTTP/2 provides a notion of maximum active concurrent streams. The SETTINGS_MAX_CONCURRENT_STREAMS parameter allows a server to advertise its limit of concurrency. For example, if the server states a limit of 100, then only 100 requests can be active at any time. If a client attempts to open a stream above this limit, it must be rejected by the server using a RST_STREAM frame. Stream rejection does not affect the other in-flight streams on the connection.
The true story is a little more complicated. Streams have a lifecycle. Below is a diagram of the HTTP/2 stream state machine. Client and server manage their own views of the state of a stream. HEADERS, DATA and RST_STREAM frames trigger transitions when they are sent or received. Although the views of the stream state are independent, they are synchronized.
HEADERS and DATA frames include an END_STREAM flag, that when set to the value 1 (true), can trigger a state transition.

Let's work through this with an example of a GET request that has no message content. The client sends the request as a HEADERS frame with the END_STREAM flag set to 1. The client first transitions the stream from idle to open state, then immediately transitions into half-closed state. The client half-closed state means that it can no longer send HEADERS or DATA, only WINDOW_UPDATE, PRIORITY or RST_STREAM frames. It can receive any frame however.
Once the server receives and parses the HEADERS frame, it transitions the stream state from idle to open and then half-closed, so it matches the client. The server half-closed state means it can send any frame but receive only WINDOW_UPDATE, PRIORITY or RST_STREAM frames.
The response to the GET contains message content, so the server sends HEADERS with END_STREAM flag set to 0, then DATA with END_STREAM flag set to 1. The DATA frame triggers the transition of the stream from half-closed to closed on the server. When the client receives it, it also transitions to closed. Once a stream is closed, no frames can be sent or received.
Applying this lifecycle back into the context of concurrency, HTTP/2 states:
Streams that are in the "open" state or in either of the "half-closed" states count toward the maximum number of streams that an endpoint is permitted to open. Streams in any of these three states count toward the limit advertised in the SETTINGS_MAX_CONCURRENT_STREAMS setting.
In theory, the concurrency limit is useful. However, there are practical factors that hamper its effectiveness— which we will cover later in the blog.
Earlier, we talked about client cancellation of in-flight requests. HTTP/2 supports this in a much more efficient way than HTTP/1.1. Rather than needing to tear down the whole connection, a client can send a RST_STREAM frame for a single stream. This instructs the server to stop processing the request and to abort the response, which frees up server resources and avoids wasting bandwidth.
Let's consider our previous example of 3 requests. This time the client cancels the request on stream 1 after all of the HEADERS have been sent. The server parses this RST_STREAM frame before it is ready to serve the response and instead only responds to stream 3 and 5:
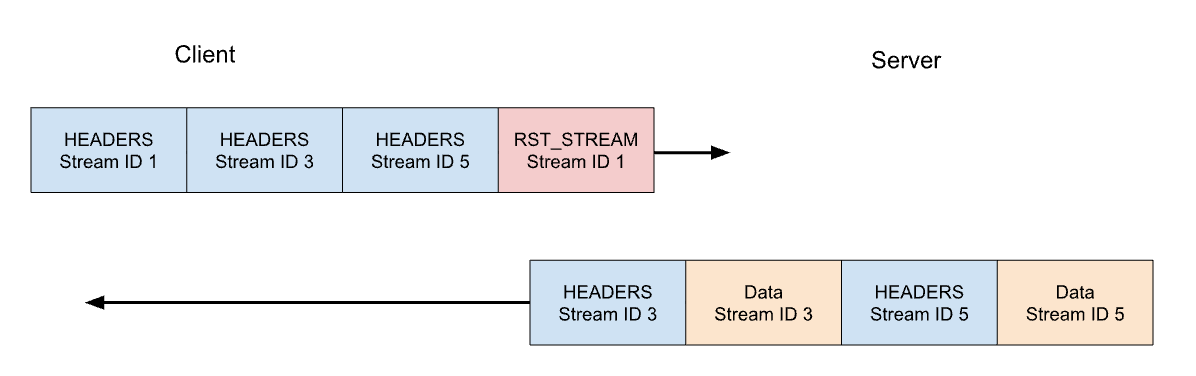
Request cancellation is a useful feature. For example, when scrolling a webpage with multiple images, a web browser can cancel images that fall outside the viewport, meaning that images entering it can load faster. HTTP/2 makes this behaviour a lot more efficient compared to HTTP/1.1.
A request stream that is canceled, rapidly transitions through the stream lifecycle. The client's HEADERS with END_STREAM flag set to 1 transitions the state from idle to open to half-closed, then RST_STREAM immediately causes a transition from half-closed to closed.

Recall that only streams that are in the open or half-closed state contribute to the stream concurrency limit. When a client cancels a stream, it instantly gets the ability to open another stream in its place and can send another request immediately. This is the crux of what makes CVE-2023-44487 work.
HTTP/2 request cancellation can be abused to rapidly reset an unbounded number of streams. When an HTTP/2 server is able to process client-sent RST_STREAM frames and tear down state quickly enough, such rapid resets do not cause a problem. Where issues start to crop up is when there is any kind of delay or lag in tidying up. The client can churn through so many requests that a backlog of work accumulates, resulting in excess consumption of resources on the server.
A common HTTP deployment architecture is to run an HTTP/2 proxy or load-balancer in front of other components. When a client request arrives it is quickly dispatched and the actual work is done as an asynchronous activity somewhere else. This allows the proxy to handle client traffic very efficiently. However, this separation of concerns can make it hard for the proxy to tidy up the in-process jobs. Therefore, these deployments are more likely to encounter issues from rapid resets.
When Cloudflare's reverse proxies process incoming HTTP/2 client traffic, they copy the data from the connection’s socket into a buffer and process that buffered data in order. As each request is read (HEADERS and DATA frames) it is dispatched to an upstream service. When RST_STREAM frames are read, the local state for the request is torn down and the upstream is notified that the request has been canceled. Rinse and repeat until the entire buffer is consumed. However this logic can be abused: when a malicious client started sending an enormous chain of requests and resets at the start of a connection, our servers would eagerly read them all and create stress on the upstream servers to the point of being unable to process any new incoming request.
Something that is important to highlight is that stream concurrency on its own cannot mitigate rapid reset. The client can churn requests to create high request rates no matter the server's chosen value of SETTINGS_MAX_CONCURRENT_STREAMS.
Here's an example of rapid reset reproduced using a proof-of-concept client attempting to make a total of 1000 requests. I've used an off-the-shelf server without any mitigations; listening on port 443 in a test environment. The traffic is dissected using Wireshark and filtered to show only HTTP/2 traffic for clarity. Download the pcap to follow along.

It's a bit difficult to see, because there are a lot of frames. We can get a quick summary via Wireshark's Statistics > HTTP2 tool:

The first frame in this trace, in packet 14, is the server's SETTINGS frame, which advertises a maximum stream concurrency of 100. In packet 15, the client sends a few control frames and then starts making requests that are rapidly reset. The first HEADERS frame is 26 bytes long, all subsequent HEADERS are only 9 bytes. This size difference is due to a compression technology called HPACK. In total, packet 15 contains 525 requests, going up to stream 1051.
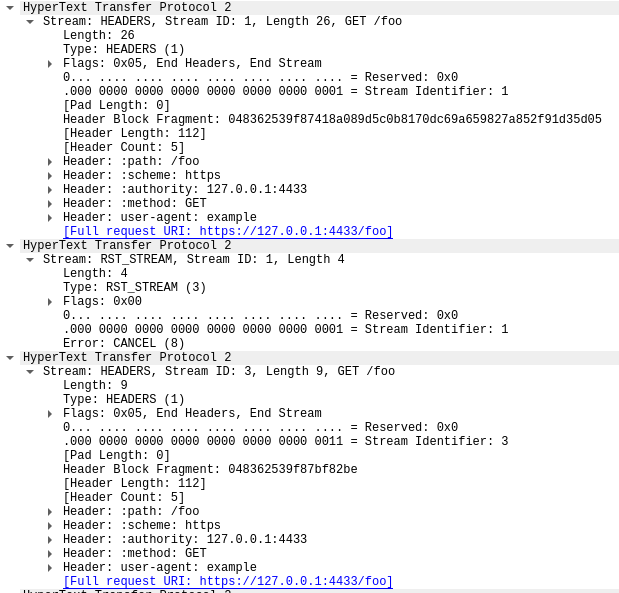
Interestingly, the RST_STREAM for stream 1051 doesn't fit in packet 15, so in packet 16 we see the server respond with a 404 response. Then in packet 17 the client does send the RST_STREAM, before moving on to sending the remaining 475 requests.
Note that although the server advertised 100 concurrent streams, both packets sent by the client sent a lot more HEADERS frames than that. The client did not have to wait for any return traffic from the server, it was only limited by the size of the packets it could send. No server RST_STREAM frames are seen in this trace, indicating that the server did not observe a concurrent stream violation.
As mentioned above, as requests are canceled, upstream services are notified and can abort requests before wasting too many resources on it. This was the case with this attack, where most malicious requests were never forwarded to the origin servers. However, the sheer size of these attacks did cause some impact.
First, as the rate of incoming requests reached peaks never seen before, we had reports of increased levels of 502 errors seen by clients. This happened on our most impacted data centers as they were struggling to process all the requests. While our network is meant to deal with large attacks, this particular vulnerability exposed a weakness in our infrastructure. Let's dig a little deeper into the details, focusing on how incoming requests are handled when they hit one of our data centers:
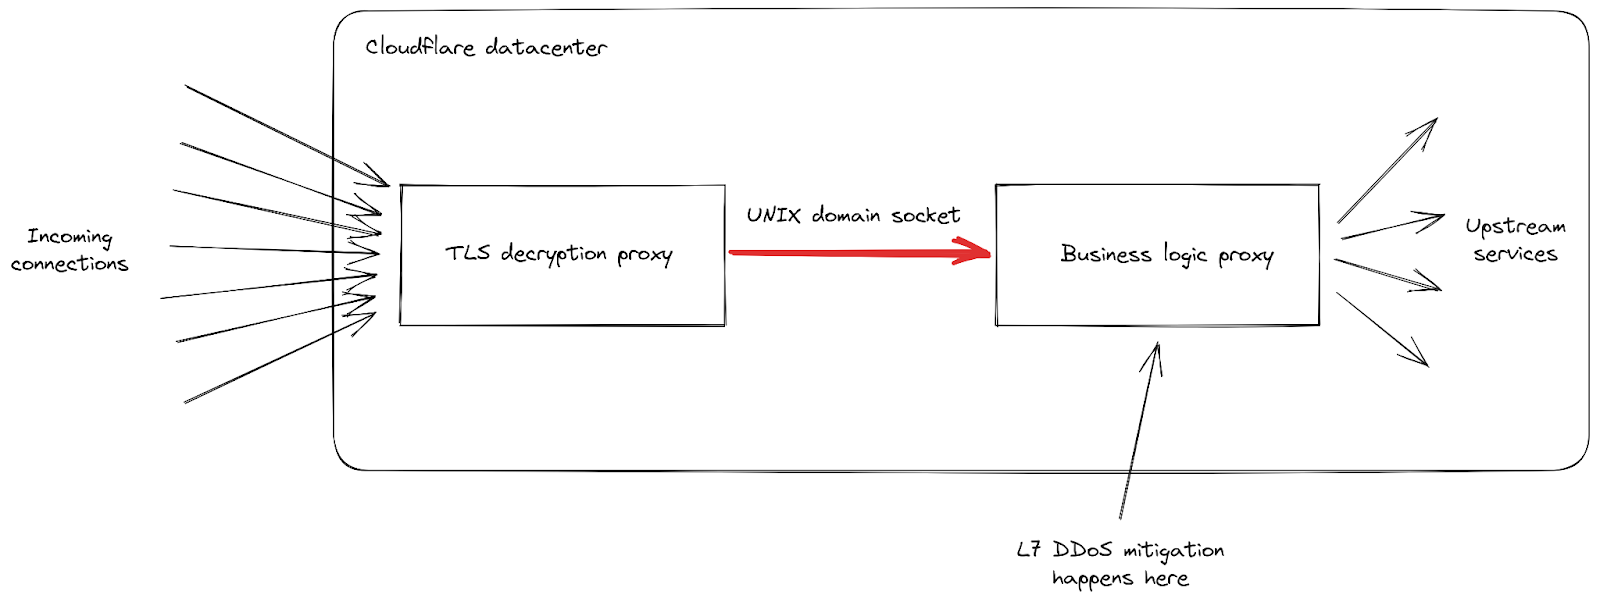
We can see that our infrastructure is composed of a chain of different proxy servers with different responsibilities. In particular, when a client connects to Cloudflare to send HTTPS traffic, it first hits our TLS decryption proxy: it decrypts TLS traffic, processes HTTP 1, 2 or 3 traffic, then forwards it to our "business logic" proxy. This one is responsible for loading all the settings for each customer, then routing the requests correctly to other upstream services — and more importantly in our case, it is also responsible for security features. This is where L7 attack mitigation is processed.
The problem with this attack vector is that it manages to send a lot of requests very quickly in every single connection. Each of them had to be forwarded to the business logic proxy before we had a chance to block it. As the request throughput became higher than our proxy capacity, the pipe connecting these two services reached its saturation level in some of our servers.
When this happens, the TLS proxy cannot connect anymore to its upstream proxy, this is why some clients saw a bare "502 Bad Gateway" error during the most serious attacks. It is important to note that, as of today, the logs used to create HTTP analytics are also emitted by our business logic proxy. The consequence of that is that these errors are not visible in the Cloudflare dashboard. Our internal dashboards show that about 1% of requests were impacted during the initial wave of attacks (before we implemented mitigations), with peaks at around 12% for a few seconds during the most serious one on August 29th. The following graph shows the ratio of these errors over a two hours while this was happening:
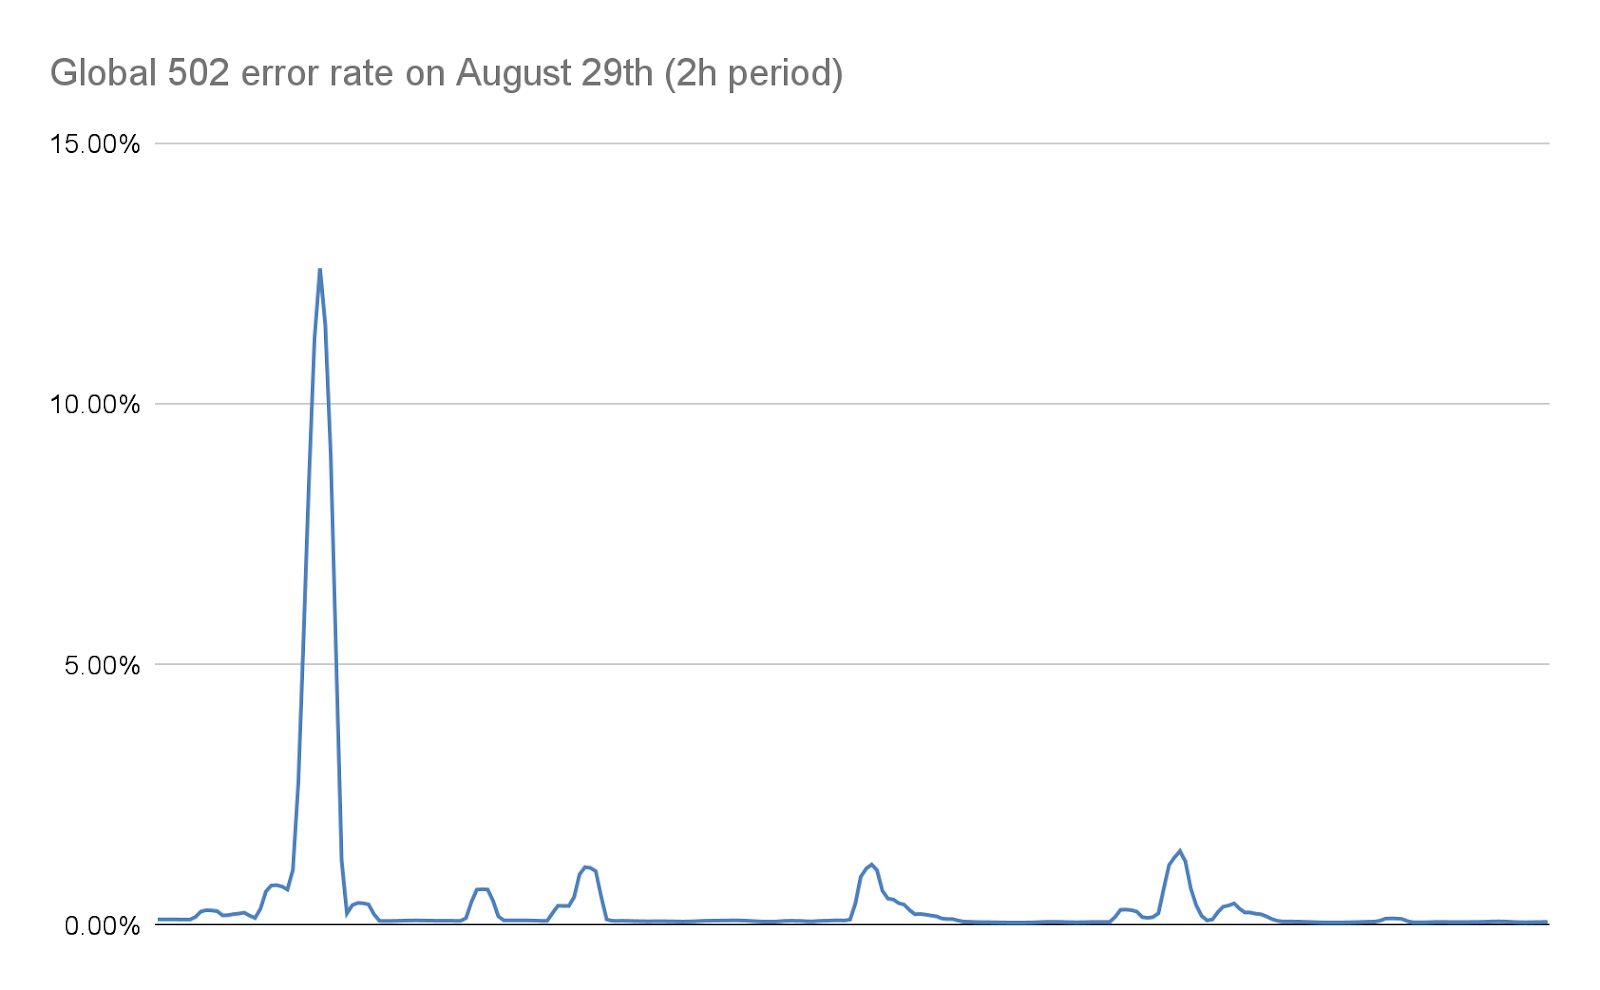
We worked to reduce this number dramatically in the following days, as detailed later on in this post. Both thanks to changes in our stack and to our mitigation that reduce the size of these attacks considerably, this number is today is effectively zero:
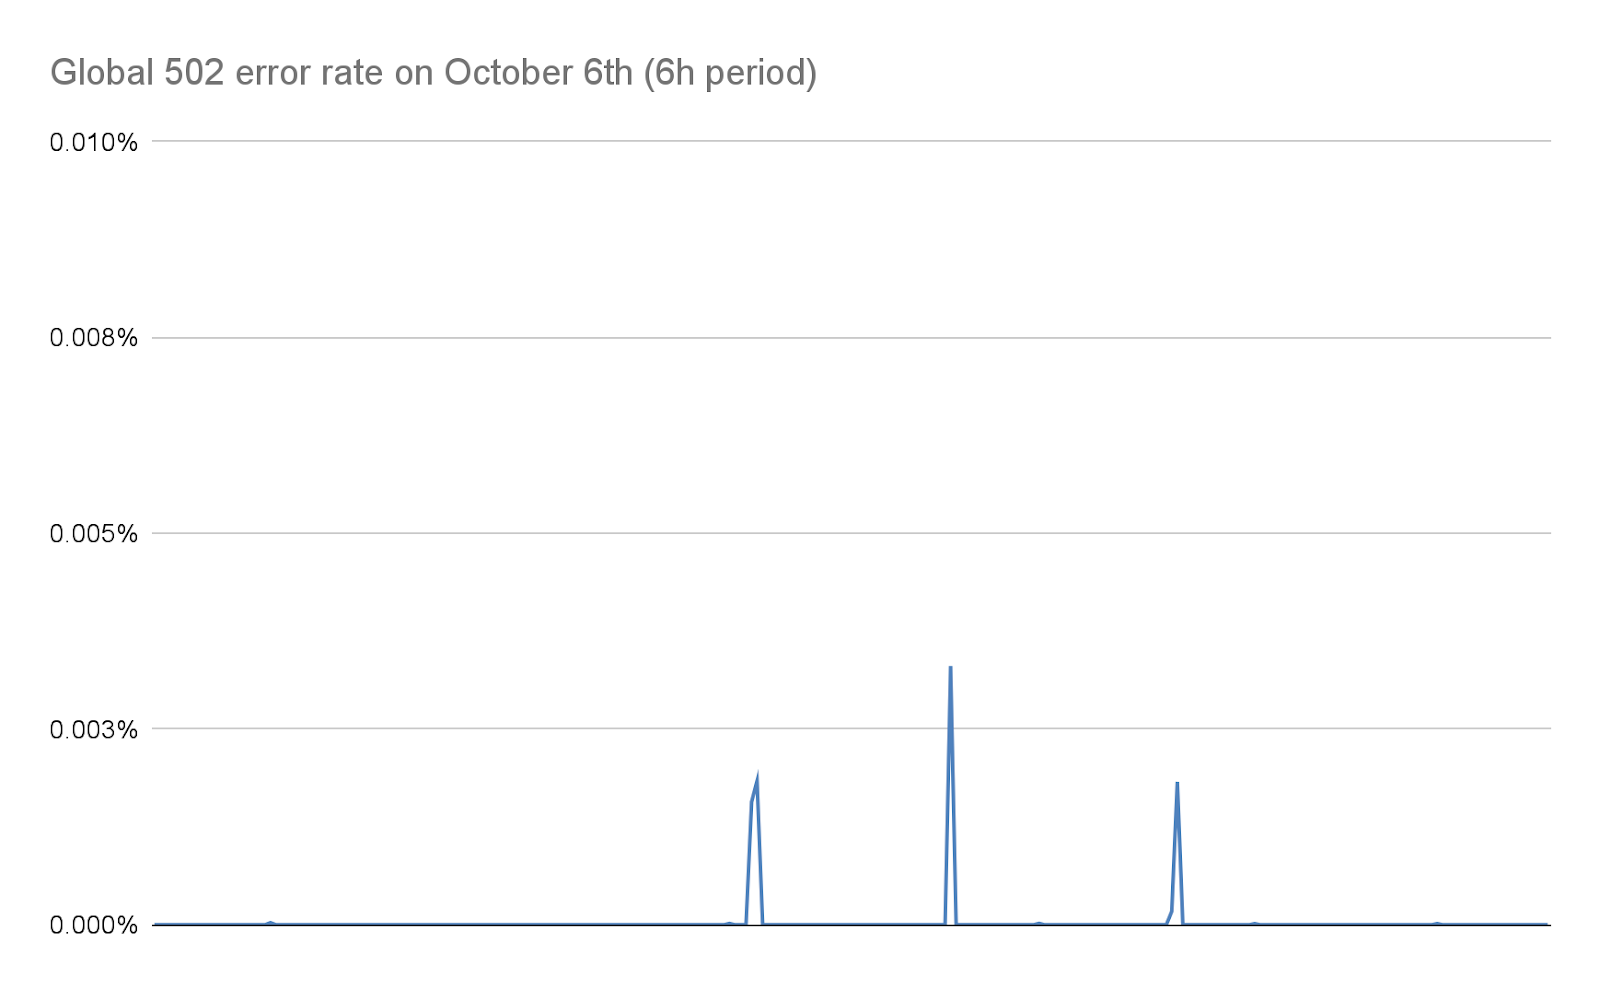
Another symptom reported by some customers is an increase in 499 errors. The reason for this is a bit different and is related to the maximum stream concurrency in a HTTP/2 connection detailed earlier in this post.
HTTP/2 settings are exchanged at the start of a connection using SETTINGS frames. In the absence of receiving an explicit parameter, default values apply. Once a client establishes an HTTP/2 connection, it can wait for a server's SETTINGS (slow) or it can assume the default values and start making requests (fast). For SETTINGS_MAX_CONCURRENT_STREAMS, the default is effectively unlimited (stream IDs use a 31-bit number space, and requests use odd numbers, so the actual limit is 1073741824). The specification recommends that a server offer no fewer than 100 streams. Clients are generally biased towards speed, so don't tend to wait for server settings, which creates a bit of a race condition. Clients are taking a gamble on what limit the server might pick; if they pick wrong the request will be rejected and will have to be retried. Gambling on 1073741824 streams is a bit silly. Instead, a lot of clients decide to limit themselves to issuing 100 concurrent streams, with the hope that servers followed the specification recommendation. Where servers pick something below 100, this client gamble fails and streams are reset.
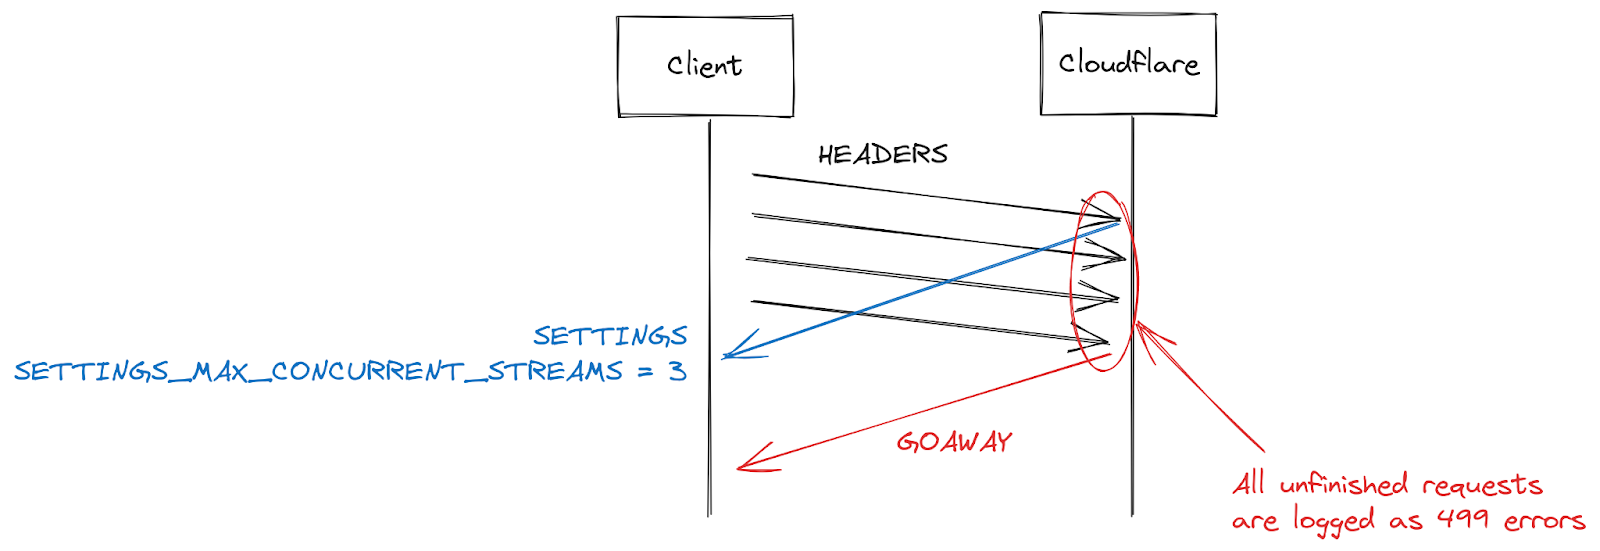
There are many reasons a server might reset a stream beyond concurrency limit overstepping. HTTP/2 is strict and requires a stream to be closed when there are parsing or logic errors. In 2019, Cloudflare developed several mitigations in response to HTTP/2 DoS vulnerabilities. Several of those vulnerabilities were caused by a client misbehaving, leading the server to reset a stream. A very effective strategy to clamp down on such clients is to count the number of server resets during a connection, and when that exceeds some threshold value, close the connection with a GOAWAY frame. Legitimate clients might make one or two mistakes in a connection and that is acceptable. A client that makes too many mistakes is probably either broken or malicious and closing the connection addresses both cases.
While responding to DoS attacks enabled by CVE-2023-44487, Cloudflare reduced maximum stream concurrency to 64. Before making this change, we were unaware that clients don't wait for SETTINGS and instead assume a concurrency of 100. Some web pages, such as an image gallery, do indeed cause a browser to send 100 requests immediately at the start of a connection. Unfortunately, the 36 streams above our limit all needed to be reset, which triggered our counting mitigations. This meant that we closed connections on legitimate clients, leading to a complete page load failure. As soon as we realized this interoperability issue, we changed the maximum stream concurrency to 100.
In 2019 several DoS vulnerabilities were uncovered related to implementations of HTTP/2. Cloudflare developed and deployed a series of detections and mitigations in response. CVE-2023-44487 is a different manifestation of HTTP/2 vulnerability. However, to mitigate it we were able to extend the existing protections to monitor client-sent RST_STREAM frames and close connections when they are being used for abuse. Legitimate client uses for RST_STREAM are unaffected.
In addition to a direct fix, we have implemented several improvements to the server's HTTP/2 frame processing and request dispatch code. Furthermore, the business logic server has received improvements to queuing and scheduling that reduce unnecessary work and improve cancellation responsiveness. Together these lessen the impact of various potential abuse patterns as well as giving more room to the server to process requests before saturating.
Cloudflare already had systems in place to efficiently mitigate very large attacks with less expensive methods. One of them is named "IP Jail". For hyper volumetric attacks, this system collects the client IPs participating in the attack and stops them from connecting to the attacked property, either at the IP level, or in our TLS proxy. This system however needs a few seconds to be fully effective; during these precious seconds, the origins are already protected but our infrastructure still needs to absorb all HTTP requests. As this new botnet has effectively no ramp-up period, we need to be able to neutralize attacks before they can become a problem.
To achieve this we expanded the IP Jail system to protect our entire infrastructure: once an IP is "jailed", not only it is blocked from connecting to the attacked property, we also forbid the corresponding IPs from using HTTP/2 to any other domain on Cloudflare for some time. As such protocol abuses are not possible using HTTP/1.x, this limits the attacker's ability to run large attacks, while any legitimate client sharing the same IP would only see a very small performance decrease during that time. IP based mitigations are a very blunt tool — this is why we have to be extremely careful when using them at that scale and seek to avoid false positives as much as possible. Moreover, the lifespan of a given IP in a botnet is usually short so any long term mitigation is likely to do more harm than good. The following graph shows the churn of IPs in the attacks we witnessed:
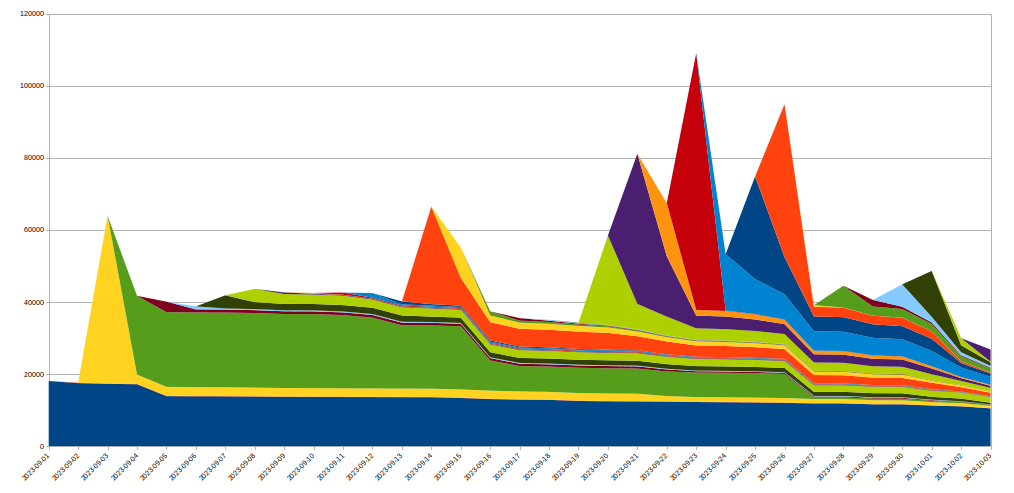
As we can see, many new IPs spotted on a given day disappear very quickly afterwards.
As all these actions happen in our TLS proxy at the beginning of our HTTPS pipeline, this saves considerable resources compared to our regular L7 mitigation system. This allowed us to weather these attacks much more smoothly and now the number of random 502 errors caused by these botnets is down to zero.
Another front on which we are making change is observability. Returning errors to clients without being visible in customer analytics is unsatisfactory. Fortunately, a project has been underway to overhaul these systems since long before the recent attacks. It will eventually allow each service within our infrastructure to log its own data, instead of relying on our business logic proxy to consolidate and emit log data. This incident underscored the importance of this work, and we are redoubling our efforts.
We are also working on better connection-level logging, allowing us to spot such protocol abuses much more quickly to improve our DDoS mitigation capabilities.
While this was the latest record-breaking attack, we know it won’t be the last. As attacks continue to become more sophisticated, Cloudflare works relentlessly to proactively identify new threats — deploying countermeasures to our global network so that our millions of customers are immediately and automatically protected.
Cloudflare has provided free, unmetered and unlimited DDoS protection to all of our customers since 2017. In addition, we offer a range of additional security features to suit the needs of organizations of all sizes. Contact us if you’re unsure whether you’re protected or want to understand how you can be.
Post Syndicated from Grant Bourzikas original http://blog.cloudflare.com/zero-day-rapid-reset-http2-record-breaking-ddos-attack/

Earlier today, Cloudflare, along with Google and Amazon AWS, disclosed the existence of a novel zero-day vulnerability dubbed the “HTTP/2 Rapid Reset” attack. This attack exploits a weakness in the HTTP/2 protocol to generate enormous, hyper-volumetric Distributed Denial of Service (DDoS) attacks. Cloudflare has mitigated a barrage of these attacks in recent months, including an attack three times larger than any previous attack we’ve observed, which exceeded 201 million requests per second (rps). Since the end of August 2023, Cloudflare has mitigated more than 1,100 other attacks with over 10 million rps — and 184 attacks that were greater than our previous DDoS record of 71 million rps.
This zero-day provided threat actors with a critical new tool in their Swiss Army knife of vulnerabilities to exploit and attack their victims at a magnitude that has never been seen before. While at times complex and challenging to combat, these attacks allowed Cloudflare the opportunity to develop purpose-built technology to mitigate the effects of the zero-day vulnerability.
If you are using Cloudflare for HTTP DDoS mitigation, you are protected. And below, we’ve included more information on this vulnerability, and resources and recommendations on what you can do to secure yourselves.
In late August 2023, our team at Cloudflare noticed a new zero-day vulnerability, developed by an unknown threat actor, that exploits the standard HTTP/2 protocol — a fundamental protocol that is critical to how the Internet and all websites work. This novel zero-day vulnerability attack, dubbed Rapid Reset, leverages HTTP/2’s stream cancellation feature by sending a request and immediately canceling it over and over.
By automating this trivial “request, cancel, request, cancel” pattern at scale, threat actors are able to create a denial of service and take down any server or application running the standard implementation of HTTP/2. Furthermore, one crucial thing to note about the record-breaking attack is that it involved a modestly-sized botnet, consisting of roughly 20,000 machines. Cloudflare regularly detects botnets that are orders of magnitude larger than this — comprising hundreds of thousands and even millions of machines. For a relatively small botnet to output such a large volume of requests, with the potential to incapacitate nearly any server or application supporting HTTP/2, underscores how menacing this vulnerability is for unprotected networks.
Threat actors used botnets in tandem with the HTTP/2 vulnerability to amplify requests at rates we have never seen before. As a result, our team at Cloudflare experienced some intermittent edge instability. While our systems were able to mitigate the overwhelming majority of incoming attacks, the volume overloaded some components in our network, impacting a small number of customers’ performance with intermittent 4xx and 5xx errors — all of which were quickly resolved.
Once we successfully mitigated these issues and halted potential attacks for all customers, our team immediately kicked off a responsible disclosure process. We entered into conversations with industry peers to see how we could work together to help move our mission forward and safeguard the large percentage of the Internet that relies on our network prior to releasing this vulnerability to the general public.
We cover the technical details of the attack in more detail in a separate blog post: HTTP/2 Rapid Reset: deconstructing the record-breaking attack.
There is no such thing as a “perfect disclosure.” Thwarting attacks and responding to emerging incidents requires organizations and security teams to live by an assume-breach mindset — because there will always be another zero-day, new evolving threat actor groups, and never-before-seen novel attacks and techniques.
This “assume-breach” mindset is a key foundation towards information sharing and ensuring in instances such as this that the Internet remains safe. While Cloudflare was experiencing and mitigating these attacks, we were also working with industry partners to guarantee that the industry at-large could withstand this attack.
During the process of mitigating this attack, our Cloudflare team developed and purpose-built new technology to stop these DDoS attacks and further improve our own mitigations for this and other future attacks of massive scale. These efforts have significantly increased our overall mitigation capabilities and resiliency. If you are using Cloudflare, we are confident that you are protected.
Our team also alerted web server software partners who are developing patches to ensure this vulnerability cannot be exploited — check their websites for more information.

Disclosures are never one and done. The lifeblood of Cloudflare is to ensure a better Internet, which stems from instances such as these. When we have the opportunity to work with our industry partners and governments to ensure there are no widespread impacts on the Internet, we are doing our part in increasing the cyber resiliency of every organization no matter the size or vertical.
To gain more of an understanding around mitigation tactics and next steps on patching, register for our webinar.
It may seem odd that Cloudflare was one of the first companies to witness these attacks. Why would threat actors attack a company that has some of the most robust defenses against DDoS attacks in the world?
The reality is that Cloudflare often sees attacks before they are turned on more vulnerable targets. Threat actors need to develop and test their tools before they deploy them in the wild. Threat actors who possess record-shattering attack methods can have an extremely difficult time testing and understanding how large and effective they are, because they don't have the infrastructure to absorb the attacks they are launching. Because of the transparency that we share on our network performance, and the measurements of attacks they could glean from our public performance charts, this threat actor was likely targeting us to understand the capabilities of the exploit.
But that testing, and the ability to see the attack early, helps us develop mitigations for the attack that benefit both our customers and industry as a whole.
I have been a CSO for over 20 years, on the receiving end of countless disclosures and announcements like this. But whether it was Log4J, Solarwinds, EternalBlue WannaCry/NotPetya, Heartbleed, or Shellshock, all of these security incidents have a commonality. A tremendous explosion that ripples across the world and creates an opportunity to completely disrupt any of the organizations that I have led — regardless of the industry or the size.
Many of these were attacks or vulnerabilities that we may have not been able to control. But regardless of whether the issue arose from something that was in my control or not, what has set any successful initiative I have led apart from those that did not lean in our favor was the ability to respond when zero-day vulnerabilities and exploits like this are identified.
While I wish I could say that Rapid Reset may be different this time around, it is not. I am calling all CSOs — no matter if you’ve lived through the decades of security incidents that I have, or this is your first day on the job — this is the time to ensure you are protected and stand up your cyber incident response team.
We’ve kept the information restricted until today to give as many security vendors as possible the opportunity to react. However, at some point, the responsible thing becomes to publicly disclose zero-day threats like this. Today is that day. That means that after today, threat actors will be largely aware of the HTTP/2 vulnerability; and it will inevitably become trivial to exploit and kickoff the race between defenders and attacks — first to patch vs. first to exploit. Organizations should assume that systems will be tested, and take proactive measures to ensure protection.
To me, this is reminiscent of a vulnerability like Log4J, due to the many variants that are emerging daily, and will continue to come to fruition in the weeks, months, and years to come. As more researchers and threat actors experiment with the vulnerability, we may find different variants with even shorter exploit cycles that contain even more advanced bypasses.
And just like Log4J, managing incidents like this isn’t as simple as “run the patch, now you’re done”. You need to turn incident management, patching, and evolving your security protections into ongoing processes — because the patches for each variant of a vulnerability reduce your risk, but they don’t eliminate it.
I don’t mean to be alarmist, but I will be direct: you must take this seriously. Treat this as a full active incident to ensure nothing happens to your organization.
While no one security event is ever identical to the next, there are lessons that can be learned. CSOs, here are my recommendations that must be implemented immediately. Not only in this instance, but for years to come:
Cloudflare’s mission is to help build a better Internet. If you are concerned with your current state of DDoS protection, we are more than happy to provide you with our DDoS capabilities and resilience for free to mitigate any attempts of a successful DDoS attack. We know the stress that you are facing as we have fought off these attacks for the last 30 days and made our already best in class systems, even better.
If you’re interested in finding out more, we have a webinar coming up with more details on the zero-day and how to respond; you can register here. We also have more technical details of the attack in more detail in a separate blog post: HTTP/2 Rapid Reset: deconstructing the record-breaking attack. Finally, if you’re being targeted or need immediate protection, please contact your local Cloudflare representative or visit https://www.cloudflare.com/under-attack-hotline/.
Post Syndicated from Grant Bourzikas original http://blog.cloudflare.com/ko-kr/zero-day-rapid-reset-http2-record-breaking-ddos-attack-ko-kr/
오늘 Cloudflare는 Google, Amazon AWS와 함께 “HTTP/2 Rapid Reset” 공격이라는 새로운 zero-day 취약성의 존재를 공개했습니다. 이 공격은 HTTP/2 프로토콜의 약점을 악용하여 거대 하이퍼 볼류메트릭 분산 서비스 거부 (DDoS) 공격을 생성합니다. Cloudflare는 최근 몇 달간 이런 빗발치는 공격을 완화하였는데, 그중에는 이전에 우리가 목격한 것보다 규모가 3배 큰, 초당 2억 100만 요청(rps)을 넘어서는 공격도 있었습니다. Cloudflare는 2023년 8월 말부터 1,000만 rps가 넘는 기타 공격 1,100건 이상을 완화하였으며, 184건은 이전 DDoS 기록인 7,100만 rps보다도 큰 공격이었습니다.
위협 행위자들은 이러한 zero-day를 통해 취약성이라는 맥가이버 칼에 치명적인 도구를 새로 더하여 이전에 본 적 없는 규모로 피해자를 공격할 수 있게 되었습니다. 때로는 복잡하고 힘든 싸움이었지만, Cloudflare는 이러한 공격을 통해 zero-day 취약성의 영향을 완화하기 위한 기술을 개발할 수 있었습니다.
HTTP DDoS 완화를 위해 Cloudflare를 이용 중이시라면, 여러분은 보호받고 있습니다. 이 취약성에 대해 아래에서 더 알아보고, 스스로를 보호하기 위해 할 수 있는 리소스와 권장 사항을 확인해 보세요.
2023년 8월 말, Cloudflare 팀은 알 수 없는 위협 행위자가 개발한 새로운 zero-day 취약성을 발견하였습니다. 이 취약성은 인터넷 및 모든 웹 사이트의 작동에 필수적인 표준 HTTP/2 프로토콜을 악용합니다. Rapid Reset이라는 별명이 붙은 이 새로운 zero-day 취약성 공격은 요청 전송 후 즉각적 취소를 반복함으로써 HTTP/2 스트림 취소 기능을 활용합니다.
작은 규모의 “요청, 취소, 요청, 취소” 패턴을 대규모로 자동화함으로써 위협 행위자는 서비스 거부를 생성하며 HTTP/2의 표준 구현을 실행하는 모든 서버 또는 애플리케이션도 쓰러뜨릴 수 있습니다. 또한 이 기록적인 공격에 대해 알아야 할 한 가지 중대한 사항은 이 공격에 관여하는 봇넷이 대략 2만 개의 머신으로 구성되어 규모가 크지 않다는 사실입니다. Cloudflare는 수십, 수백만 개의 머신으로 구성되어 이보다 훨씬 더 큰 규모의 봇넷을 정기적으로 감지합니다. 비교적 작은 봇넷이 이렇게나 많은 요청을 출력하고 HTTP/2를 지원하는 거의 모든 서버나 애플리케이션을 무력화시킬 수 있다는 것은 이러한 취약성이 보호받지 않는 네트워크에 얼마나 위협적인지 잘 알려 줍니다.
위협 행위자는 HTTP/2 취약성과 봇넷을 함께 사용함으로써 이전에 본 적 없는 비율로 요청을 증폭시켰습니다. 그 결과 Cloudflare 팀은 간헐적 에지 불안정을 다소 경험했습니다. Cloudflare 시스템은 압도적인 수의 공격 유입을 완화할 수 있었지만, 네트워크의 일부 구성 요소에 과부하가 발생했습니다. 이로 인해 간헐적으로 400번 대 및 500번 대 오류가 발생하여 소수의 고객 성능에 영향을 미쳤습니다. 하지만 이 오류는 모두 신속하게 해결되었습니다.
이러한 문제를 성공적으로 완화하고 모든 고객에 대한 잠재적 공격을 중지시킨 후, Cloudflare 팀은 즉시 책임감 있는 공개 프로세스를 시작했습니다. Cloudflare는 일반 대중에게 이 취약성을 공개하기 전에 업계 동료 기업과의 대화를 통해 Cloudflare의 사명을 진전시키고, 당사 네트워크에 의존하는 인터넷의 상당 부분을 보호하기 위한 방법을 모색했습니다.
Cloudflare는 별도의 블로그 게시물을 통해 이 공격에 대한 기술적 세부 사항을 더 자세히 다루었습니다: HTTP/2 Rapid Reset: 기록적인 공격의 분석.
“완벽한 공개”라는 것은 없습니다. 공격을 차단하고 새롭게 발생하는 사건에 대응하기 위해 조직과 보안 팀은 침해를 가정하는 사고방식을 가져야 합니다. 또 다른 zero-day와 새롭게 진화하는 위협 행위자 집단, 전에 본 적 없는 공격과 기술이 앞으로 언제든 등장할 것이기 때문입니다.
이러한 “침해 가정” 사고방식은 정보 공유의 핵심 기반이며, 이러한 상황에서 인터넷을 안전하게 유지하도록 보장합니다. Cloudflare는 이러한 공격을 경험하고 완화하는 동시에 업계 파트너와 협업하여 업계 전반이 이러한 공격을 확실히 견뎌낼 수 있도록 노력하고 있습니다.
이 공격을 완화하는 과정에서 Cloudflare 팀은 이러한 DDoS 공격을 중지하고, 이번 공격 및 향후 발생할 기타 대규모 공격에 대비하여 자체 완화 능력을 개선시킬 목적으로 새로운 기술을 개발 및 구축했습니다. 이러한 노력은 Cloudflare의 전반적 완화 역량과 복원력을 크게 높였습니다. 만약 Cloudflare를 이용 중이시라면, 여러분은 보호받고 있다고 자신 있게 말씀드릴 수 있습니다.
또한 Cloudflare 팀은 이러한 취약성을 절대 악용할 수 없도록 하기 위해, 패치를 개발하고 있는 웹 서버 소프트웨어 파트너사에도 이 사실을 알렸습니다. 해당 파트너사의 웹 사이트에서 자세한 정보를 확인하세요.
공개는 결코 일회성으로 끝나는 것이 아닙니다. Cloudflare의 생명선은 더 나은 인터넷을 보장하는 것이며, 이는 이러한 사례로부터 시작됩니다. 업계 파트너 및 정부와 협력하여 인터넷에 광범위한 영향을 미치지 않도록 보장할 수 있는 기회가 있을 때, Cloudflare는 규모와 범주에 관계없이 모든 조직의 사이버 복원력을 키우기 위해 본분을 다하고 있습니다.
완화 전략 및 다음 패치 단계에 대해 자세히 알아보려면, 웨비나에 등록하세요.
이러한 공격을 가장 먼저 목격한 회사 중 하나가 Cloudflare라는 사실이 이상하게 보일 수도 있습니다. 위협 행위자들이 세계에서 가장 강력한 DDoS 공격 방어 체계를 갖춘 회사를 공격하는 이유는 무엇일까요?
실제로 Cloudflare는 더 취약한 대상에게 공격이 실행되기 전에 이를 감지하는 경우가 많습니다. 위협 행위자들은 도구를 야생에 배포하기 전에 개발하고 테스트해야 합니다. 전례 없는 공격 기법을 보유한 위협 행위자는 자신들이 개시하는 공격을 소화할 인프라가 부족하므로 공격의 규모와 효과를 테스트하고 파악하는 데 어려움을 겪을 수 있습니다. Cloudflare가 네트워크 성능에 대해 공유하는 투명성과 Cloudflare의 공개 성능 차트에서 확보할 수 있는 공격 측정값 때문에, 위협 행위자는 악용 역량을 파악하기 위하여 Cloudflare를 대상으로 삼았을 가능성이 높습니다.
그러나 해당 테스트와 공격을 조기에 감지할 수 있는 능력은 Cloudflare가 고객과 업계 전체에 도움을 주는 공격 완화 방법을 개발할 수 있도록 합니다.
저는 20년 이상을 CSO로 일하면서 이와 같은 수없이 많은 공개와 발표를 접해왔습니다. 그러나 이것이 Log4J이든, Solarwinds, EternalBlue WannaCry/NotPetya, Heartbleed, 혹은 Shellshock이든, 이러한 보안 사고에는 모두 공통점이 있습니다. 이 거대한 폭발은 전 세계에 파문을 일으키고 산업이나 규모에 관계 없이 제가 이끌었던 모든 조직을 완전히 혼란에 빠뜨릴 수 기회를 만들어 낸다는 것이죠.
이 중 상당수는 제어가 불가능했던 공격이나 취약성이었습니다. 그러나 해당 문제가 제가 제어할 수 있는 사안에서 발생했는지와 관계없이, 제가 이끈 성공적인 이니셔티브와 그렇지 않은 이니셔티브를 차별화할 수 있었던 것은 이와 같은 zero-day 취약성과 그 악용이 발견되었을 때 대응할 수 있는 능력이었습니다.
이번 Rapid Reset은 다를 것이라고 말할 수 있었다면 좋았겠지만, 그렇지 않습니다. 수십 년 동안 보안 사고를 겪어온 CSO든 오늘이 CSO로서의 첫 출근이든 관계없이 저는 모든 CSO분들께 지금이 바로 여러분을 보호하고 사이버 사고 대응팀을 강화해야 할 시기라고 말씀드립니다.
저희는 최대한 많은 보안 공급자가 대응할 기회를 제공하기 위해 오늘날까지 정보를 제한해 왔습니다. 그러나 언젠가는 이러한 zero-day 위협을 대중에 공개해야 합니다. 오늘이 바로 그날입니다. 이는 오늘 이후로 위협 행위자들이 HTTP/2 취약성에 대해 대부분 인지하게 될 것이며, 이를 악용하는 것은 필연적으로 방어자와 공격자 간의 경쟁, 즉 먼저 패치를 적용하는 것과 먼저 악용하는 것 사이의 경쟁을 시작하게 될 것을 의미합니다. 조직은 시스템이 테스트 될 것이라는 전제하에 보안을 확보하기 위해 사전 조처를 해야 합니다.
저에게 이 사건은 Log4J 같은 취약성을 떠올리게 합니다. 많은 변종이 매일 새롭게 떠올라 앞으로 몇 주, 몇 달, 몇 년 동안 연이어 결실을 보게 될 것이니까요. 더 많은 연구원과 위협 행위자들이 이 취약성을 시험함에 따라, 우리는 훨씬 발전한 우회로를 포함하며 훨씬 짧은 악용 주기를 가진 다양한 변종을 마주할 수 있습니다.
그리고 Log4J와 마찬가지로, 이러한 사고를 다루는 것은 “패치를 적용하시면 됩니다.”라고 할 수 있을 만큼 간단하지가 않습니다. 여러분은 사고 관리, 패치, 보안 보호의 진화를 지속적인 과정으로 전환시켜야 합니다. 취약성의 각 변종에 대한 패치가 위험 요소를 줄여줄 수는 있지만, 완전히 제거하지는 않기 때문입니다.
불안을 조장하려는 것은 아니지만, 직설적으로 말씀드립니다. 여러분은 이 문제를 심각하게 받아들여야 합니다. 조직에 아무 일도 일어나지 않게 하려면 이를 정식 사고로 취급해야 합니다.
어떤 보안 사건도 다음 사건과 동일할 수는 없지만, 배울 수 있는 교훈은 있습니다. CSO 여러분, 즉시 시행할 수 있는 권장 사항을 말씀드리겠습니다. 이는 이번 사례뿐만 아니라, 앞으로 다가올 몇 년 동안에도 마찬가지입니다.
Cloudflare의 사명은 더 나은 인터넷 구축을 지원하는 것입니다. 현재 DDoS 방어 상태가 염려된다면, 성공적인 DDoS 공격 시도를 완화할 수 있는 DDoS 대응 기능 및 복원력을 기꺼이 무료로 제공해 드리겠습니다. Cloudflare는 지난 30일간 이러한 공격에 맞서 싸우며 동급 최고의 시스템을 더욱 개선했기 때문에 여러분이 받고 있는 스트레스를 이해합니다.
자세한 내용이 궁금하다면, zero-day에 대한 세부 사항과 대응 방법에 관한 웨비나를 시청하세요. 보호받고 있는지 잘 모르겠거나 어떻게 보호받을 수 있는지 알고 싶다면 이곳으로 문의하세요. 또한 Cloudflare는 별도의 블로그 게시물에서 해당 공격에 대한 기술적 세부 사항을 더 자세히 다루었습니다. HTTP/2 Rapid Reset: 기록적인 공격의 분석. 마지막으로 만약 공격의 대상이 되었거나 즉각적 보호가 필요하다면, 여러분의 Cloudflare 지역 담당자에게 연락하거나 https://www.cloudflare.com/under-attack-hotline/을 방문하십시오.
Post Syndicated from Lucas Pardue original http://blog.cloudflare.com/ja-jp/technical-breakdown-http2-rapid-reset-ddos-attack-ja-jp/
2023年8月25日以降、当社では、多くのお客様を襲った異常に大規模なHTTP攻撃を目撃し始めました。これらの攻撃は当社の自動DDoSシステムによって検知され、軽減されました。しかし、これらの攻撃が記録的な規模に達するまで、それほど時間はかかりませんでした。その規模は、過去に記録された最大の攻撃の約3倍にも達したのです。
懸念となるのは、攻撃者がわずか2万台のボットネットでこの攻撃を実行できたという事実です。今日、数万台から数百万台のマシンで構成されるボットネットが存在しています。Web上では全体として通常1秒間に10億から30億のリクエストしかないことを考えると、この方法を使えば、Webのリクエスト全体を少数のターゲットに集中させることができます。
これは前例のない規模の斬新な攻撃ベクトルでしたが、Cloudflareの既存の保護システムは攻撃の矛先をほぼ吸収することができました。当初はお客様のトラフィックに若干の影響が見られたものの(攻撃の初期波ではリクエストのおよそ1%に影響)、現在では緩和方法を改良し、当社のシステムに影響を与えることなく、Cloudflareのすべてのお客様に対する攻撃を阻止することができるようになりました。
当社は、業界の最大手であるGoogleとAWSの2社と同時に、この攻撃に気づきました。当社はCloudflareのシステムを強化し、今日ではすべてのお客様がこの新しいDDoS攻撃手法から保護され、お客様への影響がないことを確認しました。当社はまた、グーグルやAWSとともに、影響を受けるベンダーや重要インフラストラクチャプロバイダーへの攻撃に関する協調的な情報開示に参加しました。
この攻撃は、HTTP/2プロトコルのいくつかの機能とサーバー実装の詳細を悪用することで行われました(詳細は、CVE-2023-44487をご覧ください)。この攻撃はHTTP/2プロトコルにおける根本的な弱点を悪用しているため、HTTP/2を実装しているすべてのベンダーがこの攻撃の対象になると考えられます。これには、すべての最新のWebサーバーも含まれます。当社は、GoogleとAWSとともに、Webサーバーベンダーがパッチを実装できるよう、攻撃方法を開示しました。一方で、Webに面したWebやAPIサーバーの前段階に設置されるCloudflareのようなDDoS軽減サービスを利用するのが最善の防御策とります。
この投稿では、HTTP/2プロトコルの詳細、攻撃者がこれらの大規模な攻撃を発生させるために悪用した機能、およびすべてのお客様が保護されていることを保証するために当社が講じた緩和策について詳細を掘り下げて紹介します。これらの詳細を公表することで、影響を受ける他のWebサーバーやサービスが緩和策を実施するために必要な情報を得られることを期待しています。そしてさらに、HTTP/2プロトコル規格チームや、将来のWeb規格に取り組むチームには、こうした攻撃を防ぐためHTTP/2プロトコルの設計改善に役立てていただければと思っています。
HTTPは、Webを稼働するにあたって用いられるアプリケーションプロトコルです。HTTPセマンティクスとは、リクエストとレスポンスメッセージ、メソッド、ステータスコード、ヘッダーフィールドとトレーラフィールド、メッセージコンテンツなど、全体的なアーキテクチャ、用語、プロトコルの側面に関し、あらゆるバージョンに共通しています。個々のHTTPバージョンでは、セマンティクスをインターネット上でやりとりするための「ワイヤーフォーマット」に変換する方法を定義しています。例えば、クライアントはリクエストメッセージをバイナリデータにシリアライズして送信し、サーバーがこれを解析して処理可能なメッセージに戻します。
HTTP/1.1は、テキスト形式のシリアライズを使用します。リクエストメッセージとレスポンスメッセージはASCII文字のストリームとしてやりとりされ、TCPのような信頼性の高いトランスポートレイヤーを介して、以下のフォーマットで送信されます(「CRLF」はキャリッジリターンとラインフィードを意味します):
 HTTP-message   = start-line CRLF
                   *( field-line CRLF )
                   CRLF
                   [ message-body ]
例えば、ワイヤ上の非常に簡単なGETリクエストは、https://blog.cloudflare.com/となります:
GET / HTTP/1.1 CRLFHost: blog.cloudflare.comCRLFCRLF
そして、応答は次のようなものになります:
HTTP/1.1 200 OK CRLFServer: cloudflareCRLFContent-Length: 100CRLFtext/html; charset=UTF-8CRLFCRLF<100 bytes of data>
このフォーマットは、ワイヤ上でメッセージをフレーム化します。つまり、1つのTCP接続を使って複数のリクエストとレスポンスをやり取りすることが可能になります。しかし、このフォーマットでは、各メッセージがまとめて送信される必要があります。さらに、リクエストと応答を正しく関連付けるために、厳密な順序が要求されます。つまり、メッセージは順序だてて交換され、多重化することはできません。https://blog.cloudflare.com/、https://blog.cloudflare.com/page/2/の2つのGETリクエストは、次のようになります:
GET / HTTP/1.1 CRLFHost: blog.cloudflare.comCRLFCRLFGET /page/2/ HTTP/1.1 CRLFHost: blog.cloudflare.comCRLFCRLF
レスポンスは、次のようになります:
HTTP/1.1 200 OK CRLFServer: cloudflareCRLFContent-Length: 100CRLFtext/html; charset=UTF-8CRLFCRLF<100 bytes of data>CRLFHTTP/1.1 200 OK CRLFServer: cloudflareCRLFContent-Length: 100CRLFtext/html; charset=UTF-8CRLFCRLF<100 bytes of data>
Webページでは、これらの例よりも複雑なHTTPインタラクションが必要となります。Cloudflareブログにアクセスすると、ブラウザは複数のスクリプト、スタイル、メディアアセットを読み込みます。HTTP/1.1を使ってトップページを訪れ、すぐに2ページ目に移動した場合、ブラウザは2つの選択肢から選ぶことになります。ページ2が始まる前に、ページに対するキューに入れられたものでもう必要のないものすべての応答を待つか、TCP接続を閉じて新しい接続を開くことで、実行中のリクエストをキャンセルすることのいずれかとなります。どちらも、あまり現実的ではありません。ブラウザは、TCP接続のプール(ホストあたり最大6つ)を管理し、プール上で複雑なリクエストディスパッチロジックを実装することによって、これらの制限を回避する傾向があります。
HTTP/2は、HTTP/1.1の多くの問題に対処しています。各HTTPメッセージは、型、長さ、フラグ、ストリーム識別子(ID)と悪意のあるペイロードを持つHTTP/2フレームのセットにシリアライズされます。ストリームIDは、ワイヤ上のどのバイトがどのメッセージに適用されるかを明確にし、安全な多重化と同時実行を可能にします。ストリームは、双方向となります。クライアントはフレームを送信し、サーバーは同じIDを使ったフレームを返信します。
HTTP/2では、https://blog.cloudflare.comへの当社のGETリクエストはストリームID 1でやり取りされ、クライアントは1つのHEADERSフレームを送信し、サーバーは1つのHEADERSフレームと、それに続く1つ以上のDATAフレームで応答します。クライアントのリクエストは常に奇数番号のストリームIDを使用するので、後続のリクエストはストリームID 3、5、…を使用することになります。レスポンスはどのような順番でも提供することができ、異なるストリームからのフレームをインターリーブすることもできます。
ストリーム多重化と同時実行は、HTTP/2の強力な機能です。これらは、単一のTCP接続をより効率的に使用することを可能にします。HTTP/2は、特に優先順位付けと組み合わせると、リソースの取得を最適化します。反面、クライアントが大量の並列作業を簡単に開始できるようにすることは、HTTP/1.1と比くらべサーバーリソースに対するピーク需要を増加させる可能性があります。これは明らかに、サービス拒否のベクトルです。
複数の防護策を提供するため、HTTP/2は最大アクティブ同時ストリームの概念を活用します。SETTINGS_MAX_CONCURRENT_STREAMSパラメータにより、サーバーは同時処理数の上限をアドバタイズできます。例えば、サーバーが上限を100とした場合、常時アクティブにできるのは100リクエストだけになります。クライアントがこの制限を超えてストリームを開こうとした場合、RST_STREAMフレームを使用してサーバーに拒否される必要があります。ストリーム拒否は、接続中の他のストリームには影響しません。
本当のところはもう少し複雑になります。ストリームには、ライフサイクルがあります。下図はHTTP/2ストリームのステートマシンの図です。クライアントとサーバーはストリームの状態をそれぞれ管理します。HEADERS、DATA、RST_STREAMフレームが送受信されると遷移が発生します。ストリームの状態のビューは独立していますが、同期しています。
HEADERSとDATAフレームはEND_STREAMフラグを含み、このフラグが値1(true)にセットされると、ステート遷移のトリガーとなります。
メッセージコンテンツを持たないGETリクエストの例で説明します。クライアントはまずストリームをアイドル状態からオープン状態に、続いて即座にハーフクローズ状態に遷移させます。クライアントのハーフクローズ状態は、もはやHEADERSやDATAを送信できないことを意味し、WINDOW_UPDATE、PRIORITY、RST_STREAMフレームのみを送信できます。ただし、任意のフレームを受信することができます。
サーバーがHEADERSフレームを受信して解析すると、ストリームの状態をアイドル状態からオープン状態、そしてハーフクローズ状態に遷移させ、クライアントと一致させます。サーバーがハーフクローズ状態であれば、どんなフレームでも送信できますが、WINDOW_UPDATE、PRIORITY、またはRST_STREAMフレームしか受信できないことを意味します。
そのため、サーバーはEND_STREAMフラグを0に設定したHEADERSを送信し、次にEND_STREAMフラグを1に設定したDATAを送信します。DATAフレームは、サーバーでハーフクローズドからクローズドへのストリームの遷移をトリガーします。クライアントがこのフレームを受信すると、ストリームもクローズドに遷移します。ストリームがクローズされると、フレームの送受信はできなくなります。
このライフサイクルを今カレンシーの文脈に当てはめ直し、HTTP/2は次のように記述します:
「オープン」状態にあるストリーム、または「ハーフクローズド」状態のいずれかにあるストリームは、エンドポイントが開くことを許可されるストリームの最大数にカウントされます。これら3つの状態のいずれかにあるストリームは、SETTINGS_MAX_CONCURRENT_STREAMS設定でアドバタイズされる制限にカウントされます。
理論的には、コンカレンシーの制限は、有用です。しかし、その効果を妨げる現実的な要因があります。詳細は、このブログの後半で開設します。
前段で、クライアントからの実行中のリクエストのキャンセルについて説明しました。HTTP/2は、HTTP/1.1よりもはるかに効率的な方法でこれをサポートしています。接続全体を切断するのではなく、クライアントは1つのストリームに対してRST_STREAMフレームを送信することができます。サーバーにリクエストの処理を中止し、レスポンスを中止するよう指示するものです。これによって、Free 、サーバーのリソースを節約し、帯域幅の浪費を避けることができます。
先ほどの3つのリクエストの例を考えてみます。このときクライアントは、すべてのHEADERSが送信された後に、ストリーム1のリクエストをキャンセルします。サーバーは、応答を提供する準備ができる前にこのRST_STREAMフレームを解析し、代わりにストリーム3と5にのみ応答します:
リクエストのキャンセルは、便利な機能です。たとえば、複数の画像を含むウェブページをスクロールするとき、Webブラウザはビューポートの外にある画像をキャンセルすることができ、ビューポートに入る画像をより速く読み込むことができます。HTTP/2は、HTTP/1.1に比べてこの動作をより効率的にしています。
キャンセルされたリクエストストリームは、ストリームのライフサイクルを急速に遷移していきます。END_STREAMフラグが1に設定されたクライアントのHEADERSは、状態をアイドルからオープン、ハーフクローズへと遷移させ、RST_STREAMは直ちにハーフクローズからクローズへと遷移させます。
ストリームの同時実行数制限に寄与するのは、オープン状態またはハーフクローズ状態にあるストリームだけであることを思い出してください。クライアントがストリームをキャンセルすると、そのクライアントは即座に別のストリームをオープンできるようになり、すぐに別のリクエストを送信できるようになります。これがCVE-2023-44487を機能させる要諦なのです。
HTTP/2リクエストのキャンセルは、制限のない数のストリームを急速にリセットするために悪用される可能性があります。HTTP/2サーバーがクライアントから送信されたRST_STREAMフレームを処理し、十分に迅速に状態を取りやめることができる場合、こうした迅速なリセットは問題を引き起こしません。問題が発生し始めるのは、片付ける際に何らかの遅延やタイムラグがある場合です。クライアントは非常に多くのリクエストを処理するため、作業のバックログが蓄積され、サーバーのリソースを過剰に消費することになります。
一般的なHTTPデプロイメントアーキテクチャは、HTTP/2プロキシやロードバランサーを他のコンポーネントの前で実行することになっています。クライアントのリクエストが到着すると、それはすぐにディスパッチされ、実際の作業は非同期アクティビティとして別の場所で行われます。これにより、プロキシはクライアントのトラフィックを非常に効率的に処理することができます。しかし、このような懸念の層別は、プロキシが処理中のジョブを片付けることを難しくします。そのため、これらのデプロイでは、急速なリセットによる問題が発生しやすくなります。
Cloudflareのリバースプロキシは、HTTP/2クライアントのトラフィックを処理する際、接続ソケットからデータをバッファにコピーし、バッファリングされたデータを順番に処理していきます。各リクエストが読み込まれると(HEADERSとDATAフレーム)、アップストリームサービスにディスパッチされます。RST_STREAMフレームが読み込まれると、リクエストのローカル状態が破棄され、リクエストがキャンセルされたことがアップストリームに通知されます。バッファ全体が消費されるまで、これが繰り返されます。しかしながら、このロジックは悪用される可能性があります。悪意のあるクライアントが膨大なリクエストの連鎖を送信し始め、接続の開始時にリセットされると、当社のサーバーはそれらすべてを熱心に読み込み、新しい着信リクエストを処理できなくなるほどのストレスをアップストリームサーバーにもたらすでしょう。
強調すべき重要な点は、ストリームの同時実行性だけでは急激なリセットを緩和できないということです。サーバーがSETTINGS_MAX_CONCURRENT_STREAMSの値を選んだとしても、クライアントは高いリクエストレートを生成するためにリクエストを繰り返すことができます。
以下、合計1000リクエストを試みる概念実証クライアントを使用して再現された高速リセットの例を示します。軽減策は一切設けず、市販品のサーバーを用いたテスト環境で、443番ポートを用いています。トラフィックはWiresharkを使って分解され、わかりやすくするためにHTTP/2トラフィックだけを表示するようにフィルタリングされています。進めるには、pcapをダウンロードしてください。
コマ数が多いので、ちょっと見づらいかもしれません。WiresharkのStatistics> HTTP2ツールで簡単な要約をまとめています:
このトレースの最初のフレームであるパケット14はサーバーのSETTINGSフレームであり、最大ストリーム同時実行数100をアドバタイズしています。パケット15では、クライアントはいくつかの制御フレームを送信し、その後、急速にリセットするリクエストを開始します。最初のHEADERSフレームは26バイト長ですが、それ以降のHEADERSはすべて9バイトです。このサイズの違いは、HPACKと呼ばれる圧縮技術によるものです。パケット15は合計で525のリクエストを含み、ストリーム1051まで増やされます。
興味深いことに、ストリーム1051のRST_STREAMはパケット15に適合しないため、パケット16ではサーバーが404応答しているのがわかります。その後、残りの475リクエストの送信に移る前に、パケット17でクライアントがRST_STREAMを送信しています。
サーバーは100の同時ストリームをアドバタイズしていますが、クライアントが送信したパケットはいずれも、それよりも多くのHEADERSフレームを送信しています。クライアントはサーバーからの折り返しのトラフィックを待つ必要がなく、送信できるパケットのサイズによってのみ制限されています。このトレースにはサーバーのRST_STREAMフレームは見られず、サーバーは同時ストリーム違反を観測していないことを示しています。
上述したように、リクエストがキャンセルされると、アップストリームサービスは通知を受け、多くのリソースを浪費する前にリクエストを中止することができます。今回の攻撃では、ほとんどの悪意あるリクエストが配信元サーバーに転送されることはありませんでした。しかし、これらの攻撃の規模が大きいため、何らかの影響が引き起こされます。
まず、リクエストの着信率がこれまでにないピークに達したため、クライアントが目にする502エラーのレベルが上昇したという報告がありました。これは、最も影響を受けたデータセンターで発生しており、すべてのリクエストを処理するのに難儀しました。当社のネットワークは大規模な攻撃にも対応できるようになっているものの、今回の脆弱性は当社のインフラストラクチャの弱点を露呈するものでした。データセンターのひとつに届いたリクエストがどのように処理されるかを中心に、詳細をもう少し掘り下げてみましょう:
Cloudflareのインフラストラクチャは、役割の異なるプロキシサーバのチェーンで構成されていることがわかります。特に、クライアントがHTTPSトラフィックを送信するためにCloudflareに接続すると、まずTLS復号化プロキシに当たります。このプロキシはTLSトラフィックを復号化し、HTTP 1、2、または3トラフィックを処理した後、「ビジネスロジック」プロキシに転送します。このプロキシは、各顧客のすべての設定をロードし、リクエストを他のアップストリームサービスに正しくルーティングする役割を担っており、さらに当社の場合ではセキュリティ機能も担っています。このプロキシで、L7攻撃緩和の処理が行われます。
この攻撃ベクトルでの問題点は、すべての接続で非常に多くのリクエストを素早く送信することになります。当社がブロックするチャンスを得る前に、そのひとつひとつがビジネスロジックプロキシに転送されなければならなりませんでした。リクエストのスループットがプロキシのキャパシティを上回るようになると、この2つのサービスをつなぐパイプは、いくつかのサーバーで飽和レベルに達しました。
これが起こると、TLSプロキシはアップストリームプロキシに接続できなくなり、最も深刻な攻撃時に「502 Bad Gateway」エラーが表示されるクライアントがあるのは、これが理由です。重要なのは、現在ではHTTP分析の作成に使用されるログは、ビジネスロジックプロキシからも出力されることになります。その結果、これらのエラーはCloudflareのダッシュボードには表示されません。当社内部のダッシュボードによると、(緩和策を実施する前の)最初の攻撃波では、リクエストの約1%が影響を受け、8月29日の最も深刻な攻撃では数秒間で約12%のピークが見られました。次のグラフは、この現象が起きていた2時間にわたるエラーの割合を示したものです:
当社では、この記事の後半で詳述するとおり、その後の数日間でこの数を劇的に減らすことに努めました。当社によるスタックの変更と軽減策により、こうした攻撃の規模が大幅に縮小されたおかげで、この数は今日では事実上ゼロになっています:
一部の顧客から報告されたもう一つの症状に、499エラーの増加がありました。この理由は少し違っており、この投稿で前述したHTTP/2接続の最大ストリームの同時実行数に関連しています。
HTTP/2の設定は、SETTINGSフレームを使用して接続の開始時に交換されます。明示的なパラメータを受け取らない場合、デフォルト値が適用されます。クライアントがHTTP/2接続を確立すると、サーバーの設定を待つ(遅い)か、デフォルト値を想定してリクエストを開始(速い)することになります。SETTINGS_MAX_CONCURRENT_STREAMSでは、デフォルトでは事実上無制限となります(ストリームIDは31ビットの数値空間を使用し、リクエストは奇数を使用するため、実際の制限は1073741824となります)。仕様では、サーバーが提供するストリーム数は100を下回らないようにすることを推奨しています。クライアントは一般的にスピードを重視するため、サーバーの設定を待つ傾向がなく、ちょっとした競合状態が発生します。つまり、クライアントは、サーバーがどのリミットを選択するかという賭けに出ているのです。もし間違ったリミットを選択すれば、リクエストは拒否され、再試行しなければならなくなります。1073741824ストリームに賭けるギャンブルは、賢明ではありません。その代わり、多くのクライアントは、サーバーが仕様の推奨に従うことを期待し、同時ストリーム発行数を100に制限することにしています。サーバーが100以下のものを選んだ場合、このクライアントのギャンブルは失敗し、ストリームはリセットされます。
サーバーによるストリームのリセットには、同時実行数の上限を超えた場合など、たくさんの理由があります。HTTP/2は厳格であり、構文解析やロジックエラーが発生した場合はストリームを閉じる必要があります。2019年、CloudflareはHTTP/2のDoS脆弱性に対応して複数の緩和策を開発しました。これらの脆弱性のいくつかは、クライアントが誤動作を起こし、サーバーがストリームをリセットすることによって引き起こされていました。そのようなクライアントを取り締まるための非常に効果的な戦略は、接続中のサーバーリセットの回数をカウントし、それがある閾値を超えたらGOAWAYフレームで接続を閉じることになります。正当なクライアントは、接続中に1つか2つのミスをするかもしれないものの、それは許容範囲内となります。あまりにも多くのミスをするクライアントは、おそらく壊れているか悪意のあるクライアントであり、接続を閉じることで両方のケースに対処できます。
CVE-2023-44487によるDoS攻撃に対応している間、Cloudflareはストリームの最大同時実行数を64に減らしました。この変更を行う前、当社はクライアントがSETTINGSを待たず、代わりに100の同時実行を想定していることを知りませんでした。画像ギャラリーのような一部のWebページでは、接続開始時にブラウザがすぐに100リクエストを送信することがあります。残念ながら、制限を超えた36のストリームはすべてリセットする必要があり、これがカウント緩和のトリガーとなりました。つまり、正当なクライアントの接続を閉じてしまい、ページのロードが完全に失敗してしまったのです。この相互運用性の問題に気づいてすぐに、ストリームの最大同時接続数を100に変更しました。
2019年、HTTP/2の実装に関連する複数のDoS脆弱性が発覚しました。Cloudflareはこれを受けて一連の検出と緩和策を開発し、デプロイしました。CVE-2023-44487は、HTTP/2の脆弱性の異なる症状です。しかし、この脆弱性を緩和するために、クライアントから送信されるRST_STREAMフレームを監視し、不正に使用されている場合は接続を閉じるよう、既存の保護を拡張することができました。RST_STREAMの正当なクライアント利用への影響はありませんでした。
直接的な修正に加え、サーバーのHTTP/2フレーム処理とリクエストディスパッチコードにいくつかの改善を実装しました。さらに、ビジネスロジックサーバーではキューイングとスケジューリングを改善し、不要な作業が減り、キャンセルの応答性が向上しました。これらを組み合わせることで、様々な悪用パターンの可能性の影響を軽減し、サーバーに飽和する前にリクエストを処理するための余裕を与えることができました。
Cloudflareはすでに、より安価な方法で非常に大規模な攻撃を効率的に軽減するシステムを導入していました。その一つが、「IP Jail」というものです。ハイパー帯域幅消費型攻撃の場合、このシステムは攻撃に参加しているクライアントIPを収集し、攻撃されたプロパティへの接続をIPレベルまたは当社のTLSプロキシで阻止します。この貴重な数秒の間にオリジンはすでに保護されているものの、当社のインフラストラクチャはまだすべてのHTTPリクエストを吸収する必要があります。この新しいボットネットには事実上立ち上がり期間がないため、問題になる前に攻撃を無力化する必要があります。
これを実現するため、当社はIP Jailシステムを拡張してインフラストラクチャ全体を保護しました。IPが「ジェイル」(投獄)されると、攻撃されたプロパティへの接続がブロックされるだけでなく、対応するIPがCloudflare上の他のドメインに対してHTTP/2を使用することも、しばらくの間禁止されます。このようなプロトコルは、HTTP/1.xでの悪用は不可能です。このため、攻撃者による大規模な攻撃の実行は制限されるものの、同じIPを共有する正当なクライアントであればその間のパフォーマンスの低下はごくわずかなものとなります。IPベースの攻撃軽減策は、非常に鈍感なツールです。このため、このような規模で使用する場合、細心の注意を払い、誤検知をできるだけ避けるようにしなければなりません。さらに、ボットネット内の特定のIPの寿命は通常短いため、長期的な緩和策は良いことよりも悪いことの方が多い可能性が高くなります。以下のグラフは、我々が目撃した攻撃におけるIPの入れ替わりを示したものです:
このように、ある日に発見された多くの新規IPは、その後すぐに消えてしまいます。
これらの動作は、すべてHTTPSパイプラインの最初にあるTLSプロキシで行われるため、通常のL7攻撃低減システムと比較してかなりのリソースを節約できます。これにより、これらの攻撃をはるかにスムーズに切り抜けることができるようになり、現在ではこれらのボットネットによって引き起こされるランダムな502エラーの数は、ゼロになりました。
当社が変革しようとしているもうひとつの地平に、観測可能性があります。顧客分析で捉えられることなく、クライアントにエラーを返してしまうのは、不満につながります。幸いなことに、今回の攻撃のはるか以前から、これらのシステムをオーバーホールするプロジェクトが進行中でした。最終的には、ビジネスロジックプロキシがログ・データを統合して出力する代わりに、インフラ内の各サービスが独自にデータをログできるようになります。今回の事件は、この取り組みの重要性を浮き彫りにしました。
また、接続レベルのロギングの改善にも取り組んでおり、このようなプロトコルの乱用をより迅速に発見し、DDoS軽減能力を向上させることができます。
今回の攻撃は記録的な規模であったものの、これが最後ではないことは明白です。攻撃がますます巧妙化する中、Cloudflareでは新たな脅威を能動的に特定し、当社のグローバル・ネットワークに対策をデプロイすることで、数百万人の顧客が即座に自動的に保護されるようたゆまぬ努力を続けています。
Cloudflareは、2017年以来すべてのお客様に無料、従量制、無制限のDDoS攻撃対策を提供してきました。さらに、あらゆる規模の組織のニーズに合わせて、さまざまな追加のセキュリティ機能を提供しています。保護されているかどうかわからない場合、または保護方法をお知りになりたい場合、当社にお問い合わせください。
Post Syndicated from Lucas Pardue original http://blog.cloudflare.com/fr-fr/technical-breakdown-http2-rapid-reset-ddos-attack-fr-fr/
À compter du 25 août 2023, nous avons commencé à observer des attaques HTTP inhabituellement volumineuses frappant bon nombre de nos clients. Ces attaques ont été détectées et atténuées par notre système anti-DDoS automatisé. Il n’a pas fallu longtemps pour que ces attaques atteignent des tailles record, pour finir par culminer à un peu plus de 201 millions de requêtes par seconde, soit un chiffre près de trois fois supérieur à la précédente attaque la plus volumineuse que nous ayons enregistrée.
Le fait que l’acteur malveillant soit parvenu à générer une attaque d’une telle ampleur à l’aide d’un botnet de tout juste 20 000 machines s’avère préoccupant. Certains botnets actuels se composent de centaines de milliers ou de millions de machines. Comme qu’Internet dans son ensemble ne reçoit habituellement qu’entre 1 et 3 milliards de requêtes chaque seconde, il n’est pas inconcevable que l’utilisation de cette méthode puisse concentrer l’intégralité du nombre de requêtes du réseau sur un petit nombre de cibles.
Il s’agissait d’un nouveau vecteur d’attaque évoluant à une échelle sans précédent, mais les protections Cloudflare existantes ont largement pu absorber le plus gros de ces attaques. Si nous avons constaté au départ un certain impact sur le trafic client (environ 1 % des requêtes ont été touchées pendant la vague d’attaques initiale), nous avons ensuite pu perfectionner nos méthodes d’atténuation afin de bloquer l’attaque pour n’importe quel client Cloudflare sans affecter nos systèmes.
Nous avons remarqué ces attaques en même temps que deux autres acteurs majeurs du secteur : Google et AWS. Nous nous sommes attelés au renforcement des systèmes de Cloudflare afin de nous assurer qu’aujourd’hui tous nos clients sont protégés contre cette nouvelle méthode d’attaque DDoS sans impact sur ces derniers. Nous avons également participé, avec Google et AWS, à une révélation coordonnée de l’attaque aux prestataires affectés et aux fournisseurs d’infrastructure essentielle.
Cette attaque a été rendue possible par l’abus de certaines fonctionnalités du protocole HTTP/2 et des détails de mise en œuvre des serveurs (voir la CVE-2023-44487 pour plus d’informations). Comme l’attaque tire parti d’une faiblesse sous-jacente du protocole HTTP/2, nous pensons que tous les fournisseurs qui ont déployé le HTTP/2 subiront l’attaque. Ce constat comprend tous les serveurs web modernes. Aux côtés de Google et d’AWS, nous avons divulgué la méthode d’attaque aux fournisseurs de serveurs web qui, nous l’espérons, déploieront les correctifs. Entre temps, la meilleure défense consiste à utiliser un service d’atténuation des attaques DDoS tel que Cloudflare en amont de chaque réseau en contact avec Internet ou de chaque serveur d’API.
Cet article s’intéressera en profondeur aux détails du protocole HTTP/2, la fonctionnalité exploitée par les acteurs malveillants pour générer ces attaques d’envergure, ainsi qu’aux stratégies d’atténuation que nous avons appliquées pour nous assurer que tous nos clients sont protégés. Nous espérons qu’en publiant ces détails d’autres serveurs web et services affectés disposeront des informations dont ils ont besoin pour mettre en œuvre ces stratégies d’atténuation. En outre, l’équipe chargée des normes du protocole HTTP/2, de même que les équipes travaillant sur les futures normes web, pourront mieux concevoir ces dernières afin d’empêcher de telles attaques.
Le protocole d’application HTTP sous-tend Internet. La norme HTTP Semantics est commune à toutes les versions de HTTP : l’architecture générale, la terminologie et les aspects de protocole, comme les messages de requête et de réponse, les méthodes, les codes d’état, les champs d’en-tête et de trailer, le contenu des messages et bien d’autres. Chaque version individuelle de HTTP définit la manière dont la sémantique est transformée au « format conversation » (wire) pour l’échange sur Internet. Un client doit, par exemple, sérialiser un message de requête en données binaires avant de l’envoyer. Le serveur l’analyse ensuite et le retransforme en message qu’il peut traiter.
Le protocole HTTP/1.1 utilise une forme textuelle de sérialisation. Les messages de requête et de réponse sont échangés sous la forme d’un flux de caractères ASCII, envoyé via une couche de transport fiable, comme le TCP, selon le format suivant (dans lequel CRLF signifie retour chariot et saut de ligne) :
 HTTP-message   = start-line CRLF
                   *( field-line CRLF )
                   CRLF
                   [ message-body ]
Une requête GET très simple pour https://blog.cloudflare.com/ ressemblerait, par exemple, à ceci sur la conversation :
GET / HTTP/1.1 CRLFHost: blog.cloudflare.comCRLFCRLF
Et la réponse ressemblerait à ce qui suit :
HTTP/1.1 200 OK CRLFServer: cloudflareCRLFContent-Length: 100CRLFtext/html; charset=UTF-8CRLFCRLF<100 bytes of data>
Ce format encapsule les messages sur la conversation, pour indiquer qu’il est possible d’utiliser une unique connexion TCP pour échanger plusieurs requêtes et réponses. Le format nécessite toutefois que chaque message soit envoyé en entier. En outre, afin de faire entrer correctement en corrélation les requêtes avec les réponses, un ordre strict se révèle nécessaire. Les messages peuvent donc être échangés de manière sérielle et ne peuvent pas être multiplexés. Deux requêtes GET, pour https://blog.cloudflare.com/ et https://blog.cloudflare.com/page/2/,, se présenteraient ainsi sous la forme suivante :
GET / HTTP/1.1 CRLFHost: blog.cloudflare.comCRLFCRLFGET /page/2/ HTTP/1.1 CRLFHost: blog.cloudflare.comCRLFCRLF
Et les réponses :
HTTP/1.1 200 OK CRLFServer: cloudflareCRLFContent-Length: 100CRLFtext/html; charset=UTF-8CRLFCRLF<100 bytes of data>CRLFHTTP/1.1 200 OK CRLFServer: cloudflareCRLFContent-Length: 100CRLFtext/html; charset=UTF-8CRLFCRLF<100 bytes of data>
Les pages web nécessitent davantage d’interactions HTTP compliquées que ces exemples. Lorsque vous visitez le blog de Cloudflare, votre navigateur charge plusieurs scripts, styles et ressources multimédias. Si vous accédez à la page d’accueil à l’aide du protocole HTTP/1.1 et que vous décidez rapidement de vous rendre sur la page 2, votre navigateur a le choix entre deux options. Soit attendre l’ensemble des réponses en attente pour la page que vous ne souhaitez plus consulter avant de démarrer la page 2, soit annuler les requêtes en transit en mettant fin à la connexion TCP et en établissant une nouvelle connexion. Aucune de ces options ne s’avère particulièrement pratique. Les navigateurs ont tendance à contourner ces limitations en gérant un pool de connexions TCP (jusqu’à 6 par hôte) et en mettant en œuvre une logique complexe de répartition des requêtes au sein du pool.
Le protocole HTTP/2 répond à bon nombre des problèmes du HTTP/1.1. Chaque message HTTP est sérialisé sous la forme d’un ensemble de trames HTTP/2 disposant d’un type, d’une longueur, de marqueurs, d’un identifiant (ID) de flux et d’un contenu. L’ID de flux indique clairement quels octets sur la conversation s’appliquent à un message donné, afin de permettre le multiplexage et la concurrence en toute sécurité. Les flux sont bidirectionnels. Les clients envoient des trames et les serveurs répondent par des trames utilisant le même ID.
En HTTP/2, notre requête GET pour https://blog.cloudflare.com serait échangée sur l’ID de flux 1, le client envoyant une trame HEADERS et le serveur répondant par une trame HEADERS, suivies par une ou plusieurs trames DATA. Comme les requêtes du client utilisent toujours des ID de flux impairs, les requêtes suivantes utiliseront donc les ID de flux 3, 5 et ainsi de suite. Les réponses peuvent être transmises dans n’importe quel ordre et les trames provenant de flux différents peuvent être entrelacées.
Le multiplexage et la concurrence des flux constituent de puissantes fonctionnalités du protocole HTTP/2. Elles permettent l’utilisation plus efficace d’une unique connexion TCP. Le HTTP/2 optimise la récupération de ressources, notamment lorsqu’elle est associée à la priorisation. En réciproque, le fait de faciliter le lancement de vastes quantités de tâches parallèles aux clients peut accroître le pic de demande de ressources serveur par rapport au HTTP/1.1. Il s’agit là d’un vecteur évident de déni de service.
Afin de proposer quelques garde-fous, le HTTP/2 avance la notion de maximum de flux concurrents actifs. Le paramètre SETTINGS_MAX_CONCURRENT_STREAMS permet à un serveur d’annoncer sa limite de concurrence. Par exemple, si le serveur annonce une limite de 100, seules 100 requêtes pourront être actives à un moment donné. Si un client tente d’ouvrir un flux au-delà de cette limite, ce dernier devra être rejeté par le serveur à l’aide d’une trame RST_STREAM. Le rejet d’un flux n’affecte pas les autres flux en transit sur la connexion.
La réalité de l’affaire est un peu plus compliquée. Les flux présentent un cycle de vie. Vous trouverez ci-dessous un schéma de l’état d’un flux HTTP/2. Le client et le serveur gèrent leurs propres vues de l’état d’un flux. L’envoi ou la réception de trames HEADERS, DATA et RST_STREAM déclenchent les transitions. Les vues de l’état d’un flux sont indépendantes, mais restent synchronisées.
Les trames HEADERS et DATA intègrent un marqueur END_STREAM qui, lorsqu’il est défini sur la valeur 1 (true), peut déclencher une transition d’état.
Examinons ceci plus en détail avec un exemple de requête GET sans contenu de message. Le client envoie la requête sous la forme d’une trame HEADERS comportant le marqueur END_STREAM défini sur 1. Il déclenche en premier lieu la transition de l’état « idle » (à l’arrêt) à « open » (ouvert), avant de déclencher immédiatement une transition vers l’état « half-closed » (mi-fermé). L’état « half-closed » du client indique qu’il ne peut plus envoyer de trames HEADERS ou DATA, mais uniquement des trames WINDOW_UPDATE, PRIORITY ou RST_STREAM. Il peut toutefois recevoir n’importe quelle trame.
Une fois que le serveur reçoit et analyse la trame HEADERS, il fait passer l’état du flux d’« idle » à « open », puis à « half-closed », afin de correspondre à celui du client. L’état « half-closed » du serveur indique qu’il peut envoyer n’importe quelle trame, mais qu’il ne peut recevoir que des trames WINDOW_UPDATE, PRIORITY ou RST_STREAM.
La réponse à la requête GET contient un contenu de message, aussi le serveur envoie-t-il une trame HEADERS comportant le marqueur END_STREAM défini sur 0, puis une trame DATA comportant le marqueur END_STREAM défini sur 1. La trame DATA déclenche la transition du flux de half-closed à closed (fermé) sur le serveur. Lorsque le client la reçoit, il lance également sa transition vers l’état « closed ». Une fois un flux fermé, plus aucune trame ne peut être envoyée ou reçue.
En appliquant ce cycle de vie dans le contexte de la concurrence, le protocole HTTP/2 précise :
Les flux à l’état « open » ou dans l’un des deux états « half-closed » comptent dans le nombre maximum de flux qu’un point de terminaison est autorisé à ouvrir. Les flux dans l’un de ces trois états comptent à l’égard de la limite annoncée dans le paramètre SETTINGS_MAX_CONCURRENT_STREAMS.
En théorie, la limite de concurrence est utile. Certains facteurs pratiques entravent toutefois son efficacité, que nous aborderons plus tard dans cet article.
Un peu plus tôt, nous avons évoqué l’annulation de requêtes en transit par le client. Le protocole HTTP/2 prend cette fonctionnalité en charge de manière plus efficace que le HTTP/1.1. Plutôt que de devoir abandonner la connexion dans son ensemble, un client peut désormais envoyer une trame RST_STREAM pour un seul flux. Cette dernière demande au serveur de mettre fin au traitement de la requête et d’abandonner la réponse. Cette opération libère des ressources serveur et permet d’éviter de gaspiller de la bande passante.
Reprenons notre exemple précédent, avec les trois requêtes. Cette fois, le client annule la requête sur le flux 1 après l’envoi de toutes les trames HEADERS. Le serveur analyse la trame RST_STREAM avant d’être prêt à diffuser la réponse et, à la place, ne répond qu’aux flux 3 et 5 :
L’annulation de requête constitue une fonctionnalité bien utile. Lorsque vous parcourez une page web comportant plusieurs images, par exemple, un navigateur web peut annuler les images qui ne sont pas affichées dès l’ouverture. Les images qui lui parviennent peuvent donc être chargées plus rapidement. Le protocole HTTP/2 rend ce comportement bien plus efficace par rapport au HTTP/1.1.
Un flux de requête annulé passe rapidement par tous les états du cycle de vie d’un flux. La trame HEADERS envoyée par le client, comportant le marqueur END_STREAM défini sur 1, passe de l’état « idle » à « open », puis à « half-closed », avant que la trame RST_STREAM ne déclenche immédiatement sa transition de l’état « half-closed » à « closed ».
Souvenez-vous que seuls les flux à l’état « open » ou « half-closed » sont comptabilisés dans la limite de concurrence du flux. Lorsqu’un client annule un flux, il regagne instantanément la capacité d’ouvrir un autre flux à la place et peut immédiatement envoyer une nouvelle requête. C’est là le cœur du fonctionnement de la vulnérabilité CVE-2023-44487.
Le processus d’annulation de requête du protocole HTTP/2 peut être utilisé de manière abusive en réinitialisant rapidement un nombre illimité de flux. Lorsqu’un serveur HTTP/2 peut traiter des trames client-sent RST_STREAM et leur faire changer d’état suffisamment rapidement, ces réinitialisations rapides ne posent pas de problème. Les soucis commencent lorsqu’une quelconque forme de retard ou de latence apparaît lors du nettoyage. Le client peut avoir à traiter un nombre de requêtes si important que les tâches s’accumulent, en entraînant une consommation excessive de ressources sur le serveur.
Une architecture de déploiement HTTP courante consiste à exécuter un proxy HTTP/2 ou un équilibreur de charge en amont des autres composants. Lorsqu’une requête client arrive, elle est rapidement retransmise et la tâche réelle est effectuée sous forme d’activité asynchrone à un autre endroit. Cette opération permet au proxy de traiter le trafic client très efficacement. Toutefois, cette séparation des préoccupations peut compliquer la phase de nettoyage des tâches en cours pour le proxy. Ce type de déploiement est donc plus susceptible de rencontrer des problèmes en cas de réinitialisations rapides.
Lorsque les proxys inverses de Cloudflare traitent du trafic client entrant HTTP/2, ils copient les données du socket de la connexion au sein d’un tampon et traitent ces données en tampon dans l’ordre. Chaque requête est lue (trames HEADERS et DATA) et transmise à un service en amont. Lorsque les trames RST_STREAM sont lues, l’état local de la requête est abandonné et l’amont est notifié de l’annulation de la requête. Les proxys répètent ensuite le processus jusqu’à ce que toutes les données en tampon aient été traitées. Cette logique peut toutefois être utilisée de manière abusive : si un client malveillant commence à envoyer une énorme chaîne de requêtes, qu’il réinitialise au début d’une connexion, nos serveurs s’empresseront de toutes les lire. Cette situation engendrera alors une pression sur les serveurs en amont, au point qu’ils se retrouveront incapables de traiter les nouvelles requêtes entrantes.
Un point important à souligner est que la concurrence de flux ne peut pas, par elle-même, atténuer les réinitialisations rapides. Le client peut créer des requêtes afin de produire des taux de requêtes élevés, peu importe la valeur choisie par le serveur pour le paramètre SETTINGS_MAX_CONCURRENT_STREAMS.
Voici un exemple de réinitialisation rapide (Rapid Reset) reproduite à l’aide d’un client de démonstration de faisabilité tentant d’envoyer un total de 1 000 requêtes. J’ai utilisé un serveur du commerce ne disposant d’aucune mesure d’atténuation et écoutant le port 443 au sein d’un environnement de test. Le trafic est disséqué à l’aide de Wireshark et filtré pour ne montrer que le trafic HTTP/2, pour plus de clarté. Téléchargez la pcap pour suivre la démonstration.
Il est un peu difficile à analyser, en raison du grand nombre de trames. Nous pouvons en obtenir un résumé rapide à l’aide de l’outil HTTP/2 de Wireshark, disponible sous « Statistics » (Statistiques) :
La première trame de cette trace, dans le paquet 14, est la trame SETTINGS du serveur, qui annonce un nombre maximum de flux concurrents de 100. Dans le paquet 15, le client envoie quelques trames de contrôle, puis commence à envoyer des requêtes, rapidement réinitialisées. La première trame HEADERS fait 26 octets de long, tandis que toutes les trames HEADERS suivantes ne mesurent que 9 octets. Cette différence de taille est due à une technologie de compression nommée HPACK. Au total, le paquet 15 contient 525 requests, remontant le long du flux 1051.
Curieusement, la trame RST_STREAM du flux 1051 ne rentre pas dans le paquet 15. Nous voyons donc, dans le paquet 16, le serveur répondre par une erreur 404. Le client envoie ensuite la trame RST_STREAM dans le paquet 17, avant de passer à l’envoi des 475 requêtes suivantes.
Veuillez noter que bien que le serveur ait annoncé 100 flux concurrents, les deux paquets envoyés par le client comportaient bien plus de trames HEADERS. Le client n’a pas attendu le trafic de retour du serveur, il n’était limité que par la taille des paquets qu’il pouvait envoyer. Aucune trame RST_STREAM du serveur n’apparaît dans cette trace, un constat qui indique que le serveur n’a pas observé de violation du nombre de flux concurrents.
Comme mentionné plus haut, lorsque les requêtes sont annulées, les services en amont sont notifiés et peuvent abandonner ces dernières avant de gaspiller trop de ressources sur leur traitement. C’est ce qui s’est passé dans cette attaque, au cours de laquelle les requêtes malveillantes n’ont jamais été retransmises aux serveurs d’origine. Toutefois, l’ampleur de ces attaques a engendré des effets.
Tout d’abord, lorsque le taux de requêtes entrantes a atteint des pics jamais encore observés jusqu’ici, nous avons reçu des signalements de niveaux élevés d’erreurs 502 observées par les clients. C’est ce qui s’est produit dans nos datacenters les plus impactés, car ils avaient du mal à traiter toutes les requêtes. Notre réseau est conçu pour faire face aux attaques d’envergure, mais cette vulnérabilité a révélé une faiblesse au sein de notre infrastructure. Intéressons-nous de plus près aux détails, en nous concentrant sur la manière dont les requêtes entrantes sont traitées lorsqu’elles arrivent dans l’un de nos datacenters :
Nous pouvons voir que notre infrastructure se compose d’une chaîne de différents serveurs de proxy aux responsabilités différentes. Plus particulièrement, lorsqu’un client se connecte à Cloudflare pour envoyer du trafic HTTPS, ce dernier passe en premier par notre proxy de déchiffrement TLS, qui déchiffre le trafic TLS et traite le trafic HTTP 1, 2 ou 3, avant de le transmettre à notre proxy de « logique métier ». Ce dernier est responsable du chargement de l’ensemble des paramètres pour chaque client, puis du routage correct des requêtes vers les autres services d’amont. Plus important encore dans le cas qui nous intéresse, il est également responsable des fonctionnalités de sécurité. C’est là que l’atténuation des attaques sur la couche 7 est mise en œuvre.
Le problème avec ce vecteur d’attaque réside dans le fait qu’il parvient à envoyer un grand nombre de requêtes de manière très rapide, sur chaque connexion. Chacune d’elles devait être retransmise au proxy de logique métier avant que nous n’ayons l’occasion de la bloquer. Lorsque le volume de requêtes s’est révélé supérieur à la capacité de notre proxy, le pipeline reliant ces deux services a atteint son niveau de saturation dans certains de nos serveurs.
Quand cette situation se produit, le proxy TLS ne peut plus se connecter à son proxy d’amont. C’est pourquoi certains de nos clients ont vu s’afficher une erreur « 502 Bad Gateway » lors des attaques les plus graves. Il est important de noter qu’à la date d’aujourd’hui, les journaux utilisés pour produire les analyses HTTP sont également émis par notre proxy de logique métier. En conséquence, ces erreurs ne sont pas visibles au sein du tableau de bord Cloudflare. Nos tableaux de bord internes révèlent qu’environ 1 % des requêtes ont été affectées lors de la vague d’attaques initiale (avant la mise en œuvre des mesures d’atténuation), avec un pic se situant autour de 12 % pendant quelques secondes lors de l’attaque la plus massive, le 29 août. Le graphique suivant montre la proportion de ces erreurs sur une période de deux heures au cours de l’attaque :
Nous nous sommes efforcés de réduire ce nombre de manière considérable les jours suivants, comme nous le détaillons plus loin dans cet article. Ce nombre aujourd’hui est effectivement de zéro, à la fois grâce aux modifications apportées à notre pile et à nos mesures d’atténuation, qui ont drastiquement réduit la taille de ces attaques.
Un autre symptôme signalé par certains clients réside dans l’augmentation des erreurs 499. La raison est ici quelque peu différente et se trouve liée à la concurrence de flux maximale au sein d’une connexion HTTP/2, comme détaillée précédemment dans l’article.
Les paramètres HTTP/2 sont échangés au début d’une connexion à l’aide de trames SETTINGS. En l’absence de réception d’un paramètre explicite, ce sont les valeurs par défaut qui s’appliquent. Lorsqu’un client établit une connexion HTTP/2, il peut soit attendre la trame SETTINGS d’un serveur (lent), soit présupposer les valeurs par défaut et commencer à envoyer des requêtes (rapide). Pour le paramètre SETTINGS_MAX_CONCURRENT_STREAMS, la valeur par défaut est, dans les faits, illimitée (les ID de flux s’appuient sur un espace mathématique de 31 bits et les requêtes utilisent les nombres impairs. la limite réelle est donc établie à 1 073 741 824). La spécification recommande qu’un serveur ne propose pas moins de 100 flux concurrents. Les clients sont généralement axés sur la vitesse. Ils n’ont donc pas tendance à attendre les paramètres du serveur et ce fait entraîne en quelque sorte une situation de compétition. Ils « parient » sur la limite que le serveur pourrait avoir choisie. S’ils se trompent, la requête sera rejetée et devra être renvoyée. Le fait de parier sur un ensemble numérique de 1 073 741 824 nombres s’avère pour le moins absurde. Pour contrebalancer cette situation, de nombreux clients décident de se limiter à l’émission de 100 flux concurrents, dans l’espoir que les serveurs suivent la recommandation de la spécification. Si les serveurs ont sélectionné une valeur inférieure à 100, le pari du client échoue et les flux sont réinitialisés.
Un serveur pourrait réinitialiser un flux pour de nombreuses raisons en dehors d’un dépassement de la limite de concurrence. Le HTTP/2 est strict et nécessite qu’un flux soit fermé (closed) en cas d’erreurs d’interprétation ou d’erreurs logiques. En 2019, Cloudflare a développé plusieurs mesures d’atténuation en réponse aux vulnérabilités DoS du protocole HTTP/2. Plusieurs de ces vulnérabilités résultaient d’un mauvais comportement de la part du client, qui poussait le serveur à réinitialiser un flux. Une stratégie très efficace pour freiner ces clients consiste à compter le nombre de réinitialisations du serveur au cours d’une connexion puis, lorsque ce chiffre dépasse un certain seuil, de mettre un terme à cette dernière à l’aide d’une trame GOAWAY. Les clients peuvent commettre une ou deux erreurs au cours d’une connexion et il s’agit là d’un constat acceptable. Un client qui commet trop d’erreurs est probablement soit défectueux, soit malveillant, et le fait de mettre fin à la connexion répond aux deux cas.
En réponse aux attaques DoS permises par la vulnérabilité CVE-2023-44487, Cloudflare a réduit la concurrence de flux maximale à 64. Avant d’effectuer cette modification, nous n’avions pas conscience que les clients n’attendaient pas la trame SETTINGS et supposaient à la place que la concurrence était fixée à 100. Certaines pages web, comme les galeries d’images, entraînent effectivement l’envoi immédiat de 100 requêtes par le navigateur au début d’une connexion. Malheureusement, les 36 flux au-delà de notre limite devaient être réinitialisés et cette opération déclenchait les compteurs de nos mesures d’atténuation. Nous interrompions donc des connexions sur des clients légitimes, avec pour résultat un échec total du chargement des pages. Dès que nous avons constaté ce problème d’interopérabilité, nous avons de nouveau fixé la concurrence de flux maximale à 100.
En 2019, nous avons découvert plusieurs vulnérabilités DoS liées à l’implémentation du protocole HTTP/2. Cloudflare a développé et déployé une série de mesures de détection et d’atténuation en réponse. La vulnérabilité CVE-2023-44487 est une différente manifestation de la vulnérabilité HTTP/2. Toutefois, pour l’atténuer, nous avons pu étendre les protections existantes afin de surveiller les trames RST_STREAM envoyées par les clients et de mettre fin aux connexions lorsque ces dernières étaient utilisées à des fins abusives. Les scénarios d’utilisation légitimes des trames RST_STREAM par les clients n’ont pas été affectés.
En plus d’un correctif direct, nous avons mis en œuvre plusieurs améliorations du serveur concernant le traitement des trames HTTP/2 et du code de répartition des requêtes. Le serveur de logique métier a, en outre, fait l’objet de perfectionnements au niveau de la mise en file d’attente et de la planification. Ces derniers réduisent le travail inutile et améliorent la réponse aux annulations. Ensemble, ces mesures diminuent l’impact des divers schémas d’abus potentiels, tout en accordant plus d’espace au serveur pour traiter les requêtes avant d’atteindre la saturation.
Cloudflare dispose déjà de systèmes en place permettant d’atténuer efficacement les attaques de très grande ampleur à l’aide de méthodes moins coûteuses. L’une d’elles se nomme « IP Jail » (Prison IP). En cas d’attaques hypervolumétriques, ce système collecte les adresses IP des clients participant à l’attaque et les empêche de se connecter à la propriété attaquée, que ce soit au niveau de l’adresse IP ou de notre proxy TLS. Ce système demande toutefois quelques secondes pour être pleinement efficace. Au cours de ces précieuses secondes, les serveurs d’origine sont déjà protégés, mais notre infrastructure doit encore absorber l’ensemble des requêtes HTTP. Comme ce nouveau botnet ne dispose dans les faits d’aucune période de démarrage, nous devons pouvoir neutraliser ces attaques avant qu’elles ne deviennent un problème.
Pour y parvenir, nous avons étendu le système IP Jail afin qu’il protège l’intégralité de notre infrastructure. Une fois une adresse IP « en prison », nous l’empêchons non seulement de se connecter à la propriété attaquée, mais interdisons également aux adresses IP correspondants d’utiliser le HTTP/2 pour se connecter à un autre domaine sur Cloudflare pendant quelque temps. Comme de tels abus du protocole ne sont pas possibles à l’aide du HTTP/1.x, l’acteur malveillant se trouve sévèrement limité dans sa capacité à conduire des attaques d’envergure, tandis qu’un client légitime partageant la même adresse IP ne constaterait d’une très légère diminution des performances pendant ce temps. Les mesures d’atténuation basées sur l’IP constituent un outil pour le moins brutal. C’est pourquoi nous devons faire preuve d’une extrême prudence lorsque nous les utilisons à grande échelle et chercher à éviter les faux positifs autant que possible. De même, comme la durée de vie d’une adresse IP donnée au sein d’un botnet est généralement courte, l’atténuation à long terme risque davantage de nuire que d’aider. Le graphique suivant montre l’évolution du nombre d’adresses IP lors de l’attaque dont nous avons été témoins :
Il apparaît très clairement que les nouvelles adresses IP repérées lors d’une journée donnée disparaissent très rapidement après l’attaque.
Le fait que ces actions se déroulent dans notre proxy TLS, à l’entrée de notre pipeline HTTPS, permet d’économiser des ressources considérables par rapport à notre système d’atténuation de couche 7 habituel. Cette situation nous a permis de supporter ces attaques d’autant plus facilement et, aujourd’hui, le nombre d’erreurs 502 aléatoires dues à ces botnets a été réduit à zéro.
L’un des autres fronts sur lequel nous avons apporté des modifications est celui de l’observabilité. Le fait de renvoyer des erreurs aux clients sans que ces dernières soient visibles dans les outils d’analyse des clients se révèle pour le moins insatisfaisant. Fort heureusement, nous avons lancé un projet visant à réorganiser ces systèmes bien avant les attaques récentes. Il permettra à terme à chaque service compris au sein de notre infrastructure de journaliser ses propres données, au lieu de s’en remettre à notre proxy de logique métier pour consolider et émettre les données de journalisation. Cet incident a fait ressortir l’importance de ce travail, dans le cadre duquel nous redoublons d’efforts.
Nous travaillons également à une meilleure journalisation au niveau de la connexion, afin de nous permettre de repérer ce type d’abus de protocole bien plus rapidement, afin d’améliorer nos capacités d’atténuation des attaques DDoS.
Si l’attaque à laquelle cet article est consacré constituait sans conteste la dernière attaque record à ce jour, nous savons que ce ne sera pas la dernière. Alors que les attaques gagnent chaque jour en sophistication, Cloudflare travaille avec acharnement aux moyens d’identifier les nouvelles menaces de manière proactive, en déployant des contremesures sur notre réseau mondial afin de protéger nos millions de clients, immédiatement et automatiquement.
Cloudflare fournit une protection contre les attaques DDoS gratuite, totalement illimitée et sans surcoût lié à l’utilisation à l’ensemble de ses clients, et ce depuis 2017. Nous proposons en outre une gamme de fonctionnalités de sécurité supplémentaires afin de répondre aux besoins des entreprises de toutes les tailles. Contactez-nous si vous n’êtes pas sûr de savoir si vous êtes protégé ou si vous souhaitez comprendre comment vous pourriez l’être.