R2 is an S3-compatible, globally distributed object storage, allowing developers to store large amounts of unstructured data without the costly egress bandwidth fees you commonly find with other providers.
To enjoy this egress freedom, you’ll have to start planning to send all that data you have somewhere else into R2. You might want to do it all at once, moving as much data as quickly as possible while ensuring data consistency. Or do you prefer moving the data to R2 slowly and gradually shifting your reads from your old provider to R2? And only then decide whether to cut off your old storage or keep it as a backup for new objects in R2?
There are multiple options for architecture and implementations for this movement, but taking terabytes of data from one cloud storage provider to another is always problematic, always involves planning, and likely requires staffing.
And that was hard. But not anymore.
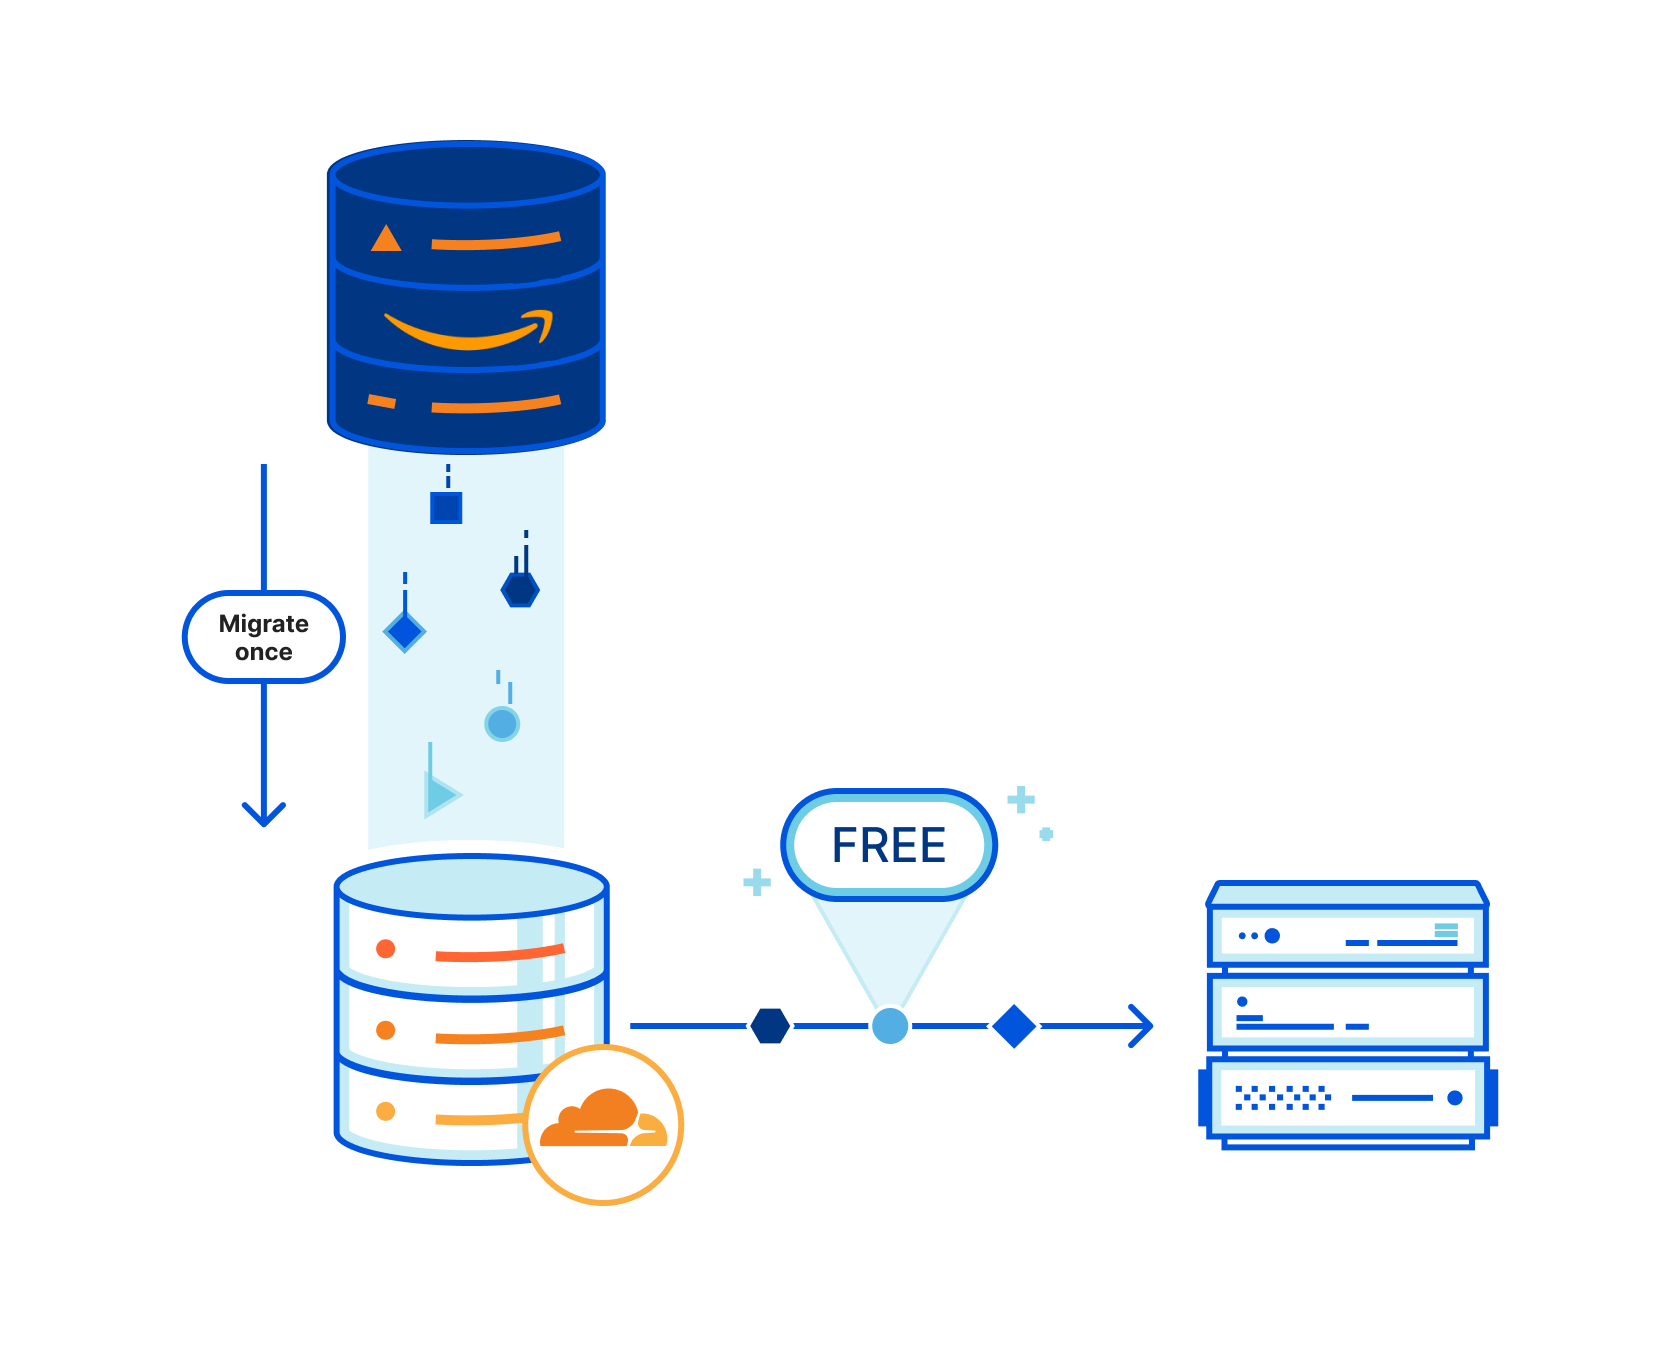
Today we’re announcing the R2 Super Slurper, the feature that will enable you to move all your data to R2 in one giant slurp or sip by sip — all in a friendly, intuitive UI and API.
The first step: R2 Super Slurper Private Beta
One giant slurp
The very first iteration of the R2 Super Slurper allows you to target an S3 bucket and import the objects you have stored there into your R2 bucket. It’s a simple, one-time import that covers the most common scenarios. Point to your existing S3 source, grant the R2 Super Slurper permissions to read the objects you want to migrate, and an asynchronous job will take care of the rest.
You’ll also be able to save the definitions and credentials to access your source bucket, so you can migrate different folders from within the bucket, in new operations, without having to define URLs and credentials all over again. This operation alone will save you from scripting your way through buckets with many paths you’d like to validate for consistency. During the beta stages — with your feedback — we will evolve the R2 Super Slurper to the point where anyone can achieve an entirely consistent, super slurp, all with the click of just a few buttons.
Automatic sip by sip migration
Other future development includes automatic sip by sip migration, which provides a way to incrementally copy objects to R2 as they get requested from an end-user. It allows you to start serving objects from R2 as they migrate, saving you money immediately.
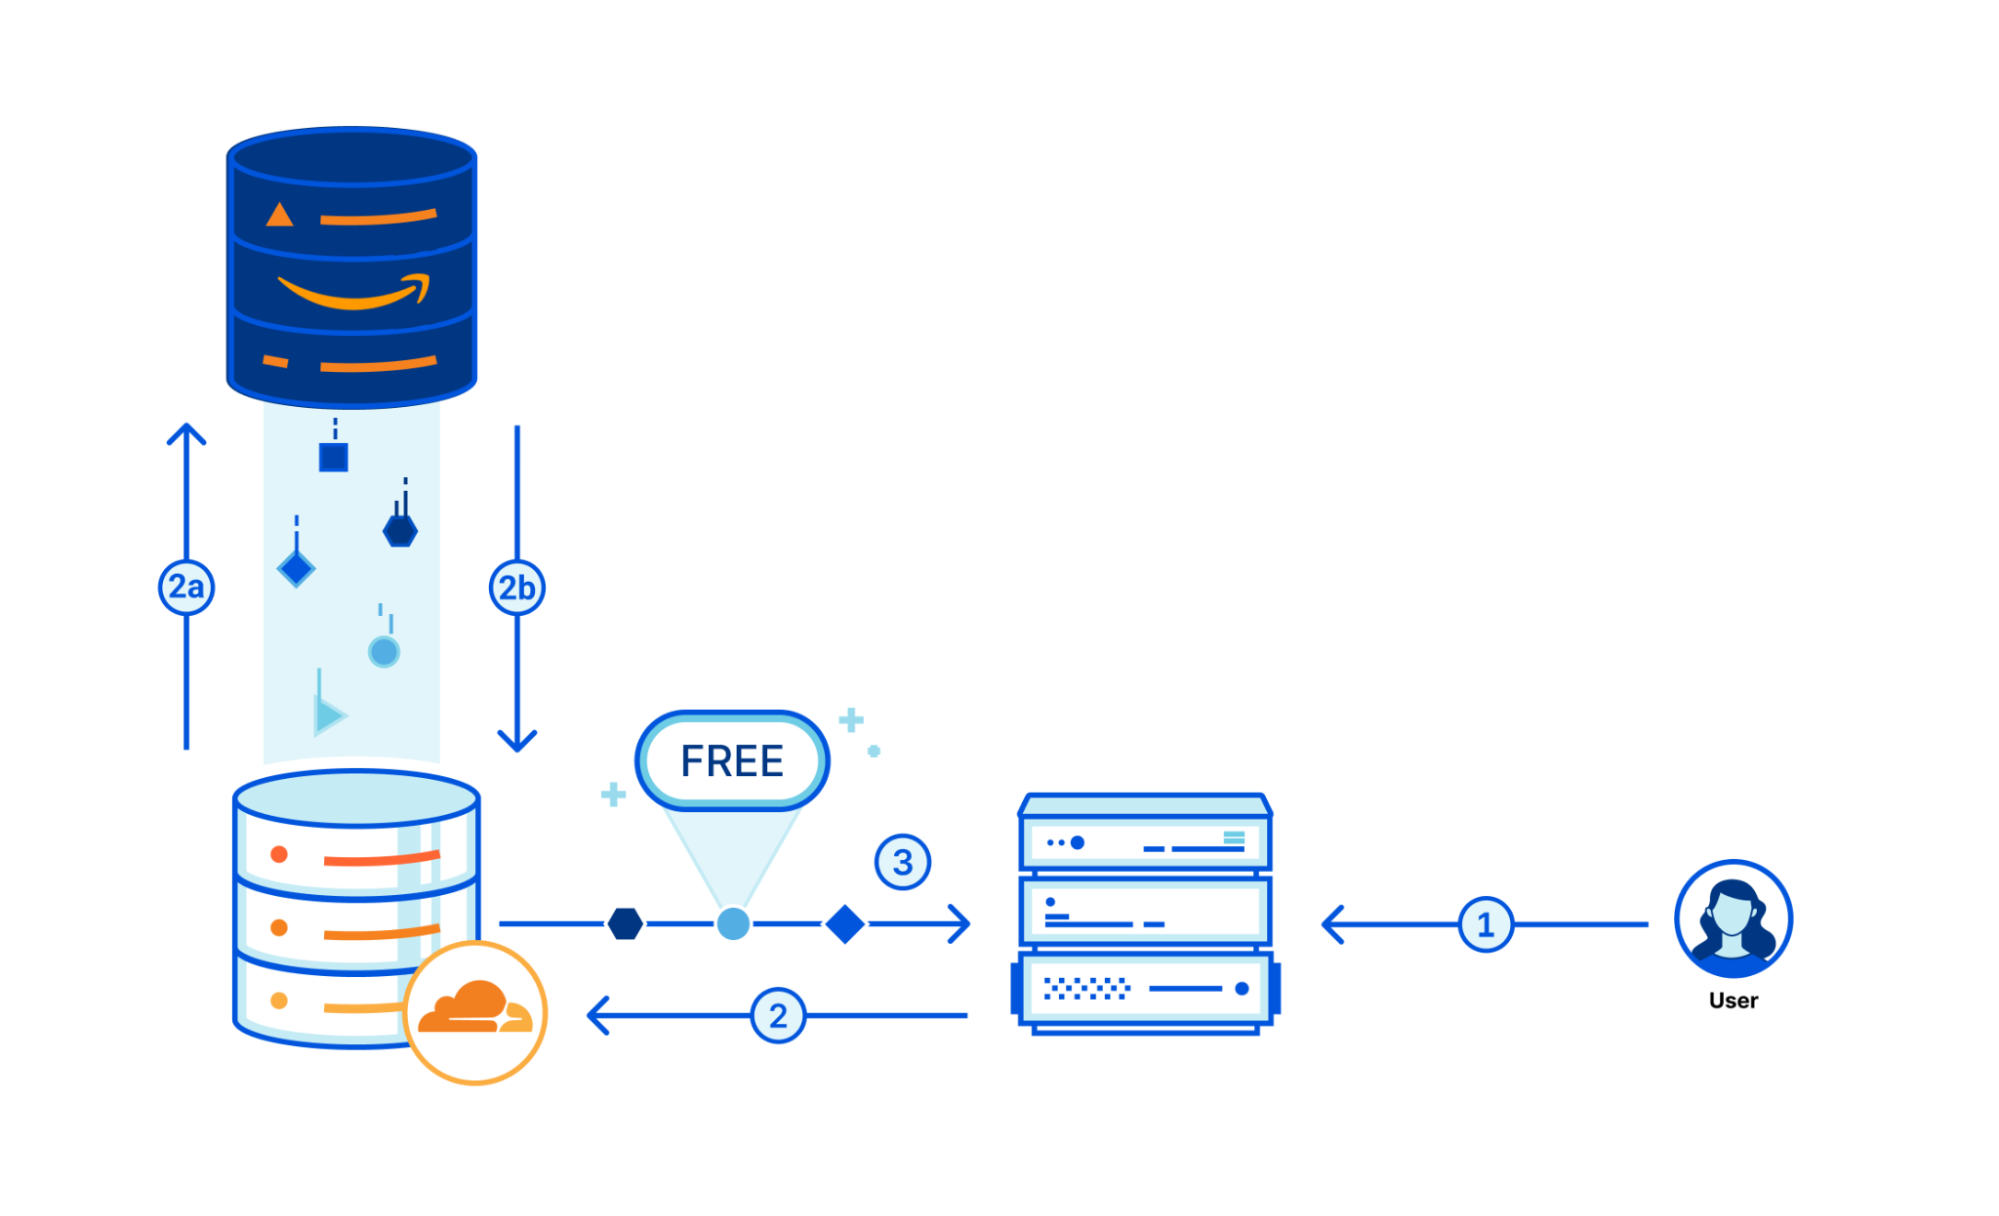
The flow of the requests and object migration will look like this:
Check for Object — A request arrives at Cloudflare (1), and we check the R2 bucket for the requested object (2). If the object exists, R2 serves it (3).
Copy the Object — If the object does not exist in R2, a request for the object flows to the origin bucket (2a). Once there’s an answer with an object, we serve it and copy it into R2 (2b).
Serve the Object — R2 serves all future requests for the object (3).
With this capability you can copy your objects, previously scattered through one or even multiple buckets from other vendors, while ensuring that everything requested from the end-user side gets served from R2. And because you will only need to use the R2 Super Slurper to sip the object from elsewhere on the first request, you will start saving on those egress fees for any subsequent ones.
We are currently targeting S3-compatible buckets for now, but you can expect other sources to become available during 2023.
Join the waitlist for the R2 Super Slurper private beta
We will collaborate closely with many early users in the private beta stage to refine and test the service . Soon, we’ll announce an open beta where users can sign up for the service.
Make sure to join our Discord server and get in touch with a fantastic community of users and Cloudflare staff for all R2-related topics!
Earlier this year, we introduced Cache Reserve. Cache Reserve helps users serve content from Cloudflare’s cache for longer by using R2’s persistent data storage. Serving content from Cloudflare’s cache benefits website operators by reducing their bills for egress fees from origins, while also benefiting website visitors by having content load faster.
Cache Reserve has been in closed beta for a few months while we’ve collected feedback from our initial users and continued to develop the product. After several rounds of iterating on this feedback, today we’re extremely excited to announce that Cache Reserve is graduating to open beta – users will now be able to test it and integrate it into their content delivery strategy without any additional waiting.
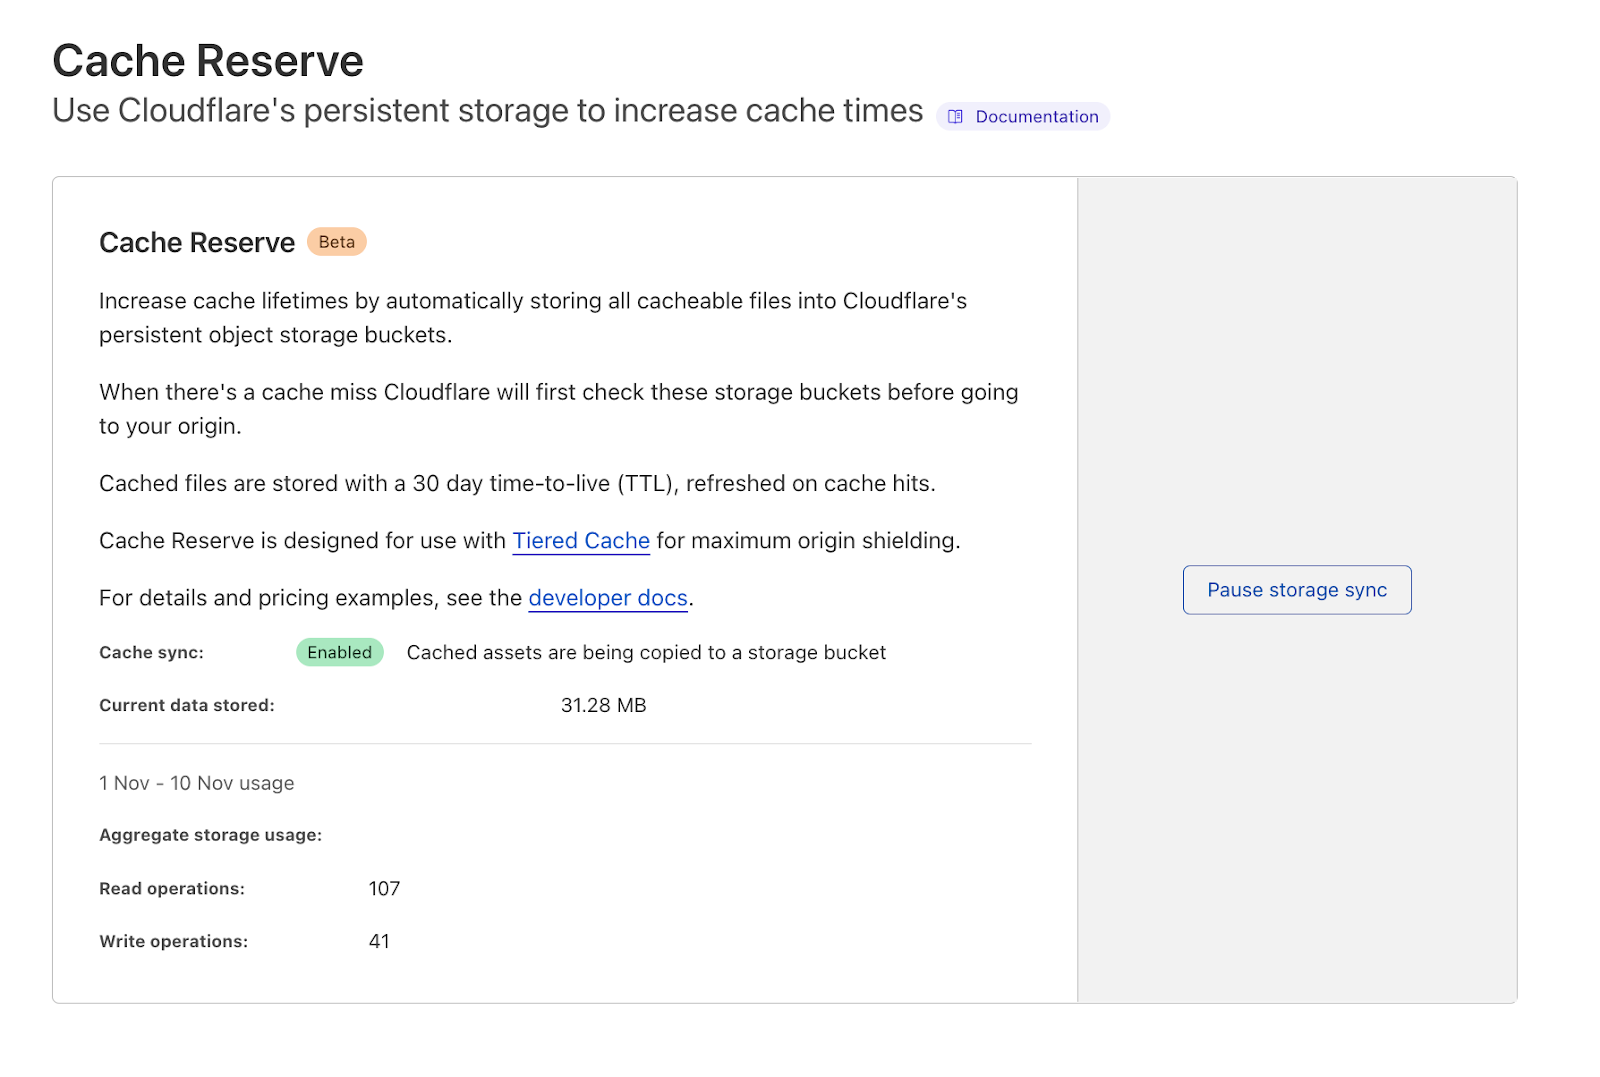
If you want to see the benefits of Cache Reserve for yourself and give us some feedback– you can go to the Cloudflare dashboard, navigate to the Caching section and enable Cache Reserve by pushing one button.
How does Cache Reserve fit into the larger picture?
Content served from Cloudflare’s cache begins its journey at an origin server, where the content is hosted. When a request reaches the origin, the origin compiles the content needed for the response and sends it back to the visitor.
The distance between the visitor and the origin can affect the performance of the asset as it may travel a long distance for the response. This is also where the user is charged a fee to move the content from where it’s stored on the origin to the visitor requesting the content. These fees, known as “bandwidth” or “egress” fees, are familiar monthly line items on the invoices for users that host their content on cloud providers.
Cloudflare’s CDN sits between the origin and visitor and evaluates the origin’s response to see if it can be cached. If it can be added to Cloudflare’s cache, then the next time a request comes in for that content, Cloudflare can respond with the cached asset, which means there’s no need to send the request to the origin– reducing egress fees for our customers. We also cache content in data centers close to the visitor to improve the performance and cut down on the transit time for a response.
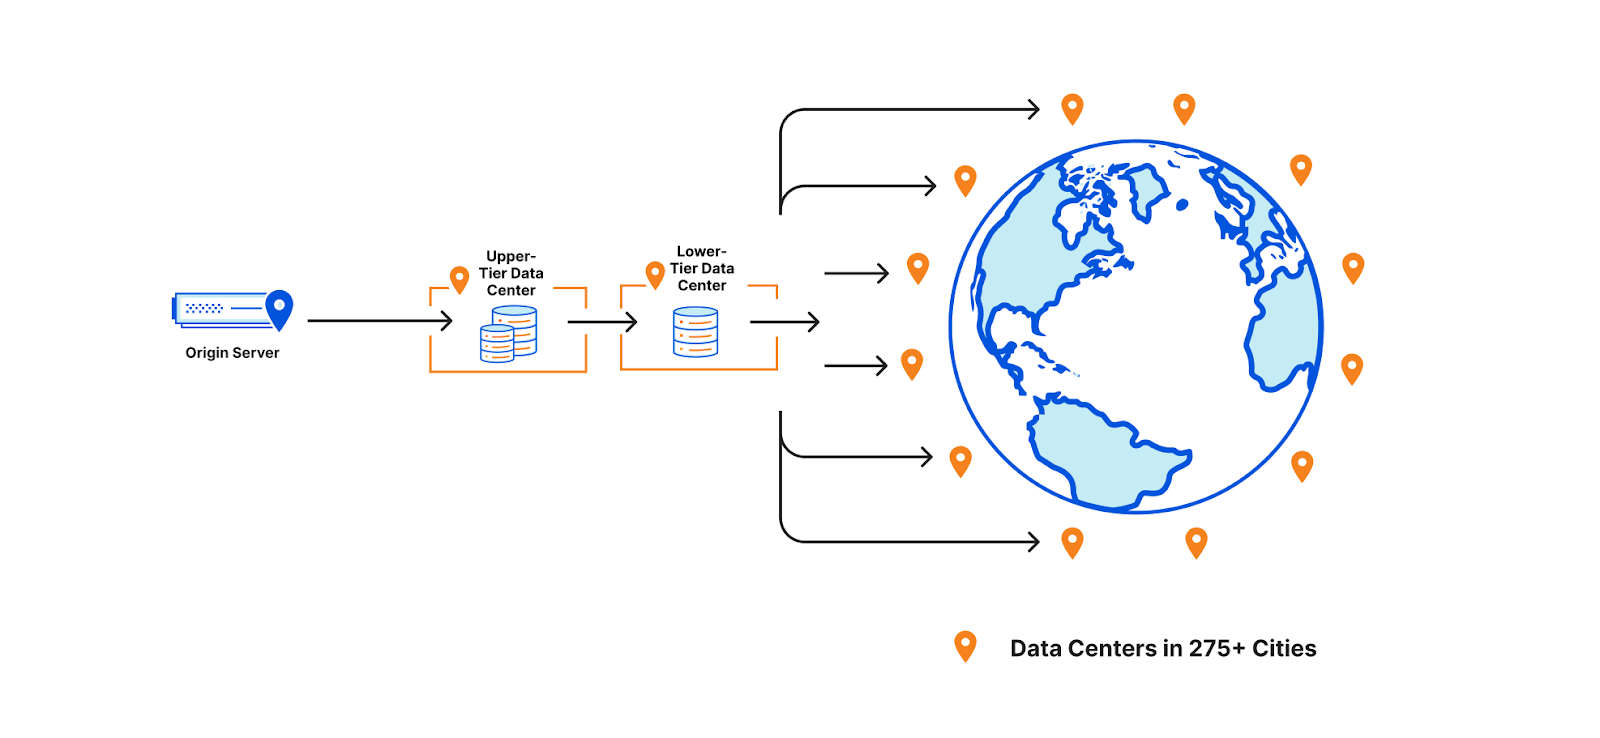
To help assets remain cached for longer, a few years ago we introduced Tiered Cache which organizes all of our 250+ global data centers into a hierarchy of lower-tiers (generally closer to visitors) and upper-tiers (generally closer to origins). When a request for content cannot be served from a lower-tier’s cache, the upper-tier is checked before going to the origin for a fresh copy of the content. Organizing our data centers into tiers helps us cache content in the right places for longer by putting multiple caches between the visitor’s request and the origin.
Why do cache misses occur? Misses occur when Cloudflare cannot serve the content from cache and must go back to the origin to retrieve a fresh copy. This can happen when a customer sets the cache-control time to signify when the content is out of date (stale) and needs to be revalidated. The other element at play – how long the network wants content to remain cached – is a bit more complicated and can fluctuate depending on eviction criteria.
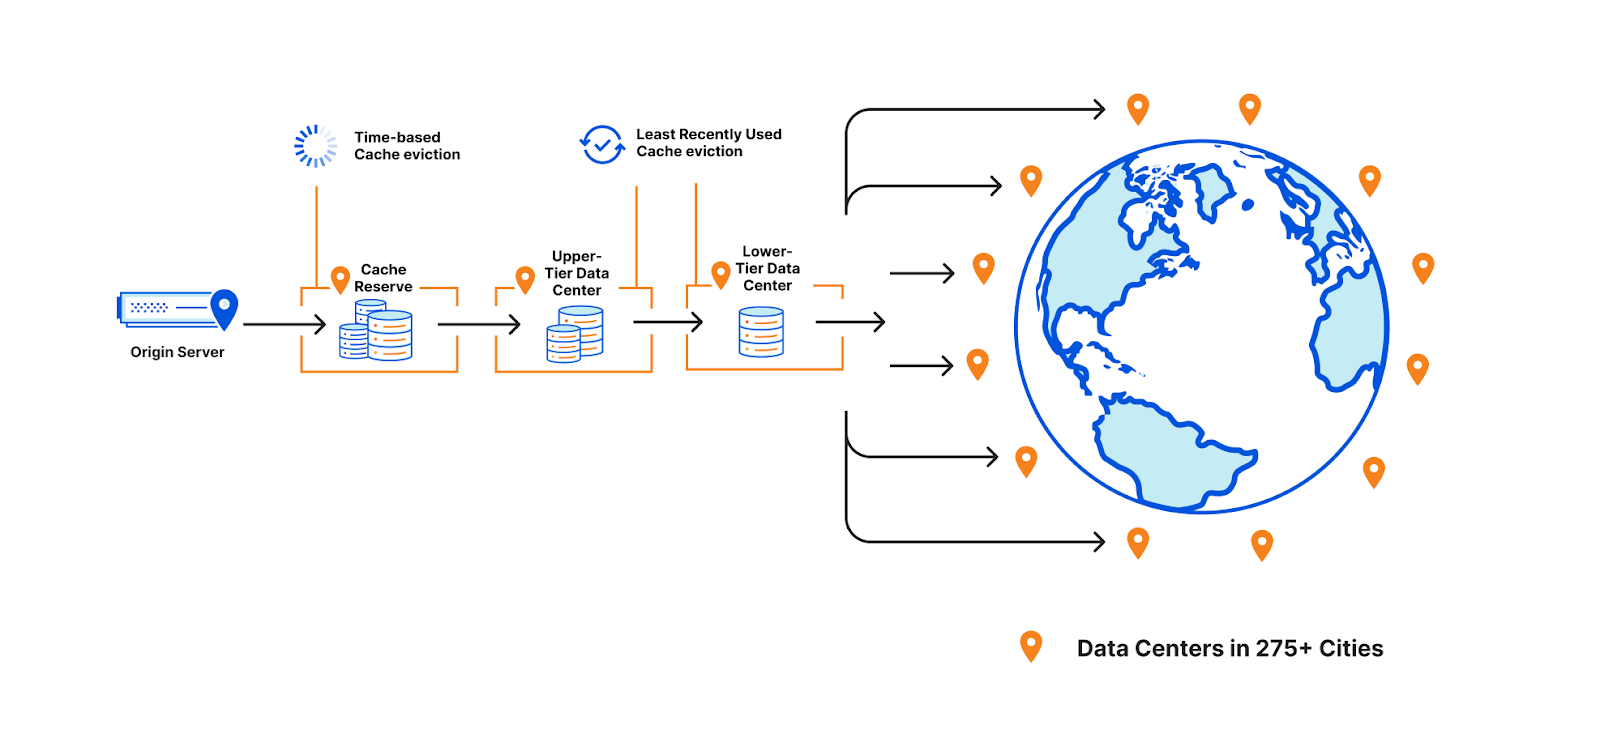
CDNs must consider whether they need to evict content early to optimize storage of other assets when cache space is full. At Cloudflare, we prioritize eviction based on how recently a piece of cached content was requested by using an algorithm called “least recently used” or LRU. This means that even if cache-control signifies that a piece of content should be cached for many days, we may still need to evict it earlier (if it is least-requested in that cache) to cache more popular content.
This works well for most customers and website visitors, but is often a point of confusion for people wondering why content is unexpectedly displaying a miss. If eviction did not happen then content would need to be cached in data centers that were further away from visitors requesting that data, harming the performance of the asset and injecting inefficiencies into how Cloudflare’s network operates.
Some customers, however, have large libraries of content that may not be requested for long periods of time. Using the traditional cache, these assets would likely be evicted and, if requested again, served from the origin. Keeping assets in cache requires that they remain popular on the Internet which is hard given what’s popular or current is constantly changing. Evicting content that becomes cold means additional origin egress for the customer if that content needs to be pulled repeatedly from the origin.
Enter Cache Reserve This is where Cache Reserve shines. Cache Reserve serves as the ultimate upper-tier data center for content that might otherwise be evicted from cache. Once admitted to Cache Reserve, content can be stored for a much longer period of time– 30 days by default. If another request comes in during that period, it can be extended for another 30 days (and so on) or until cache-control signifies that we should no longer serve that content from cache. Cache Reserve serves as a safety net to backstop all cacheable content, so customers don’t have to worry about unwanted cache eviction and origin egress fees.
How does Cache Reserve save egress?
The promise of Cache Reserve is that hit ratios will increase and egress fees from origins will decrease for long tail content that is rarely requested and may be evicted from cache.
However, there are additional egress savings built into the product. For example, objects are written to Cache Reserve on misses. This means that when fetching the content from the origin on a cache miss, we both use that to respond to a request while also writing the asset to Cache Reserve, so customers won’t experience egress from serving that asset for a long time.
Cache Reserve is designed to be used with tiered cache enabled for maximum origin shielding. When there is a cache miss in both the lower and upper tiers, Cache Reserve is checked and if there is a hit, the response will be cached in both the lower and upper tier on its way back to the visitor without the origin needing to see the request or serve any additional data.
Cache Reserve accomplishes these origin egress savings for a low price, based on R2 costs. For more information on Cache Reserve prices and operations, please see the documentation here.
Scaling Cache Reserve on Cloudflare’s developer platform
When we first announced Cache Reserve, the response was overwhelming. Over 20,000 users wanted access to the beta, and we quickly made several interesting discoveries about how people wanted to use Cache Reserve.
The first big challenge we found was that users hated egress fees as much as we do and wanted to make sure that as much content as possible was in Cache Reserve. During the closed beta we saw usage above 8,000 PUT operations per second sustained, and objects served at a rate of over 3,000 GETs per second. We were also caching around 600Tb for some of our large customers. We knew that we wanted to open the product up to anyone that wanted to use it and in order to scale to meet this demand, we needed to make several changes quickly. So we turned to Cloudflare’s developer platform.
Cache Reserve stores data on R2 using its S3-compatible API. Under the hood, R2 handles all the complexity of an object storage system using our performant and scalable developer primitives: Workers and Durable Objects. We decided to use developer platform tools because it would allow us to implement different scaling strategies quickly. The advantage of building on the Cloudflare developer platform is that Cache Reserve was easily able to experiment to see how we could best distribute the high load we were seeing, all while shielding the complexity of how Cache Reserve works from users.
With the single press of a button, Cache Reserve performs these functions:
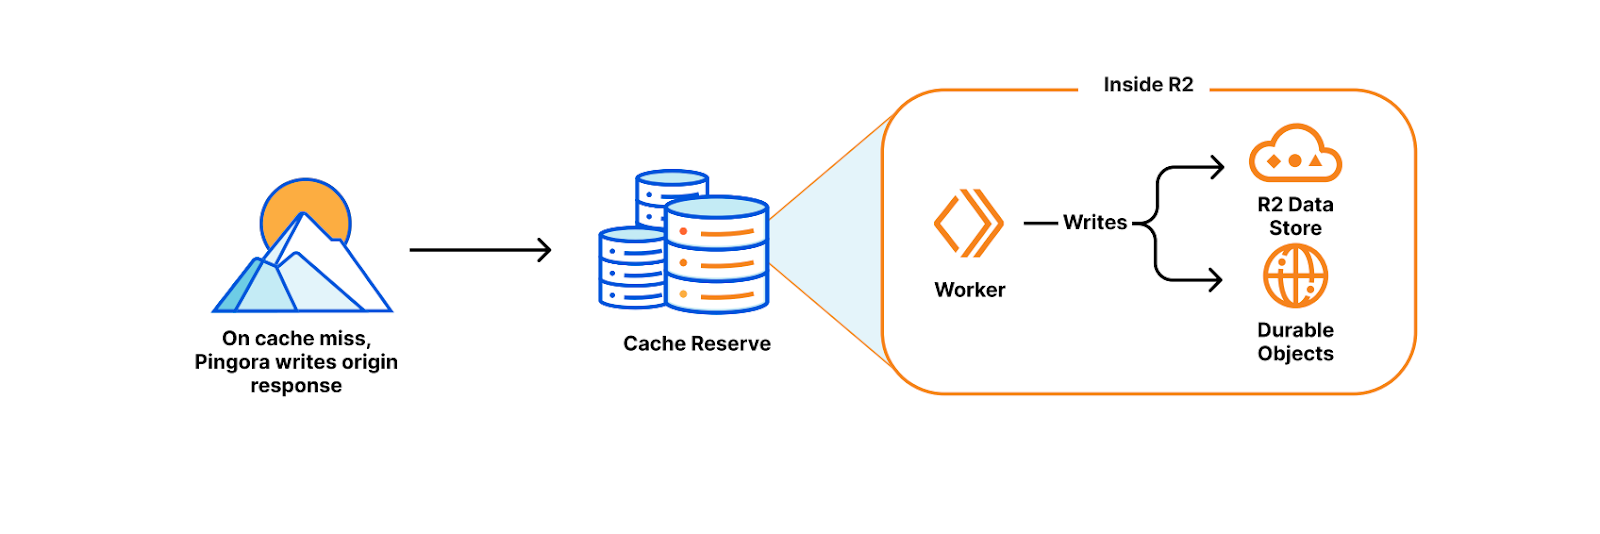
On a cache miss, Pingora (our new L7 proxy) reaches out to the origin for the content and writes the response to R2. This happens while the content continues its trip back to the visitor (thereby avoiding needless latency).
Inside R2, a Worker writes the content to R2’s persistent data storage while also keeping track of the important metadata that Pingora sends about the object (like origin headers, freshness values, and retention information) using Durable Objects storage.
When the content is next requested, Pingora looks up where the data is stored in R2 by computing the cache key. The cache key’s hash determines both the object name in R2 and which bucket it was written to, as each zone’s assets are sharded across multiple buckets to distribute load.
Once found, Pingora attaches the relevant metadata and sends the content from R2 to the nearest upper-tier to be cached, then to the lower-tier and finally back to the visitor.
This is magic! None of the above needs to be managed by the user. By bringing together R2, Workers, Durable Objects, Pingora, and Tiered Cache we were able to quickly build and make changes to Cache Reserve to scale as needed…
What’s next for Cache Reserve
In addition to the work we’ve done to scale Cache Reserve, opening the product up also opens the door to more features and integrations across Cloudflare. We plan on putting additional analytics and metrics in the hands of Cache Reserve users, so they know precisely what’s in Cache Reserve and how much egress it’s saving them. We also plan on building out more complex integrations with R2 so if customers want to begin managing their storage, they are able to easily make that transition. Finally, we’re going to be looking into providing more options for customers to control precisely what is eligible for Cache Reserve. These features represent just the beginning for how customers will control and customize their cache on Cloudflare.
What’s some of the feedback been so far?
As a long time Cloudflare customer, we were eager to deploy Cache Reserve to provide cost savings and improved performance for our end users. Ensuring our application always performs optimally for our global partners and delivery riders is a primary focus of Delivery Hero. With Cache Reserve our cache hit ratio improved by 5% enabling us to scale back our infrastructure and simplify what is needed to operate our global site and provide additional cost savings. Wai Hang Tang, Director of Engineering at Delivery Hero
Anthology uses Cloudflare’s global cache to drastically improve the performance of content for our end users at schools and universities. By pushing a single button to enable Cache Reserve, we were able to provide a great experience for teachers and students and reduce two-thirds of our daily egress traffic. Paul Pearcy, Senior Staff Engineer at Anthology
At Enjoei we’re always looking for ways to help make our end-user sites faster and more efficient. By using Cloudflare Cache Reserve, we were able to drastically improve our cache hit ratio by more than 10% which reduced our origin egress costs. Cache Reserve also improved the performance for many of our merchants’ sites in South America, which improved their SEO and discoverability across the Internet (Google, Criteo, Facebook, Tiktok)– and it took no time to set it up. Elomar Correia, Head of DevOps SRE | Enterprise Solutions Architect at Enjoei
In the live events industry, the size and demand for our cacheable content can be extremely volatile, which causes unpredictable swings in our egress fees. Additionally, keeping data as close to our users as possible is critical for customer experience in the high traffic and low bandwidth scenarios our products are used in, such as conventions and music festivals. Cache Reserve helps us mitigate both of these problems with minimal impact on our engineering teams, giving us more predictable costs and lower latency than existing solutions. Jarrett Hawrylak, VP of Engineering | Enterprise Ticketing at Patron Technology
How can I use it today?
As of today, Cache Reserve is in open beta, meaning that it’s available to anyone who wants to use it.
To use the Cache Reserve:
Simply go to the Caching tile in the dashboard.
Navigate to the Cache Reserve page and push the enable data sync button (or purchase button).
Enterprise Customers can work with their Cloudflare Account team to access Cache Reserve.
Customers can ensure Cache Reserve is working by looking at the baseline metrics regarding how much data is cached and how many operations we’ve seen in the Cache Reserve section of the dashboard. Specific requests served by Cache Reserve are available by using Logpush v2 and finding HTTP requests with the field “CacheReserveUsed.”
We will continue to make sure that we are quickly triaging the feedback you give us and making improvements to help ensure Cache Reserve is easy to use, massively beneficial, and your choice for reducing egress fees for cached content.
Try it out
We’ve been so excited to get Cache Reserve in more people’s hands. There will be more exciting developments to Cache Reserve as we continue to invest in giving you all the tools you need to build your perfect cache.
Try Cache Reserve today and let us know what you think.
Our customers rely on their Cloudflare logs to troubleshoot problems and debug issues. One of the biggest challenges with logs is the cost of managing them, so earlier this year, we launched the ability to store and retrieve Cloudflare logs using R2.
In this post, I’ll explain how we built the R2 Log Retrieval API using Cloudflare Workers with a focus on Durable Objects and the Streams API. Using these, allows a customer to index and query millions of their Cloudflare logs stored in batches on R2.
Before we dive into the internals you might be wondering why one doesn’t just use a traditional database to index these logs? After all, databases are a well proven technology. Well, the reason is that individual developers or companies, both large and small, often don’t have the resources necessary to maintain such a database and the surrounding infrastructure to create this kind of setup.
Our approach instead relies on Durable Objects to maintain indexes of the data stored in R2, removing the complexity of managing and maintaining your own database. It was also super easy to add Durable Objects to our existing Workers code with just a few lines of config and some code. And R2 is very economical.
Indexing
Indexing data is often used to reduce the lookup time for a query by first pre-processing the data and computing an index – usually a file (or set of files) that have a known structure which can be used to perform lookups on the underlying data. This approach makes lookups quick as indexes typically contain the answer for a given query, or at the very least, tells you how to find it. For this project we are going to index records by the unique identifier called a RayID which our customers use to identify an HTTP request in their logs, but this solution can be modified to index any many other types of data.
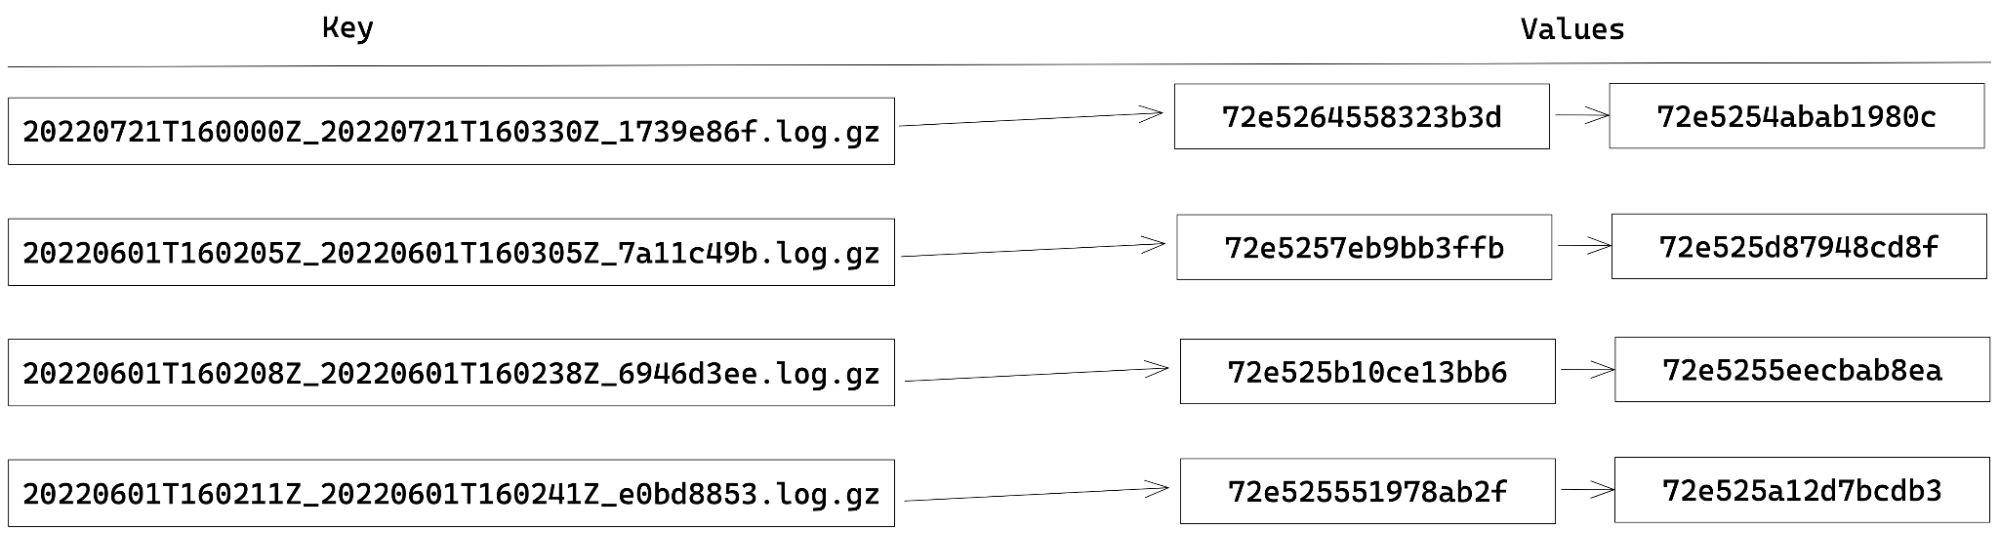
When indexing RayIDs for logs stored in R2, we choose an index structure that is fairly straightforward and is commonly known as a forward-index. This type of index consists of a key-value mapping between a document’s name and a list of words contained in that document. The terms “document” and “words” are meant to be generic, and you get to define what a document and a word is.
In our case, a document is a batch of logs stored in R2 and the words are RayIDs contained within that document. For example, our index currently looks like this:
Building an index using Durable Objects and the Streams API
In order to maintain the state of our index, we chose to use Durable Objects. Each Durable Object has its own transactional key-value storage. Therefore, to store our index, we assign each key to be the document (batch) name and the value being a JSON-array of RayIDs within that document. When extracting the RayIDs for a given batch, updating the index becomes as simple as storage.put(batchName, rayIds). Likewise, getting all the RayIDs for a document is just a call to storage.get(batchName).
When performing indexing, since the batches are stored using compression and often with a 30-100x compression ratio, reading an entire batch into memory can lead to out-of-memory (OOM) errors in our Worker. To get around this, we use the Streams API to avoid the OOM errors by processing the data in smaller chunks. There are two types of streams available: byte-oriented and value-oriented. Byte-oriented streams operate at the byte-level for things such as compressing and decompressing data, while the value-orientated streams work on first class values in JavaScript. Numbers, strings, undefined, null, objects, you name it. If it’s a valid JavaScript value, you can process it using a value-oriented stream. The Streams API also allows us to define our own JavaScript transformations for both byte- and value-oriented streams.
So, when our API receives a request to index a batch, our Worker streams the contents from R2 into a pipeline of TransformationStreams to decompress the data, decode the bytes into strings, split the data into records based on the newlines, and finally collect all the RayIDs. Once we’ve collected all the RayIDs, the data is then persisted in the index by making calls to the Durable Object, which in turn calls the aforementioned storage.put method to persist the data to the index. To illustrate what I mean, I include some code detailing the steps described above.
async function index(r2, bucket, key, storage) {
  const obj = await getObject(r2, bucket, key);

  const rawStream = obj.Body as ReadableStream;
  const index: Record<string, string[]> = {};

  const rayIdIndexingStream = new TransformStream({
    transform(chunk: string) {
      for (const match of chunk.matchAll(RAYID_FIELD_REGEX)) {
        const { rayid } = match.groups!;
        if (key in index) {
          index[key].push(rayid);
        } else {
          index[key] = [rayid];
        }
      }
    }
  });

  await collectStream(rawStream.pipeThrough(new DecompressionStream('gzip')).pipeThrough(textDecoderStream()).pipeThrough(readlineStream()).pipeThrough(rayIdIndexingStream));
  storage.put(index);
}
Searching for a RayID
Once a batch has been indexed, and the index is persisted to our Durable Object, we can then query it using a combination of the RayID and a batch name to check the presence of a RayID in that given batch. Assuming that a zone is producing a batch of logs at the rate of one batch per second this means that over 86,400 batches would be produced in a day! Over the course of a week, there would be far too many keys in our index for us to be able to iterate through them all in a timely manner. This is where the encoding of a RayID and the naming of each batch comes into play.
A RayID is currently, and I emphasize currently because this can change and has over time, a 16-byte hex encoded value where the first 36-bits encode a timestamp, and it looks something like: 764660d8ec5c2ab1. Note that the format of the RayID is likely to evolve in the near future, but for now we can use it to optimize retrieval.
Each batch produced by Logpush also happens to encode the time the batch was started and completed. Last but not least, upon analysis of our logging pipeline we found that 95% of RayIDs can be found in a batch produced within five minutes of the request completing. (Note that the encoded time sets a lower bound of the batch time we need to search).
Encoding of a RayIDEncoding of a batch name
For example: say we have a request that was made on November 3 at 16:00:00 UTC. We only need to check the batches under the prefix 20221103 and those batches that contain the time range of 16:00:00 to 16:05:00 UTC.
By reducing the number of batches to just a small handful of possibilities for a given RayID, we can simply ask our index if any of those batches contains the RayID by iterating through all the batch names (keys).
If the RayID is found in a batch, we then stream the corresponding batch back from R2 using another TransformationStream pipeline to filter out any non-matching records from the final response. If no result was found, we return an error message saying we were unable to find the RayID.
Summary
To recap, we showed how we can use Durable Objects and their underlying storage to create and manage forward-indexes for performing efficient lookup on the RayID for potentially millions of records. All without needing to manage your own database or logging infrastructure or doing a full-scan of the data.
While this is just one possible use case for Durable Objects, we are just getting started. If you haven’t read it before, checkout How we built Instant Logs to see another application of Durable Objects to stream millions of logs in real-time to your Cloudflare Dashboard!
What’s next
We currently offer RayID lookups for the HTTP Requests, Firewall Events, and soon support for Workers Trace Events. This is just the beginning for our Log Retrieval API, and we are already looking to add the ability to index and query on more types of fields such as status codes and host names. We also plan to integrate this into the dashboard so that developers can quickly retrieve the logs they need without needing to craft the necessary API calls by hand.
Last but not least, we want to make our retrieval functionality even more powerful and are looking at adding more complex types of filters and queries that you can run against your logs.
As always, stay tuned to the blog for more updates to our developer documentation for instructions on how to get started with log retrieval. If you’re interested in joining the beta, please email [email protected].
Millions of customers trust Cloudflare to accelerate their website, protect their network, or as a platform to build their own applications. But, once you’re running in production, how do you know what’s going on with your application? You need logs from Cloudflare – a record of what happened on our network when your customers interacted with your product that uses Cloudflare.
Cloudflare Logs are an indispensable tool for debugging applications, identifying security vulnerabilities, or just understanding how users are interacting with your product. However, our customers generate petabytes of logs, and store them for months or years at a time. Log data is tantalizing: all those answers, just waiting to be revealed with the right query! But until now, it’s been too hard for customers to actually store, search, and understand their logs without expensive and cumbersome third party tools.
Today we’re announcing Cloudflare Logs Engine: a new product to enable any kind of investigation with Cloudflare Logs — all within Cloudflare.
Starting today, Cloudflare customers who push their logs to R2 can retrieve them by time range and unique identifier. Over the coming months we want to enable customers to:
Store logs for any Cloudflare dataset, for as long as you want, with a few clicks
Access logs no matter what plan you use, without relying on third party tools
Write queries that include multiple datasets
Quickly identify the logs you need and take action based on what you find
Why Cloudflare Logs?
When it comes to visibility into your traffic, most customers start with analytics. Cloudflare dashboard is full of analytics about all of our products, which give a high-level overview of what’s happening: for example, number of requests served, the ratio of cache hits, or the amount of CPU time used.
But sometimes, more detail is needed. Developers especially need to be able to read individual log lines to debug applications. For example, suppose you notice a problem where your application throws an error in an unexpected way – you need to know the cause of that error and see every request with that pattern.
Cloudflare offers tools like Instant Logs and wrangler tail which excel at real-time debugging. These are incredibly helpful if you’re making changes on the fly, or if the problem occurs frequently enough that it will appear during your debugging session.
In other cases, you need to find that needle in a haystack — the one rare event that causes everything to go wrong. Or you might have identified a security issue and want to make sure you’ve identified every time that issue could have been exploited in your application’s history.
When this happens, you need logs. In particular, you need forensics: the ability to search the entire history of your logs.
A brief overview of log analysis
Before we take a look at Logs Engine itself, I want to briefly talk about alternatives – how have our customers been dealing with their logs so far?
Cloudflare has long offered Logpull and Logpush. Logpull enables enterprise customers to store their HTTP logs on Cloudflare for up to seven days, and retrieve them by either time or RayID. Logpush can send your Cloudflare logs just about anywhere on the Internet, quickly and reliably. While Logpush provides more flexibility, it’s been up to customers to actually store and analyze those logs.
Cloudflare has a number of partnerships with SIEMs and data warehouses/data lakes. Many of these tools even have pre-built Cloudflare dashboards for easy visibility. And third party tools have a big advantage in that you can store and search across many log sources, not just Cloudflare.
That said, we’ve heard from customers that they have some challenges with these solutions.
First, third party log tooling can be expensive! Most tools require that you pay not just for storage, but for indexing all of that data when it’s ingested. While that enables powerful search functionality later on, Cloudflare (by its nature) is often one of the largest emitters of logs that a developer will have. If you were to store and index every log line we generate, it can cost more money to analyze the logs than to deliver the actual service.
Second, these tools can be hard to use. Logs are often used to track down an issue that customers discover via analytics in the Cloudflare dashboard. After finding what you need in logs, it can be hard to get back to the right part of the Cloudflare dashboard to make the appropriate configuration changes.
Finally, Logpush was previously limited to Enterprise plans. Soon, we will start offering these services to customers at any scale, regardless of plan type or how they choose to pay.
Why Logs Engine?
With Logs Engine, we wanted to solve these problems. We wanted to build something affordable, easy to use, and accessible to any Cloudflare customer. And we wanted it to work for any Cloudflare logs dataset, for any span of time.
Our first insight was that to make logs affordable, we need to separate storage and compute. The cost of Storage is actually quite low! Thanks to R2, there’s no reason many of our customers can’t store all of their logs for long periods of time. At the same time, we want to separate out the analysis of logs so that customers only pay for the compute of logs they analyze – not every line ingested. While we’re still developing our query pricing, our aim is to be predictable, transparent and upfront. You should never be surprised by the cost of a query (or land a huge bill by accident).
It’s great to separate storage and compute. But, if you need to scan all of your logs anyway to answer the first question you have, you haven’t gained any benefits to this separation. In order to realize cost savings, it’s critical to narrow down your search before executing a query. That’s where our next big idea came in: a tight integration with analytics.
Most of the time, when analyzing logs, you don’t know what you’re looking for. For example, if you’re trying to find the cause of a specific origin status code, you may need to spend some time understanding which origins are impacted, which clients are sending them, and the time range in which these errors happened. Thanks to our ABR analytics, we can provide a good summary of the data very quickly – but not the exact details of what happened. By integrating with analytics, we can help customers narrow down their queries, then switch to Logs Engine once you know exactly what you’re looking for.
Finally, we wanted to make logs accessible to anyone. That means all plan types – not just Enterprise.
Additionally, we want to make it easy to both set up log storage and analysis, and also to take action on logs once you find problems. With Logs Engine, it will be possible to search logs right from the dashboard, and to immediately create rules based on the patterns you find there.
What’s available today and our roadmap
Today, Enterprise customers can store logs in R2 and retrieve them via time range. Currently in beta, we also allow customers to retrieve logs by RayID (see our companion blog post) — to join the beta, please email [email protected].
Coming soon, we will enable customers on all plan types — not just Enterprise — to ingest logs into Logs Engine. Details on pricing will follow soon.
We also plan to build more powerful querying capability, beyond time range and RayID lookup. For example, we plan to support arbitrary filtering on any column, plus more expressive queries that can look across datasets or aggregate data.
But why stop at logs? This foundation lays the groundwork to support other types of data sources and queries one day. We are just getting started. Over the long term, we’re also exploring the ability to ingest data sources outside of Cloudflare and query them. Paired with Analytics Engine this is a formidable way to explore any data set in a cost-effective way!
One of the things we prioritize at Cloudflare is enabling developers to build their applications on our developer platform with ease. We’re excited to share a collection of ready-made templates that’ll help you start building your next application on Workers. We want developers to get started as quickly as possible, so that they can focus on building and innovating and avoid spending so much time configuring and setting up their projects.
Cloudflare Workers enables you to build applications with exceptional performance, reliability, and scale. We are excited to share a collection of templates that helps you get started quickly and give you an idea of what is possible to build on our developer platform.
We have made available a set of starter templates highlighting different use cases of Workers. We understand that you have different ideas you will love to build on top of Workers and you may have questions or wonder if it is possible. These sets of templates go beyond the convention ‘Hello, World’ starter. They’ll help shape your idea of what kind of applications you can build with Workers as well as other products in the Cloudflare Developer Ecosystem.
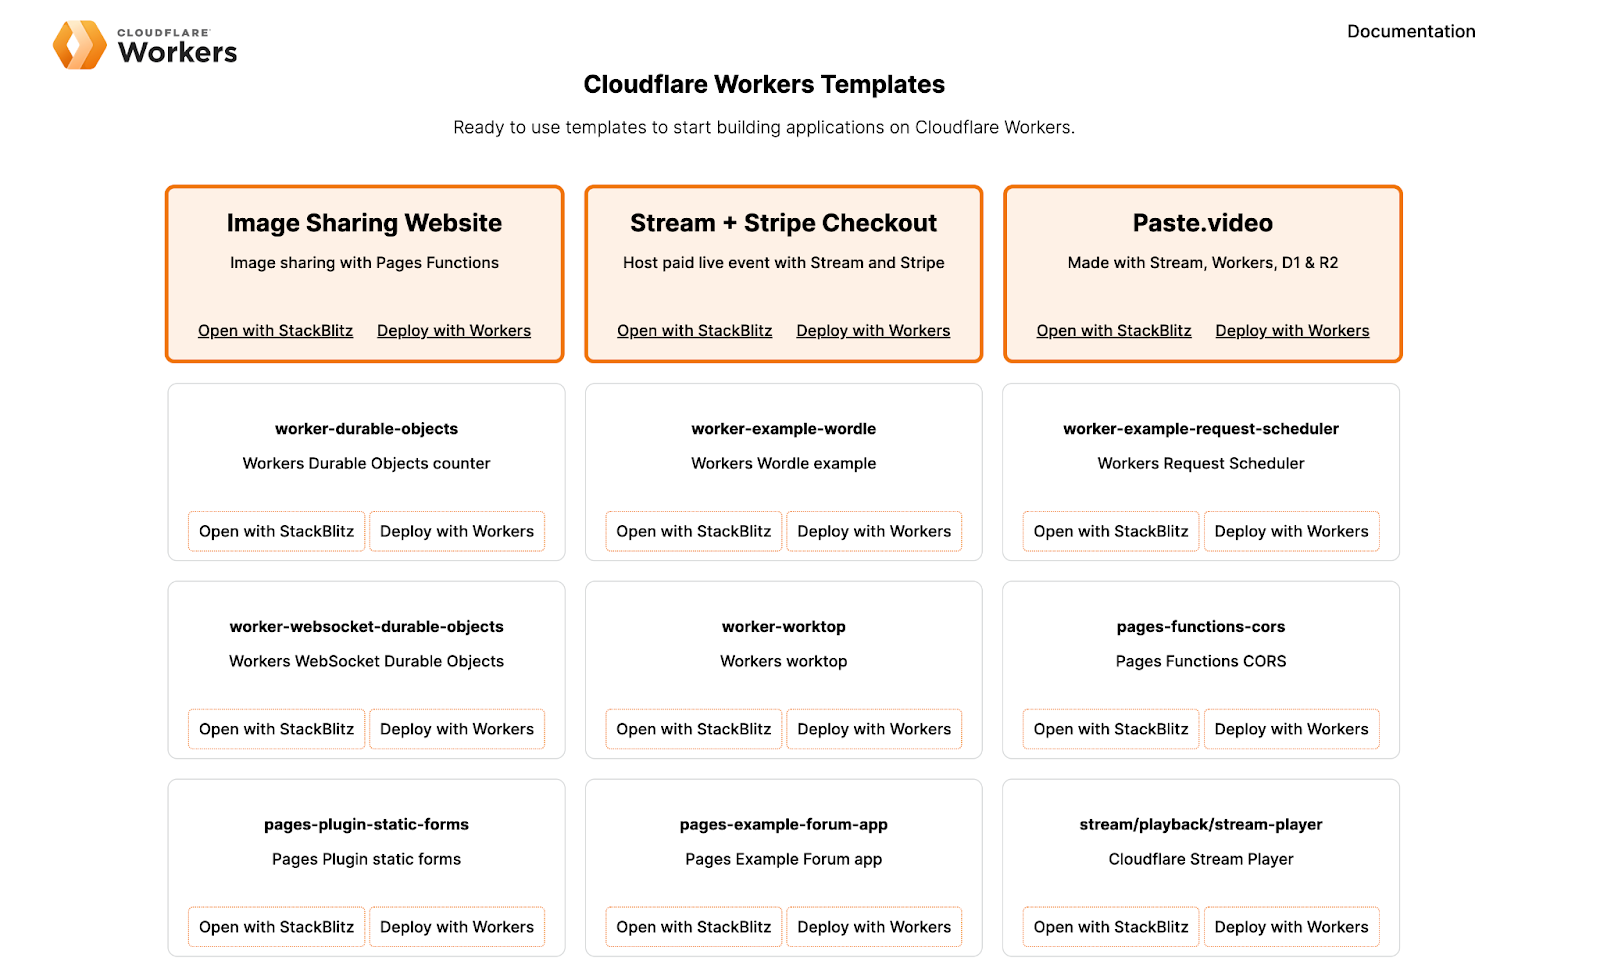
We are excited to introduce a new collection of starter templates workers.new/templates. This shortcut will serve you a collection of templates that you can immediately start using to build your next application.
Cloudflare Workers Template Collection
How to use Cloudflare Workers templates
We created this collection of templates to support you in getting started with Workers. Some examples listed showcase a use-case with a combination of multiple Cloudflare developer platform products to build applications similar to ones you might use every day. We know that Workers are being used today for different use-cases, we want to showcase some of them to you.
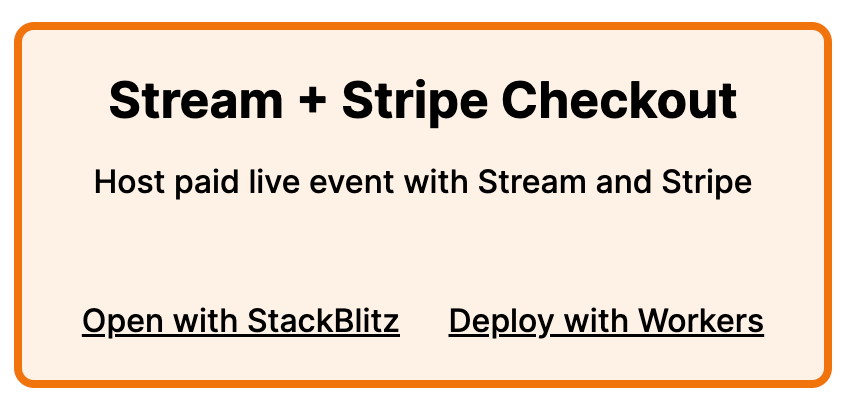
One example to highlight is a template that lets you accept payment for video content. It is powered by Pages Functions, Cloudflare Stream and Stripe Checkout. This app shows how you can use Cloudflare Workers with external payment and authentication systems to create a logged-in experience, without ever having to manage a database or persist any state yourself.
Once a user has paid, Stripe Checkout redirects to a URL that verifies a token from Stripe, and generates a signed URL using Cloudflare Stream to view the video. This signed URL is only valid for a specified amount of time, and access can be restricted by country or IP address.
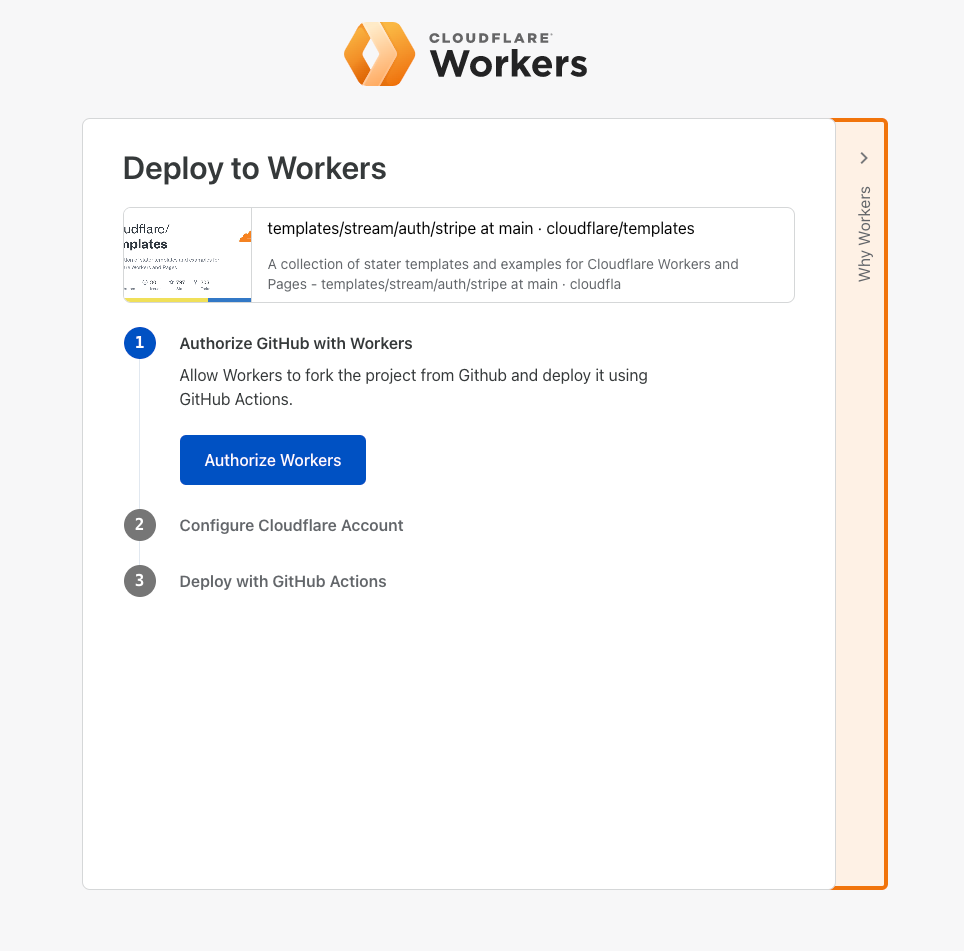
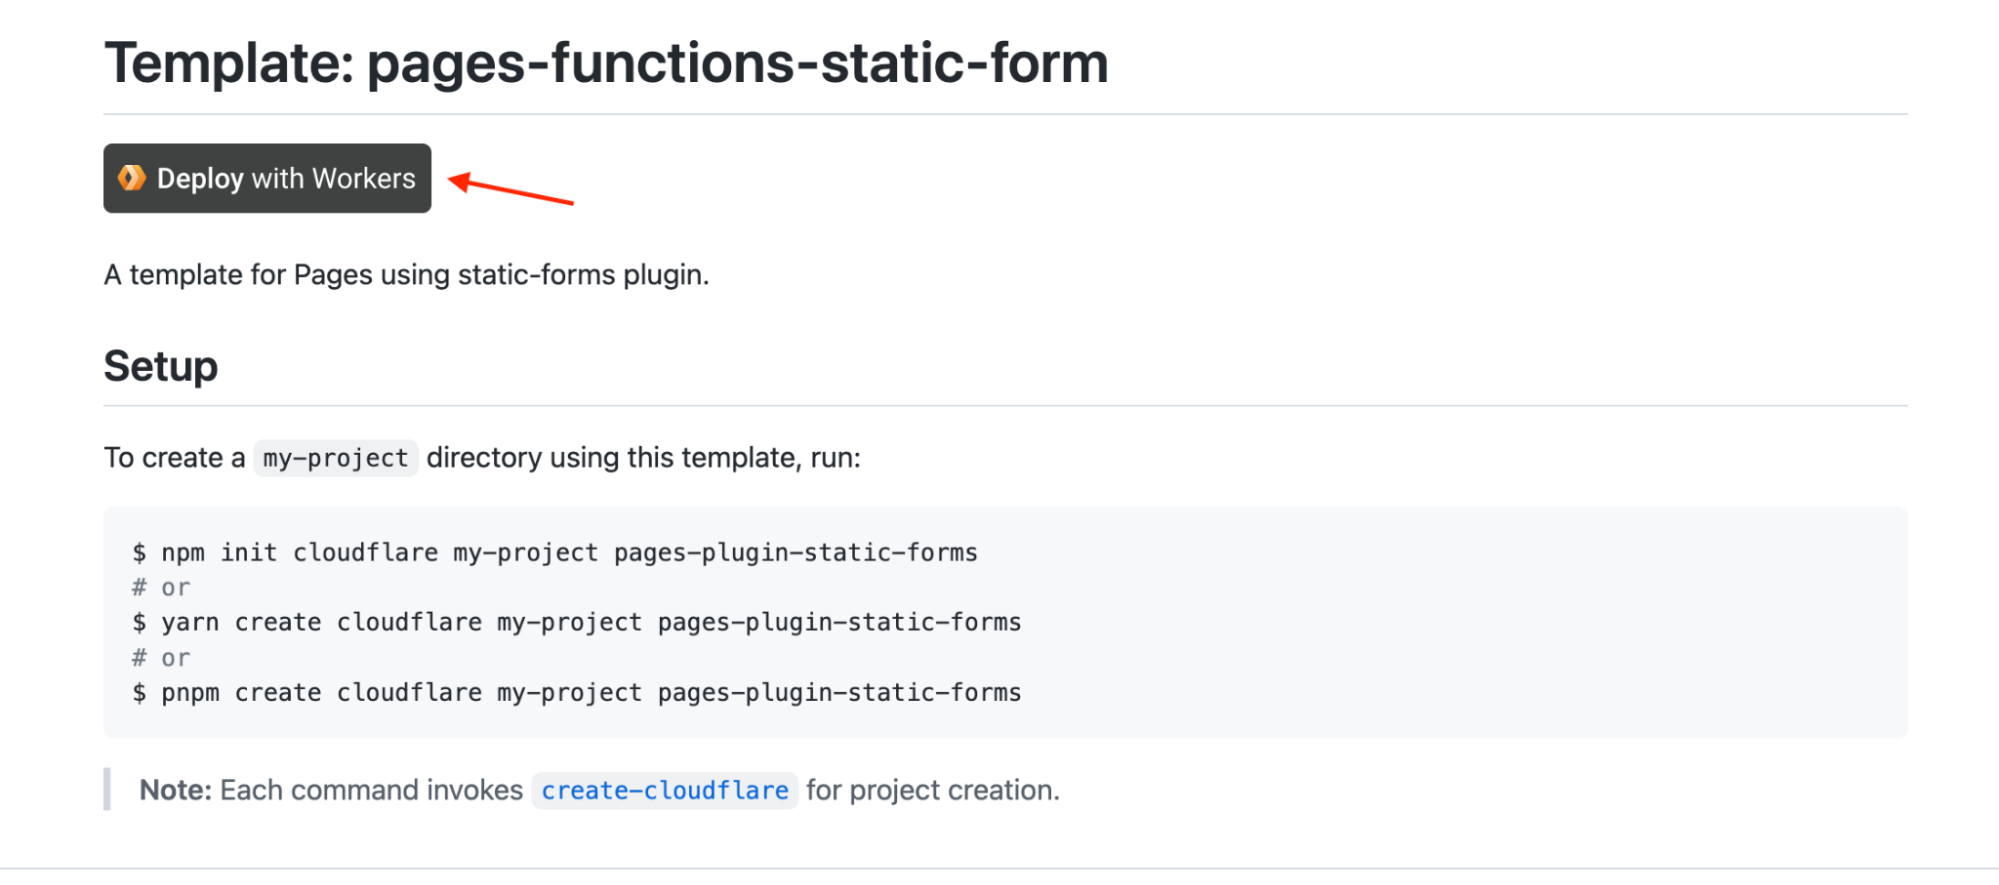
To use the template, you need to either click the deploy with Workers button or open the template with Stackblitz.
The Deploy with Workers button will redirect you to a page where you can authorize GitHub to deploy a fork of the repository using GitHub actions while opening with StackBlitz creates a new fork of the template for you to start working with.
Deploy to Workers Demo
These templates also comes bundled with additional features I would like to share with you:
We added a deploy button to all templates listed in the templates repository and the collection website, so you can quickly get up to speed with your code. The deploy with Workers button lets you deploy your code in under five minutes, it uses a GitHub action powered with Cloudflare Workers to do this.
GitHub Repository with Deploy to Workers Button
Support for Test Driven Development
As developers, we need to write tests for our code to ensure we’re shipping quality production grade software and also ensure that our code is bug-free. We support writing tests in Workers using the Wrangler unstable_dev API to write integration and end-to-end tests. We want to enable not just the developer experience but also nudge developers to follow best practices and prioritize TDD in development. We configured a number of templates to support integration tests against a local server, this will serve as a template to help you set up tests in your projects.
Here’s an example using Wrangler’s unstable_dev API and Vitest test framework to test the code written in an example ‘Hello worker’ starter template:
We announced StackBlitz’s partnership with Cloudflare Workers during Platform Week early this year. We believe a developer’s experience should be of utmost priority because we want them to build with ease on our developer platform.
StackBlitz is an online development platform for building web applications. It is powered by WebContainers, the first WebAssembly-based operating system which boots Node.js environments in milliseconds, securely within your browser tab.
We made it even easier to get started with Workers with an integrated Open with StackBlitz button for each starter template, making it easier to create a fork of a template and the great thing is you only need a web browser to build your application.
Everything we’ve highlighted in this post, all leads to one thing – How can we create a better experience for developers getting started with Workers. We introduce these ready-made templates to make you more efficient, bring you a wholesome developer experience and help improve your time to deployment. We want you to spend less time getting started with building on the Workers developer platform, so what are you waiting for?
Next Steps
You can start building your own Worker today using the available templates provided in the templates collection to help you get started. If you would like to contribute your own templates to the collection, be sure to send in a pull request we’re more than happy to review and add to the growing collection. Share what you have built with us in the #builtwith channel on our Discord community. Make sure to follow us on Twitter or join our Discord Developers Community server.
It’s no wonder that Postgres is one of the world’s favorite databases. It’s easy to learn, a pleasure to use, and can scale all the way up from your first database in an early-stage startup to the system of record for giant organizations. Postgres has been an integral part of Cloudflare’s journey, so we know this fact well. But when it comes to connecting to Postgres from environments like Cloudflare Workers, there are unfortunately a bunch of challenges, as we mentioned in our Relational Database Connector post.
Neon.tech not only solves these problems; it also has other cool features such as branching databases — being able to branch your database in exactly the same way you branch your code: instant, cheap and completely isolated.
How to use it
It’s easy to get started. Neon’s client library @neondatabase/serverless is a drop-in replacement for node-postgres, the npm pg package with which you may already be familiar. After going through the getting started process to set up your Neon database, you can easily create a Worker to ask Postgres for the current time like so:
Create a new Worker — Run npx wrangler init neon-cf-demo and accept all the defaults. Enter the new folder with cd neon-cf-demo.
Install the Neon package — Run npm install @neondatabase/serverless.
Provide connection details — For deployment, run npx wrangler secret put DATABASE_URL and paste in your connection string when prompted (you’ll find this in your Neon dashboard: something like postgres://user:[email protected]/main). For development, create a new file .dev.vars with the contents DATABASE_URL= plus the same connection string.
Write the code — Lastly, replace src/index.ts with the following code:
import { Client } from '@neondatabase/serverless';
interface Env { DATABASE_URL: string; }

export default {
  async fetch(request: Request, env: Env, ctx: ExecutionContext) {
    const client = new Client(env.DATABASE_URL);
    await client.connect();
    const { rows: [{ now }] } = await client.query('select now();');
    ctx.waitUntil(client.end());  // this doesn’t hold up the response
    return new Response(now);
  }
}
To try this locally, type npm start. To deploy it around the globe, type npx wrangler publish.
How does this work? In this case, we take the coordinates supplied to our Worker in request.cf.longitude and request.cf.latitude. We then feed these coordinates to a SQL query that uses the PostGIS distance operator <-> to order our results:
const { longitude, latitude } = request.cf
const { rows } = await client.query(`
  select
    id_no, name_en, category,
    st_makepoint($1, $2) <-> location as distance
  from whc_sites_2021
  order by distance limit 10`,
  [longitude, latitude]
);
Since we created a spatial index on the location column, the query is blazing fast. The result (rows) looks like this:
[{
  "id_no": 308,
  "name_en": "Yosemite National Park",
  "category": "Natural",
  "distance": 252970.14782223428
},
{
  "id_no": 134,
  "name_en": "Redwood National and State Parks",
  "category": "Natural",
  "distance": 416334.3926827573
},
/* … */
]
For even lower latencies, we could cache these results at a slightly coarser geographical resolution — rounding, say, to one sixtieth of a degree (one arc minute) of longitude and latitude, which is a little under a mile.
Sign up to Neon using the invite code serverless and try the @neondatabase/serverless driver with Cloudflare Workers.
Why we did it
Cloudflare Workers has enormous potential to improve back-end development and deployment. It’s cost-effective, admin-free, and radically scalable.
The use of V8 isolates means Workers are now fast and lightweight enough for nearly any use case. But it has a key drawback: Cloudflare Workers don’t yet support raw TCP communication, which has made database connections a challenge.
Even when Workers eventually support raw TCP communication, we will not have fully solved our problem, because database connections are expensive to set up and also have quite a bit of memory overhead.
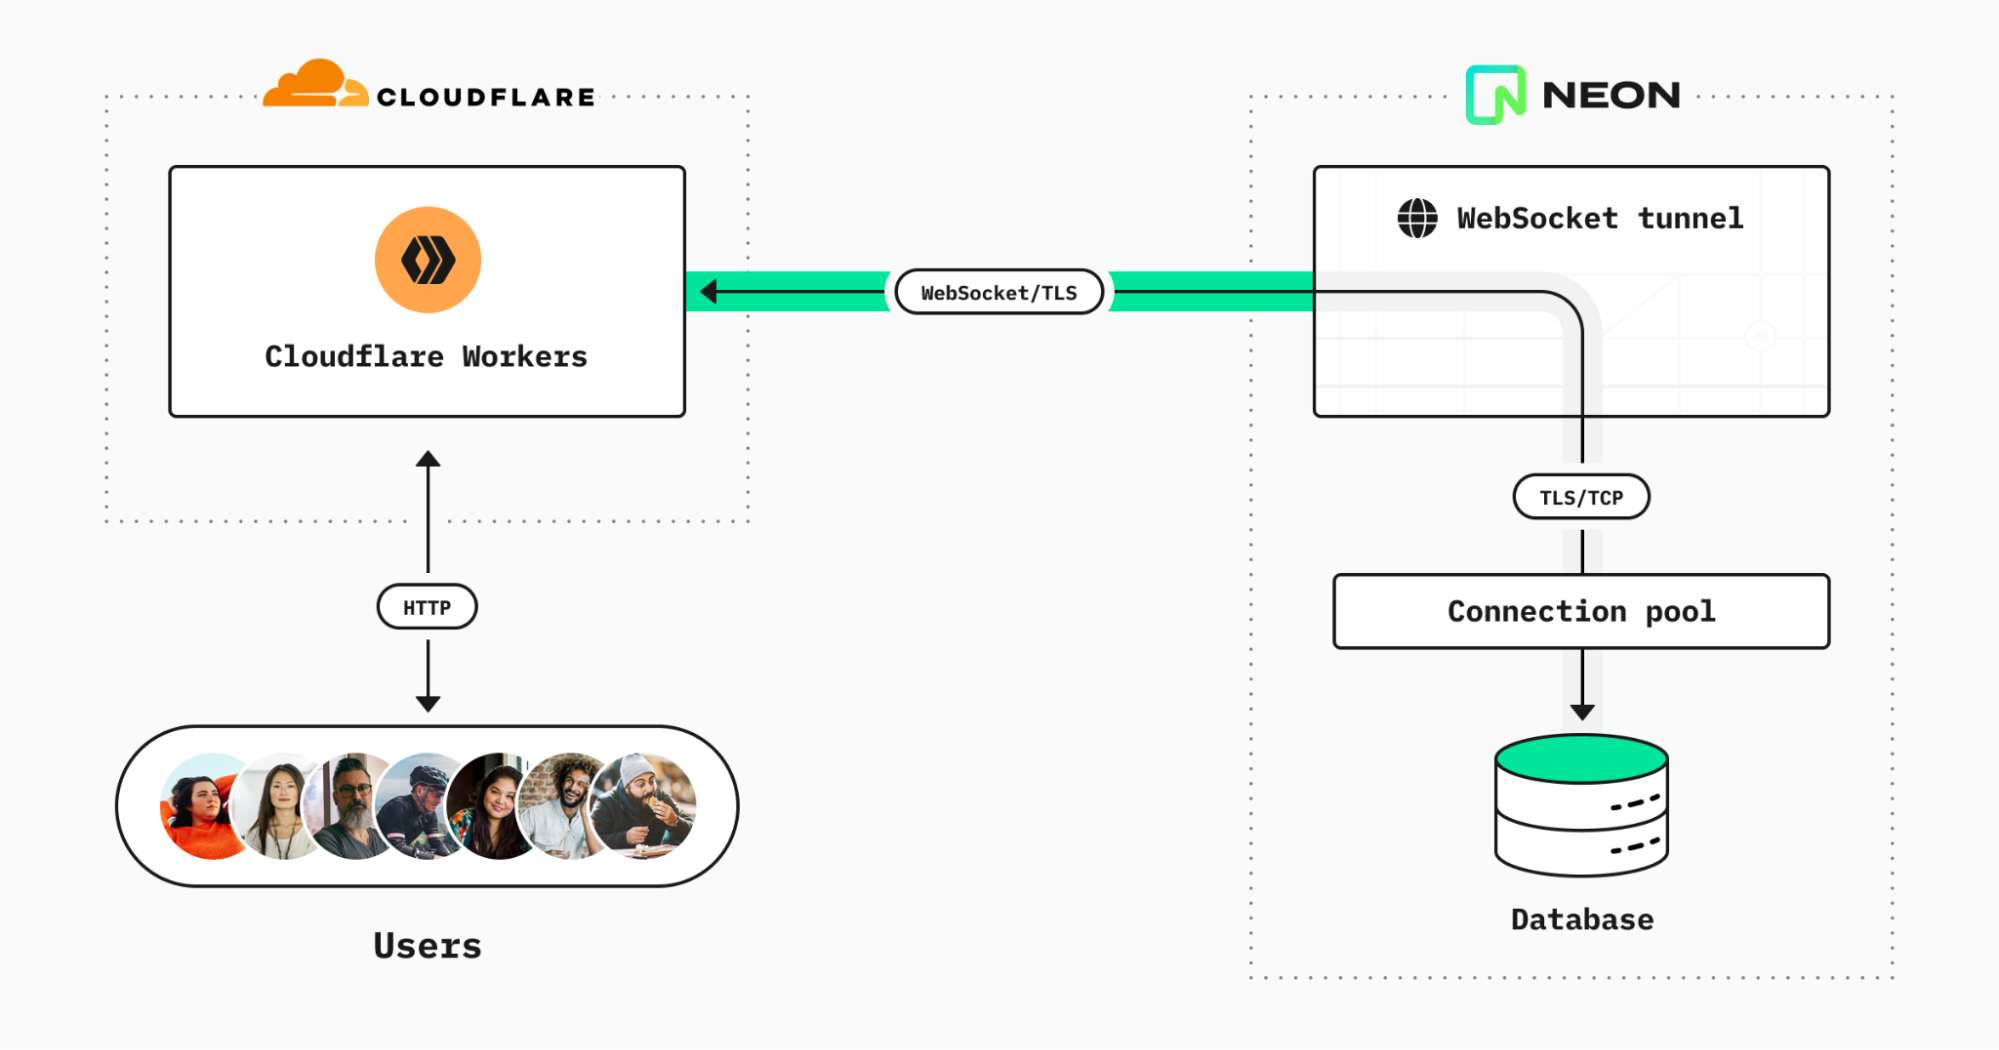
This is what the solution looks like:
It consists of three parts:
Connection pooling built into the platform — Given Neon’s serverless compute model, splitting storage and compute operations, it is not recommended to rely on a one-to-one mapping between external clients and Postgres connections. Instead, you can turn on connection pooling simply by flicking a switch (it’s in the Settings area of your Neon dashboard).
WebSocket proxy — We deploy our own WebSocket-to-TCP proxy, written in Go. The proxy simply accepts WebSocket connections from Cloudflare Worker clients, relays message payloads to a requested (Neon-only) host over plain TCP, and relays back the responses.
Client library — Our driver library is based on node-postgres but provides the necessary shims for Node.js features that aren’t present in Cloudflare Workers. Crucially, we replace Node’s net.Socket and tls.connect with code that redirects network reads and writes via the WebSocket connection. To support end-to-end TLS encryption between Workers and the database, we compile WolfSSL to WebAssembly with emscripten. Then we use esbuild to bundle it all together into an easy-to-use npm package.
The @neondatabase/serverless package is currently in public beta. We have plans to improve, extend, and explain it further in the near future on the Neon blog. In line with our commitment to open source, you can configure our serverless driver and/or run our WebSocket proxy to provide access to Postgres databases hosted anywhere — just see the respective repos for details.
Last month, we were warned not to install Qatar’s World Cup app because it was spyware. This month, it’s Egypt’s COP27 Summit app:
The app is being promoted as a tool to help attendees navigate the event. But it risks giving the Egyptian government permission to read users’ emails and messages. Even messages shared via encrypted services like WhatsApp are vulnerable, according to POLITICO’s technical review of the application, and two of the outside experts.
The app also provides Egypt’s Ministry of Communications and Information Technology, which created it, with other so-called backdoor privileges, or the ability to scan people’s devices.
On smartphones running Google’s Android software, it has permission to potentially listen into users’ conversations via the app, even when the device is in sleep mode, according to the three experts and POLITICO’s separate analysis. It can also track people’s locations via smartphone’s built-in GPS and Wi-Fi technologies, according to two of the analysts.
Launched in 2013, Hour of Code is an initiative to introduce young people to computer science using fun one-hour tutorials. To date, over 100 million young people have completed an hour of code with it.
Although the Hour of Code website is accessible all year round, every December for Computer Science Education Week people worldwide run their own Hour of Code events. Each year we love seeing many Code Clubs, CoderDojos, and young people at home across the community complete their Hour of Code. You can register your 2022 Hour of Code event now to run between 5 and 11 December.
To support your event, we have pulled together a bumper set of our free coding projects, which can each be completed in just one hour. You will find these activities on the Hour of Code website.
There’s something for all ages and levels of experience, so put an hour aside and help young people make something fabulous with code:
Ages 7–11
Beginner
For younger creators new to coding, a Scratch project is a great place to start.
With our Space talk project, they can create a space scene with characters that ‘emote’ to share their thoughts or feelings using sounds, colours, and actions. Creators program the character emotes using Scratch blocks to control graphic effects, costume animation, and sound effects.
Alternatively, our Stress ball project lets them code an onscreen stress ball that reacts to user clicks. Creators use the Paint and Sound editors in Scratch to personalise a clickable stress ball, and they add Scratch blocks to control graphic effects, costume animation, and sound effects.
We love this fun stress ball example sent to us recently by young creator April from the United States:
Another great option is to use Code Club World, which is a free tool to help children who are new to coding.
Creators can develop a character avatar, design a T-shirt, make some music, and more.
Comfortable
For 7- to 11-year-olds who are more comfortable with block-based coding, our project Broadcasting spells is ideal to choose. With the project, they connect Scratch blocks to code a wand that casts spells turning sprites into toads, and growing and shrinking them. Creators use broadcast blocks to transform multiple sprites at once, and they create sound effects with the Sound editor in Scratch.
Ages 11–14
Beginner
We have three exciting projects for trying text-based coding during Hour of Code in this category. The first, Anime expressions, is one of our brand-new ‘Introduction to web development’ projects. With this project, young people create a responsive webpage with text and images for an anime drawing tutorial. They write HTML to structure the webpage and CSS styles to apply layout, colour palettes, and fonts.
For a great introduction to coding with Python, we have the project Hello world from our ‘Introduction to Python’ path. With this project, creators write Python text-based code to create an interactive program that shows text and emojis based on user input. They learn about variables as they use them to store text and numbers, and they learn about writing functions to organise code and do calculations, retrieve the current date and time, and make a customisable dice.
LED firefly is a fantastic physical making project in which young people use a Raspberry Pi Pico microcontroller and basic electronic components to create a blinking LED firefly. They program the LED’s light patterns with MicroPython code and activate it via a switch they make themselves using jumper wires.
Comfortable
For 11- to 14-year-olds who are already comfortable with HTML, the Flip treat webcards project is a fun option. With this, they create a webpage showing a set of cards that flip when a visitor’s mouse pointer hovers over them. Creators use CSS styling and animations to add interactivity, then they customise the cards with fancy fonts and colour gradients.
Young people who have already done some Python coding can try out our project Target practice. With this project they create a game, using the p5 graphics library to draw a colourful target, and writing code so that the player scores points by hitting the target’s rings with arrows. While they create the project, they learn about RGB colours, shape positioning with x and y coordinates, and decisions using if, else-if, and else code statements.
Ages 14+
Beginner
Our project Charting champions is a great introduction to data visualisation and analysis for coders aged 15 and older. With the project, they will discover the power of the Python programming language as they store Olympic medal data in lists and use the pygal library to create an interactive chart.
Comfortable
Teenage coders who feel comfortable with Python programming can use our project Solar system simulator to code an animated, interactive solar system model using the Python p5 graphics library. Their model will be interactive, as they’ll use dictionaries to store planet facts that display when a user clicks on an orbiting planet.
Coding for Hour of Code and beyond
Now is the time to register your Hour of Code event, then decide which project you’d like to support young people to create. You can download certificates for each of the creators from the Hour of Code certificates page.
And make sure to check out our project paths so you know what projects you can help the young people you support to code beyond this one hour of code.
We don’t just create activities so that other people can experience coding and digital making — we also get involved ourselves!
Recently, our teams who support the Code Club and CoderDojo networks got together to make LED fireflies. We are excited to get coding again as part of Hour of Code and Computer Science Education Week.
Само две седмици, след като „Биволъ“ документира и засне празнуването на рождения ден на завеждащия Следствения отдел на Софийска градска прокуратура Илиян Танчев в работно време, той е повишен от…
Data engineers and data scientists are dependent on distributed data processing infrastructure like Amazon EMR to perform data processing and advanced analytics jobs on large volumes of data. In most mid-size and enterprise organizations, cloud operations teams own procuring, provisioning, and maintaining the IT infrastructures, and their objectives and best practices differ from the data engineering and data science teams. Enforcing infrastructure best practices and governance controls present interesting challenges for analytics teams:
Limited agility – Designing and deploying a cluster with the required networking, security, and monitoring configuration requires significant expertise in cloud infrastructure. This results in high dependency on operations teams to perform simple experimentation and development tasks. This typically results in weeks or months to deploy an environment.
Security and performance risks – Experimentation and development activities typically require sharing existing environments with other teams, which presents security and performance risks due to lack of workload isolation.
Limited collaboration – The security complexity of running shared environments and the lack of a shared web UI limits the analytics team’s ability to share and collaborate during development tasks.
To promote experimentation and solve the agility challenge, organizations need to reduce deployment complexity and remove dependencies to cloud operations teams while maintaining guardrails to optimize cost, security, and resource utilization. In this post, we walk you through how to implement a self-service analytics platform with Amazon EMR and Amazon EMR Studio to improve the agility of your data science and data engineering teams without compromising on the security, scalability, resiliency, and cost efficiency of your big data workloads.
Solution overview
A self-service data analytics platform with Amazon EMR and Amazon EMR Studio provides the following advantages:
It’s simple to launch and access for data engineers and data scientists.
The robust integrated development environment (IDE) is interactive, makes data easy to explore, and provides all the tooling necessary to debug, build, and schedule data pipelines.
It enables collaboration for analytics teams with the right level of workload isolation for added security.
It removes dependency from cloud operations teams by allowing administrators within each analytics organization to self-provision, scale, and de-provision resources from within the same UI, without exposing the complexities of the EMR cluster infrastructure and without compromising on security, governance, and costs.
It simplifies moving from prototyping into a production environment.
Cloud operations teams can independently manage EMR cluster configurations as products and continuously optimize for cost and improve the security, reliability, and performance of their EMR clusters.
Amazon EMR Studio is a web-based IDE that provides fully managed Jupyter notebooks where teams can develop, visualize, and debug applications written in R, Python, Scala, and PySpark, and tools such as Spark UI to provide an interactive development experience and simplify debugging of jobs. Data scientists and data engineers can directly access Amazon EMR Studio through a single sign-on enabled URL and collaborate with peers using these notebooks within the concept of an Amazon EMR Studio Workspace, version code with repositories such as GitHub and Bitbucket, or run parameterized notebooks as part of scheduled workflows using orchestration services. Amazon EMR Studio notebook applications run on EMR clusters, so you get the benefit of a highly scalable data processing engine using the performance optimized Amazon EMR runtime for Apache Spark.
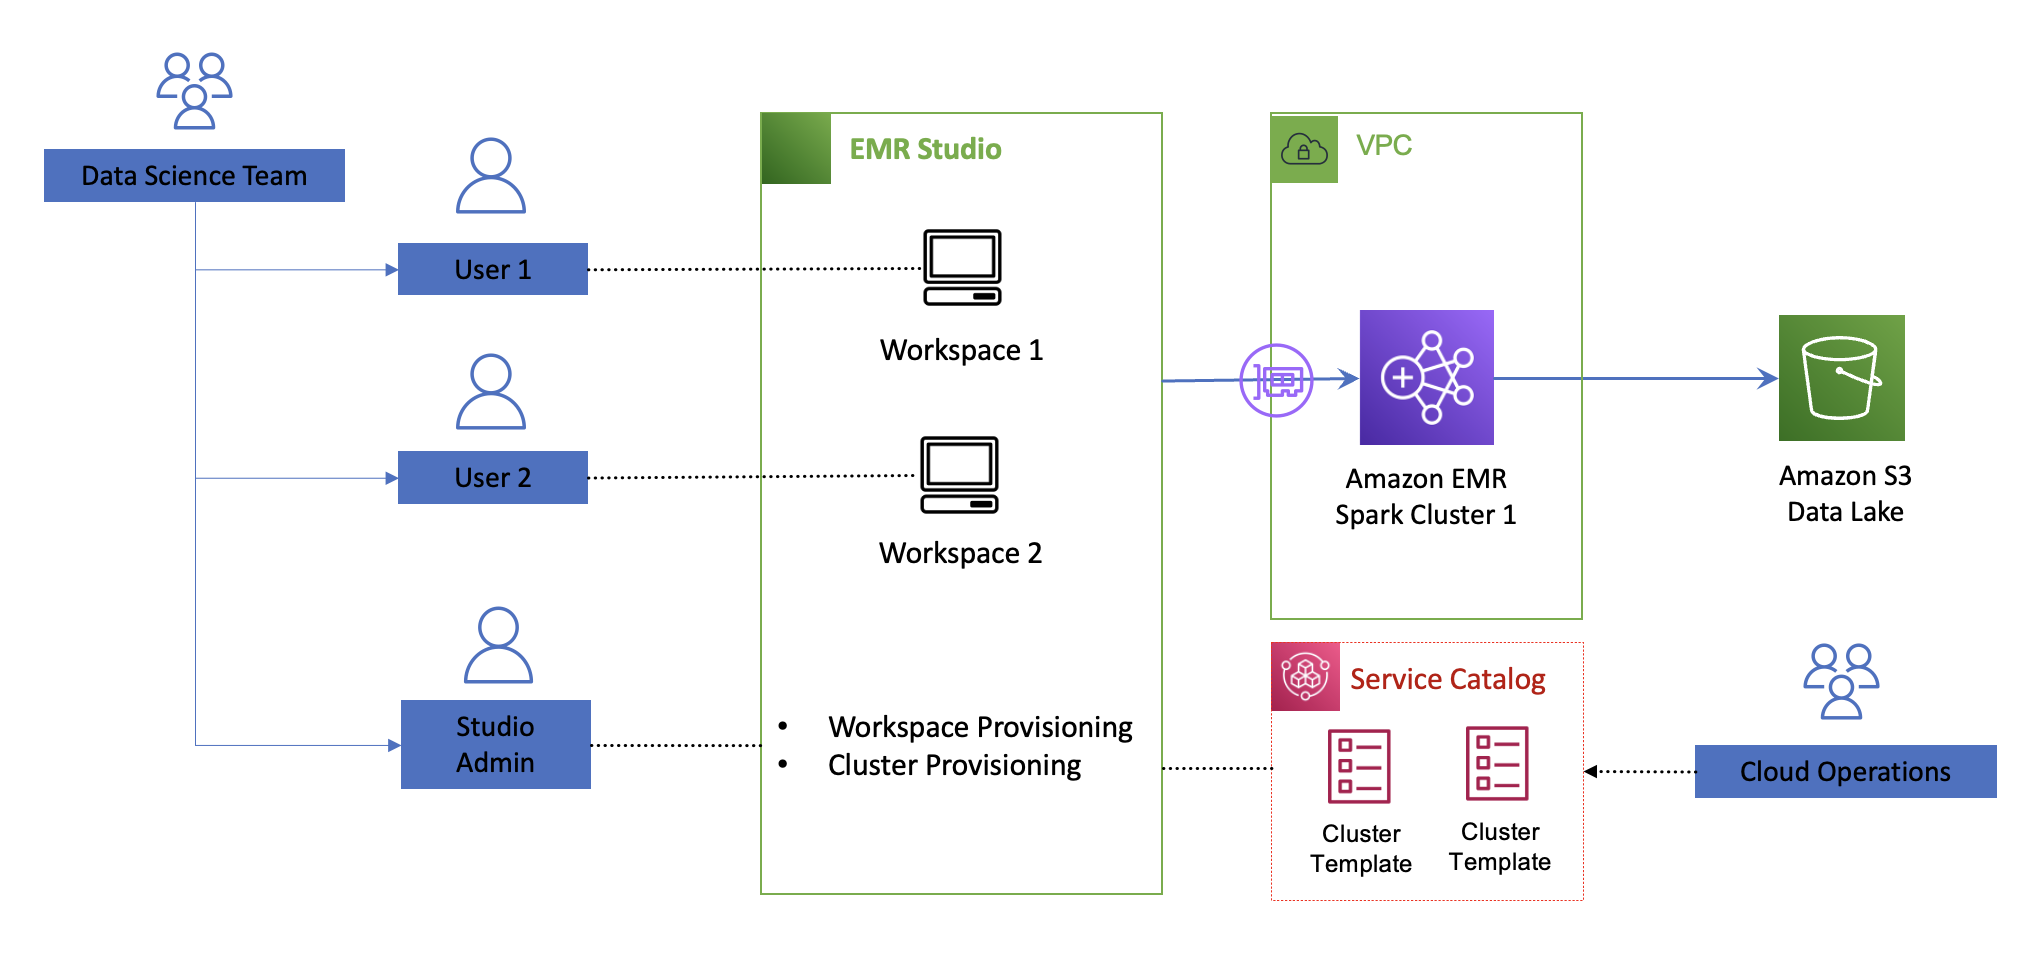
The following diagram illustrates the architecture of the self-service analytics platform with Amazon EMR and Amazon EMR Studio.
Cloud operations teams can assign one Amazon EMR Studio environment to each team for isolation and provision Amazon EMR Studio developer and administrator users within each team. Cloud operations teams have full control on the permissions each Amazon EMR Studio user has via Amazon EMR Studio permissions policies and control the EMR cluster configurations that Amazon EMR Studio administrators can deploy via cluster templates. Amazon EMR Studio administrators within each team can assign workspaces to each developer and attached to existing EMR clusters or, if allowed, self-provision EMR clusters from predefined templates. Each workspace is a serverless Jupyter instance with notebook files backed up continuously into an Amazon Simple Storage Service (Amazon S3) bucket. Users can attach or detach to provisioned EMR clusters and you only pay for the EMR cluster compute capacity used.
Cloud operations teams organize EMR cluster configurations as products within the AWS Service Catalog. In AWS Service Catalog, EMR cluster templates are organized as products in a portfolio that you share with Amazon EMR Studio users. Templates hide the complexities of the infrastructure configuration and can have custom parameters to allow for further optimization based on the workload requirement. After you publish a cluster template, Amazon EMR Studio administrators can launch new clusters and attach to new or existing workspaces within an Amazon EMR Studio without dependency to cloud operations teams. This makes it easier for teams to test upgrades, share predefined templates across teams, and allow analytics users to focus on achieving business outcomes.
The following diagram illustrates the decoupling architecture.
You can decouple the definition of the EMR clusters configurations as products and enable independent teams to deploy serverless workspaces and attach self-provisioned EMR clusters within Amazon EMR Studio in minutes. This enables organizations to create an agile and self-service environment for data processing and data science at scale while maintaining the proper level of security and governance.
As a cloud operations engineer, the main task is making sure your templates follow proper cluster configurations that are secure, run at optimal cost, and are easy to use. The following sections discuss key recommendations for security, cost optimization, and ease of use when defining EMR cluster templates for use within Amazon EMR Studio. For additional Amazon EMR best practices, refer to the EMR Best Practices Guide.
Security
Security is mission critical for any data science and data prep workload. Ensure you follow these recommendations:
Team-based isolation – Maintain workload isolation by provisioning an Amazon EMR Studio environment per team and a workspace per user.
Authorization – Set fine-grained permissions within your Amazon EMR Studio environment. Set limited (1–2) users with the Amazon EMR Studio admin role to allow workspace and cluster provisioning. Most data engineers and data scientists will have a developer role. For more information on how to define permissions, refer to Configure EMR Studio user permissions.
Encryption – When defining your cluster configuration templates, ensure encryption is enforced both in transit and at rest. For example, traffic between data lakes should use the latest version of TLS, data is encrypted with AWS Key Management Service (AWS KMS) at rest for Amazon S3, Amazon Elastic Block Store (Amazon EBS), and Amazon Relational Database Service (Amazon RDS).
Cost
To optimize cost of your running EMR cluster, consider the following cost-optimization options in your cluster templates:
Use EC2 Spot Instances – Spot Instances let you take advantage of unused Amazon Elastic Compute Cloud (Amazon EC2) capacity in the AWS Cloud and offer up to a 90% discount compared to On-Demand prices. Spot is best suited for workloads that can be interrupted or have flexible SLAs, like testing and development workloads.
Use instance fleets – Use instance fleets when using EC2 Spot to increase the likelihood of Spot availability. An instance fleet is a group of EC2 instances that host a particular node type (primary, core, or task) in an EMR cluster. Because instance fleets can consist of a mix of instance types, both On-Demand and Spot, this will increase the likelihood of Spot Instance availability when reaching your target capacity. Consider at least 10 instance types across all Availability Zones.
Use Spark cluster mode andensure that application masters run on On-Demand nodes – The application master (AM) is the main container launching and monitoring the application executors. Therefore, it’s important to ensure the AM is as resilient as possible. In an Amazon EMR Studio environment, you can expect users running multiple applications concurrently. In cluster mode, your Spark applications can run as independent sets of processes spread across your worker nodes within the AMs. By default, an AM can run on any of the worker nodes. Modify the behavior to ensure AMs run only in On-Demand nodes. For details on this setup, see Spot Usage.
Use Amazon EMR managed scaling – This avoids overprovisioning clusters and automatically scales your clusters up or down based on resource utilization. With Amazon EMR managed scaling, AWS manages the automatic scaling activity by continuously evaluating cluster metrics and making optimized scaling decisions.
Implement an auto-termination policy – This avoids idle clusters or the need to manually monitor and stop unused EMR clusters. When you set an auto-termination policy, you specify the amount of idle time after which the cluster should automatically shut down.
Provide visibility and monitor usage costs – You can provide visibility of EMR clusters to Amazon EMR Studio administrators and cloud operations teams by configuring user-defined cost allocation tags. These tags help create detailed cost and usage reports in AWS Cost Explorer for EMR clusters across multiple dimensions.
Ease of use
With Amazon EMR Studio, administrators within data science and data engineering teams can self-provision EMR clusters from templates pre-built with AWS CloudFormation. Templates can be parameterized to optimize cluster configuration according to each team’s workload requirements. For ease of use and to avoid dependencies to cloud operations teams, the parameters should avoid requesting unnecessary details or expose infrastructure complexities. Here are some tips to abstract the input values:
Maintain the number of questions to a minimum (less than 5).
Hide network and security configurations. Be opinionated when defining your cluster according to your security and network requirements following Amazon EMR best practices.
Avoid input values that require knowledge of AWS Cloud-specific terminology, such as EC2 instance types, Spot vs. On-Demand Instances, and so on.
Abstract input parameters considering information available to data engineering and data science teams. Focus on parameters that will help further optimize the size and costs of your EMR clusters.
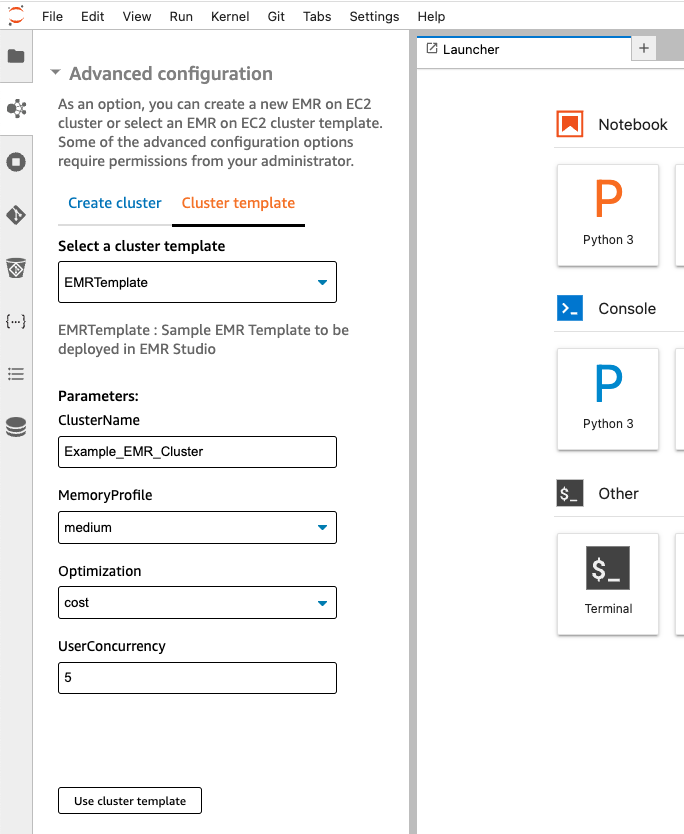
The following screenshot is an example of input values you can request from a data science team and how to resolve them via CloudFormation template features.
The input parameters are as follows:
User concurrency – Knowing how many users are expected to run jobs simultaneously will help determine the number of executors to provision
Optimized for cost or reliability – Use Spot Instances to optimize for cost; for SLA sensitive workloads, use only On-Demand nodes
Workload memory requirements (small, medium, large) – Determine the ratio of memory per Spark executor in your EMR cluster
The following sections describe how to resolve the EMR cluster configurations from these input parameters and what features to use in your CloudFormation templates.
User concurrency: How many concurrent users do you need?
Knowing the expected user concurrency will help determine the target node capacity of your cluster or the min/max capacity when using the Amazon EMR auto scaling feature. Consider how much capacity (CPU cores and memory) each data scientist needs to run their average workload.
For example, let’s say you want to provision 10 executors to each data scientist in the team. If the expected concurrency is set to 7, then you need to provision 70 executors. An r5.2xlarge instance type has 8 cores and 64 Gib of RAM. With the default configuration, the core count (spark.executor.cores) is set to 1 and memory (spark.executor.memory) is set to 6 Gib. One core will be reserved for running the Spark application, therefore leaving seven executors per node. You will need a total of 10 r5.2xlarge nodes to meet the demand. The target capacity can dynamically resolve to 10 from the user concurrency input, and the capacity weights in your fleet make sure the same capacity is met if different instance sizes are provisioned to meet the expected capacity.
Using an CloudFormation transform allows you to resolve the target capacity based on a numeric input value. A transform passes your template script to a custom AWS Lambda function so you can replace any placeholder in your CloudFormation template with values resolved from your input parameters.
The following CloudFormation script calls the emr-size-macro transform that replaces the custom::Target placeholder in the TargetSpotCapacity object based on the UserConcurrency input value:
Optimized for cost or reliability: How do you optimize your EMR cluster?
This parameter determines if the cluster should use Spot Instances for task nodes to optimize cost or provision only On-Demand nodes for SLA sensitive workloads that need to be optimized for reliability.
You can use the CloudFormation Conditions feature in your template to resolve your desired instance fleet configurations. The following code shows how the Conditions feature looks in a sample EMR template:
Workload memory requirements: How big a cluster do you need?
This parameter helps determine the amount of memory and CPUs to allocate to each Spark executor. The specific memory to CPU ratio allocated to each executor should be set appropriately to avoid out of memory errors. You can map the input parameter (small, medium, large) to specific instance types to select the CPU/memory ratio. Amazon EMR has default configurations (spark.executor.cores, spark.executor.memory) based on each instance type. For example, a small size cluster request could resolve to general purpose instances like m5 (default: 2 cores and 4 gb per executor), whereas a medium workflow can resolve to an R type (default: 1 core and 6 gb per executor). You can further tune the default Amazon EMR memory and CPU core allocation to each instance type by following the best practices outlined in the Spark section of the EMR Best Practices Guides.
Use the CloudFormation Mappings section to resolve the cluster configuration in your template:
In this post, we showed how to create a self-service analytics platform with Amazon EMR and Amazon EMR Studio to take full advantage of the agility the AWS Cloud provides by considerably reducing deployment times without compromising governance. We also walked you through best practices in security, cost, and ease of use when defining your Amazon EMR Studio environment so data engineering and data science teams can speed up their development cycles by removing dependencies from Cloud Operations teams when provisioning their data processing platforms.
Pablo Redondo is a Principal Solutions Architect at Amazon Web Services. He is a data enthusiast with over 16 years of fintech and healthcare industry experience and is a member of the AWS Analytics Technical Field Community (TFC). Pablo has been leading the AWS Gain Insights Program to help AWS customers achieve better insights and tangible business value from their data analytics initiatives.
Malini Chatterjee is a Senior Solutions Architect at AWS. She provides guidance to AWS customers on their workloads across a variety of AWS technologies with a breadth of expertise in data and analytics. She is very passionate about semi-classical dancing and performs in community events. She loves traveling and spending time with her family.
Avijit Goswami is a Principal Solutions Architect at AWS, specialized in data and analytics. He supports AWS strategic customers in building high-performing, secure, and scalable data lake solutions on AWS using AWS-managed services and open-source solutions. Outside of his work, Avijit likes to travel, hike San Francisco Bay Area trails, watch sports, and listen to music.
Delivering personalized customer experiences enables organizations to improve business outcomes such as acquiring and retaining customers, increasing engagement, driving efficiencies, and improving discoverability. Developing an in-house personalization solution can take a lot of time, which increases the time it takes for your business to launch new features and user experiences.
In this post, we show you how to architect near real-time personalized recommendations using Amazon Personalize and AWS purpose-built data services. We also discuss key considerations and best practices while building near real-time personalized recommendations.
Building personalized recommendations with Amazon Personalize
Amazon Personalize makes it easy for developers to build applications capable of delivering a wide array of personalization experiences, including specific product recommendations, personalized product re-ranking, and customized direct marketing.
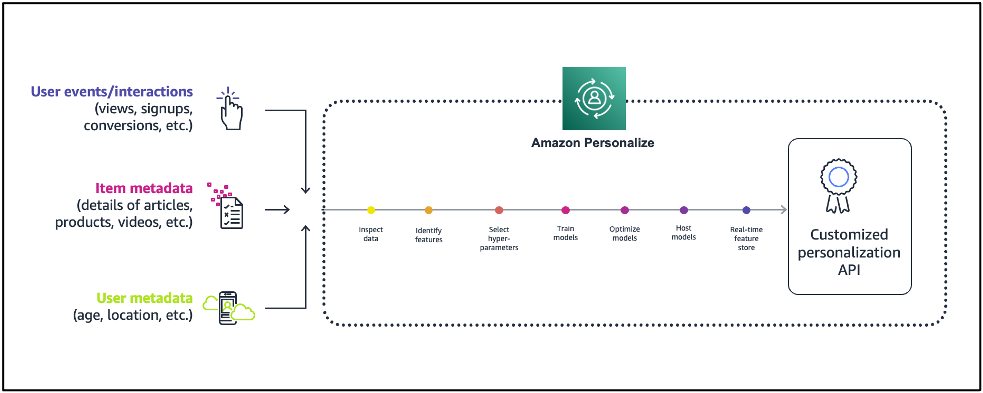
Amazon Personalize provisions the necessary infrastructure and manages the entire machine learning (ML) pipeline, including processing the data, identifying features, using the most appropriate algorithms, and training, optimizing, and hosting the models. You receive results through an Application Programming Interface (API) and pay only for what you use, with no minimum fees or upfront commitments.
Figure 1 illustrates the comparison of Amazon Personalize with the ML lifecycle.
Figure 1. Machine learning lifecycle vs. Amazon Personalize
First, provide the user and items data to Amazon Personalize. In general, there are three steps for building near real-time recommendations with Amazon Personalize:
Data preparation: Preparing data is one of the prerequisites for building accurate ML models and analytics, and it is the most time-consuming part of an ML project. There are three types of data you use for modeling on Amazon Personalize:
An Interactions data set captures the activity of your users, also known as events. Examples include items your users click on, purchase, or watch. The events you choose to send are dependent on your business domain. This data set has the strongest signal for personalization, and is the only mandatory data set.
An Items data set includes details about your items, such as price point, category information, and other essential information from your catalog. This data set is optional, but very useful for scenarios such as recommending new items.
A Users data set includes details about the users, such as their location, age, and other details.
Train the model with Amazon Personalize: Amazon Personalize provides recipes, based on common use cases for training models. A recipe is an Amazon Personalize algorithm prepared for a given use case. Refer to Amazon Personalize recipes for more details. The four types of recipes are:
USER_PERSONALIZATION: Recommends items for a user from a catalog. This is often included on a landing page.
RELATED_ITEM: Suggests items similar to a selected item on a detail page.
PERSONALZIED_RANKING: Re-ranks a list of items for a user within a category or in within search results.
USER_SEGMENTATION: Generates segments of users based on item input data. You can use this to create a targeted marketing campaign for particular products by brand.
Get near real-time recommendations: Once your model is trained, a private personalization model is hosted for you. You can then provide recommendations for your users through a private API.
Figure 2 illustrates a high-level overview of Amazon Personalize:
Figure 2. Building recommendations with Amazon Personalize
Near real-time personalized recommendations reference architecture
Figure 3 illustrates how to architect near real-time personalized recommendations using Amazon Personalize and AWS purpose-built data services.
Figure 3. Near real-time recommendations reference architecture
Architecture flow:
Data preparation: Start by creating a dataset group, schemas, and datasets representing your items, interactions, and user data.
Train the model: After importing your data, select the recipe matching your use case, and then create a solution to train a model by creating a solution version. Once your solution version is ready, you can create a campaign for your solution version. You can create a campaign for every solution version that you want to use for near real-time recommendations. In this example architecture, we’re just showing a single solution version and campaign. If you were building out multiple personalization use cases with different recipes, you could create multiple solution versions and campaigns from the same datasets.
Get near real-time recommendations: Once you have a campaign, you can integrate calls to the campaign in your application. This is where calls to the GetRecommendations or GetPersonalizedRanking APIs are made to request near real-time recommendations from Amazon Personalize.
The approach you take to integrate recommendations into your application varies based on your architecture but it typically involves encapsulating recommendations in a microservice or AWS Lambda function that is called by your website or mobile application through a RESTful or GraphQL API interface.
Near real-time recommendations support the ability to adapt to each user’s evolving interests. This is done by creating an event tracker in Amazon Personalize.
An event tracker provides an endpoint that allows you to stream interactions that occur in your application back to Amazon Personalize in near real-time. You do this by using the PutEvents API.
Again, the architectural details on how you integrate PutEvents into your application varies, but it typically involves collecting events using a JavaScript library in your website or a native library in your mobile apps, and making API calls to stream them to your backend. AWS provides the AWS Amplify framework that can be integrated into your web and mobile apps to handle this for you.
In this example architecture, you can build an event collection pipeline using Amazon API Gateway, Amazon Kinesis Data Streams, and Lambda to receive and forward interactions to Amazon Personalize.
The Event Tracker performs two primary functions. First, it persists all streamed interactions so they will be incorporated into future retraining of your model. This also how Amazon Personalize cold starts new users. When a new user visits your site, Amazon Personalize will recommend popular items. After you stream in an event or two, Amazon Personalize immediately starts adjusting recommendations.
Key considerations and best practices
For all use cases, your interactions data must have a minimum 1000 interaction records from users interacting with items in your catalog. These interactions can be from bulk imports, streamed events, or both, and a minimum 25 unique user IDs with at least two interactions for each.
Metadata fields (user or item) can be used for training, filters, or both.
Amazon Personalize supports the encryption of your imported data. You can specify a role allowing Amazon Personalize to use an AWS Key Management Service (AWS KMS) key to decrypt your data, or use the Amazon Simple Storage Service (Amazon S3) AES-256 server-side default encryption.
You can re-train Amazon Personalize deployments based on how much interaction data you generate on a daily basis. A good rule is to re-train your models once every week or two as needed.
In this post, we showed you how to build near real-time personalized recommendations using Amazon Personalize and AWS purpose-built data services. With the information in this post, you can now build your own personalized recommendations for your applications.
Read more and get started on building personalized recommendations on AWS:
It’s now just two weeks to AWS re:Invent in Las Vegas, and the pace is picking up, both here on the News Blog, and throughout AWS as everyone get ready for the big event! I hope you get the chance to join us, and have shared links and other information at the bottom of this post. First, though, let’s dive straight in to this week’s review of news and announcements from AWS.
Last Week’s Launches As usual, let’s start with a summary of some launches from the last week that I want to remind you of:
New Switzerland Region – First and foremost, AWS has opened a new Region, this time in Switzerland. Check out Seb’s post here on the News Blog announcing the launch.
New AWS Resource Explorer – if you’ve ever spent time searching for specific resources in your AWS account, especially across Regions, be sure to take a look at the new AWS Resource Explorer, described in this post by Danilo. Once enabled, indexes of the resources in your account are built and maintained (you have control over which resources are indexed). Once the indexes are built, you can issue queries to more quickly arrive at the required resource without jumping between different Regions and service dashboards in the Management Console.
New models for Amazon SageMaker JumpStart – Two new state-of-the-art models have been released for Amazon SageMaker JumpStart. SageMaker JumpStart provides pretrained, open-source models covering a wide variety of problem types that help you get started with machine learning. The first new model, Bloom, can be used to complete sentences or generate long paragraphs of text in 46 different languages. The second model, Stable Diffusion, generates realistic images from given text. Find out more about the new models in this What’s New post.
Other AWS News Some other news items you may want to explore:
AWS Open Source News and Updates – This blog is published each week, and Installment 135 is now available, highlighting new open-source projects, tools, and demos from the AWS community.
Upcoming AWS Events AWS re:Invent 2022 – As I noted at the top of this post, we’re now just two weeks away from the event! Join us live in Las Vegas November 28–December 2 for keynotes, opportunities for training and certification, and over 1,500 technical sessions. If you are joining us, be sure to check out the re:Invent 2022 Attendee Guides, each curated by an AWS Hero, AWS industry team, or AWS partner.
If you can’t join us live in Las Vegas, be sure to join us online to watch the keynotes and leadership sessions. My cohosts and I on the AWS on Air show will also be livestreaming daily from the event, chatting with service teams and special guests about all the launches and other announcements. You can find us on Twitch.tv (we’ll be on the front page throughout the event), the AWS channel on LinkedIn Live, Twitter.com/awsonair, and YouTube Live.
And one final update for the event – if you’re a .NET developer, be sure to check out the XNT track in the session catalog to find details on the seven breakouts, three chalk talks, and the workshop we have available for you at the conference!
Check back next Monday for our last week in review before the start of re:Invent!
Streamlining your digital media workflow can make all the difference when it comes to your productivity—not to mention your budget. For folks in media, entertainment, post-production, corporate, education, government, or content creation, media workflows just got a little easier thanks to a partnership between Backblaze and Telestream.
Now joint customers can store transcoded media files on Backblaze B2 Cloud Storage as their origin store for delivery via Telestream’s Vantage CloudPort product. Read on to learn more about the partnership and what it means for you.
What Does Telestream Do?
Telestream, a Backblaze alliance partner, specializes in products that make it possible to get video content to any audience regardless of how it is created, distributed, or viewed. Throughout the entire digital media lifecycle, from capture to viewing, for consumers through high-end professionals, Telestream products range from desktop components and cross-platform applications to fully-automated, enterprise-class digital media transcoding, and workflow systems. Telestream enables users in a broad range of business environments to leverage the value of their video content.
How Does This Partnership Benefit Joint Customers?
Content is king, as they say, and being able to efficiently and effectively produce content and make it available to the audiences that are going to consume it is critical. This partnership benefits joint customers in a few key ways:
Customers can benefit from cost savings in the cloud: Backblaze is a fraction of the cost of diversified cloud providers.
By storing transcoded media files in the cloud, customers can leverage other services like QC in the cloud to ensure quality is up to their high standards.
Customers can leave on-premises storage in the past and move to the cloud to leverage the cloud’s infinite scalability and parallelism.
Making the move to the cloud also reduces the risk of having a single point of failure on premises.
“Telestream and Backblaze are driven by a shared mission to empower our customers and help them make their businesses more efficient. With this collaboration, we can meet our customers where their content is stored and apply Telestream’s best in class media processing tools.”
—Tim MacGregor, Senior Director, Head of Strategy and Product Development, Telestream Cloud
NLnet Labs has put up a
blog entry warning about the possible effects of the “Cyber Resilience
Act” proposal in the European Commission.
We feel the current proposal misses a major opportunity. At a high
level the ‘essential cybersecurity requirements’ are not
unreasonable, but the compliance overhead can range from tough to
impossible for small, or cash-strapped developers. The CRA could
bring support to open-source developers maintaining the critical
foundations of our digital society. But instead of introducing
incentives for integrators or financial support via the CRA, the
current proposal will overload small developers with compliance
work.
As a general rule, one need not have worked in the technology industry for
long before the value of good data backups becomes clear. Creating a
backup that is truly good, though, can be a challenge if the filesystem in
question is actively being changed while the backup process runs. Over the
years, various ways of addressing this problem have been developed, ranging
from simply shutting down the system while backups run to a variety of
snapshotting mechanisms. The kernel may be about to get another approach
to snapshots should the blksnap
patch set from Sergei Shtepa find its way into the mainline.
GraphQL is an open-source data query and manipulation language that can be used to build application program interfaces (APIs). Since its initial inception by Facebook in 2012 and subsequent release in 2015, GraphQL has grown steadily in popularity. Some estimate that by 2025, more than 50% of enterprises will use GraphQL in production, up from less than 10% in 2021.
Unlike Rest APIs, which return information called from an endpoint and require the user to extract applicable information, GraphQL allows the user to query specific data from a GraphQL schema and return precise results.
Although GraphQL is relatively new and allows you to query exactly what you require, it is still prone to the same common vulnerabilities as other APIs. There are weaknesses that attackers can exploit to gain access to sensitive data, making securing GraphQL extremely important. The ability to scan a GraphQL schema will help to remediate those weaknesses and provide additional API security coverage.
Why GraphQL security is important
While there are numerous benefits to adopting GraphQL, the security implications are less well-understood. Can functionality be abused? What problems come with querying flexibility? Which vulnerabilities can be exploited? These are all points of concern for its use base.
GraphQL is also no different from other APIs in terms of potential attack vectors. Indeed, it has its own unique security vulnerabilities on top of those you would encounter through a REST API.
As we discussed in our recent post on API security best practices, APIs are a lucrative target that can allow hackers to gain access to an otherwise secure system and exploit vulnerabilities. Not only do APIs often suffer from the same vulnerabilities as web applications — like broken access controls, injections, security misconfigurations, and vulnerabilities inherited from other dependent code libraries — but they are also more susceptible to resource consumption and rate limiting issues due to the automated nature of their users.
Best practices for securing GraphQL
The first step in securing your GraphQL endpoint is to familiarize yourself with some of the most common vulnerabilities and best practices to protect against potential exposure. The most common are injection vulnerabilities – such as SQL injection, OS command injection, and server-side request forgery – where the data provided in the arguments of a GraphQL request is injected into commands, queries, and other executable entities by the application code. Other common vulnerabilities include a lack of resource management that can enable a Denial of Service (DoS) attack, due to general graph/query complexity and the potential for large batch requests. Finally, broken access control vulnerabilities exist in GraphQL APIs in much the same way as in other applications and services, but they can be exacerbated by the segmented nature of GraphQL query resolvers.
There are several best practice recommendations which can be utilized to counter such attacks.
Only allow valid values to be passed – Values should be controlled via allow lists, custom validators and correct definitions.
Depth limiting – Restricting the depth of a query only to predetermined levels will allow control over the expense of a query and avoid tying up your back end unnecessarily.
Amount limiting – Restricting the amount of a particular object in a query will reduce the expense of the query by not allowing more than x objects to be called.
Query cost analysis – Checking how expensive a query may be before you allow it to run is a useful additional step to block expensive or malicious queries.
Control input rejections – Ensure you don’t overly expose information about the API during input rejections.
Introspection turned off – By default, introspection will be enabled on GraphQL, but simply disabling introspection will restrict what information the consumer can access and not allow them to learn everything about your API.
OWASP have also produced a really neat cheat sheet series, which provides an introduction to GraphQL, as well as a detailed rundown of best practices and common GraphQL attacks, to help teams with upskilling and securing GraphQL.
How to secure GraphQL
The second step in securing your GraphQL endpoint is right here with Rapid7! While almost every modern DAST solution can properly parse and understand requests to and responses from web applications and, in most cases, APIs, that doesn’t mean all those tools will specifically understand GraphQL. That’s why InsightAppSec has specifically added support for parsing GraphQL requests, responses, and schemas, so that it can properly scan GraphQL-based APIs. This new feature provides customers with the ability to scan GraphQL endpoints to identify and then remediate any vulnerabilities encountered.
Initial support will be provided to identify the following vulnerabilities:
SQL injection
Blind SQL injection
OS commanding
Server-side request forgery
Local file inclusion/remote file inclusion
To find out how to execute a GraphQL scan, check out our doc on the feature in InsightAppSec for additional information, support, and guidance.
The collective thoughts of the interwebz
Manage Consent
To provide the best experiences, we use technologies like cookies to store and/or access device information. Consenting to these technologies will allow us to process data such as browsing behavior or unique IDs on this site. Not consenting or withdrawing consent, may adversely affect certain features and functions.
Functional
Always active
The technical storage or access is strictly necessary for the legitimate purpose of enabling the use of a specific service explicitly requested by the subscriber or user, or for the sole purpose of carrying out the transmission of a communication over an electronic communications network.
Preferences
The technical storage or access is necessary for the legitimate purpose of storing preferences that are not requested by the subscriber or user.
Statistics
The technical storage or access that is used exclusively for statistical purposes.The technical storage or access that is used exclusively for anonymous statistical purposes. Without a subpoena, voluntary compliance on the part of your Internet Service Provider, or additional records from a third party, information stored or retrieved for this purpose alone cannot usually be used to identify you.
Marketing
The technical storage or access is required to create user profiles to send advertising, or to track the user on a website or across several websites for similar marketing purposes.