Genomics workflows, Part 5: automated benchmarking

Post Syndicated from Rostislav Markov original https://aws.amazon.com/blogs/architecture/genomics-workflows-part-5-automated-benchmarking/

Launching and running genomics workflows can take hours and involves large pools of compute instances that process data at a petabyte scale. Benchmarking helps you evaluate workflow performance and discover faster and cheaper ways of running them.

In practice, performance evaluations happen irregularly because of the associated heavy lifting. In this blog post, we discuss how life-science research teams can automate evaluations.

Business Benefits

An automated benchmarking solution provides:

  • more accurate enterprise resource planning by performing historical analytics,
  • lower cost to the business by comparing performance on different resource types, and
  • cost transparency to the business by quantifying periodical chargeback.

We’ve used automated benchmarking to compare processing times on different services such as Amazon Elastic Compute Cloud (Amazon EC2), AWS Batch, AWS ParallelCluster, Amazon Elastic Kubernetes Service (Amazon EKS), and on-premises HPC clusters. Scientists, financiers, technical leaders, and other stakeholders can build reports and dashboards to compare consumption data by consumer, workflow type, and time period.

Design pattern

Our automated benchmarking solution measures performance on two dimensions:

  • Timing: measures the duration of a workflow launch on a specific dataset
  • Pricing: measures the associated cost

This solution can be extended to other performance metrics such as iterations per second or process/thread distribution across compute nodes.

Our requirements include the following:

  • Consistent measurement of timing based on workflow status (such as preparing, waiting, ready, running, failed, complete)
  • Extensible pricing models based on unit prices (the Amazon EC2 Spot price at a specific period of time compared to Amazon EC2 On-Demand pricing)
  • Scalable, cost-efficient, and flexible data store enabling historical benchmarking and estimations
  • Minimal infrastructure management overhead

We choose a serverless design pattern using AWS Step Functions orchestration, AWS Lambda for our application code, and Amazon DynamoDB to track workflow launch IDs and states (as described in Part 3). We assume that the genomics workflows run on AWS Batch with genomics data on Amazon FSx for Lustre (Part 1). AWS Step Functions allows us to break down processing into smaller steps and avoid monolithic application code. Our evaluation process runs in four steps:

  1. Monitor for completed workflow launches in the DynamoDB stream using an Amazon EventBridge pipe with a Step Functions workflow as target. This event-driven approach is more efficient than periodic polling and avoids custom code for parsing status and cost values in all records of the DynamoDB stream.
  2. Collect a list of all compute resources associated with the workflow launch. Design a Lambda function that queries the AWS Batch API (see Part 1) to describe compute environment parameters like the Amazon EC2 instance IDs and their details, such as processing times, instance family/size, and allocation strategy (for example, Spot Instances, Reserved Instances, On-Demand Instances).
  3. Calculate the cost of all consumed resources. We achieve this with another Lambda function, which calculates the total price based on unit prices from the AWS Price List Query API.
  4. Our state machine updates the total price in the DynamoDB table without the need for additional application code.

Figure 1 visualizes these steps.

Automated benchmarking of genomics workflows

Figure 1. Automated benchmarking of genomics workflows

Implementation considerations

AWS Step Functions orchestrates our benchmarking workflow reliably and makes our application code easy to maintain. Figure 2 summarizes the state machine transitions that we’ll describe.

AWS Step Functions state machine for automated benchmarking

Figure 2. AWS Step Functions state machine for automated benchmarking

Gather consumption details

Configure the DynamoDB stream view type to New image so that the entire item is passed through as it appears after it was changed. We set up an Amazon EventBridge pipe with event filtering and the DynamoDB stream as a source. Our event filter uses multiple matching on records with a status of COMPLETE, but no cost entry in order to avoid an infinite loop. Once our state machine has updated the DynamoDB item with the workflow price, the resulting record in the DynamoDB stream will not pass our event filter.

The syntax of our event filter is as follows:

{
  "dynamodb": {
    "NewImage": {
      "status": {
        "S": ["COMPLETE"]
      },
      "totalCost": {
        "S": [{
          "exists": false
        }]
      }
    }
  }
}

We use an input transformer to simplify follow-on parsing by removing unnecessary metadata from the event.

The consumed resources included in the stream record are the auto-scaling group ID for AWS Batch and the Amazon FSx for Lustre volume ID. We use the DescribeJobs API (describe_jobs in Boto3) to determine which compute resources were used. If the response is a list of EC2 instances, we then look up consumption information including start and end times using the ListJobs API (list_jobs in Boto3) for each compute node. We use describe_volumes with filters on the identified EC2 instances to obtain the size and type of Amazon Elastic Block Store (Amazon EBS) volumes.

Calculate prices

Another Lambda function obtains the associated unit prices of all consumed resources using the GetProducts request of AWS Price List Query API (get_products in Boto3) and then parsing the pricePerUnit value. For Spot Instances, we use describe_spot_price_history of the EC2 client in Boto3 and specify the time range and instance types for which we want to receive prices.

Calculate the price of workflow launches based on the following factors:

  • Number and size of EC2 instances in auto-scaling node groups
  • Size of EBS volumes and Amazon FSx for Lustre
  • Processing duration

Our Python-based Lambda function calculates the total, rounds it, and delivers the price breakdown in the following format:

total_cost: str, instance_cost: str, volume_cost: str, filesystem_cost: str

Lastly, we put the price breakdown to the DynamoDB table using UpdateItem directly from the Amazon States Language.

Note that AWS credits and enterprise discounts might not be reflected in the responses of the AWS Price List Query API unless applied to the particular AWS account. This is often considered best practice in light of least-privilege considerations.

In the past, we’ve also used AWS Cost Explorer instead of the AWS Price List API. AWS Cost Explorer data is updated at least once every 24 hours. You can denote the pending price status in the DynamoDB table item and use the Wait state to delay the calculation process.

The presented solution can be extended to other compute services such as Amazon Elastic Kubernetes Service (Amazon EKS). For Amazon EKS, events are enriched with the cluster ID from the DynamoDB table and the price calculation should also include control plane costs.

Conclusion

Life-science research teams use benchmarking to compare workflow performance and inform their architectural decisions. Such evaluations are effort-intensive and therefore done irregularly.

In this blog post, we showed how life-science research teams can automate benchmarking for their scientific workflows. The insights teams gain from automated benchmarking indicate continuous optimization opportunities, such as by adjusting compute node configuration. The evaluation data is also available on demand for other purposes including chargeback.

Stay tuned for our next post in which we show how to use historical benchmarking data for price estimations of future workflow launches.

Related information

Automate the deployment of an NGINX web service using Amazon ECS with TLS offload in CloudHSM

Post Syndicated from Nikolas Nikravesh original https://aws.amazon.com/blogs/security/automate-the-deployment-of-an-nginx-web-service-using-amazon-ecs-with-tls-offload-in-cloudhsm/

Customers who require private keys for their TLS certificates to be stored in FIPS 140-2 Level 3 certified hardware security modules (HSMs) can use AWS CloudHSM to store their keys for websites hosted in the cloud. In this blog post, we will show you how to automate the deployment of a web application using NGINX in AWS Fargate, with full integration with CloudHSM. You will also use AWS CodeDeploy to manage the deployment of changes to your Amazon Elastic Container Service (Amazon ECS) service.

CloudHSM offers FIPS 140-2 Level 3 HSMs that you can integrate with NGINX or Apache HTTP Server through the OpenSSL Dynamic Engine. The CloudHSM Client SDK 5 includes the OpenSSL Dynamic Engine to allow your web server to use a private key stored in the HSM with TLS versions 1.2 and 1.3 to support applications that are required to use FIPS 140-2 Level 3 validated HSMs.

CloudHSM uses the private key in the HSM as part of the server verification step of the TLS handshake that occurs every time that a new HTTPS connection is established between the client and server. Using the exchanged symmetric key, OpenSSL software performs the key exchange and bulk encryption. For more information about this process and how CloudHSM fits in, see How SSL/TLS offload with AWS CloudHSM works.

Solution overview

This blog post uses the AWS Cloud Development Kit (AWS CDK) to deploy the solution infrastructure. The AWS CDK allows you to define your cloud application resources using familiar programming languages.

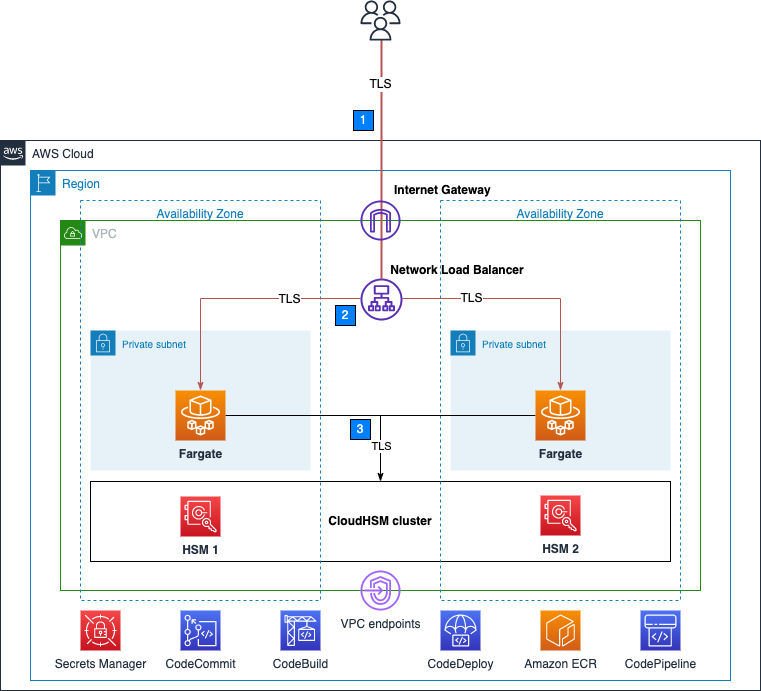
Figure 1 shows an overview of the overall architecture deployed in this blog. This solution contains three CDK stacks: The TlsOffloadContainerBuildStack CDK stack deploys the CodeCommit, CodeBuild, and AmazonECR resources. The TlsOffloadEcsServiceStack CDK stack deploys the ECS Fargate service along with the required VPC resources. The TlsOffloadPipelineStack CDK stack deploys the CodePipeline resources to automate deployments of changes to the service configuration.

Figure 1: Overall architecture

Figure 1: Overall architecture

At a high level, here’s how the solution in Figure 1 works:

  1. Clients make an HTTPS request to the public IP address exposed by Network Load Balancer to connect to the web server and establish a secure connection that uses TLS.
  2. Network Load Balancer routes the request to one of the ECS hosts running in private virtual private cloud (VPC) subnets, which are connected to the CloudHSM cluster.
  3. The NGINX web server that is running on ECS containers performs a TLS handshake by using the private key stored in the HSM to establish a secure connection with the requestor.

Note: Although we don’t focus on perimeter protection in this post, AWS has a number of services that help provide layered perimeter protection for your internet-facing applications, such as AWS Shield and AWS WAF.

Figure 2 shows an overview of the automation infrastructure that is deployed by the TlsOffloadContainerBuildStack and TlsOffloadPipelineStack CDK stacks.

Figure 2: Deployment pipeline

Figure 2: Deployment pipeline

At a high level, here’s how the solution in Figure 2 works:

  1. A developer makes changes to the service configuration and commits the changes to the AWS CodeCommit repository.
  2. AWS CodePipeline detects the changes and invokes AWS CodeBuild to build a new version of the Docker image that is used in Amazon ECS.
  3. CodeBuild builds a new Docker image and publishes it to the Amazon Elastic Container Registry (Amazon ECR) repository.
  4. AWS CodeDeploy creates a new revision of the ECS task definition for the Amazon ECS service and initiates a deployment of the new service.

Required services

To build this architecture in your account, you need to use a role within your account that can configure the following services and features:

Prerequisites

To follow this walkthrough, you need to have the following components in place:

Step 1: Store secrets in Secrets Manager

As with other container projects, you need to decide what to build statically into the container (for example, libraries, code, or packages) and what to set as runtime parameters, to be pulled from a parameter store. In this walkthrough, we use Secrets Manager to store sensitive parameters and use the integration of Amazon ECS with Secrets Manager to securely retrieve them when the container is launched.

Important: You need to store the following information in Secrets Manager as plaintext, not as key/value pairs.

To create a new secret

  1. Open the Secrets Manager console and choose Store a new secret.
  2. On the Choose secret type page, do the following:
    1. For Secret type, choose Other type of secret.
    2. In Key/value pairs, choose Plaintext and enter your secret just as you would need it in your application.

The following is a list of the required secrets for this solution and how they look in the Secrets Manager console.

  • Your cluster-issuing certificate – this is the certificate that corresponds to the private key that you used to sign the cluster’s certificate signing request. In this example, the name of the secret for the certificate is tls/clustercert.
    Figure 3: Store the cluster certificate

    Figure 3: Store the cluster certificate

  • The web server certificate – In this example, the name of the secret for the web server certificate is tls/servercert. It will look similar to the following:
    Figure 4: Store the web server certificate

    Figure 4: Store the web server certificate

  • The fake PEM file for the private key stored in the HSM that you generated in the Prerequisites section. In this example, the name of the secret for the fake PEM file is tls/fakepem.
    Figure 5: Store the fake PEM

    Figure 5: Store the fake PEM

  • The HSM pin used to authenticate with the HSMs in your cluster. In this example, the name of the secret for the HSM pin is tls/pin.
    Figure 6: Store the HSM pin

    Figure 6: Store the HSM pin

After you’ve stored your secrets, you should see output similar to the following:

Figure 7: List of required secrets

Figure 7: List of required secrets

Step 2: Download and configure the CDK app

This post uses the AWS CDK to deploy the solution infrastructure. In this section, you will download the CDK app and configure it.

To download and configure the CDK app

  1. In your CDK environment that you created in the Prerequisites section, check out the source code from the aws-cloudhsm-tls-offload-blog GitHub repository.
  2. Edit the app_config.json file and update the <placeholder values> with your target configuration:
    {
        "applicationAccount": "<AWS_ACCOUNT_ID>",
        "applicationRegion": "<REGION>",
        "networkConfig": {
            "vpcId": "<VPC_ID>",
            "publicSubnets": ["<PUBLIC_SUBNET_1>", "<PUBLIC_SUBNET_2>", ...],
            "privateSubnets": ["<PRIVATE_SUBNET_1>", "<PRIVATE_SUBNET_2>", ...]
        },
        "secrets": {
            "cloudHsmPin": "arn:aws:secretsmanager:<REGION>:<AWS_ACCOUNT_ID>:secret:<SECRET_ID>",
            "fakePem": "arn:aws:secretsmanager:<REGION>:<AWS_ACCOUNT_ID>:secret:<SECRET_ID>",
            "serverCert": "arn:aws:secretsmanager:<REGION>:<AWS_ACCOUNT_ID>:secret:<SECRET_ID>",
            "clusterCert": "arn:aws:secretsmanager:<REGION>:<AWS_ACCOUNT_ID>:secret:<SECRET_ID>"
        },
        "cloudhsm": {
            "clusterId": "<CLUSTER_ID>",
            "clusterSecurityGroup": "<CLUSTER_SECURITY_GROUP>"
        }
    }

  3. Run the following command to build the CDK stacks from the root of the project directory.
    npm run build

  4. To view the stacks that are available to deploy, run the following command from the root of the project directory.
    cdk ls

    You should see the following stacks available to deploy:

    • TlsOffloadContainerBuildStack — Deploys the CodeCommit, CodeBuild, and ECR repository that builds the ECS container image.
    • TlsOffloadEcsServiceStack — Deploys the ECS Fargate service along with the required VPC resources.
    • TlsOffloadPipelineStack — Deploys the CodePipeline that automates the deployment of updates to the service.

Step 3: Deploy the container build stack

In this step, you will deploy the container build stack, and then create a build and verify that the image was built successfully.

To deploy the container build stack

Deploy the TlsOffloadContainerBuildStack stack that we described in Figure 2 to your AWS account. In your CDK environment, run the following command:

cdk deploy TlsOffloadContainerBuildStack

The command line interface (CLI) will prompt you to approve the changes. After you approve them, you will see the following resources deployed to your newly created CodeCommit repository.

  • Dockerfile — This file provides a containerized environment for each of the Fargate containers to run. It downloads and installs necessary dependencies to run the NGINX web server with CloudHSM.
  • nginx.conf — This file provides NGINX with the configuration settings to run an HTTPS web server with CloudHSM configured as the SSL engine that performs the TLS handshake. The following nginx.conf values have already been configured in the file; if you want to make changes, update the file before deployment:
    • ssl_engine is set to cloudhsm
    • the environment variable is env CLOUDHSM_PIN
    • error_log is set to stderr so that the Fargate container can capture the logs in CloudWatch
    • the server section is set up to listen on port 443
    • ssl_ciphers are configured for a server with an RSA private key
  • run.sh — This script configures the CloudHSM OpenSSL Dynamic Engine on the Fargate task before the NGINX server is started.
  • nginx.service — This file specifies the configuration settings that systemd uses to run the NGINX service. Included in this file is a reference to the file that contains the environment variables for the NGINX service. This provides the HSM pin to the OpenSSL Engine.
  • index.html — This file is a sample HTML file that is displayed when you navigate to the HTTPS endpoint of the load balancer in your browser.
  • dhparam.pem — This file provides sample Diffie-Hellman parameters for demonstration purposes, but AWS recommends that you generate your own. You can generate your own Diffie-Hellman parameters by running the following command with the OpenSSL CLI. These parameters are not required for TLS but are recommended to provide perfect forward secrecy in your encrypted messages.
    openssl dhparam -out ./dhparam.pem 2048

Your repository should look like the following:

Figure 8: CodeCommit repository

Figure 8: CodeCommit repository

Before you deploy the Amazon ECS service, you need to build your first Docker image to populate the ECR repository. To successfully deploy the service, you need to have at least one image already present in the repository.

To create a build and verify the image was built successfully

  1. Open the AWS CodeBuild console.
  2. Find the CodeBuild project that was created by the CDK deployment and select it.
  3. Choose Start Build to initiate a new build.
  4. Wait for the build to complete successfully, and then open the Amazon ECR console.
  5. Select the repository that the CDK deployment created.

You should now see an image in your repository, similar to the following:

Figure 9: ECR repository

Figure 9: ECR repository

Step 4: Deploy the Amazon ECS service

Now that you have successfully built an ECR image, you can deploy the Amazon ECS service. This step deploys the following resources to your account:

  • VPC endpoints for the required AWS services that your ECS task needs to communicate with, including the following:
    • Amazon ECR
    • Secrets Manager
    • CloudWatch
    • CloudHSM
  • Network Load Balancer, which load balances HTTPS traffic to your ECS tasks.
  • A CloudWatch Logs log group to host the logs for the ECS tasks.
  • An ECS cluster with ECS tasks using your previously built Docker image that hosts the NGINX service.

To deploy the Amazon ECS service with the CDK

  • In your CDK environment, run the following command:
    cdk deploy TlsOffloadEcsServiceStack

The CLI will prompt you to approve the changes. After you approve them, you will see these resources deploy to your account.

Checkpoint

At this point, you should have a working service. To confirm that you do, in your browser, navigate using HTTPS to the public address associated with the Network Load Balancer. While not covered in this blog, you can additionally configure DNS routing using Amazon Route53 to setup a custom domain name for your web service. You should see a screen similar to the following.

Figure 10: The sample website

Figure 10: The sample website

Step 5: Use CodePipeline to automate the deployment of changes to the web server

Now that you have deployed a preliminary version of the application, you can take a few steps to automate further releases of the web server. As you maintain this application in production, you might need to update one or more of the following items:

  • Your website HTML source and other required libraries (for example, CSS or JavaScript)
  • Your Docker environment, such as the OpenSSL libraries, operating system and CloudHSM packages, and NGINX version.
  • Re-deploy the service after rotating your web server private key and certificate in Secrets Manager

Next, you will set up a CodePipeline project that orchestrates the end-to-end deployment of a change to the application—from an update to the code in our CodeCommit repo to the deployment of updated container images and the redirection of user traffic by the load balancer to the updated application.

This step deploys to your account a deployment pipeline that connects your CodeCommit, CodeBuild, and Amazon ECS services.

Deploy the CodePipeline stack with CDK

In your CDK environment, run the following command:

cdk deploy TlsOffloadPipelineStack

The CLI will prompt you to approve the changes. After you approve them, you will see the resources deploy to your account.

Start a deployment

To verify that your automation is working correctly, start a new deployment in your CodePipeline by making a change to your source repository. If everything works, the CodeBuild project will build the latest version of the Dockerfile located in your CodeCommit repository and push it to Amazon ECR. Then, the CodeDeploy application will create a new version of the ECS task definition and deploy new tasks while spinning down the existing tasks.

View your website

Now that the deployment is complete, you should again be able to view your website in your browser by navigating to the website for your application. If you made changes to the source code, such as changes to your index.html file, you should see these changes now.

Verify that the web server is properly configured by checking that the website’s certificate matches the one that you created in the Prerequisites section. Figure 11 shows an example of a certificate.

Figure 11: Certificate for the application

Figure 11: Certificate for the application

To verify that your NGINX service is using your CloudHSM cluster to offload the TLS handshake, you can view the CloudHSM client logs for this application in CloudWatch in the log group that you specified when you configured the ECS task definition.

To view your CloudHSM client logs in CloudWatch

  1. Open the CloudWatch console.
  2. In the navigation pane, select Log Groups.
  3. Select the log group that was created for you by the CDK deployment.
  4. Select a log stream entry. Each log stream corresponds to an ECS instance that is running the NGINX web server.
  5. You should see the client logs for this instance, which will look similar to the following:
    Figure 12: Fargate task logs

    Figure 12: Fargate task logs

You can also verify your HSM connectivity by viewing your HSM audit logs.

To view your HSM audit logs

  1. Open the CloudWatch console.
  2. In the navigation pane, select Log Groups.
  3. Select the log group corresponding to your CloudHSM cluster. The log group has the following format: /aws/cloudhsm/<cluster-id>.
  4. You can see entries similar to the following, which indicates that the NGINX application is connecting and logging in to the HSM to perform cryptographic operations.
    Time: 02/04/23 17:45:40.333033, usecs:1675532740333033
    Version No : 1.0
    Sequence No : 0x2
    Reboot counter : 0x8
    Opcode : CN_LOGIN (0xd)
    Command Type(hex) : CN_MGMT_CMD (0x0)
    User id : 3
    Session Handle : 0x15010002
    Response : 0x0:HSM Return: SUCCESS
    Log type : USER_AUTH_LOG (2)
    User Name : crypto_user
    User Type : CN_CRYPTO_USER (1) 

Conclusion

In this post, you learned how to set up a NGINX web server on Fargate in a secure, private subnet that offloads the TLS termination to a FIPS 140-2 Level 3 HSM environment that uses the CloudHSM OpenSSL Dynamic Engine. You also learned how to set up a deployment pipeline to automate the Fargate deployments when updates are made.

You can expand this solution to fit your individual use case. For example, you can use the NGINX web server as a reverse proxy for additional servers in your internal network, and set up mutual TLS between these internal servers.

Further reading

If you have feedback about this post, submit comments in the Comments section below. If you have questions about this post, start a new thread on the AWS CloudHSM re:Post or contact AWS Support.

Want more AWS Security news? Follow us on Twitter.

Alket Memushaj

Alket Memushaj

Alket Memushaj is a Principal Solutions Architect in the Market Development team for Capital Markets at AWS. In his role, Alket helps customers transform their business with the power of the AWS Cloud. His main focus is on helping customers deploy data and analytics, risk management, and electronic trading platforms in AWS. Alket previously led engineering teams at Morgan Stanley and consulted for global financial services at VMware.

Nikolas Nikravesh

Nikolas Nikravesh

Nikolas is a Software Development Engineer at AWS CloudHSM. He works with the SDK team to develop standards compliant SDKs and integrations to enable AWS customers to develop secure applications with CloudHSM.

Brad Woodward

Brad Woodward

Brad is a Senior Customer Delivery Architect with AWS Professional Services. Brad has presented at RSA and DefCon Skytalks, been an instructor at BlackHat and BlackHat Europe, presented tools at BlackHat Arsenal, and is the maintainer of several open source tools and platforms.

Building diversified and cost-optimized EC2 server groups in Spinnaker

Post Syndicated from Sheila Busser original https://aws.amazon.com/blogs/compute/building-diversified-and-cost-optimized-ec2-server-groups-in-spinnaker/

This blog post is written by Sandeep Palavalasa, Sr. Specialist Containers SA, and Prathibha Datta-Kumar, Software Development Engineer

Spinnaker is an open source continuous delivery platform created by Netflix for releasing software changes rapidly and reliably. It enables teams to automate deployments into pipelines that are run whenever a new version is released with proven deployment strategies that are faster and more dependable with zero downtime. For many AWS customers, Spinnaker is a critical piece of technology that allows developers to deploy their applications safely and reliably across different AWS managed services.

Listening to customer requests on the Spinnaker open source project and in the Amazon EC2 Spot Instances integrations roadmap, we have further enhanced Spinnaker’s ability to deploy on Amazon Elastic Compute Cloud (Amazon EC2). The enhancements make it easier to combine Spot Instances with On-Demand, Reserved, and Savings Plans Instances to optimize workload costs with performance. You can improve workload availability when using Spot Instances with features such as allocation strategies and proactive Spot capacity rebalancing, when you are flexible about Instance types and Availability Zones. Combinations of these features offer the best possible experience when using Amazon EC2 with Spinnaker.

In this post, we detail the recent enhancements, along with a walkthrough of how you can use them following the best practices.

Amazon EC2 Spot Instances

EC2 Spot Instances are spare compute capacity in the AWS Cloud available at steep discounts of up to 90% when compared to On-Demand Instance prices. The primary difference between an On-Demand Instance and a Spot Instance is that a Spot Instance can be interrupted by Amazon EC2 with a two-minute notification when Amazon EC2 needs the capacity back. Amazon EC2 now sends rebalance recommendation notifications when Spot Instances are at an elevated risk of interruption. This signal can arrive sooner than the two-minute interruption notice. This lets you proactively replace your Spot Instances before it’s interrupted.

The best way to adhere to Spot best practices and instance fleet management is by using an Amazon EC2 Auto Scaling group When using Spot Instances in Auto Scaling group, enabling Capacity Rebalancing helps you maintain workload availability by proactively augmenting your fleet with a new Spot Instance before a running instance is interrupted by Amazon EC2.

Spinnaker concepts

Spinnaker uses three key concepts to describe your services, including applications, clusters, and server groups, and how your services are exposed to users is expressed as Load balancers and firewalls.

An application is a collection of clusters, a cluster is a collection of server groups, and a server group identifies the deployable artifact and basic configuration settings such as the number of instances, autoscaling policies, metadata, etc. This corresponds to an Auto Scaling group in AWS. We use Auto Scaling groups and server groups interchangeably in this post.

Spinnaker and Amazon EC2 Integration

In mid-2020, we started looking into customer requests and gaps in the Amazon EC2 feature set supported in Spinnaker. Around the same time, Spinnaker OSS added support for Amazon EC2 Launch Templates. Thanks to their effort, we could follow-up and expand the Amazon EC2 feature set supported in Spinnaker. Now that we understand the new features, let’s look at how to use some of them in the following tutorial spinnaker.io.

Here are some highlights of the features contributed recently:

Feature Why use it? (Example use cases)
  Multiple Instance Types   Tap into multiple capacity pools to achieve and maintain the desired scale using Spot Instances.
  Combining On-Demand and Spot Instances

  – Control the proportion of On-Demand and Spot Instances launched in your sever group.

– Combine Spot Instances with Amazon EC2 Reserved Instances or Savings Plans.

  Amazon EC2 Auto Scaling allocation strategies   Reduce overall Spot interruptions by launching from Spot pools that are optimally chosen based on the available Spot capacity, using capacity-optimized Spot allocation strategy.
  Capacity rebalancing   Improve your workload availability by proactively shifting your Spot capacity to optimal pools by enabling capacity rebalancing along with capacity-optimized allocation strategy.
  Improved support for burstable performance instance types with custom credit specification   Reduce costs by preventing wastage of CPU cycles.

We recommend using Spinnaker stable release 1.28.x for API users and 1.29.x for UI users. Here is the Git issue for related PRs and feature releases.

Now that we understand the new features, let’s look at how to use some of them in the following tutorial.

Example tutorial: Deploy a demo web application on an Auto Scaling group with On-Demand and Spot Instances

In this example tutorial, we setup Spinnaker to deploy to Amazon EC2, create an Application Load Balancer, and deploy a demo application on a server group diversified across multiple instance types and purchase options – this case On-Demand and Spot Instances.

We leverage Spinnaker’s API throughout the tutorial to create new resources, along with a quick guide on how to deploy the same using Spinnaker UI (Deck) and leverage UI to view them.

Prerequisites

As a prerequisite to complete this tutorial, you must have an AWS Account with an AWS Identity and Access Management (IAM) User that has the AdministratorAccess configured to use with AWS Command Line Interface (AWS CLI).

1. Spinnaker setup

We will use the AWS CloudFormation template setup-spinnaker-with-deployment-vpc.yml to setup Spinnaker and the required resources.

1.1 Create an Secure Shell(SSH) keypair used to connect to Spinnaker and EC2 instances launched by Spinnaker.

AWS_REGION=us-west-2 # Change the region where you want Spinnaker deployed
EC2_KEYPAIR_NAME=spinnaker-blog-${AWS_REGION}
aws ec2 create-key-pair --key-name ${EC2_KEYPAIR_NAME} --region ${AWS_REGION} --query KeyMaterial --output text > ~/${EC2_KEYPAIR_NAME}.pem
chmod 600 ~/${EC2_KEYPAIR_NAME}.pem

1.2 Deploy the Cloudformation stack.

STACK_NAME=spinnaker-blog
SPINNAKER_VERSION=1.29.1 # Change the version if newer versions are available
NUMBER_OF_AZS=3
AVAILABILITY_ZONES=${AWS_REGION}a,${AWS_REGION}b,${AWS_REGION}c
ACCOUNT_ID=$(aws sts get-caller-identity --query "Account" --output text)
S3_BUCKET_NAME=spin-persitent-store-${ACCOUNT_ID}

# Download template
curl -o setup-spinnaker-with-deployment-vpc.yml https://raw.githubusercontent.com/awslabs/ec2-spot-labs/master/ec2-spot-spinnaker/setup-spinnaker-with-deployment-vpc.yml

# deploy stack
aws cloudformation deploy --template-file setup-spinnaker-with-deployment-vpc.yml \
    --stack-name ${STACK_NAME} \
    --parameter-overrides NumberOfAZs=${NUMBER_OF_AZS} \
    AvailabilityZones=${AVAILABILITY_ZONES} \
    EC2KeyPairName=${EC2_KEYPAIR_NAME} \
    SpinnakerVersion=${SPINNAKER_VERSION} \
    SpinnakerS3BucketName=${S3_BUCKET_NAME} \
    --capabilities CAPABILITY_NAMED_IAM --region ${AWS_REGION}

1.3 Connecting to Spinnaker

1.3.1 Get the SSH command to port forwarding for Deck – the browser-based UI (9000) and Gate – the API Gateway (8084) to access the Spinnaker UI and API.

SPINNAKER_INSTANCE_DNS_NAME=$(aws cloudformation describe-stacks --stack-name ${STACK_NAME} --region ${AWS_REGION} --query "Stacks[].Outputs[?OutputKey=='SpinnakerInstance'].OutputValue" --output text)
echo 'ssh -A -L 9000:localhost:9000 -L 8084:localhost:8084 -L 8087:localhost:8087 -i ~/'${EC2_KEYPAIR_NAME}' ubuntu@$'{SPINNAKER_INSTANCE_DNS_NAME}''

1.3.2 Open a new terminal and use the SSH command (output from the previous command) to connect to the Spinnaker instance. After you successfully connect to the Spinnaker instance via SSH, access the Spinnaker UI here and API here.

2. Deploy a demo web application

Let’s make sure that we have the environment variables required in the shell before proceeding. If you’re using the same terminal window as before, then you might already have these variables.

STACK_NAME=spinnaker-blog
AWS_REGION=us-west-2 # use the same region as before
EC2_KEYPAIR_NAME=spinnaker-blog-${AWS_REGION}
VPC_ID=$(aws cloudformation describe-stacks --stack-name ${STACK_NAME} --region ${AWS_REGION} --query "Stacks[].Outputs[?OutputKey=='VPCID'].OutputValue" --output text)

2.1 Create a Spinnaker Application

We start by creating an application in Spinnaker, a placeholder for the service that we deploy.

curl 'http://localhost:8084/tasks' \
-H 'Content-Type: application/json;charset=utf-8' \
--data-raw \
'{
   "job":[
      {
         "type":"createApplication",
         "application":{
            "cloudProviders":"aws",
            "instancePort":80,
            "name":"demoapp",
            "email":"[email protected]",
            "providerSettings":{
               "aws":{
                  "useAmiBlockDeviceMappings":true
               }
            }
         }
      }
   ],
   "application":"demoapp",
   "description":"Create Application: demoapp"
}'

Spin Create Server Group

2.2 Create an Application Load Balancer

Let’s create an Application Load Balanacer and a target group for port 80, spanning the three availability zones in our public subnet. We use the Demo-ALB-SecurityGroup for Firewalls to allow public access to the ALB on port 80.

As Spot Instances are interrupted with a two minute warning, you must adjust the Target Group’s deregistration delay to a slightly lower time. Recommended values are 90 seconds or less. This allows time for in-flight requests to complete and gracefully close existing connections before the instance is interrupted.

curl 'http://localhost:8084/tasks' \
-H 'Content-Type: application/json;charset=utf-8' \
--data-binary \
'{
   "application":"demoapp",
   "description":"Create Load Balancer: demoapp",
   "job":[
      {
         "type":"upsertLoadBalancer",
         "name":"demoapp-lb",
         "loadBalancerType":"application",
         "cloudProvider":"aws",
         "credentials":"my-aws-account",
         "region":"'"${AWS_REGION}"'",
         "vpcId":"'"${VPC_ID}"'",
         "subnetType":"public-subnet",
         "idleTimeout":60,
         "targetGroups":[
            {
               "name":"demoapp-targetgroup",
               "protocol":"HTTP",
               "port":80,
               "targetType":"instance",
               "healthCheckProtocol":"HTTP",
               "healthCheckPort":"traffic-port",
               "healthCheckPath":"/",
               "attributes":{
                  "deregistrationDelay":90
               }
            }
         ],
         "regionZones":[
            "'"${AWS_REGION}"'a",
            "'"${AWS_REGION}"'b",
            "'"${AWS_REGION}"'c"
         ],
         "securityGroups":[
            "Demo-ALB-SecurityGroup"
         ],
         "listeners":[
            {
               "protocol":"HTTP",
               "port":80,
               "defaultActions":[
                  {
                     "type":"forward",
                     "targetGroupName":"demoapp-targetgroup"
                 }
               ]
            }
         ]
      }
   ]
}'

Spin Create ALB

2.3 Create a server group

Before creating a server group (Auto Scaling group), here is a brief overview of the features used in the example:

      • onDemandBaseCapacity (default 0): The minimum amount of your ASG’s capacity that must be fulfilled by On-Demand instances (can also be applied toward Reserved Instances or Savings Plans). The example uses an onDemandBaseCapacity of three.
      • onDemandPercentageAboveBaseCapacity (default 100): The percentages of On-Demand and Spot Instances for additional capacity beyond OnDemandBaseCapacity. The example uses onDemandPercentageAboveBaseCapacity of 10% (i.e. 90% Spot).
      • spotAllocationStrategy: This indicates how you want to allocate instances across Spot Instance pools in each Availability Zone. The example uses the recommended Capacity Optimized strategy. Instances are launched from optimal Spot pools that are chosen based on the available Spot capacity for the number of instances that are launching.
      • launchTemplateOverridesForInstanceType: The list of instance types that are acceptable for your workload. Specifying multiple instance types enables tapping into multiple instance pools in multiple Availability Zones, designed to enhance your service’s availability. You can use the ec2-instance-selector, an open source AWS Command Line Interface(CLI) tool to narrow down the instance types based on resource criteria like vcpus and memory.
      • capacityRebalance: When enabled, this feature proactively manages the EC2 Spot Instance lifecycle leveraging the new EC2 Instance rebalance recommendation. This increases the emphasis on availability by automatically attempting to replace Spot Instances in an ASG before they are interrupted by Amazon EC2. We enable this feature in this example.

Learn more on spinnaker.io: feature descriptions and use cases and sample API requests.

Let’s create a server group with a desired capacity of 12 instances diversified across current and previous generation instance types, attach the previously created ALB, use Demo-EC2-SecurityGroup for the Firewalls which allows http traffic only from the ALB, use the following bash script for UserData to install httpd, and add instance metadata into the index.html.

2.3.1 Save the userdata bash script into a file user-date.sh.

Note that Spinnaker only support base64 encoded userdata. We use base64 bash command to encode the file contents in the next step.

cat << "EOF" > user-data.sh
#!/bin/bash
yum update -y
yum install httpd -y
echo "<html>
    <head>
        <title>Demo Application</title>
        <style>body {margin-top: 40px; background-color: #Gray;} </style>
    </head>
    <body>
        <h2>You have reached a Demo Application running on</h2>
        <ul>
            <li>instance-id: <b> `curl http://169.254.169.254/latest/meta-data/instance-id` </b></li>
            <li>instance-type: <b> `curl http://169.254.169.254/latest/meta-data/instance-type` </b></li>
            <li>instance-life-cycle: <b> `curl http://169.254.169.254/latest/meta-data/instance-life-cycle` </b></li>
            <li>availability-zone: <b> `curl http://169.254.169.254/latest/meta-data/placement/availability-zone` </b></li>
        </ul>
    </body>
</html>" > /var/www/html/index.html
systemctl start httpd
systemctl enable httpd
EOF

2.3.2 Create the server group by running the following command. Note we use the KeyPairName that we created as part of the prerequisites.

curl 'http://localhost:8084/tasks' \
-H 'Content-Type: application/json;charset=utf-8' \
-d \
'{
   "job":[
      {
         "type":"createServerGroup",
         "cloudProvider":"aws",
         "account":"my-aws-account",
         "application":"demoapp",
         "stack":"",
         "credentials":"my-aws-account",
	"healthCheckType": "ELB",
	"healthCheckGracePeriod":600,
	"capacityRebalance": true,
         "onDemandBaseCapacity":3, 
         "onDemandPercentageAboveBaseCapacity":10,
         "spotAllocationStrategy":"capacity-optimized",
         "setLaunchTemplate":true,
         "launchTemplateOverridesForInstanceType":[
            {
               "instanceType":"m4.large"
            },
            {
               "instanceType":"m5.large"
            },
            {
               "instanceType":"m5a.large"
            },
            {
               "instanceType":"m5ad.large"
            },
            {
               "instanceType":"m5d.large"
            },
            {
               "instanceType":"m5dn.large"
            },
            {
               "instanceType":"m5n.large"
            }

         ],
         "capacity":{
            "min":6,
            "max":21,
            "desired":12
         },
         "subnetType":"private-subnet",
         "availabilityZones":{
            "'"${AWS_REGION}"'":[
               "'"${AWS_REGION}"'a",
               "'"${AWS_REGION}"'b",
               "'"${AWS_REGION}"'c"
            ]
         },
         "keyPair":"'"${EC2_KEYPAIR_NAME}"'",
         "securityGroups":[
            "Demo-EC2-SecurityGroup"
         ],
         "instanceType":"m5.large",
         "virtualizationType":"hvm",
         "amiName":"'"$(aws ec2 describe-images --owners amazon --filters "Name=name,Values=amzn2-ami-hvm-2*x86_64-gp2" --query 'reverse(sort_by(Images, &CreationDate))[0].Name' --region ${AWS_REGION} --output text)"'",
         "targetGroups":[
            "demoapp-targetgroup"
         ],
         "base64UserData":"'"$(base64 user-data.sh)"'",,
        "associatePublicIpAddress":false,
         "instanceMonitoring":false
      }
   ],
   "application":"demoapp",
   "description":"Create New server group in cluster demoapp"
}'

Spin Create ServerGroup

Spinnaker creates an Amazon EC2 Launch Template and an ASG with specified parameters and waits until the ALB health check passes before sending traffic to the EC2 Instances.

The server group and launch template that we just created will look like this in Spinnaker UI:

Spin View ServerGroup

The UI also displays capacity type, such as the purchase option for each instance type in the Instance Information section:

Spin View ServerGroup Purchase Options 1Spin View ServerGroup Purchase Options 2

3. Access the application

Copy the Application Load Balancer URL by selecting the tree icon in the right top corner of the server group, and access it in a browser. You can refresh multiple times to see that the requests are going to different instances every time.

Spin Access App

Congratulations! You successfully deployed the demo application on an Amazon EC2 server group diversified across multiple instance types and purchase options.

Moreover, you can clone, modify, disable, and destroy these server groups, as well as use them with Spinnaker pipelines to effectively release new versions of your application.

Cost savings

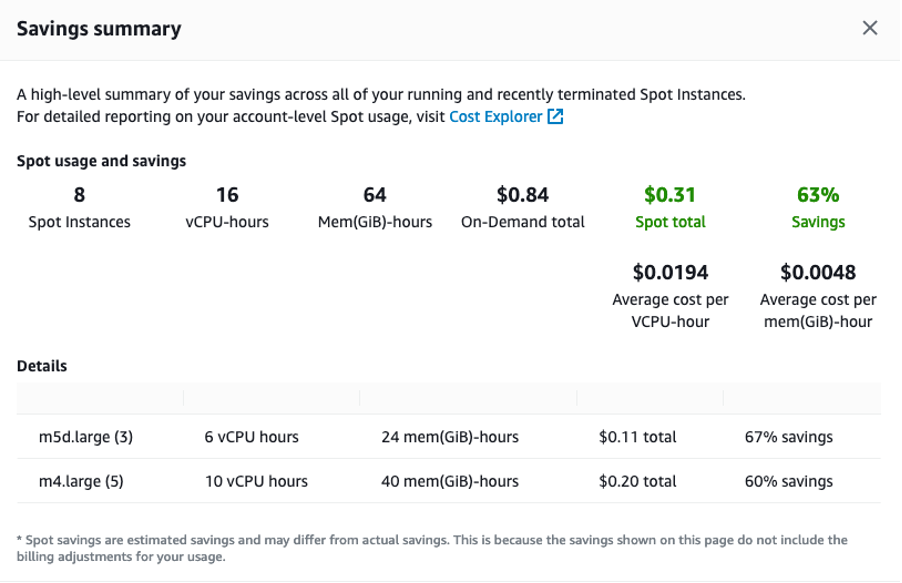
Check the savings you realized by deploying your demo application on EC2 Spot Instances by going to EC2 console > Spot Requests > Saving Summary.

Spin Spot Savings

Cleanup

To avoid incurring any additional charges, clean up the resources created in the tutorial.

Frist, delete the server group, application load balancer and application in Spinnaker.

curl 'http://localhost:8084/tasks' \
-H 'Content-Type: application/json;charset=utf-8' \
--data-raw \
'{
   "job":[
      {
         "reason":"Cleanup",
         "asgName":"demoapp-v000",
         "moniker":{
            "app":"demoapp",
            "cluster":"demoapp",
            "sequence":0
         },
         "serverGroupName":"demoapp-v000",
         "type":"destroyServerGroup",
         "region":"'"${AWS_REGION}"'",
         "credentials":"my-aws-account",
         "cloudProvider":"aws"
      },
      {
         "cloudProvider":"aws",
         "loadBalancerName":"demoapp-lb",
         "loadBalancerType":"application",
         "regions":[
            "'"${AWS_REGION}"'"
         ],
         "credentials":"my-aws-account",
         "vpcId":"'"${VPC_ID}"'",
         "type":"deleteLoadBalancer"
      },
      {
         "type":"deleteApplication",
         "application":{
            "name":"demoapp",
            "cloudProviders":"aws"
         }
      }
   ],
   "application":"demoapp",
   "description":"Deleting ServerGroup, ALB and Application: demoapp"
}'

Wait for Spinnaker to delete all of the resources before proceeding further. You can confirm this either on the Spinnaker UI or AWS Management Console.

Then delete the Spinnaker infrastructure by running the following command:

aws ec2 delete-key-pair --key-name ${EC2_KEYPAIR_NAME} --region ${AWS_REGION}
rm ~/${EC2_KEYPAIR_NAME}.pem
aws s3api delete-objects \
--bucket ${S3_BUCKET_NAME} \
--delete "$(aws s3api list-object-versions \
--bucket ${S3_BUCKET_NAME} \
--query='{Objects: Versions[].{Key:Key,VersionId:VersionId}}')" #If error occurs, there are no Versions and is OK
aws s3api delete-objects \
--bucket ${S3_BUCKET_NAME} \
--delete "$(aws s3api list-object-versions \
--bucket ${S3_BUCKET_NAME} \
--query='{Objects: DeleteMarkers[].{Key:Key,VersionId:VersionId}}')" #If error occurs, there are no DeleteMarkers and is OK
aws s3 rb s3://${S3_BUCKET_NAME} --force #Delete Bucket
aws cloudformation delete-stack --region ${AWS_REGION} --stack-name ${STACK_NAME}

Conclusion

In this post, we learned about the new Amazon EC2 features recently added to Spinnaker, and how to use them to build diversified and optimized Auto Scaling Groups. We also discussed recommended best practices for EC2 Spot and how they can improve your experience with it.

We would love to hear from you! Tell us about other Continuous Integration/Continuous Delivery (CI/CD) platforms that you want to use with EC2 Spot and/or Auto Scaling Groups by adding an issue on the Spot integrations roadmap.

What’s Up, Home? – Monitor your website visitor rate

Post Syndicated from Janne Pikkarainen original https://blog.zabbix.com/whats-up-home-monitor-your-website-visitor-rate/25660/

Can you monitor your website visitor rate with Zabbix? Of course, you can! By day, I am a lead site reliability engineer in a global cyber security company. By night, I monitor my home with Zabbix & Grafana and do some weird experiments with them.

I have this website hosted in a domain hotel, and among other features, the admin panel has some standard website access log analyzers (such as awstats) available for me to see the activity of this site. That’s cool, but also boringly easy, and requires me to log in to that admin panel instead of me using my trusted single pane of glass that is Zabbix.

Let’s connect to site logs

If I log in to my site over ssh/sftp, my home directory has a preconfigured access_logs directory. Like the name says, it contains the website access logs in the usual format you would expect it to be:

35.166.xxx.xxx – – [26/Jan/2023:04:24:37 +0200] “GET / HTTP/1.1” 200 10055 “http://whatsuphome.fi” “Mozilla/5.0 (X11; Linux x86_64) AppleWebKit/537.36 (KHTML, like Gecko) Chrome/83.0.4103.97 Safari/537.36”

That’s great, but how to monitor that in real time with Zabbix? Let’s use sshfs — it’s like NFS or CIFS, but allows you to mount stuff over ssh. On my dear Raspberry Pi 4, which runs my Zabbix, running

sudo mkdir /var/log/whatsuphome && sudo chown zabbix /var/log/whatsuphome

sudo sshfs -o allow_other mywhatsuphomeaccount@myhotelname:access_logs /var/log/whatsuphome

did mount my remote server access_logs directory perfectly fine.

Time for monitoring

Now that we have our log file, the rest is very straightforward and standard log file monitoring. First, let’s add a master item that reads the log.

Nothing too difficult yet.

Next, let’s add a dependent item that grabs the visitor IP address part from a log line.

… and some item preprocessing to grab only the IP

Items

Sorry about that ugly regular expression.

… after adding a few more items, here’s my template.

I’m currently not parsing the referrer, exact URL, or user-agent values, as for the most part those would just add unnecessary noise and load for my poor little home Zabbix.

Dashboard time!

So, finally, I created a dashboard showing the number of unique IP addresses & hits during the past 24 hours and some graphs. Now that I’ve not posted any posts in a while, welcome to Tumbleweedville!

It’s so silent in here that I can hear my own typing.

After publishing this post, I’ll wait for a while and then update the post with a new screenshot, so we’ll get to see the incredible visitor surge that will be counted in at least tens of new IP addresses.

Update #1 about 15 minutes after publishing the post

Clearly some movement in the access log needle!

Update #2 about 15 minutes after publishing the post

Almost 400 unique IP addresses already? Hello, dear readers and bots.

Update #3 about 15 minutes after publishing the post

Even though IP addresses are a bad way to measure the actual amount of visitors, roughly 400 unique new addresses after publishing my post are very good. Thanks, bots and readers!

This post was originally published on the author’s page.

Устните бясно танцуват

Post Syndicated from Тоест original https://www.toest.bg/ustnite-byasno-tantsuvat/

Устните бясно танцуват

устните бясно танцуват
червения танц на радостта
и жълтия танц на покрусата
танцуват танца на клоуна с бял нос
и синия танц на тракащата пишеща машина
единствено сърцето не танцува
този велик режисьор седи в мрака сред публиката
сякаш безучастен към всичко
мълчалив като хиената
която волно кръстосва безбрежната степ

(Август 1988 г.)
Ю Дзиен
Превод от китайски Веселин Карастойчев


Ю Дзиен (р. 1954) е китайски поет, роден „на юг от облаците“, в югозападната китайска провинция Юннан. Автор е на над 50 книги с поезия, проза, спомени и размишления. Носител е на множество национални и международни награди. Негова стихосбирка ще излезе до края на 2023 г. в Издателство за поезия „ДА“ в превод на Веселин Карастойчев.

Веселин Карастойчев (р. 1971) е китаист и „съмнителен бас китарист“, преподавател в СУ „Св. Климент Охридски“ и преводач. Автор на „Думи в полет“, изследване върху съвременната китайска поезия; съставител и преводач на антологията „Малък лексикон на най-новата китайска поезия“ (2008), книгата на Бей Дао „Пейзажи над нулата и други стихотворения“ (2021) и др.


Според Екатерина Йосифова „четящият стихотворение сутрин… добре понася другите часове“ от деня. Убедени, че поезията държи умовете ни будни, а сърцата – отворени, в края на всеки месец ви предлагаме по едно стихотворение. Защото и в най-смутни времена доброто стихотворение е добра новина.

Security updates for Friday

Post Syndicated from original https://lwn.net/Articles/927198/

Security updates have been issued by Debian (chromium, libdatetime-timezone-perl, and tzdata), Fedora (flatpak and gmailctl), Mageia (firefox, flatpak, golang, gssntlmssp, libmicrohttpd, libtiff, python-flask-security, python-owslib, ruby-rack, thunderbird, unarj, and vim), Red Hat (firefox, kpatch-patch, nss, openssl, and thunderbird), SUSE (containerd, hdf5, qt6-base, and squirrel), and Ubuntu (amanda, gif2apng, graphviz, and linux, linux-aws, linux-azure, linux-gcp, linux-ibm, linux-kvm,
linux-lowlatency, linux-oracle, linux-raspi).

Use the language of your choice with Pages Functions via WebAssembly

Post Syndicated from Carmen Popoviciu original https://blog.cloudflare.com/pages-functions-with-webassembly/

Use the language of your choice with Pages Functions via WebAssembly

Use the language of your choice with Pages Functions via WebAssembly

On the Cloudflare Developer Platform, we understand that building any application is a unique experience for every developer. We know that in the developer ecosystem there are a plethora of tools to choose from and as a developer you have preferences and needs. We don’t believe there are “right” or “wrong” tools to use in development and want to ensure a good developer experience no matter your choices. We believe in meeting you where you are.

When Pages Functions moved to Generally Available in November of last year, we knew it was the key that unlocks a variety of use cases – namely full-stack applications! However, we still felt we could do more to provide the flexibility for you to build what you want and how you want.

That’s why today we’re opening the doors to developers who want to build their server side applications with something other than JavaScript. We’re excited to announce WebAssembly support for Pages Functions projects!

WebAssembly (or Wasm) is a low-level assembly-like language that can run with near-native performance. It provides programming languages such as C/C++, C# or Rust with a compilation target, enabling them to run alongside JavaScript. Primarily designed to run on the web (though not exclusively), WebAssembly opens up exciting opportunities for applications to run on the web platform, both on the client and the server, that up until now couldn’t have done so.

With Pages Functions being Workers “under the hood” and Workers having Wasm module support for quite some time, it is only natural that Pages provides a similar experience for our users as well. While not all use cases are a good fit for Wasm, there are many that are. Our goal with adding Wasm support is enabling those use cases and expanding the boundaries of what Functions can build.

Using WebAssembly in Pages Functions

WebAssembly in Pages Functions works very similar to how it does today in Workers — we read wasm files as WebAssembly modules, ready for you to import and use directly from within your Functions. In short, like this:

// functions/api/distance-between.js

import wasmModule from "../../pkg/distance.wasm";

export async function onRequest({ request }) {
  const moduleInstance = await WebAssembly.instantiate(wasmModule);
  const distance = await moduleInstance.exports.distance_between();

  return new Response(distance);
}

Let’s briefly unpack the code snippet above to highlight some things that are important to understand.

import wasmModule from "../../pkg/distance.wasm";

Pages makes no assumptions as to how the binary .wasm files you want to import were compiled. In our example above, distance.wasm can be a file you compiled yourself out of code you wrote, or equally, a file provided in a third-party library’s distribution. The only thing Pages cares about is that distance.wasm is a compiled binary Wasm module file.

The result of that import is a WebAssembly.Module object, which you can then instantiate:

const moduleInstance = await WebAssembly.instantiate(wasmModule);

Once the WebAssembly.Instance object is created, you can start using whatever features your Wasm module exports, inside your Functions code:

const distance = await moduleInstance.exports.distance_between();

More modules, more fun!

Apart from Wasm modules, this work unlocks support for two other module types that you can import within your Functions code: text and binary. These are not standardized modules, but can be very handy if you need to import raw text blobs (such as HTML files) as a string:

// functions/my-function.js
import html from "404.html";

export async function onRequest() {
  return new Response(html,{
    headers: { "Content-Type": "text/html" }
  });
}

or raw data blobs (such as images) as an ArrayBuffer.

// functions/my-function.js
import image from "../hearts.png.bin";

export async function onRequest() {
  return new Response(image,{
    headers: { "Content-Type": "image/png" }
  });
}

The distance between us on the surface of Earth

Let’s take a look at a live example to see it all in action! We’ve built a small demo app that walks you through an example of Functions with WebAssembly end-to-end. You can check out the code of our demo application available on GitHub.

The application computes the distance in kilometers on the surface of Earth between your current location (based on the geo coordinates of the incoming request) and any other point on the globe, each time you click on the globe’s surface.

Use the language of your choice with Pages Functions via WebAssembly

The code that performs the actual high-performance distance calculation is written in Rust, and is a slight adaptation of the example provided in the Rust cookbook:

fn distance_between(from_latitude_degrees: f64, from_longitude_degrees: f64, to_latitude_degrees: f64, to_longitude_degrees: f64) -> f64 {
    let earth_radius_kilometer = 6371.0_f64;

    let from_latitude = from_latitude_degrees.to_radians();
    let to_latitude = to_latitude_degrees.to_radians();

    let delta_latitude = (from_latitude_degrees - to_latitude_degrees).to_radians();
    let delta_longitude = (from_longitude_degrees - to_longitude_degrees).to_radians();

    let central_angle_inner = (delta_latitude / 2.0).sin().powi(2)
        + from_latitude.cos() * to_latitude.cos() * (delta_longitude / 2.0).sin().powi(2);
    let central_angle = 2.0 * central_angle_inner.sqrt().asin();

    let distance = earth_radius_kilometer * central_angle;
    
    return distance;
}

We have a Rust playground experiment available here, in case you want to play around with this code snippet in particular.

To use the distance_between() Rust function in Pages Functions, we first compile the code to WebAssembly using wasm-pack:

##
# generate the `pkg` folder which will contain the wasm binary
##
wasm-pack build

Then, we import the generated .wasm artifact from inside our distance-between.js Pages Function. Now, each time you click on the globe surface, a request to /api/distance-between is made, which will trigger the distance_between() function to execute. Once computed, the distance value is returned by our Function, back to the client, which proceeds to display the value to the user.

Use the language of your choice with Pages Functions via WebAssembly

We want to point out that this application could have been built entirely in JavaScript, however, we equally wanted to show just how simple it is to build it with Rust. The decision to use Rust was motivated by a few factors. First, the tooling ecosystem for building and working with Rust-generated WebAssembly is quite mature, well documented, and easy to get started with. Second, the Rust docs are a fantastic resource if you are new to Rust or to Rust with WebAssembly! If you are looking for a step-by-step tutorial on how to generate and set up a Rust and WebAssembly project, we highly recommend checking out Rust’s official WebAssembly Book.

We hope it gives you a solid starting point in exploring what is possible with Wasm on Pages Functions, and inspires you to create some powerful applications of your own. Head over to our docs to get started today!

Exploding USB Sticks

Post Syndicated from Bruce Schneier original https://www.schneier.com/blog/archives/2023/03/exploding-usb-sticks.html

In case you don’t have enough to worry about, people are hiding explosives—actual ones—in USB sticks:

In the port city of Guayaquil, journalist Lenin Artieda of the Ecuavisa private TV station received an envelope containing a pen drive which exploded when he inserted it into a computer, his employer said.

Artieda sustained slight injuries to one hand and his face, said police official Xavier Chango. No one else was hurt.

Chango said the USB drive sent to Artieda could have been loaded with RDX, a military-type explosive.

More:

According to police official Xavier Chango, the flash drive that went off had a 5-volt explosive charge and is thought to have used RDX. Also known as T4, according to the Environmental Protection Agency (PDF), militaries, including the US’s, use RDX, which “can be used alone as a base charge for detonators or mixed with other explosives, such as TNT.” Chango said it comes in capsules measuring about 1 cm, but only half of it was activated in the drive that Artieda plugged in, which likely saved him some harm.

Reminds me of assassination by cell phone.

Радев е Борисов и половина

Post Syndicated from Емилия Милчева original https://www.toest.bg/radev-e-borisov-i-polovina/

Радев е Борисов и половина

На втората година от втория мандат на президента Румен Радев няма съмнение, че приликите с управлявалия три премиерски мандата Борисов са повече от отликите. Бившият военен летец е властник със също такова его и уклон към авторитаризъм, както и бившият пожарникар и собственик на охранителна фирма.

Но поради естеството на властта, която консумира, и неспособността на парламентите да излъчат редовно правителство Румен Радев надмина Борисов.

Той управлява „Дондуков“ 1 и „Дондуков“ 2, както и областните администрации. Решава и за дипломатическите назначения, съобразявайки се отново единствено със себе си и съветническия си кръг, тъй като по закон те се съгласуват между правителството и президента, който издава указа за назначаването им. А правителството, управляващо от 2 август м.г., отново е назначено от него. Така се стигна до серия назначения в дипломацията, които коалиционното правителство на Кирил Петков спираше, и до оформяне на дипломатически ариергард на Радев и силите зад него.

Президентът определя и насоките на външната политика, представлявайки като държавен лидер България на заседанията на Европейския съвет в Брюксел, където неговите проруски позиции по най-съществения глобален проблем – войната в Украйна, са ясно изразени. И макар одобрението му да отчита спад, президентът продължава да е политическата фигура, която се ползва с най-високо доверие в обществото.

Ако позициите на лидера на ГЕРБ все пак имаха своите корективи и спирачки в лицето на германските партньори в ЕНП и в Европейската комисия, Радев е неудържим, защото няма какво да го сдържа.

Външна политика

Независимо от решението на народното събрание на парламентарна по конституция република да бъде оказана военна помощ на Украйна, президентската власт отказа България да е част от обществената поръчка на ЕС за 1 милион 155-милиметрови артилерийски снаряда. Така страната ни липсва от безпрецедентното решение на ЕС, определено като „историческо“ от върховния представител по сигурността Жозеп Борел.

На международната конференция „Антикорупция и национална сигурност“ на 21 март т.г. президентът обяви, че България няма да предоставя на нападнатата от Русия Украйна нито изтребители, нито зенитноракетни комплекси, нито танкове и бронетранспортьори. Наред с това Румен Радев отново излезе с шлагерния си призив за миротворците и войнолюбците – партиите, които се канят да управляват след изборите, да кажат „дали ще бъдат част от усилията за възстановяване на мира, или за удължаване на войната“.

На заседанието на Европейския съвет в Брюксел тази седмица Радев повтори отново позицията си за неучастие на България и дори я „надгради“ с намерението да се изисква от крайния потребител на военна продукция от българската оръжейна промишленост къде ще я изнася после: „Той (купувачът – б.а.) е длъжен да ни уведоми за какво ги иска като енд юзър (краен получател – б.а.) тези снаряди. Разбира се, че ще поставим условия.“ Известно е, че досега българските фирми продаваха на крайни купувачи от САЩ, Полша, Словакия и др., които ги доставяха на Украйна. За 2022 г. България е изнесла оръжие за поне 1 млрд. евро за Украйна, разкри наскоро Euractiv.bg.

Едва ли някой се заблуждава, че президентът е толкова настойчив, защото е адепт на индийската философия и принципа за ненасилие, а не поради кремълска детерминираност. Ударното въоръжаване на Украйна е част от колективния натиск за по-бързо приключване на войната, възстановяване на териториалната ѝ цялост от 1991 г. и справедливи наказания за агресорите. Мирни преговори не може да се водят, докато руските войски окупират части от Украйна – тази позиция на Киев, подкрепена и от Запада, е недвусмислена.

Технически погледнато, отказът на България няма да се отрази на западната помощ за Украйна, тъй като нашият принос щеше да е незначителен дял, а военните заводи така и така изнасят оръжие и боеприпаси за Киев. Ще видим дали това ще продължи да е така след изказаното вчера намерение на Радев за поставяне на условия на купувачите. В такъв сюжет Борисов едва ли щеше да направи любимия си номер с „приклякването“, защото ситуацията не търпи половинчати отговори и строителят на тръбата, изградена, за да може руският газ да заобикаля Украйна, щеше да се прислони до гърба на Запада.

Радев прави обратното – раздалечава България от съюзите, на които страната е пълноправен член и на които разчита за трансформация на икономиката и защита на територията си. Обезличава я, изтласквайки я в периферията им (за което впоследствие биват обвинявани партньорите в тези съюзи), а България все по-рядко проявява солидарност в ключови моменти.

Войната в Украйна най-вероятно ще приключи преди 2027 г., когато е краят на втория и последен мандат на Румен Радев. Сметката за пропутинските позиции на президента ще я плати България.

Вътрешна политика

Дълго време анализаторите се чудеха чия е партията на Румен Радев, приписвайки му родство първоначално с „Продължаваме промяната“, по-късно – с „Български възход“. Макар и без ДНК експертиза обаче, една политическа сила изглежда най-сродна нему – „Възраждане“. И Борисов се разбираше с националистите и даже управляваше заедно с тях – в твърди или плаващи мнозинства, но не говореше като тях. Радев го прави в относително мек вариант, докато Костадинов по фюрерски втвърдява тона, добавяйки щипки страх в интервю по БНТ:

„Възраждане“ ще спре подготвяната кражба на спестяванията на хората чрез девалвацията на лева… А в Брюксел ще се научат да свикват с мисълта, че България може да казва и „не“.

В кривите огледала на пропагандата разкъсването на връзките между България и европейската и евроатлантическа общност, към която принадлежи, се вижда като „свобода“ и „българска независимост“.

Президентът заявява, че решението България да не предоставя оръжия на Украйна е знак към ЕС за суверенитета при вземането на решения. „Крайно време е да се вземем в ръце и да започнем да се управляваме сами“, казва по-рано лидерът на „Възраждане“.

Относно еврото на среща с „Възраждане“ Радев посочва, че „не изпълняваме критериите за финансова стабилност и за инфлацията“, приканва да не се бърза и да не се допусне жизненият стандарт да бъде понижен, а в публичните си изяви говори за ползите от единната европейска валута и я определя като национална стратегическа цел. Официално партията на Костадин Костадинов също твърди, че не е изобщо против въвеждането на еврото, а само дотогава, докато България не постигне 90% от средния за ЕС жизнен стандарт. Според последните данни на Евростат България е с най-ниски нива на БВП на глава от населението, изразено в паритет на покупателната способност през 2021 г. – с 43% под средното равнище в ЕС. По показателя действително индивидуално потребление България отново е последна – 35% под средното за ЕС.

Така че докато „Възраждане“ са представени в парламента, президентът ще има „своя“ парламентарна група там, за да го играят меката и твърдата сила на кремълската пропаганда. Радев наистина е Борисов и половина.

Interact with Apache Iceberg tables using Amazon Athena and cross account fine-grained permissions using AWS Lake Formation

Post Syndicated from Kishore Dhamodaran original https://aws.amazon.com/blogs/big-data/interact-with-apache-iceberg-tables-using-amazon-athena-and-cross-account-fine-grained-permissions-using-aws-lake-formation/

We recently announced support for AWS Lake Formation fine-grained access control policies in Amazon Athena queries for data stored in any supported file format using table formats such as Apache Iceberg, Apache Hudi and Apache Hive. AWS Lake Formation allows you to define and enforce database, table, and column-level access policies to query Iceberg tables stored in Amazon S3. Lake Formation provides an authorization and governance layer on data stored in Amazon S3. This capability requires that you upgrade to Athena engine version 3.

Large organizations often have lines of businesses (LoBs) that operate with autonomy in managing their business data. It makes sharing data across LoBs non-trivial. These organizations have adopted a federated model, with each LoB having the autonomy to make decisions on their data. They use the publisher/consumer model with a centralized governance layer that is used to enforce access controls. If you are interested in learning more about data mesh architecture, visit Design a data mesh architecture using AWS Lake Formation and AWS Glue. With Athena engine version 3, customers can use the same fine-grained controls for open data frameworks such as Apache Iceberg, Apache Hudi, and Apache Hive.

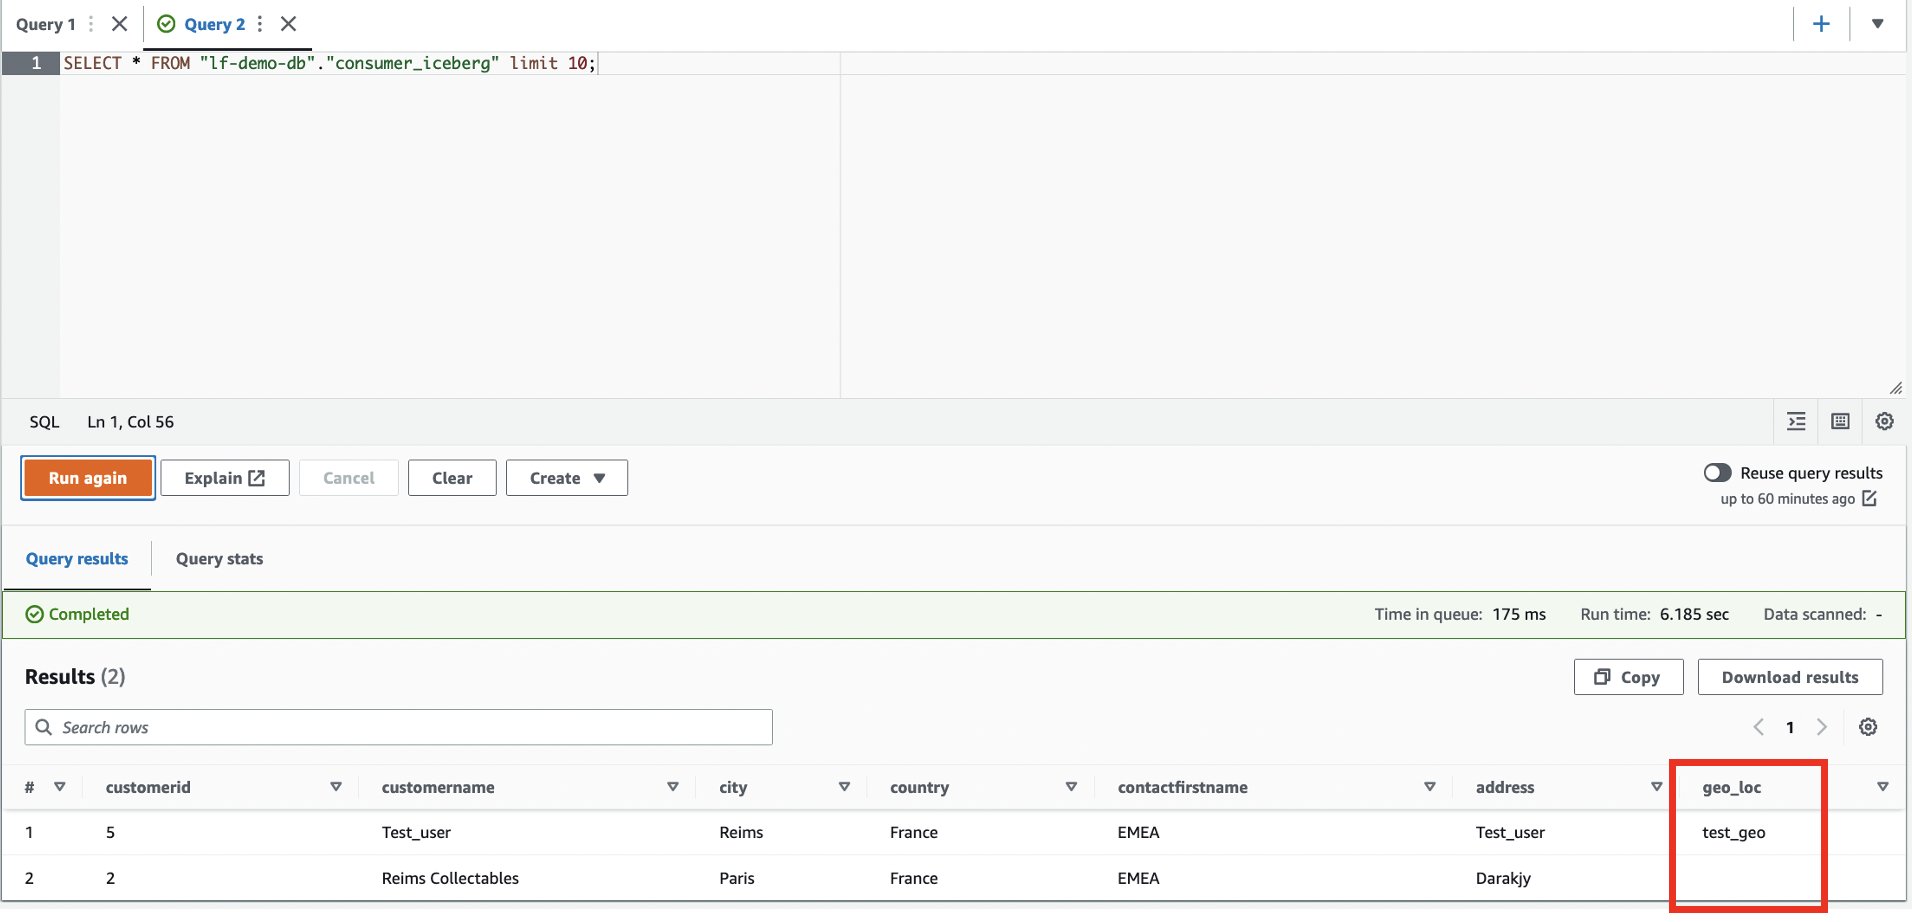
In this post, we deep dive into a use-case where you have a producer/consumer model with data sharing enabled to give restricted access to an Apache Iceberg table that the consumer can query. We’ll discuss column filtering to restrict certain rows, filtering to restrict column level access, schema evolution, and time travel.

Solution overview

To illustrate the functionality of fine-grained permissions for Apache Iceberg tables with Athena and Lake Formation, we set up the following components:

  • In the producer account:
    • An AWS Glue Data Catalog to register the schema of a table in Apache Iceberg format
    • Lake Formation to provide fine-grained access to the consumer account
    • Athena to verify data from the producer account
  • In the consumer account:
    • AWS Resource Access Manager (AWS RAM) to create a handshake between the producer Data Catalog and consumer
    • Lake Formation to provide fine-grained access to the consumer account
    • Athena to verify data from producer account

The following diagram illustrates the architecture.

Cross-account fine-grained permissions architecture

Prerequisites

Before you get started, make sure you have the following:

Data producer setup

In this section, we present the steps to set up the data producer.

Create an S3 bucket to store the table data

We create a new S3 bucket to save the data for the table:

  1. On the Amazon S3 console, create an S3 bucket with unique name (for this post, we use iceberg-athena-lakeformation-blog).
  2. Create the producer folder inside the bucket to use for the table.

Amazon S3 bucket and folder creation

Register the S3 path storing the table using Lake Formation

We register the S3 full path in Lake Formation:

  1. Navigate to the Lake Formation console.
  2. If you’re logging in for the first time, you’re prompted to create an admin user.
  3. In the navigation pane, under Register and ingest, choose Data lake locations.
  4. Choose Register location, and provide the S3 bucket path that you created earlier.
  5. Choose AWSServiceRoleForLakeFormationDataAccess for IAM role.

For additional information about roles, refer to Requirements for roles used to register locations.

If you enabled encryption of your S3 bucket, you have to provide permissions for Lake Formation to perform encryption and decryption operations. Refer to Registering an encrypted Amazon S3 location for guidance.

  1. Choose Register location.

Register Lake Formation location

Create an Iceberg table using Athena

Now let’s create the table using Athena backed by Apache Iceberg format:

  1. On the Athena console, choose Query editor in the navigation pane.
  2. If you’re using Athena for the first time, under Settings, choose Manage and enter the S3 bucket location that you created earlier (iceberg-athena-lakeformation-blog/producer).
  3. Choose Save.
  4. In the query editor, enter the following query (replace the location with the S3 bucket that you registered with Lake Formation). Note that we use the default database, but you can use any other database.
CREATE TABLE consumer_iceberg (
customerid bigint,
customername string,
email string,
city string,
country string,
territory string,
contactfirstname string,
contactlastname string)
LOCATION 's3://YOUR-BUCKET/producer/' -- *** Change bucket name to your bucket***
TBLPROPERTIES ('table_type'='ICEBERG')
  1. Choose Run.

Athena query editor to create Iceberg table

Share the table with the consumer account

To illustrate functionality, we implement the following scenarios:

  • Provide access to selected columns
  • Provide access to selected rows based on a filter

Complete the following steps:

  1. On the Lake Formation console, in the navigation pane under Data catalog, choose Data filters.
  2. Choose Create new filter.
  3. For Data filter name, enter blog_data_filter.
  4. For Target database, enter lf-demo-db.
  5. For Target table, enter consumer_iceberg.
  6. For Column-level access, select Include columns.
  7. Choose the columns to share with the consumer: country, address, contactfirstname, city, customerid, and customername.
  8. For Row filter expression, enter the filter country='France'.
  9. Choose Create filter.

create data filter

Now let’s grant access to the consumer account on the consumer_iceberg table.

  1. In the navigation pane, choose Tables.
  2. Select the consumer_iceberg table, and choose Grant on the Actions menu.
    Grant access to consumer account on consumer_iceberg table
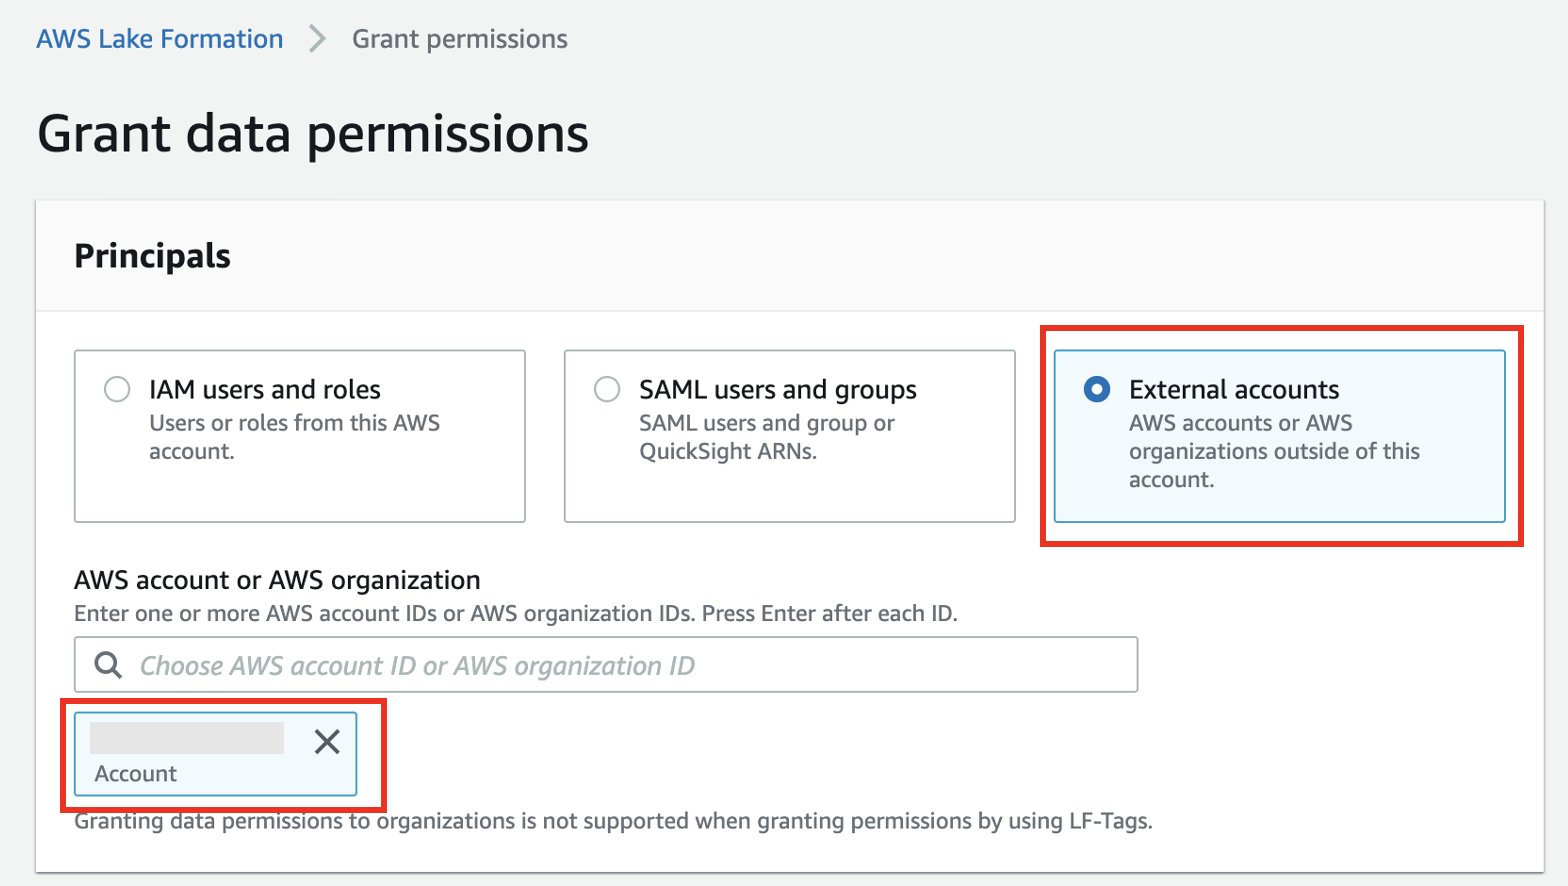
  3. Select External accounts.
  4. Enter the external account ID.
    Grant data permissions
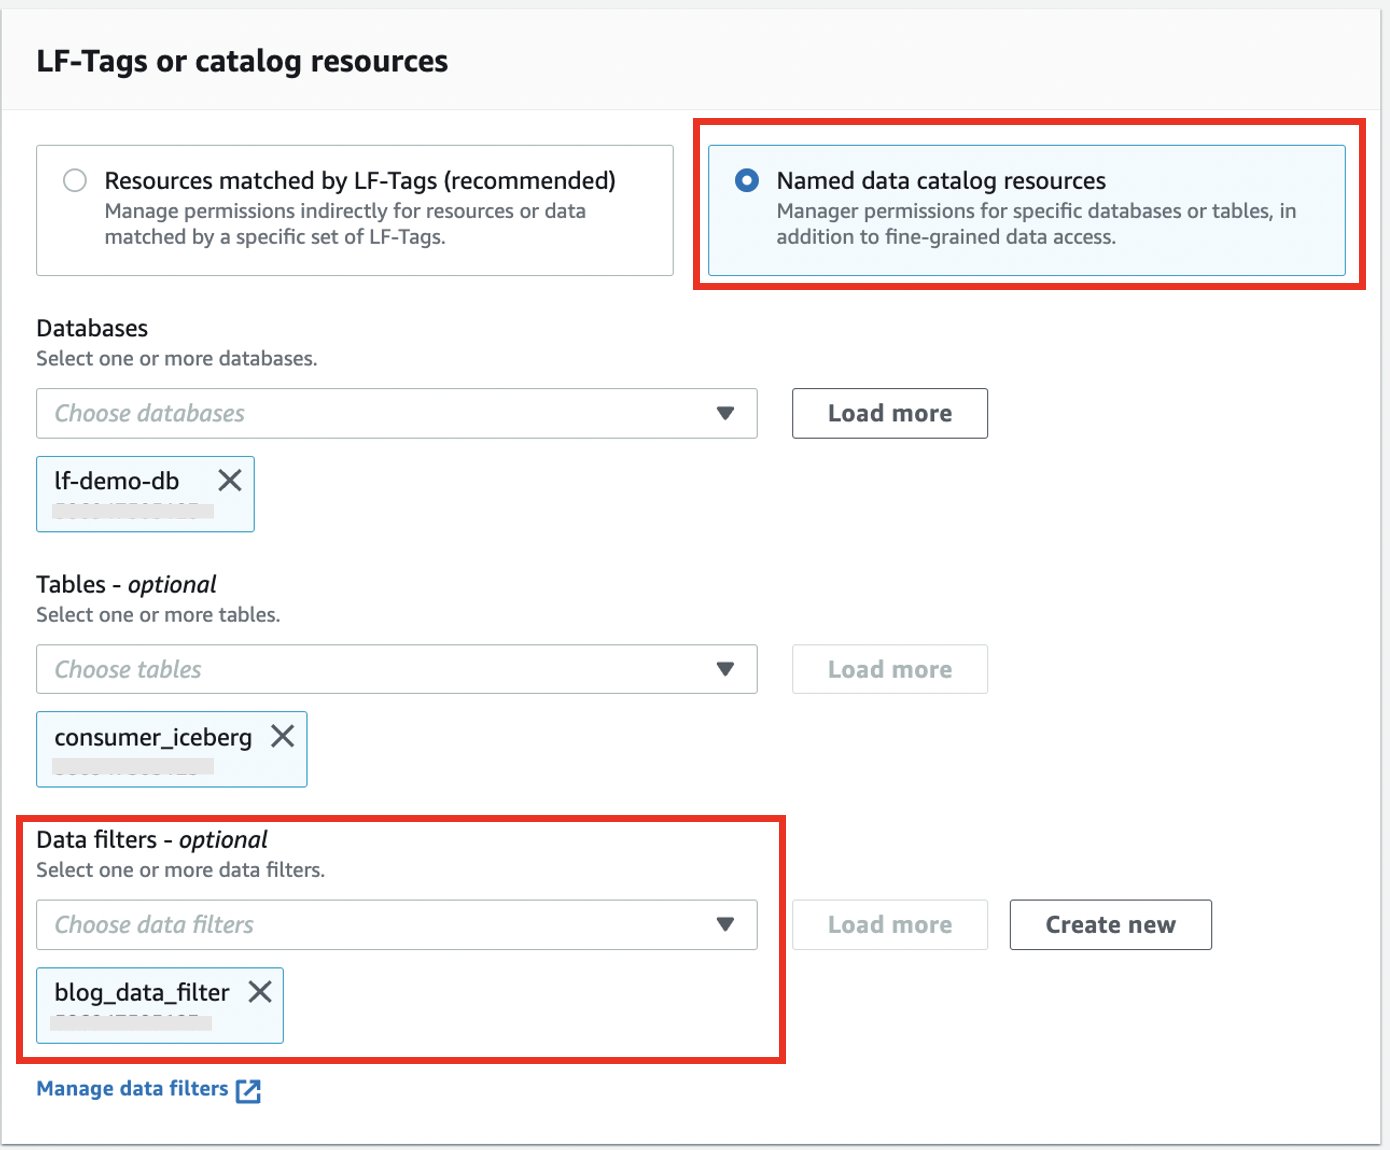
  5. Select Named data catalog resources.
  6. Choose your database and table.
  7. For Data filters, choose the data filter you created.
    Add data filter
  8. For Data filter permissions and Grantable permissions, select Select.
  9. Choose Grant.

Permissions for creating grant

Data consumer setup

To set up the data consumer, we accept the resource share and create a table using AWS RAM and Lake Formation. Complete the following steps:

  1. Log in to the consumer account and navigate to the AWS RAM console.
  2. Under Shared with me in the navigation pane, choose Resource shares.
  3. Choose your resource share.
    Resource share in consumer account
  4. Choose Accept resource share.
  5. Note the name of the resource share to use in the next steps.
    Accept resource share
  6. Navigate to the Lake Formation console.
  7. If you’re logging in for the first time, you’re prompted to create an admin user.
  8. Choose Databases in the navigation pane, then choose your database.
  9. On the Actions menu, choose Create resource link.
    Create a resource link
  10. For Resource link name, enter the name of your resource link (for example, consumer_iceberg).
  11. Choose your database and shared table.
  12. Choose Create.
    Create table with resource link

Validate the solution

Now we can run different operations on the tables to validate the fine-grained access controls.

Insert operation

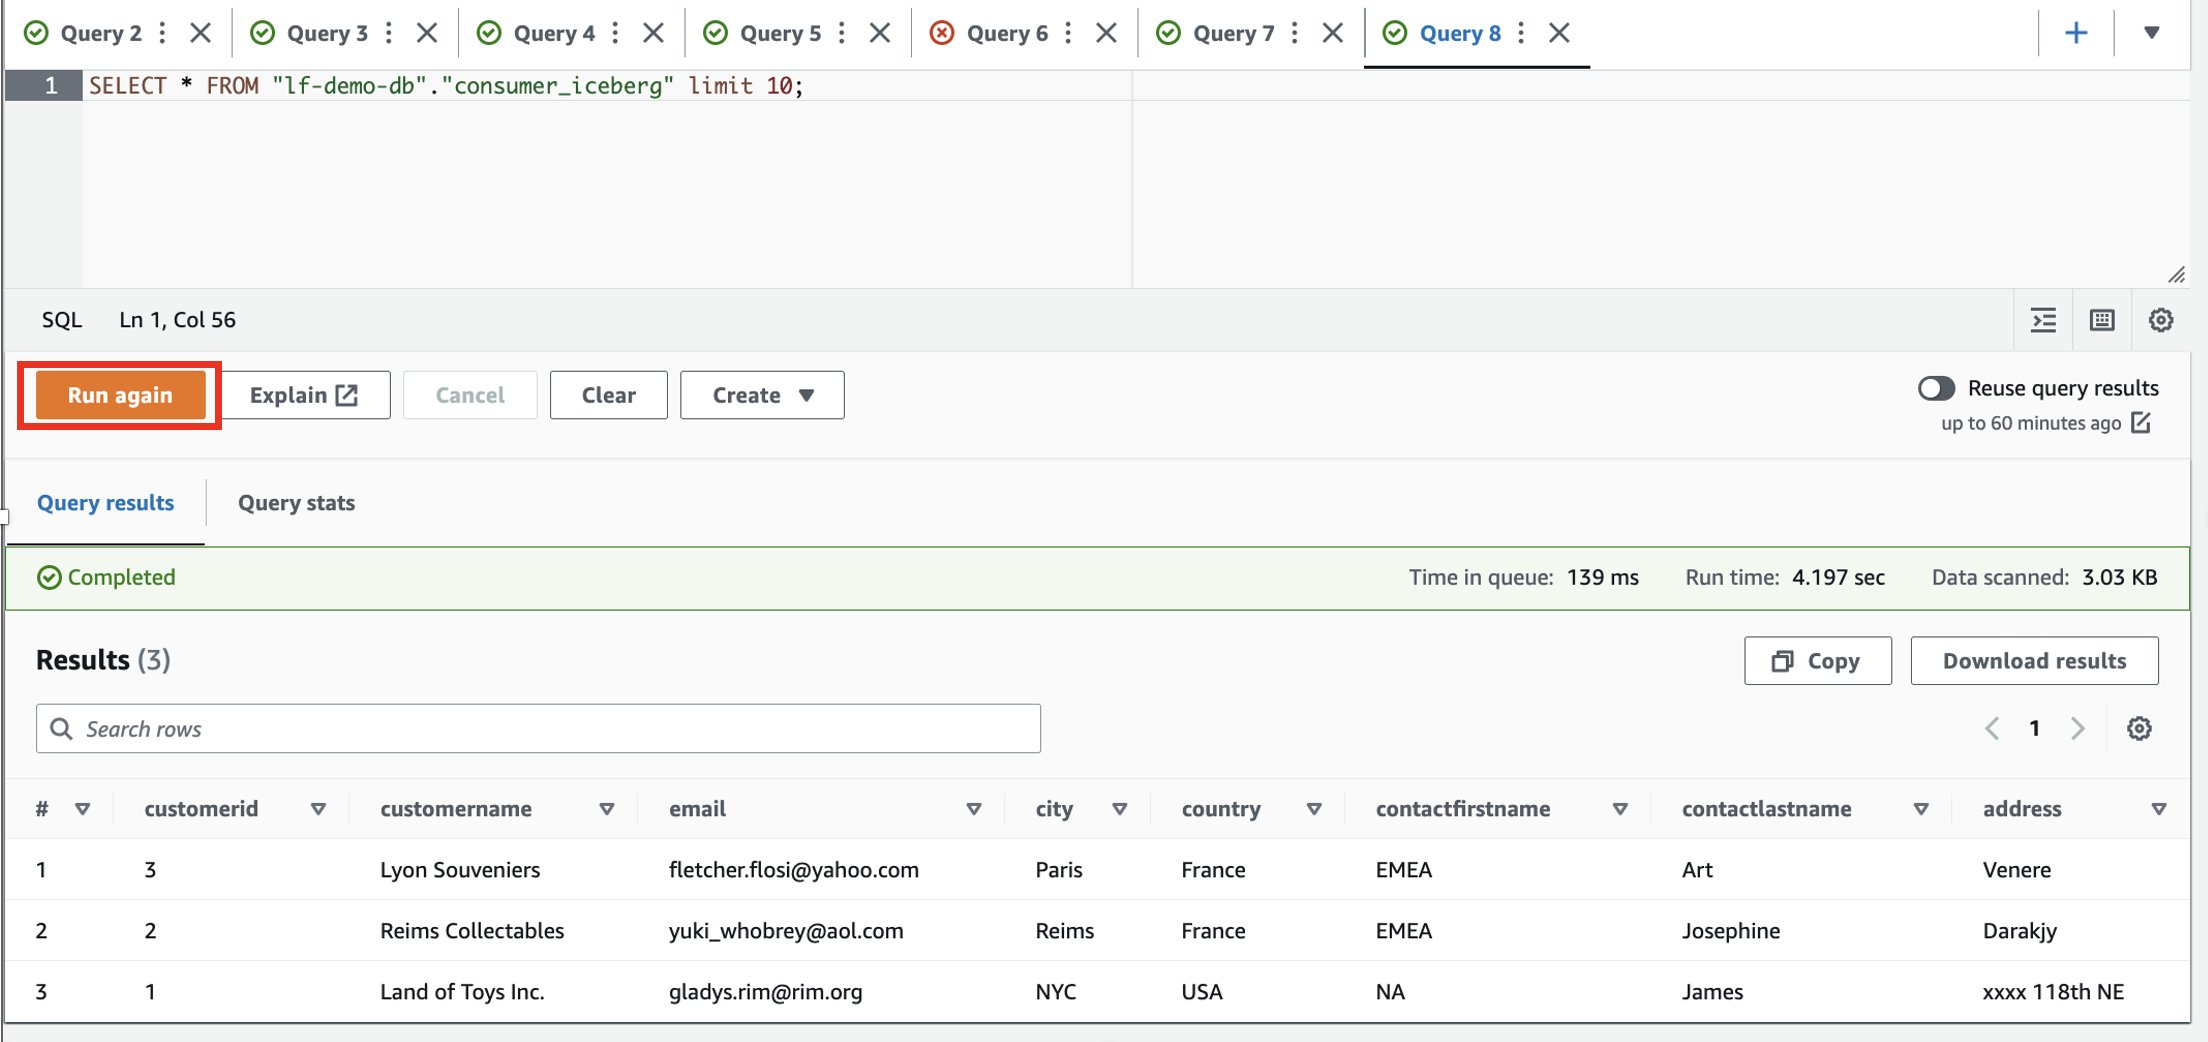
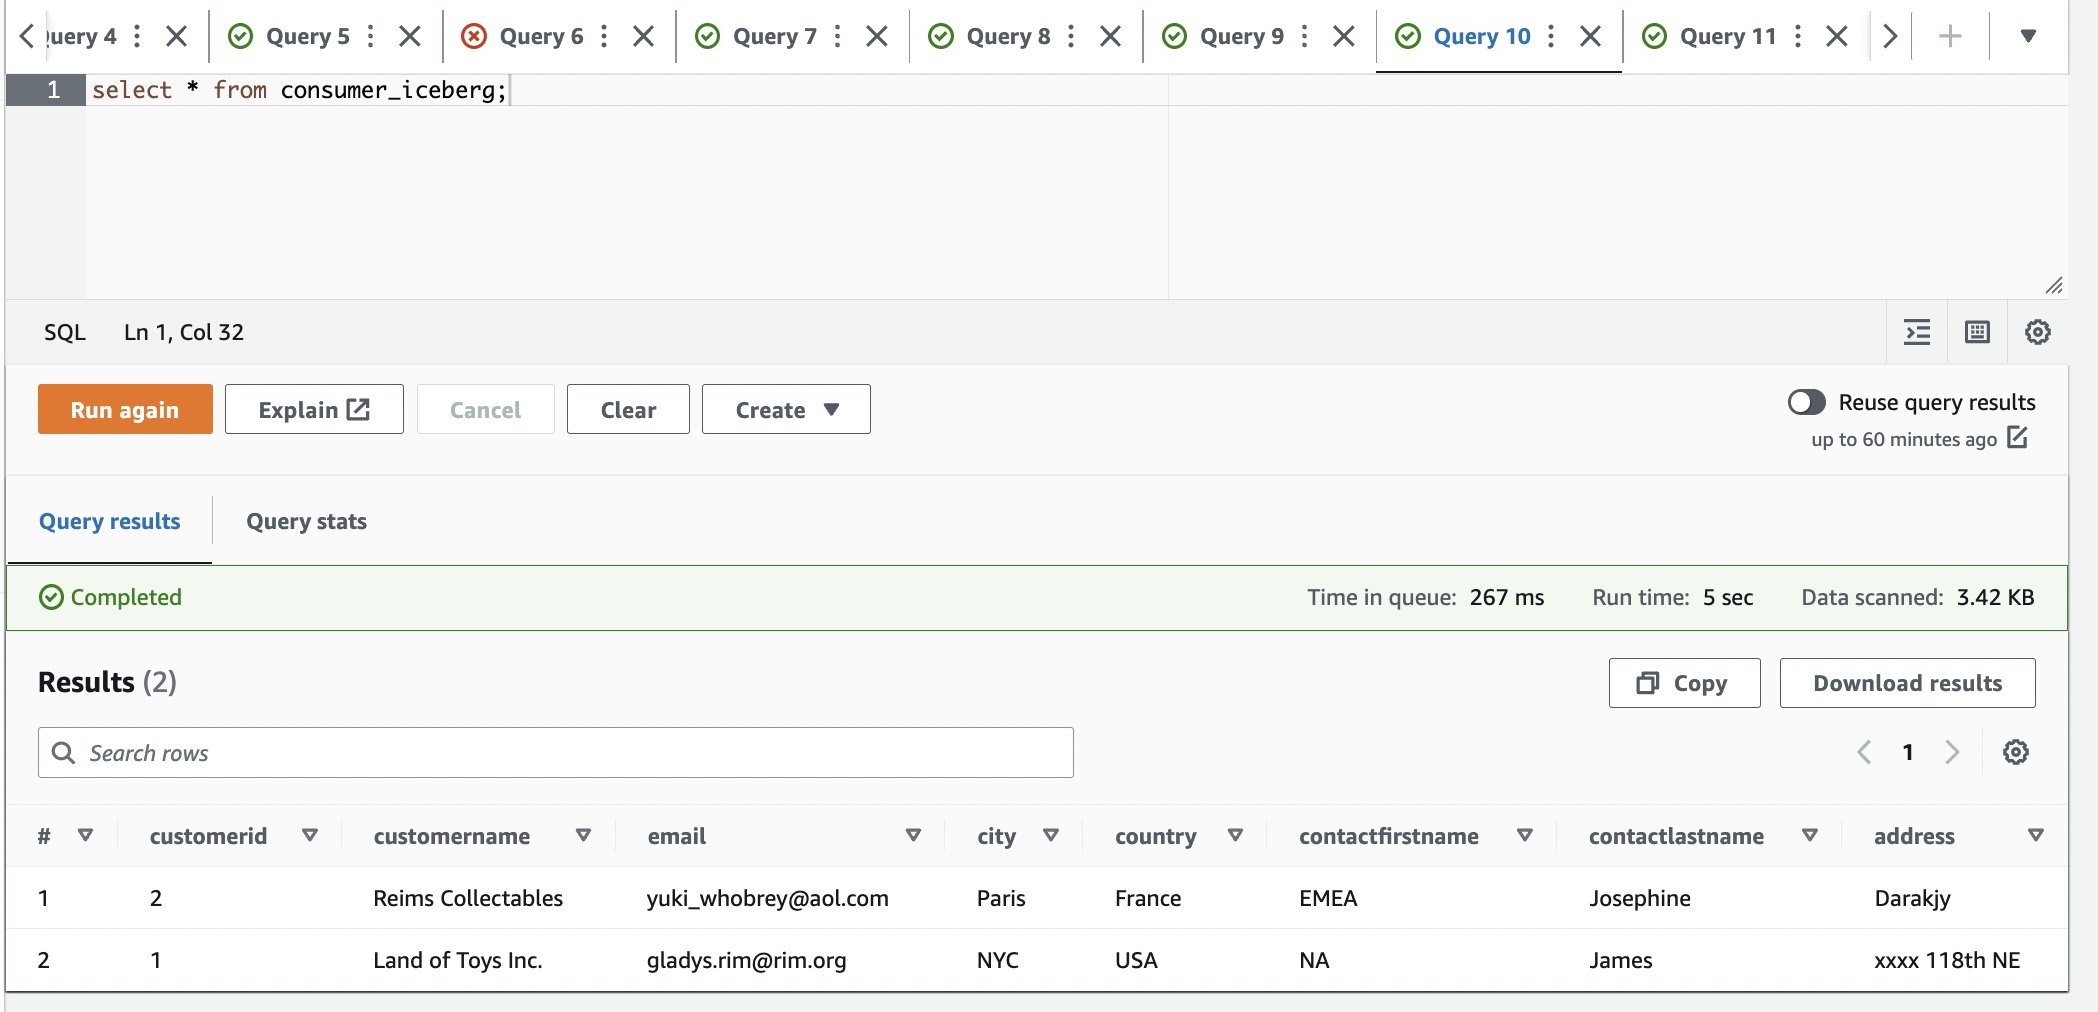
Let’s insert data into the consumer_iceberg table in the producer account, and validate the data filtering works as expected in the consumer account.

  1. Log in to the producer account.
  2. On the Athena console, choose Query editor in the navigation pane.
  3. Use the following SQL to write and insert data into the Iceberg table. Use the Query editor to run one query at a time. You can highlight/select one query at a time and click “Run”/“Run again:
INSERT INTO consumer_iceberg VALUES (1, 'Land of Toys Inc.', '[email protected]',
'NYC','USA', 'NA', 'James', 'xxxx 118th NE');

INSERT INTO consumer_iceberg VALUES (2, 'Reims Collectables', '[email protected]',
'Reims','France', 'EMEA', 'Josephine', 'Darakjy');

INSERT INTO consumer_iceberg VALUES (3, 'Lyon Souveniers', '[email protected]',
'Paris', 'France', 'EMEA','Art', 'Venere');

Insert data into consumer_iceberg table in the producer account

  1. Use the following SQL to read and select data in the Iceberg table:
SELECT * FROM "lf-demo-db"."consumer_iceberg" limit 10;

Run select query to validate rows were inserted

  1. Log in to the consumer account.
  2. In the Athena query editor, run the following SELECT query on the shared table:
SELECT * FROM "lf-demo-db"."consumer_iceberg" limit 10;

Run same query in consumer account

Based on the filters, the consumer has visibility to a subset of columns, and rows where the country is France.

Update/Delete operations

Now let’s update one of the rows and delete one from the dataset shared with the consumer.

  1. Log in to the producer account.
  2. Update city='Paris' WHERE city='Reims' and delete the row customerid = 3;
    UPDATE consumer_iceberg SET city= 'Paris' WHERE city= 'Reims' ;

    Run update query in producer account

DELETE FROM consumer_iceberg WHERE customerid =3;

Run delete query in producer account

  1. Verify the updated and deleted dataset:
SELECT * FROM consumer_iceberg;

Verify update and delete reflected in producer account

  1. Log in to the consumer account.
  2. In the Athena query editor, run the following SELECT query on the shared table:
SELECT * FROM "lf-demo-db"."consumer_iceberg" limit 10;

Verify update and delete in consumer account

We can observe that only one row is available and the city is updated to Paris.

Schema evolution: Add a new column

Let’s update one of the rows and delete one from the dataset shared with the consumer.

  1. Log in to the producer account.
  2. Add a new column called geo_loc in the Iceberg table. Use the Query editor to run one query at a time. You can highlight/select one query at a time and click “Run”/“Run again:
ALTER TABLE consumer_iceberg ADD COLUMNS (geo_loc string);

INSERT INTO consumer_iceberg VALUES (5, 'Test_user', '[email protected]',
'Reims','France', 'EMEA', 'Test_user', 'Test_user', 'test_geo');

SELECT * FROM consumer_iceberg;

Add a new column in producer aacccount

To provide visibility to the newly added geo_loc column, we need to update the Lake Formation data filter.

  1. On the Lake Formation console, choose Data filters in the navigation pane.
  2. Select your data filter and choose Edit.
    Update data filter
  3. Under Column-level access, add the new column (geo_loc).
  4. Choose Save.
    Add new column to data filter
  5. Log in to the consumer account.
  6. In the Athena query editor, run the following SELECT query on the shared table:
SELECT * FROM "lf-demo-db"."consumer_iceberg" limit 10;

Validate new column appears in consumer account

The new column geo_loc is visible and an additional row.

Schema evolution: Delete column

Let’s update one of the rows and delete one from the dataset shared with the consumer.

  1. Log in to the producer account.
  2. Alter the table to drop the address column from the Iceberg table. Use the Query editor to run one query at a time. You can highlight/select one query at a time and click “Run”/“Run again:
ALTER TABLE consumer_iceberg DROP COLUMN address;

SELECT * FROM consumer_iceberg;

Delete a column in producer account

We can observe that the column address is not present in the table.

  1. Log in to the consumer account.
  2. In the Athena query editor, run the following SELECT query on the shared table:
SELECT * FROM "lf-demo-db"."consumer_iceberg" limit 10;

Validate column deletion in consumer account

The column address is not present in the table.

Time travel

We have now changed the Iceberg table multiple times. The Iceberg table keeps track of the snapshots. Complete the following steps to explore the time travel functionality:

  1. Log in to the producer account.
  2. Query the system table:
SELECT * FROM "lf-demo-db"."consumer_iceberg$snapshots" limit 10;

We can observe that we have generated multiple snapshots.

  1. Note down one of the committed_at values to use in the next steps (for this example, 2023-01-29 21:35:02.176 UTC).
    Time travel query in consumer account
  2. Use time travel to find the table snapshot. Use the Query editor to run one query at a time. You can highlight/select one query at a time and click “Run”/“Run again:
SELECT * FROM consumer_iceberg FOR TIMESTAMP
AS OF TIMESTAMP '2023-01-29 21:35:02.176 UTC';

Find table snapshot using time travel

Clean up

Complete the following steps to avoid incurring future charges:

  1. On the Amazon S3 console, delete the table storage bucket (for this post, iceberg-athena-lakeformation-blog).
  2. In the producer account on the Athena console, run the following commands to delete the tables you created:
DROP TABLE "lf-demo-db"."consumer_iceberg";
DROP DATABASE lf-demo-db;
  1. In the producer account on the Lake Formation console, revoke permissions to the consumer account.
    Clean up - Revoke permissions to consumer account
  2. Delete the S3 bucket used for the Athena query result location from the consumer account.

Conclusion

With the support for cross account, fine-grained access control policies for formats such as Iceberg, you have the flexibility to work with any format supported by Athena. The ability to perform CRUD operations against the data in your S3 data lake combined with Lake Formation fine-grained access controls for all tables and formats supported by Athena provides opportunities to innovate and simplify your data strategy. We’d love to hear your feedback!


About the authors

Kishore Dhamodaran is a Senior Solutions Architect at AWS. Kishore helps strategic customers with their cloud enterprise strategy and migration journey, leveraging his years of industry and cloud experience.

Jack Ye is a software engineer of the Athena Data Lake and Storage team at AWS. He is an Apache Iceberg Committer and PMC member.

Chris Olson is a Software Development Engineer at AWS.

Xiaoxuan Li is a Software Development Engineer at AWS.

Rahul Sonawane is a Principal Analytics Solutions Architect at AWS with AI/ML and Analytics as his area of specialty.

Center for Information Security (CIS) unveils Azure Foundations Benchmark v2.0.0

Post Syndicated from Marla Rosner original https://blog.rapid7.com/2023/03/23/center-for-information-security-cis-unveils-azure-foundations-benchmark-v2-0-0/

Center for Information Security (CIS) unveils Azure Foundations Benchmark v2.0.0

The Center for Information Security (CIS) recently unveiled the latest version of their Azure Foundations Benchmark—Version 2.0.0. This is the first major release since the benchmark was originally released more than 4 years ago, which could lead you to believe that this update would come with a bunch of significant changes. However, this release actually brings fewer impactful changes than the minor releases that preceded it.

Instead of sweeping changes, the update includes a number of reconciled and renumbered sections along with some refreshed language and branding.

Rapid7 is actively reviewing the new recommendations and evaluating the need and potential of them being made into insights within InsightCloudSec.

So the changes were minor, but what were they?

Of the 10 sections that make up the benchmark, four sections were expanded with new recommendations:

  • Section 1 (Identity and Access Management)
  • This was also the only section that had a recommendation removed.
  • Section 4 (Database Services)
  • Section 5 (Logging and Monitoring)
  • Section 7 (Virtual Machines)

Five sections had no changes:

  • Section 3 (Storage Accounts)
  • Section 6 (Networking)
  • Section 8 (Key Vault)
  • Section 9 (AppService)
  • Section 10 (Miscellaneous)

Section 2 (Microsoft Defender) did not have any additions or subtractions, but did have some alterations related to numbering and categorization.

Section 1 (Identity and Access Management)

This section covers a wide range of recommendations centered around identity and access policies. For 2.0.0, there was one addition:

Recommendation: 1.3 – Ensure that ‘Users can create Azure AD Tenants’ is set to ‘No’

Why it Matters: It is best practice to only allow an administrator to create new tenants. This prevents users from creating new Azure AD or Azure AD B2C tenants and ensures that only authorized users are able to do so.

As noted above, this was also the only section from which a recommendation was removed entirely:

Removed Recommendation: 1.5 – Ensure that ‘Restore multi-factor authentication on all remembered devices’ is enabled (this recommendation has been replaced in v2.0.0)

Why it Was Removed: This recommendation was likely removed, as it is somewhat redundant to what is now recommendation 1.1.4 (Ensure that ‘Allow users to remember multi-factor authentication on devices they trust’ is enabled). Essentially, the updated recommendation asserts you should not allow users to bypass MFA for any device.

Section 4 (Database Services)

This section focuses on securing database services within Azure environments—such as Azure SQL or Cosmos DB. CIS added a recommendation to this section, specifically for Cosmos DB, that guides users to leverage Active Directory and Azure RBAC whenever possible.

Recommendation: 4.5.3 – Use Azure Active Directory (AAD) Client Authentication and Azure RBAC where possible.

Why it Matters: Cosmos DB, Azure’s native NoSQL database service, can use tokens or AAD for client authentication which in turn will use Azure RBAC for authorization. Using AAD is significantly more secure because AAD handles the credentials and allows for MFA and centralized management, and Azure RBAC is better integrated with the rest of Azure.

Section 5 (Logging and Monitoring)

The two new recommendations within this section are targeted toward ensuring you’ve properly configured your environment for log management, including collecting the necessary logs (flow logs, audit logs, activity logs, etc.) and also ensuring that the storage location for those logs is secure.

Recommendation: 5.3.1 – Ensure Application Insights are Configured

Why it Matters: Application Insights within Azure act as an application performance monitoring solution providing valuable data into how well an application performs and additional information when performing incident response. The types of log data collected include application metrics, telemetry data, and application trace logging data, which provide organizations with detailed information about application activity and application transactions. Both data sets help organizations adopt a proactive and retroactive means to handle security and performance related metrics within their modern applications.

Recommendation: 5.5 – Ensure that SKU Basic/Consumption is not used on artifacts that need to be monitored

Why it Matters: Basic or Free SKUs in Azure, while cost effective, have significant limitations in terms of what can be monitored and what support can be realized from the team at Microsoft. Typically, these SKU’s do not have service SLAs, and Microsoft generally refuses to provide support for them. Because of this, Basic/Free SKUs are not recommended for production workloads. While upgrading to the Standard tier may be a bit more expensive, you’ll receive more support from Microsoft, as well as the ability to generate and consume more detailed information via native monitoring services such as Azure Monitor.

Section 7 (Virtual Machines)

Section 7 is focused on securing virtual machines within your Azure environment. Recommendations in this section include ensuring that your VMs are utilizing managed disks and that OS and Data disks are encrypted with Customer Managed Keys (CMK), just to name a few. There was one new recommendation in this section.

Recommendation: 7.1 – Ensure an Azure Bastion Host Exists

Why it Matters: The Azure Bastion service allows organizations a more secure means of accessing Azure Virtual Machines over the Internet without assigning public IP addresses to them. The Azure Bastion service provides Remote Desktop Protocol (RDP) and Secure Shell (SSH) access to Virtual Machines using TLS within a web browser. This is aimed at preventing organizations from opening up 3389/TCP and 22/TCP to the Internet on Azure Virtual Machines.

Using InsightCloudSec to Implement and Enforce CIS Azure Foundations Benchmark 2.0.0

InsightCloudSec continuously assesses your entire cloud environment—whether single cloud or hosted across multiple platforms—for compliance with organizational standards. It detects noncompliant resources and unapproved changes within minutes. The platform continuously monitors your environment to ensure you’ve properly implemented the necessary controls as recommended by CIS for securing your cloud workloads running in Azure environments.

InsightCloudSec can instantly detect whenever an account or resource drifts from compliance. The platform comes out of the box with 30+ compliance packs, including a dedicated pack for the CIS Azure Foundations Benchmark 2.0.0. A compliance pack within InsightCloudSec is a set of checks that can be used to continuously assess your cloud environments for compliance with a given regulatory framework, or industry or provider best practices.

As you can see in the screenshot below, InsightCloudSec has a host of checks and insights that directly align to recommendations within the CIS Azure Foundations Benchmark 2.0.0.

Center for Information Security (CIS) unveils Azure Foundations Benchmark v2.0.0

When you dive deeper into a given insight, you’re provided with detail into how many resources are in violation with a given check and a relative risk score to outline just how risky a given violation is.

Below is an example from CIS Azure Foundations Benchmark 2.0.0, specifically a set of resources that are in violation of the check ‘Storage Account Older than 90 Days Without Access Keys Rotated’. You’re provided with an overview of the insight, including why it’s important to implement and the risks associated with not doing so.

Center for Information Security (CIS) unveils Azure Foundations Benchmark v2.0.0

That platform doesn’t just stop there, however. You’re also provided with the necessary remediation steps as advised by CIS themselves, and if you so choose, the recommended automations that can be created using native bots within InsightCloudSec for folks that would prefer to completely remove the human effort involved in enforcing compliance with this policy.

Center for Information Security (CIS) unveils Azure Foundations Benchmark v2.0.0

If you’re interested in learning more about how InsightCloudSec helps continuously and automatically enforce cloud security standards, be sure to check out the demo!

The collective thoughts of the interwebz

By continuing to use the site, you agree to the use of cookies. more information

The cookie settings on this website are set to "allow cookies" to give you the best browsing experience possible. If you continue to use this website without changing your cookie settings or you click "Accept" below then you are consenting to this.

Close